FAILURE ANALYSIS OF WASTE HEAT BOILER TUBES
April 26, 2017
Abdulmohsen Al-Sahli, Avtandil Khalil Bairamov, Abdulaziz Al-Meshari, Gys Van Zyl, and Ali Al-Shawaf
No. 1
OUTLINE
• Background
• Process Description
• Schematic Diagram of Damage Locations
• Investigation
Visual Examination
Chemical Analysis
Metallography
SEM/EDS
• Conclusions

No. 2
BACKGROUND
A petrochemical plant was shut down due to tubes leaks in a waste heat boiler (WHB).
The failed WHB has been in operation for about 20 years, without any previous failure.
Following the incident, inspection activities revealed the following:
• Leaks were observed at 7 tubes.
• Localized damage was observed on 70% of the ferrules.
• Leakages were always observed after the end of the ferrules.
• Tubes were observed to be externally covered with a deposit.
A leaked tube and another severely thinned tube from the WHB were analyzed to determine
the failure mechanism and contributing factors.

No. 3
PROCESS DESCRIPTION
Waste Heat Boiler
BFW Inlet
SH Header
Process Gas Inlet Process Gas Outlet
Fu
rth
er
Pro
ce
ssin
g
Steam Drum

No. 4
SCHEMATIC DIAGRAM OF DAMAGE LOCATIONS
The damage has been observed to be confined to areas after the ferrule’s end.

INVESTIGATION
FAILURE ANALYSIS OF WASTE HEAT BOILER TUBES

No. 6
VISUAL EXAMINATION OF THE LEAKED TUBE
The leaked tube sample in as-received condition.
Pin HoleNo signs of corrosion
Localized
Corrosion

No. 7
THE INTERNAL SURFACE OF THE LEAKED TUBE
Pin HoleLocalized Wall
Thinning
No Signs of Corrosion
The internal surfaces of the leaked tube.
Signs for Damage
Initiation

No. 8
VISUAL EXAMINATION OF THE SEVERELY THINNED TUBE
No signs of corrosionLocalized Corrosion
The severely tube sample in as-received condition.

No. 9
INTERNAL SURFACE OF THE THINNED TUBE
No Signs of Corrosion
Threads
White Lines
The internal surfaces of the thinned tube.

No. 10
TUBES MATERIAL CONFIRMATION
Element Sample ASTM SA213 T12*
C 0.13 0.05–0.15
Mn 0.44 0.30-0.61
Si 0.24 0.50
Cr 0.85 0.80–1.25
Mo 0.44 0.44–0.65
Fe Balance Balance
P 0.040 0.025
S 0.012 0.025
*Maximum unless otherwise indicated
XRF & C/S analyses (wt.%).
The chemical composition of the materials closely matches the chemical composition of
ASTM SA 213 T12.

No. 11
CHEMICAL COMPOSITION OF DEPOSIT FOUND ON TUBES EXTERNAL SURFACES
Element Sample
C 0.04
Mg 0.04
Al 0.08
Si 0.17
P 0.03
S 0.02
Cl 0.02
Ca 0.04
Cr 0.61
Mn 0.34
Fe Balance
Ni 0.08
Cu 0.10
Mo 0.42
XRF & C/S analyses (wt.%).
No. 12
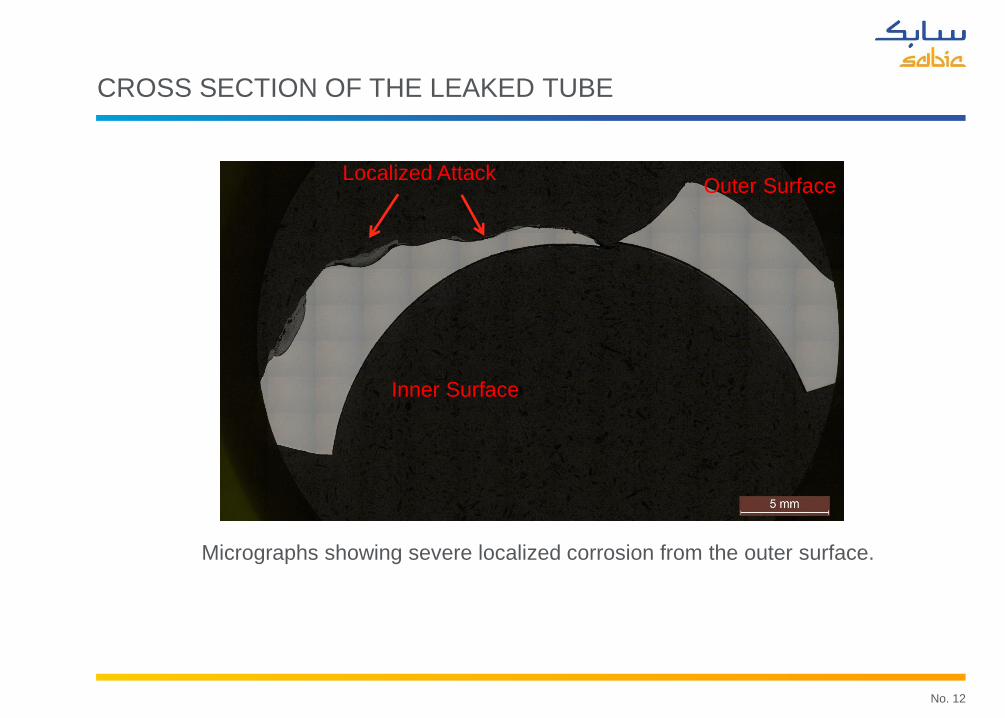
CROSS SECTION OF THE LEAKED TUBE
Micrographs showing severe localized corrosion from the outer surface.
Localized AttackOuter Surface
Inner Surface

No. 13
MICROSTRUCTURAL ANALYSIS OF TUBES
Micrographs of the leaked tube, as polished (left) and etched with 2% Nital (right).

No. 14
SEM/EDS OF TUBE EXTERNAL SURFACE NEAR PINHOLE
Spectrum C O Na Si S Fe Cu
A1 2.51 22.79 0.22 0.20 73.53 0.75
A2 2.59 34.73 0.18 0.33 62.17

No. 15
SEM/EDS OF TUBE INTERNAL SURFACE AT PINHOLE
Spectrum C O Na Al Si P Ca Mn Fe Mo
A1 1.17 32.02 0.46 0.38 65.13 0.83
P1 2.45 33.54 0.66 0.15 0.90 5.87 0.31 7.30 48.82
P2 2.13 33.27 1.02 0.35 0.31 61.54 1.38
A2 2.55 35.51 0.18 0.28 0.12 61.37

No. 16
SEM/EDS OF TUBE EXTERNAL SURFACE AT PINHOLE
Spectrum C O Si S Cl Fe Cu Mo
A1 1.76 35.54 0.65 0.42 60.99 0.64
A2 3.86 32.57 0.64 0.68 62.26
A3 1.30 31.87 0.31 65.72 0.80

CONCLUSIONS
FAILURE ANALYSIS OF WASTE HEAT BOILER

No. 18
FAILURE MECHANISM
The experimental observations suggest that the tubes failed by caustic gauging.

No. 19
CONCLUSIONS
• The experimental observations suggest that the tubes failed by caustic gauging.
• The damage is confined to a small portion of the tubes where deposit formation has been
observed.
• Deposition resulted mostly due to the quality of BFW.
• Reduction of temperature gradient at the entrance of the boiler could help in reducing
deposition.
THANK YOU!
FAILURE ANALYSIS OF WASTE HEAT BOILER TUBES
Recommended