THE INFLUENCE OF WORKLOAD AND MOTIVATION ONEMPLOYEES’ PERFORMANCE IN PERUM BULOG
DIVRE LAMPUNG
(Undergraduate Thesis)
By
Ikke Nurjanah
FACULTY OF ECONOMICS AND BUSINESS
UNIVERSITY OF LAMPUNG
2016
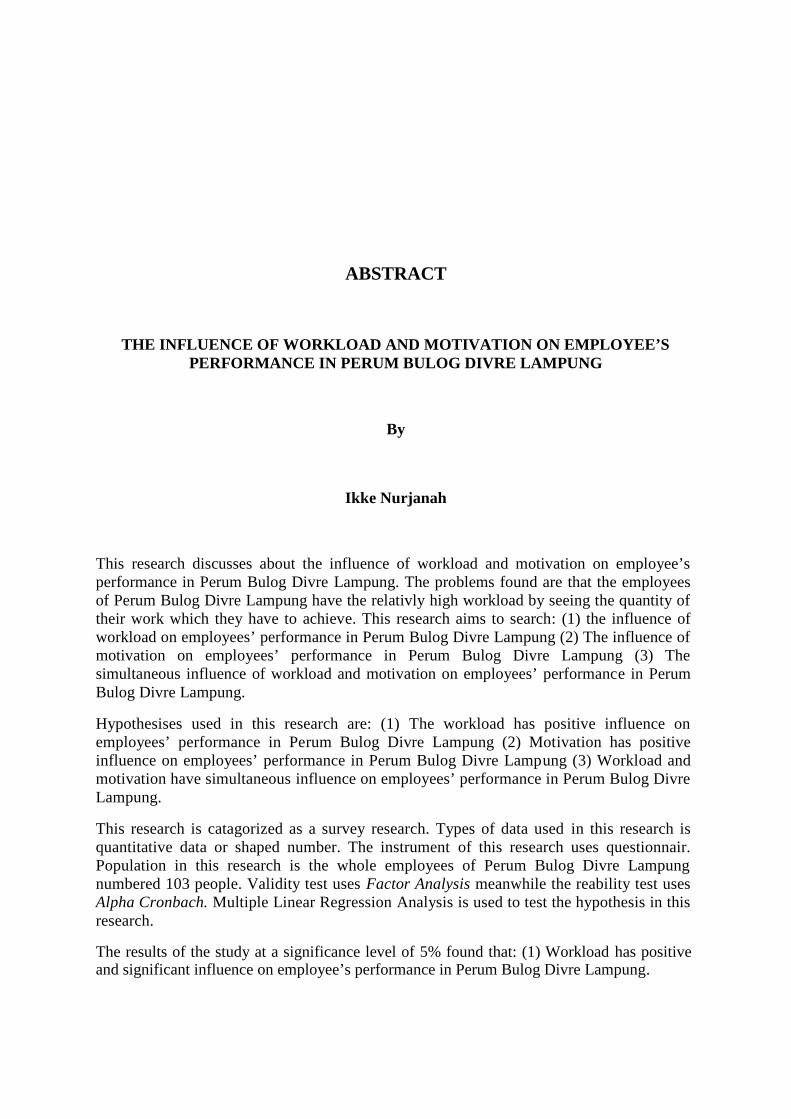
ABSTRACT
THE INFLUENCE OF WORKLOAD AND MOTIVATION ON EMPLOYEE’SPERFORMANCE IN PERUM BULOG DIVRE LAMPUNG
By
Ikke Nurjanah
This research discusses about the influence of workload and motivation on employee’sperformance in Perum Bulog Divre Lampung. The problems found are that the employeesof Perum Bulog Divre Lampung have the relativly high workload by seeing the quantity oftheir work which they have to achieve. This research aims to search: (1) the influence ofworkload on employees’ performance in Perum Bulog Divre Lampung (2) The influence ofmotivation on employees’ performance in Perum Bulog Divre Lampung (3) Thesimultaneous influence of workload and motivation on employees’ performance in PerumBulog Divre Lampung.
Hypothesises used in this research are: (1) The workload has positive influence onemployees’ performance in Perum Bulog Divre Lampung (2) Motivation has positiveinfluence on employees’ performance in Perum Bulog Divre Lampung (3) Workload andmotivation have simultaneous influence on employees’ performance in Perum Bulog DivreLampung.
This research is catagorized as a survey research. Types of data used in this research isquantitative data or shaped number. The instrument of this research uses questionnair.Population in this research is the whole employees of Perum Bulog Divre Lampungnumbered 103 people. Validity test uses Factor Analysis meanwhile the reability test usesAlpha Cronbach. Multiple Linear Regression Analysis is used to test the hypothesis in thisresearch.
The results of the study at a significance level of 5% found that: (1) Workload has positiveand significant influence on employee’s performance in Perum Bulog Divre Lampung.
Ikke Nurjanah
(2) Motivation has positive and significant influence on employee’s performance in PerumBulog Divre Lampung. (3) The workload and motivation simultaneously influenceemployees’ performance in Perum Bulog Divre Lampung.
Suggestions for Perum Bulog Divre Lampung are (1) Being more concerned about theworkload that will be burdened to employees such as the time required to complete tasks andmental activity of each employee so that each individual can obtain tranquility in performingrequired tasks (2 ) Being more concerned to improve the motivation by paying moreattention about employees’ job security, especially for employees who work in the field,implement discipline among employees so that their achievements will be increased, as wellas creating an environmental work better so that employees will feel more comfortable inworking and growing bonds of friendship which will mutually support each other. (3)Should improve the knowledge of each employee in order to be more uptodate so that theycan improve performance by adding skills and the way they have to find creative solutions incase of happenning problems in their work.
Key Words: Workload, Motivation, Performance
THE INFLUENCE OF WORKLOAD AND MOTIVATION ONEMPLOYEES’ PERFORMANCE IN PERUM BULOG
DIVRE LAMPUNG
(Undergraduate Thesis)
By
Ikke Nurjanah
FACULTY OF ECONOMICS AND BUSINESS
UNIVERSITY OF LAMPUNG
2016
ACKNOWLEDGEMENTS
Bismillahirohmanirrohim,
Alhamdulillahirobbilalamin, praise to Allah SWT whi has been giving out mercy,
guidance and His goood pleasure, so that I can finish this undergraduate thesis
entitled “The Influence of Workload and Motivation on Employees’ Performance
in Perum Bulog Divre Lampung”. This undegraduate thesis is one of the
requirements to accomplish study in the management undergraduate program at
Faculty of Economics and Business, University of Lampung. There are
limitations during this research faced since the beginning until the end of the
research. I would like to thank to:
1. Allah SWT, because of His unlimited blessings.
2. My hero father, Mr. Abdul Chalik, my best mother, Ms. Titin Rohaitin,
my brothers, Mr. Tedy, A.md, Mr. Anthony, A.md, my sisters-inlaw, Ms.
Fitri Aini and Ms Rahadian Ningsih, S.E., my beloved nieces, Mr. Bagus
Rafli Mokoginta, Mr. Firman Taqwa, Mr. Fadlan Al-ghifari, and my
beautiful cousin, Ms. Zaskya Ainun Mahya.
3. Mr. Prof. Dr. H. Satria Bangsawan, S.E., M.Si., as the Dean of Faculty of
Economics and Business, University of Lampung.
4. Mrs. R.R. Erlina, S.E., M.Si., as the Head of Management Department
Faculty of Economics and Business, University of Lampung.
5. Ms. Yuningsih, S.E., M.M., as the Secretary of Management Department
Faculty of Economics and Business, University of Lampung.
6. Mr. Rinaldi Bursan, S.E., M.Si., as the researcher’s academic counselor.
7. Mr. Dr. Ayi Ahadiat, S.E., M.B.A., as the Advisor Lecture.
8. Ms. Nova Mardiana, S.E., M.M., as the Co-Advisor Lecture.
9. Mr. Arifin, S.E., as the Head of Human Resource Department in Perum
Bulog Divre Lampung, to give me his permission to do my research in his
department.
10. My Genks, Ms. Wenika Anisa Putri, S.E., Ms. Selvi Eliandita (soon to be
S.E), Ms. Sri Mentari (soon to be S.E), Ms. Puput Handayani (soon to be
S.E).
11. The Gritongs, Ms. Rizky Faradila, S.E., Ms. Yovita Woro, S.Ikom., Ms.
Maryani (soon to be S.E), Ms. Nopiani (soon to be S.E), Ms. Endah Mas
Ayu (soon to be S.E), Ms. Adis Marekas (soon to be S.Pd), and Ms. Anes
Yuwita (soon to be ).
12. The MG, Ms. Ade Putri Mutiara, Ms. Agustin Darma Putri, S.Ip., Ms.
Irania, S.Pd, Ms. Desna Rosdini.
13. Social one of SMANTA, Ms. Nadia Putri, A.Md., Ms. Devinia Jeniar Mr.
Prasatya Nurul Ramadhan, Mr. Faturrahman, Mr. Ando Partindo, Mr.
Adham Hasta Reza (soon to be S.Pd).
14. KKN team, Ms. Anisa Riyasti, S.Ikom., Ms. Rika Permata Alam (soon to
be S.Ikom), Mr. Ferly Herdiansah, S.E., Mr. Fernico Lubis, S.E., Ms.
Mirtania Ristiani (soon to be S.E), Ms. Saphira Riani (soon to be S.Ikom).
15. Management Billingual Class Batch 2012, Ms. Lia Febrialina, S.E., Ms.
Dian Saputri, S.E., Ms Marlia Fitriana, S.E., Mr. Dirga Baskara, Mr.
Kautsar Tanjung, Ms. Larassati Ahluwalia, S.E., Ms. Nerissa Arviana,
S.E., Mr. Reza Guntara, Ms. Ayu Nadia Basumbul, S.E., Ms. Siska
Meilanda Sari, S.E., Mr. Kemas Rahmat, Mr. Fadil Muhammad, S.E., Ms.
Donna Vita Sari, S.E., Ms. Lia Hermanto, Ms. Brenda Metarani, S.E., Ms.
Citra Laras Maharani, Ms. Elisa Nurinda, Mr. Zefri Setiabe.
16. Presidium Economics and Business Club 2014-2015 period, Ms. Rossinda
Budianti, Ms. Rizky Zakiyah, Ms. Yunita Sari, Ms. Sindi Martatila, Ms.
Elia Rahma Putri, Ms. Hanifah Hanum, Mr. Pandu Solihin, Mr. Ageng
Wahyudin, Mr. Asri, Mr. Sony, Mr. Alyuriza Syalkahfi, Mr. Nizar.
17. Human Resource management Class batch 2012, Ms. Adri, Mr. Alam, Mr.
Arie, Ms. Jasmine, Mr. Akil, Ms. Muli, Ms. Tasya, Ms. Vinie, Ms. Kenny,
Ms, Chyntia, Ms. Alnia, Ms. Cisca, Mr. Husa, Mr. Arman, Mr. Dharman,
Mr. Rakha, Ms. Ryan, Ms. Ilal, Ms. Any, Ms. Uthe, Ms. Fristiana, Ms.
Monce, Ms. Niken, Ms. Ucy.
18. Management Class Batch 2012, Ms. Yafie, Ms. Siska Maharani, Mr.
Vicky, Mr. Wahid, Ms Heylin, Mr. Farhan, Mr. Giovanni, Mr. Albert, Mr.
Dwiyan, Mr. Naldo, Ms Mahardita Dinda, and the others.
19. Someone who will accompany me in his whole life and never bored of
me, my future husband.
20. And other parties whi help me during finishing this undergraduate thesis.
Bandar Lampung, July 2016
Ikke Nurjanah
BIOGRAPHY
The researcher is the last child from 4 siblings of Mr. Abdul Chalik and Ms.
Titin Rohaitin. The researcher has 2 brothers and one late sister. The researcher
was born on June 3rd 1994. The researcher got the education of primary school at
SDN 1 Gulak-Galik 2 which was graduated in 2006, the researcher continued the
study to Junior High Schoolat SMPN 25 Bandar Lampung which was graduated
in 2009, the researcher continued the study of Senior High School at SMAN 3
Bandar Lampung which was graduated in 2012. In 2012, the researcher
continued the education to a university at Faculty of Economics and Business,
Lampung University.
MOTTO
“Hai orang-orang beriman, mintalah pertolongan (kepada Allah) dengan sabar dan
Shalat, sesungguhnya Allah beserta orang-orang yang sabar”
(Q.S. Al-Bawarah: 153)
“The greatest obstacle to discovery is not ignorance; it is the illusion of knowledge”
(Daniel J. Boorstin)
“If you want something you’ve never had, you must be willing to do something you’ve”
never done
(Anonymous)
“Success consists of going from failure to failure without loss of enthusiasm”
(Winston Churchill)
With hope blessing of Allah SWT, I would like to present my banchelor thesis to:
My superhero and the most powerful parents, Abdul Chalik and Titin Rohaitin.
“There’s no word that can describe both of you. The only precisious things I ever had are
loving you both. I always do my best that can make you say “ we’re so proud to have a
daughter like you’. I love you both till this heart stops beating.
For my late sister and father
“Thank you for existing in my life once. I am learning how to survive from you all. Losts
aren’t just the things which can make people sad but also can make people stronger than
others”
For my loveable brothers Anthony, A.md., Tedy Suherman, A.md., and my beautiful
sisters-in-law Rahadian Ningsih, S.E., and Fitri Aini.
“Thank you for teaching me how to live my life. Thank you for supporting me no matter
what, thank you for always being there whenever I need help. You all are my best little
family and I am so grateful to have you. I love you so much”
My handsome nieces Bagus Rafli, Firman Taqwa, Fadlan and My angel cousin Zaskya
Ainun Mahya.
“My life is complete when I have you. I already felt like I have sons and daughters. When I
felt sad the only thing that can make me laugh again is by playing with you all. I love you”

Myself,
“Never feel lonely meanwhile you have a olt of people who love you so much. Think of your
parents then everything’s getting easier”
My almamater, Faculty of Economics and Business University of Lampung
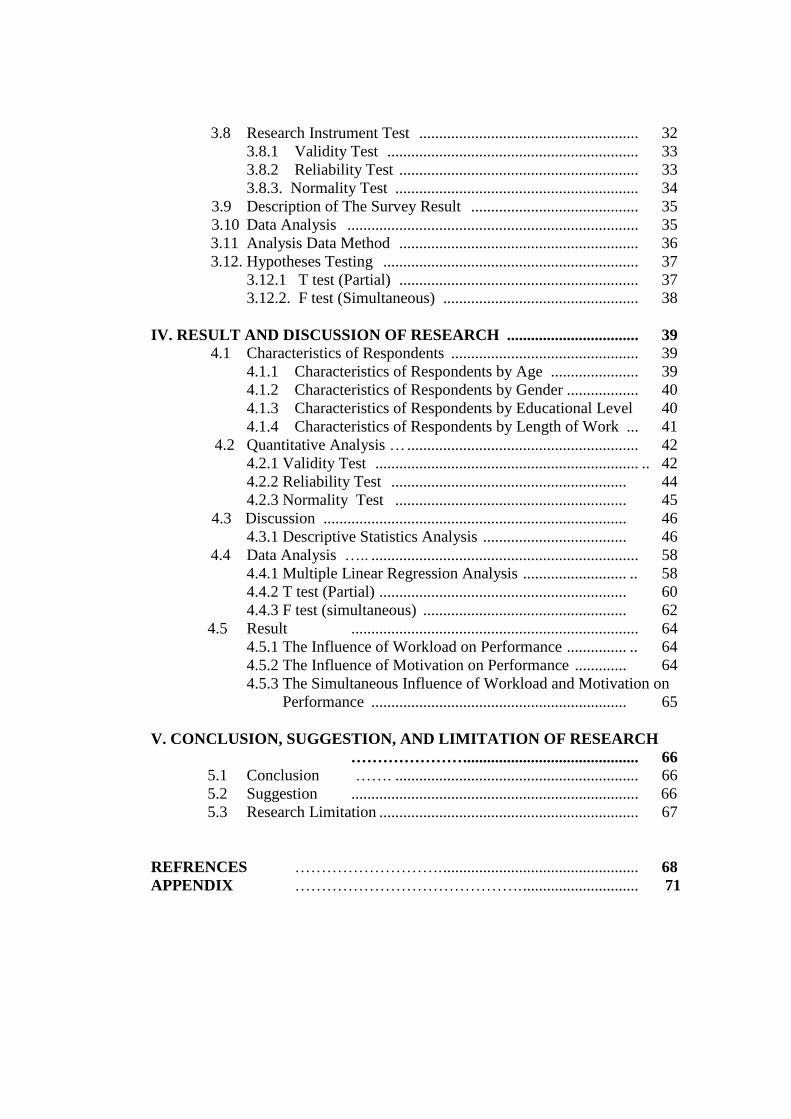
CONTENTS
Abstract ........................................................................................................... i
Content of Table ............................................................................................ iv
Content of Figure .......................................................................................... vi
Content of Appendix ..................................................................................... vii
I. INTRODUCTION ................................................................................... 1
1.1 Background ............................................................................. 1
1.2 Problem Statement ................................................................. 8
1.3 Research Objective .................................................................. 8
1.4 Benefits of Research ............................................................... 9
II. LITERATURE REVIEW, CONCEPTUAL FRAMEWORK AND
HYPOTHESES ................. .................................................................... 10
2.1 Human Resource .................................................................... 10
2.1.1 The definition of Human Resource ................................ 10
2.1.2 The Function of Human Resource ................................. 11
2.2 Workload ................................................................................. 13
2.2.1 The Definition of Workload ........................................... 13
2.2.2 Factors Influenced Workload ......................................... 14
2.3 Motivation ............................................................................... 15
2.3.1 The Definition of Motivation ......................................... 15
2.3.2 Motivation Objective .................................................... 15
2.3.3 Motivation Theory .......................................................... 16
2.3.4 Motivationg Measures .................................................... 18
2.4 Performance ........................................................................... 19
2.4.1 The Definition of Performance ....................................... 19
2.4.2 Factors Influenced Performance .................................. 20
2.4.3 Indicators of Performance ............................................. 20
2.5 Previous Research .................................................................. 21
2.6 Conceptual Framework .......................................................... 23
2.7 Hypotheses ............................................................................. 27
III. RESEARCH METHOD ......................................................................... 28
3.1 Research Object ...................................................................... 28
3.2 Research Design ...................................................................... 28
3.3 Identification of Research Variables ....................................... 29
3.4. Source of Data ......................................................................... 29
3.5 Population and Sample ............................................................ 30
3.6 Data Collection Method ......................................................... 30
3.7. Operational Definition and Measurement Variables .............. 31
3.8 Research Instrument Test ....................................................... 32
3.8.1 Validity Test ............................................................... 33
3.8.2 Reliability Test ............................................................ 33
3.8.3. Normality Test ............................................................. 34
3.9 Description of The Survey Result .......................................... 35
3.10 Data Analysis ......................................................................... 35
3.11 Analysis Data Method ............................................................ 36
3.12. Hypotheses Testing ................................................................ 37
3.12.1 T test (Partial) ............................................................ 37
3.12.2. F test (Simultaneous) ................................................. 38
IV. RESULT AND DISCUSSION OF RESEARCH ................................. 39
4.1 Characteristics of Respondents ............................................... 39
4.1.1 Characteristics of Respondents by Age ...................... 39
4.1.2 Characteristics of Respondents by Gender .................. 40
4.1.3 Characteristics of Respondents by Educational Level 40
4.1.4 Characteristics of Respondents by Length of Work ... 41
4.2 Quantitative Analysis … .......................................................... 42
4.2.1 Validity Test .................................................................. .. 42
4.2.2 Reliability Test ........................................................... 44
4.2.3 Normality Test .......................................................... 45
4.3 Discussion ............................................................................ 46
4.3.1 Descriptive Statistics Analysis .................................... 46
4.4 Data Analysis ….. ................................................................... 58
4.4.1 Multiple Linear Regression Analysis .......................... .. 58
4.4.2 T test (Partial) .............................................................. 60
4.4.3 F test (simultaneous) ................................................... 62
4.5 Result ........................................................................ 64
4.5.1 The Influence of Workload on Performance ............... .. 64
4.5.2 The Influence of Motivation on Performance ............. 64
4.5.3 The Simultaneous Influence of Workload and Motivation on
Performance ................................................................ 65
V. CONCLUSION, SUGGESTION, AND LIMITATION OF RESEARCH
………………… ............................................ 66
5.1 Conclusion ……. ............................................................. 66
5.2 Suggestion ........................................................................ 66
5.3 Research Limitation ................................................................. 67
REFRENCES ………………………. ................................................. 68
APPENDIX ……………………………………. ............................. 71
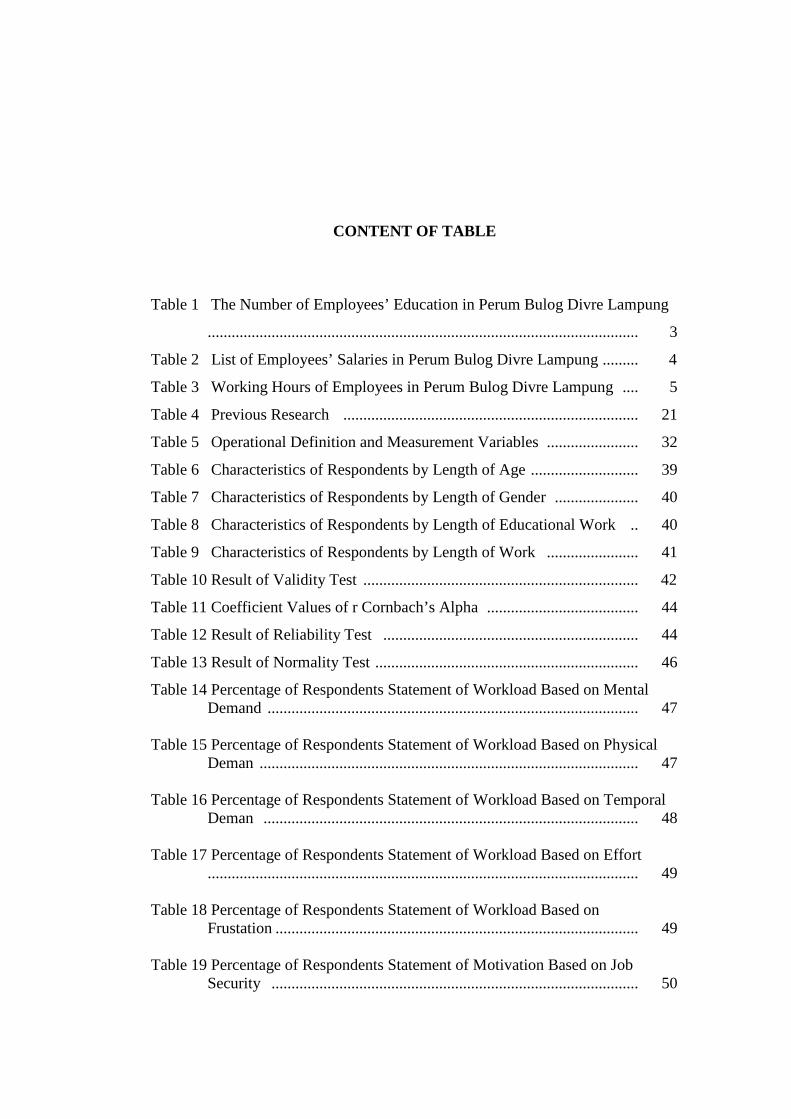
CONTENT OF TABLE
Table 1 The Number of Employees’ Education in Perum Bulog Divre Lampung
............................................................................................................ 3
Table 2 List of Employees’ Salaries in Perum Bulog Divre Lampung ......... 4
Table 3 Working Hours of Employees in Perum Bulog Divre Lampung .... 5
Table 4 Previous Research .......................................................................... 21
Table 5 Operational Definition and Measurement Variables ....................... 32
Table 6 Characteristics of Respondents by Length of Age ........................... 39
Table 7 Characteristics of Respondents by Length of Gender ..................... 40
Table 8 Characteristics of Respondents by Length of Educational Work .. 40
Table 9 Characteristics of Respondents by Length of Work ....................... 41
Table 10 Result of Validity Test ..................................................................... 42
Table 11 Coefficient Values of r Cornbach’s Alpha ...................................... 44
Table 12 Result of Reliability Test ................................................................ 44
Table 13 Result of Normality Test .................................................................. 46
Table 14 Percentage of Respondents Statement of Workload Based on MentalDemand ............................................................................................. 47
Table 15 Percentage of Respondents Statement of Workload Based on PhysicalDeman ............................................................................................... 47
Table 16 Percentage of Respondents Statement of Workload Based on TemporalDeman .............................................................................................. 48
Table 17 Percentage of Respondents Statement of Workload Based on Effort............................................................................................................ 49
Table 18 Percentage of Respondents Statement of Workload Based onFrustation ........................................................................................... 49
Table 19 Percentage of Respondents Statement of Motivation Based on JobSecurity ............................................................................................ 50
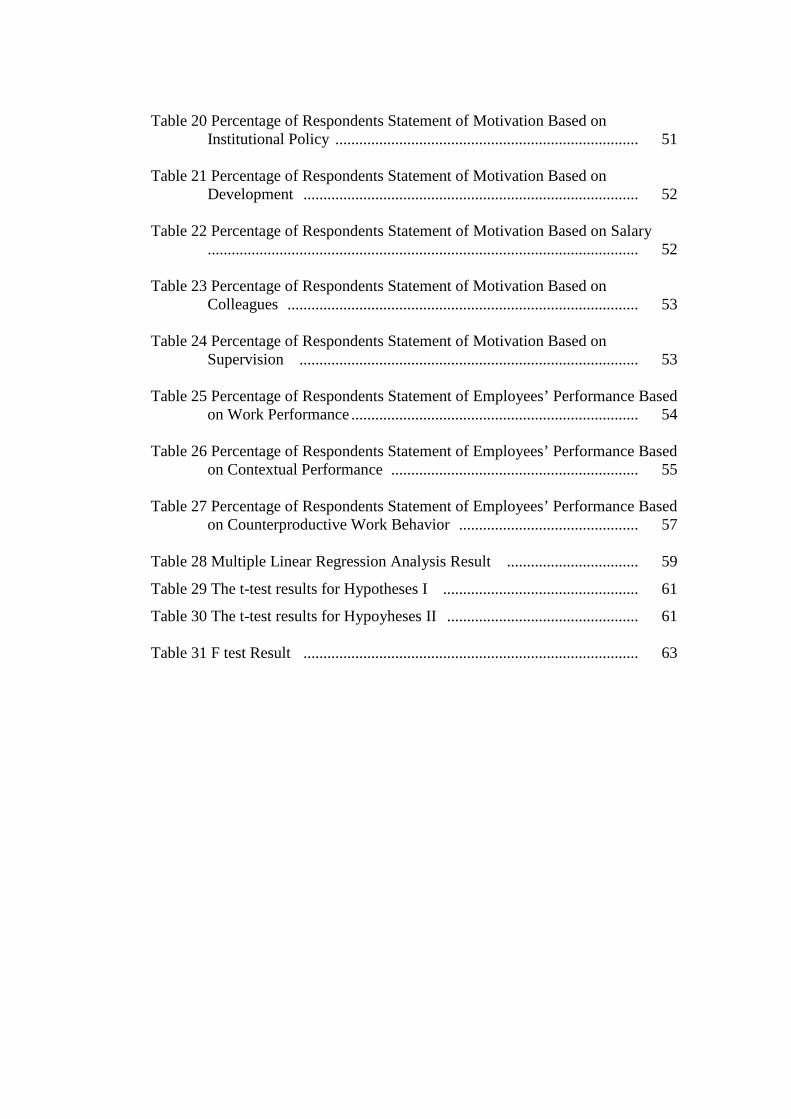
Table 20 Percentage of Respondents Statement of Motivation Based onInstitutional Policy ............................................................................ 51
Table 21 Percentage of Respondents Statement of Motivation Based onDevelopment .................................................................................... 52
Table 22 Percentage of Respondents Statement of Motivation Based on Salary............................................................................................................ 52
Table 23 Percentage of Respondents Statement of Motivation Based onColleagues ........................................................................................ 53
Table 24 Percentage of Respondents Statement of Motivation Based onSupervision ..................................................................................... 53
Table 25 Percentage of Respondents Statement of Employees’ Performance Basedon Work Performance ........................................................................ 54
Table 26 Percentage of Respondents Statement of Employees’ Performance Basedon Contextual Performance .............................................................. 55
Table 27 Percentage of Respondents Statement of Employees’ Performance Basedon Counterproductive Work Behavior ............................................. 57
Table 28 Multiple Linear Regression Analysis Result ................................. 59
Table 29 The t-test results for Hypotheses I ................................................. 61
Table 30 The t-test results for Hypoyheses II ................................................ 61
Table 31 F test Result .................................................................................... 63
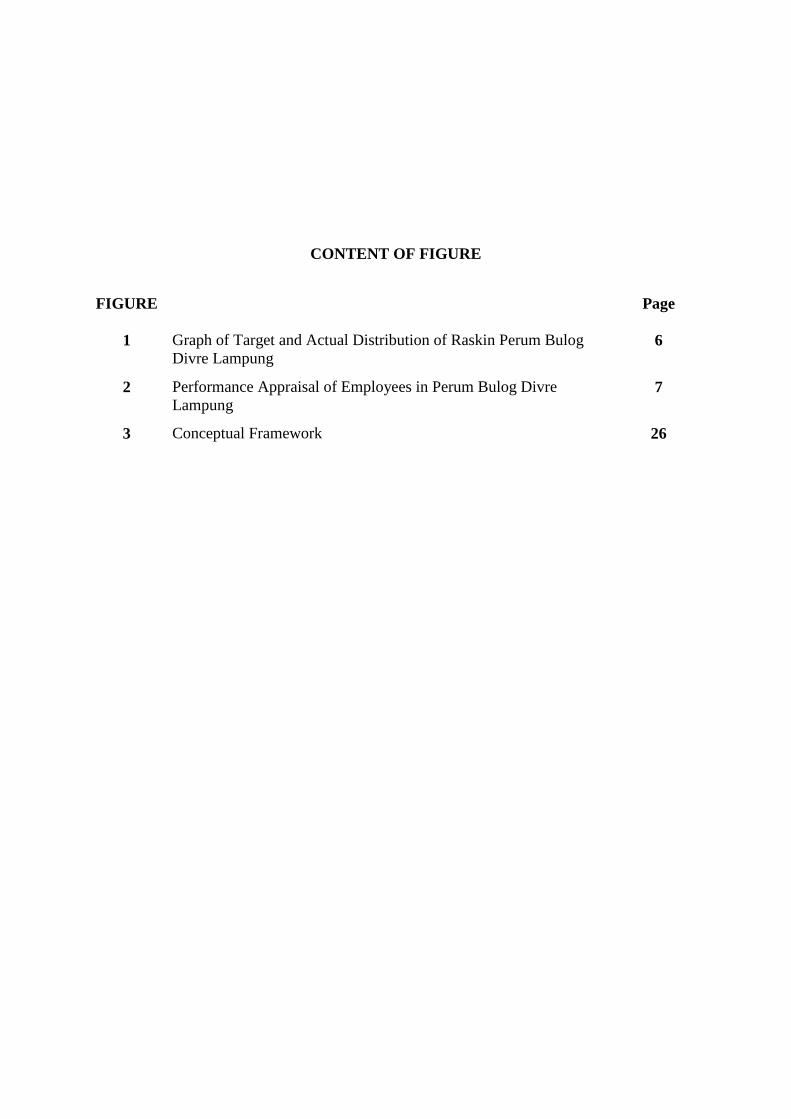
CONTENT OF FIGURE
FIGURE Page
1 Graph of Target and Actual Distribution of Raskin Perum BulogDivre Lampung
6
2 Performance Appraisal of Employees in Perum Bulog DivreLampung
7
3 Conceptual Framework 26
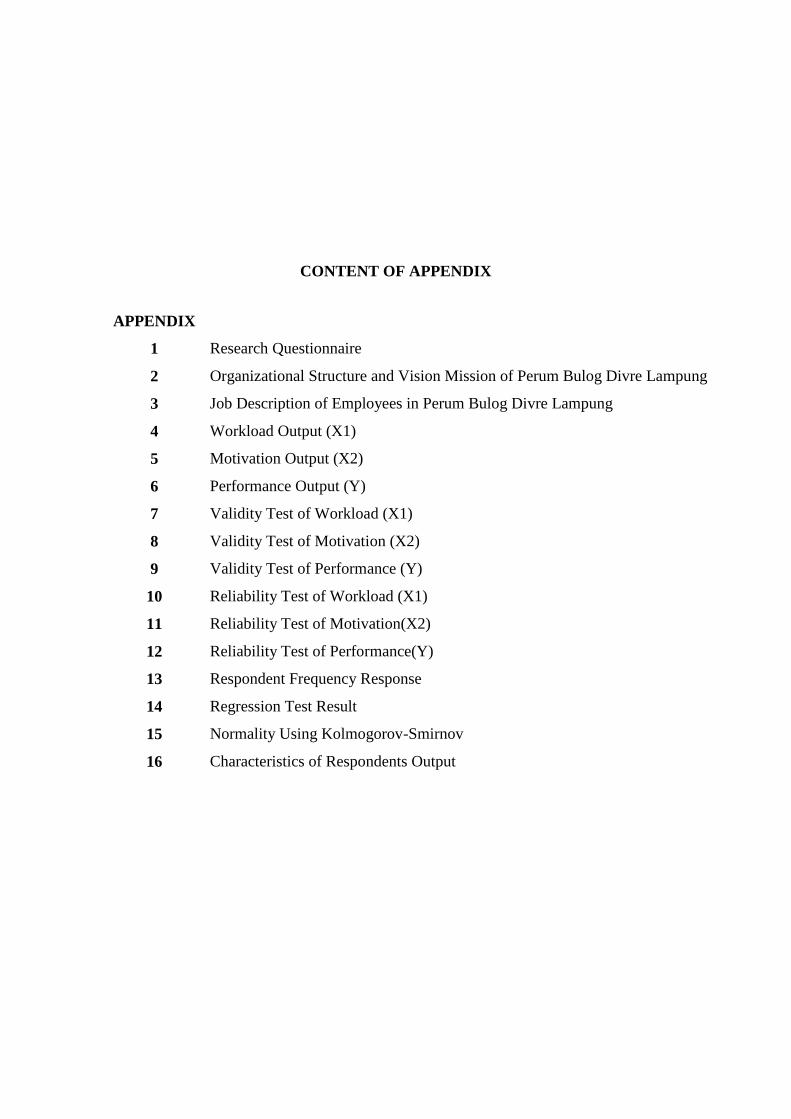
CONTENT OF APPENDIX
APPENDIX
1 Research Questionnaire
2 Organizational Structure and Vision Mission of Perum Bulog Divre Lampung
3 Job Description of Employees in Perum Bulog Divre Lampung
4 Workload Output (X1)
5 Motivation Output (X2)
6 Performance Output (Y)
7 Validity Test of Workload (X1)
8 Validity Test of Motivation (X2)
9 Validity Test of Performance (Y)
10 Reliability Test of Workload (X1)
11 Reliability Test of Motivation(X2)
12 Reliability Test of Performance(Y)
13 Respondent Frequency Response
14 Regression Test Result
15 Normality Using Kolmogorov-Smirnov
16 Characteristics of Respondents Output
I. INTRODUCTION
1.1 Background
One of the factors in determining success is performance or productivity of
employees. In this globalization era, every company or either government-
ownedagencies and private companies are demanded to improve more in every
kind of aspects in order to achieve the purpose of the company, one of them is to
increase employees’ performance. Managers must be able to develop, coordinate
and direct the employees according to the purpose of the company. This is very
essential because not all new employees are directly suitable with the company
needs. Employees must be trained in order that they are able to do work
effectively. Whether or not the company achieve its purpose is influenced by
employees’ performance. Performance is the result of optimal work achievement
done by someone or a group/ agency.
Employees’ performance influenced by some factors which includes motivation,
ability, knowledge, talent, education, training, passion, personality attitude
consists of physical conditions and physiological needs, social needs and egoistic
needs (Sutermeister, 1999).Another factor is workload which put upon each
employee, because basically workload is the responsibilities which they have to
bear during undergoing activities inside the company. Companies will try to
choose and maintain talented employees to compete in the global market.
2
Akhavan and Jaffari (2008) reveal that the biggest problem is that the concerns of
organizations and employees are not always getting long together. Employees are
expecting to have little work meanwhile the managers try to optimize the
productivies of available workers by giving the workload beyond their abality.
Similarly the workers wish to get more salary with fewer try meanwhile the
managers try to pay the workers fewer so that the cost taken is lower. Those
problems are the triggers the worse performance of some employees.
Motivation is one of factors in performance, spur employees’ motivation must be
done to encourage a better performance achievement. Flippo (2002) revealed that
motivations is a proficiency in directing the employees and organization in order
that it will successfully work, so that the employees’ wishes and the purpose of
the company achieve at once. Motivation is a process in giving motif working on
the employees so that they want to work for the sake of reaching the company
purposes effectively and efficiently. Motivation can also act as a tool for the
leaders in order that their employees are more productive. Qualities of the
employees are the important effect in performance. Employees with the higher
level of motivation will successfully do their work. Performance becomes the
most important thing in the company because perfromance level will be getting
worse if the motivation level of employees decreases.
Every company especially government-owned agencies, employees are important
element besides other resorces, because in its duty of serving publics it is needed
the more talented human resources so that the perfromance of the company is
rated good by government or society similarly with the duties and responsibilities
of Perum Bulog which is engaged in food and logistics. The business scope of this
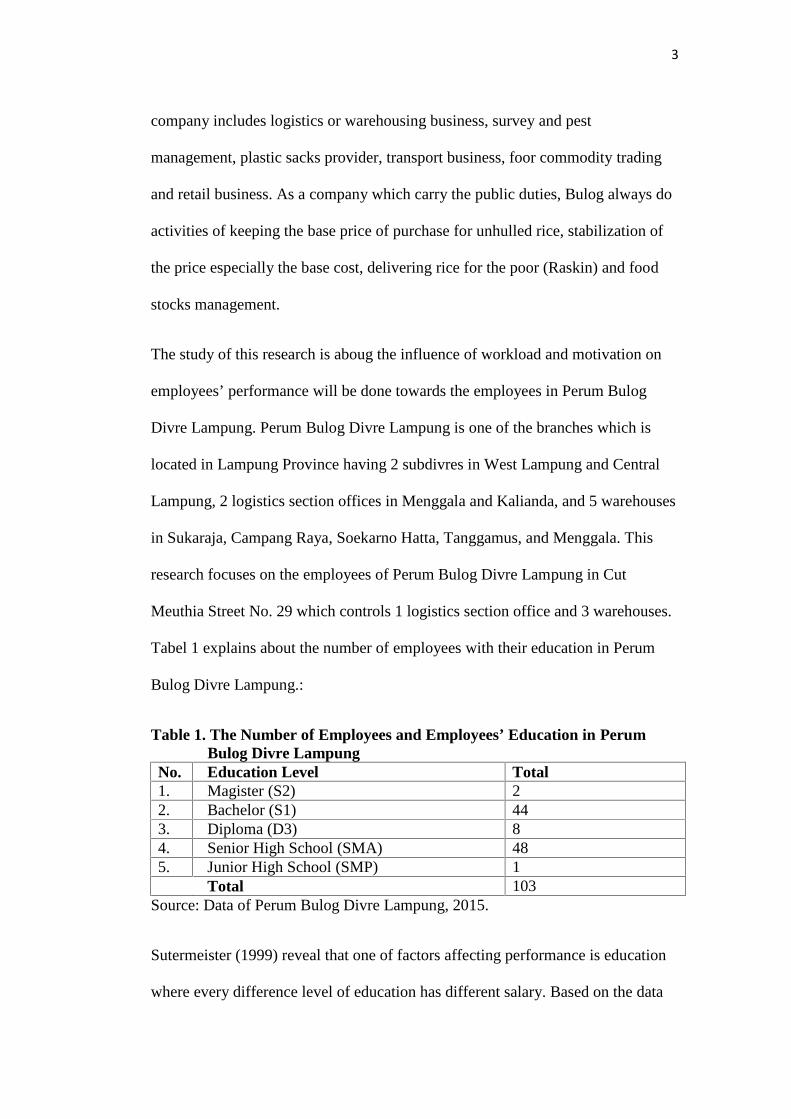
3
company includes logistics or warehousing business, survey and pest
management, plastic sacks provider, transport business, foor commodity trading
and retail business. As a company which carry the public duties, Bulog always do
activities of keeping the base price of purchase for unhulled rice, stabilization of
the price especially the base cost, delivering rice for the poor (Raskin) and food
stocks management.
The study of this research is aboug the influence of workload and motivation on
employees’ performance will be done towards the employees in Perum Bulog
Divre Lampung. Perum Bulog Divre Lampung is one of the branches which is
located in Lampung Province having 2 subdivres in West Lampung and Central
Lampung, 2 logistics section offices in Menggala and Kalianda, and 5 warehouses
in Sukaraja, Campang Raya, Soekarno Hatta, Tanggamus, and Menggala. This
research focuses on the employees of Perum Bulog Divre Lampung in Cut
Meuthia Street No. 29 which controls 1 logistics section office and 3 warehouses.
Tabel 1 explains about the number of employees with their education in Perum
Bulog Divre Lampung.:
Table 1. The Number of Employees and Employees’ Education in PerumBulog Divre Lampung
No. Education Level Total1. Magister (S2) 22. Bachelor (S1) 443. Diploma (D3) 84. Senior High School (SMA) 485. Junior High School (SMP) 1
Total 103Source: Data of Perum Bulog Divre Lampung, 2015.
Sutermeister (1999) reveal that one of factors affecting performance is education
where every difference level of education has different salary. Based on the data
4
above, the number of employees in Perum Bulog Divre Lampung is 103 people
with 2 people educated magister, 44 people bachelor, 8 people educated diploma
III, 48 people educated senior high school, and one person educated junior high
school.
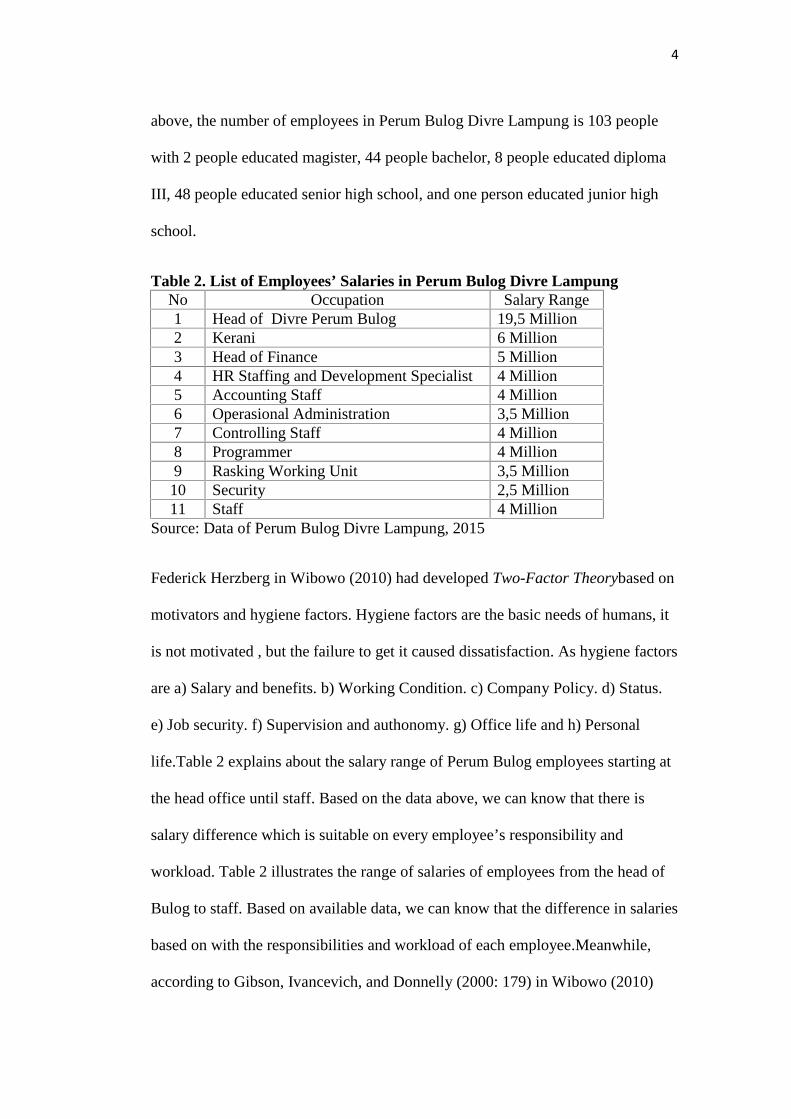
Table 2. List of Employees’ Salaries in Perum Bulog Divre LampungNo Occupation Salary Range1 Head of Divre Perum Bulog 19,5 Million2 Kerani 6 Million3 Head of Finance 5 Million4 HR Staffing and Development Specialist 4 Million5 Accounting Staff 4 Million6 Operasional Administration 3,5 Million7 Controlling Staff 4 Million8 Programmer 4 Million9 Rasking Working Unit 3,5 Million10 Security 2,5 Million11 Staff 4 Million
Source: Data of Perum Bulog Divre Lampung, 2015
Federick Herzberg in Wibowo (2010) had developed Two-Factor Theorybased on
motivators and hygiene factors. Hygiene factors are the basic needs of humans, it
is not motivated , but the failure to get it caused dissatisfaction. As hygiene factors
are a) Salary and benefits. b) Working Condition. c) Company Policy. d) Status.
e) Job security. f) Supervision and authonomy. g) Office life and h) Personal
life.Table 2 explains about the salary range of Perum Bulog employees starting at
the head office until staff. Based on the data above, we can know that there is
salary difference which is suitable on every employee’s responsibility and
workload. Table 2 illustrates the range of salaries of employees from the head of
Bulog to staff. Based on available data, we can know that the difference in salaries
based on with the responsibilities and workload of each employee.Meanwhile,
according to Gibson, Ivancevich, and Donnelly (2000: 179) in Wibowo (2010)
5
express that in addition to wages and salaries as well as intensive, the employee
can be given benefits which is other compensations beyond salaries and wages.
Benefits provided to Bulog employees are Bulog Special Allowances (TKB)
which is provided in the monthly salary of each employee with permanent status,
while contract employees hired by the Cooperative Logistics Agency of Indonesia
(KOPELINDO).
Another factor that can affect the performance of employees is the workload.
According Komaruddin in Kurnia (2010) a workload analysis is the process to set
the number of hours people are used or needed to complete a job within a certain
time, or in other words workload analysis aims to determine how the number of
personnel and the amount of responsibility or burden proper work delegated to an
officer. Table 3 describes the working time of employees in Perum Bulog Divre
Lampung:
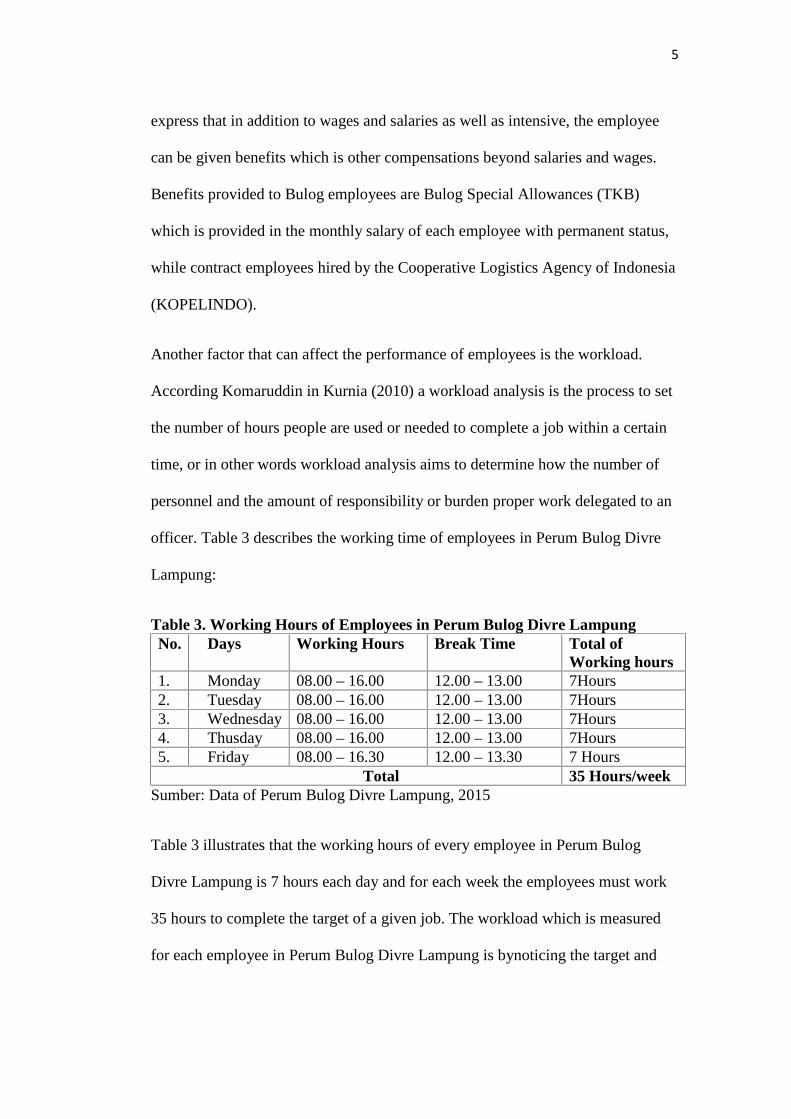
Table 3. Working Hours of Employees in Perum Bulog Divre LampungNo. Days Working Hours Break Time Total of
Working hours1. Monday 08.00 – 16.00 12.00 – 13.00 7Hours2. Tuesday 08.00 – 16.00 12.00 – 13.00 7Hours3. Wednesday 08.00 – 16.00 12.00 – 13.00 7Hours4. Thusday 08.00 – 16.00 12.00 – 13.00 7Hours5. Friday 08.00 – 16.30 12.00 – 13.30 7 Hours
Total 35 Hours/weekSumber: Data of Perum Bulog Divre Lampung, 2015
Table 3 illustrates that the working hours of every employee in Perum Bulog
Divre Lampung is 7 hours each day and for each week the employees must work
35 hours to complete the target of a given job. The workload which is measured
for each employee in Perum Bulog Divre Lampung is bynoticing the target and
6
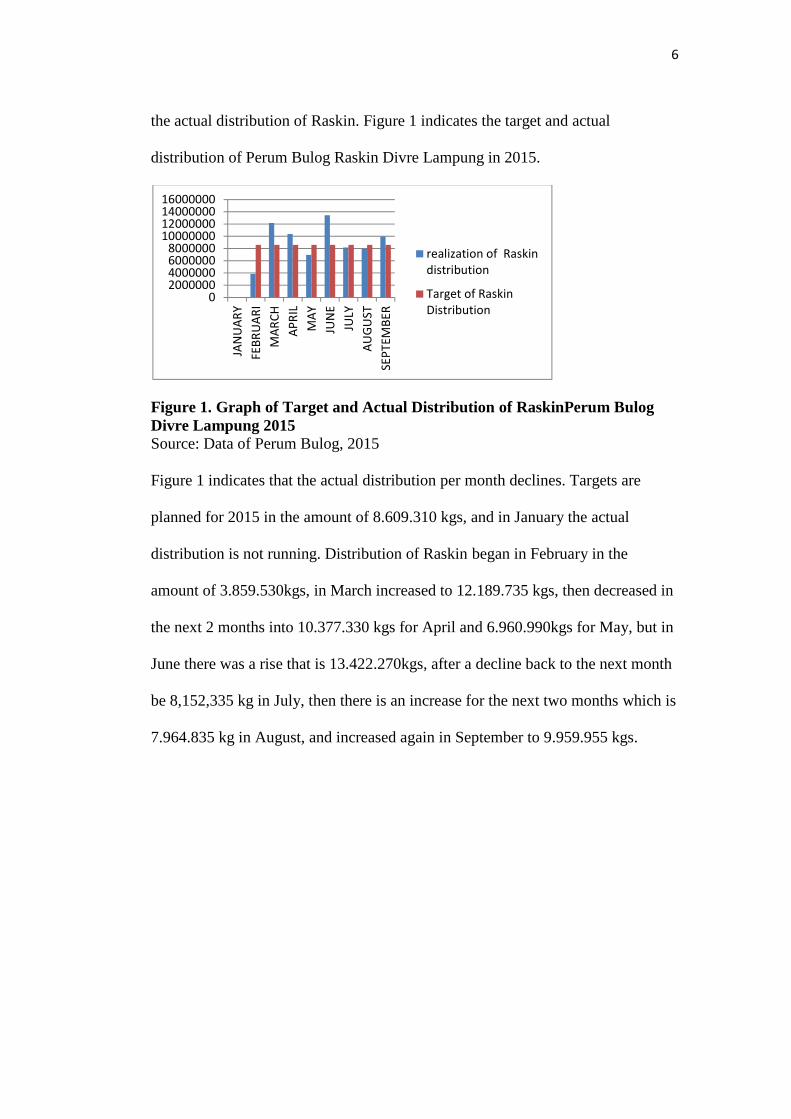
the actual distribution of Raskin. Figure 1 indicates the target and actual
distribution of Perum Bulog Raskin Divre Lampung in 2015.
Figure 1. Graph of Target and Actual Distribution of RaskinPerum BulogDivre Lampung 2015Source: Data of Perum Bulog, 2015
Figure 1 indicates that the actual distribution per month declines. Targets are
planned for 2015 in the amount of 8.609.310 kgs, and in January the actual
distribution is not running. Distribution of Raskin began in February in the
amount of 3.859.530kgs, in March increased to 12.189.735 kgs, then decreased in
the next 2 months into 10.377.330 kgs for April and 6.960.990kgs for May, but in
June there was a rise that is 13.422.270kgs, after a decline back to the next month
be 8,152,335 kg in July, then there is an increase for the next two months which is
7.964.835 kg in August, and increased again in September to 9.959.955 kgs.
02000000400000060000008000000
10000000120000001400000016000000
JAN
UAR
YFE
BRU
ARI
MAR
CHAP
RIL
MAY
JUN
EJU
LYAU
GUST
SEPT
EMBE
R
realization of Raskindistribution
Target of RaskinDistribution
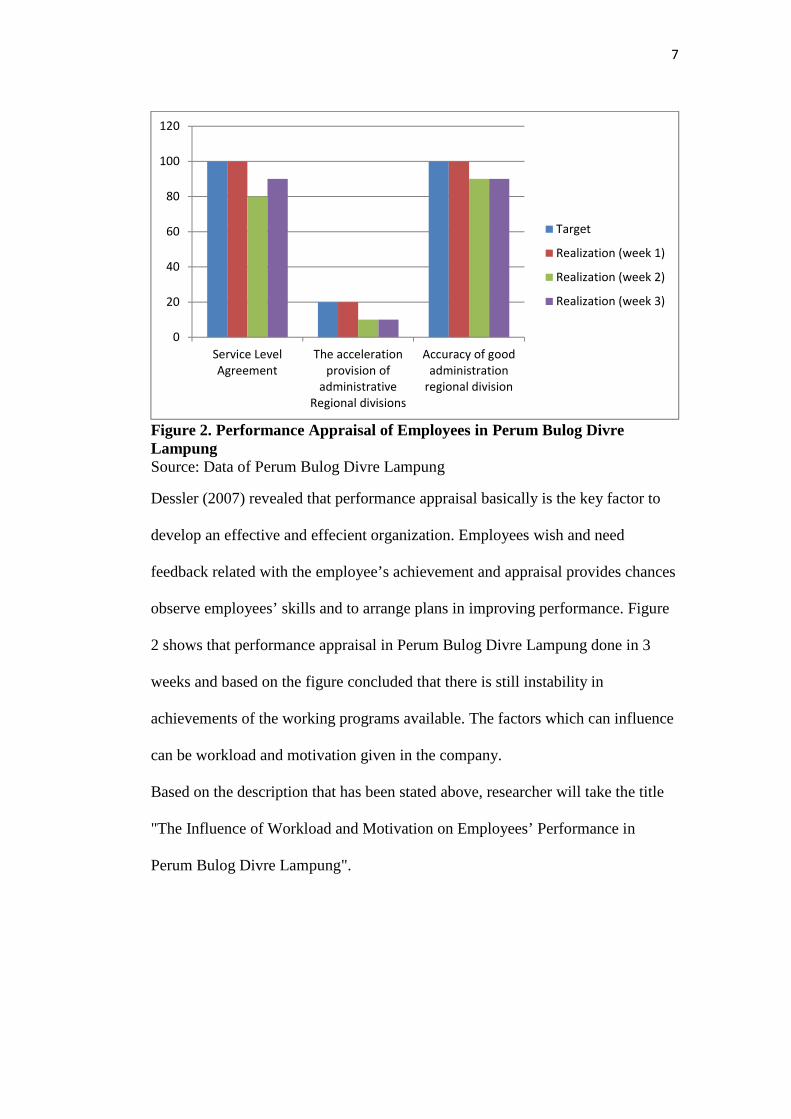
7
Figure 2. Performance Appraisal of Employees in Perum Bulog DivreLampungSource: Data of Perum Bulog Divre Lampung
Dessler (2007) revealed that performance appraisal basically is the key factor to
develop an effective and effecient organization. Employees wish and need
feedback related with the employee’s achievement and appraisal provides chances
observe employees’ skills and to arrange plans in improving performance. Figure
2 shows that performance appraisal in Perum Bulog Divre Lampung done in 3
weeks and based on the figure concluded that there is still instability in
achievements of the working programs available. The factors which can influence
can be workload and motivation given in the company.
Based on the description that has been stated above, researcher will take the title
"The Influence of Workload and Motivation on Employees’ Performance in
Perum Bulog Divre Lampung".
0
20
40
60
80
100
120
Service LevelAgreement
The accelerationprovision of
administrativeRegional divisions
Accuracy of goodadministration
regional division
Target
Realization (week 1)
Realization (week 2)
Realization (week 3)
8
1.2 Problem Statement
The workload for each employee inPerum Bulog Divre Lampung is quite heavy
because it is based on the actual distribution of Raskin which must be distributed
in each Divre and by figure 1 shows that between realization and targets to be
achieved in the distributing Raskin is still experiencing instability and figure 2
shows that thare is instability in performance appraisal which is done every 3
weeks and it can be influenced by workload and motivation available in the
company. Based on the background above, the researcher identified the problems
as follows:
1. Does the workload influence employees’ performance in Perum Bulog
Divre Lampung?
2. Does motivation influence employees’ performance in Perum Bulog Divre
Lampung?
3. Do workload and motivation simultaneously influence employees’
performance in Perum Bulog Divre Lampung?
1.3 Research Objective
Based on the background and the problem statement, so this research objectives
are:
1. To determine the influence of workload on employees’ performance in
Perum Bulog Divre Lampung.
2. To determine the influence of motivation on employees’ performance in
Perum Bulog Divre Lampung.
9
3. To determine the simultaneous influence of workload and motivation on
employees’ performance in Perum Bulog Divre Lampung.
1.4 Benefits of Research
The benefits are expected to arise in the presence of this research are:
1. This research is expected to be the evaluation which can be considered by
the leader in determining policy especially in human resource division
about employees’ workload, motivation and performance.
2. This research is expected to be contribution of knowledge for others in
need, when discussing about the problems which have to do with the
influence of workload and motivation on employees’ performance.
10
II. LITERATURE REVIEW, CONCEPTUAL FRAMEWORKS AND
HYPOTHESES
2.1 Human Resource
2.1.1 The Meaning of Human Resource
According to Follett (1993) Human Resource Management is an art to achieve
organizational goals through arrangements of other people to carry out various
jobs as needed, or in other words not doing work themselves. While Gomes
(2002: 3), gives a different meaning, that HRM is a motion of recognizing the
importance of the human element as a potential resource that should be developed
in such a way so as to give a maximum contribution to the organization and to the
development itself. According to Mathis and Jackson (2006, p3) stated that
Human Resources is the design of the formal systems within an organization to
ensure the use of human talent effectively and efficiently in order to achieve
organizational goals.
According to the Chartered Institute of Personnel and Development (CIPD) in
Mullins (2005) stated that the design, implementation and maintenance of
11
strategies to manage people for optimum business performance including the
development of policies and process to support these strategies.
According Rival (2003, p 1), Human Resource Management is one of the areas of
general management that includes aspects of planning, organizing,
implementation and control. This process is contained in functions or areas of
production, marketing, finance, and personnel. Because human resources is
considered an increasingly important role in the achievement of corporate
objectives, the various experiences and research results in the field of human
resources systematically collected in what is called human resource management.
The term of "management" has the meaning as a collection of knowledge about
how to manage the human resources.
2.1.2 The Function of Human Resource
There are functions of Human Resource Management according to Flippo (2002):
1. Managerial Function
This function consists of:
a. Planning
Planning has meaning determination regarding labor program will support the
achievement of the goals set by the company.
12
b. Organizing
The organization was formed by designing the structure of the relationship
that links between employment, employees, and physical factors that can be
established cooperation with one another.
c. Directing
The directing consists of the staffing function and leading. Staffing function is
to put people in the organizational structure, while the functions performed
leading human resource directingin order that employees work in accordance
with the objectives set.
d. Controlling
By being available of managerial functions that arrange the activities to fit the
predetermined plan organization in accordance with the objectives to be
achieved, in case of deviation could be detected and promptly carried out
repairs.
2. Operational Function
This function consists of:
a. Procurement
Attempts to obtain the required number of manpower companies, especially
those relating to the determination of manpower requirements, withdrawal,
selection, orientation and placement.
13
b. Development
Efforts to improve employee skills through education and training program
that is appropriate for the employee or the employee can do their job well.
This activity is important and will continue to grow due to changing
technologies, the adjustment and the increasing difficulty of the task manager.
c. Compensation
Compensation function defined as efforts to provide remunerationor adequate
remuneration to the employees in accordance with the contributions that have
been donated to the company or organization.
2.2 Workload
2.2.1 The Definition of Workload
According to Irwandi (2007) workload is the average frequency of activity of each
job within a certain period. Workload according to Haryono (2004) is the number
of activities that must be completed by a person or group of people for a certain
period of time under normal circumstances. According to Regulation No.
12/2008, the work load is the amount of work that must be borne by an office or
unit organization and is the product of the volume of work and the norms of the
time. It can be concluded workload definition is a process undertaken by a person
in completing the tasks of a job or position group carried out under normal
circumstances in a given time period.
14
2.2.2 Factors Influenced Workload
Factors influenced workload according to Tarwaka (2011) as follows:
1. External Factor: workload which comes from outside the employees’
bodies, like:
1) Duties: includes such physical tasks, work station, workplace layout,
work space conditions, working conditions, work attitude, a way of
conveyance, the load is lifted. While the task is mental covering,
responsibility, job complexity, emotion workers and so on.
2) The organization of work: includes the length of working time, rest
periods, shift work, work systems and so on.
3) Working environment. The work environment can impose additional
burdens which includes, physical work environment, work
environment of chemical, biological work environment and
psychological work environment.
2. Internal Factor
Internal factors are factors originating from within the body as a result of
reaction to the workload of the external potential as stressors, factors include
somatic (gender, age, body size, nutritional status, health condition, and so
on), and psychological factors (motivation, perception, belief, desire,
satisfaction, and so on).
15
2.3 Motivation
2.3.1 The Definition of Motivation
Pearson stated that motivation refers to reasons that underlie behavior that is
characterized by willingness and volition. Guay (2010:712) stated that motivation
refers to the reasons underlying behavior. According Winardi (2000) motivation is
the desire contained in an individual that stimulate to action. Flippo (2002) argues
motivation is a skill in directing employees and organizations in order to work
successfully, so that the wishes of the employee and organizational goals once
achieved.
Based on some meanings of motivation above it can be concluded that the
motivation arises from the self to achieve a specific purpose and can also be due
to the encouragement of others. But the best motivation is of myself because it
was done without coercion, and each individual has a different motivation to
achieve its objectives.
2.3.2 Motivation Objective
The purpose of motivation according to Hasibuan (2000) is to improve the morale
and job satisfaction of employees, increase productivity of employees, improve
discipline employees, maintain the stability of the company's employees,
streamline procurement employees, creating an atmosphere and a good working
relationship, increase loyalty, creativity and employee participation, increase
employee welfare, heightening the sense of responsibility of employees to the
tasks, improve the efficiency of the use of tools and raw materials.
16
2.3.3 Motivation Theory
Widodo (2015) revealed that there are several theories about the motivation, is as
follows:
1. Motivation Theory of Needs
This theory proposed by Abraham Maslow A. stating that people were
motivated to satisfy a number of requirements inherent in every human being
who tend to be congenital. This requirement consists of five types and are
formed in a hierarchy in the fulfillment, in the sense that humans are basically
the first one will try to fulfill the needs of the first level, then the need for a
second level and so on, and the fulfillment of all the requirements are met is
not a motivating element again. The need according to Maslow are physical
needs, safety needs, social needs, the need for recognition, self-actualization
needs.
2. X and Y Theory
This theory states that people are basically of two types. Originators
McGregor, said that there are types of the human X and Y type of each man
has certain characteristics. Human type X is a man who always wanted to
avoid work whenever possible, whereas Y indicates the kind of human nature
likened love to work that worked for him as playing. Then the human species
X does not have the initiative and happy directed, whereas human jens Y is
the opposite. Attributed to the need, it is said that the human type X when
referring to Maslow's hierarchy of needs, have a low level compared to the
human needs of the type of Y which has a high degree.
17
3. Two Factor Theory of Motivation
This theory is called the theory of two factors because in this theory
dikembang-kan two motivational factor for employees. The first factor is
called the factors that make employees feel dissatisfied (dissatiffiers factor)
and the second factor is called the factors that make employees feel satisfied
(satisfiers factor). Two factors are also called extrinsic and intrinsic factors.
Dissatisfer factors or extrinsic factors consist of a series of working conditions
include factors salary, job security, working conditions, status, company
policy, the quality of surveillance techniques, inter-personal interaction. The
second factor, namely the factor or factors intrinsic satisfiers, consists of a
series of working conditions that include several factors such as recognition,
responsibility, achievement, work itself, the possibility to develop and
progress. This theory states that people are basically of two types. Originators
McGregor, said that there are types of the human X and Y type of man that
each of them has certain characteristics. Human type X is a man who always
wanted to avoid work whenever possible, whereas Y indicates the kind of
human nature likened love to work that worked for him as playing. Then the
human species X does not have the initiative and happy directed, whereas
human jens Y is the opposite. Attributed to the need, it is said that the human
type X when referring to Maslow's hierarchy of needs, have a low level
compared to the human needs of the type of Y which has a high degree.
18
2.3.4 Motivating Measures
Motivation is an active process that is driven by a series of actions that can be
grouped into three groups, Baldoni (2005), namely:
1. Energize (giving power), is what leaders do when they give you an
example, communicate clearly, and provide a challenge to the right
- Exemplify
Motivation starts with a good example.
- Communicate
Communication is a central issue for the leadership, including how the
leader speak, listen, and learn.
- Chalange
Leaders who opened the way to such needs can be strongly associated
with achieving the goal because the fulfillment of expectations.
2. Encourage (push), is what leaders do to support the process of motivation
through empowerment, coaching, and recognition.
3. Exhort (urgent), is how leaders create an experience based on sacrifice
and inspiration that prepare the ground for the motivation to be able to
thrive.
19
- Sacrifice
Service is most correct size is sacrifice, putting the needs of others ahead
than our own needs.
- Inspire
Motivation can be developed into an inspiration, because motivation
comes from within, its shape was the inspiration themselves. This process
is maintained by observing other people achieve their goals.
2.4 Performance
2.4.1 The Definition of Performance
According to Dessler (2005) performance is a performance, a comparison of the
work to the standards set. Robbins (2003) stated that performance is defined as the
output and accomplishments of a worker, which are acknowledged by the
organization or system in which he works in.
According Wibowo (2010) suggests that the performance is about doing the work
and results of the work. From the various descriptions above can confirm that the
employee's performance is, the performance is a comparison of the work achieved
by the employee with the specified standard. Performance also means that the
results achieved by someone, both the quantity and quality within an organization
in accordance with the responsibilities given to him.
20
2.4.2 Factors Influenced Performance
Simanjuntak (2011) suggests a person's performance in influencing factors which
can be classified in three (3) groups: individual compensation, organizational
support factors and psychological factors. According to Mathis and Jackson
(2002) in a discussion of the problems of the employee's performance can not be
separated from the various factors that accompany them the capability and the
motivation factor.
2.4.3 Indicators of Performance
There are two indicators of performance by Goodman and Svyantek (1999: 261),
as follows:
1. Contextual Performance
This indicator refers to activities such as willingness to carry out unauthorized
actions on the job, helping others, following the rules of the organization/
procedures when personal comfortable, supportive organizational objectives and
survive with little extra effort to successfully complete the activities of one's
duties.
Contextual performance consists of two parts:
- Altruism that individual characteristics that can be demonstrated by a
willingness to help or altruistic.
21
- Conscientiousness that individual characteristics that can be shown
with regular characteristics, more full of restraint and use awareness
and conscience in the execution of works.
2. Task performance
This indicator refers to the abilities and skills of employees in performing
basic tasks, include activities that contribute well to the work, managing the
responsibilities, using skills entirely in doing tasks and completing work
assignments given in accordance with the determined deadlines.
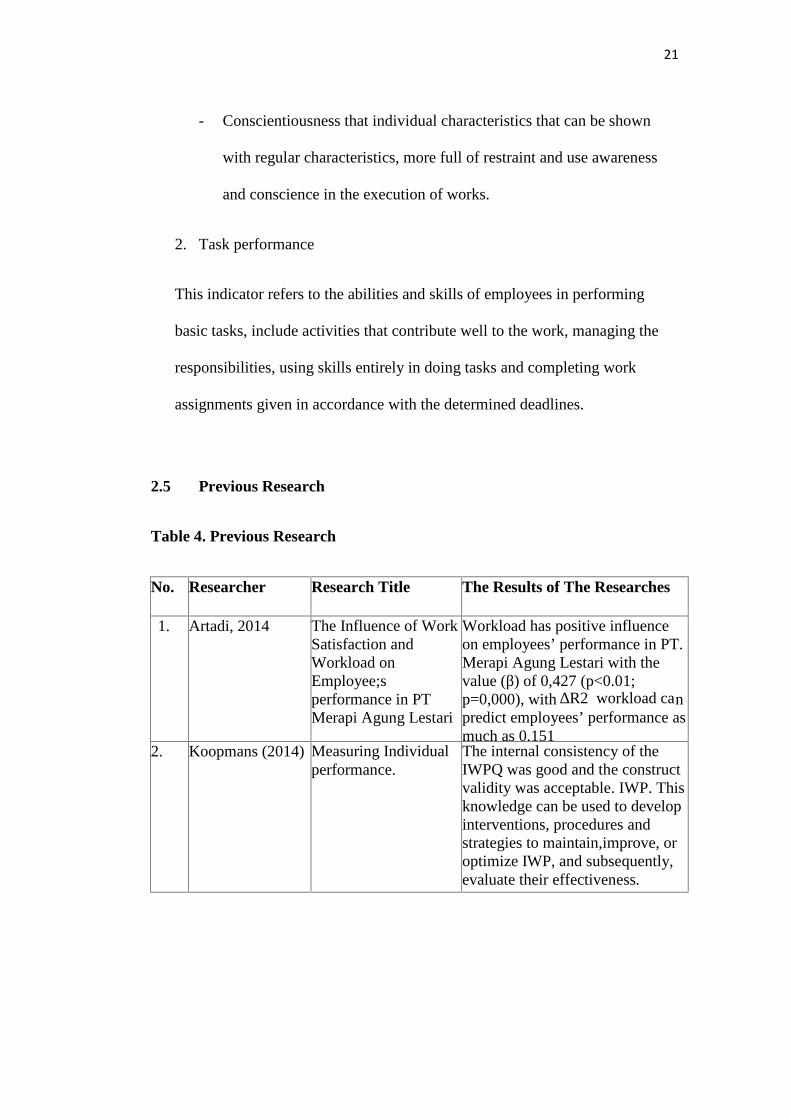
2.5 Previous Research
Table 4. Previous Research
No. Researcher Research Title The Results of The Researches
1. Artadi, 2014 The Influence of WorkSatisfaction andWorkload onEmployee;sperformance in PTMerapi Agung Lestari
Workload has positive influenceon employees’ performance in PT.Merapi Agung Lestari with thevalue (β) of 0,427 (p<0.01;p=0,000), with ∆R2 workload canpredict employees’ performance asmuch as 0,151
2. Koopmans (2014) Measuring Individualperformance.
The internal consistency of theIWPQ was good and the constructvalidity was acceptable. IWP. Thisknowledge can be used to developinterventions, procedures andstrategies to maintain,improve, oroptimize IWP, and subsequently,evaluate their effectiveness.
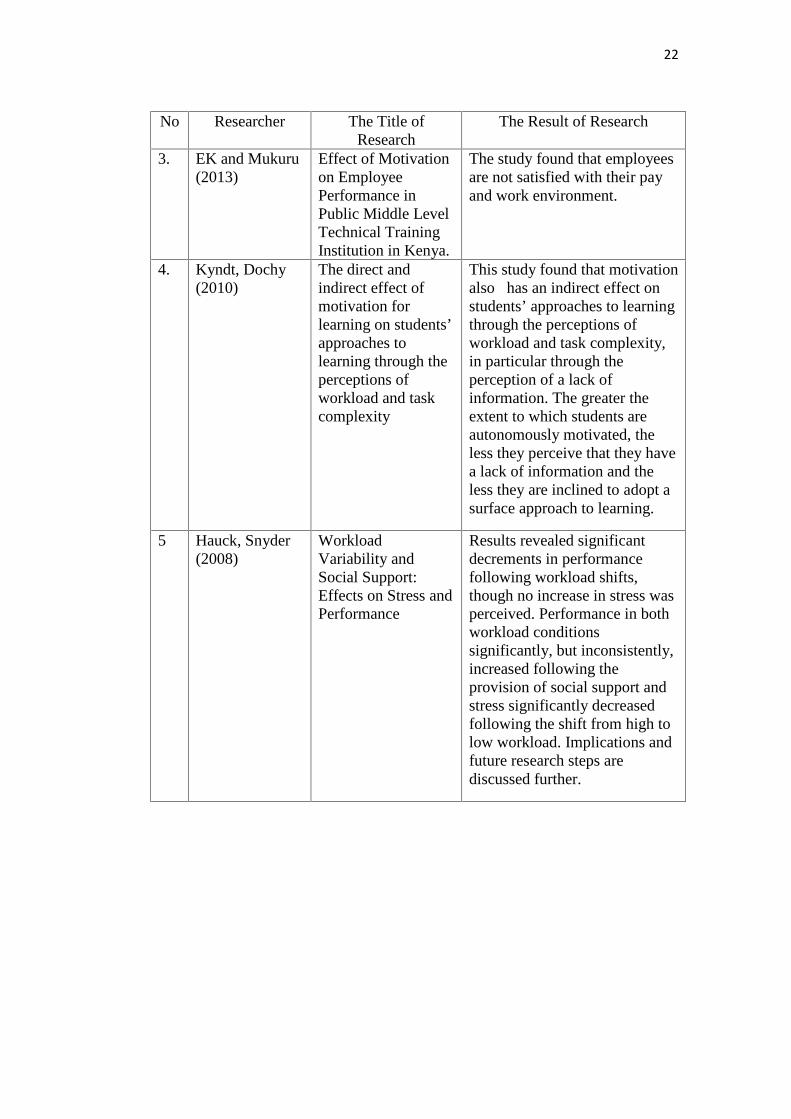
22
No Researcher The Title ofResearch
The Result of Research
3. EK and Mukuru(2013)
Effect of Motivationon EmployeePerformance inPublic Middle LevelTechnical TrainingInstitution in Kenya.
The study found that employeesare not satisfied with their payand work environment.
4. Kyndt, Dochy(2010)
The direct andindirect effect ofmotivation forlearning on students’approaches tolearning through theperceptions ofworkload and taskcomplexity
This study found that motivationalso has an indirect effect onstudents’ approaches to learningthrough the perceptions ofworkload and task complexity,in particular through theperception of a lack ofinformation. The greater theextent to which students areautonomously motivated, theless they perceive that they havea lack of information and theless they are inclined to adopt asurface approach to learning.
5 Hauck, Snyder(2008)
WorkloadVariability andSocial Support:Effects on Stress andPerformance
Results revealed significantdecrements in performancefollowing workload shifts,though no increase in stress wasperceived. Performance in bothworkload conditionssignificantly, but inconsistently,increased following theprovision of social support andstress significantly decreasedfollowing the shift from high tolow workload. Implications andfuture research steps arediscussed further.
23
2.6 Conceptual Framework
According Kyndt, Dochy (2010), the factors to be considered in the workload
covers:
1. Mental demand. Emotional distress, psychological or mental placed on
the individual. Stress occurs when this pressure exceeds the individual's
ability to cope. Stress does not lend itself ready for measurement and
therefore can not be ascertained in standard units.
2. Physical demand. Pressure exerted on the body by exercise or other forms
of physical activity, environmental extremes (eg very hot climates),
medical problems, and poor lifestyle habits such as smoking or lack of
sleep. Physical stress such as mental stress aggravates thereby increasing
the overall burden of stress felt by an individual.
3. Temporal demand. Perceived time pressure because of the level or speed
at which tasks or task element occurs, which can also be measured by
comparing the time it takes for a series of subtasks of the time available.
4. Effort. Total work done to achieve specific objectives
5. Frustration. Insecurity and dissatisfaction arising from unresolved
problems or unfulfilled needs.
According to EK and Mukuru (2013) Herzberg's theory presents a strong
relationship between motivation and performance of employees in TVET
institutions. He presents that performance can come as an emanation of feeling
like achievement, progress, growth associated with motivation. He stressed the
24
importance of job enrichment and job enlargement he parted from which includes
responsibility for enhancing and engagement, opportunities for advancement and
a sense of achievement. Here is a glance at each of the factors of motivation
according to Herzberg:
1. Recognition. When employees receive the recognition they deserve for a
job well done, the satisfaction will increase.
2. Possibility of Growth. This motivation factor includes the chance one
might have for advancement within the institution. This could also include
the opportunity to learn a new skill or trade.
3. Working Relationship.This is those relationships one engages in with
their supervisors, peers, and subordinates.
4. Working Conditions. This includes the physical surroundings that one
works within, such as the facilities or location.
5. Salary. This factor is fairly simple, the increase or decrease of wage or
salary effects the dissatisfaction within a company a great deal..
6. Job Security.This is a pretty significant factor. The sense of job security
within a position or organization as a whole relates to the dissatisfaction as
well.
7. Institution Policy. An employee’s perception of whether the policies in
place are good or bad or fair or not, changes the level of dissatisfaction
that employee will feel.
25
According to Koopmans et al. (2014), factors to consider in evaluating
performance include:
1. Work Performance, refers to the ability of an employee to perform tasks
that the main job, which includes the quality of work, planning and
organizing tasks, results-oriented, prioritize, and work efficiently.
2. Contextual Performance, refers to the behaviour of employees who
support the organization, social, and psychological environment in which
job tasks central carried out, for example, is responsible for the work,
creative, has initiative, happy to take a challenging job, communicate
effectively, able to work together, and to accept and learn from others.
3. Counterproductive Work Behaviour, refers to behaviours that are
harmful to the survival of the organization, for example, do things that are
detrimental to the organization, to do things that harm co-workers and
superiors, and deliberately make mistakes.
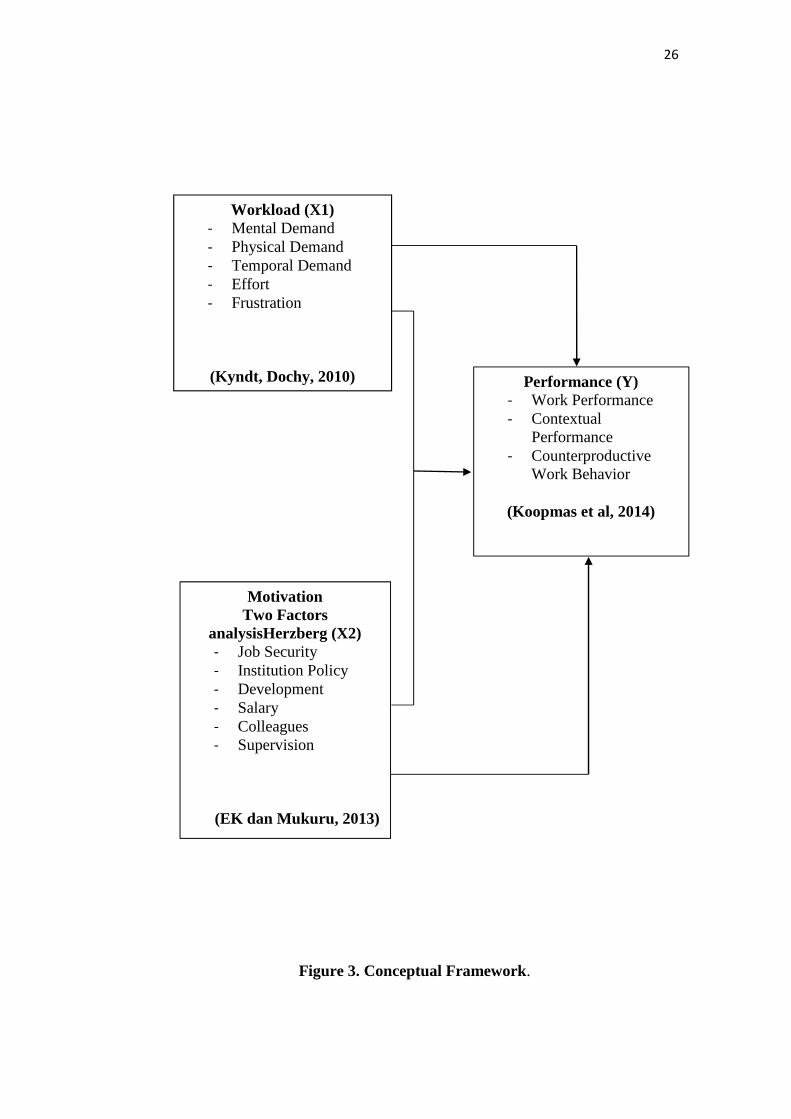
Diagram 1 shows the framework for this study based on the theory that has been
described.
26
Figure 3. Conceptual Framework.
Workload (X1)- Mental Demand- Physical Demand- Temporal Demand- Effort- Frustration
(Kyndt, Dochy, 2010)
MotivationTwo Factors
analysisHerzberg (X2)- Job Security- Institution Policy- Development- Salary- Colleagues- Supervision
(EK dan Mukuru, 2013)
Performance (Y)- Work Performance- Contextual
Performance- Counterproductive
Work Behavior
(Koopmas et al, 2014)
27
2.7 Hypotheses
Based on the background, problem formulation and framework that have been
developed in this study, the researchers are able to formulate hypotheses as
follows:
1. Workload has a positive and significant influence on employees’
performance in Perum Bulog Divre Lampung.
2. Motivation has a positive and significant influence on employees’
performance in Perum Bulog Divre Lampung.
3. Workload and motivation have simultaneous influences on employee’s
performance in Perum Bulog Divre Lampung.
III. RESEARCH METHOD
3.1 Research Object
This research was done in Perum Bulog Divre Lampung which is located on Cut
Meuthia Street No. 29, Bandar Lampung.Perum Bulog is a state-owned company
engaged in the food logistics. The company business scope includes business
logistics/warehousing, survey and eradication of pests, the provision of plastic bags,
transport business, food commodity trading and retail businesses. As a company that
remains the task of the public from the government, Perum Bulog keep doing
activities to maintain floor prices for grain purchases, particularly the cost of price
stabilization, distribute rice for the poor (Raskin) and management of food stocks.
3.2 Research Design
This study uses a quantitative approach to the category of associative causal
research, Oei (2010). A quantitative approach used in this study is to use the survey
method. In the survey, information was collected from respondents using a
questionnaire. Generally, the survey research is limited to research on data collected
from a sample population to represent the entire population. This study aims to
determine the effect of the variables to be studied, the influence of workload and
motivation on employees’ performance in Perum Bulog Divre Lampung.
29
3.3 Identification of Research Variables
Variable research is an attribute or trait value of people, objects or activities which
have certain variations are set to be learned and conclusions drawn (Sugiyono,
2013).Variables used in the study can be classified into two variables:
1. The independent variable, the variables that explain and affect other variables.
In this study, the independent variable is the workload (X1) and motivation
(X2).
2. The dependent variable (dependent), which is a variable that is described and
is influenced by independent variables. In this study, the dependent variable is
employees’ performance (Y).
3.4 Source of Data
1. Primary data, is data results collected by researchers directly and specifically
to answer research questions. Sources of primary data obtained by distributing
questionnaires to the object of research and filled directly by the respondent.
According Sekaran (2006) primary data is obtained from the information first
hand by researchers associated with the variables studied. In this study, the
data used comes directly from Perum Bulog Divre Lampung.
2. Secondary data, secondary data is data obtained through library research or the
result of the collection of data or information from the literature and references
related to the research topic (Oei, 2010).
30
3.5 Population and Sample
According to Oei (2010) population is defined as the sum total of all members
surveyed, while the sample is a part of the population to be studied. According to
Arikunto (2005) when the subject is less than 100, better taken all of them, so the
research is the study population. Furthermore, if there are more than 100 can be taken
between 10 20 -15% or -25% or more. In this study, will be used employee
population of Perum Bulog Divre Lampung which are 103 people, and all serve as
respondents.
3.6 Data Collection Method
The data collection according to Nazir (2009) is a standard systematic procedure to
obtain the necessary data. There is always a connection between the data collection
methods with research problems to be solved. There are several methods of data
collection study, the following are ways that researchers do to gather the necessary
information to researchers, among which are:
1. Observations
Observations made by looking at the work environment as well as on the pattern
of job satisfaction that is applied to the Regional Division BULOG Lampung.
2. Questionnaire
The questionnaire is an instrument for data collection, in which participants or
respondents filled questions raised by investigators. Researchers can use the
questionnaire to obtain data associated with thoughts, feelings, attitudes, beliefs,
values, perceptions, and behaviours of the respondents. In other words, the
31
researchers were able to use measurements of a variety of characteristics by using
a questionnaire (Sugiyono, 2013).
Measurement of the questionnaire in this study using a Likert scale, where
a score is given to each respondent's answer is:
Answer Strongly Agree (SA) by a score of 5
Answer Agree (A) by a score of 4
Answer Neutral (N) by a score of 3
Answer Disagree (DA) by a score of 2
Answer Strongly Disagree (SDA) were given a score of 1
3.7 Operational Definition and Measurement Variables
The operational definition is a definition that is given to a variable or contract by
giving meaning, or specifying the activity or provide an operational needed to
measure the contract or variable (Nazir, 2009: 126). The following operational
definition and measurement variables are presented in tabular form:
32
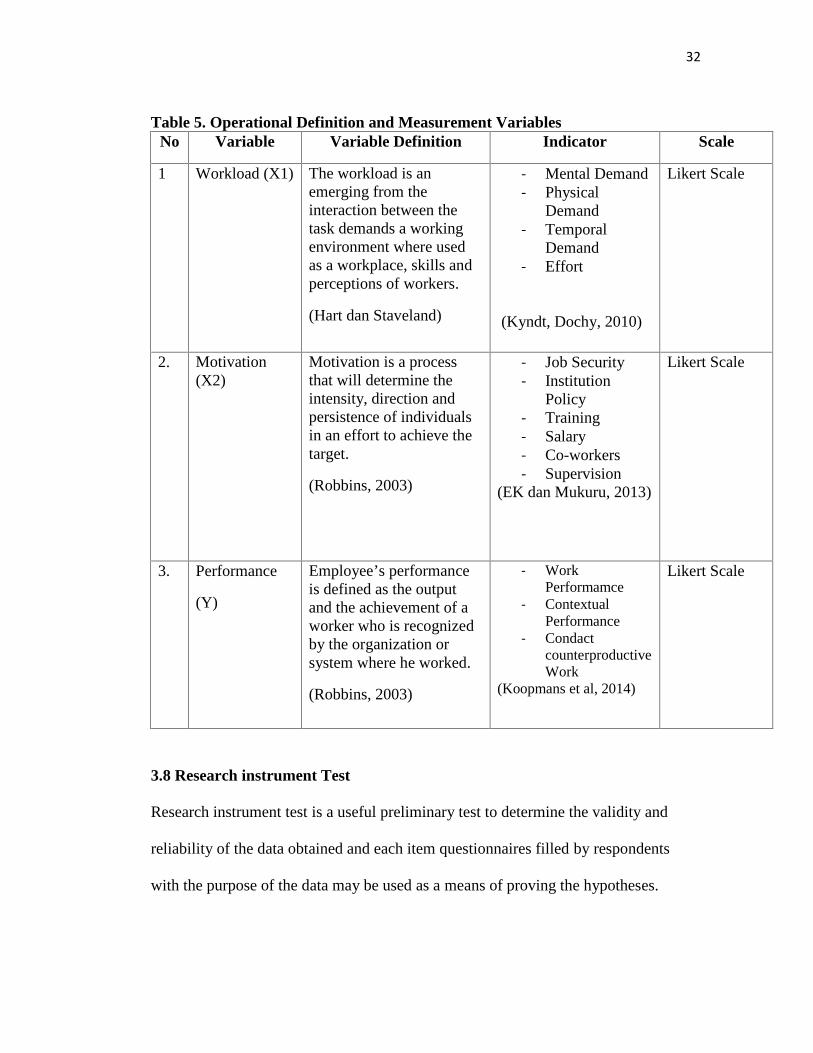
Table 5. Operational Definition and Measurement VariablesNo Variable Variable Definition Indicator Scale
1 Workload (X1) The workload is anemerging from theinteraction between thetask demands a workingenvironment where usedas a workplace, skills andperceptions of workers.
(Hart dan Staveland)
- Mental Demand- Physical
Demand- Temporal
Demand- Effort
(Kyndt, Dochy, 2010)
Likert Scale
2. Motivation(X2)
Motivation is a processthat will determine theintensity, direction andpersistence of individualsin an effort to achieve thetarget.
(Robbins, 2003)
- Job Security- Institution
Policy- Training- Salary- Co-workers- Supervision
(EK dan Mukuru, 2013)
Likert Scale
3. Performance
(Y)
Employee’s performanceis defined as the outputand the achievement of aworker who is recognizedby the organization orsystem where he worked.
(Robbins, 2003)
- WorkPerformamce
- ContextualPerformance
- CondactcounterproductiveWork
(Koopmans et al, 2014)
Likert Scale
3.8 Research instrument Test
Research instrument test is a useful preliminary test to determine the validity and
reliability of the data obtained and each item questionnaires filled by respondents
with the purpose of the data may be used as a means of proving the hypotheses.
33
3.8.1 Validity Test
Validity test is intended to measure how well an instrument measures the concept
which should be measured. Valid instrument means the instrument can be used to
measure what is to be measured accurately and correctly. Results of the study are able
to explain the problem of research in accordance with the actual circumstances or
events when using research instruments that have a high validity.According to
Arikunto (2006) validity is a measure that indicates the levels of validity or validity
of an instrument. Management of data using SPSS for Windows 16.0 and validity test
used in this research is the method of factor analysis. This research tested the
measurement validity of the questionnaire to 103 respondents of employees in Perum
Bulog Divre Lampung.
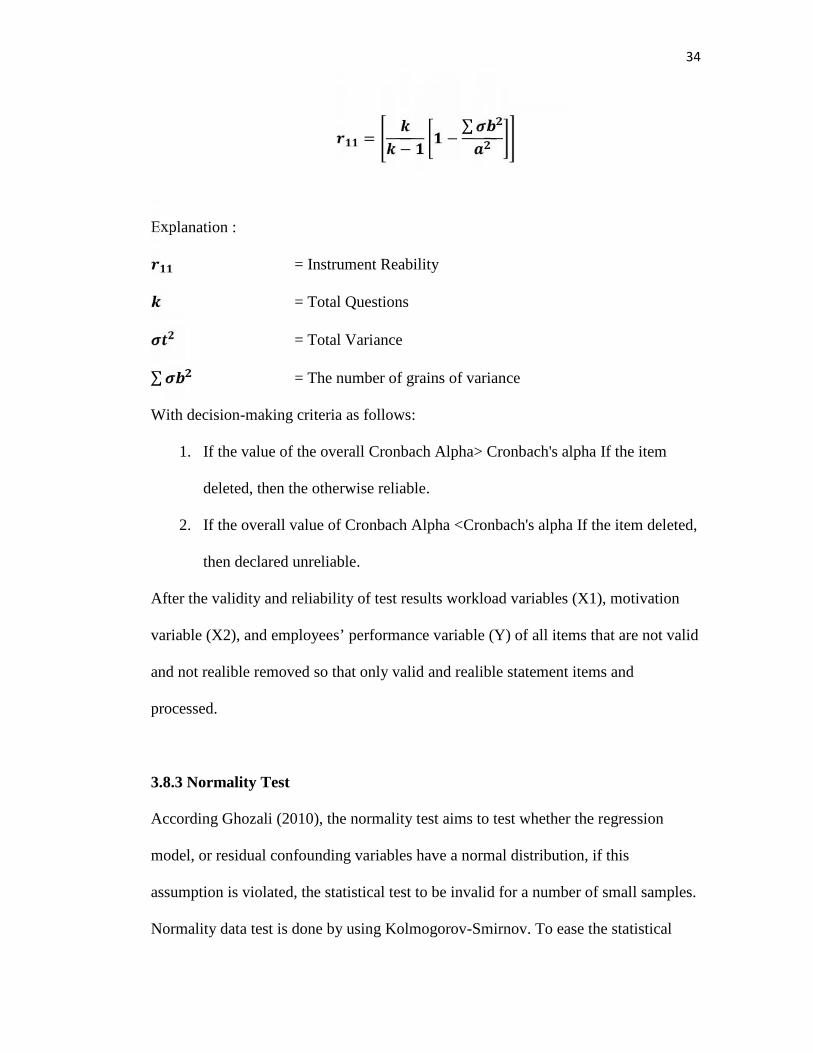
3.8.2 Reliability Test
Instrument reability is the pertinence or accuracy of the measuring instrument.
Reliability test is performed to determine the consistency and accuracy of the
measurement, if the measurement is done at the same object over and over again with
the same instrument. According Arikunto (2006), reability demonstrated at an
understanding that an instrument is trustworthy enough to be used as a means of
collecting data due to the instrument has been good.Measurement of precision level
measurement tool to assess the reliability in this study is using SPSS for Windows
16.0 and reliability test used in this study is to use the formula Alpha Croanbach.
According Arikunto (2006), the formula is as follows:
34
= − − ∑Explanation :
= Instrument Reability
= Total Questions
= Total Variance∑ = The number of grains of variance
With decision-making criteria as follows:
1. If the value of the overall Cronbach Alpha> Cronbach's alpha If the item
deleted, then the otherwise reliable.
2. If the overall value of Cronbach Alpha <Cronbach's alpha If the item deleted,
then declared unreliable.
After the validity and reliability of test results workload variables (X1), motivation
variable (X2), and employees’ performance variable (Y) of all items that are not valid
and not realible removed so that only valid and realible statement items and
processed.
3.8.3 Normality Test
According Ghozali (2010), the normality test aims to test whether the regression
model, or residual confounding variables have a normal distribution, if this
assumption is violated, the statistical test to be invalid for a number of small samples.
Normality data test is done by using Kolmogorov-Smirnov. To ease the statistical
35
calculation, the analysis undertaken in this study will be treated with the help of
statistical software SPSS 16.0 for Windows. "A normal distribution of data declared
if Asymp Sig (2-tailed) Kolmogorov-Smirnov calculation result is greater than 1/2α".
3.9 Description of The Survey Result
Description of the survey result is an analysis done by the survey results are used to
explain or describe the data that has been collected without the intention to make
conclusions apply generally.
3.10 Data Analysis
Analysis of data to determine the alleged influence of workload and motivation
(independent variable) on employees’ performance (dependent variable), use of data
analysis of qualitative and quantitative data analysis:
1. Survey Description
SurveyDescription: analysis of the influence of job characteristics, job satisfaction
on employee commitment, is further described in the form of a sentence
composed in a systematic approach to human resources management theory,
especially the theory of workload, motivation, and employees’ perfromance. In
this study, the data were analyzed qualitatively, by classifying the answers and
classifying the data, and then analyzed to obtain the circumstances as well as the
conclusions on the basis of data obtained.
2. Quantitative Data Analysis
Quantitative data analysis is a mathematical calculation using a specific formula
used to determine the results of the investigation. In this study using a test
36
research instruments that test the validity and reliability, as well as using multiple
linear regression analysis determines the influence of workload and motivation on
employees’ performance in Perum Bulog Divre Lampung, it will be proved by
using regression analysis assisted SPSS for Windows 16.0 using multiple linear
formula.
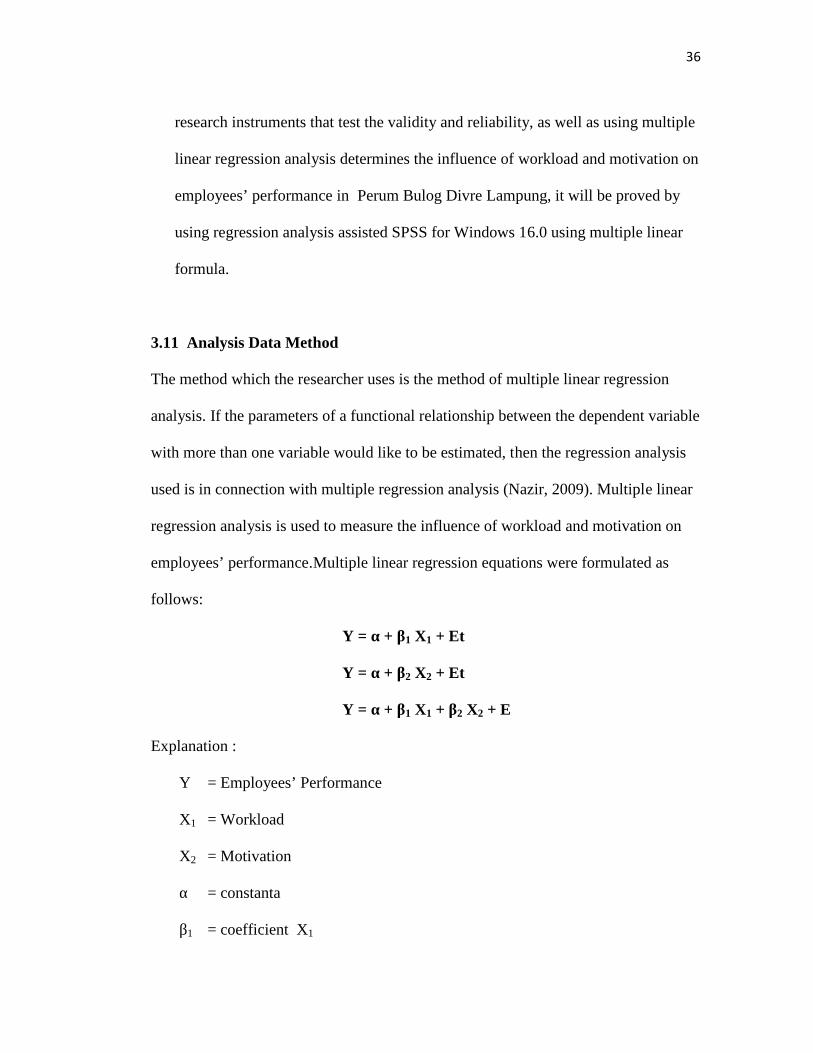
3.11 Analysis Data Method
The method which the researcher uses is the method of multiple linear regression
analysis. If the parameters of a functional relationship between the dependent variable
with more than one variable would like to be estimated, then the regression analysis
used is in connection with multiple regression analysis (Nazir, 2009). Multiple linear
regression analysis is used to measure the influence of workload and motivation on
employees’ performance.Multiple linear regression equations were formulated as
follows:
Y = α + β1 X1 + Et
Y = α + β2 X2 + Et
Y = α + β1 X1 + β2 X2 + E
Explanation :
Y = Employees’ Performance
X1 = Workload
X2 = Motivation
α = constanta
β1 = coefficient X1
37
β2 = coefficion X2
Et = Error term
3.12 Hypotheses Testing
Hypotheses function is to give a statement of allegations about the tentative
relationship between phenomena in research. In general hypotheses can be tested in
two ways, namely match with the facts or by studying the logical consistency (Nazir,
2009). Methods of testing the hypothesis which is proposed, done by partial testing (t
test) and simultaneous testing using the (test F).
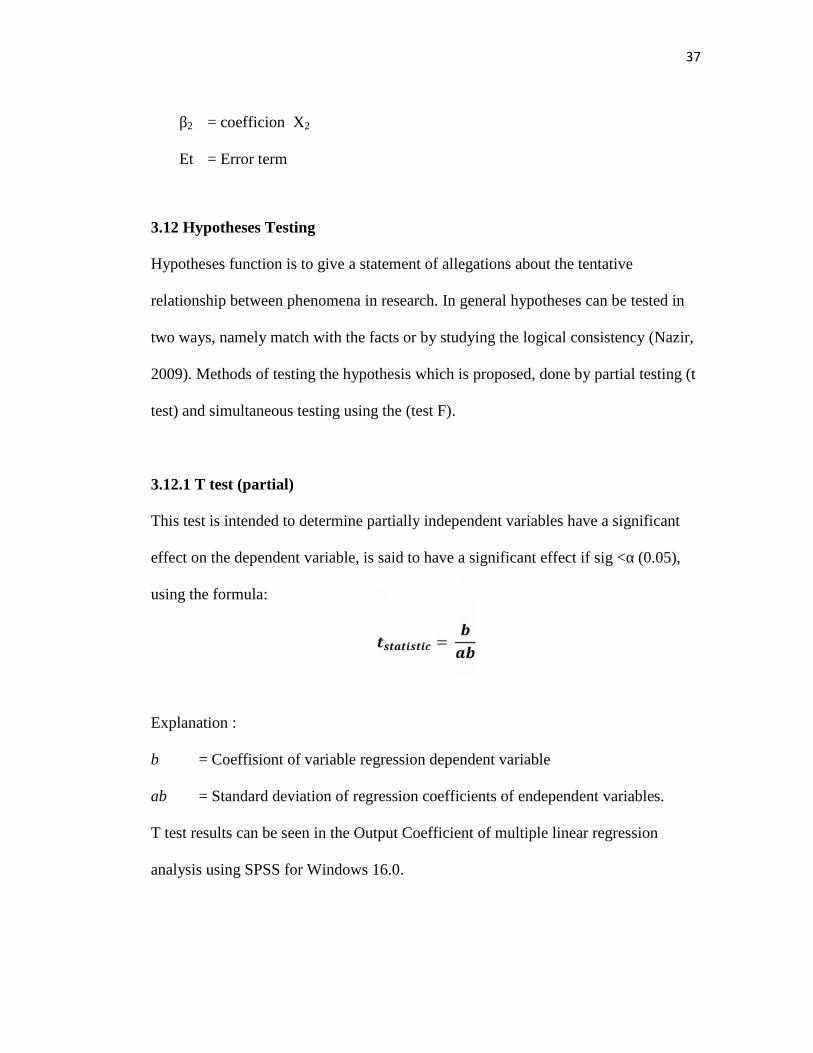
3.12.1 T test (partial)
This test is intended to determine partially independent variables have a significant
effect on the dependent variable, is said to have a significant effect if sig <α (0.05),
using the formula:
=Explanation :
b = Coeffisiont of variable regression dependent variable
ab = Standard deviation of regression coefficients of endependent variables.
T test results can be seen in the Output Coefficient of multiple linear regression
analysis using SPSS for Windows 16.0.
38
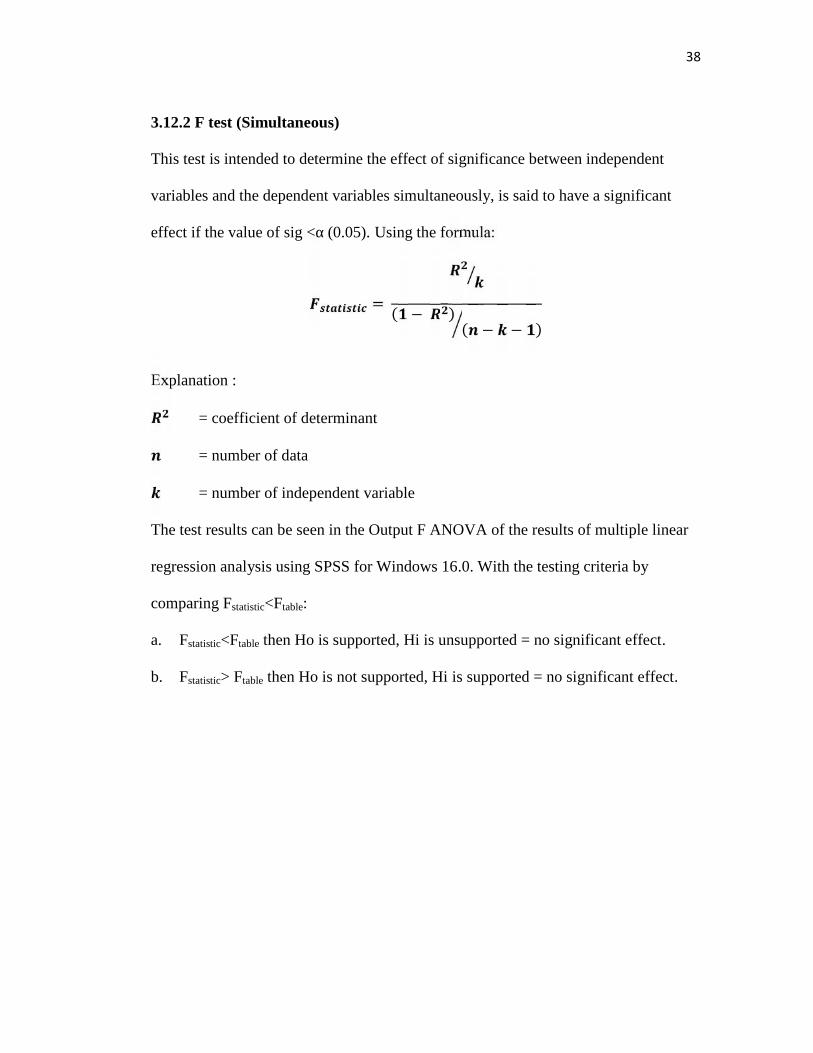
3.12.2 F test (Simultaneous)
This test is intended to determine the effect of significance between independent
variables and the dependent variables simultaneously, is said to have a significant
effect if the value of sig <α (0.05). Using the formula:
= ( − ) ( − − )Explanation :
= coefficient of determinant
= number of data
= number of independent variable
The test results can be seen in the Output F ANOVA of the results of multiple linear
regression analysis using SPSS for Windows 16.0. With the testing criteria by
comparing Fstatistic<Ftable:
a. Fstatistic<Ftable then Ho is supported, Hi is unsupported = no significant effect.
b. Fstatistic> Ftable then Ho is not supported, Hi is supported = no significant effect.
66
V. CONCLUSION, SUGGESTION, AND LIMITATION OF RESEARCH
5.1 Conclusion
The results of research and discussion about the influence of workload and motivaton on
employees’ performance in Perum Bulog Divre Lampung done by researcher, the
conclusion is the research supports the hypotheses and explained as follows:
1. Workload positively significantly influences employees’ performance in Perum
Bulog Divre Lampung .
2. Motivation positively and significantly influences employees’ perdormance in
Perum Bulog Divre Lampung.
3. Workload and motivation simultaneously influence employees’ performance in
Perum Bulog Divre Lampung.
5.2 Suggestion
The conclusion which has been described previously, there are some suggestions given by
researcher are:
1. Perum Bulog Divre Lampung should pay more attention about the workload which
will be given to the employees like time needed to finish the job and mental activities
of each employee so that each individual can get calmness in doing their duties.
2. Perum Bulog Divre Lampung should increas employees’ motivation more by paying
67
more attention on their job security problems especially for the employees who is
working outside, implement diciplinary towards all of the employees, and create a
better environmental work in order to be more feeling comfortable in working as well
as growing friendship among them which can create the feeling of supporting each
other.
3. Perum Bulog Divre Lampung should increase each employee’s knowledge in order to
be more update so they can increase their performance by adding some skills and the
way they seek for solutions, should improve knowledge of each employee in order to
be uptodate so that they can further improve performance by adding their skills and
how they have to find creative solutions in case of problems in their work. Managers
should provide a platform for them to share both problems, new and creative ideas
and knowledge, because most of the employees working in the company are
employees with productive age, this means that they are still able to learn a new way
to add insight they.
5.3 Research Limitation
1. There are limitations to the research by using questionnaires that sometimes the
answers that respondents do not show the real situation.
2. It is hoped that next researcher could use a better refrences of the variable
workload.
3. For further research, the authors suggest to fix things lacking in this research for
the better.
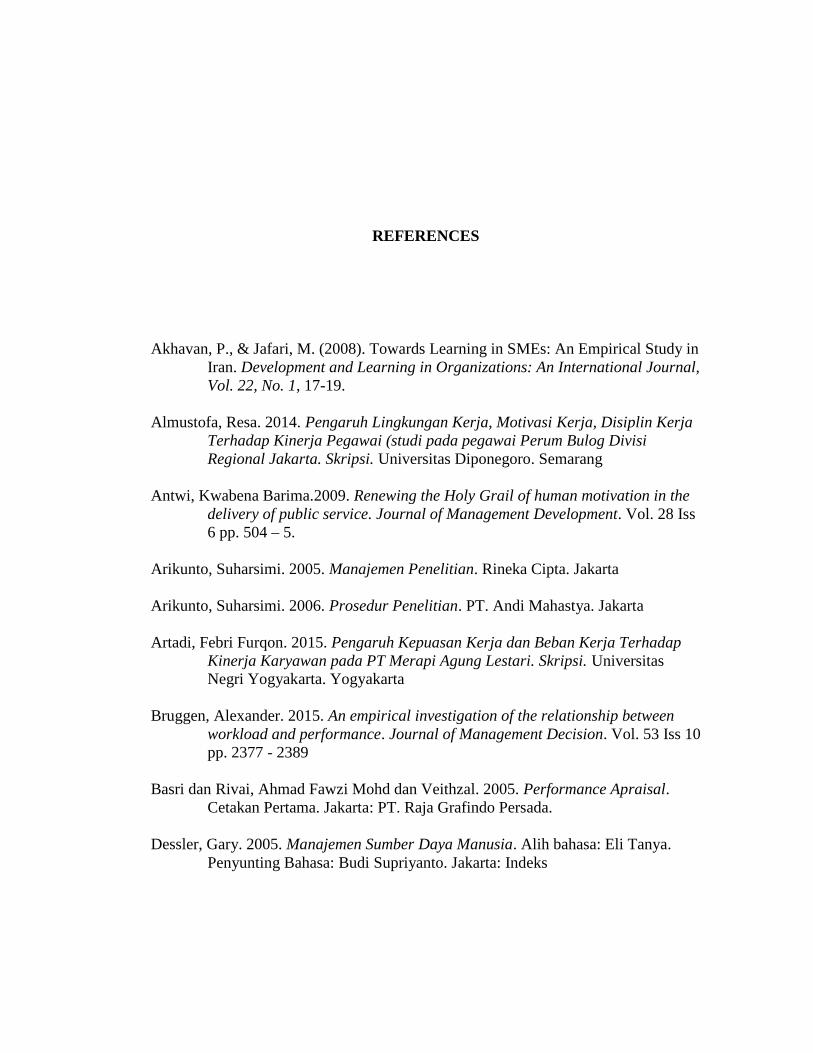
REFERENCES
Akhavan, P., & Jafari, M. (2008). Towards Learning in SMEs: An Empirical Study inIran. Development and Learning in Organizations: An International Journal,Vol. 22, No. 1, 17-19.
Almustofa, Resa. 2014. Pengaruh Lingkungan Kerja, Motivasi Kerja, Disiplin KerjaTerhadap Kinerja Pegawai (studi pada pegawai Perum Bulog DivisiRegional Jakarta. Skripsi. Universitas Diponegoro. Semarang
Antwi, Kwabena Barima.2009. Renewing the Holy Grail of human motivation in thedelivery of public service. Journal of Management Development. Vol. 28 Iss6 pp. 504 – 5.
Arikunto, Suharsimi. 2005. Manajemen Penelitian. Rineka Cipta. Jakarta
Arikunto, Suharsimi. 2006. Prosedur Penelitian. PT. Andi Mahastya. Jakarta
Artadi, Febri Furqon. 2015. Pengaruh Kepuasan Kerja dan Beban Kerja TerhadapKinerja Karyawan pada PT Merapi Agung Lestari. Skripsi. UniversitasNegri Yogyakarta. Yogyakarta
Bruggen, Alexander. 2015. An empirical investigation of the relationship betweenworkload and performance. Journal of Management Decision. Vol. 53 Iss 10pp. 2377 - 2389
Basri dan Rivai, Ahmad Fawzi Mohd dan Veithzal. 2005. Performance Apraisal.Cetakan Pertama. Jakarta: PT. Raja Grafindo Persada.
Dessler, Gary. 2005. Manajemen Sumber Daya Manusia. Alih bahasa: Eli Tanya.Penyunting Bahasa: Budi Supriyanto. Jakarta: Indeks
EK,Kiruja and Mukuru, Elegwa. 2013. Effect of Motivation on EmployeePerformance In Public Middle Level Technical Training Institutions InKenya. Vol.2 | Issue 4|73-82
Fisher, et al. 1993. Human Resource Management, 2nd Edition. Boston: HoughtonMifflin.
Follett, Mary Parker. (1999). Visionary Leadership and Strategic Management. MBCUniversity Press. Women in Management Review Volume 14. Number 7.
Flippo, Edwin B. 2002. Personel Management (Manajemen Personalia), Edisi VIIJilid II, Terjemahan Alponso S, Erlangga, Jakarta.Handoko, T Hani. 2000.Manajemen Personalia dan Sumber Daya Manusia. Yogyakarta: BPFE
Gibson, James L. John M Ivancevich dan James H. Donnelly, Jr. Organizations.2000. Boston: McGraw-Hill Companies, Inc.
Goodman, S. A., & Svyantek, D. J. 1999. Person–organization fit and contextualperformance: Do shared values matter. Journal of Vocational Behavior,55:254-275.
Guay, F. Marsh FH. &, Boivin, M. 2003. Academic Self -Concept and AcademicAchievement: Developmental Perspectives on Their Causal OrderingJournal of Educational Psychology Copyright. The American PsychologicalAssociation, Inc. 2003, Vol. 95, No. 1
Handoko, T. Hani. 2002. Manajemen Personalia Dan Sumber Daya Manusia.Yogyakarta: BPFE
Hariandja, Marihot T.E, 2002. Manajemen Sumber Daya Manusia. Jakarta: Grasindo.
Haryono. 2004. Manajemen Sumber Daya Manusia Lanjutan, Jakarta.
Hasibuan, 2010. Manajemen Sumber Daya Manusia. Jakarta: Bumi Aksara.
Irwandy. 2007, Faktor-Faktor yang Berhubungan dengan BebanKerja,:http//www.liwandy.kapali.wordpress.com//.
Koopmans, Linda. 2014. Measuring Individual Work Performance.
Kyndt, eva and Dochy, Filip. 2010. The perception of workload and task complexityand its influence on students’ approaches to learning: a study in highereducation. DOI 10.1007/s10212-010-0053-2
Mathis, Robert L., and John H. Jackson. 2003. Human Resource Management. TenthEdition. Ohio: South-Western.
Mondy, R. Wayne, and Robert M. Noe. 2005. Human Resource Management. NinthEdition. USA: Prentice Hall.
Mudayana, Ahmad Ahid. 2011. Pengaruh Motivasi dan Beban Kerja Terhadao KinerjaKaryawan di Rumah Sakit NUR HIDAYAH BANTU. Skripsi. Universitas AhmadDahlan, Yogyakarta.
Mullins, Laurier J. 2005. Management and Organizational Bahavior. Prentice Hall:Edinburg Gate Harlow
Munandar, M. 2001. Budgeting, Perencanaan Kerja Pengkoodinasian KerjaPengawasan Kerja. Edisi Pertama. BPFE Universitas Gajah Mada.Yogyakarta.
Nazir, Moh. (2009). Metode Penelitian. Jakarta: Ghalia Indonesia.
Nitisemito, Alex. S. 1984. Pembelajaran Perusahaan. Jakarta: Ghalia Indonesia.
Ranupandojo, Drs. Heidjarachman.1984. Manajemen Personalia, Edisi Ketiga.Yogyakarta:BPFE.
Robbins, Stephen P. 1996. Perilaku Organisasi, Konsep, Kontroversi danAplikasi.Alih Bahasa : Hadyana Pujaatmaka. Edisi Keenam. Jakarta: Penerbit PT.Bhuana Ilmu Populer.
Robbins, Stephen P, 2003. Perilaku Organisasi. Jilid 2, PT. Indeks KelompokGramedia.Jakarta
Ruky, Achmad. S. 2003. Sistem Manajemen Kinerja. Jakarta: Gramedia .
Sedarmayanti. 2007. Sumber Daya Manusia dan Produktivitas Kerja. Bandung:Mandar Maju
Sekaran, Uma. 2006, Metodologi Penelitian untuk Bisnis, Edisi 4, Buku 1, Jakarta:Salemba Empat.
Shah, Syed Saad Hussain. 2011. Workload and Performance of Employees.Interdiciplinary Journal of Contemporary Research In Business. Vol 3, No.5.
Sugiyono. 2013. Metode Penelitian Kuantitatif Kualitatif dan R & D. Bandung:Alfabeta.
Sutarto, 2006, Dasar-dasar Organisasi, Gajah Mada University Press. Yogyakarta
Sutermeister. R.A. 1999. People and Productivity. Toronto Inc, Mc. Graw Hill Book.
Sutrisno Hadi. 2001. Metodologi Research untuk Penulisan Paper, Skripsi, Thesis danDisertasi, Jilid Tiga. Yogyakarta : ANDI.
Wibowo. 2010. Manajemen Kinerja. Edisi Ketiga. Penerbit Rajawali Pers, Jakarta.
Widodo, Suparni Eko. 2015. Manajemen Pengembangan Sumber DayaManusia.Yogyakarta: Pustaka Pelajar. Cetakan I
Winardi. J. 2000. Motivasi dan Pemotivasian dalam Manajemen. Yakarta: PT.RajaGrafindo Persada,
Wursanto, Drs. Ig. Dasar-dasar Ilmu Organisasi. Yogyakarta: ANDI.
Yaslis, Ilyas. 2002. Kinerja. Teori, Penilaian dan penelitian. Pusat Kajian EkonomiKesehatan FKM Universitas Indonesia, Jakarta.
Universitas Lampung. 2012. Format Penulisan Karya Ilmiah Universitas Lampung.Bandarlampung : Universitas Lampung.
Recommended