FACTORS POSITIVELY AFFECTING PURCHASE INTENTION OF
AUTOMOBILE CONSUMERS AT THAILAND INTERNATIONAL MOTOR
EXPO 2015 IN BANGKOK
FACTORS POSITIVELY AFFECTING PURCHASE INTENTION OF
AUTOMOBILE CONSUMERS AT THAILAND INTERNATIONAL MOTOR
EXPO 2015 IN BANGKOK
Chiratt Chaisamran
This independent Study Manuscript Presented to
The Graduated School of Bangkok University
in Partial Fulfillment
of the Requirements for the Degree
Master of Business Administration
2016

©2016
Chiratt Chaisamran
All Rights Reserved
Chaisamran, C. M.B.A., April 2016, Graduate School, Bangkok University.
Factors Positively Affecting Purchase Intention of Automobile Consumers at
Thailand International Motor Expo 2015 in Bangkok (138 pp.)
Advisor: Penjira Kanthawongs. Ph.D.
ABSTRACT
The researcher studied the positive influence of car attributes, emotional
connection, accessibility, external Influence, brand-loving tendency, support
environmental protection, drive for environmental responsibility, and vivacity towards
purchase intention of automobile consumers at Thailand International Motor Expo
2015 in Bangkok. The 258 usable survey questionnaires were received from the
attendants of Thailand International Motor Expo 2015 at IMPACT Muang Thong
Thani Convention Centre between 5 December to 13 December in 2015. The data was
analyzed using Multiple Regression Analysis found that vivacity (β = 0.361) and
accessibility (β = 0.141) were positively affected purchase intention of the potential
automobile consumers in the Expo at .05 level of significant, explaining 57% of the
influence towards purchase intention of the consumers. However, car attribute,
emotional connection, brand-loving tendency, supporting environmental protection,
and drive for environmental responsibility were not found to be significantly affected
purchase intention of working people in Bangkok.
Keywords: Purchase Intentions, Automobile, Vivacity, Accessibility
v
ACKNOWLEDGEMENT
First of all, I would like to sincerely express my gratitude to my advisor, Dr.
Penjira Kanthawongs, for continuous support this research as parts of my study for
her patience, review, and suggestion. This study from my own selected topic had been
done under the assistance and guidance from my advisor. Besides my advisor, I also
would like to thank all professors of MBA International Program for knowledge and
encouragement.
I sincerely thank Mr. Nontapant Chongthong, Toyota Mahanakorn Manager,
and Mr. Aekkarak Khongkay, Siam Nissan Bangkok HR Manager, who delicated
their valuable times to reviewing and correcting the questionnaire.
I thank you for all participants who delicate their valuable time to answering
and completing the questionnaire. This independent study would not have been
possible unless many participants and many individuals who has provided assistance
in all ways.
Thank for the classmates and friends to accompany in my side in the last two
years, and thank for the useful suggestions and opinions which they proposed, and
thank all people particularly MBA international program colleagues who helped me to
pass the troubled situations and for all the fun we have had in the last two years. Last
but not least, I would like to dedicate this document to my family, thank for my
parents’ support.
Chiratt Chaisamran
TABLE OF CONTENTS
Page
ABSTRACT..................................................................................................................iv
ACKNOWLEDGEMENT..............................................................................................v
LIST OF TABLES........................................................................................................xi
LIST OF FIGURES.......................................................................................................ix
CHAPTER 1: INTRODUCTION..................................................................................1
1.1 Background..................................................................................................1
1.2 SWOT Analysis............................................................................................7
1.3 Statement of Problem...................................................................................9
1.4 Objectives of Research ................................................................................9
1.5 Scope of Research......................................................................................10
1.6 Research Question......................................................................................10
1.7 Significance of Research............................................................................11
1.8 Limitation of Research...............................................................................11
1.9 Definition of Terms....................................................................................12
CHAPTER 2: LITERATURE REVIEW.....................................................................14
2.1 Concept theories of Car Attribute..............................................................15
2.2 Concept theories of Emotional Connection................................................16
2.3 Concept theories of Accessibility...............................................................17
2.4 Concept theories of External Influence......................................................18
2.5 Concept theories of Brand-Loving Tendency............................................19
2.6 Concept theories of Supporting Environmental Protection........................22
2.7 Concept theories of Drive for Environmental Responsibility....................23
vii
TABLE OF CONTENTS (Continued)
Page
CHAPTER 2: LITERATURE REVIEW (Continued)
2.8 Concept theories of Vivacity......................................................................24
2.9 Concept theories of Behavioral Intention...................................................25
2.10 Related document and previous research.................................................29
2.11 Hypothesis................................................................................................34
2.12 Variable used in research.........................................................................35
2.13 Theoretical Framework............................................................................36
CHAPTER 3: METHODOLOGY................................................................................37
3.1 Research Design.........................................................................................37
3.2 Population and Sample Selection...............................................................38
3.3 Research Instrument...................................................................................39
3.4 Testing Research Instrument......................................................................42
3.5 Data Collection...........................................................................................49
3.6 Preparation and Data Analysis...................................................................49
3.7 Statistic Method..........................................................................................51
CHAPTER 4: FINDING..............................................................................................55
4.1 Demographic data.......................................................................................55
4.2 Mean, Standard Deviation and Respondents perception............................62
4.3 Analysis of the data base on assumption....................................................72
4.4 Other Analysis............................................................................................80
viii
TABLE OF CONTENTS (Continued)
Page
CHAPTER 5: CONCLUSIONS AND RECOMMENDATIONS...............................82
5.1 Hypothesis Assumption..............................................................................82
5.2 Summary....................................................................................................84
5.3 Suggestion .................................................................................................89
5.4 Recommendation........................................................................................90
BIBLIOGRAPHY........................................................................................................93
APPENDICES............................................................................................................102
APPENDIX A................................................................................................103
APPENDIX B.................................................................................................112
APPENDIX C.................................................................................................121
BIODATA..................................................................................................................137
LICENSE AGREEMENT..........................................................................................138
ix
LIST OF TABLES
Page
Table 1.1: Statistic of Number of Vehicle Registered in Thailand................................2
Table 1.2: Thailand Domestic Sales Volume : November 2015...................................4
Table 1.3: Top 3 Vehicle Sale by Segment During January - December 2015.............5
Table 1.4: Toyota, Ford, Honda SWOT Analysis..........................................................7
Table 2.1: Eight kinds of consumer-object relations....................................................20
Table 3.1: Factor Analysis of factor positively affect automobile purchase intention
of working people in Bangkok....................................................................44
Table 3.2: ANOVA Analysis.......................................................................................53
Table 4.1: Gender of respondents.................................................................................56
Table 4.2: Age of respondents......................................................................................56
Table 4.3: Marital status of respondents......................................................................57
Table 4.4: Educational level of respondents................................................................57
Table 4.5: Monthly salary of respondents....................................................................58
Table 4.6: Occupation of respondents..........................................................................58
Table 4.7: Number of vehicle own of respondents......................................................59
Table 4.8: Interested vehicle segment of respondents..................................................60
Table 4.9: Vehicle buying intention period of respondents.........................................60
Table 4.10: Buying decision influence of respondents................................................61
Table 4.11: Buying objective of respondents...............................................................62
Table 4.12: Mean, Standard Deviation and Perception of Car Attribute.....................62
Table 4.13: Mean, Standard Deviation and Perception of Emotional Connection......63
Table 4.14: Mean, Standard Deviation and Perception of Accessibility......................64
x
LIST OF TABLES (Continued)
Page
Table 4.15: Mean, Standard Deviation and Perception of External Influence.............65
Table 4.16: Mean, Standard Deviation and Perception of Brand-Loving Tendency...66
Table 4.17: Mean, Standard Deviation and Perception of Supporting Environmental
Protection...................................................................................................67
Table 4.18: Mean, Standard Deviation and Perception of Drive for Environmental
Responsibility............................................................................................69
Table 4.19: Mean, Standard Deviation and Perception of Vivacity.............................70
Table 4.20: Mean, Standard Deviation and Perception of Behavioral Intention.........71
Table 4.21: Pearson's Correlation Coefficient Analysis...............................................73
Table 4.22: ANOVA Analysis.....................................................................................76
Table 4.23: Multiple Regression Analysis...................................................................77
Table 4.24: Testing Collinearity of independent variable............................................80
xi
LIST OF FIGURES
Page
Figure 2.1: Theory of reasoned action........................................................................26
Figure 2.2: Theory of planned behavior......................................................................27
Figure 2.3: Consumer buying decision process...........................................................28
Figure 2.4: Theoretical framework for purchase intention..........................................36
Figure 4.1: Result of Multiple Regression Analysis from scope of research...............81
CHAPTER 1
INTRODUCTION
This chapter presents background of the research, objectives of the research,
scope of the research, problem statement, research questions, significance of the
research, definition of terms, and limitation of research.
1.1 Background
Nowadays, selecting suitable transportation modes can help to manage time.
There are many ways to travel around Bangkok. According to the traffic in Bangkok,
BTS Skytrain and MRT subway maybe the most efficient way to reach the
destination. Travel by road in Bangkok rush hour may not be a smart choice unless
there are no other transportations. However, it is the other way to move from point A
to B with more convenience.
Each person has a different reason to purchase a vehicle. Some people have to
purchase due to their living area. Most of people in urban areas do not have many
transportation choices. Some of them transport by buses, but some travel by driving
their own cars. Then, families with children would take longer times to travel from
their homes in urban areas into downtown areas of the cities. Next is a family with
children. Parents would take their children to school even if the schools are located far
away. So, families with children would take longer times to travel from their homes in
urban areas into downtown areas of the cities. Moreover, Thai people often drive their
own cars for their vacations or visits their ancestors in their hometowns.
2
According to Thailand Board of Investment (BOI), the automobile industry
has been the important key industry in Thailand, accounting for about 12% of the
country’s gross domestic product (GDP) (Thailand Board of Investment (BOI), 2015).
In 2015, Thai automotive production capacity was at 2.85 million vehicles and the
Industry employed more than 550,000 people in 2012 (Bangkokbiznews.com, 2015;
Thailand Board of Investment (BOI), 2015). Then, the total number of vehicles under
the motor vehicle act in Bangkok from 31 December 2014 to 2015 were increased
from 8,476,590 units to 8,840,195 units, accounting for the increase of 4.29%
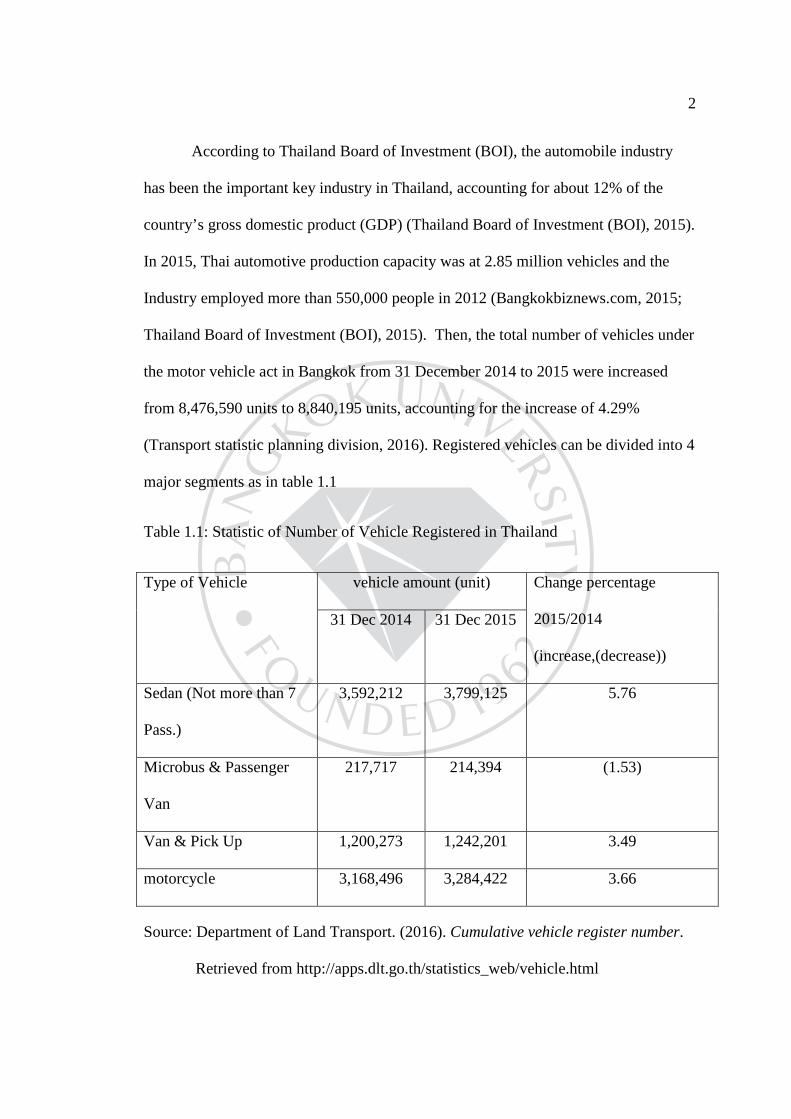
(Transport statistic planning division, 2016). Registered vehicles can be divided into 4
major segments as in table 1.1
Table 1.1: Statistic of Number of Vehicle Registered in Thailand
Type of Vehicle vehicle amount (unit) Change percentage
2015/2014
(increase,(decrease))
31 Dec 2014 31 Dec 2015
Sedan (Not more than 7
Pass.)
3,592,212 3,799,125 5.76
Microbus & Passenger
Van
217,717 214,394 (1.53)
Van & Pick Up 1,200,273 1,242,201 3.49
motorcycle 3,168,496 3,284,422 3.66
Source: Department of Land Transport. (2016). Cumulative vehicle register number.
Retrieved from http://apps.dlt.go.th/statistics_web/vehicle.html
3
Thai government coordinated with the private sector have generated the vision
development towards the Development of Thailand Automotive Industry in year 2021
together, determining Thailand to be a global green automotive production base with
strong domestic supply chains which create high value added for the country
(thaiauto.or.th, 2012). The new excise tax to reduce the carbon dioxide emission
starting 1 January 2016 should be positive for the Thai automotive industry. In the
past when the Thai government succeeded in formulating the tax policies push
forward eco-car development projects. As a result, eco-car projects have been product
champions for Thailand to attract foreign automobile producers to produce hybrid
cars to decrease the use of energies and toxic emission, while increase product safety
by automobile producers. With support of the Thai government, many regulations
have been implemented to reduce the cost of domestic automobiles produced and sold
in Thailand. The regulations included the development of eco-car phase one and two,
the use of ethanol fuels, and the reduction of carbon dioxide emission policies. As the
result, automobile industry in Thailand is growing year after years (Motorexpo.co.th,
2015).
Domestic sales volumes of top selling 7 brands in Thailand have been Toyota,
Isuzu, Honda, Mitsubishi, Ford, Mazda, and Suzuki (Headlightmag.com, 2016). For
example, Toyota Motor Company Limited forecasts for producing around 1.5 million
cars in 2016 (Bangkokbiznews.com, 2015). The establishment of the ASEAN
Economic Community (AEC) in 2015 has extended the regional economic
integration, offering opportunities in the form of a huge market of US$2.6 trillion and
over 622 million people. In 2014, AEC was collectively the third largest economy in
Asia and the seventh largest in the world (Asean.org, 2016). Then, Toyota has been
4
interested to enter automobile markets of countries along the Mekong River, including
Lao, Vietnam, Cambodia, and Myanmar. Nissan Motor Company Limited decided to
invest more than 10,000 million baht building 2 factories in Thailand in order to be
the center of producing and exporting to neighboring countries (Bangkokbiz
news.com, 2015). Mazda Sales (Thailand) Company Limited pointed out 3 major
trends, high-performance hybrid cars, the use of clean diesel technology, and electric
cars (Bangkokbiznews.com, 2015).
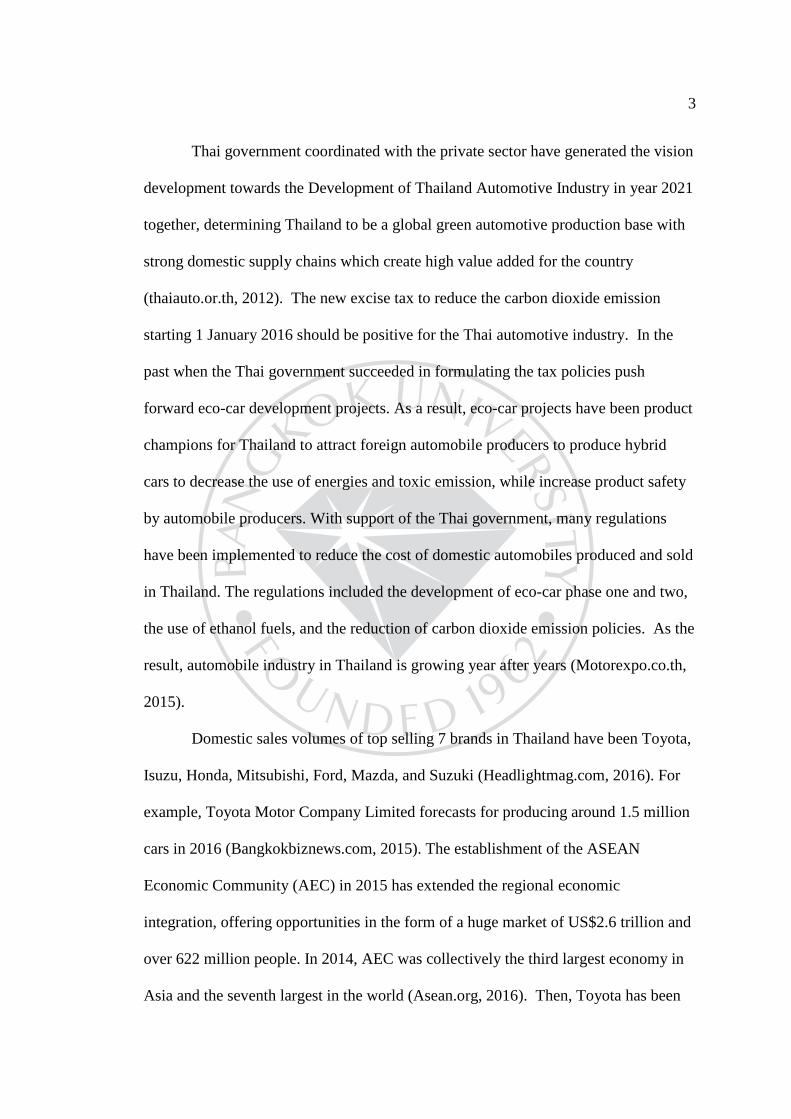
As consumer perception change over time, it has an impact on purchase
vehicles as well. With more variety of products, brands, and feedbacks from users,
consumers have enough information to match the vehicles with their lifestyles.
Table 1.2:Thailand Domestic Sales Volume: November 2015
Rank Brand Nov '15 Oct '15 %
change
Nov '14 % change Jan '15 -
Nov '15
1 Toyota 24,578 23,043 +6.6% 28,965 -15.1% 237,127
2 Isuzu 11,586 10,727 +8.0% 12,045 -3.8% 124,292
3 Honda 10,288 9,699 +6.0% 9,605 +7.1% 99,635
4 Mitsubishi 8,731 6,341 +37.6% 5,221 +67.2% 50,018
5 Nissan 4,899 4,259 +15.0% 4,762 +2.9% 44,851
6 Ford 4,500 3,457 +30.1% 2,905 +54.9% 33,838
7 Mazda 4,197 3,280 +27.9% 2,525 +66.2% 31,233
8 Suzuki 1,562 1,341 +16.4% 1,040 +50.2% 18,711
9 Chevrolet 1,399 1,713 -18.3% 2,003 -30.2% 15,152
(Continued)
5
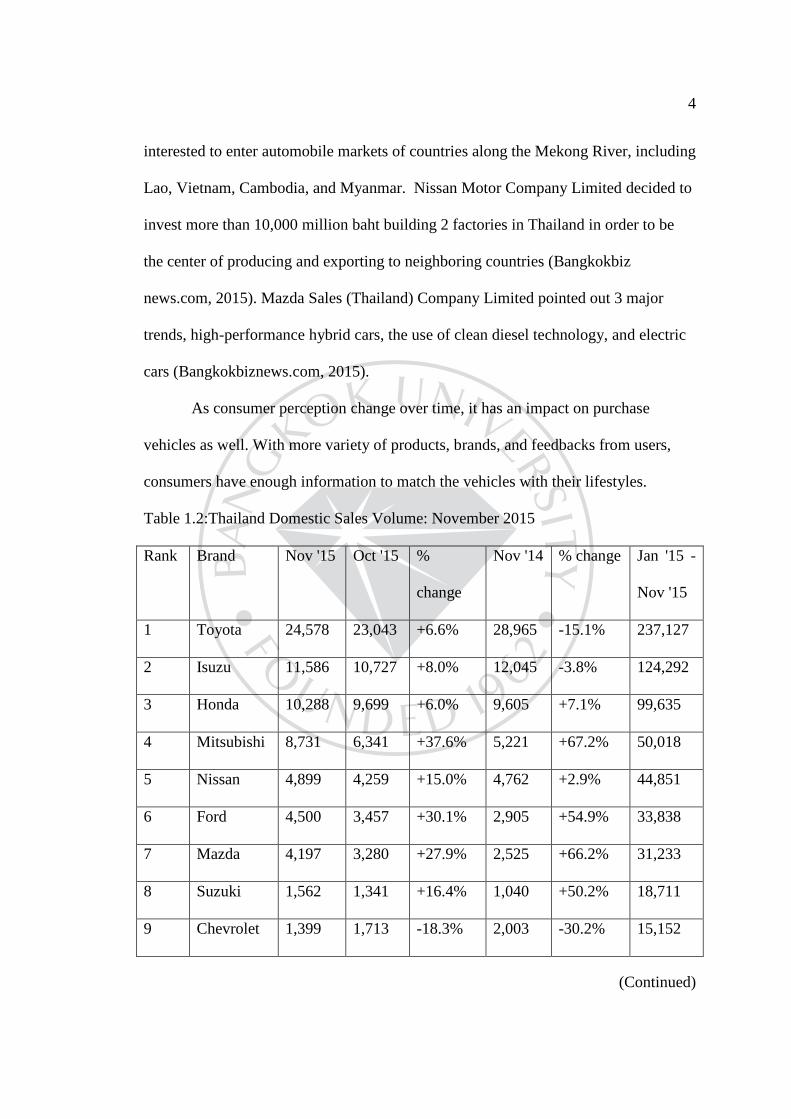
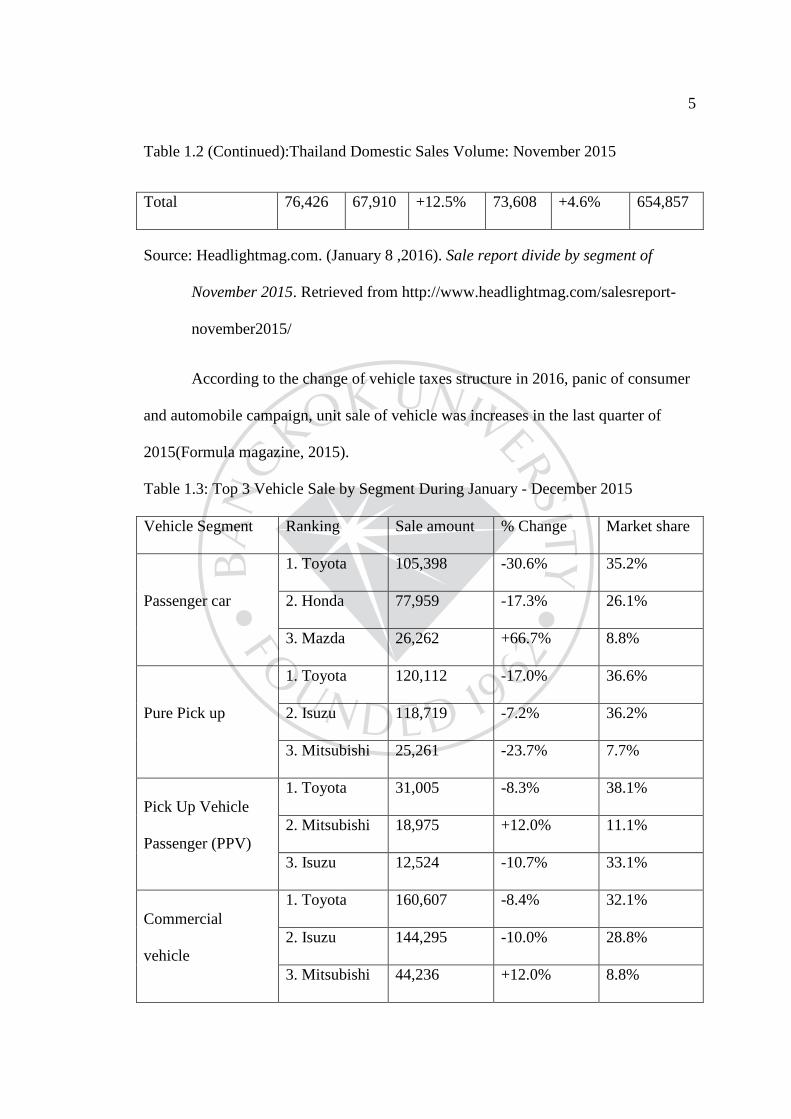
Table 1.2 (Continued):Thailand Domestic Sales Volume: November 2015
Total 76,426 67,910 +12.5% 73,608 +4.6% 654,857
Source: Headlightmag.com. (January 8 ,2016). Sale report divide by segment of
November 2015. Retrieved from http://www.headlightmag.com/salesreport-
november2015/
According to the change of vehicle taxes structure in 2016, panic of consumer
and automobile campaign, unit sale of vehicle was increases in the last quarter of
2015(Formula magazine, 2015).
Table 1.3: Top 3 Vehicle Sale by Segment During January - December 2015
Vehicle Segment Ranking Sale amount % Change Market share
Passenger car
1. Toyota 105,398 -30.6% 35.2%
2. Honda 77,959 -17.3% 26.1%
3. Mazda 26,262 +66.7% 8.8%
Pure Pick up
1. Toyota 120,112 -17.0% 36.6%
2. Isuzu 118,719 -7.2% 36.2%
3. Mitsubishi 25,261 -23.7% 7.7%
Pick Up Vehicle
Passenger (PPV)
1. Toyota 31,005 -8.3% 38.1%
2. Mitsubishi 18,975 +12.0% 11.1%
3. Isuzu 12,524 -10.7% 33.1%
Commercial
vehicle
1. Toyota 160,607 -8.4% 32.1%
2. Isuzu 144,295 -10.0% 28.8%
3. Mitsubishi 44,236 +12.0% 8.8%
6
Source: Thairath. (January 25 ,2016). Total car sales in December 2015. Retrieved
from http://www.thairath.co.th/content/566539 2016
Moreover, Thailand International Motor Expo 2015 was the 32nd of the motor
expo organized in Thailand with the concept of “new standard automobile care for
earth.” The expo was claimed to include 39,125 cars booked, 5,749 motorcycles
booked, 1.5 million visitors, and more than 50,000 billion money circulations
(Motorexpo.co.th, 2016).
Narteh, Odoom, Braimah, and Buame (2012) conducted research on 1,020
vehicle owners in Ghana about key drivers of automobile brand choices and found
that consumers are looking for style, design, comfort, and safety vehicle. Moreover,
Kumar and Ghodeswar (2015) studied purchase intention of green products and found
that Indian consumers opened to green products and would willing to purchase them.
Meanwhile, they prefer products from green company than polluted one. Furthermore,
Toldos-Tomero and Orozco-Gómez (2015) discovered that vivacity was the most
powerful predictor on purchase intention. Teenagers were more concerned about
brand vivacity than professional looks.
7
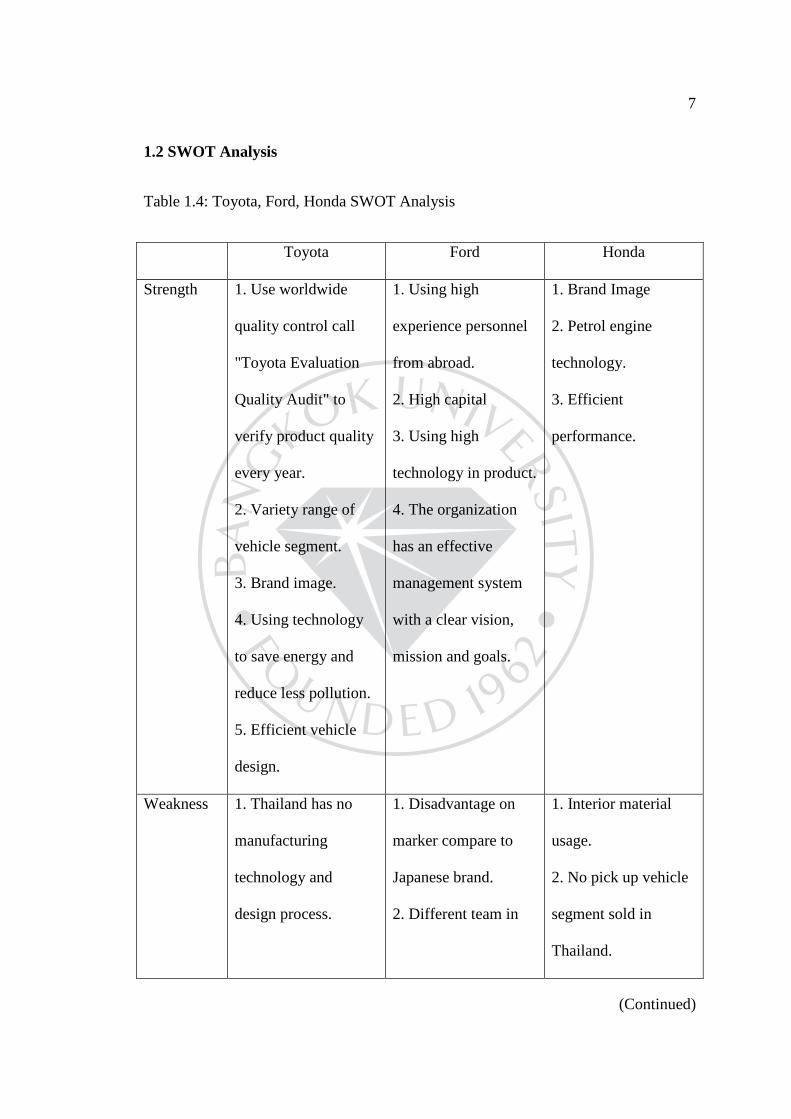
1.2 SWOT Analysis
Table 1.4: Toyota, Ford, Honda SWOT Analysis
Toyota Ford Honda
Strength 1. Use worldwide
quality control call
"Toyota Evaluation
Quality Audit" to
verify product quality
every year.
2. Variety range of
vehicle segment.
3. Brand image.
4. Using technology
to save energy and
reduce less pollution.
5. Efficient vehicle
design.
1. Using high
experience personnel
from abroad.
2. High capital
3. Using high
technology in product.
4. The organization
has an effective
management system
with a clear vision,
mission and goals.
1. Brand Image
2. Petrol engine
technology.
3. Efficient
performance.
Weakness 1. Thailand has no
manufacturing
technology and
design process.
1. Disadvantage on
marker compare to
Japanese brand.
2. Different team in
1. Interior material
usage.
2. No pick up vehicle
segment sold in
Thailand.
(Continued)
8
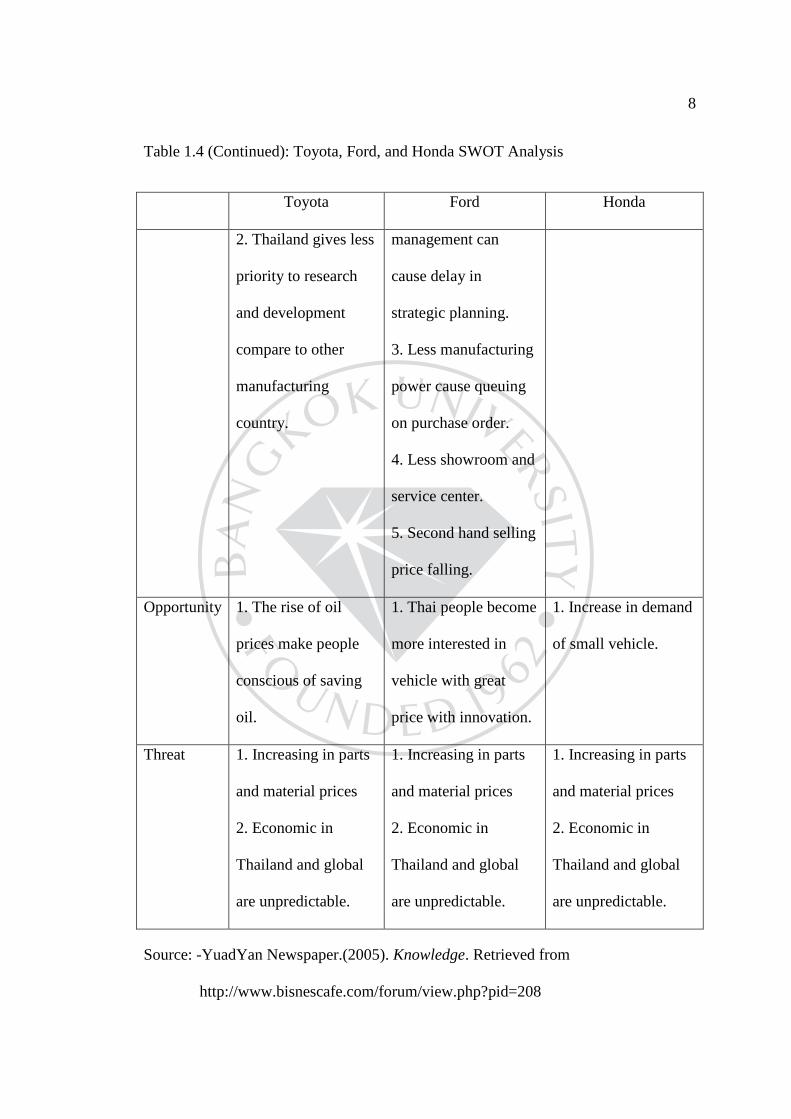
Table 1.4 (Continued): Toyota, Ford, and Honda SWOT Analysis
Toyota Ford Honda
2. Thailand gives less
priority to research
and development
compare to other
manufacturing
country.
management can
cause delay in
strategic planning.
3. Less manufacturing
power cause queuing
on purchase order.
4. Less showroom and
service center.
5. Second hand selling
price falling.
Opportunity 1. The rise of oil
prices make people
conscious of saving
oil.
1. Thai people become
more interested in
vehicle with great
price with innovation.
1. Increase in demand
of small vehicle.
Threat 1. Increasing in parts
and material prices
2. Economic in
Thailand and global
are unpredictable.
1. Increasing in parts
and material prices
2. Economic in
Thailand and global
are unpredictable.
1. Increasing in parts
and material prices
2. Economic in
Thailand and global
are unpredictable.
Source: -YuadYan Newspaper.(2005). Knowledge. Retrieved from
http://www.bisnescafe.com/forum/view.php?pid=208
9
- Toyota Motor Thailand (2011).Toyota Motor Thailand case study.
Retrieved from http://www.bisnescafe.com/forum/view.php?pid=208
- Ford Thailand (2011) .Publications news. Retrieved from
http://www.ford.co.th/about/newsroom
1.3 Statement of Problem
Since the consumers change their behaviors, change of government
regulations on automobile taxes, automotive technology advancements, and more
variety of vehicles with wider price ranges. As the results, every car manufacturer
compete with each other to provide the best option for consumers. However, each
consumer has different intention to purchase vehicles, which is worth researching.
1.4 Objective of Research
The objective of this research was to study positive influence of factors
affecting purchase intention of visitors at Thailand International Motor Expo 2015 in
Bangkok. These positive factors were car attributes, emotional connection,
accessibility, external Influence, brand-loving tendency, support environmental
protection, drive for environmental responsibility and vivacity towards purchase
intention of the visitors at Thailand International Motor Expo 2015 in Bangkok.
10
1.5 Scope of Research
1.5.1 Study on the following independent factors that positively affect
purchase intention.
1.5.1.1 Car Attributes
1.5.1.2 Emotional Connection
1.5.1.3 Accessibility
1.5.1.4 External Influence
1.5.1.5 Brand-Loving Tendency
1.5.1.6 Supporting Environmental Protection
1.5.1.7 Drive for Environmental Responsibility
1.5.1.8 Vivacity
1.5.2 The data collected by using survey questionnaires from the working
people who attend the Thailand International Motor Expo 2015 at Impact Challenger,
Bangkok, during 5 December 2015 to 13 December 2015 with the sample size of 258.
1.6 Research Question
1.6.1 Do car attributes, emotional connection, accessibility, external influence,
brand-loving tendency, supporting environmental protection, drive for environmental
responsibility, and vivacity have relationships with consumer purchase intention?
11
1.6.2 Do car attributes, emotional connection, accessibility, external influence,
brand-loving tendency, supporting environmental protection, drive for environmental
responsibility, and vivacity affect consumer purchase intention?
1.7 Significant of Research
1.7.1 The results of this research can be used in automobile marketing plan to
launch the promotion or advertisement that related to the research factors.
1.7.2 To provide the information on factors affecting consumer purchase
intention.
1.7.3 This research will expand the information on how car attributes,
emotional connection, accessibility, external influence, brand-loving tendency,
supporting environmental protection, drive for environmental responsibility, and
vivacity affecting consumer purchase intention. This will benefit researchers in the
future.
1.8 Limitations of Research
First, the data collection had been done in only one event which was at
“Thailand International Motor Expo 2015 at IMPACT Muang Thong Thani
Convention Centre between 5 to 13 December in 2015,” then the results may not be
able to generalized to all Motor Expos in the past or the future or in other areas.
Moreover, this research was the preliminary one. Therefore, only independent and
dependent variables were considered, mediating or mediator variables may not be
taken into the account.
12
1.9 Definition of terms
1.9.1 ASEAN Economic Community (AEC) is the realization of the region’s
end goal of economic integration. It envisions ASEAN as a single market and
production base, a highly competitive region, with equitable economic development,
and fully integrated into the global economy.
1.9.2 Thailand board of investment (BOI) is an agency of the Government of
Thailand to promote investment in Thailand. It provides investment information and
services for investors, as well as many incentives.
1.9.3 Country-of-origin (COO) refer to the country that a manufacturer’s
product or brand is associated with.
1.9.4 Car Attribute refers to product quality encompasses the features and
characteristics of a product or service that bears on its ability to satisfy stated or
implied needs, can be defined as “fitness for use” or “conformance to requirement”.
1.9.5 Emotional Connection refers to the intimate bond created from feelings
and experiences between a consumer and a brand or a product.
1.9.6 Accessibility refers to comfortability of the brand, product, or service
that is easy to find, purchase, and use. Including varieties of payment methods,
flexibility of operation hours, and product availability.
1.9.7 External Influence refers to any external factors that affect consumer
purchase intention such as COO. COO was based on stereotypical images associated
13
with certain countries, which has impact on consumer perceptions and choice of
brands.
1.9.8 Brand-Loving Tendency refers to relationship between consumer and
object, product or brand.
1.9.9 Supporting Environmental Protection refers to consumer perception on
environmental impact during manufacturing process and finished products.
1.9.10 Drive for Environmental Responsibility refers to consumer perception
on environmental responsibility of the company. For example, factory that powered
by green energy and used wasted treatment system during manufacturing process.
1.9.11Vivacity refers to youth, spirit, cool and cheerfulness that brand
reflected.
1.9.12 Behavioral Intention refers to a plan that a person will perform some
behavior in specific situations. The theory of planned behavior (TPB) stated that an
individual behavioral intention was influenced by attitudes, subjective norms, and
perceived behavior control.
CHAPTER 2
LITERATURE REVIEW
This chapter will present related literature, related theories, theoretical
framework, and previous studies of factors positively affecting consumer vehicle
purchase intention of automobile consumers at Thailand International Motor Expo
2015 respectively as follow:
2.1 Concept theories of Car Attribute
2.2 Concept theories of Emotional Connection
2.3 Concept theories of Accessibility
2.4 Concept theories of External Influence
2.5 Concept theories of Brand-Loving Tendency
2.6 Concept theories of Supporting Environmental Protection
2.7 Concept theories of Drive for Environmental Responsibility
2.8 Concept theories of Vivacity
2.9 Concept theories of Behavioral Intention
2.10 Related document and previous research
2.11 Hypothesis
2.12 Variable used in research
2.13 Theoretical Framework
15
2.1 Concept theories of Car Attribute
Consumers have many perceptions toward brand and quality. Recently product
quality becomes an important issue between competitors. Product quality bears
responsibility to satisfy consumer needs, usage, and reflects the brand standard. On
the other hand, its uniqueness represent the brand. Product quality can be defined as
“fitness for use” or “conformance to requirement” from the consumer’s expected
standards of the brand (Russell & Taylor, 2006).
Product design is another related attributes. Since consumers pay more
attention toward design and style of the product (Kuksov, 2004). Product design is a
process of making new innovative products to be sold to consumers. Design include
styling, selecting materials, and processing (Robert, 2014). This made it an extremely
powerful and unique tool in the modern marketing environment. In order to influence
consumers, some marketers use design as opportunities and focus on designing a car
instead of advertising. As the result, most of the cases show that style and designs
have more influence on consumers perception toward car brand than advertising
(Hofmeyr & Rice, 2000). Some car brands use only style and design as tools to
communicate to consumers without the help of advertising and support (Rundh,
2005). When consumers know and familiar with the uniqueness design or components
of the brand, for example, consumer recognized Porsche and Jeep by their exterior
design, BMW by the front grill, and Roll-Royce by their iconic symbolic, known as
the spirit of ecstasy, standing on the front of the bonnet. Consumer will acknowledged
the brand without a doubt. Not only that, vehicle brands can reflect owner personality.
Forbes magazine found that, Honda owners are usually pragmatic, well educated, and
16
technology guys. For Roll-Royce, every owners have passion for life (Greenburg,
2009).
2.2 Concept theories of Emotional Connection
Emotional connection refers to the intimate bond created from feelings and
experiences between a consumer and a brand or a product (Narteh et al., 2012).
Nowadays, branding is an important issue toward consumers perception. It also
creates an emotional connection to consumers as well. It is not easy to crate this link
between consumers and brands, but once they bound by emotional connection, it is
harder for consumers to separate and finding another brand (Chaffey & Miller, 2012).
The concept of emotional brand is consumers emotionally attach to their passionate
brand. This bond is similar to the bond consumers crated among their close friend or
family (Aggarwal, 2004). Consumers’ perceived “emotional value” refers to their
affective reactions to a brand. Feelings toward brands are usually reported in
elicitation sessions such as "this brand make me feel confident" and usually express
their feeling toward brands in mild, intense, negative, or positive (Keller, 2001).
Morris et al. (2002) also found that emotional response to a brand is a strong predictor
toward purchase intention. Nowadays, every companies used emotional branding to
creates controls on consumer's emotions and makes them better receptors to brands
(Gobe, 2001).
Lots of consumers have high emotional connection with their car. Some
owners become emotionally attached towards vehicle brand based on ethical value
considerations. Not only that, some owner gave their car gender, male or female,
while owners with ages of 18 to 24 love to name their cars (Charlwood, 2014). This
17
makes car brand more focus on creating emotional atmosphere through their brands or
their car models instead of brand trustworthy (Rindfleisch, Burroughs, & Wong,
2009). With emotionally connected, car will be more than a type of transportation.
Consumers will enjoy their moment while they travelling and have good experience
with it.
2.3 Concept theories of Accessibility
Accessibility is another factor that consumers give priority to. Accessibility
can change consumers decision on purchasing one product to another. Accessibility
brand is a brand that consumers can easy to access. Consumers feel more comfortable
with a brand or service that is easy to find, purchase, and use. Including varieties of
payment methods, process simplicity, flexibility of operation hours, waiting times,
and product availability (VanAuken, 2015). Brand accessibility can be expanded by
using distribution. Switching brand is another serious issue. The studied of
Emmelheinz et al. (1991) found that 32 percents of consumers switched brand due to
out-of-stock. Raising price above the competitors in the same segment of substitution
goods can also lead consumers to switching brands as well. Convenience of a brand
had a significant impact on consumers’ brand choices as well as distribution channels
(Lin & Chang, 2003). In consumers decision making process, pre-purchase states,
consumers only considering only three to five favorite brands in their mind for a
certain product categories based on their accessibility and convenience (Schiffman &
Kanuk, 2009). For the car company, having showroom and service center give more
accessibility for consumers to stop by or service the car. Stocking is another issue
related to accessibility. In the other word, car brand must be available where
18
consumers shopped or within a reasonable distance for it to be considered within the
choice set (Schiffman & Kanuk, 2009). Since the number of older people is raising,
14.5% of U.S. population in 2014 which predicted to be 24.7% in 2040
(Administration for Commumity Living, 2015). Easy access to the vehicle become
another issue. This included getting in and out of the vehicle, comfortable of the
vehicles, and luggage space. For a large family market, especially in Thailand, that
have to travel with elders (UNPFA Asia, 2016). Luggage space for wheelchair, seat
position, and easiness of enter and exit vehicle become important issues.
2.4 Concept theories of External Influence
Now, consumers choose to be part of a group that they feel comfortable with.
There are many types of group with various types of social power. Beside family,
which has most influence power, 5 social power can be categorized. First is referent.
This group compose of people who share the same lifestyle. Second is legitimate,
created to achieve something with order and direction. Third is expert, this group
share or give an information on expert expertise field. Forth is reward, this group
provide reward to member who exceed the condition, Last one is coercive, penalty for
misbehave members usually use in military (Friesner, 2014).
Consumers tend to find more information before purchasing products or
services in order to get the most suitable one by searching through consumers
experience, feedback, promotion, and etc (Friesner, 2014).
Nowadays, COO of the manufacturing becomes more important than the
actual country of manufacture. COO refers to the country that a manufacturer’s
product or brand is associated with. As the result, car manufactures are looking for
19
consumers behaviors and find that birth place and manufacture location have
relationship between brand personality of vehicle and consumers purchase intention
(Wang & Yang, 2008). In the other word, Country-of-origin (COO) was known to
affect consumers perceptions and choice of brands. COO was based on stereotypical
images associated with certain countries and scholars argued that the construct could
moderate the positive relationship between brand personality and purchase intention.
A favorable COO increased the positive impact, while the opposite usually occurred
when COO was negative. Then, brand selection could be influenced by external
factors, including the consumer's status, role, family and other reference groups
(Narteh, Odoom, Braimah, & Buame, 2012). However, a different type of product or
service may have different effects (Wu & Lo, 2009).
2.5 Concept theories of Brand-Loving Tendency
Love combine many bonds of feeling together. Relationship between
consumers and objects, products or brands, are as same as interpersonal love. Liking
mean feeling toward the brand. Yearning mean strong emotion toward the brand.
Decision mean personal perception of liking and yearning toward brand for short
periods. Commitment mean long term repeat purchase perception toward the brand
(Shimp & Madden, 1988).
20
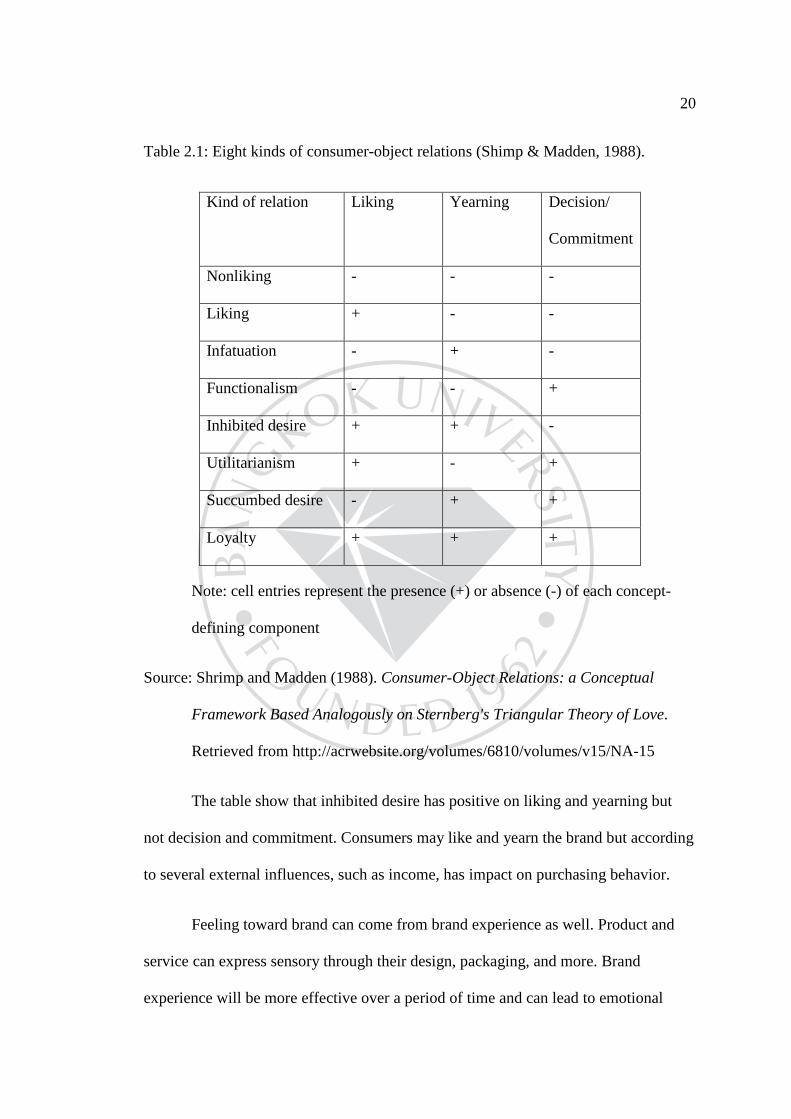
Table 2.1: Eight kinds of consumer-object relations (Shimp & Madden, 1988).
Kind of relation Liking Yearning Decision/
Commitment
Nonliking - - -
Liking + - -
Infatuation - + -
Functionalism - - +
Inhibited desire + + -
Utilitarianism + - +
Succumbed desire - + +
Loyalty + + +
Note: cell entries represent the presence (+) or absence (-) of each concept-
defining component
Source: Shrimp and Madden (1988). Consumer-Object Relations: a Conceptual
Framework Based Analogously on Sternberg's Triangular Theory of Love.
Retrieved from http://acrwebsite.org/volumes/6810/volumes/v15/NA-15
The table show that inhibited desire has positive on liking and yearning but
not decision and commitment. Consumers may like and yearn the brand but according
to several external influences, such as income, has impact on purchasing behavior.
Feeling toward brand can come from brand experience as well. Product and
service can express sensory through their design, packaging, and more. Brand
experience will be more effective over a period of time and can lead to emotional
21
connection toward brand (J. Joško Brakus, Bernd H. Schmitt, & Zarantonello, 2009).
Satisfaction is another emotion toward brand. First impression toward product are far
more important than post-consumption experience. Negative impression on first sight
is vital to the brand.
After brand love conceptualization by Shrimp and Madden (1988), it become a
topic of interest for every brand. Then Sternberg (1986) adapted the theory and newly
categorize into three dimensions, composed of passion, intimacy, and commitment.
The brand love relationship is deep and enduring, sometime it is irreplaceable.
Consumers suffer when deprived of the brand for a period of time. Brand love also
leads to negative or positive perceptions of the brand.
Consumers choose products and brands not only for their utilitarian values but
also for their symbolic benefits. Consumers use brands to present themselves to others
or achieve their identity goals (Escalas & Bettman, 2003). Brands also have the ability
to reflect owner’s identity. There are two sources of link between consumers and
brands. First is "brand identification" which refers to brand's image, values, and
personality. Second is "consumer identification" which refers to the focal consumer’s
identification with typical consumers of the brand (Escalas & Bettman, 2003;
Fournier, 1998).
Another issue that affect brand love is brand trust. In a consumer-brand
relationship, trust reflect reliability, honesty and selflessness that consumers attribute
to brands (Hess, 1995).
22
2.6 Concept theories of Supporting Environmental Protection.
Every human share the same home called earth. Every life on earth depend on
each other. Food chain and ecosystem are an example of system created by earth.
Global warming confirmed that these two systems has been ruined by human for a
long time (ODonnell, 2014). As global environment changing quickly, many
environmental protection organizations such as NRDC (Natural Resource Defense
Council) working together with government to legislate regulations and laws on
environmental protection. As the result, protecting environment become an important
issue for every company. For example Siemens using environmental management
system to surpass the laws and regulation consist of EHS (Environmental Protection,
Health Management and Safety) management system, "Serve the Environment"
program to efficient energy and resource, "Product Eco Excellence", a modular design
program, to innovative product (Siemen AGs, 2014).
As time passed, consumers have more concern about environmental issue. So
product and service that proofed to be part of environmental protection grows among
others and become one of the consumers choice (Gadenne, Sharma, Kerr, & Smith,
2011). Furthermore, environmental protection materials, design, and usage become
more popular and more available. The consumers searched for products which were
not harmful to the animals and nature, their ingredients were recyclable and produced
lesser environmental pollution during their usage. Thus, they recognized the role of
green products in improving the quality of environment and they exhibited support for
environmental protection by purchasing and owning green products (Escalas &
Bettman, 2005).
23
For the automobile industry, regulation of carbon emission standard is
increasing in a past few year. According to the EU regulation, since 2009, newly
build passenger cars and light van are using Euro 5 standard and become Euro 6 in
2014. As the result, car brand develops new technology to reduce carbon emission.
The result is green car, a vehicle that is more environmental friendly and consume
less fuel than normal vehicle. Hybrid cars, electric cars, hydrogen cars, and solar cars
are the example (PetrolPrices, 2014). Even the price is higher than a normal car.
Green car show consumers the ability to support environmental protection with
suitable for their lifestyle (Pickett‐Baker & Ozaki, 2008).
2.7 Concept theories of Drive for Environmental Responsibility.
Since environmental problem issue becomes more serious. Many people
demand companies to have more responsibility toward environmental including their
research and development to manufacturing process (Gadenne et al., 2011). Due to
the image of the company, modern company give more importance on environmental
responsibility. Staring from using green energy to power factory, material of the
factory, and wasted from the manufacturing process to product design and
development (Apple, 2015). Same as car companies. Many car companies continue to
designing and developing a better green vehicle. Lower consumption combustion
engine to hybrid engine and become fully electric. As a reward green company and
product getting more attention to consumers. Before consumers making purchase
decision, green consumers focus on ingredients as well as energy usage during
manufacturing process (Laroche, Bergeron, & Barbaro‐Forleo, 2001). But not every
consumers, environmental responsibility related to the perspective of consumers on
24
environmental protection. Each consumer has different level of responsibility toward
environment. Some consumers believe environmental protection lies with them
(Gadenne et al., 2011). Some have emotionally attached to environmental protection
(Lee, 2009).
With consumers concern about environmental problem that occur. Consumers
perception as well as purchase decision change and having more responsibility on
environment by purchase more green products (Kilbourne & Pickett, 2008). So, drive
for environmental responsibility was related to consumers' personal commitment
towards environmental protection issues and their individual-level activities intended
to improve the quality of the environment (Gadenne et al., 2011).
2.8 Concept theories of Vivacity
Vivacity or hipness was a component of the brand personality and had been
explained as included youth, spirit, cool and cheerfulness (Toldos-Romero & Orozco-
Gómez, 2015). According to Aaker's methodology of brand personality, 42 traits can
be divine to 5 main personality dimensions consist of Sincerity, Excitement,
Competence, Sophistication and Ruggedness. Later on, Aaker's methodology has
been use and developing all over the world with different in use of the methodology,
dimension found, and outcome. For example, the study in Mexico with 7 factors:
Success, Hipness/Vivacity, Sophistication, Sincerity, Domesticity/Emotionality,
Ruggedness, and Professionalism use to analyze brand personality between male and
female (Romero & Paz, 2012). The result show that women rated brand toward
Success and Hipness/Vivacity, while men rated brand using Domesticity/
Emotionality, Ruggedness and Professionalism.
25
Consumers express attitudes toward a brand using level of favor. Image and
attitude toward brand create brand equity (Berger & Mitchell, 1989). Higher level of
brand equity creates more attention, which lead to purchase and repurchase intention
(Chang & Liu, 2009).
Nowadays, brand personality becomes an important matter for company since
consumers purchase decision base on brand image than product (Dick, Chakravarti, &
Biehal, 1990). In purchasing process, consumers will search for the preference of
brand though memory. Positive brand image or personal experience has critical
impact on purchasing decision and repurchase product or brand (Aaker, 1992).
However, influence of brand personality dimension base on product type. Product
attributes has more influence to consumers on a familiar product while brand
personality is more effective on consumers toward unfamiliar product (Hoon, Ho, &
Wook, 2003).
2.9 Concept theories of Behavioral Intention.
Behavioral intention is a plan that a person will perform some behavior in
specific situations and usually measured by Likert scale. The question on intention to
perform made by respondents show that behavioral intention has predicted to have
highly relation toward behavior (Ajzen, 1991). There are 2 well known model of
behavioral intention, theory of reasoned action (TRA) and theory of planned behavior
(TPB).
Theory of reasoned action (TRA) was established by Martin Fishbein in
1960s, but was well known in 1970s after getting help from Icek Ajzen to expand the
theory. TRA focus on individual intention to perform actions. In order to understand
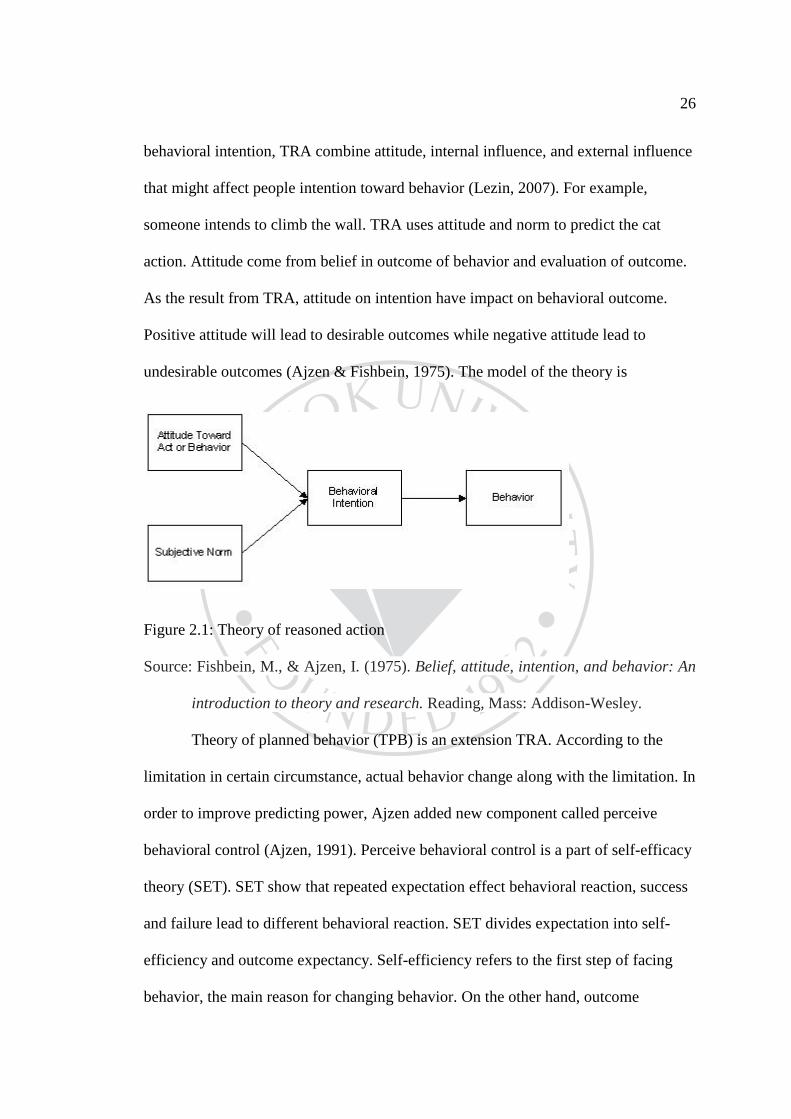
26
behavioral intention, TRA combine attitude, internal influence, and external influence
that might affect people intention toward behavior (Lezin, 2007). For example,
someone intends to climb the wall. TRA uses attitude and norm to predict the cat
action. Attitude come from belief in outcome of behavior and evaluation of outcome.
As the result from TRA, attitude on intention have impact on behavioral outcome.
Positive attitude will lead to desirable outcomes while negative attitude lead to
undesirable outcomes (Ajzen & Fishbein, 1975). The model of the theory is
Figure 2.1: Theory of reasoned action
Source: Fishbein, M., & Ajzen, I. (1975). Belief, attitude, intention, and behavior: An
introduction to theory and research. Reading, Mass: Addison-Wesley.
Theory of planned behavior (TPB) is an extension TRA. According to the
limitation in certain circumstance, actual behavior change along with the limitation. In
order to improve predicting power, Ajzen added new component called perceive
behavioral control (Ajzen, 1991). Perceive behavioral control is a part of self-efficacy
theory (SET). SET show that repeated expectation effect behavioral reaction, success
and failure lead to different behavioral reaction. SET divides expectation into self-
efficiency and outcome expectancy. Self-efficiency refers to the first step of facing
behavior, the main reason for changing behavior. On the other hand, outcome
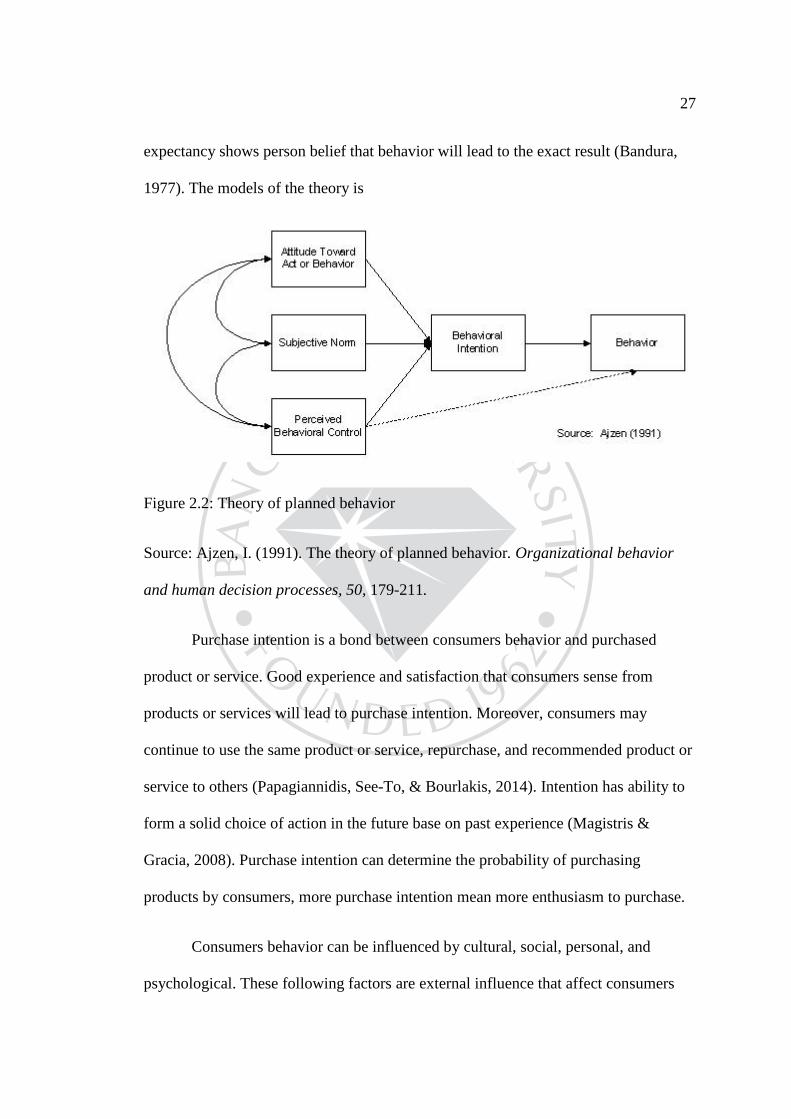
27
expectancy shows person belief that behavior will lead to the exact result (Bandura,
1977). The models of the theory is
Figure 2.2: Theory of planned behavior
Source: Ajzen, I. (1991). The theory of planned behavior. Organizational behavior
and human decision processes, 50, 179-211.
Purchase intention is a bond between consumers behavior and purchased
product or service. Good experience and satisfaction that consumers sense from
products or services will lead to purchase intention. Moreover, consumers may
continue to use the same product or service, repurchase, and recommended product or
service to others (Papagiannidis, See-To, & Bourlakis, 2014). Intention has ability to
form a solid choice of action in the future base on past experience (Magistris &
Gracia, 2008). Purchase intention can determine the probability of purchasing
products by consumers, more purchase intention mean more enthusiasm to purchase.
Consumers behavior can be influenced by cultural, social, personal, and
psychological. These following factors are external influence that affect consumers
28
behavior on purchasing product (Armstrong, Kotler, Harker, & Brennan, 2009).
Another influence is consumers personal characteristic such as gender, age, income,
lifestyle, and more (Kotler & Armstrong, 2010).
Consumers buying decision can be divided into 4 types. The first type is
complex buying behavior. Consumers in the first type are very concern on purchase
and clearly understand the different between brands. Usually take effect on high risk
and expensive product. Second is dissonance-reducing buying behavior, second type
consumers has bad experience or unsatisfied after purchasing the product but still
believe in their decision. Third is habitual buying behavior, this type of behavior
occurring in daily use product. So consumers takes a few involvements on purchasing.
Last type called variety seeking buying behavior; consumers have no brand loyalty
and usually switching brands (Kotler & Armstrong, 2010).
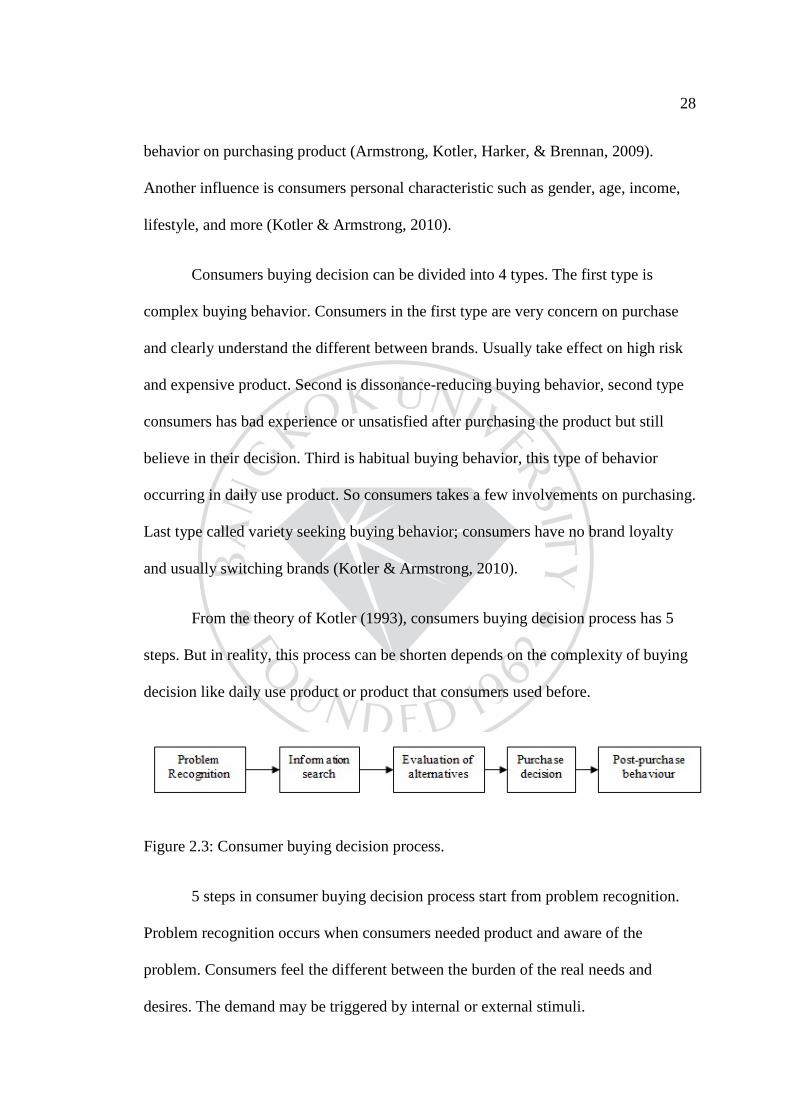
From the theory of Kotler (1993), consumers buying decision process has 5
steps. But in reality, this process can be shorten depends on the complexity of buying
decision like daily use product or product that consumers used before.
Figure 2.3: Consumer buying decision process.
5 steps in consumer buying decision process start from problem recognition.
Problem recognition occurs when consumers needed product and aware of the
problem. Consumers feel the different between the burden of the real needs and
desires. The demand may be triggered by internal or external stimuli.
29
Second is information search. As the effect of stimuli, consumers will find
more information about the product to satisfy the need. The information comes from
internal search, based on psychology, and external search. External search includes
personal source, commercial source, public source, and experimental source.
Third is evaluation of alternative. Once gather enough information, consumers
will process on branding advantage and value of the brand. Next step is pulling out
the alternative criteria of belief and attitude that buried in consumers' minds. Each
consumer has different alternative criteria. Some consider on interested specific
features or benefits to purchase the product. Then compare product and choose the
best one. However, different person has different perspective and measurement.
Fourth is purchase decision. End of the buying process. The variables that
have influence in this stage are motivation, attitude, culture, product feedback and
situation.
The last step is post-purchase behavior. Post-purchase behaviors include
consumers satisfaction toward products or services. Positive and negative satisfaction
affect consumers belief and attitude on repurchase the product, word of mouth, and
brand changing.
2.10 Related document and previous research
Naeteh, Odoom, Braimah, & Buame (2012) study on automobile brand choice
in Ghana through a survey of 1,020 respondents. The factors are brand awareness,
brand image, accessibility, emotional connection, price, automobile attributes, and
external influence. The results show that automobile attributes, emotional connection,
30
external influences, brand awareness, and accessibility show significant effect on
automobile brand choice in Ghana. Consumers are more familiar with famous or well-
known brand as well as unique vehicle attributes which have significant impact on
purchase decisions. Positive emotional attachment on car brand as well as positive
brand country origin and manufactory origin are another factor that impact purchase
decision and can lead to repurchase product depend on consumers reference.
Consumers purchase decision lies on convenient as well. More factors that increase
accessibility make consumers more convince to purchase the product. Last positive
factor mention in this study is automobile attribute. Style and design of the vehicle
reflect market segmentation and positioning, which has more influence on consumers
than advertising.
Kumar & Ghodeswar (2015) study the factors that affect consumers purchase
decisions on green product in Asian market. The study method is snowball sampling
on 38-item questionnaires from 403 respondents in Mumbai, India. The result shows
that Indian consumers are concerned about existing environmental problem and
willing to cooperate by purchasing and using green products. Indian consumers
searching information on green product and experience them. Indian consumers also
prefers to purchase product from companies that supporting environmental protection
and denied to purchase product from companies that polluted the environment.
Supporting environmental protection and drive for environmental responsibility
factors require consumers experience and emotional involvement on green products.
In the other words, consumers have an environmental friendly lifestyle.
31
Woo, Ahn, Lee, & Koo (2015) study to explore the influence of media
channels on purchase decision. Nowadays, consumers receive product information
from many different sources depend on their personal interest and product categories.
Non-durable goods, durable goods, and services are used against 10 media channels.
Base on lifestyle, the result show that broadcast TV and word of mouth are most
effective channel on consumers purchase decision while newspapers and magazine
are least effective. Base on ages, newspaper ads and word of mouth works well for
older consumers while teenager consumers more information from internet ads. Based
on gender, effective media channel for male consumers are a newspaper while female
consumers are magazine. Based on education level, newspaper and internet ads have
most impact on educated consumers. For brand-loving consumers. Broadcast TV and
magazines are the most effective way. As the result, consumers prefers information on
word of mouth and broadcast TV before purchase a car.
Toldos-Romero & Orozco-Gómez (2015) study the influence of brand
personality on purchase intention. The participants in this study are 400 undergraduate
students. Factors in this study are vivacity, success, sincerity, sophistication,
emotionality and professionalism. The result of the research found that vivacity,
success, sincerity, and sophistication powerful predictor on purchase intention but not
emotionality and professionalism. Among all powerful predictors, vivacity is the best
predictor follow by success. In the other word, teenagers looking for vivacity of the
brand not the professional of the brand. However, consumers purchase intention is
based on product type and category.
32
Shiau & Chau (2015) study on behavioral intention to use a cloud computing
classroom. Reasearchers tested 6 theories: service quality, self-efficacy, the
motivational model, the technology acceptance model, theory of planned behavior,
and innovation diffusion theory using online questionnaires with 478 samples. As the
result, 6 theoretical models show strong capability toward behavioral intention on
using cloud computing classroom. The result also shows the reference on managing,
planning, and implementing system on cloud computing classroom.
Moslehpour, Aulia, & Masarie (2015) study on perception and purchase
intention of consumers toward bakery products. Since there are many Indonesian in
Taiwan, it is an opportunity for Taiwanese bakery owner to develop new strategy for
Indonesian consumers. So, the sample group of this study is Indonesian consumers.
Independent factors in this study are product characteristics, perceived price, and
perceived servicescape. While perceived quality and purchase intentions are
dependent factors. The result of this study found that product characteristic is the most
important matters of Indonesian consumers follow by perceived price. In contrast, no
influence on perceived servicescape toward perceived quality and purchase intention.
Pungchoo, Kanthawongs, & Chitcharoen (2014) study on the effect of label
product, communications of organic distinctiveness, global socioeconomic conditions,
resource availability of organicity, assessment of statements about organic farming,
healthy and environmentally friendly, and buying motivation on purchase intention of
organic product at shop A using survey method. Hypotheses testing analyzed by
Multiple Regression Analysis. The result shows that most of the participants were
female, ages between 21-30, bachelor's degree, company employees, and income
33
range of 10,001-20,000 baht. After analysis at 0.05 levels of significance by Multiple
Regression, Buying Motivation has beta equal to 0.258, Assessment of Statement
about Organic Farming has beta equal to 0.242, Communications of Organic
Distinctiveness has beta equal to 0.211, and Healthy and Environmentally Friendly
has beta equal to 0.158 have effect on purchase intention of the organic product shop
“A” in Pathumthani Province. Hence, organic product shop should consider the
following factors and use in future marketing strategy.
Siraiyara, Kanthawongs, & Chitcharoen (2014) research on influence of
celebrities’ Instagram references, customer review, cost and time savings,
convenience, risk, product variety, and consumers resources and skills on purchase
intention of facial skin care products through Instagram application of females in
Bangkok. The data in this research were collected by using survey method with 300
sample size. Hypotheses testing analyzed by Multiple Regression Analysis. The result
shows that most of the participants were aged between 26-35, bachelor's degree,
single, student, income range of 10,001-20,000 baht, using Instragram more than 15
times a month, using Instragram 1-5 hours a week, and never bought product through
Instragram before. After analysis at 0.01 levels of significance by Multiple
Regression, only celebrities’ Instagram references, customer review, and cost and
time savings have significance effect on purchase intention of facial skin care
products through Instagram. The result from this research will benefit facial skin care
products sellers on Instragram.
Saengrattanachaiyakul, Kanthawongs, & Kanthawongs (2014) studied on the
influence of convenience, social conscience, behavioral loyalty, product-based
satisfaction, transaction-based satisfaction, and unconstrained eating toward purchase
34
intention of consumers in Bangkok. The data in this research were collected by using
survey method with 300 sample size. Hypotheses testing analyzed by Multiple
Regression Analysis. The result shows that most of the participants were female, ages
between 25-35, bachelor's degree, business owner, income below 30,000 baht, single,
live in a detached house, consume fast food 1 time a week, favorite fast food menu
were fried chicken, and consume fast food at the store. After analysis at 0.01 level of
significance by Multiple Regression, only product-base satisfaction, convenience, and
behavioral loyalty have significance effect on purchase intention of fast food in
Bangkok. The result from this research will benefit fast food brand and store.
2.11 Hypothesis
From related literature, related theories, theories framework, and previous
studies can be hypothesized as follows.
2.11.1 There is positive relationship between Car Attribute and Behavioral
Intention.
2.11.2 There is positive relationship between Emotional Connection and
Behavioral Intention.
2.11.3 There is positive relationship between Accessibility and Behavioral
Intention.
2.11.4 There is positive relationship between External Influence and
Behavioral Intention.
35
2.11.5 There is positive relationship between Brand-Loving Tendency and
Behavioral Intention.
2.11.6 There is positive relationship between Supporting Environmental
Protection and Behavioral Intention.
2.11.7 There is positive relationship between Drive for Environmental
Protection and Behavioral Intention.
2.11.8 There is positive relationship between Vivacity and Behavioral
Intention.
2.11.9 Car Attribute, Emotional Connection, Accessibility, External Influence,
Brand-Loving Tendency, Supporting Environmental Protection, Drive for
Environmental Protection has positively influence on Behavioral Intention of working
people in Bangkok.
2.12 Variable used in research.
2.12.1 Independent Variable categorized into
2.12.1.1 Car Attribute.
2.12.1.2 Emotional Connection.
2.12.1.3 Accessibility.
2.12.1.4 External Influence.
2.12.1.5 Brand-Loving Tendency.
2.12.1.6 Supporting Environmental Protection.
36
2.12.1.7 Drive for Environmental Protection.
2.12.1.8 Vivacity.
2.12.2 Dependent Variable is Behavioral Intention.
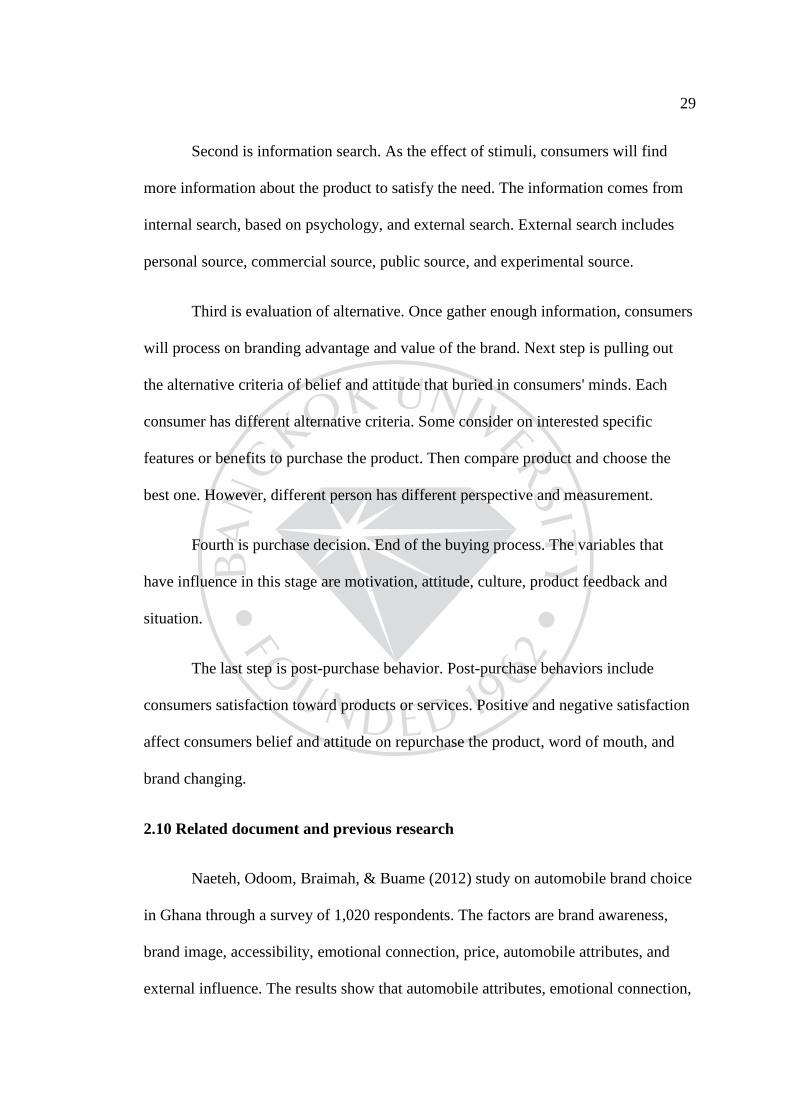
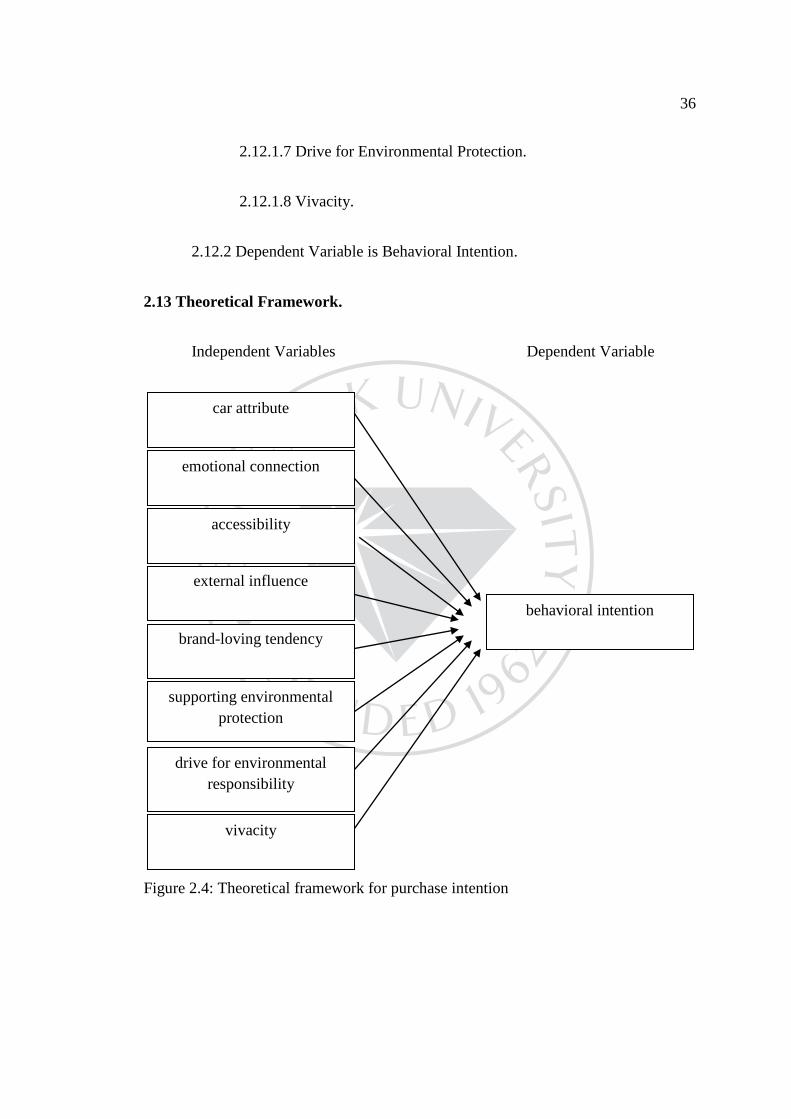
2.13 Theoretical Framework.
Independent Variables Dependent Variable
Figure 2.4: Theoretical framework for purchase intention
car attribute
emotional connection
accessibility
external influence
behavioral intention
brand-loving tendency
supporting environmental
protection
drive for environmental
responsibility
vivacity
CHAPTER 3
RESEARCH METHODOLOGY
To study factors positively affecting purchase intention of automobile
consumers at Thailand International Motor Expo 2015 in Bangkok. The researcher
conducts research on the following order.
3.1 Research Design
3.2 Population and Sample Selection
3.3 Research Instrument
3.4 Testing Research Instrument
3.5 Data Collection
3.6 Preparation and Data Analysis
3.7 Statistic Method
3.1 Research Design
This research objective is to explore the factor positively affecting automobile
consumer purchase intention in Thailand International Motor Expo 2015. The
methodology of this research is based on quantitative approaches. This research use
survey method and collect data by questionnaire.
38
3.2 Population and Sample Selection
3.2.1 Population in Research
Population in this research are working people who attend to 32nd Bangkok
International Motor Expo 2015 at Impact Challenge. Total number of visitors during
the exhibition are 1.5 million (Redlinelap, 2015).
3.2.2 Sample Size in Research
The sample size for this study was based on a Cohen (1977) formula to
determine the sample size from 40 questionnaires done by working people that attend
to 32nd Bangkok International Motor Expo 2015. According to the formula, Cohen
(1977), using in G*power and an approval from several researchers (Erdfelder, Faul,
& Buchner, 1996; Wiratchai, 2012). G*power version 3.1.9.2 is using to calculate 40
sets of Pilot Test with the Power (1– β) of 0.80, Alpha (α) of 0.20, Number of Test
Predictor of 8, Effect Size of 0.03702 (Calculated by Partial R2 of 0.0357). The result
shows that the minimum of the total sample size is 258 (Cohen, 1977). Thus, 300 sets
of questionnaire have been collected.
3.2.3 Sample Selection in Research
The sample of this research is selected by using one of the non-probability
sampling methods called Convenience Sampling; participants are working people
who attend to 32nd Bangkok Motor Expo 2015 and willing to cooperate with
researcher by doing questionnaire.
39
3.3 Research Instrument
The researcher conduct research instrument in the following order
1.1 Research from books, documents, articles, and Journals that relate to the
customer purchase intention, customer purchase decision, customer satisfaction, and
environmental responsibility, together with guidance and assistance from an advisor.
1.2 Creating a questionnaire from theory in related researches, which are car
attributes, emotional connection, accessibility, external influence, brand-loving
tendency, supporting environmental protection, drive for environmental
responsibility, vivacity, and behavioral intention, with the approval of an advisor.
1.3 After complete questionnaire form, passing content validity of the
questionnaire by approval from the advisor, Dr. Penjira Kanthawongs, and 2
automotive experts, Mr. Nontapant Chongthong, Toyota Mahanakorn Manager, and
Mr. Aekkarak Khongkay, Siam Nissan Bangkok Human Resource Manager.
1.4 Using comment and guidance from the advisor and 2 experts to remake the
questionnaire. After that, launch 40 pilot test questionnaires and analyze the reliability
of each variable in each factor using Cronbach's Alpha Coefficient. Value of
Cronbach's Alpha is between 0≤α≤ 1, higher value mean higher reliability and closely
related of section.
1.5 Conduct Construct Validity by using Factor Analysis on 40 pilot test to
ensure that the grouping of questions for each factor is also consistent with the theory
that study.
This research using questionnaire, which created from a related literature
review, for collected data. The questionnaire can be divide into 4 parts:
40
Part 1: 6 Close-ended Response Question about participant demographic and
general information consist of Gender, Age, Status, Education, Salary, and
Occupation.
Part 2: 5 Close-ended Response Question about buying behavioral consist of
How many cars you owned?, What types of car are you interested to purchase?, How
long do you intend to purchase a car?, Who has an influence on purchase a car?, and
Main reason to purchase a car?
Part 3: 39 Close-ended Response Question about " Factor Positively Affecting
Automobile Consumer Purchase Intention of Working People in Bangkok " consist of
Car Attributes 4 Questions
Emotional Connection 4 Questions
Accessibility 4 Questions
External Influence 4 Questions
Brand-Loving Tendency 4 Questions
Support Environmental Protection 6 Questions
Drive for Environmental Responsibility 5 Questions
Vivacity 4 Questions
Behavioral Intention 4 Questions
This part is measured in interval scale by using a five-level Likert Scale to
measure the level of agreement.
41
Strongly Agree 5 points
Agree 4 points
Neutral 3 points
Disagree 2 points
Strongly Disagree 1 points
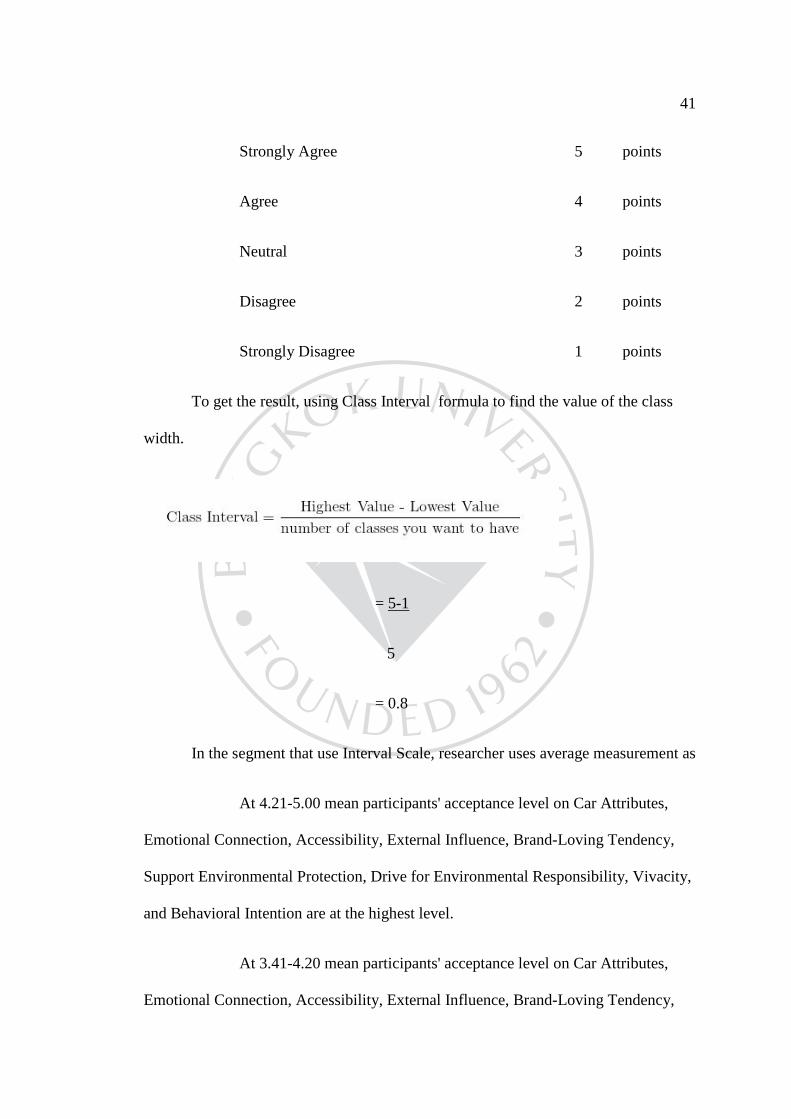
To get the result, using Class Interval formula to find the value of the class
width.
= 5-1
5
= 0.8
In the segment that use Interval Scale, researcher uses average measurement as
At 4.21-5.00 mean participants' acceptance level on Car Attributes,
Emotional Connection, Accessibility, External Influence, Brand-Loving Tendency,
Support Environmental Protection, Drive for Environmental Responsibility, Vivacity,
and Behavioral Intention are at the highest level.
At 3.41-4.20 mean participants' acceptance level on Car Attributes,
Emotional Connection, Accessibility, External Influence, Brand-Loving Tendency,
42
Support Environmental Protection, Drive for Environmental Responsibility, Vivacity,
and Behavioral Intention are at high level.
At 2.61-3.40 mean participants' acceptance level on Car Attributes,
Emotional Connection, Accessibility, External Influence, Brand-Loving Tendency,
Support Environmental Protection, Drive for Environmental Responsibility, Vivacity,
and Behavioral Intention are at normal level.
At 1.81-2.60 mean participants' acceptance level on Car Attributes,
Emotional Connection, Accessibility, External Influence, Brand-Loving Tendency,
Support Environmental Protection, Drive for Environmental Responsibility, Vivacity,
and Behavioral Intention are at low level.
At 1.00-1.80 mean participants' acceptance level on Car Attributes,
Emotional Connection, Accessibility, External Influence, Brand-Loving Tendency,
Support Environmental Protection, Drive for Environmental Responsibility, Vivacity,
and Behavioral Intention are at the lowest level.
Part 4: An Open–Ended Response Question that allows participants to leave
some advice or comment for researcher.
3.4 Testing Research Instrument
After analyzing 40 pilot test. The Cronbach's Alpha Coefficient of Car
Attribute equal 0.647, Emotional Connection equals 0.755, Accessibility equals
0.695, External Influence equals 0.653, Brand-Loving Tendency equals 0.833,
Supporting Environmental Protection equals 0.862, Drive for Environmental
Responsibility equals 0.873, Vivacity equals 0.758, Behavioral Intention equals
43
0.645. Almost all alpha coefficients passed the 0.65 (Nunnally, 1978) recommended
level and had proven to be reliable. However, the Cronbach's Alpha Coefficient of
Car Attribute of 0.647 is likely to be increased with larger sample size for actual data
collection in the next step.
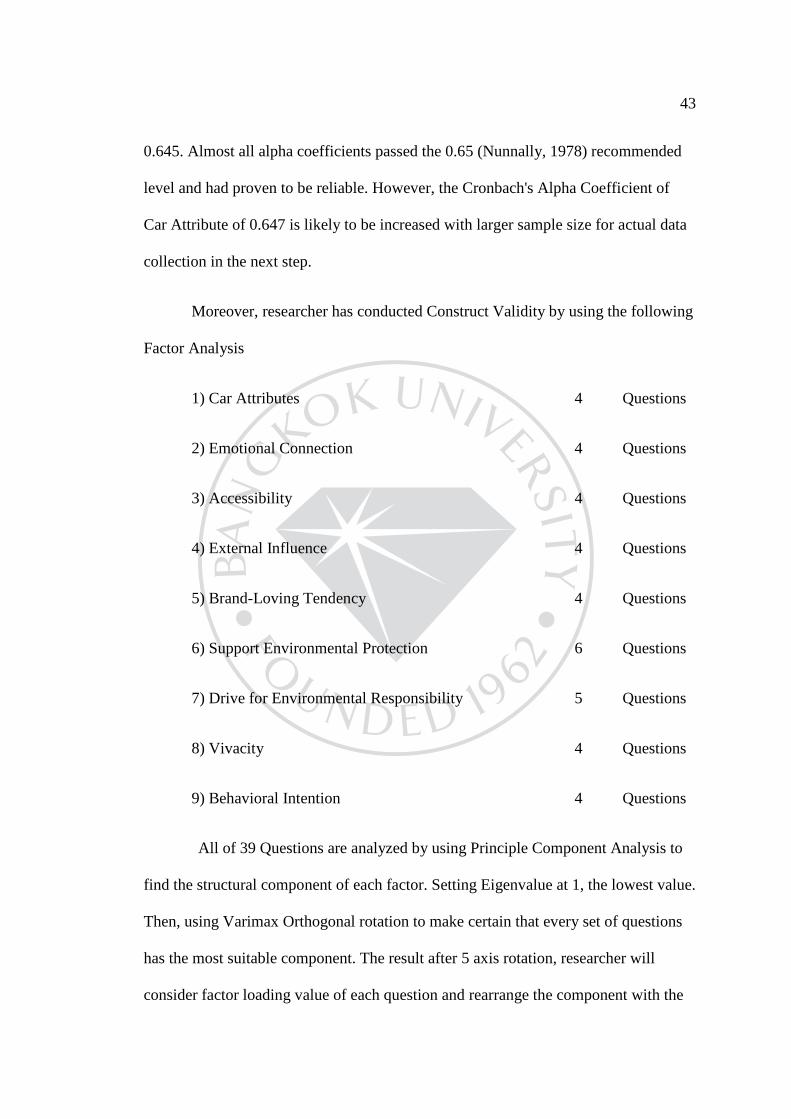
Moreover, researcher has conducted Construct Validity by using the following
Factor Analysis
1) Car Attributes 4 Questions
2) Emotional Connection 4 Questions
3) Accessibility 4 Questions
4) External Influence 4 Questions
5) Brand-Loving Tendency 4 Questions
6) Support Environmental Protection 6 Questions
7) Drive for Environmental Responsibility 5 Questions
8) Vivacity 4 Questions
9) Behavioral Intention 4 Questions
All of 39 Questions are analyzed by using Principle Component Analysis to
find the structural component of each factor. Setting Eigenvalue at 1, the lowest value.
Then, using Varimax Orthogonal rotation to make certain that every set of questions
has the most suitable component. The result after 5 axis rotation, researcher will
consider factor loading value of each question and rearrange the component with the
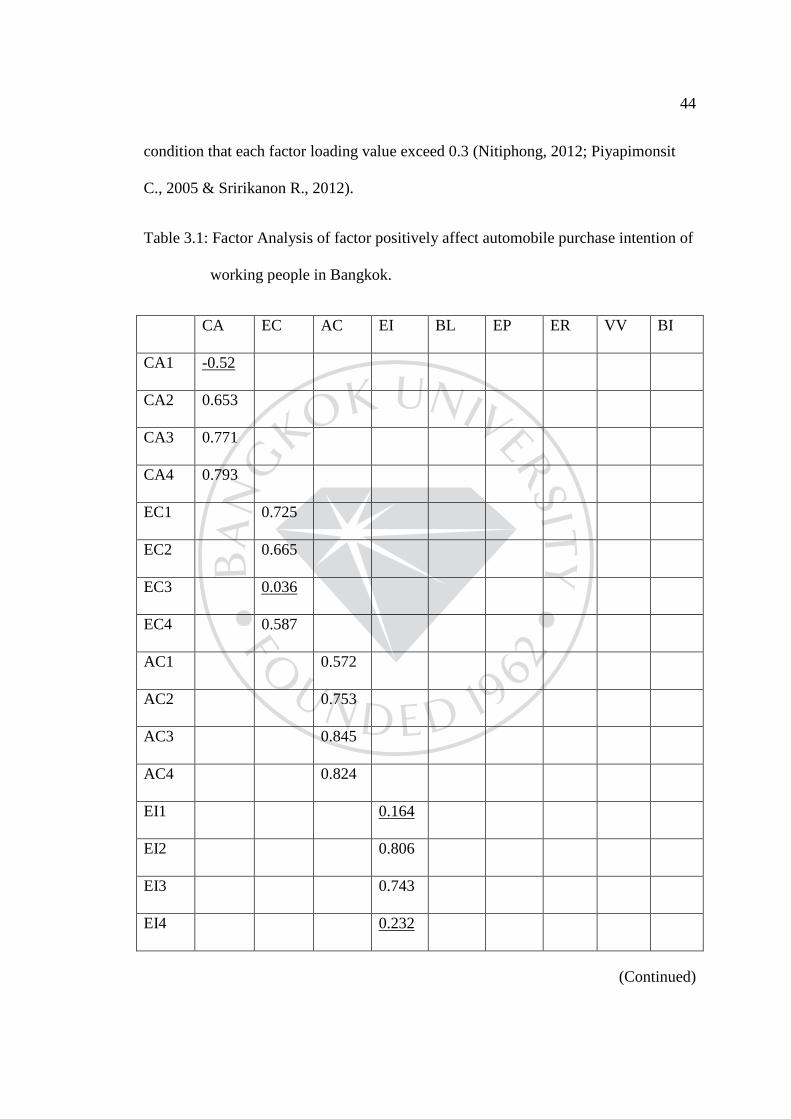
44
condition that each factor loading value exceed 0.3 (Nitiphong, 2012; Piyapimonsit
C., 2005 & Sririkanon R., 2012).
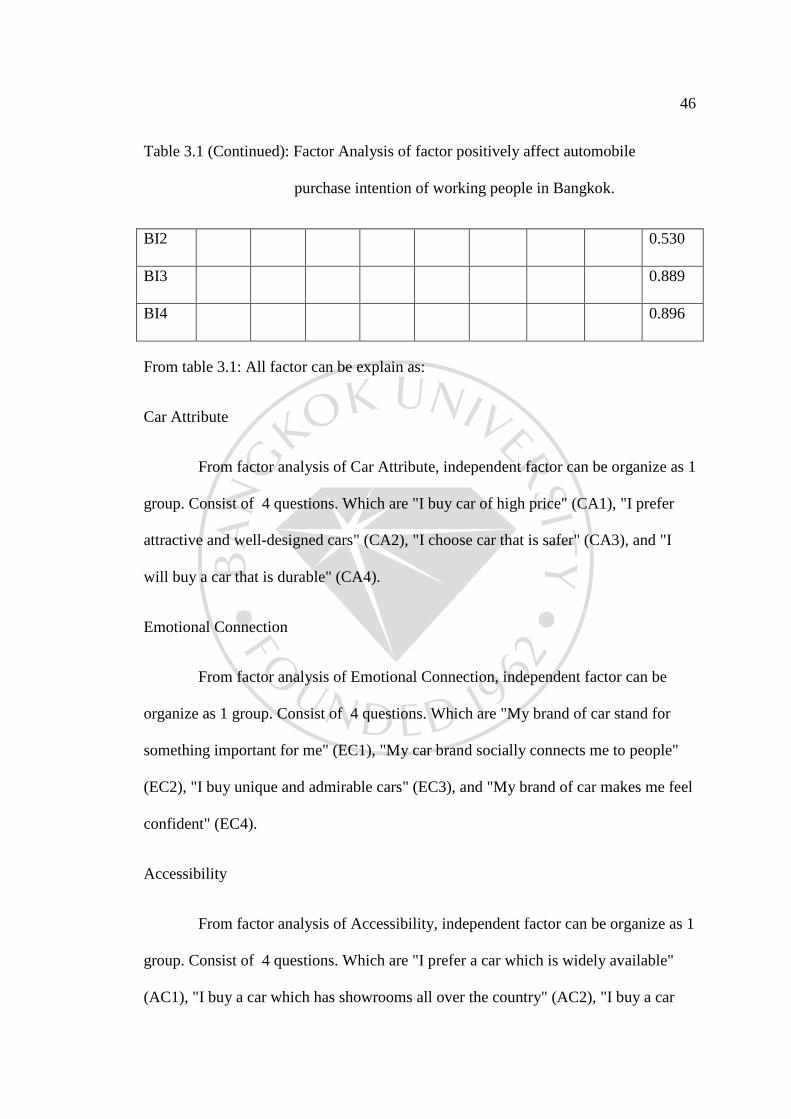
Table 3.1: Factor Analysis of factor positively affect automobile purchase intention of
working people in Bangkok.
CA EC AC EI BL EP ER VV BI
CA1 -0.52
CA2 0.653
CA3 0.771
CA4 0.793
EC1 0.725
EC2 0.665
EC3 0.036
EC4 0.587
AC1 0.572
AC2 0.753
AC3 0.845
AC4 0.824
EI1 0.164
EI2 0.806
EI3 0.743
EI4 0.232
(Continued)
45
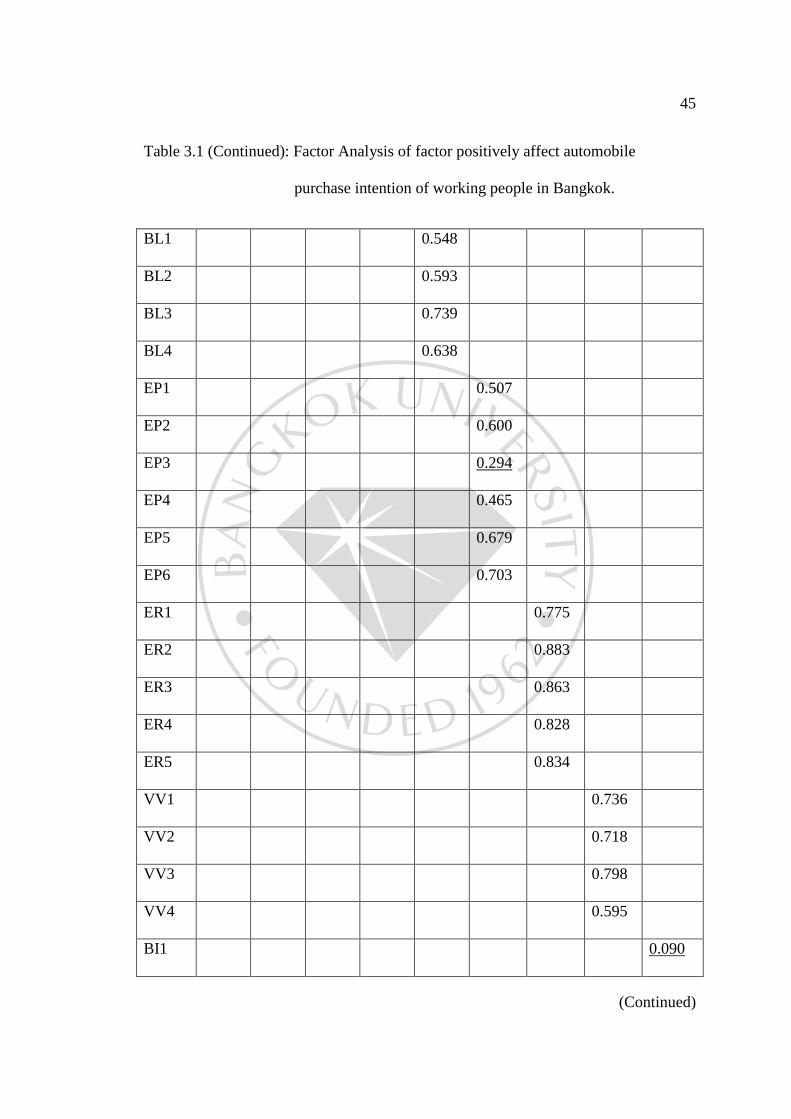
Table 3.1 (Continued): Factor Analysis of factor positively affect automobile
purchase intention of working people in Bangkok.
BL1 0.548
BL2 0.593
BL3 0.739
BL4 0.638
EP1 0.507
EP2 0.600
EP3 0.294
EP4 0.465
EP5 0.679
EP6 0.703
ER1 0.775
ER2 0.883
ER3 0.863
ER4 0.828
ER5 0.834
VV1 0.736
VV2 0.718
VV3 0.798
VV4 0.595
BI1 0.090
(Continued)
46
Table 3.1 (Continued): Factor Analysis of factor positively affect automobile
purchase intention of working people in Bangkok.
BI2 0.530
BI3 0.889
BI4 0.896
From table 3.1: All factor can be explain as:
Car Attribute
From factor analysis of Car Attribute, independent factor can be organize as 1
group. Consist of 4 questions. Which are "I buy car of high price" (CA1), "I prefer
attractive and well-designed cars" (CA2), "I choose car that is safer" (CA3), and "I
will buy a car that is durable" (CA4).
Emotional Connection
From factor analysis of Emotional Connection, independent factor can be
organize as 1 group. Consist of 4 questions. Which are "My brand of car stand for
something important for me" (EC1), "My car brand socially connects me to people"
(EC2), "I buy unique and admirable cars" (EC3), and "My brand of car makes me feel
confident" (EC4).
Accessibility
From factor analysis of Accessibility, independent factor can be organize as 1
group. Consist of 4 questions. Which are "I prefer a car which is widely available"
(AC1), "I buy a car which has showrooms all over the country" (AC2), "I buy a car
47
which has spare parts readily available" (AC3), and "I choose cars with maintenance
and repair services" (AC4).
External Influence
From factor analysis of External Influence, independent factor can be
organize as 1 group. Consist of 4 questions. Which are "I buy a car because of its
country origin" (EI1), "I buy a car recommended by my family and friends" (EI2), "I
buy a car used by my family and friends" (EI3), and "My car brand reflects my social
status" (EI4).
Brand-Loving Tendency
From factor analysis of Brand-Loving Tendency, independent factor can be
organize as 1 group. Consist of 4 questions. Which are "I tend to care about brands
when I buy things" (BL1), "I tend to repurchase brands that I have bought before"
(BL2), "I tend to consider company image when I buy things" (BL3), and "I tend to
buy products from famous brands even though they are expensive" (BL4).
Supporting Environmental Protection
From factor analysis of Supporting Environmental Protection, independent
factor can be organize as 1 group. Consist of 6 questions. Which are "Supporting
environmental protection in automobile makes me feel meaningful" (EP1), "The price
for environmental friendly vehicles should be appropriate in relation to value for
money" (EP2), "Components of an environmentally friendly vehicles are recyclable"
(EP3), "I find environmental friendly vehicles really relevant to my lifestyle" (EP4),
"An environmental friendly vehicles should produces the least pollution in its usage"
48
(EP5), and "I prefer environmental friendly vehicles over non- environmental friendly
vehicles when their product qualities are similar" (EP6).
Drive for Environmental Responsibility
From factor analysis of Drive for Environmental Responsibility, independent
factor can be organize as 1 group. Consist of 5 questions. Which are "Supporting
environmental protection makes me feel as an environmentally responsible person"
(ER1), "I should be responsible for protecting our environment" (ER2),
"Environmental protection start with me" (ER3), "I would say I am emotionally
involved in environmental protection issue" (ER4), and "Supporting environmental
protection makes me special" (ER5).
Vivacity
From factor analysis of Vivacity, independent factor can be organize as 1
group. Consist of 4 questions. Which are "Car design should reflect your youth"
(VV1), "Car design should reflect your spirit" (VV2), "I Car design should reflect
your coolness" (VV3), and "Car design should reflect your cheerfulness" (VV4).
Behavioral Intention
From factor analysis of Behavioral Intention, independent factor can be
organize as 1 group. Consist of 4 questions. Which are "I would like to purchase
vehicle that has good price" (BI1), "I intend to purchase vehicle soon" (BI2), "I will
recommended my friend to purchase vehicle by considering factors in this
questionnaire" (BI3), and "I encourage my relative to purchase vehicle by considering
factors in this questionnaire" (BI4).
49
3.5 Data Collection
There are two types of data collection in this research.
3.5.1 Primary Data is the data from the questionnaire by following step
3.5.1.1 Researcher research from related hypothesis, idea, and documents
to create research ideas through research procedure. 280 questionnaires were collected
during 32nd Bangkok International Motor Expo 2015.
3.5.1.2 Correct and check the finished questionnaire along with the advice
from the advisor and experts before analyzing the data.
3.5.1.3 Keying raw data from completed questionnaire in suitable tools.
Compute and analyze the data.
3.5.2 Secondary Data is data collected from books, tables, articles, researched
research, and internet that related to the automobile, customer decision, and purchase
intention to narrow the scope of research and using as a reference.
3.6 Preparation and Data Analysis
This research uses SPSS as a software for statistical analysis. Each part of the
questionnaire uses different tools to analyze the data. The steps are
1. Classify complete and useable questionnaire.
2. Coding classified questionnaire.
3. Saving coding questionnaire in SPSS by using Level of Significance of
0.05.
50
4. Questionnaire data will be analyzed for statistics.
4.1 Descriptive Statistic Analysis
4.1.1 Question about participant demographic and general information
are analyzed by using Frequency and Percentage.
4.1.2 Question about buying behavioral analyze by using frequency
and Percentage.
4.1.3 Likert Scale question about Car Attributes, Emotional
Connection, Accessibility, External Influence, Brand-Loving Tendency, Support
Environmental Protection, Drive for Environmental Responsibility, Vivacity, and
Behavioral Intention analyze by using Mean (𝑋𝑋)��� and Standard Deviation (S.D)
4.2 Inferential Statistic Analysis
4.2.1 Each independent variable consist of Car Attributes, Emotional
Connection, Accessibility, External Influence, Brand-Loving Tendency, Support
Environmental Protection, Drive for Environmental Responsibility, and Vivacity
analyzes by using Pearson Product-Moment Correlation Coefficient.
4.2.2 All independent variable (Car Attributes, Emotional Connection,
Accessibility, External Influence, Brand-Loving Tendency, Support Environmental
Protection, Drive for Environmental Responsibility, and Vivacity) with dependent
variable (Behavioral Intention) analyze by using Multiple Regression Analysis.
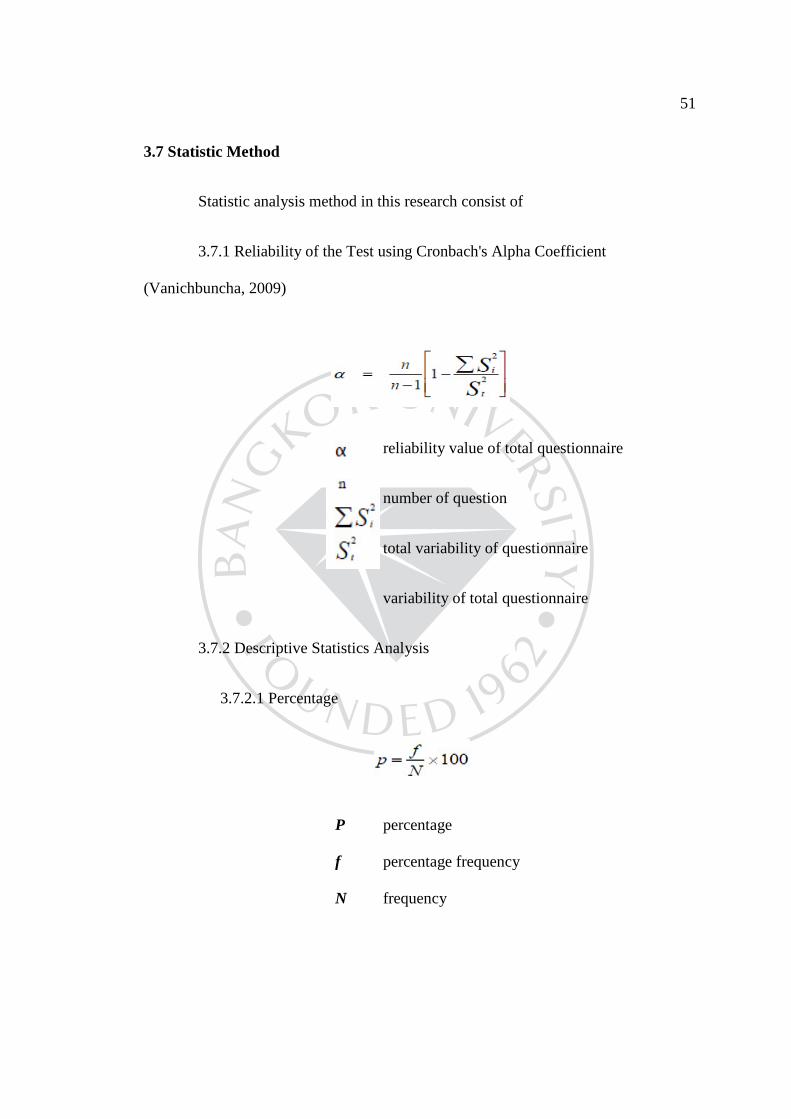
51
3.7 Statistic Method
Statistic analysis method in this research consist of
3.7.1 Reliability of the Test using Cronbach's Alpha Coefficient
(Vanichbuncha, 2009)
reliability value of total questionnaire
number of question
total variability of questionnaire
variability of total questionnaire
3.7.2 Descriptive Statistics Analysis
3.7.2.1 Percentage
P percentage
f percentage frequency
N frequency
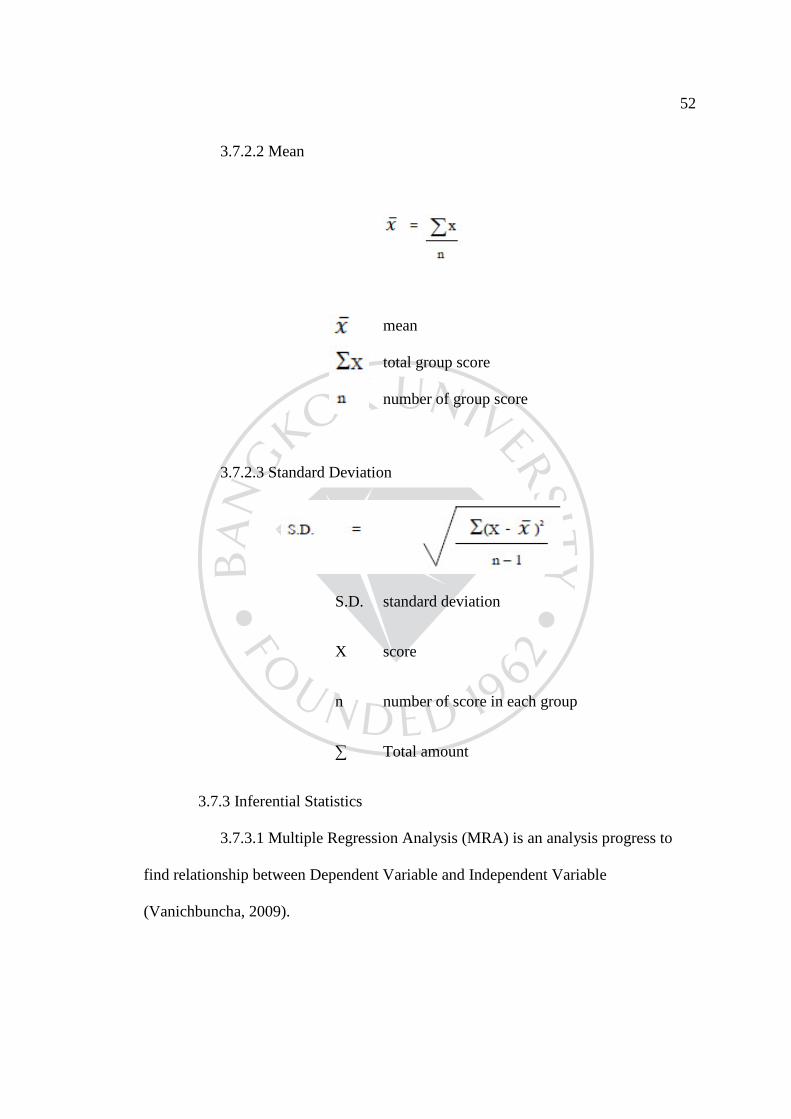
52
3.7.2.2 Mean
mean
total group score
number of group score
3.7.2.3 Standard Deviation
S.D. standard deviation
X score
n number of score in each group
∑ Total amount
3.7.3 Inferential Statistics
3.7.3.1 Multiple Regression Analysis (MRA) is an analysis progress to
find relationship between Dependent Variable and Independent Variable
(Vanichbuncha, 2009).
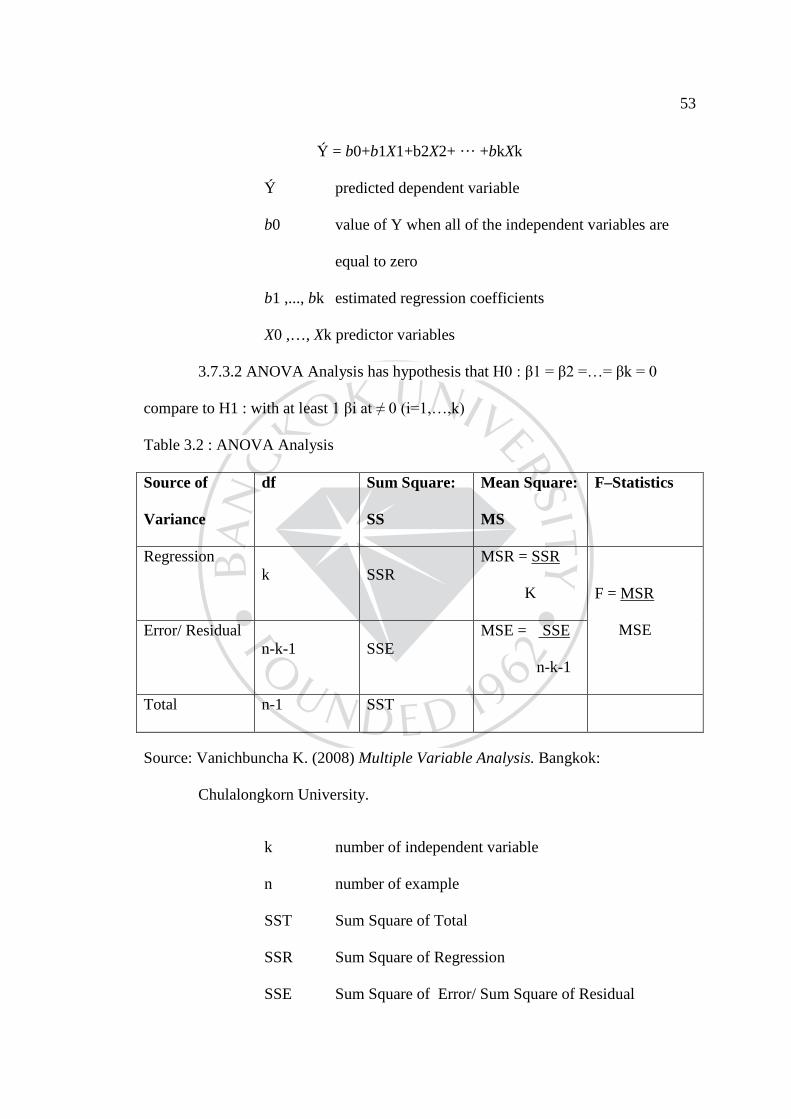
53
Ý = b0+b1X1+b2X2+ ··· +bkXk
Ý predicted dependent variable
b0 value of Y when all of the independent variables are
equal to zero
b1 ,..., bk estimated regression coefficients
X0 ,…, Xk predictor variables
3.7.3.2 ANOVA Analysis has hypothesis that H0 : β1 = β2 =…= βk = 0
compare to H1 : with at least 1 βi at ≠ 0 (i=1,…,k)
Table 3.2 : ANOVA Analysis
Source of
Variance
df Sum Square:
SS
Mean Square:
MS
F–Statistics
Regression k SSR
MSR = SSR
K F = MSR
MSE Error/ Residual n-k-1 SSE
MSE = SSE
n-k-1
Total n-1 SST
Source: Vanichbuncha K. (2008) Multiple Variable Analysis. Bangkok:
Chulalongkorn University.
k number of independent variable
n number of example
SST Sum Square of Total
SSR Sum Square of Regression
SSE Sum Square of Error/ Sum Square of Residual
54
MSR Mean Square of Regression
MSE Mean Square of Error
F F-Statistic
3.7.3.3 Pearson Product-Moment Correlation Coefficient
Rxy Pearson Correlation Coefficient
x Values in the first set of data
y Values in second set of data
n Total number of value
The value of Pearson Correlation Coefficient is between –1≤ r ≤ 1. The
positive and negative value of r determine the direction of relationship.
Positive r show that 2 variable have same direction of relationship.
Negative r show that 2 variable have opposite direction of relationship.
The size of the relationship can be determine by value of r
r value nearly +1 show that 2 variable have close relationship in the
same direction.
r value nearly -1 show that 2 variable have least relationship in
opposite direction.
r value equal to 0 mean there is no correlation between 2 variable.
r value close to 0 mean that 2 variable has few relationship.
CHAPTER 4
FINDING
Since the purposes of this research is to explore factors positively affecting
automobile consumer purchase intention of working people in Bangkok. The data are
collected by passing a survey questionnaire in 32nd Bangkok International Motor
Expo 2015 at Impact Arena, Muang Thong Thani. During 5 to 11 December 2015, the
questionnaire was sent to 258 people, whose buying an exhibition ticket, with a
hundred percent response rate.
The value of Cronbach's Alpha Coefficient of 8 factors are shown as follows.
Car Attributes equal to 0.712, Emotional Connection equal to 0.739, Accessibility
equal to 0.792, External Influence equal to 0.631, Brand-Loving Tendency equal to
0.734, Supporting Environmental Protection equal to 0.852, Drive For Environmental
Protection equal to 0.916, Vivacity equal to 0.797, and Behavioral Intention equal to
0.704. Every factor except External Influence exceeds the minimal coefficient, 0.65.
All alpha coefficients passed the 0.65 (Nunnally, 1978) recommended level and had
proven to be reliable.
According to this, data can be analyzed and can be presented below.
4.1 Demographic data
Data will be present in frequencies and percentage of gender, ages, status,
educational level, monthly salary, occupation, number of vehicles owned, interested
vehicle segment, vehicle buying period, buying decision influenced, and buying
objective.
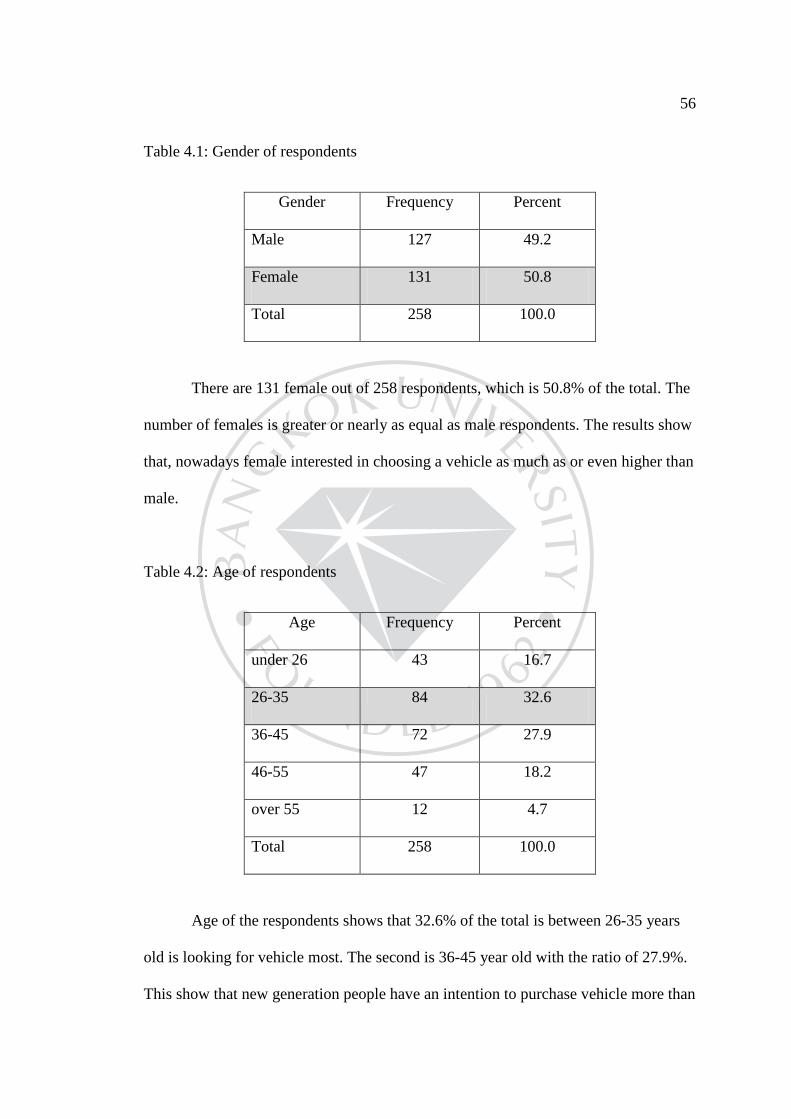
56
Table 4.1: Gender of respondents
Gender Frequency Percent
Male 127 49.2
Female 131 50.8
Total 258 100.0
There are 131 female out of 258 respondents, which is 50.8% of the total. The
number of females is greater or nearly as equal as male respondents. The results show
that, nowadays female interested in choosing a vehicle as much as or even higher than
male.
Table 4.2: Age of respondents
Age Frequency Percent
under 26 43 16.7
26-35 84 32.6
36-45 72 27.9
46-55 47 18.2
over 55 12 4.7
Total 258 100.0
Age of the respondents shows that 32.6% of the total is between 26-35 years
old is looking for vehicle most. The second is 36-45 year old with the ratio of 27.9%.
This show that new generation people have an intention to purchase vehicle more than
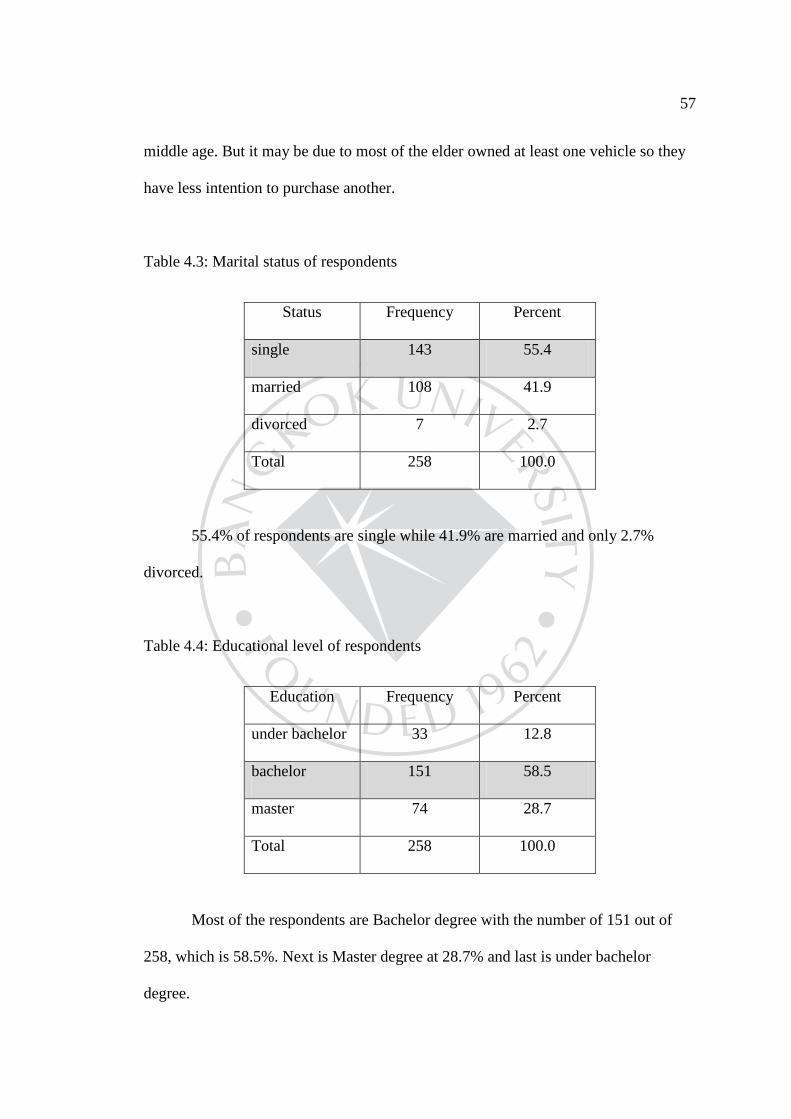
57
middle age. But it may be due to most of the elder owned at least one vehicle so they
have less intention to purchase another.
Table 4.3: Marital status of respondents
Status Frequency Percent
single 143 55.4
married 108 41.9
divorced 7 2.7
Total 258 100.0
55.4% of respondents are single while 41.9% are married and only 2.7%
divorced.
Table 4.4: Educational level of respondents
Education Frequency Percent
under bachelor 33 12.8
bachelor 151 58.5
master 74 28.7
Total 258 100.0
Most of the respondents are Bachelor degree with the number of 151 out of
258, which is 58.5%. Next is Master degree at 28.7% and last is under bachelor
degree.
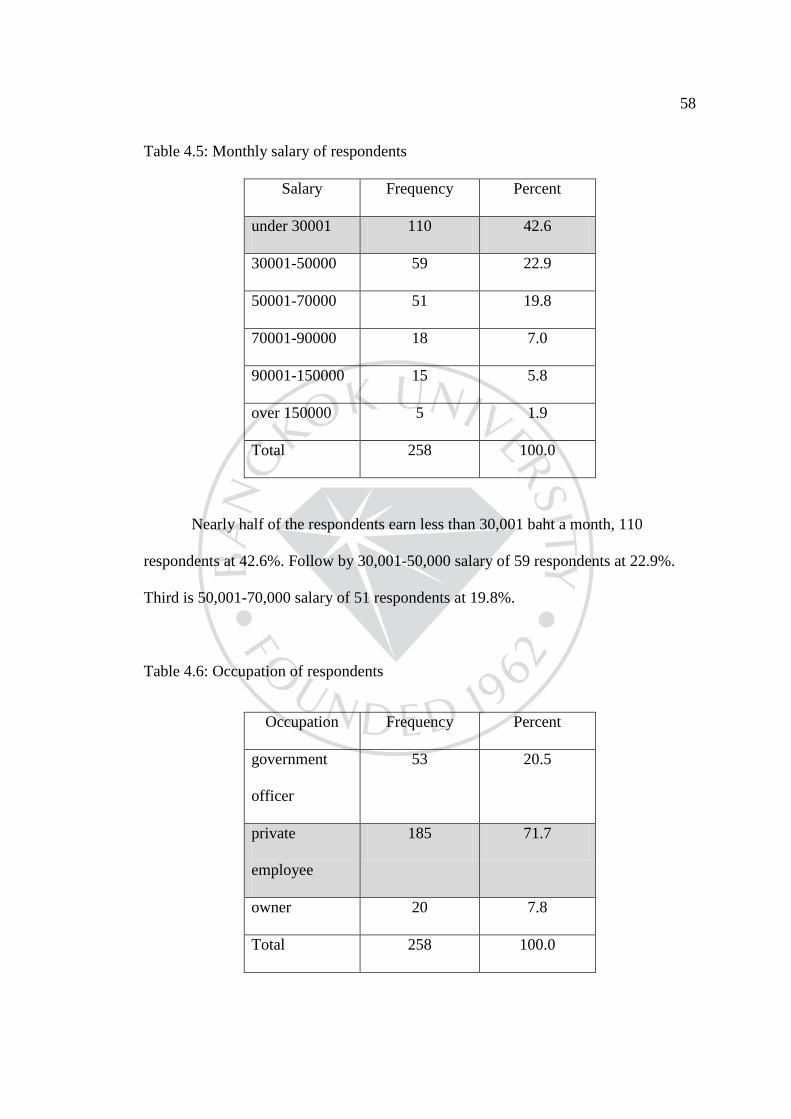
58
Table 4.5: Monthly salary of respondents
Salary Frequency Percent
under 30001 110 42.6
30001-50000 59 22.9
50001-70000 51 19.8
70001-90000 18 7.0
90001-150000 15 5.8
over 150000 5 1.9
Total 258 100.0
Nearly half of the respondents earn less than 30,001 baht a month, 110
respondents at 42.6%. Follow by 30,001-50,000 salary of 59 respondents at 22.9%.
Third is 50,001-70,000 salary of 51 respondents at 19.8%.
Table 4.6: Occupation of respondents
Occupation Frequency Percent
government
officer
53 20.5
private
employee
185 71.7
owner 20 7.8
Total 258 100.0
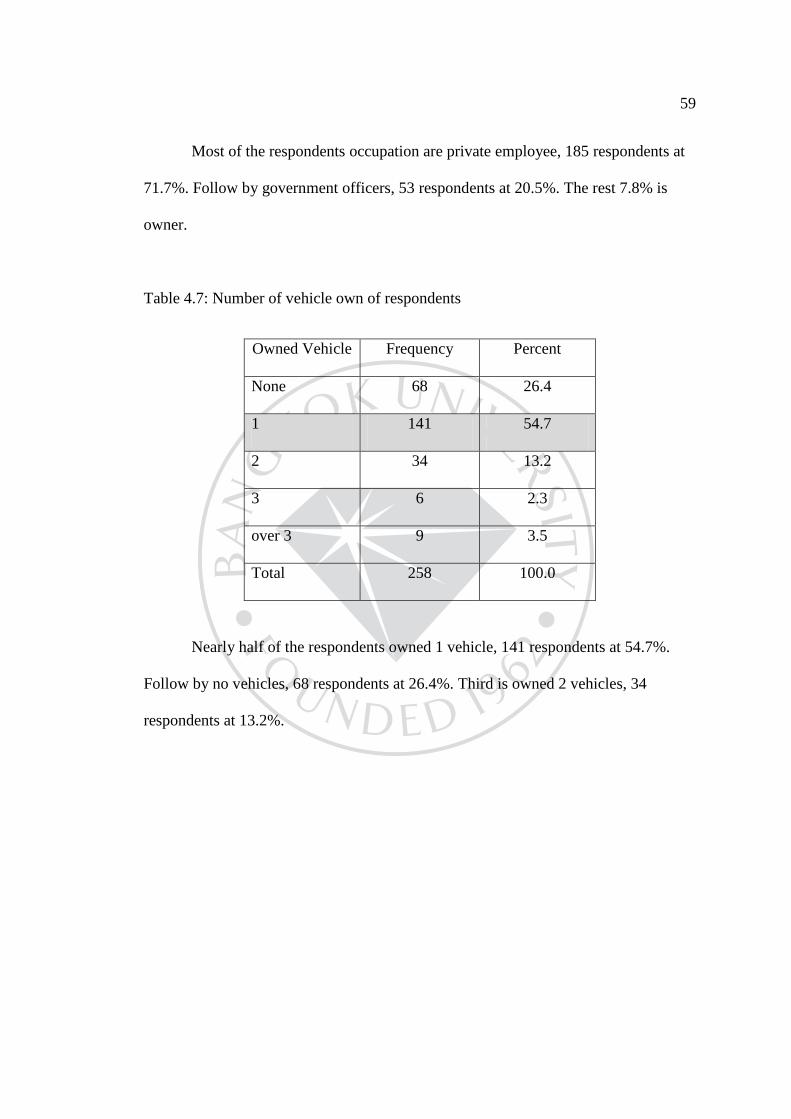
59
Most of the respondents occupation are private employee, 185 respondents at
71.7%. Follow by government officers, 53 respondents at 20.5%. The rest 7.8% is
owner.
Table 4.7: Number of vehicle own of respondents
Owned Vehicle Frequency Percent
None 68 26.4
1 141 54.7
2 34 13.2
3 6 2.3
over 3 9 3.5
Total 258 100.0
Nearly half of the respondents owned 1 vehicle, 141 respondents at 54.7%.
Follow by no vehicles, 68 respondents at 26.4%. Third is owned 2 vehicles, 34
respondents at 13.2%.
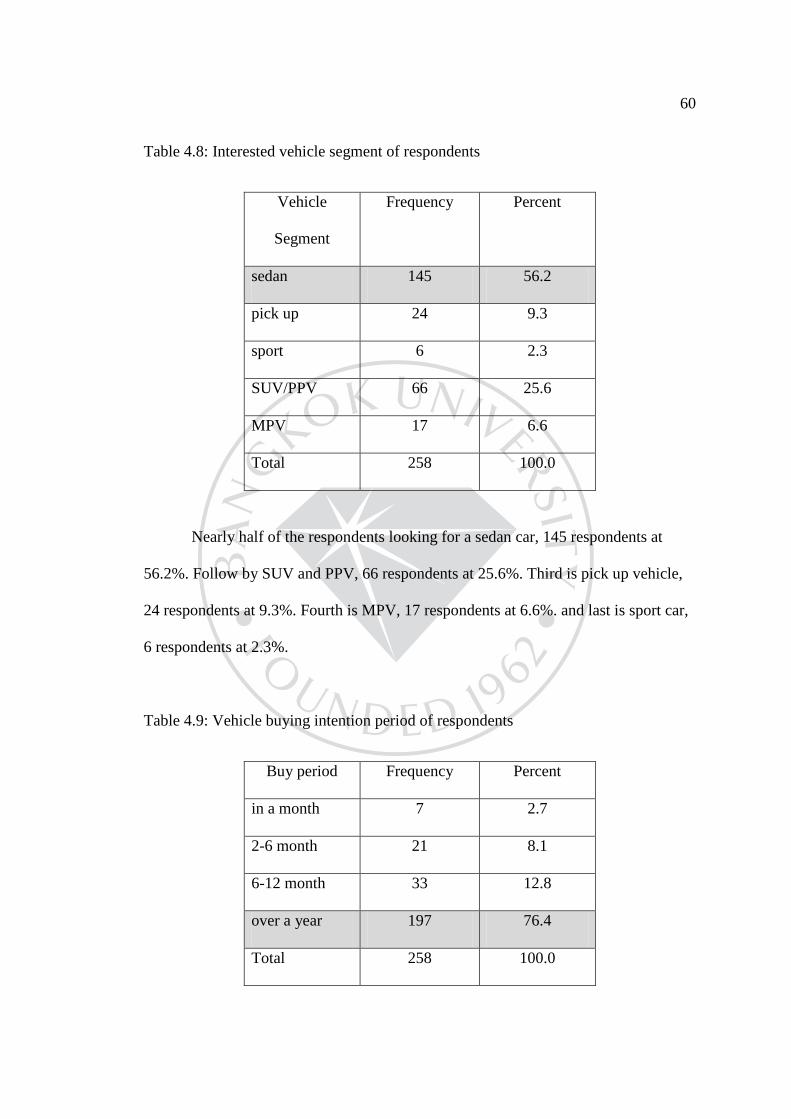
60
Table 4.8: Interested vehicle segment of respondents
Vehicle
Segment
Frequency Percent
sedan 145 56.2
pick up 24 9.3
sport 6 2.3
SUV/PPV 66 25.6
MPV 17 6.6
Total 258 100.0
Nearly half of the respondents looking for a sedan car, 145 respondents at
56.2%. Follow by SUV and PPV, 66 respondents at 25.6%. Third is pick up vehicle,
24 respondents at 9.3%. Fourth is MPV, 17 respondents at 6.6%. and last is sport car,
6 respondents at 2.3%.
Table 4.9: Vehicle buying intention period of respondents
Buy period Frequency Percent
in a month 7 2.7
2-6 month 21 8.1
6-12 month 33 12.8
over a year 197 76.4
Total 258 100.0
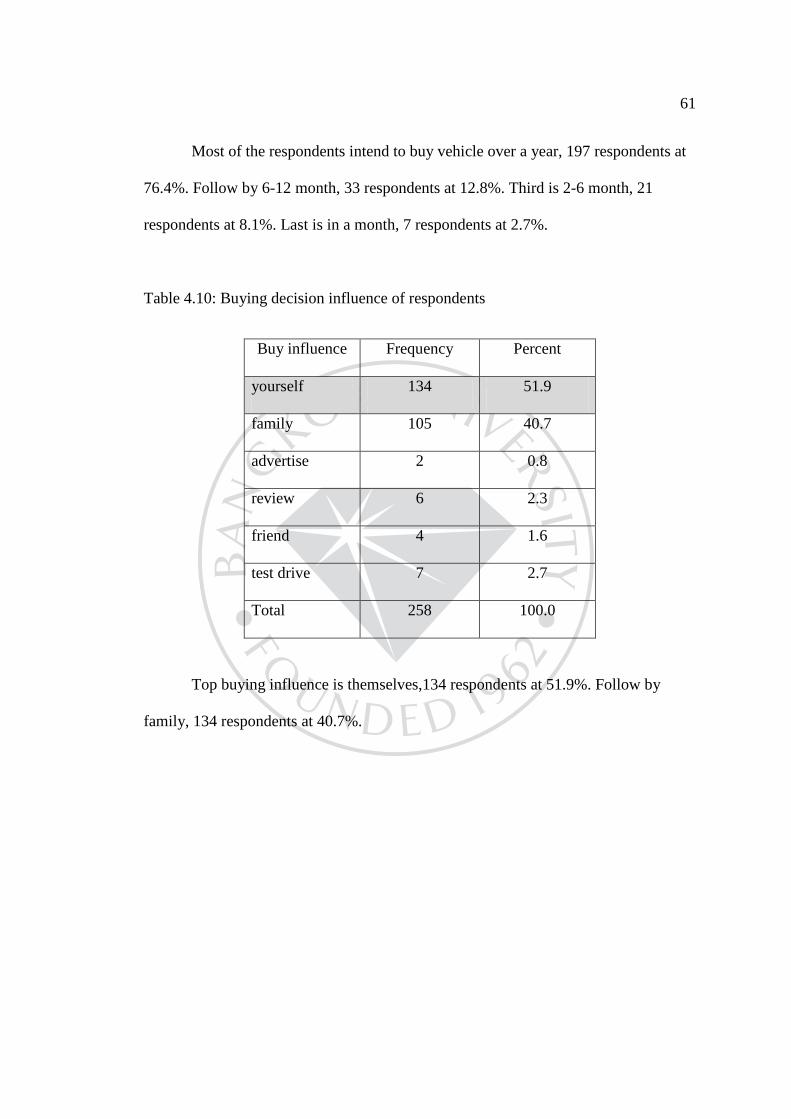
61
Most of the respondents intend to buy vehicle over a year, 197 respondents at
76.4%. Follow by 6-12 month, 33 respondents at 12.8%. Third is 2-6 month, 21
respondents at 8.1%. Last is in a month, 7 respondents at 2.7%.
Table 4.10: Buying decision influence of respondents
Buy influence Frequency Percent
yourself 134 51.9
family 105 40.7
advertise 2 0.8
review 6 2.3
friend 4 1.6
test drive 7 2.7
Total 258 100.0
Top buying influence is themselves,134 respondents at 51.9%. Follow by
family, 134 respondents at 40.7%.
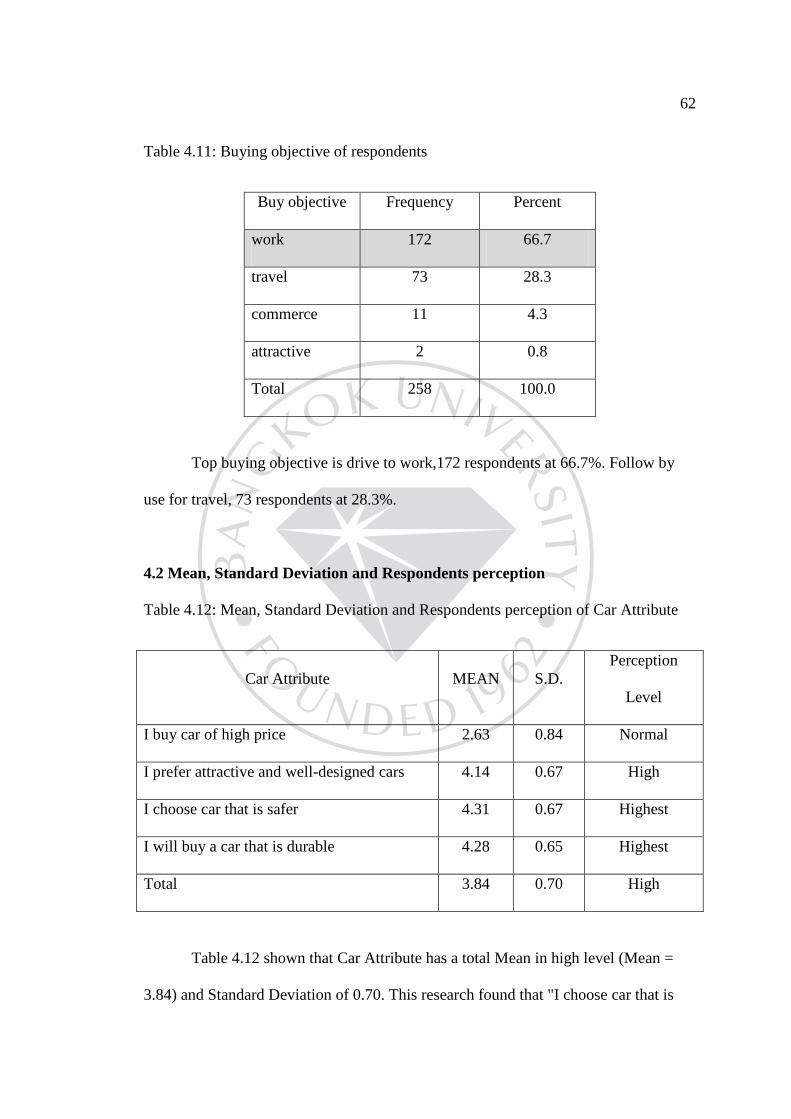
62
Table 4.11: Buying objective of respondents
Buy objective Frequency Percent
work 172 66.7
travel 73 28.3
commerce 11 4.3
attractive 2 0.8
Total 258 100.0
Top buying objective is drive to work,172 respondents at 66.7%. Follow by
use for travel, 73 respondents at 28.3%.
4.2 Mean, Standard Deviation and Respondents perception
Table 4.12: Mean, Standard Deviation and Respondents perception of Car Attribute
Car Attribute MEAN S.D. Perception
Level
I buy car of high price 2.63 0.84 Normal
I prefer attractive and well-designed cars 4.14 0.67 High
I choose car that is safer 4.31 0.67 Highest
I will buy a car that is durable 4.28 0.65 Highest
Total 3.84 0.70 High
Table 4.12 shown that Car Attribute has a total Mean in high level (Mean =
3.84) and Standard Deviation of 0.70. This research found that "I choose car that is
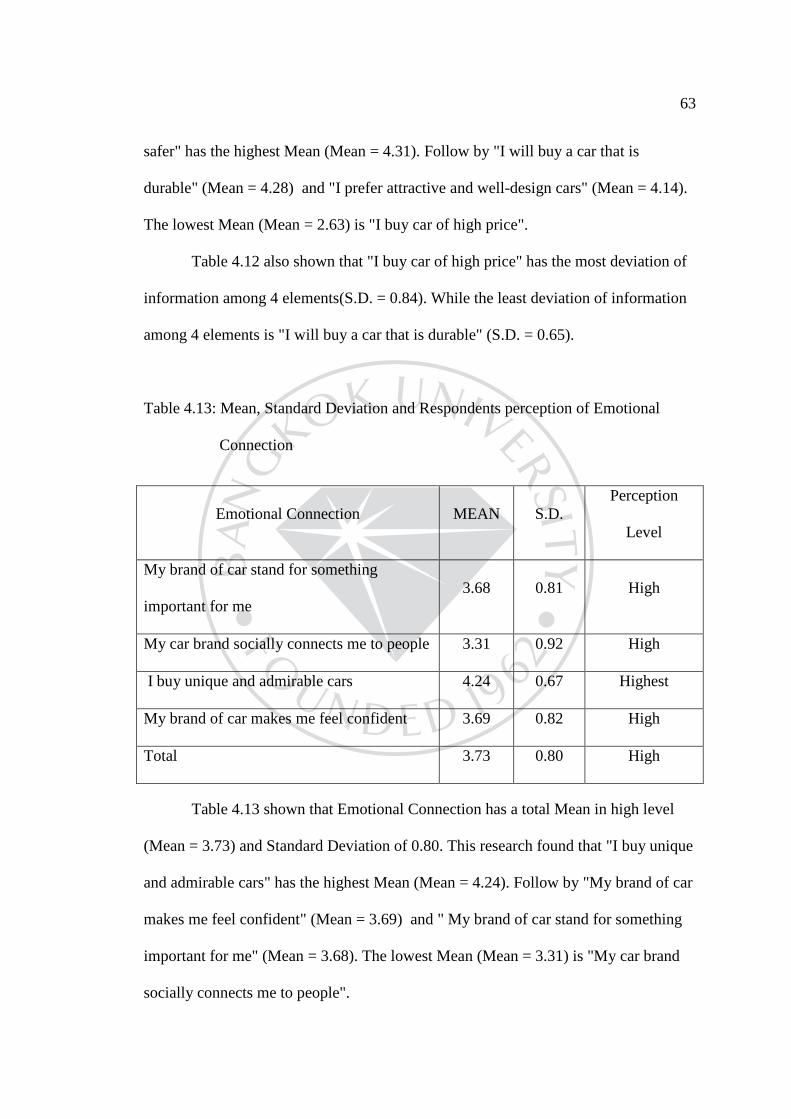
63
safer" has the highest Mean (Mean = 4.31). Follow by "I will buy a car that is
durable" (Mean = 4.28) and "I prefer attractive and well-design cars" (Mean = 4.14).
The lowest Mean (Mean = 2.63) is "I buy car of high price".
Table 4.12 also shown that "I buy car of high price" has the most deviation of
information among 4 elements(S.D. = 0.84). While the least deviation of information
among 4 elements is "I will buy a car that is durable" (S.D. = 0.65).
Table 4.13: Mean, Standard Deviation and Respondents perception of Emotional
Connection
Emotional Connection MEAN S.D. Perception
Level
My brand of car stand for something
important for me 3.68 0.81 High
My car brand socially connects me to people 3.31 0.92 High
I buy unique and admirable cars 4.24 0.67 Highest
My brand of car makes me feel confident 3.69 0.82 High
Total 3.73 0.80 High
Table 4.13 shown that Emotional Connection has a total Mean in high level
(Mean = 3.73) and Standard Deviation of 0.80. This research found that "I buy unique
and admirable cars" has the highest Mean (Mean = 4.24). Follow by "My brand of car
makes me feel confident" (Mean = 3.69) and " My brand of car stand for something
important for me" (Mean = 3.68). The lowest Mean (Mean = 3.31) is "My car brand
socially connects me to people".
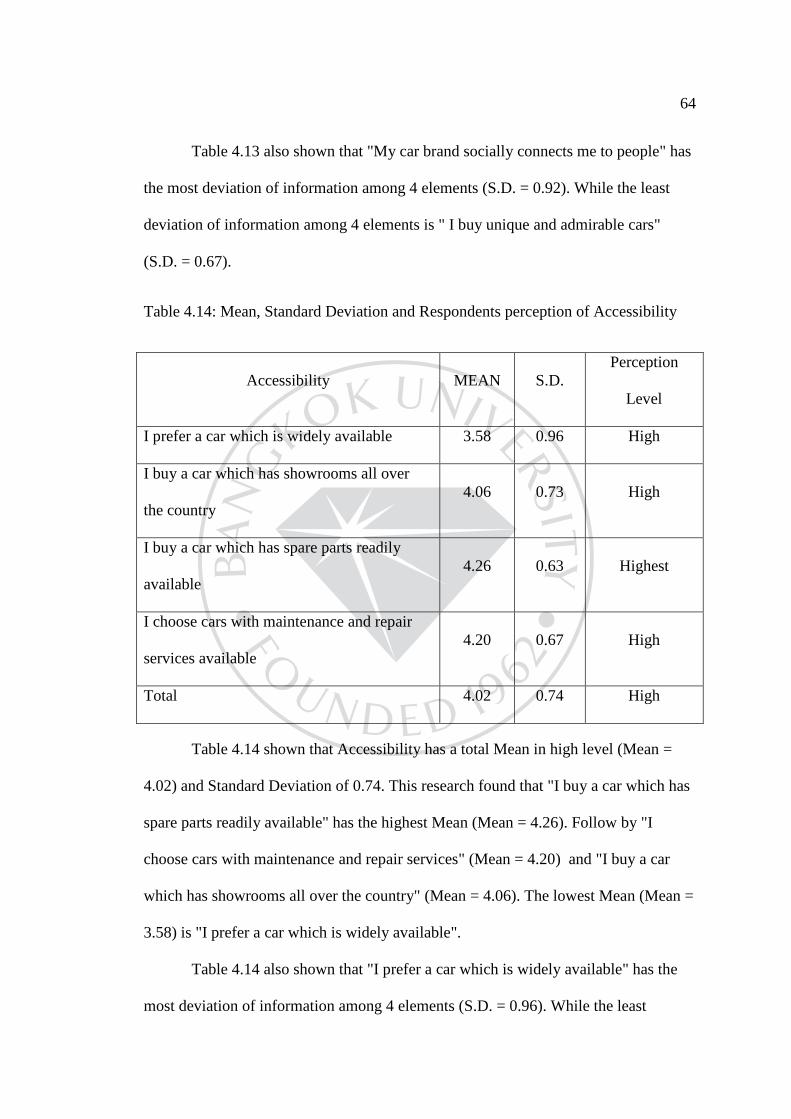
64
Table 4.13 also shown that "My car brand socially connects me to people" has
the most deviation of information among 4 elements (S.D. = 0.92). While the least
deviation of information among 4 elements is " I buy unique and admirable cars"
(S.D. = 0.67).
Table 4.14: Mean, Standard Deviation and Respondents perception of Accessibility
Accessibility MEAN S.D. Perception
Level
I prefer a car which is widely available 3.58 0.96 High
I buy a car which has showrooms all over
the country 4.06 0.73 High
I buy a car which has spare parts readily
available 4.26 0.63 Highest
I choose cars with maintenance and repair
services available 4.20 0.67 High
Total 4.02 0.74 High
Table 4.14 shown that Accessibility has a total Mean in high level (Mean =
4.02) and Standard Deviation of 0.74. This research found that "I buy a car which has
spare parts readily available" has the highest Mean (Mean = 4.26). Follow by "I
choose cars with maintenance and repair services" (Mean = 4.20) and "I buy a car
which has showrooms all over the country" (Mean = 4.06). The lowest Mean (Mean =
3.58) is "I prefer a car which is widely available".
Table 4.14 also shown that "I prefer a car which is widely available" has the
most deviation of information among 4 elements (S.D. = 0.96). While the least
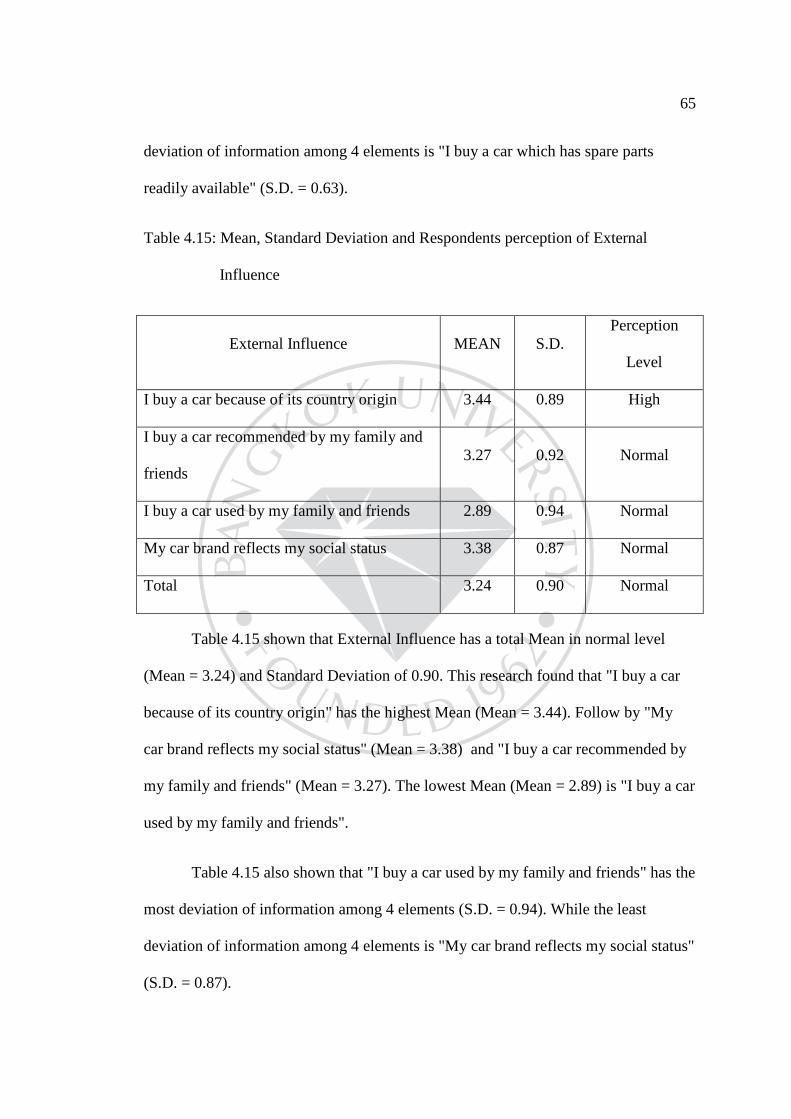
65
deviation of information among 4 elements is "I buy a car which has spare parts
readily available" (S.D. = 0.63).
Table 4.15: Mean, Standard Deviation and Respondents perception of External
Influence
External Influence MEAN S.D. Perception
Level
I buy a car because of its country origin 3.44 0.89 High
I buy a car recommended by my family and
friends 3.27 0.92 Normal
I buy a car used by my family and friends 2.89 0.94 Normal
My car brand reflects my social status 3.38 0.87 Normal
Total 3.24 0.90 Normal
Table 4.15 shown that External Influence has a total Mean in normal level
(Mean = 3.24) and Standard Deviation of 0.90. This research found that "I buy a car
because of its country origin" has the highest Mean (Mean = 3.44). Follow by "My
car brand reflects my social status" (Mean = 3.38) and "I buy a car recommended by
my family and friends" (Mean = 3.27). The lowest Mean (Mean = 2.89) is "I buy a car
used by my family and friends".
Table 4.15 also shown that "I buy a car used by my family and friends" has the
most deviation of information among 4 elements (S.D. = 0.94). While the least
deviation of information among 4 elements is "My car brand reflects my social status"
(S.D. = 0.87).
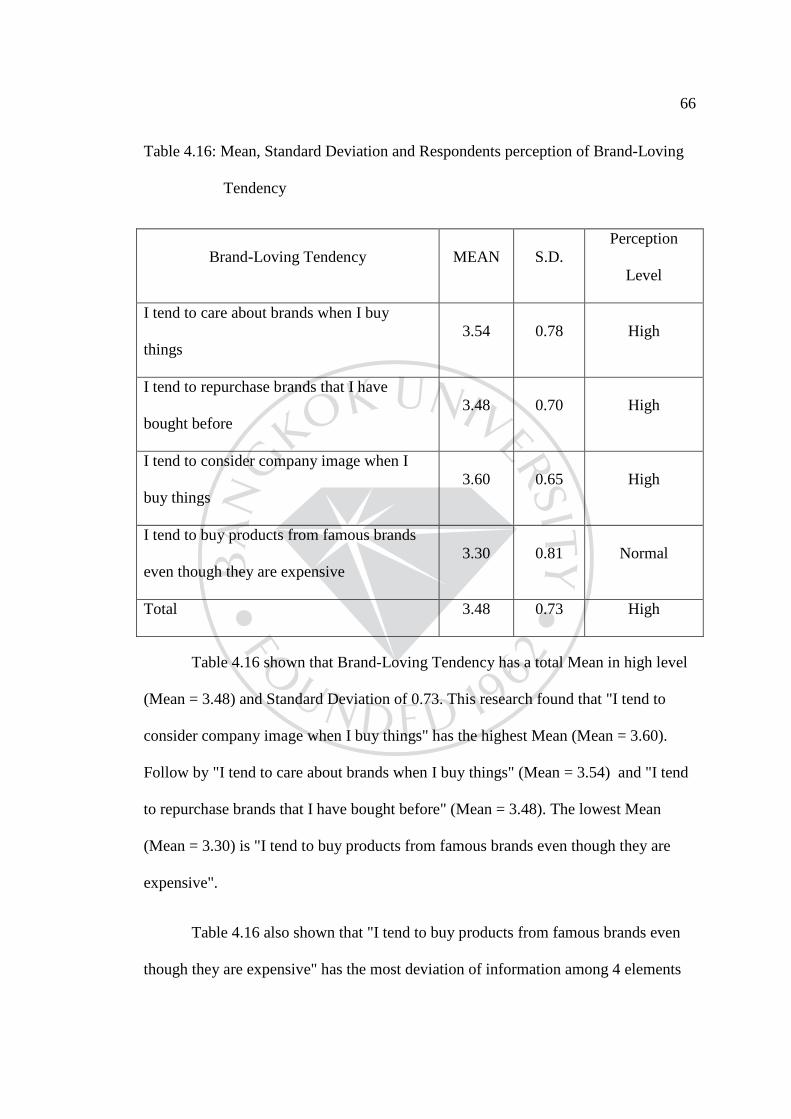
66
Table 4.16: Mean, Standard Deviation and Respondents perception of Brand-Loving
Tendency
Brand-Loving Tendency MEAN S.D. Perception
Level
I tend to care about brands when I buy
things 3.54 0.78 High
I tend to repurchase brands that I have
bought before 3.48 0.70 High
I tend to consider company image when I
buy things 3.60 0.65 High
I tend to buy products from famous brands
even though they are expensive 3.30 0.81 Normal
Total 3.48 0.73 High
Table 4.16 shown that Brand-Loving Tendency has a total Mean in high level
(Mean = 3.48) and Standard Deviation of 0.73. This research found that "I tend to
consider company image when I buy things" has the highest Mean (Mean = 3.60).
Follow by "I tend to care about brands when I buy things" (Mean = 3.54) and "I tend
to repurchase brands that I have bought before" (Mean = 3.48). The lowest Mean
(Mean = 3.30) is "I tend to buy products from famous brands even though they are
expensive".
Table 4.16 also shown that "I tend to buy products from famous brands even
though they are expensive" has the most deviation of information among 4 elements
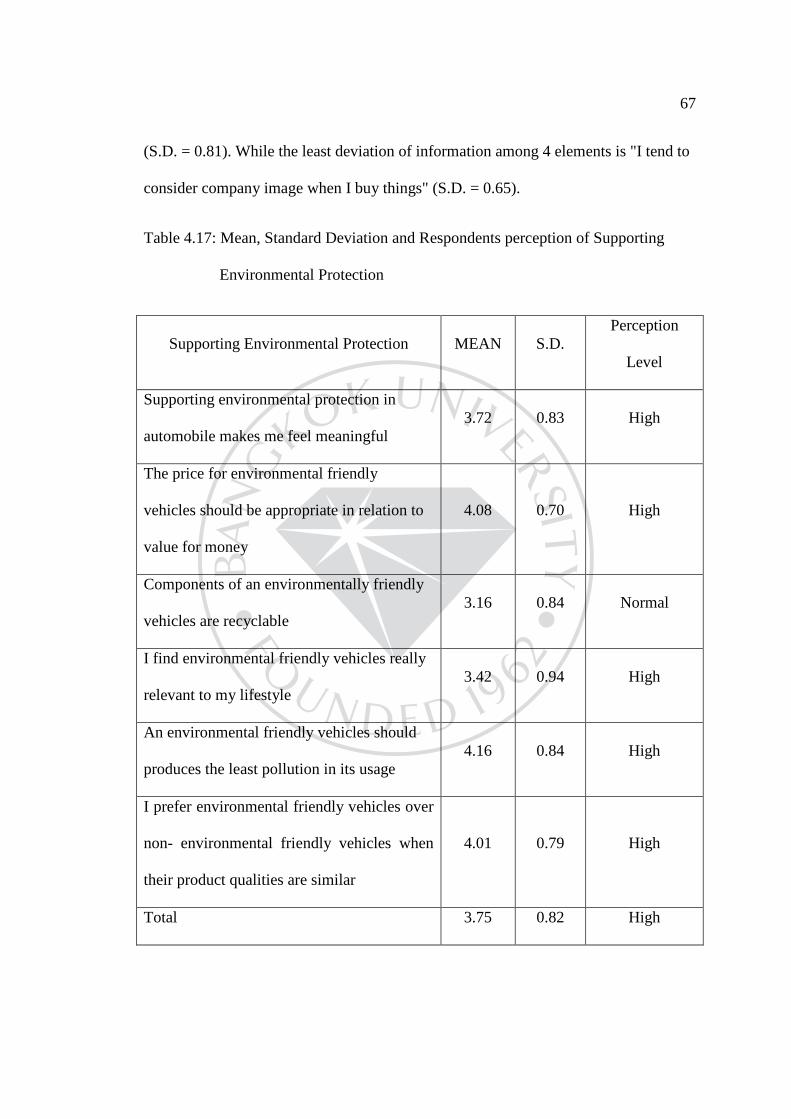
67
(S.D. = 0.81). While the least deviation of information among 4 elements is "I tend to
consider company image when I buy things" (S.D. = 0.65).
Table 4.17: Mean, Standard Deviation and Respondents perception of Supporting
Environmental Protection
Supporting Environmental Protection MEAN S.D. Perception
Level
Supporting environmental protection in
automobile makes me feel meaningful 3.72 0.83 High
The price for environmental friendly
vehicles should be appropriate in relation to
value for money
4.08 0.70 High
Components of an environmentally friendly
vehicles are recyclable 3.16 0.84 Normal
I find environmental friendly vehicles really
relevant to my lifestyle 3.42 0.94 High
An environmental friendly vehicles should
produces the least pollution in its usage 4.16 0.84 High
I prefer environmental friendly vehicles over
non- environmental friendly vehicles when
their product qualities are similar
4.01 0.79 High
Total 3.75 0.82 High
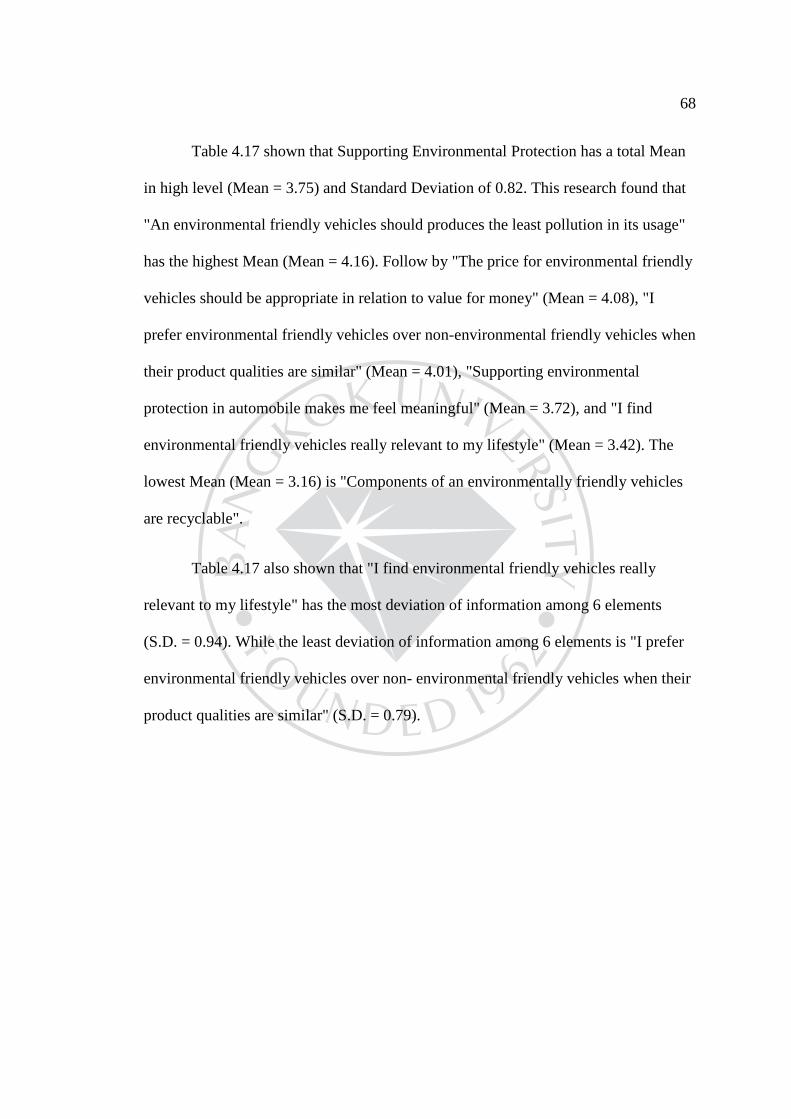
68
Table 4.17 shown that Supporting Environmental Protection has a total Mean
in high level (Mean = 3.75) and Standard Deviation of 0.82. This research found that
"An environmental friendly vehicles should produces the least pollution in its usage"
has the highest Mean (Mean = 4.16). Follow by "The price for environmental friendly
vehicles should be appropriate in relation to value for money" (Mean = 4.08), "I
prefer environmental friendly vehicles over non-environmental friendly vehicles when
their product qualities are similar" (Mean = 4.01), "Supporting environmental
protection in automobile makes me feel meaningful" (Mean = 3.72), and "I find
environmental friendly vehicles really relevant to my lifestyle" (Mean = 3.42). The
lowest Mean (Mean = 3.16) is "Components of an environmentally friendly vehicles
are recyclable".
Table 4.17 also shown that "I find environmental friendly vehicles really
relevant to my lifestyle" has the most deviation of information among 6 elements
(S.D. = 0.94). While the least deviation of information among 6 elements is "I prefer
environmental friendly vehicles over non- environmental friendly vehicles when their
product qualities are similar" (S.D. = 0.79).
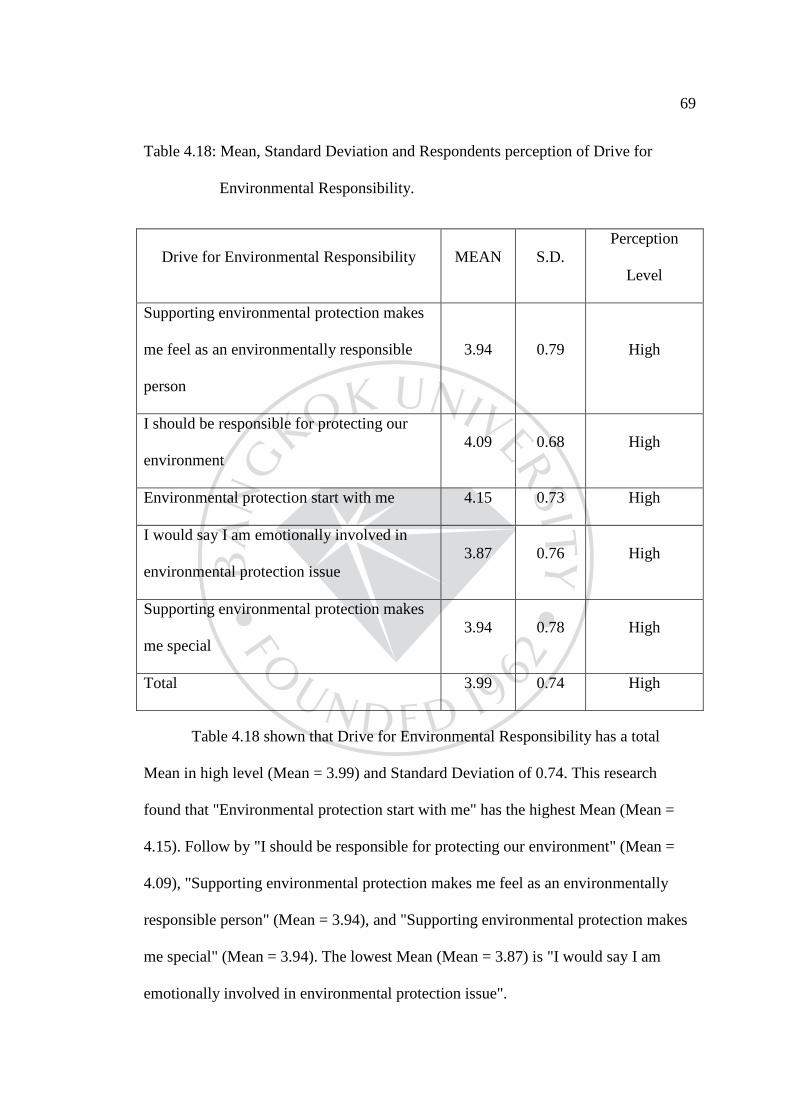
69
Table 4.18: Mean, Standard Deviation and Respondents perception of Drive for
Environmental Responsibility.
Drive for Environmental Responsibility MEAN S.D.Perception
Level
Supporting environmental protection makes
me feel as an environmentally responsible
person
3.94 0.79 High
I should be responsible for protecting our
environment 4.09 0.68 High
Environmental protection start with me 4.15 0.73 High
I would say I am emotionally involved in
environmental protection issue 3.87 0.76 High
Supporting environmental protection makes
me special 3.94 0.78 High
Total 3.99 0.74 High
Table 4.18 shown that Drive for Environmental Responsibility has a total
Mean in high level (Mean = 3.99) and Standard Deviation of 0.74. This research
found that "Environmental protection start with me" has the highest Mean (Mean =
4.15). Follow by "I should be responsible for protecting our environment" (Mean =
4.09), "Supporting environmental protection makes me feel as an environmentally
responsible person" (Mean = 3.94), and "Supporting environmental protection makes
me special" (Mean = 3.94). The lowest Mean (Mean = 3.87) is "I would say I am
emotionally involved in environmental protection issue".
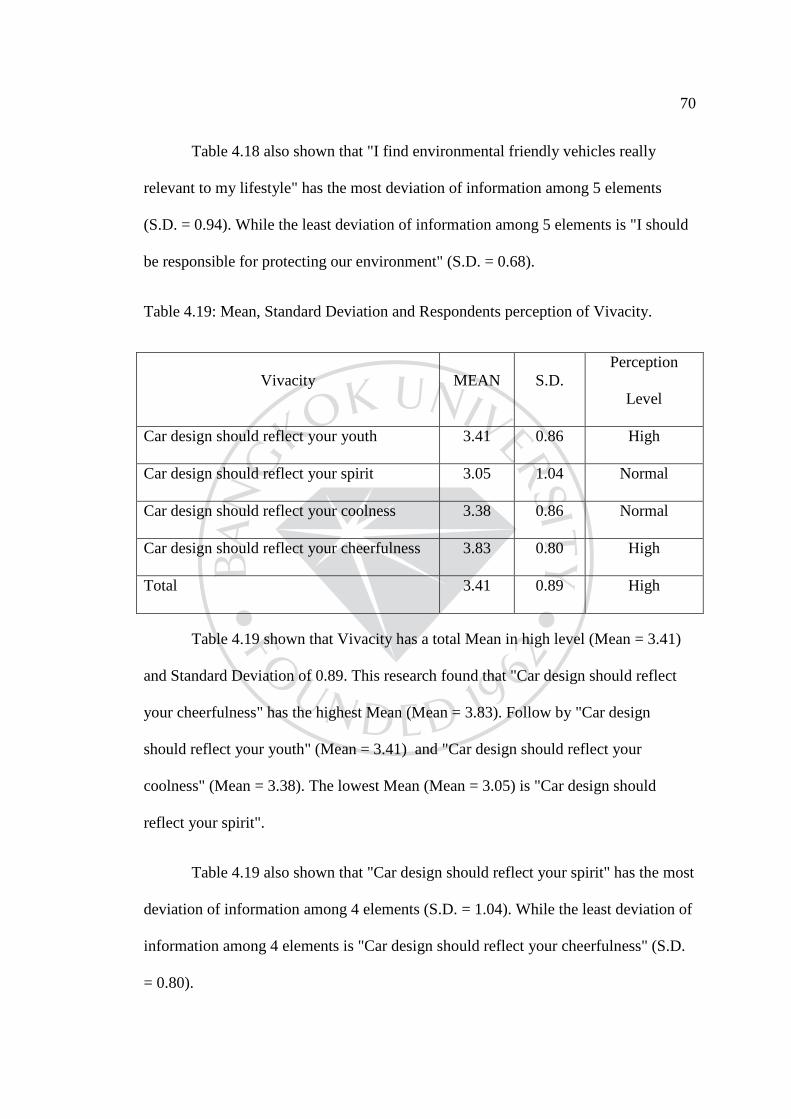
70
Table 4.18 also shown that "I find environmental friendly vehicles really
relevant to my lifestyle" has the most deviation of information among 5 elements
(S.D. = 0.94). While the least deviation of information among 5 elements is "I should
be responsible for protecting our environment" (S.D. = 0.68).
Table 4.19: Mean, Standard Deviation and Respondents perception of Vivacity.
Vivacity MEAN S.D.Perception
Level
Car design should reflect your youth 3.41 0.86 High
Car design should reflect your spirit 3.05 1.04 Normal
Car design should reflect your coolness 3.38 0.86 Normal
Car design should reflect your cheerfulness 3.83 0.80 High
Total 3.41 0.89 High
Table 4.19 shown that Vivacity has a total Mean in high level (Mean = 3.41)
and Standard Deviation of 0.89. This research found that "Car design should reflect
your cheerfulness" has the highest Mean (Mean = 3.83). Follow by "Car design
should reflect your youth" (Mean = 3.41) and "Car design should reflect your
coolness" (Mean = 3.38). The lowest Mean (Mean = 3.05) is "Car design should
reflect your spirit".
Table 4.19 also shown that "Car design should reflect your spirit" has the most
deviation of information among 4 elements (S.D. = 1.04). While the least deviation of
information among 4 elements is "Car design should reflect your cheerfulness" (S.D.
= 0.80).
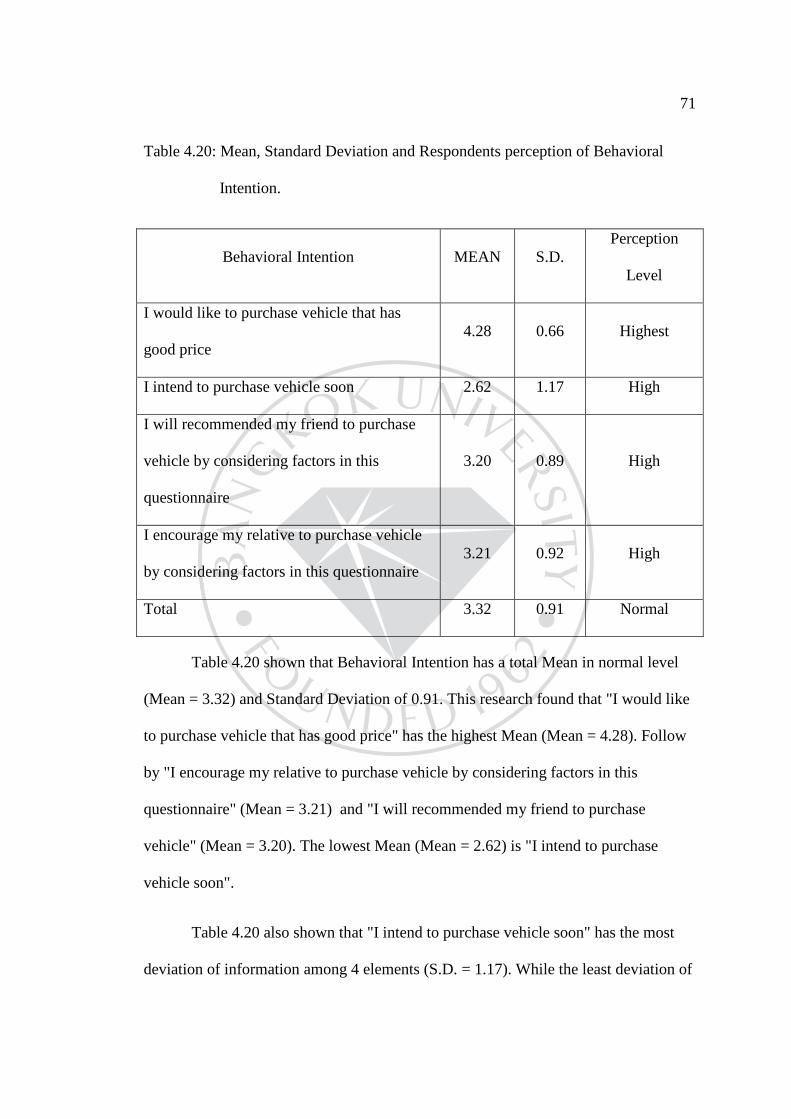
71
Table 4.20: Mean, Standard Deviation and Respondents perception of Behavioral
Intention.
Behavioral Intention MEAN S.D. Perception
Level
I would like to purchase vehicle that has
good price 4.28 0.66 Highest
I intend to purchase vehicle soon 2.62 1.17 High
I will recommended my friend to purchase
vehicle by considering factors in this
questionnaire
3.20 0.89 High
I encourage my relative to purchase vehicle
by considering factors in this questionnaire 3.21 0.92 High
Total 3.32 0.91 Normal
Table 4.20 shown that Behavioral Intention has a total Mean in normal level
(Mean = 3.32) and Standard Deviation of 0.91. This research found that "I would like
to purchase vehicle that has good price" has the highest Mean (Mean = 4.28). Follow
by "I encourage my relative to purchase vehicle by considering factors in this
questionnaire" (Mean = 3.21) and "I will recommended my friend to purchase
vehicle" (Mean = 3.20). The lowest Mean (Mean = 2.62) is "I intend to purchase
vehicle soon".
Table 4.20 also shown that "I intend to purchase vehicle soon" has the most
deviation of information among 4 elements (S.D. = 1.17). While the least deviation of
72
information among 4 elements is "I would like to purchase vehicle that has good
price" (S.D. = 0.66).
4.3 Analysis of the data based on assumptions
Consists of Car Attributes, Emotional Connection, Accessibility, External
Influence, Brand-Loving Tendency, Supporting Environmental Protection, Drive For
Environmental Protection, Vivacity, and Behavioral Intention
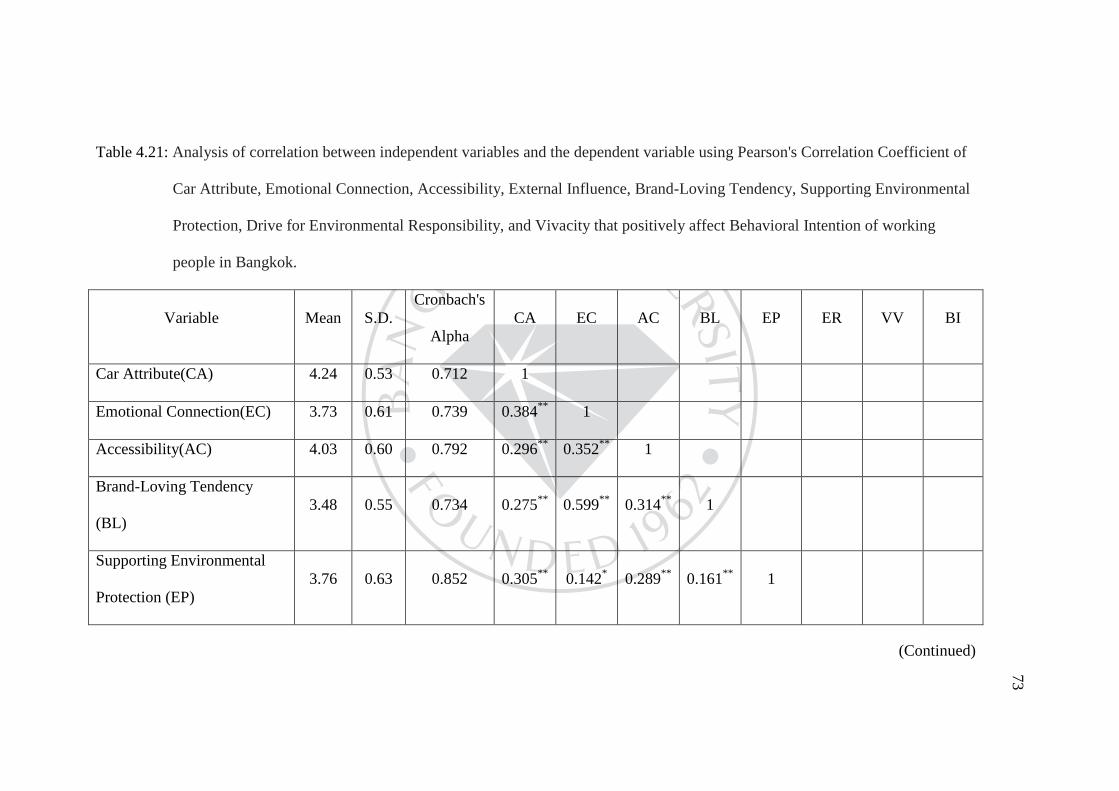
73
Table 4.21: Analysis of correlation between independent variables and the dependent variable using Pearson's Correlation Coefficient of
Car Attribute, Emotional Connection, Accessibility, External Influence, Brand-Loving Tendency, Supporting Environmental
Protection, Drive for Environmental Responsibility, and Vivacity that positively affect Behavioral Intention of working
people in Bangkok.
Variable Mean S.D. Cronbach's
Alpha CA EC AC BL EP ER VV BI
Car Attribute(CA) 4.24 0.53 0.712 1
Emotional Connection(EC) 3.73 0.61 0.739 0.384** 1
Accessibility(AC) 4.03 0.60 0.792 0.296** 0.352** 1
Brand-Loving Tendency
(BL) 3.48 0.55 0.734 0.275** 0.599** 0.314** 1
Supporting Environmental
Protection (EP) 3.76 0.63 0.852 0.305** 0.142* 0.289** 0.161** 1
(Continued)
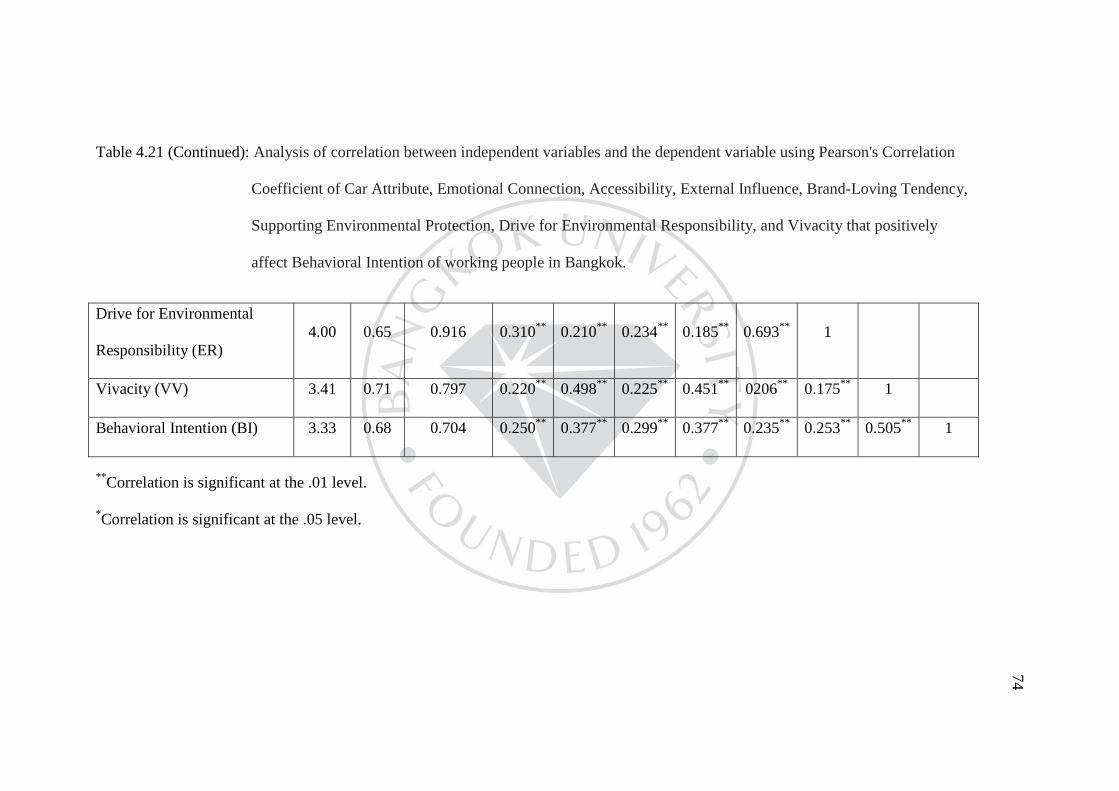
74
Table 4.21 (Continued): Analysis of correlation between independent variables and the dependent variable using Pearson's Correlation
Coefficient of Car Attribute, Emotional Connection, Accessibility, External Influence, Brand-Loving Tendency,
Supporting Environmental Protection, Drive for Environmental Responsibility, and Vivacity that positively
affect Behavioral Intention of working people in Bangkok.
Drive for Environmental
Responsibility (ER) 4.00 0.65 0.916 0.310** 0.210** 0.234** 0.185** 0.693** 1
Vivacity (VV) 3.41 0.71 0.797 0.220** 0.498** 0.225** 0.451** 0206** 0.175** 1
Behavioral Intention (BI) 3.33 0.68 0.704 0.250** 0.377** 0.299** 0.377** 0.235** 0.253** 0.505** 1
**Correlation is significant at the .01 level.
*Correlation is significant at the .05 level.
75
From table 4.21: Hypothesis can be explain as
Hypothesis 1, Car Attribute factor has a positive relationship toward
Behavioral Intention or not. The result from the analysis show that Car Attribute has a
positive relationship toward Behavioral Intention (Pearson's Correlation = 0.250) at
0.01 significant level.
Hypothesis 2, Emotional Connection factor has a positive relationship toward
Behavioral Intention or not. The result from the analysis show that Emotional
Connection has a positive relationship toward Behavioral Intention (Pearson's
Correlation = 0.377) at 0.01 significant level.
Hypothesis 3, Accessibility factor has a positive relationship toward
Behavioral Intention or not. The result from the analysis show that Accessibility has a
positive relationship toward Behavioral Intention (Pearson's Correlation = 0.299) at
0.01 significant level.
Hypothesis 4, Brand-Loving Tendency factor has a positive relationship
toward Behavioral Intention or not. The result from the analysis show that Brand-
Loving Tendency has a positive relationship toward Behavioral Intention (Pearson's
Correlation = 0.377) at 0.01 significant level.
Hypothesis 5, Supporting Environmental Protection factor has a positive
relationship toward Behavioral Intention or not. The result from the analysis show
that Supporting Environmental Protection has a positive relationship toward
Behavioral Intention (Pearson's Correlation = 0.235) at 0.01 significant level.
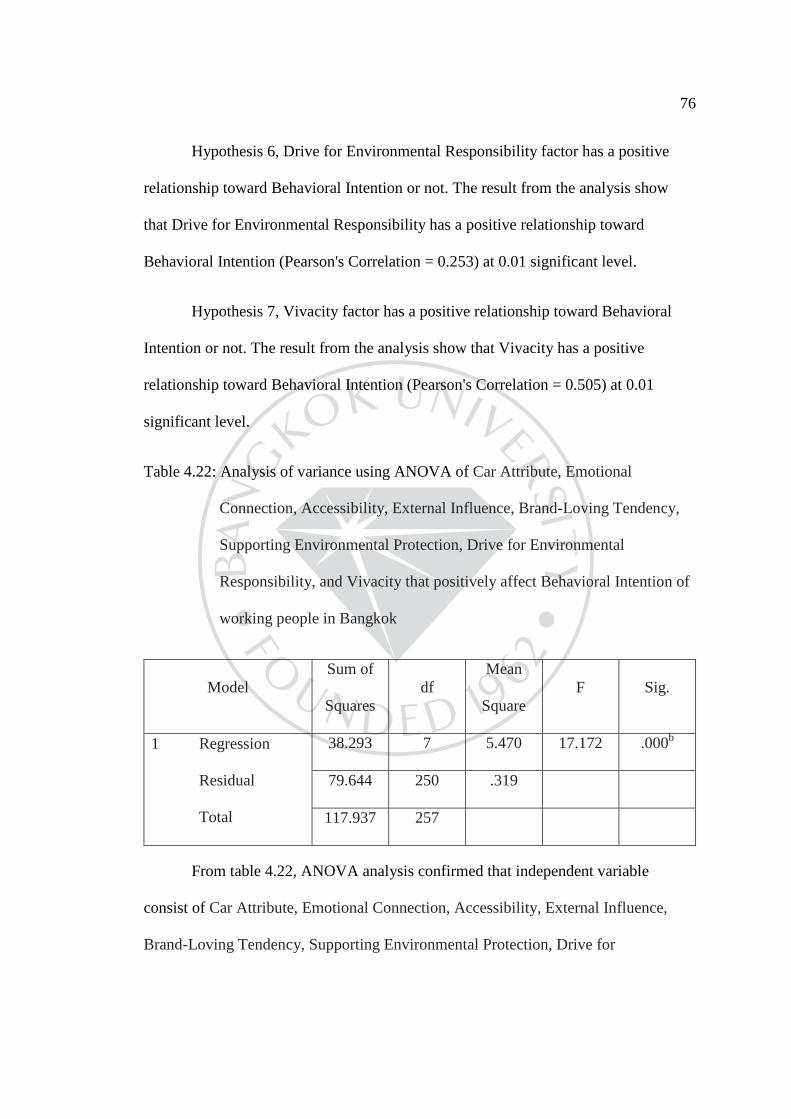
76
Hypothesis 6, Drive for Environmental Responsibility factor has a positive
relationship toward Behavioral Intention or not. The result from the analysis show
that Drive for Environmental Responsibility has a positive relationship toward
Behavioral Intention (Pearson's Correlation = 0.253) at 0.01 significant level.
Hypothesis 7, Vivacity factor has a positive relationship toward Behavioral
Intention or not. The result from the analysis show that Vivacity has a positive
relationship toward Behavioral Intention (Pearson's Correlation = 0.505) at 0.01
significant level.
Table 4.22: Analysis of variance using ANOVA of Car Attribute, Emotional
Connection, Accessibility, External Influence, Brand-Loving Tendency,
Supporting Environmental Protection, Drive for Environmental
Responsibility, and Vivacity that positively affect Behavioral Intention of
working people in Bangkok
Model Sum of
Squares df
Mean
Square F Sig.
1 Regression
Residual
Total
38.293 7 5.470 17.172 .000b
79.644 250 .319
117.937 257
From table 4.22, ANOVA analysis confirmed that independent variable
consist of Car Attribute, Emotional Connection, Accessibility, External Influence,
Brand-Loving Tendency, Supporting Environmental Protection, Drive for
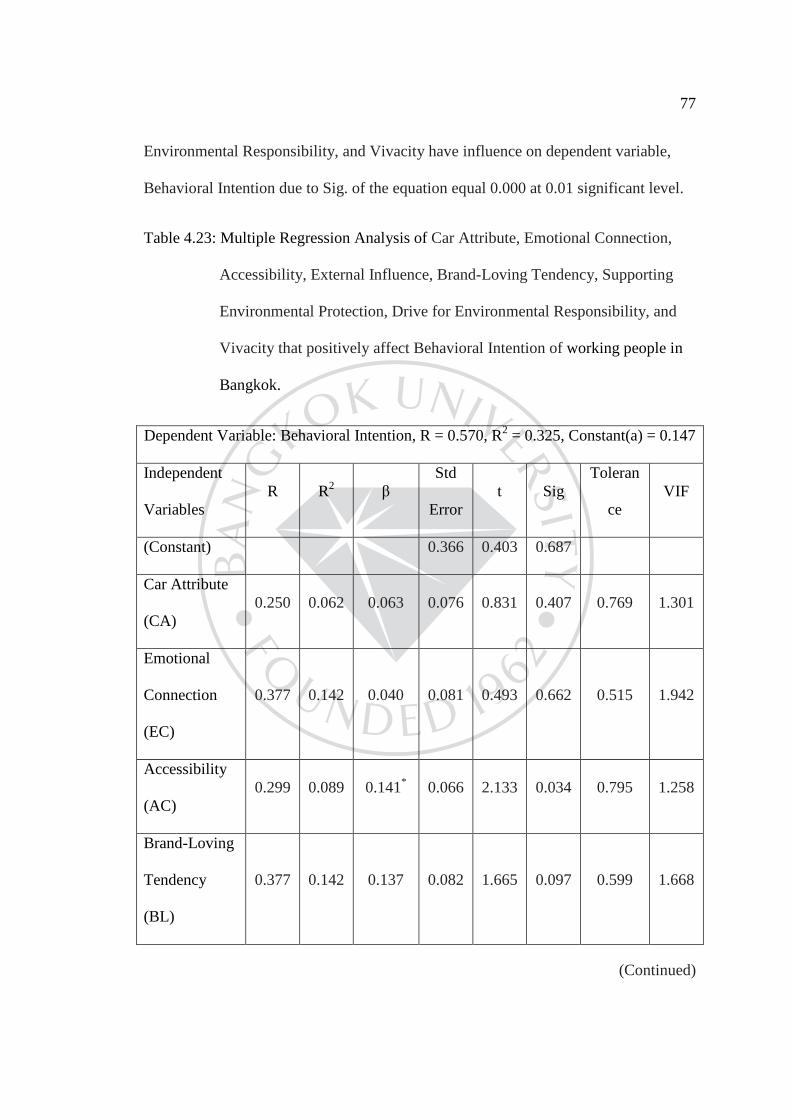
77
Environmental Responsibility, and Vivacity have influence on dependent variable,
Behavioral Intention due to Sig. of the equation equal 0.000 at 0.01 significant level.
Table 4.23: Multiple Regression Analysis of Car Attribute, Emotional Connection,
Accessibility, External Influence, Brand-Loving Tendency, Supporting
Environmental Protection, Drive for Environmental Responsibility, and
Vivacity that positively affect Behavioral Intention of working people in
Bangkok.
Dependent Variable: Behavioral Intention, R = 0.570, R2 = 0.325, Constant(a) = 0.147
Independent
Variables R R2 β
Std
Error t Sig
Toleran
ce VIF
(Constant) 0.366 0.403 0.687
Car Attribute
(CA) 0.250 0.062 0.063 0.076 0.831 0.407 0.769 1.301
Emotional
Connection
(EC)
0.377 0.142 0.040 0.081 0.493 0.662 0.515 1.942
Accessibility
(AC) 0.299 0.089 0.141* 0.066 2.133 0.034 0.795 1.258
Brand-Loving
Tendency
(BL)
0.377 0.142 0.137 0.082 1.665 0.097 0.599 1.668
(Continued)
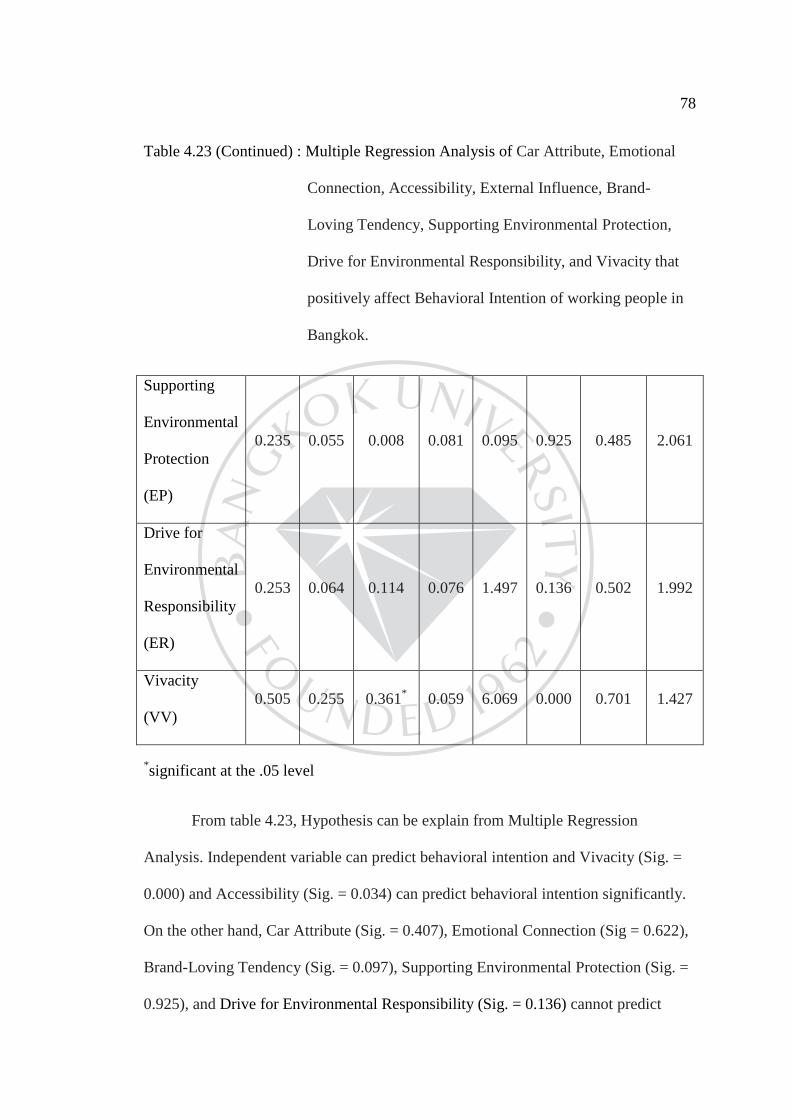
78
Table 4.23 (Continued) : Multiple Regression Analysis of Car Attribute, Emotional
Connection, Accessibility, External Influence, Brand-
Loving Tendency, Supporting Environmental Protection,
Drive for Environmental Responsibility, and Vivacity that
positively affect Behavioral Intention of working people in
Bangkok.
Supporting
Environmental
Protection
(EP)
0.235 0.055 0.008 0.081 0.095 0.925 0.485 2.061
Drive for
Environmental
Responsibility
(ER)
0.253 0.064 0.114 0.076 1.497 0.136 0.502 1.992
Vivacity
(VV) 0.505 0.255 0.361* 0.059 6.069 0.000 0.701 1.427
*significant at the .05 level
From table 4.23, Hypothesis can be explain from Multiple Regression
Analysis. Independent variable can predict behavioral intention and Vivacity (Sig. =
0.000) and Accessibility (Sig. = 0.034) can predict behavioral intention significantly.
On the other hand, Car Attribute (Sig. = 0.407), Emotional Connection (Sig = 0.622),
Brand-Loving Tendency (Sig. = 0.097), Supporting Environmental Protection (Sig. =
0.925), and Drive for Environmental Responsibility (Sig. = 0.136) cannot predict
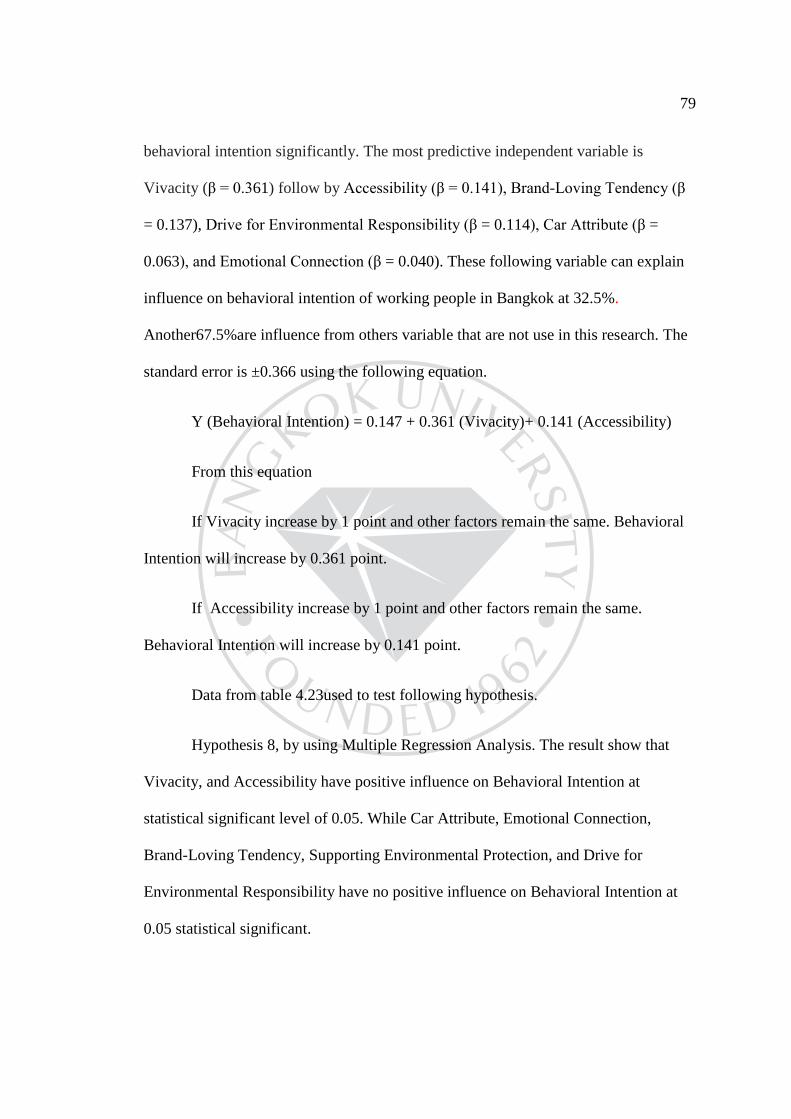
79
behavioral intention significantly. The most predictive independent variable is
Vivacity (β = 0.361) follow by Accessibility (β = 0.141), Brand-Loving Tendency (β
= 0.137), Drive for Environmental Responsibility (β = 0.114), Car Attribute (β =
0.063), and Emotional Connection (β = 0.040). These following variable can explain
influence on behavioral intention of working people in Bangkok at 32.5%.
Another67.5%are influence from others variable that are not use in this research. The
standard error is ±0.366 using the following equation.
Y (Behavioral Intention) = 0.147 + 0.361 (Vivacity)+ 0.141 (Accessibility)
From this equation
If Vivacity increase by 1 point and other factors remain the same. Behavioral
Intention will increase by 0.361 point.
If Accessibility increase by 1 point and other factors remain the same.
Behavioral Intention will increase by 0.141 point.
Data from table 4.23used to test following hypothesis.
Hypothesis 8, by using Multiple Regression Analysis. The result show that
Vivacity, and Accessibility have positive influence on Behavioral Intention at
statistical significant level of 0.05. While Car Attribute, Emotional Connection,
Brand-Loving Tendency, Supporting Environmental Protection, and Drive for
Environmental Responsibility have no positive influence on Behavioral Intention at
0.05 statistical significant.
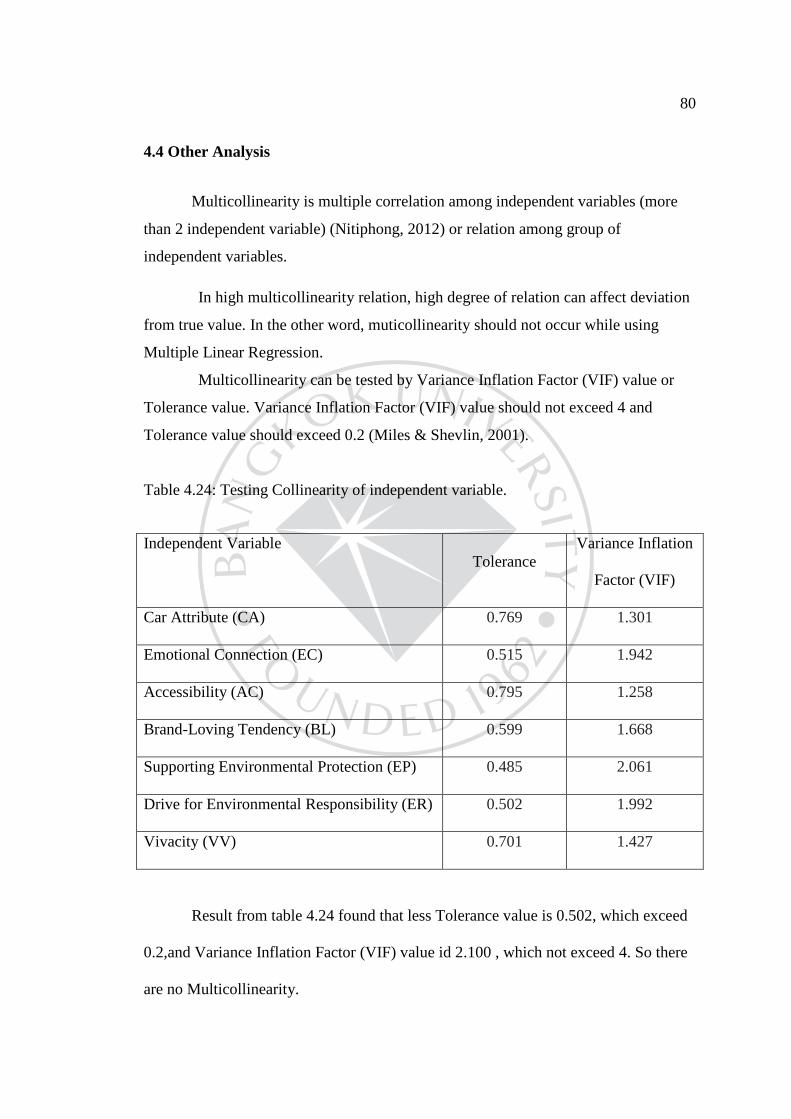
80
4.4 Other Analysis
Multicollinearity is multiple correlation among independent variables (more
than 2 independent variable) (Nitiphong, 2012) or relation among group of
independent variables.
In high multicollinearity relation, high degree of relation can affect deviation
from true value. In the other word, muticollinearity should not occur while using
Multiple Linear Regression.
Multicollinearity can be tested by Variance Inflation Factor (VIF) value or
Tolerance value. Variance Inflation Factor (VIF) value should not exceed 4 and
Tolerance value should exceed 0.2 (Miles & Shevlin, 2001).
Table 4.24: Testing Collinearity of independent variable.
Independent Variable Tolerance
Variance Inflation
Factor (VIF)
Car Attribute (CA) 0.769 1.301
Emotional Connection (EC) 0.515 1.942
Accessibility (AC) 0.795 1.258
Brand-Loving Tendency (BL) 0.599 1.668
Supporting Environmental Protection (EP) 0.485 2.061
Drive for Environmental Responsibility (ER) 0.502 1.992
Vivacity (VV) 0.701 1.427
Result from table 4.24 found that less Tolerance value is 0.502, which exceed
0.2,and Variance Inflation Factor (VIF) value id 2.100 , which not exceed 4. So there
are no Multicollinearity.
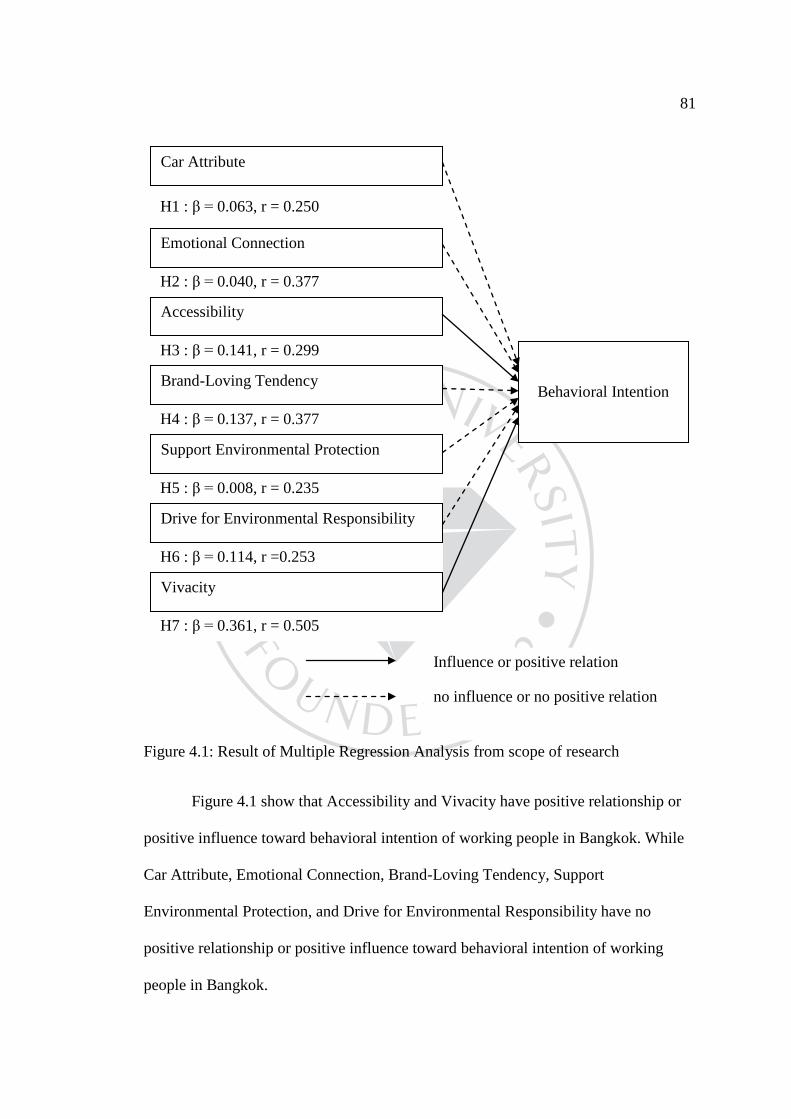
81
Figure 4.1: Result of Multiple Regression Analysis from scope of research
Figure 4.1 show that Accessibility and Vivacity have positive relationship or
positive influence toward behavioral intention of working people in Bangkok. While
Car Attribute, Emotional Connection, Brand-Loving Tendency, Support
Environmental Protection, and Drive for Environmental Responsibility have no
positive relationship or positive influence toward behavioral intention of working
people in Bangkok.
Influence or positive relation
no influence or no positive relation
H7 : β = 0.361, r = 0.505
H6 : β = 0.114, r =0.253
H5 : β = 0.008, r = 0.235
H4 : β = 0.137, r = 0.377
H3 : β = 0.141, r = 0.299
H2 : β = 0.040, r = 0.377
Emotional Connection
H1 : β = 0.063, r = 0.250
Car Attribute
Accessibility
Brand-Loving Tendency
Support Environmental Protection
Drive for Environmental Responsibility
Vivacity
Behavioral Intention
CHAPTER 5
CONCLUSIONS AND RECOMMENDATIONS
The research on the positive influence of car attributes, emotional connection,
accessibility, external Influence, brand-loving tendency, support environmental
protection, drive for environmental responsibility, and vivacity toward consumer
purchase intention of working people in Bangkok is a survey research using
questionnaires to collect data.
Populations in this research are working people who attend to 32nd Bangkok
International Motor Expo 2015 at Impact Challenge during 5 December 2015 to 13
December 2015. The sample size of this research is 258. The result of this research
analyzed in quantitative approach using SPSS program. The result can be concluded
as follows.
5.1 Hypothesis Assumption.
The important factors studied in this research are car attributes, emotional
connection, accessibility, external Influence, brand-loving tendency, support
environmental protection, drive for environmental responsibility, and vivacity
influenced on automobile consumer purchase intention found that most of the
respondents are female, ages between 26-35 years old, single, bachelor education
background, has salary under 30,000 baht per month, private employee, owned at
least 1 vehicle, interested in sedan vehicle segment, has intention to purchase vehicle
over a year, have their own influence on purchase decision, and main objective to
83
purchase vehicle is using for work. Research result base on hypothesis can be
concluded as
Hypothesis 1, Car Attribute factor has a positive relationship toward
Behavioral Intention or not. The result from the analysis shows that Car Attribute has
a positive relationship toward Behavioral Intention at 0.05 significant levels. So
hypothesis accepted.
Hypothesis 2, Emotional Connection factor has a positive relationship toward
Behavioral Intention or not. The result from the analysis shows that Emotional
Connection has a positive relationship toward Behavioral Intention at 0.05 significant
level. So hypothesis accepted.
Hypothesis 3, Accessibility factor has a positive relationship toward
Behavioral Intention or not. The result from the analysis shows that Accessibility has
a positive relationship toward Behavioral Intention at 0.05 significant levels. So
hypothesis accepted.
Hypothesis 4, Brand-Loving Tendency factor has a positive relationship
toward Behavioral Intention or not. The result from the analysis show that Brand-
Loving Tendency has a positive relationship toward Behavioral at 0.05 significant
level. So hypothesis accepted.
Hypothesis 5, Supporting Environmental Protection factor has a positive
relationship toward Behavioral Intention or not. The result from the analysis shows
that Supporting Environmental Protection has a positive relationship toward
Behavioral Intention at 0.05 significant levels. So hypothesis accepted.
84
Hypothesis 6, Drive for Environmental Responsibility factor has a positive
relationship toward Behavioral Intention or not. The result from the analysis show
that Drive for Environmental Responsibility has a positive relationship toward
Behavioral Intention at 0.05 significant levels. So hypothesis accepted.
Hypothesis 7, Vivacity factor has a positive relationship toward Behavioral
Intention or not. The result from the analysis shows that Vivacity has a positive
relationship toward Behavioral Intention at 0.05 significant levels. So hypothesis
accepted.
Hypothesis 8, Factors that can predict automobile consumer purchase
intentions (Y) are vivacity and accessibility which has 32.5% influence. Another
67.5% are influence from others variable that are not used in this research. The
standard error is ±0.366 using the following equation.
Y (Behavioral Intention) = 0.147 + 0.361 (Vivacity) + 0.141 (Accessibility)
5.2 Summary
The research on the positive influence of car attributes, emotional connection,
accessibility, external Influence, brand-loving tendency, support environmental
protection, drive for environmental responsibility, and vivacity toward consumer
purchase intention of working people in Bangkok is a survey research using
questionnaires to collected data found the interesting issue as follows.
Hypothesis 1, Car Attribute factor has a positive relationship toward
Behavioral Intention or not. The results from Pearson correlation analysis show that
Car Attribute has no positive relationship toward Behavioral Intention at 0.05
85
significant levels which accepted hypothesis. Quality, feature, and characteristic in car
attribute are factors that consumer consider in purchase decision, but are not as
important as accessibility and vivacity. Russell & Taylor (2006) state that consumers
expect the feature that suitable to use from the brand. However, every car
manufacturing gives nearly the same feature on the vehicle in order to compete with
competitors which cause consumers to look over this issue. Another attribute state by
Kuksov (2004) is product design and style. Design and style have a lot of influence on
consumers. However, Thai people always looking for brand and accessibility.
Hypothesis 2, Emotional Connection factor has a positive relationship toward
Behavioral Intention or not. The results from Pearson correlation analysis show that
Emotional Connection has no positive relationship toward Behavioral Intention at
0.05 significant levels which accepted hypothesis. Emotional connection refers to a
bond between consumers and brands or products. According to Travis (2010) and
Gobe (2001), brand control the emotional feeling on consumers. Thus, new generation
people and teenagers in Thailand are more attached to luxury brand while middle age
people tend to balance functionality, brand, and price. Consumers memorable
experience with a vehicle brand will last long in their memory.
Hypothesis 3, Accessibility factor has a positive relationship toward
Behavioral Intention or not. The results from Pearson correlation analysis show that
Accessibility has a positive relationship toward Behavioral Intention at 0.05
significant levels which accepted hypothesis. Consumers in Thailand belief that
accessibility provides by vehicle brand make their life less complex conform with Lin
& Chang (2003), convenience offered by a brand impact consumer purchase
86
intention. Plenty of showrooms, service centers, and stocked spare parts to reduce
transportation time and waiting time. Due to high vehicle price, Thai people use
vehicle longer than Japanese, American, and European people. In order to service the
vehicle after warrantee, consumers are looking for fast services with professional
work at reasonable prices. Furthermore, beside the authorize service center, there are
many choices of private garage in Thailand. In the other word, after warranty service
affect the vehicle purchase decision. European vehicle has higher maintenance cost
and less private garage than Japanese vehicle. So, accessibility has a lot of influence
to Thai consumer purchase intention.
Hypothesis 4, Brand-Loving Tendency factor has a positive relationship
toward Behavioral Intention or not. The results from Pearson correlation analysis
show that Brand-Loving Tendency has no positive relationship toward Behavioral at
0.05 significant levels which accepted hypothesis. From Shimp & Madden (1988),
inhibited desire has positive on liking and yearning but not decision and commitment.
Consumers may like and yearn the brand, but according to several external influences,
such as income, has an impact on purchasing behavior. As well as purchasing the
vehicle. In reality, admired vehicle brand may unreachable. Another issue is brand
royalty. At the same brand level, new generation consumers tend to purchase product
base on giving feature.
Hypothesis 5, Supporting Environmental Protection factor has a positive
relationship toward Behavioral Intention or not. The results from Pearson correlation
analysis show that Supporting Environmental Protection has no positive relationship
toward Behavioral Intention at 0.05 significant levels which accepted hypothesis. As
87
the global environment changing quickly, consumers have more concern about
environmental issues. Pickett‐Baker & Ozaki (2008) state that green vehicle show
consumer the ability to support environmental protection with suitable for their
lifestyle. But in reality, even green vehicle suitable for consumers, but the price of the
vehicle is higher than petrol car as well as the maintenance cost. There are only a few
green vehicles sold in Thailand and almost of them are hybrid vehicle. High
technology came with high price and high maintenance cost. In order to set the selling
price reachable, some luxury materials are replaced with plastic which make
consumers feel the vehicle is overprice. Not to mention the long term maintenance on
a complex engine system which has nearly 3 times more expensive than normal
vehicle and can only maintenance at authorize service center. As the result, petrol and
diesel vehicle are consumer choice.
Hypothesis 6, Drive for Environmental Responsibility factor has a positive
relationship toward Behavioral Intention or not. The results from Pearson correlation
analysis show that Drive for Environmental Responsibility has no positive
relationship toward Behavioral Intention at 0.05 significant levels which accepted
hypothesis. According to Gadenne et al. (2011), since environmental problem issue
becomes more serious. Companies have to create more responsibility toward
environmental. For this reason, every heavy factory and manufacturing factory have
to pass the pollution test which becomes less concern to consumers. Another study by
Kilbourne & Pickett (2008) found that consumer perception as well as purchase
decision change and having more responsibility on environment by purchasing more
green products. However, environmental responsibility related to the perspective of
88
consumer on environmental protection. Each consumer has different levels of
responsibility toward environment.
Hypothesis 7, Vivacity factor has a positive relationship toward Behavioral
Intention or not. The results from Pearson correlation analysis show that Vivacity has
a positive relationship toward Behavioral Intention at 0.05 significant levels which
accepted hypothesis. Conform to the study of Dick, Chakravarti, & Biehal (1990),
brand personality become an important matter for company since consumer purchase
decision based on brand image than products. In the purchasing process, consumers
will search for preferences of the brand though memory. Together with Aaker (1992),
positive brand image or personal experience has critical impact on purchasing
decision and repurchase products or brands.
Hypothesis 8, by using multiple regression analysis on hypothesis found that
factors affecting consumer purchase intention are vivacity and accessibility at
significant levels of 0.05. Together with the Toldos-Romero & Orozco-Gómez
(2015), show that dimensions success, vivacity, sophistication, and sincerity can
explain purchase intention. The most predictor among these dimensions is vivacity.
Furthermore, teenager prefers to purchase vivacity brands to reflect their lifestyle
conform to the main participants in this study. The result in this research is also as
same as Narteh, Odoom, Braimah, & Buame (2012), which found that a major factor
that influences consumer vehicle purchase was accessibility. Accessibility provides
convenience to consumers in term of dealer’s showrooms, service centers, available
spare parts, location, and open hours. Poor accessibility can make consumer switching
brand as well.
89
5.3 Suggestion
From the result of the research on the positive influence of car attributes,
emotional connection, accessibility, external Influence, brand-loving tendency,
support environmental protection, drive for environmental responsibility, and vivacity
toward consumer purchase intention of working people in Bangkok. Marketers or
automobile company should consider new development on product and service
strategies as follows
5.3.1 Automobile brands should focus more on accessibility for customers,
open more showrooms and service centers, stock more spare parts, and provide after
sales services. Nowadays, customers intend to purchase a vehicle that has easily
access to service and maintenance, have wide range of genuine and aftermarket spare
parts, can service through private garage, and memorable after sales service. Another
issue is flexibility of service hours. Some customers are not comfortable to bring the
car in and out of the service center during open hours. So vehicle delivering services
are becoming more popular. Some car brands and private garage already offer this
service without charging. This can be concluded that convenient service and easy
access have an influence on customer satisfaction which can lead to purchase and
repurchase intention.
5.3.2 Since vivacity or hipness reflects the brand and product characteristic.
Automobile brands should consider vivacity in the research and development process
of new car models. Each automobile brand has a different personality, for example
Mercedes-Benz reflects luxury and wealth, Mazda reflect youthfulness. New
generation consumers in Thailand tend to stick to the brand less than older people.
90
They started to choose the vehicle that suits them most. Female and male consumers
have a different perspective on purchasing vehicles. Male consumers focus more on
mechanical and technological issue while females are looking for practicality and
trusted brand. To satisfy the both male and female customers, automobile should
combine mechanical, technological, and practical together to maximize the
probability of selling vehicles. (Erdfelder, Faul, & Buchner, 1996; Wiratchai, 2012)
5.4 Recommendation
Researcher should consider the following issue in the future research
5.4.1 Respondents of this research are mostly having intention to purchase
vehicle over a year. Purchasing a vehicle need a lot of research on interested car
segment and brand. Unlike consumers who intend to purchase a vehicle in a month,
respondents who have an intention to purchase within a year may change perception
easily due to unpredictable external influence. According to this, purchase intention
toward vehicle may be different from the respondents who have an intention to
purchase in a month. As a result, researcher recommend to collect data from the
respondents who intend to purchase vehicle within a month.
5.4.2 In this research, only accessibility and vivacity can predict consumer
purchase intention. Some respondents mention about second hand selling price and
after sale service in the comment of the questionnaire. According to this, second hand
selling price and after sale service might have influence on consumer purchase
intention and should be added in the future research.
91
5.4.3 During factor analysis in this research found that some question has
factor loading value less than 0.3 which should be deleted from the group or using
confirmatory factor analysis in the future research. The question that are not exceed
factor loading value are question 1: I buy car with high price (CA1) in car attribute
grouping, question 3: I buy unique and admirable cars (EC3) in emotional connection
grouping, question 1: I buy a car because of its country origin (EI1) and question 4:
My car brand reflect my social status (EI4) in external influence grouping, question
3: Components of an environmental friendly vehicles are recyclable (EP3) in
supporting environmental protection grouping, and question 1: I would like to
purchase vehicle that has good price (BI1) in behavioral intention grouping.
5.4.4 For business benefits, the result from this study showed that vivacity and
accessibility had an impact on purchase intention of the consumers. Therefore, car
dealers and manufacturers should first aim to show vivacity or hipness as a
component of the brand personality by making the consumers believe that the
physical appearances of their cars reflect their youth, spirits, coolness, and
cheerfulness. Second, car dealers and manufacturers should be certain that the cars are
widely available, showrooms easy to access all over the country, spare parts readily
available, as well as easy to access for maintenance and repair services. Then, the
consumers are likely to purchase the automobiles.
5.4.5 For academic benefits, theories and knowledge on vivacity and
accessibility toward purchase intention had been expanded. Future research includes
data collection in other big cities like Chiangmai or Phuket to compare the results.

92
Also, the data can be collected, compared, and analyzed between the Thai and the
foreign automobile consumers in Thailand.
BIBLIOGRAPHY
Aaker, D. A. (1992). The Value of Brand Equity. Journal of Business Strategy, 13(4),
27-32. doi: doi:10.1108/eb039503
Administration for Commumity Living. (2015). Aging Statistics. Retrieved from
http://www.aoa.acl.gov/aging_statistics/index.aspx
Aggarwal, P. (2004). The Effects of Brand Relationship Norms on Consumer
Attitudes and Behavior. Journal of Consumer Research, 31(1), 87-101.
Ajzen, I. (1991). The Theory of Planned Behavior. Organizational Behavior and
Human Decision Processes, 50, 179-211.
Ajzen, I., & Fishbein, M. (1975). Belief, Attitude, Intention, and Behavior: An
Introduction to Theory and Research. Reading, MA: Addison-Wesley.
Apple.com. (2015). Environmental Responsibility Retrieved from
http://www.apple.com/environment/
Armstrong, G., Kotler, P., Harker, M., & Brennan, R. (2009). Marketing: An
Introduction. USA: Financial Times Prentice Hall.
Asean.org. (2016). ASEAN Economic Community. Retrieved from
http://www.asean.org/asean-economic-community/
Bandura, A. (1977). Self-efficacy: toward a unifying theory of behavioral change.
Psychological Review, 84(2), 191. doi: 10.1016/0146-6402(78)90002-4
Bangkokbiznews.com. (2015). Chakramon" declares political stability. Automotive
industry downturn points out recesstion. First vehicle project successful and
upturn the market. Retrieved from
http://www.bangkokbiznews.com/mobile/view/news/620884
94
Berger, I. E., & Mitchell, A. A. (1989). The Effect of Advertising on Attitude
Accessibility, Attitude Confidence, and the Attitude-Behavior Relationship.
Journal of Consumer Research, 16(3), 269-279. doi: 10.1086/209213
Boston University School of Public Health. (2013). Multiple Linear Regression
Analysis. Retrieved from http://sphweb.bumc.bu.edu/otlt/MPH-
Modules/BS/BS704_Multivariable/BS704_Multivariable7.html
Brakus, J. J., Schmitt, B. H., & Zarantonello, L. (2009). Brand Experience: What Is
It? How Is It Measured? Does It Affect Loyalty? Journal of Marketing, 73(3),
52-68. doi: doi:10.1509/jmkg.73.3.52
Chaffey, D., & Miller, S. (2012). What is emotional branding? Retrieved from
http://www.smartinsights.com/online-brand-strategy/emotional-branding-
means-customers-stay-loyal-for-the-long-haul/
Chang, H. H., & Liu, Y. M. (2009). The impact of brand equity on brand preference
and purchase intentions in the service industries. The Service Industries
Journal, 29(12), 1687-1706. doi: 10.1080/02642060902793557
Charlwood, S. (2014). Why owners have emotional connections with cars? Retrieved
from http://www.drive.com.au/motor-news/why-owners-have-emotional-
connections-with-cars-20140116-30ytt.html
Cohen, J. (1977). Statistical Power Analysis for the Behavioral Sciences. New York:
Academic.
Dick, A., Chakravarti, D., & Biehal, G. (1990). Memory-Based Inferences During
Consumer Choice. Journal of Consumer Research, 17(1), 82-93. doi:
10.1086/208539
95
Emmelheinz, M., Stock, J. & Emmelheinz, L. (1991). Consumer response to retail
stock-outs. Journal of Retailing, 67, 138-46.
Erdfelder, E., Faul, F., & Buchner, A. (1996). GPOWER: A general power analysis
program. Behavior Research Methods Instruments & Computers, 28(1), 1-11.
doi: 10.3758/BF03203630
Escalas, J. E., & Bettman, J. R. (2005). Self-Construal, Reference Groups, and Brand
Meaning. Journal of Consumer Research, 32(3), 378-389. doi:
http://dx.doi.org/10.1086/497549
Explorable.com. (2009). Convenience Sampling. Retrieved from
https://explorable.com/convenience-sampling
Formula magazine. (2015). Comparison on automobile tax between current tax and
2016 tax. Retrieved from https://motorexpo.co.th
Fournier, S. (1998). Consumers and their brands: developing relationship theory in
consumer research. Journal of Consumer Research, 24(4), 343-373.
Friesner, T. (2014). What are external influences in consumer behavior? Retrieved
from http://www.marketingteacher.com/external-influences-introduction/
Gadenne, D., Sharma, B., Kerr, D., & Smith, T. (2011). The influence of consumers'
environmental beliefs and attitudes on energy saving behaviours. Energy
Policy, 39(12), 7684-7694. doi: http://dx.doi.org/10.1016/j.enpol.2011.09.002
Gobe, M. (2001). Emotional Branding: A New Paradigm for Connecting Brands to
People. New York: Allworth.
Greenburg, Z. O. M. (2009). In Depth: What Your Car Says About You. Retrieved
from http://www.forbes.com/2009/10/06/car-personality-wealth-lifestyle-
vehicles-gender-income_slide_6.html
96
Headlightmag. (2016). In depth vehicle sale report November 2015 by segment.
Retrieved from http://www.headlightmag.com/salesreport-november2015/
Hess, J. (1995). Construction and assessment of a scale to measure consumer trust.
AMA Educators’ Conference, Enhancing Knowledge Development in
Marketing, 6, 20-25.
Hofmeyr, J. and Rice, B. (2000). Commitment-led Marketing. John Wiley: Chichester.
Hoon, L. B., Ho, A. K., & Wook, J. Y. (2003). The Empirical Study of the Relative
Influence of Brand Personality and Product Attributes in the Brand Choice.
Korea Marketing Review, 18(4), 1-21.
Keller, K. L. (2001). Building customer-based brand equity: A blueprint for creating
strong brands. Journal of Marketing Management, 10, 1-14.
Kilbourne, W., & Pickett, G. (2008). How materialism affects environmental beliefs,
concern, and environmentally responsible behavior. Journal of Business
Research, 61(9), 885-893. doi: http://dx.doi.org/10.1016/j.jbusres.2007.09.016
Kotler, P., & Armstrong, G. (2010). Principles of marketing. New Jersey: Prentice
Hall.
Kuksov, D. (2004). Buyer Search Costs and Endogenous Product Design. Marketing
Science, 23(4), 490-499.
Kumar, P., & Ghodeswar, B. M. (2015). Factors affecting consumers’ green product
purchase decisions. Marketing Intelligence & Planning, 33(3), 330-347. doi:
doi:10.1108/MIP-03-2014-0068
Laroche, M., Bergeron, J., & Barbaro‐Forleo, G. (2001). Targeting consumers who
are willing to pay more for environmentally friendly products. Journal of
Consumer Marketing, 18(6), 503-520. doi: doi:10.1108/EUM0000000006155
97
Lee, K. (2009). Gender differences in Hong Kong adolescent consumers' green
purchasing behavior. Journal of Consumer Marketing, 26(2), 87-96. doi:
doi:10.1108/07363760910940456
Lezin, N. (2007). Theories & Approaches: Theory of Reasoned Action (TRA).
Retrieved from
http://recapp.etr.org/recapp/index.cfm?fuseaction=pages.TheoriesDetail&Page
ID=517
Lin, M. Y., & Chang, L. H. (2003). Determinants of habitual behavior for national
and leading brands in China. Journal of Product & Brand Management, 12(2),
94-107. doi: doi:10.1108/10610420310469788
Magistris, T. d., & Gracia, A. (2008). The decision to buy organic food products in
Southern Italy. British Food Journal, 110(9), 929-947. doi:
doi:10.1108/00070700810900620
Miles, J., & Shevlin, M. (2001). Applying regression and correlation: A guide for
students and researchers. London: Sage.
Morris, J. D., Woo, C., Geason, J. A., & Kim, J. (2002). The power of affect:
predicting intention. Journal of Advertising Research, 43(3), 7-17.
Moslehpour, M., Aulia, C. K., & Masarie, C. E. L. (2015). Bakery Product Perception
and Purchase Intentionof Indonesian Consumers in Taiwan. International
Journal of Business & Information, 10(1), 63-94.
Motorexpo.co.th. (2015). Next year price for Eco Car/Hybrid decreasing? Retrieved
from http://www.motorexpo.co.th/news/402
Motorexpo.co.th. (2016). Motor Expo 2016. Retrieved from
http://www.motorexpo.co.th/
98
Mouakket, S. (2015). Factors influencing continuance intention to use social network
sites: The Facebook case. Computers in Human Behavior, 53, 102-110. doi:
http://dx.doi.org/10.1016/j.chb.2015.06.045
Narteh, B., Odoom, R., Braimah, M., & Buame, S. (2012). Key drivers of automobile
brand choice in sub‐Saharan Africa: the case of Ghana. Journal of Product &
Brand Management, 21(7), 516-528. doi: doi:10.1108/10610421211276268
Nunnally, J. C. (1978). Psychometric theory. New York: McGraw-Hill.
ODonnell, L. (2014). Why Is Our Environment Important? Retrieved from
http://greenliving.lovetoknow.com/Why_is_Our_Environment_Important
Papagiannidis, S., See-To, E., & Bourlakis, M. (2014). Virtual test-driving: The
impact of simulated products on purchase intention. Journal of Retailing and
Consumer Services, 21(5), 877-887. doi:
http://dx.doi.org/10.1016/j.jretconser.2014.02.010
PetrolPrices. (2014). What is a Green Car? Retrieved from
http://www.petrolprices.com/green-guide.html
Pickett‐Baker, J., & Ozaki, R. (2008). Pro‐environmental products: marketing
influence on consumer purchase decision. Journal of Consumer Marketing,
25(5), 281-293. doi: doi:10.1108/07363760810890516
Pungchoo, O., Kanthawongs, P., & Chitcharoen, C. (2014). The Relationship and the
Influences of the Factors Affecting Purchase Intention of Organic Product
Shop “A” in Pathumthani Province. Suan Sunandha Rajabhat Conference
Bangkok: : Graduated School Suan Sunandha Rajabhat.
99
Redlinelap. (2015, 14 December 2015). Motor Expo 2015 Finished. Vehicles sale and
visitors exceed expectation and acheive their goals. Retrieved from
http://www.redlinelap.com
Rindfleisch, A., Burroughs, J. E., & Wong, N. (2009). The Safety of Objects:
Materialism, Existential Insecurity, and Brand Connection. Journal of
Consumer Research, 36(1), 1-16. doi: http://dx.doi.org/10.1086/595718
Robert, Q. (2014). Product Design & Development. Retrieved from
http://www.rqriley.com/pro-dev.htm
Romero, T., & Paz, M. D. L. (2012). Dimensions of Brand Personality in Mexico.
Global Journal of Business Research, 6(5), 35-47. doi:
http://ssrn.com/abstract=2146097
Rundh, B. (2005). The multi‐faceted dimension of packaging: Marketing logistic or
marketing tool? British Food Journal, 107(9), 670-684. doi:
doi:10.1108/00070700510615053
Russell, R. S., & Taylor, B. W. (2006). Operations management : quality and
competitiveness in a global environment. Hoboken, NJ: John Wiley.
Saengrattanachaiyakul, K., Kanthawongs, P., & Kanthawongs, P. (2014). Factors
Influencing Fast Food’s Purchase Intention of Consumers in Bangkok. Suan
Sunandha Rajabhat Conference Bangkok: Graduated School Suan Sunandha
Rajabhat.
Shiau, W.-L., & Chau, P. Y. K. (2015). Understanding behavioral intention to use a
cloud computing classroom: A multiple model comparison approach.
Information & Management, 53, 355-365. doi:
http://dx.doi.org/10.1016/j.im.2015.10.004
100
Shimp, T. A., & Madden, T. J. (1988). Consumer-Object Relations: A Conceptual
Framework Based Analogously on Sternberg's Trianfular Theory of Love.
Advances in Consumer Research, 15(1), 163-168.
Siemen AGs. (2014). Environmental Protection. Retrieved from
http://www.siemens.com/about/sustainability/en/core-topics/environmental-
protection/management-and-facts/index.php
Siraiyara, Y., Kanthawongs, P., & Chitcharoen, C. (2014). The Influence of Factors
Affecting Purchase Intention of Facial Skin Care Products through Instagram
Application of Females in Bangkok. Suan Sunandha Rajabhat Conference
Bangkok: Graduated School Suan Sunandha Rajabhat.
Sternberg, R. J. (1986). A triangular theory of love. Psychologist Review, 93(2), 119-
135.
UNPFA Asia. (2016). Traditional family structures no longer the norm in Thailand.
Retrieved from http://asiapacific.unfpa.org/news/traditional-family-structures-
no-longer-norm-thailand
Thaiauto.or.th. (2012). Master Plan for Automotive Industry 2012 – 2016. Retrieved
from
http://www.thaiauto.or.th/2012/backoffice/file_upload/research/11125561430
391.pdf
Thailand Board of Investment (BOI). (2015). Thailand: Global green automotive
production base. Retrieved from http://www.boi.go.th/upload/content/BOI-
brochure%202015-automotive-20150325_70298.pdf
101
Toldos-Romero, M. D. L. P., & Orozco-Gómez, M. M. (2015). Brand personality and
purchase intention. European Business Review, 27(5), 462-476. doi:
doi:10.1108/EBR-03-2013-0046
Transport statistic planning division. (2016). Vehicle registered number (cumularive).
Retrieved from http://apps.dlt.go.th/statistics_web/vehicle.html
VanAuken, B. (2015). How Brand Accessibility Builds Strong Brands. Retrieved from
http://www.brandingstrategyinsider.com/2015/09/how-brand-accessibility-
builds-strong-brands.html#.VrC5OLJ97-g
Vanichbuncha, K. (2008). Multiple Regression Analysis. Bangkok: Chulalongkorn
University.
Wang, X., & Yang, Z. (2008). Does country‐of‐origin matter in the relationship
between brand personality and purchase intention in emerging economies?:
Evidence from China's auto industry. International Marketing Review, 25(4),
458-474. doi: doi:10.1108/02651330810887495
Wiratchai, N. (2012). Interested sample size and statistical analyzes determination.
Bangkok: National Research Council of Thailand.
Woo, J., Ahn, J., Lee, J., & Koo, Y. (2015). Media channels and consumer purchasing
decisions. Industrial Management & Data Systems, 115(8), 1510-1528. doi:
doi:10.1108/IMDS-02-2015-0036
Wu, S. I., & Lo, C. L. (2009). The influence of core‐brand attitude and consumer
perception on purchase intention towards extended product. Asia Pacific
Journal of Marketing and Logistics, 21(1), 174-194. doi:
doi:10.1108/13555850910926317

APPENDICES

103
APPENDIX A
Survey Questions (English)
104
NO..........
Questionnaire
on
Factors Positively Affecting Purchase Intention of Automobile Consumers at
Thailand International Motor Expo 2015 in Bangkok
Instruction : Objective of this survey is to collected data for use in master of business
administration research, Bangkok University. The result of this research will be
benefit to automobile industry. In this regard, cooperation from the respondents are
needed. I, Chiratt Chaisamran, master's degree of business administration student
from Bangkok University thankfully for your cooperation
Instruction : Please answer the following question and put in that matches you
most.
1. Gender
1) Male 2) Female
2. Age
1) Under 24 years old 2) 25–35years old
3) 36–45years old 4) 46–55years old
5) Over 56years old
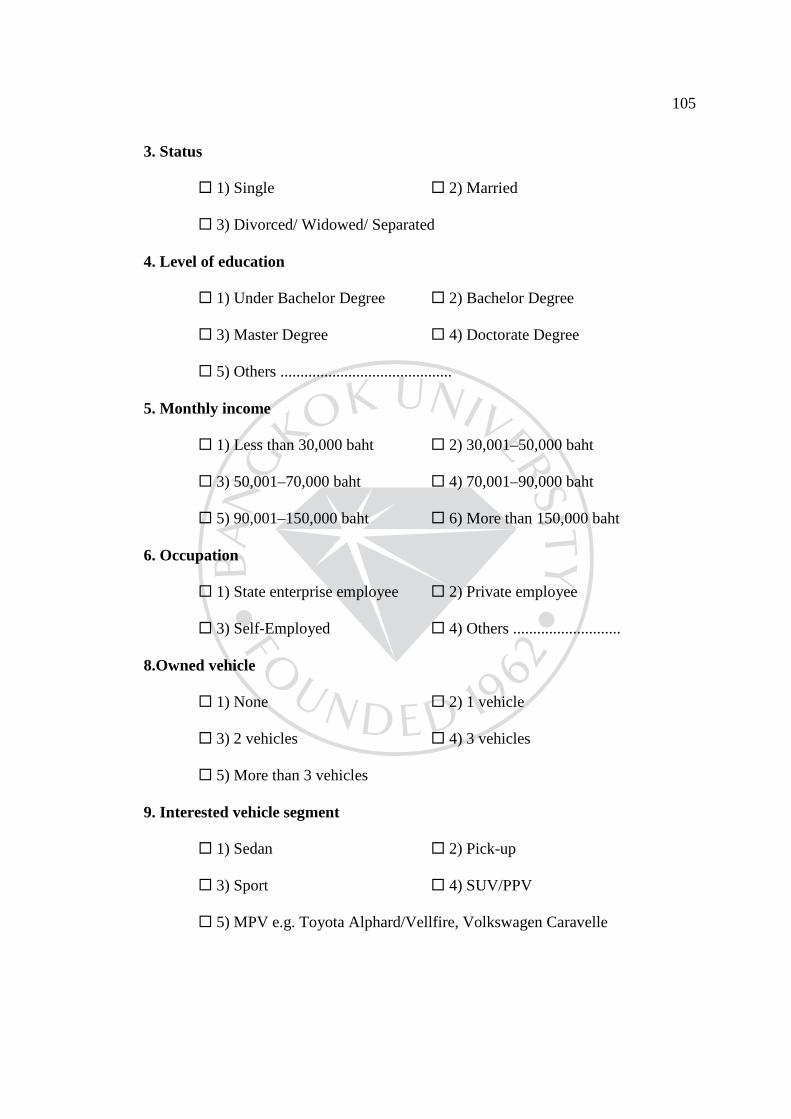
105
3. Status
1) Single 2) Married
3) Divorced/ Widowed/ Separated
4. Level of education
1) Under Bachelor Degree 2) Bachelor Degree
3) Master Degree 4) Doctorate Degree
5) Others ...........................................
5. Monthly income
1) Less than 30,000 baht 2) 30,001–50,000 baht
3) 50,001–70,000 baht 4) 70,001–90,000 baht
5) 90,001–150,000 baht 6) More than 150,000 baht
6. Occupation
1) State enterprise employee 2) Private employee
3) Self-Employed 4) Others ...........................
8.Owned vehicle
1) None 2) 1 vehicle
3) 2 vehicles 4) 3 vehicles
5) More than 3 vehicles
9. Interested vehicle segment
1) Sedan 2) Pick-up
3) Sport 4) SUV/PPV
5) MPV e.g. Toyota Alphard/Vellfire, Volkswagen Caravelle
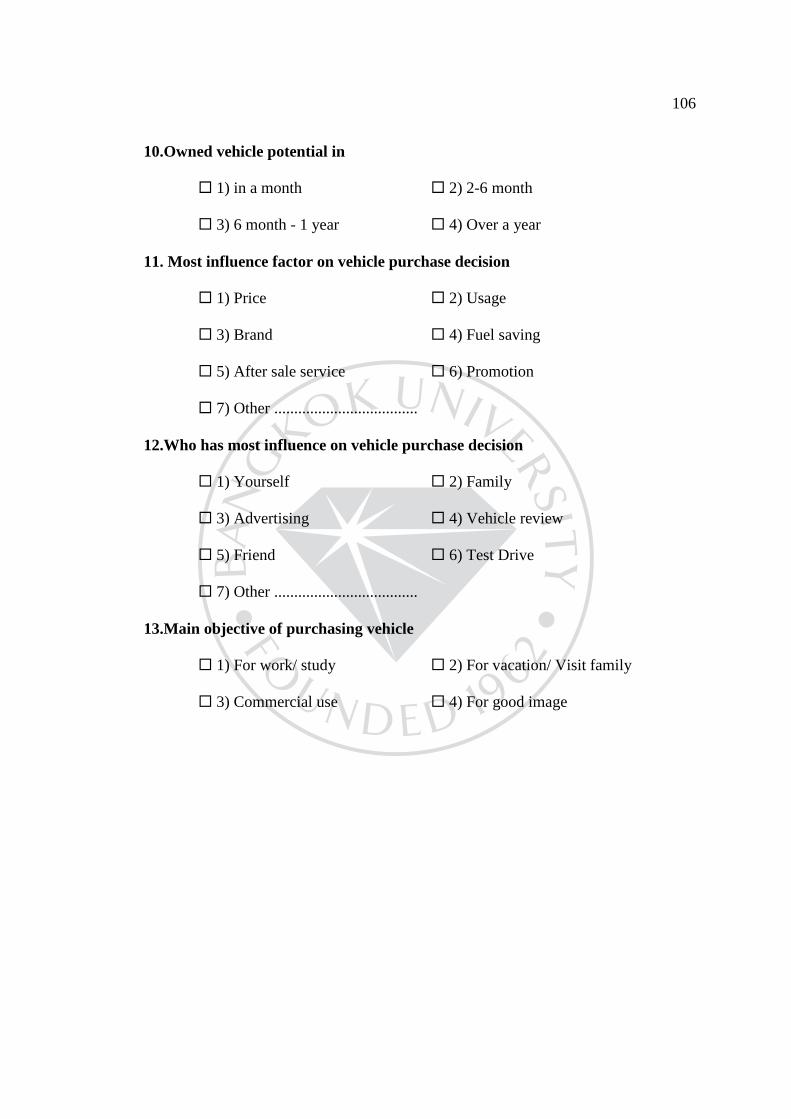
106
10.Owned vehicle potential in
1) in a month 2) 2-6 month
3) 6 month - 1 year 4) Over a year
11. Most influence factor on vehicle purchase decision
1) Price 2) Usage
3) Brand 4) Fuel saving
5) After sale service 6) Promotion
7) Other ....................................
12.Who has most influence on vehicle purchase decision
1) Yourself 2) Family
3) Advertising 4) Vehicle review
5) Friend 6) Test Drive
7) Other ....................................
13.Main objective of purchasing vehicle
1) For work/ study 2) For vacation/ Visit family
3) Commercial use 4) For good image
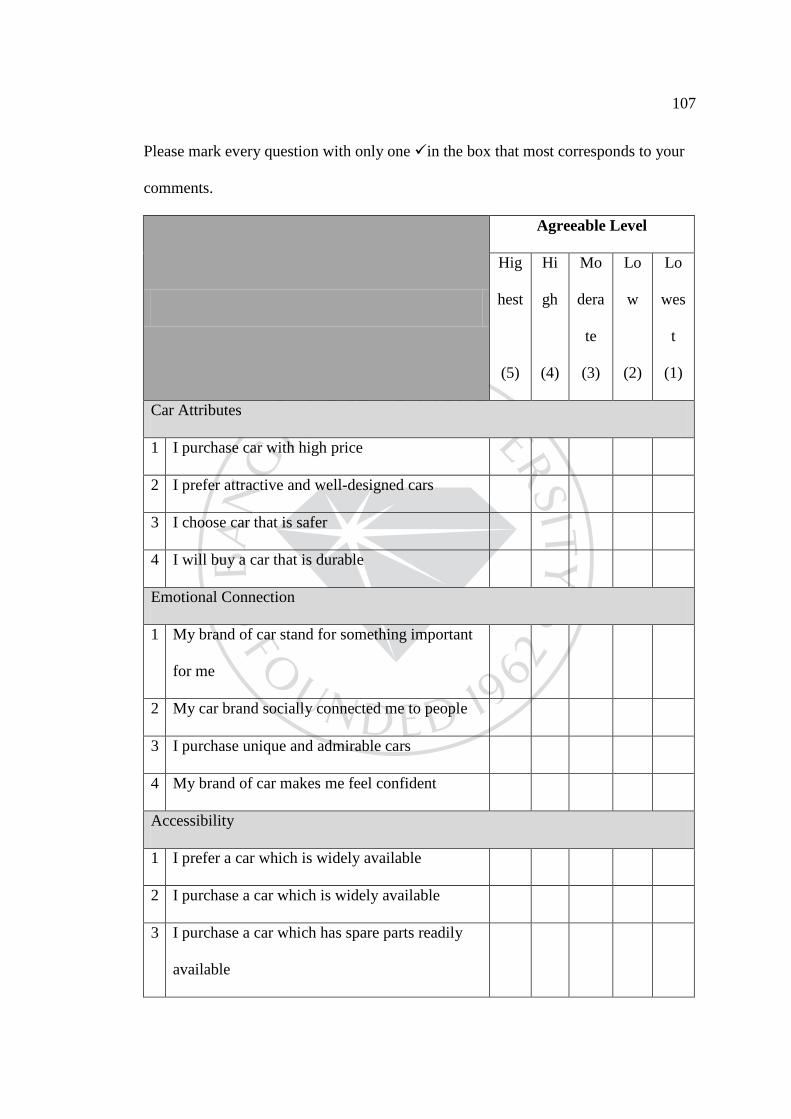
107
Please mark every question with only one in the box that most corresponds to your
comments.
Agreeable Level
Hig
hest
(5)
Hi
gh
(4)
Mo
dera
te
(3)
Lo
w
(2)
Lo
wes
t
(1)
Car Attributes
1 I purchase car with high price
2 I prefer attractive and well-designed cars
3 I choose car that is safer
4 I will buy a car that is durable
Emotional Connection
1 My brand of car stand for something important
for me
2 My car brand socially connected me to people
3 I purchase unique and admirable cars
4 My brand of car makes me feel confident
Accessibility
1 I prefer a car which is widely available
2 I purchase a car which is widely available
3 I purchase a car which has spare parts readily
available
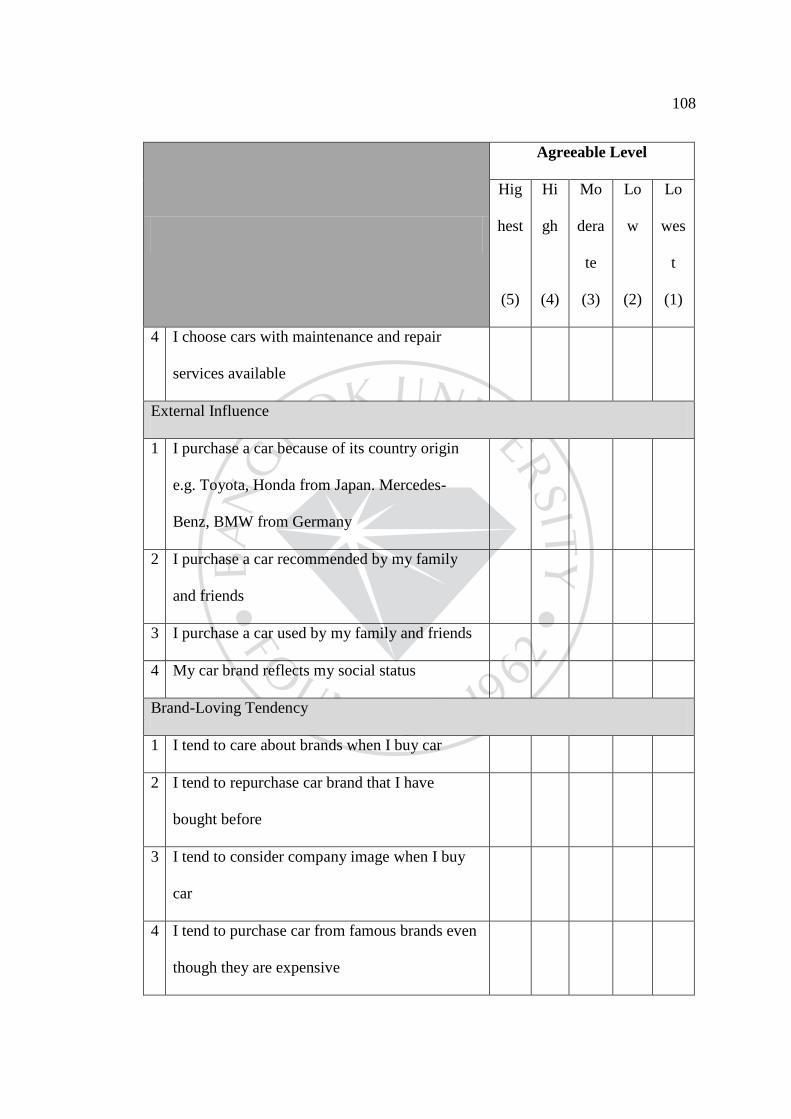
108
Agreeable Level
Hig
hest
(5)
Hi
gh
(4)
Mo
dera
te
(3)
Lo
w
(2)
Lo
wes
t
(1)
4 I choose cars with maintenance and repair
services available
External Influence
1 I purchase a car because of its country origin
e.g. Toyota, Honda from Japan. Mercedes-
Benz, BMW from Germany
2 I purchase a car recommended by my family
and friends
3 I purchase a car used by my family and friends
4 My car brand reflects my social status
Brand-Loving Tendency
1 I tend to care about brands when I buy car
2 I tend to repurchase car brand that I have
bought before
3 I tend to consider company image when I buy
car
4 I tend to purchase car from famous brands even
though they are expensive
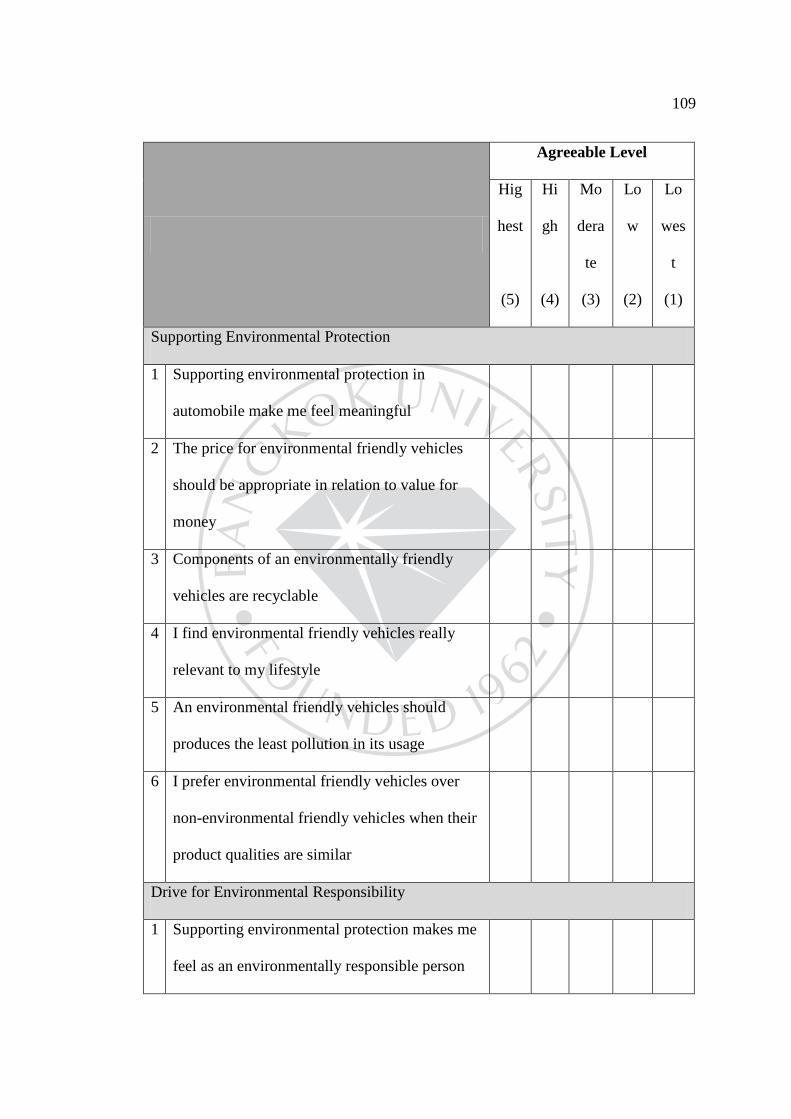
109
Agreeable Level
Hig
hest
(5)
Hi
gh
(4)
Mo
dera
te
(3)
Lo
w
(2)
Lo
wes
t
(1)
Supporting Environmental Protection
1 Supporting environmental protection in
automobile make me feel meaningful
2 The price for environmental friendly vehicles
should be appropriate in relation to value for
money
3 Components of an environmentally friendly
vehicles are recyclable
4 I find environmental friendly vehicles really
relevant to my lifestyle
5 An environmental friendly vehicles should
produces the least pollution in its usage
6 I prefer environmental friendly vehicles over
non-environmental friendly vehicles when their
product qualities are similar
Drive for Environmental Responsibility
1 Supporting environmental protection makes me
feel as an environmentally responsible person
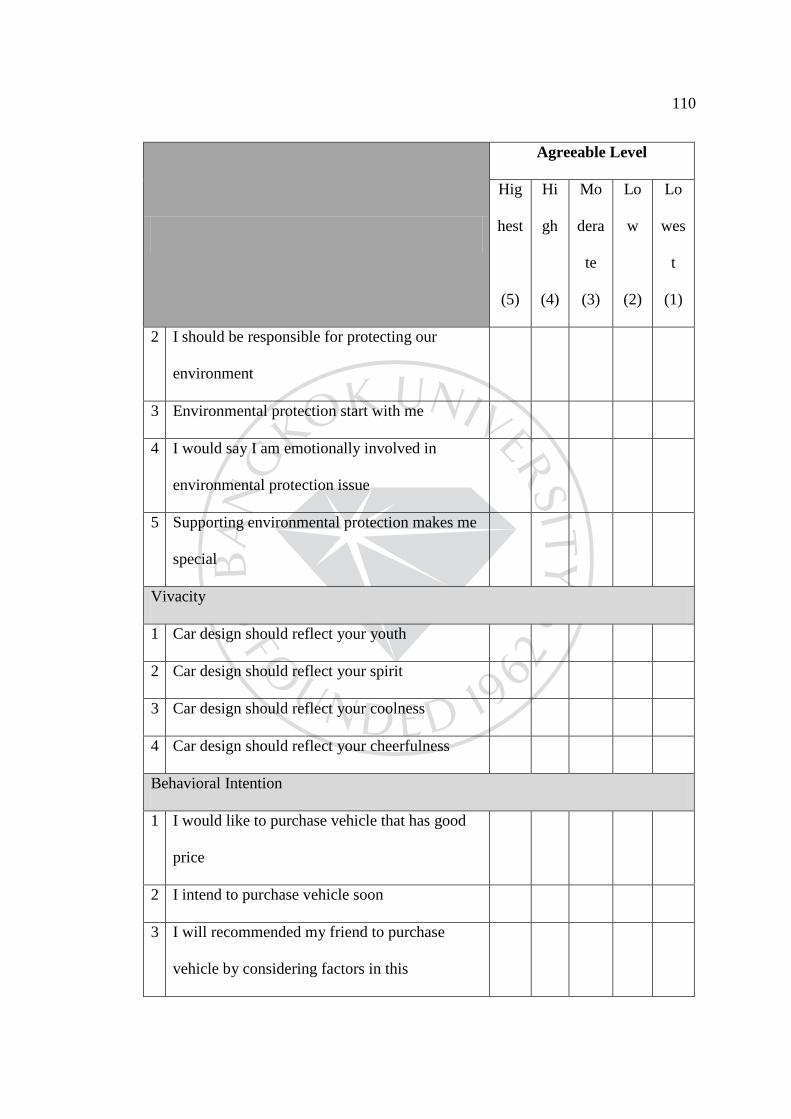
110
Agreeable Level
Hig
hest
(5)
Hi
gh
(4)
Mo
dera
te
(3)
Lo
w
(2)
Lo
wes
t
(1)
2 I should be responsible for protecting our
environment
3 Environmental protection start with me
4 I would say I am emotionally involved in
environmental protection issue
5 Supporting environmental protection makes me
special
Vivacity
1 Car design should reflect your youth
2 Car design should reflect your spirit
3 Car design should reflect your coolness
4 Car design should reflect your cheerfulness
Behavioral Intention
1 I would like to purchase vehicle that has good
price
2 I intend to purchase vehicle soon
3 I will recommended my friend to purchase
vehicle by considering factors in this
111
Agreeable Level
Hig
hest
(5)
Hi
gh
(4)
Mo
dera
te
(3)
Lo
w
(2)
Lo
wes
t
(1)
questionnaire
4 I encourage my relative to purchase vehicle by
considering factors in this questionnaire
Please recommend for other factors that might affect vehicle purchase
intention
______________________________________________________________
_____________________________________________________________________
_____________________________________________________________________
_____________________________________________________________________
_____________________________________________________________________
____________________________________________
Thank you for your cooperation
Mr. Chiratt Chaisamran
E–Mail: [email protected]

112
APPENDIX B
Survey Questions (Thai)
113
NO..........
แบบสอบถาม
เรื่อง
ปจจัยท่ีมีอิทธิพลตอความตั้งใจซ้ือรถยนตของพนักงานบริษัทเอกชนในกรุงเทพมหานคร
คําช้ีแจง: แบบสอบถามนี้มีวัตถุประสงคเก็บรวบรวมขอมูล เพ่ือนําไปประกอบการศึกษาระดับ
ปริญญาโท บริหารธุรกิจมหาบัณฑิต มหาวิทยาลัยกรุงเทพ และสามารถนําผลการวิจัยไปใชประโยชน
ไดอยางมีประสิทธิภาพตอธุรกิจยานยนต ดังนั้นจึงใครขอความรวมมือจากทานในการตอบ
แบบสอบถามใหตรงตามความเห็นของทานมากท่ีสุด โอกาสนี้ผูศึกษาวิจัยนาย จิรัฏฐ ใจสําราญ
นักศึกษาปริญญาโท สาขาวิชาเอกบริหารธุรกิจ คณะบริหารธุรกิจ มหาวิทยาลัยกรุงเทพ ขอขอบคุณ
ในความรวมมือของทานเปนอยางสูง
คําชี้แจง: โปรดทําเครื่องหมาย ลงในชองท่ีตรงกับความคิดเห็นของทานมากท่ีสุดในแตละขอเพียง
ขอละหนึ่งคําตอบและโปรดทําใหครบทุกขอ
1. เพศ
1) ชาย 2) หญิง
2. อายุ
1) ต่ํากวา 24 ป 2) 25–35ป
3) 36–45ป 4) 46–55ป
5) 56ปข้ึนไป
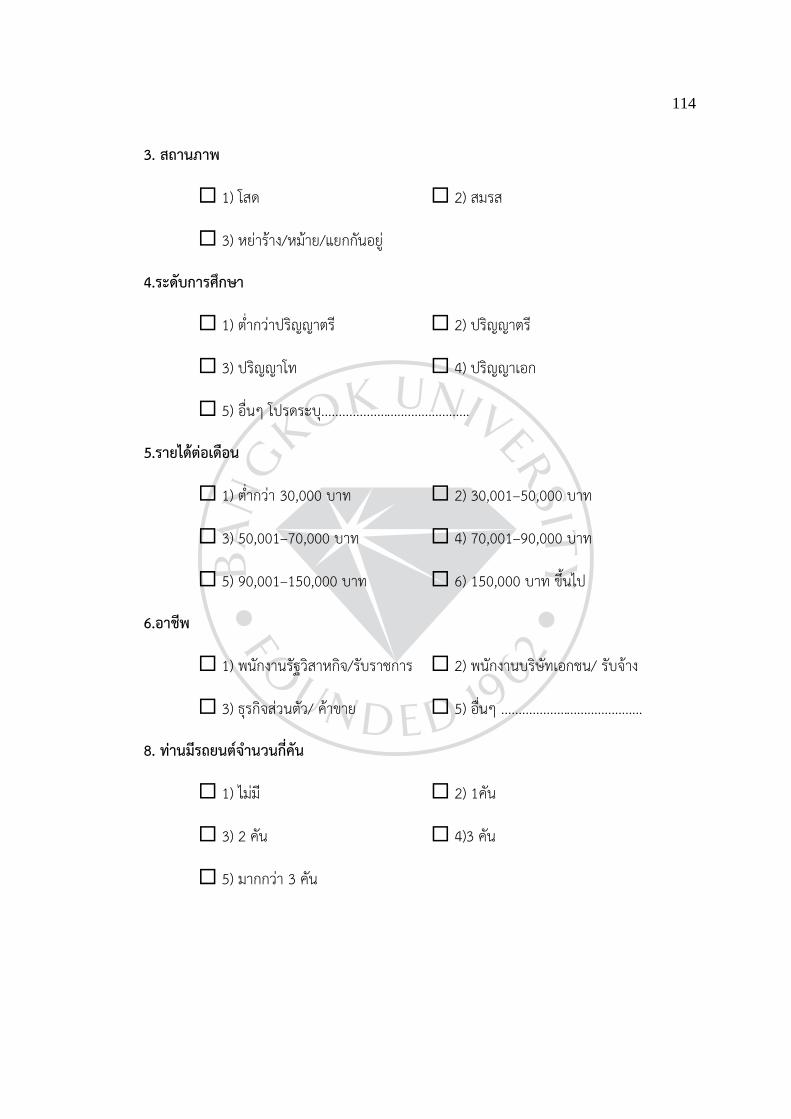
114
3. สถานภาพ
1) โสด 2) สมรส
3) หยาราง/หมาย/แยกกันอยู
4.ระดับการศึกษา
1) ต่ํากวาปริญญาตรี 2) ปริญญาตรี
3) ปริญญาโท 4) ปริญญาเอก
5) อ่ืนๆ โปรดระบุ...........................................
5.รายไดตอเดือน
1) ต่ํากวา 30,000 บาท 2) 30,001–50,000 บาท
3) 50,001–70,000 บาท 4) 70,001–90,000 บาท
5) 90,001–150,000 บาท 6) 150,000 บาท ข้ึนไป
6.อาชีพ
1) พนักงานรัฐวิสาหกิจ/รับราชการ 2) พนักงานบริษัทเอกชน/ รับจาง
3) ธุรกิจสวนตัว/ คาขาย 5) อ่ืนๆ .........................................
8. ทานมีรถยนตจํานวนกี่คัน
1) ไมมี 2) 1 คัน
3) 2 คัน 4)3 คัน
5) มากกวา 3 คัน
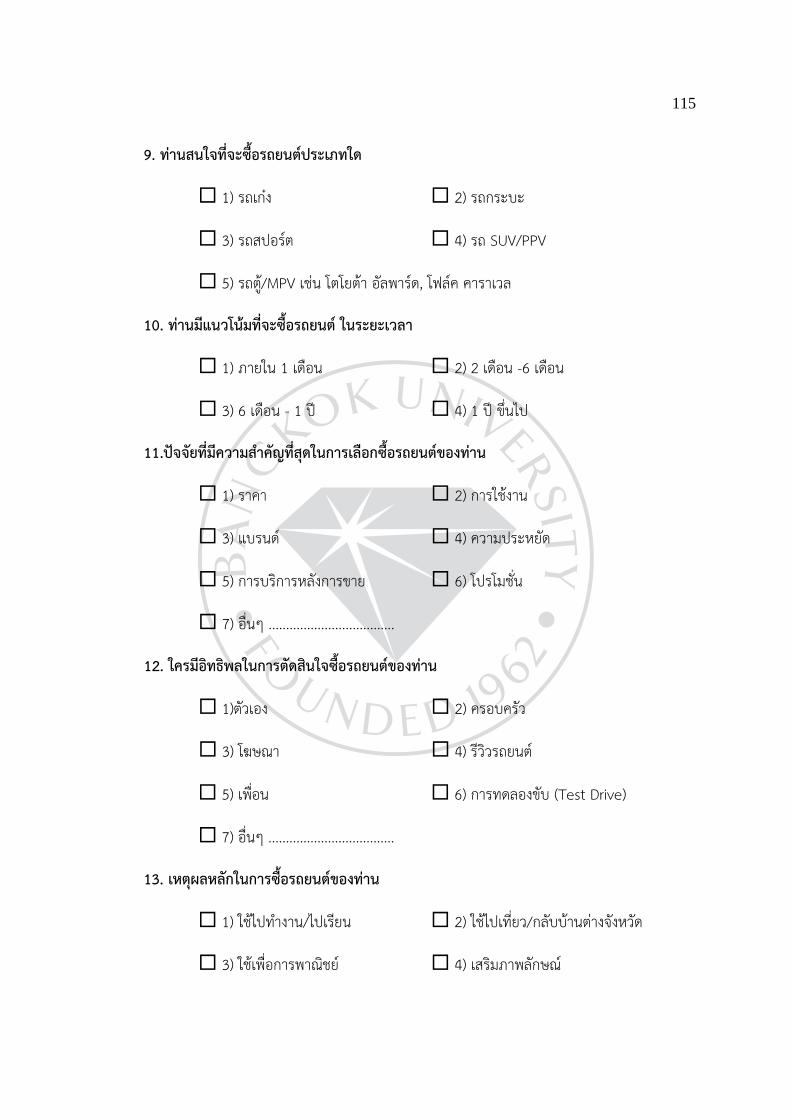
115
9. ทานสนใจท่ีจะซ้ือรถยนตประเภทใด
1) รถเกง 2) รถกระบะ
3) รถสปอรต 4) รถ SUV/PPV
5) รถตู/MPV เชน โตโยตา อัลพารด, โฟลค คาราเวล
10. ทานมีแนวโนมท่ีจะซ้ือรถยนต ในระยะเวลา
1) ภายใน 1 เดือน 2) 2 เดือน -6 เดือน
3) 6 เดือน - 1 ป 4) 1 ป ข่ึนไป
11.ปจจัยท่ีมีความสําคัญท่ีสุดในการเลือกซ้ือรถยนตของทาน
1) ราคา 2) การใชงาน
3) แบรนด 4) ความประหยัด
5) การบริการหลังการขาย 6) โปรโมชั่น
7) อ่ืนๆ ....................................
12. ใครมีอิทธิพลในการตัดสินใจซ้ือรถยนตของทาน
1)ตัวเอง 2) ครอบครัว
3) โฆษณา 4) รวีิวรถยนต
5) เพ่ือน 6) การทดลองขับ (Test Drive)
7) อ่ืนๆ ....................................
13. เหตุผลหลักในการซ้ือรถยนตของทาน
1) ใชไปทํางาน/ไปเรียน 2) ใชไปเท่ียว/กลับบานตางจังหวัด
3) ใชเพ่ือการพาณิชย 4) เสริมภาพลักษณ
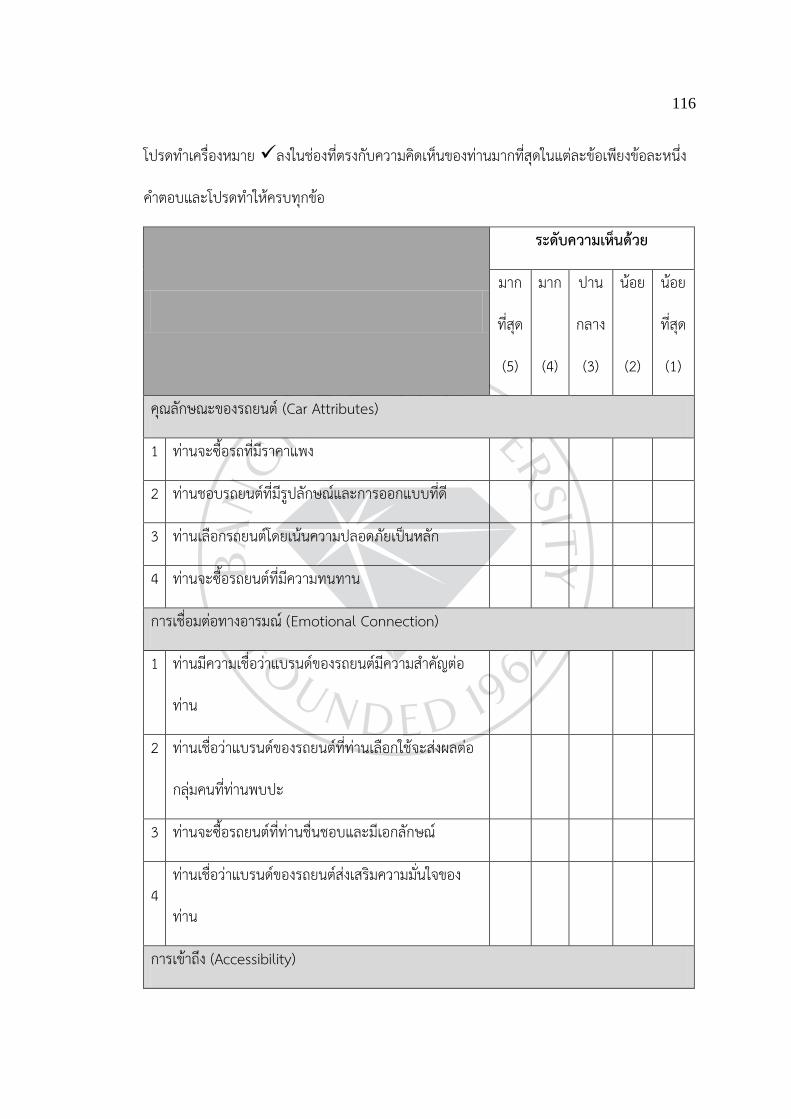
116
โปรดทําเครื่องหมาย ลงในชองท่ีตรงกับความคิดเห็นของทานมากท่ีสุดในแตละขอเพียงขอละหนึ่ง
คําตอบและโปรดทําใหครบทุกขอ
ระดับความเห็นดวย
มาก
ท่ีสุด
(5)
มาก
(4)
ปาน
กลาง
(3)
นอย
(2)
นอย
ท่ีสุด
(1)
คุณลักษณะของรถยนต (Car Attributes)
1 ทานจะซ้ือรถท่ีมีราคาแพง
2 ทานชอบรถยนตท่ีมีรูปลักษณและการออกแบบท่ีดี
3 ทานเลือกรถยนตโดยเนนความปลอดภัยเปนหลัก
4 ทานจะซ้ือรถยนตท่ีมีความทนทาน
การเชื่อมตอทางอารมณ (Emotional Connection)
1 ทานมีความเชื่อวาแบรนดของรถยนตมีความสําคัญตอ
ทาน
2 ทานเชื่อวาแบรนดของรถยนตท่ีทานเลือกใชจะสงผลตอ
กลุมคนท่ีทานพบปะ
3 ทานจะซ้ือรถยนตท่ีทานชื่นชอบและมีเอกลักษณ
4 ทานเชื่อวาแบรนดของรถยนตสงเสริมความม่ันใจของ
ทาน
การเขาถึง (Accessibility)
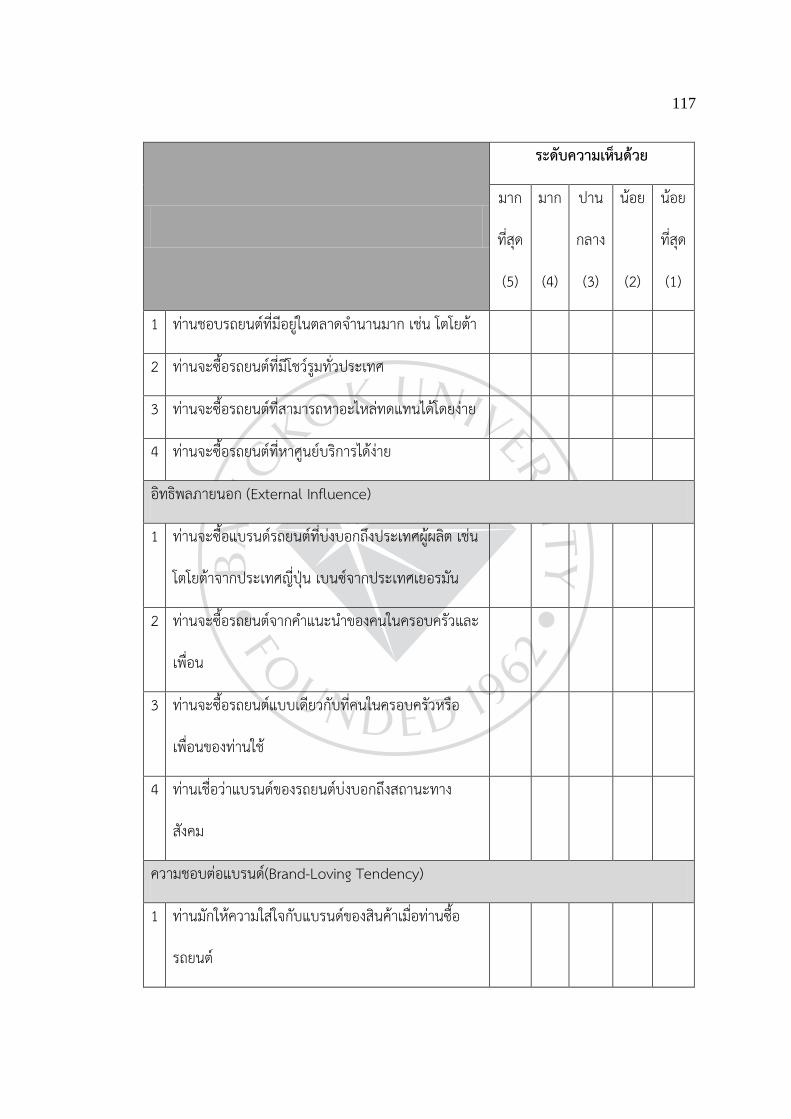
117
ระดับความเห็นดวย
มาก
ท่ีสุด
(5)
มาก
(4)
ปาน
กลาง
(3)
นอย
(2)
นอย
ท่ีสุด
(1)
1 ทานชอบรถยนตท่ีมีอยูในตลาดจํานานมาก เชน โตโยตา
2 ทานจะซ้ือรถยนตท่ีมีโชวรูมท่ัวประเทศ
3 ทานจะซ้ือรถยนตท่ีสามารถหาอะไหลทดแทนไดโดยงาย
4 ทานจะซ้ือรถยนตท่ีหาศูนยบริการไดงาย
อิทธิพลภายนอก (External Influence)
1 ทานจะซ้ือแบรนดรถยนตท่ีบงบอกถึงประเทศผูผลิต เชน
โตโยตาจากประเทศญี่ปุน เบนซจากประเทศเยอรมัน
2 ทานจะซ้ือรถยนตจากคําแนะนําของคนในครอบครัวและ
เพ่ือน
3 ทานจะซ้ือรถยนตแบบเดียวกับท่ีคนในครอบครัวหรือ
เพ่ือนของทานใช
4 ทานเชื่อวาแบรนดของรถยนตบงบอกถึงสถานะทาง
สังคม
ความชอบตอแบรนด(Brand-Loving Tendency)
1 ทานมักใหความใสใจกับแบรนดของสินคาเม่ือทานซ้ือ
รถยนต
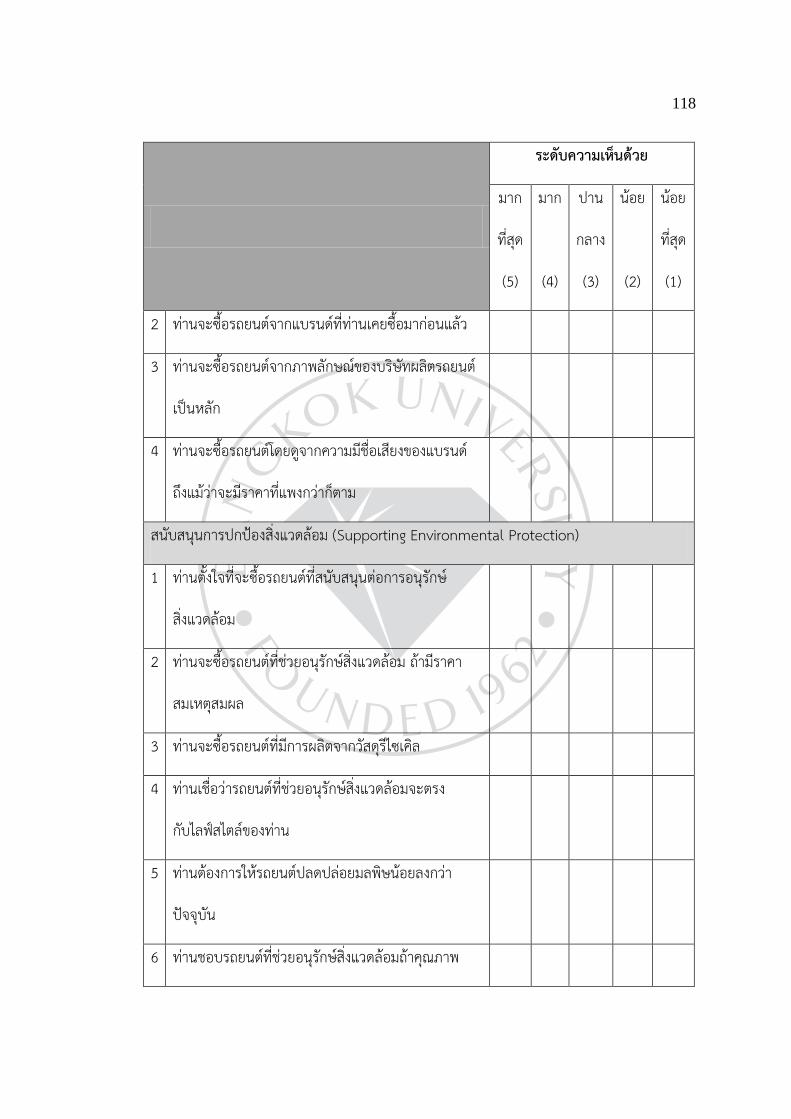
118
ระดับความเห็นดวย
มาก
ท่ีสุด
(5)
มาก
(4)
ปาน
กลาง
(3)
นอย
(2)
นอย
ท่ีสุด
(1)
2 ทานจะซ้ือรถยนตจากแบรนดท่ีทานเคยซ้ือมากอนแลว
3 ทานจะซ้ือรถยนตจากภาพลักษณของบริษัทผลิตรถยนต
เปนหลัก
4 ทานจะซ้ือรถยนตโดยดูจากความมีชื่อเสียงของแบรนด
ถึงแมวาจะมีราคาท่ีแพงกวาก็ตาม
สนับสนุนการปกปองสิ่งแวดลอม (Supporting Environmental Protection)
1 ทานตั้งใจท่ีจะซ้ือรถยนตท่ีสนับสนุนตอการอนุรักษ
สิ่งแวดลอม
2 ทานจะซ้ือรถยนตท่ีชวยอนุรักษสิ่งแวดลอม ถามีราคา
สมเหตุสมผล
3 ทานจะซ้ือรถยนตท่ีมีการผลิตจากวัสดุรีไซเคิล
4 ทานเชื่อวารถยนตท่ีชวยอนุรักษสิ่งแวดลอมจะตรง
กับไลฟสไตลของทาน
5 ทานตองการใหรถยนตปลดปลอยมลพิษนอยลงกวา
ปจจุบัน
6 ทานชอบรถยนตท่ีชวยอนุรักษสิ่งแวดลอมถาคุณภาพ
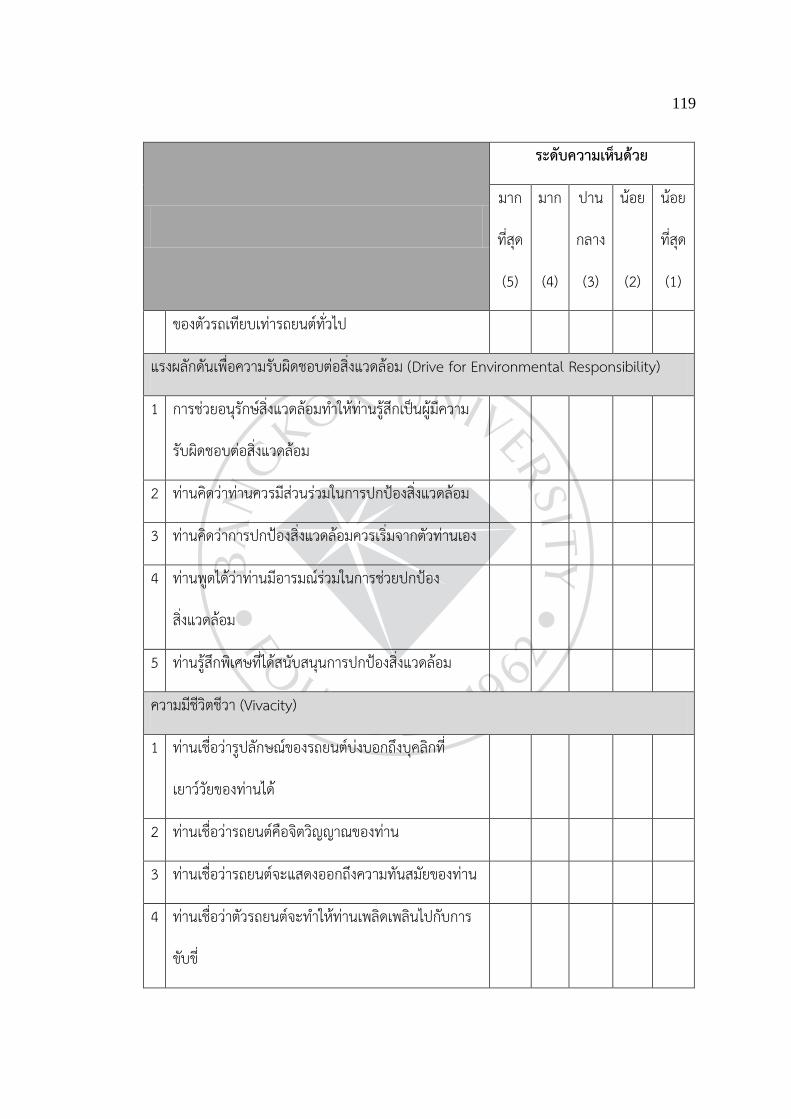
119
ระดับความเห็นดวย
มาก
ท่ีสุด
(5)
มาก
(4)
ปาน
กลาง
(3)
นอย
(2)
นอย
ท่ีสุด
(1)
ของตัวรถเทียบเทารถยนตท่ัวไป
แรงผลักดันเพ่ือความรับผิดชอบตอสิ่งแวดลอม (Drive for Environmental Responsibility)
1 การชวยอนุรักษสิ่งแวดลอมทําใหทานรูสึกเปนผูมีความ
รับผิดชอบตอสิ่งแวดลอม
2 ทานคิดวาทานควรมีสวนรวมในการปกปองสิ่งแวดลอม
3 ทานคิดวาการปกปองสิ่งแวดลอมควรเริ่มจากตัวทานเอง
4 ทานพูดไดวาทานมีอารมณรวมในการชวยปกปอง
สิ่งแวดลอม
5 ทานรูสึกพิเศษท่ีไดสนับสนุนการปกปองสิ่งแวดลอม
ความมีชีวิตชีวา (Vivacity)
1 ทานเชื่อวารูปลักษณของรถยนตบงบอกถึงบุคลิกท่ี
เยาววัยของทานได
2 ทานเชื่อวารถยนตคือจิตวิญญาณของทาน
3 ทานเชื่อวารถยนตจะแสดงออกถึงความทันสมัยของทาน
4 ทานเชื่อวาตัวรถยนตจะทําใหทานเพลิดเพลินไปกับการ
ขับข่ี
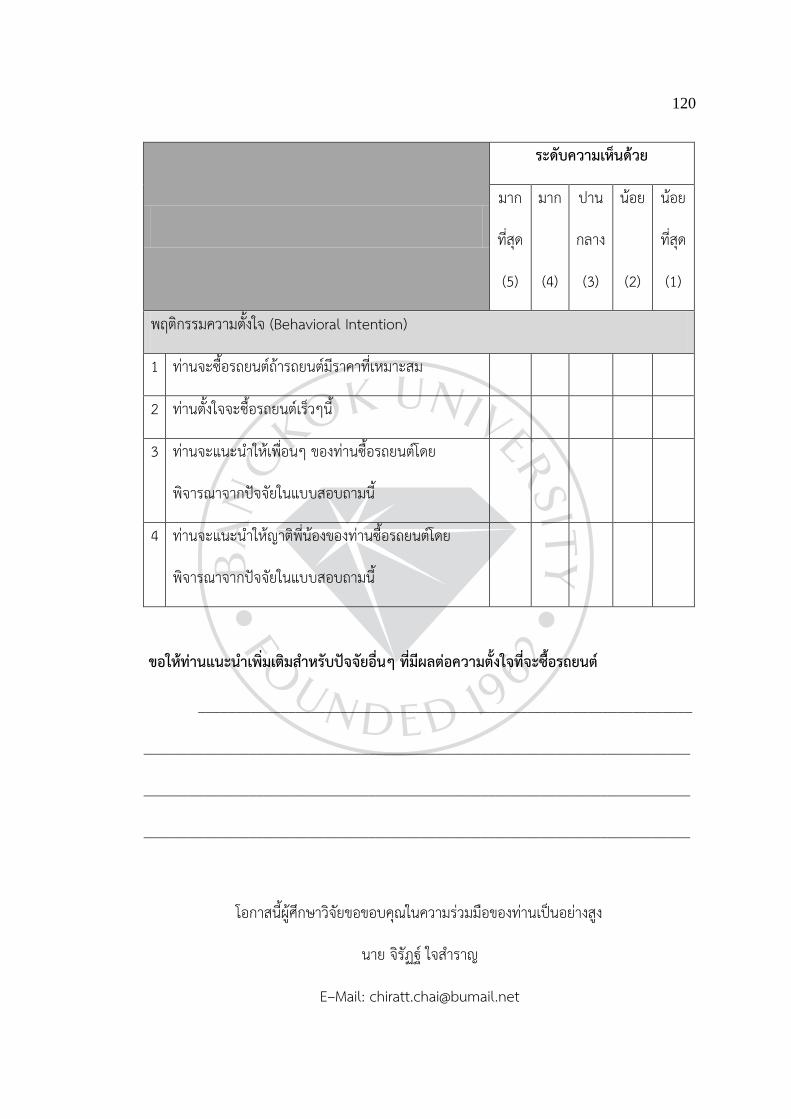
120
ระดับความเห็นดวย
มาก
ท่ีสุด
(5)
มาก
(4)
ปาน
กลาง
(3)
นอย
(2)
นอย
ท่ีสุด
(1)
พฤติกรรมความตั้งใจ (Behavioral Intention)
1 ทานจะซ้ือรถยนตถารถยนตมีราคาท่ีเหมาะสม
2 ทานตั้งใจจะซ้ือรถยนตเร็วๆนี้
3 ทานจะแนะนําใหเพ่ือนๆ ของทานซ้ือรถยนตโดย
พิจารณาจากปจจยัในแบบสอบถามนี้
4 ทานจะแนะนําใหญาติพ่ีนองของทานซ้ือรถยนตโดย
พิจารณาจากปจจยัในแบบสอบถามนี้
ขอใหทานแนะนําเพ่ิมเติมสําหรับปจจัยอ่ืนๆ ท่ีมีผลตอความตั้งใจท่ีจะซ้ือรถยนต
__________________________________________________________________
_________________________________________________________________________
_________________________________________________________________________
_________________________________________________________________________
โอกาสนี้ผูศึกษาวิจัยขอขอบคุณในความรวมมือของทานเปนอยางสูง
นาย จิรัฏฐ ใจสําราญ
E–Mail: [email protected]

121
APPENDIX C
Form to expert letter
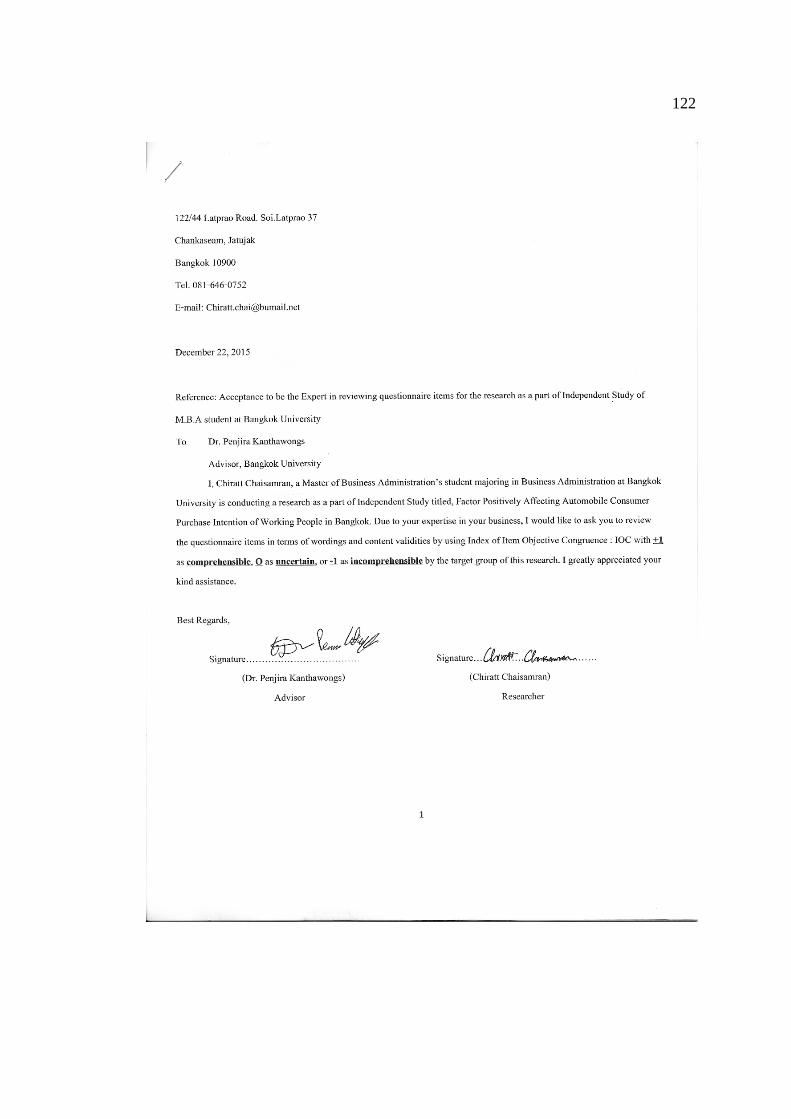
122
123
124
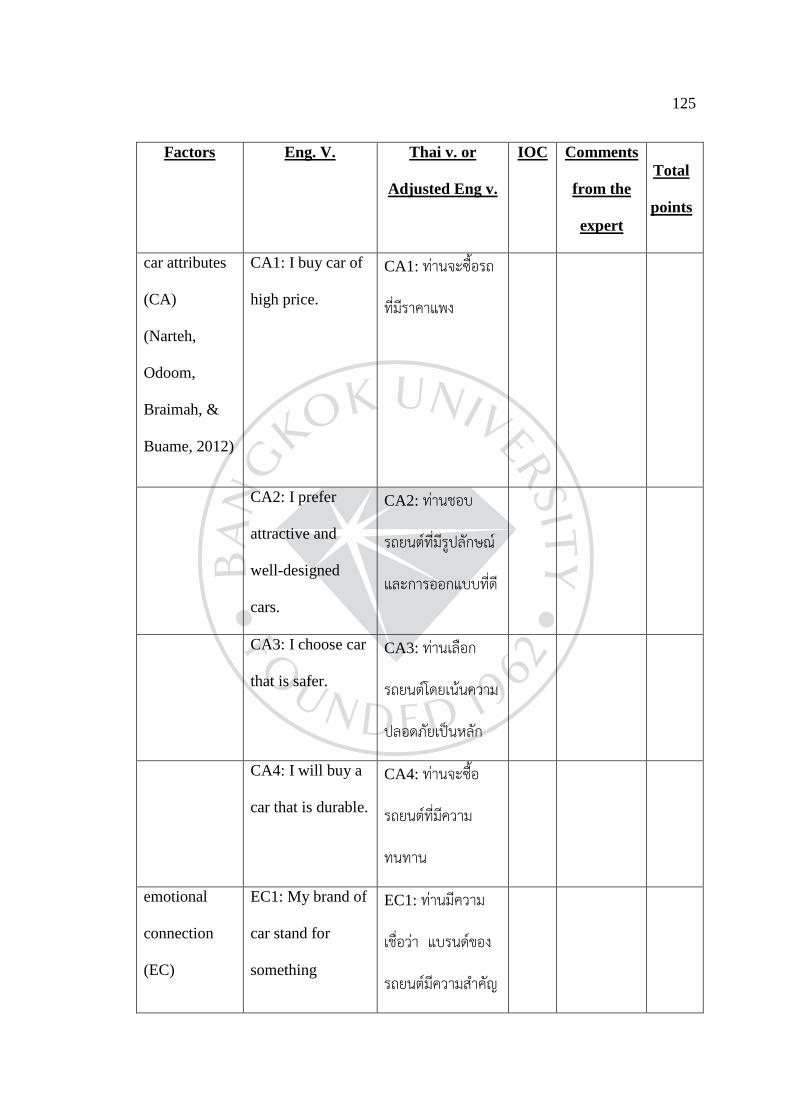
125
Factors Eng. V. Thai v. or
Adjusted Eng v.
IOC Comments
from the
expert
Total
points
car attributes
(CA)
(Narteh,
Odoom,
Braimah, &
Buame, 2012)
CA1: I buy car of
high price.
CA1: ทานจะซ้ือรถ
ท่ีมีราคาแพง
CA2: I prefer
attractive and
well-designed
cars.
CA2: ทานชอบ
รถยนตท่ีมีรูปลักษณ
และการออกแบบท่ีดี
CA3: I choose car
that is safer.
CA3: ทานเลือก
รถยนตโดยเนนความ
ปลอดภัยเปนหลัก
CA4: I will buy a
car that is durable.
CA4: ทานจะซ้ือ
รถยนตท่ีมีความ
ทนทาน
emotional
connection
(EC)
EC1: My brand of
car stand for
something
EC1: ทานมีความ
เชื่อวา แบรนดของ
รถยนตมีความสําคัญ
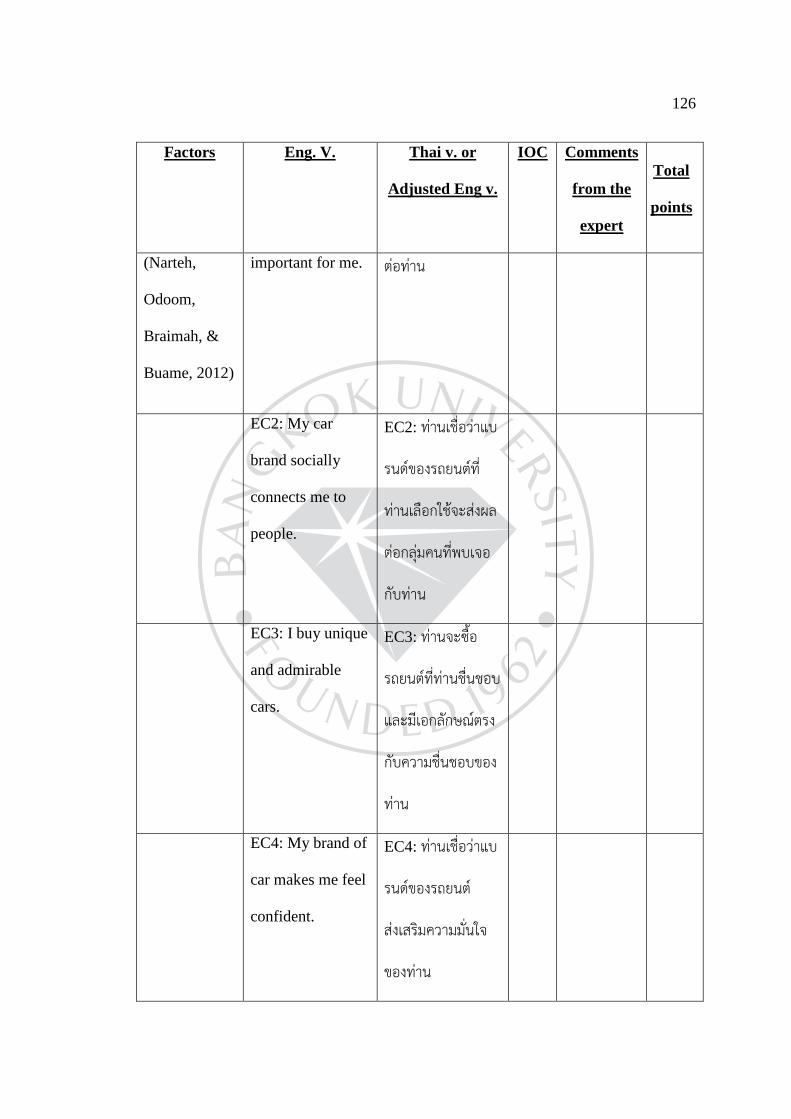
126
Factors Eng. V. Thai v. or
Adjusted Eng v.
IOC Comments
from the
expert
Total
points
(Narteh,
Odoom,
Braimah, &
Buame, 2012)
important for me. ตอทาน
EC2: My car
brand socially
connects me to
people.
EC2: ทานเชื่อวาแบ
รนดของรถยนตท่ี
ทานเลือกใชจะสงผล
ตอกลุมคนท่ีพบเจอ
กับทาน
EC3: I buy unique
and admirable
cars.
EC3: ทานจะซ้ือ
รถยนตท่ีทานชื่นชอบ
และมีเอกลักษณตรง
กับความชื่นชอบของ
ทาน
EC4: My brand of
car makes me feel
confident.
EC4: ทานเชื่อวาแบ
รนดของรถยนต
สงเสริมความม่ันใจ
ของทาน
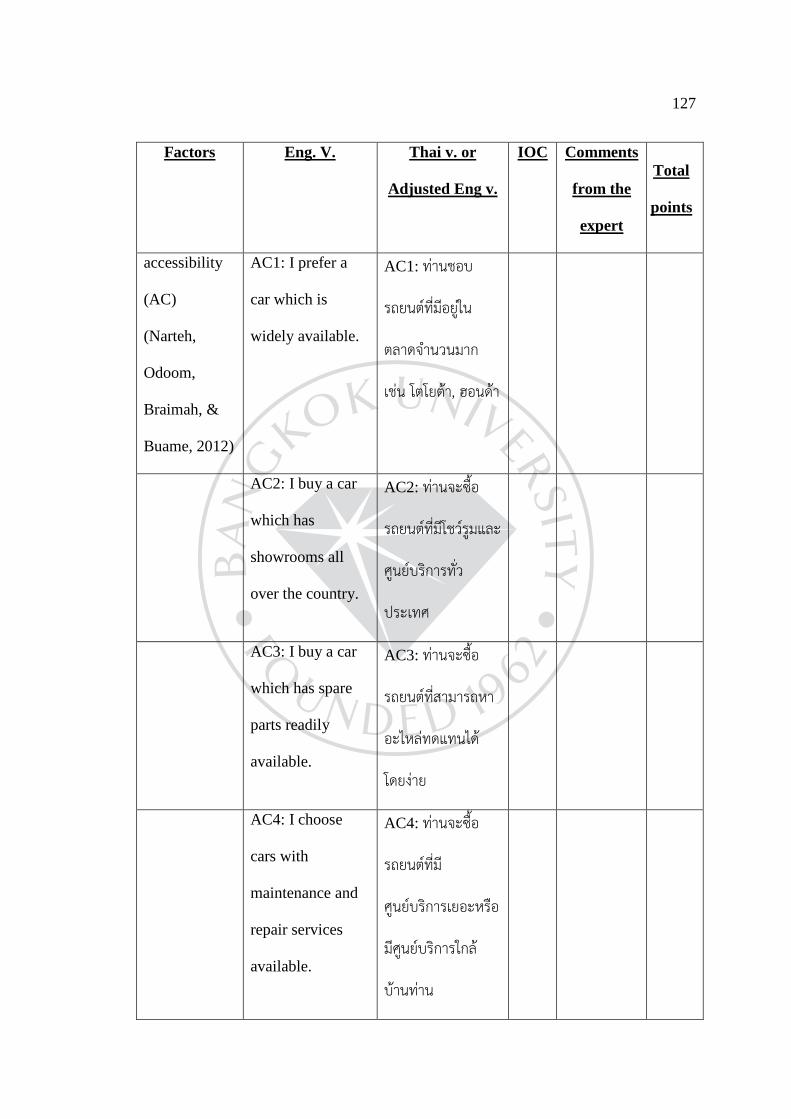
127
Factors Eng. V. Thai v. or
Adjusted Eng v.
IOC Comments
from the
expert
Total
points
accessibility
(AC)
(Narteh,
Odoom,
Braimah, &
Buame, 2012)
AC1: I prefer a
car which is
widely available.
AC1: ทานชอบ
รถยนตท่ีมีอยูใน
ตลาดจํานวนมาก
เชน โตโยตา, ฮอนดา
AC2: I buy a car
which has
showrooms all
over the country.
AC2: ทานจะซ้ือ
รถยนตท่ีมีโชวรูมและ
ศูนยบริการท่ัว
ประเทศ
AC3: I buy a car
which has spare
parts readily
available.
AC3: ทานจะซ้ือ
รถยนตท่ีสามารถหา
อะไหลทดแทนได
โดยงาย
AC4: I choose
cars with
maintenance and
repair services
available.
AC4: ทานจะซ้ือ
รถยนตท่ีมี
ศูนยบริการเยอะหรอื
มีศูนยบริการใกล
บานทาน
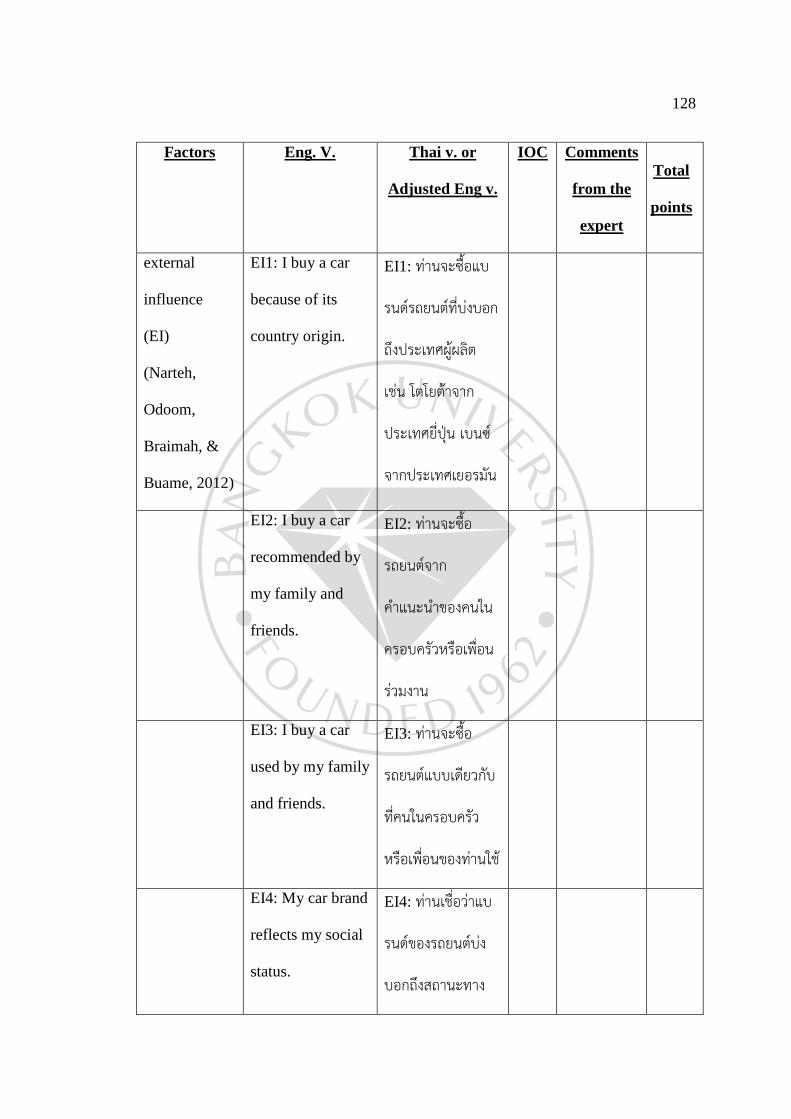
128
Factors Eng. V. Thai v. or
Adjusted Eng v.
IOC Comments
from the
expert
Total
points
external
influence
(EI)
(Narteh,
Odoom,
Braimah, &
Buame, 2012)
EI1: I buy a car
because of its
country origin.
EI1: ทานจะซ้ือแบ
รนดรถยนตท่ีบงบอก
ถึงประเทศผูผลิต
เชน โตโยตาจาก
ประเทศยี่ปุน เบนซ
จากประเทศเยอรมัน
EI2: I buy a car
recommended by
my family and
friends.
EI2: ทานจะซ้ือ
รถยนตจาก
คําแนะนําของคนใน
ครอบครัวหรือเพ่ือน
รวมงาน
EI3: I buy a car
used by my family
and friends.
EI3: ทานจะซ้ือ
รถยนตแบบเดียวกับ
ท่ีคนในครอบครัว
หรือเพ่ือนของทานใช
EI4: My car brand
reflects my social
status.
EI4: ทานเชื่อวาแบ
รนดของรถยนตบง
บอกถึงสถานะทาง
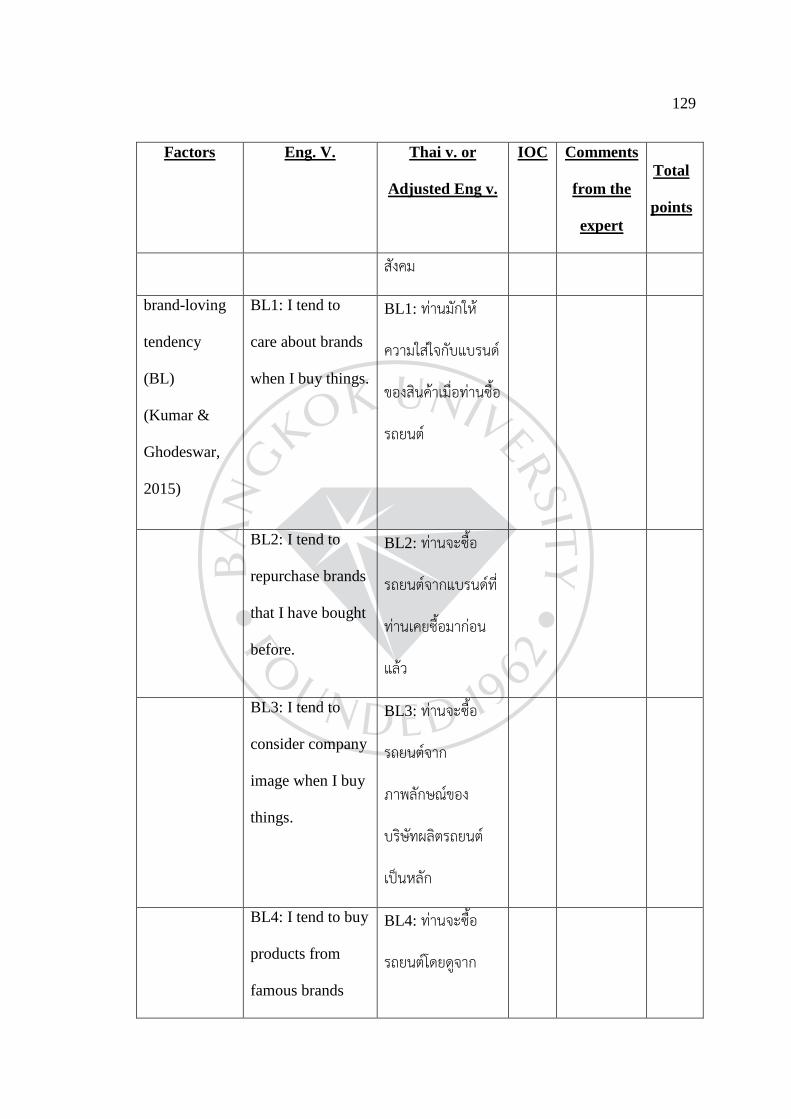
129
Factors Eng. V. Thai v. or
Adjusted Eng v.
IOC Comments
from the
expert
Total
points
สังคม
brand-loving
tendency
(BL)
(Kumar &
Ghodeswar,
2015)
BL1: I tend to
care about brands
when I buy things.
BL1: ทานมักให
ความใสใจกับแบรนด
ของสินคาเม่ือทานซ้ือ
รถยนต
BL2: I tend to
repurchase brands
that I have bought
before.
BL2: ทานจะซ้ือ
รถยนตจากแบรนดท่ี
ทานเคยซ้ือมากอน
แลว
BL3: I tend to
consider company
image when I buy
things.
BL3: ทานจะซ้ือ
รถยนตจาก
ภาพลักษณของ
บริษัทผลิตรถยนต
เปนหลัก
BL4: I tend to buy
products from
famous brands
BL4: ทานจะซ้ือ
รถยนตโดยดูจาก
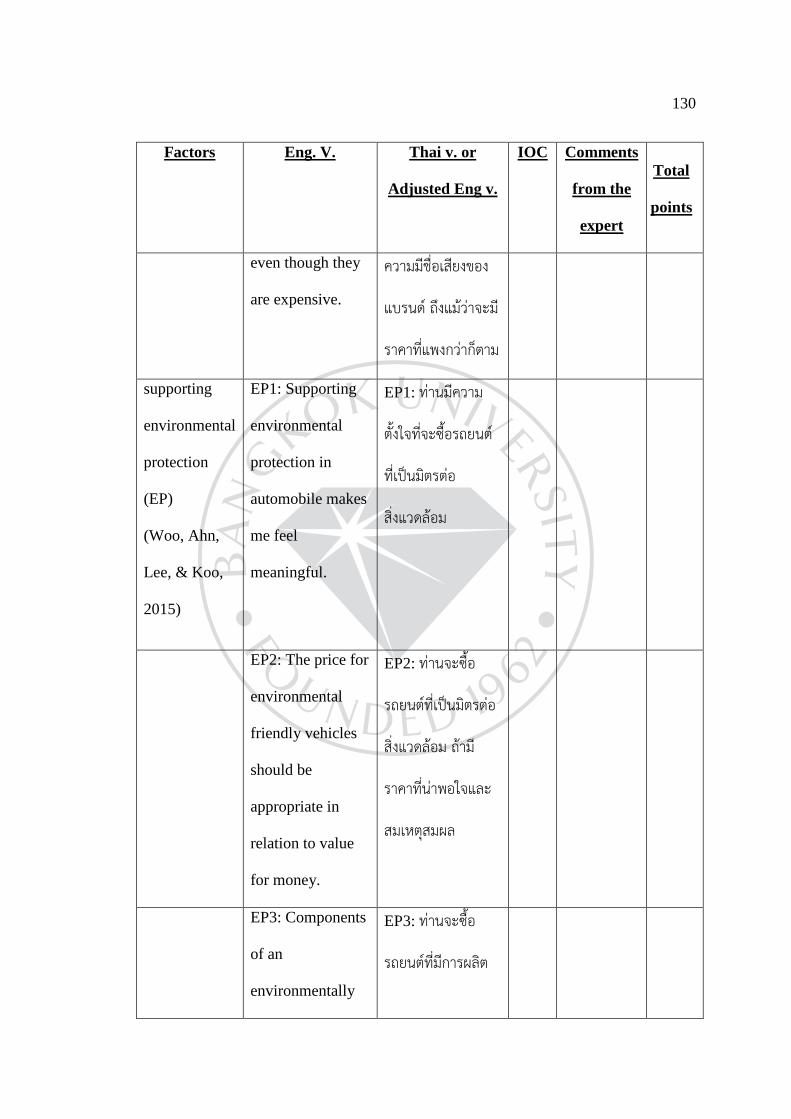
130
Factors Eng. V. Thai v. or
Adjusted Eng v.
IOC Comments
from the
expert
Total
points
even though they
are expensive.
ความมีชื่อเสียงของ
แบรนด ถึงแมวาจะมี
ราคาท่ีแพงกวาก็ตาม
supporting
environmental
protection
(EP)
(Woo, Ahn,
Lee, & Koo,
2015)
EP1: Supporting
environmental
protection in
automobile makes
me feel
meaningful.
EP1: ทานมีความ
ตั้งใจท่ีจะซ้ือรถยนต
ท่ีเปนมิตรตอ
สิ่งแวดลอม
EP2: The price for
environmental
friendly vehicles
should be
appropriate in
relation to value
for money.
EP2: ทานจะซ้ือ
รถยนตท่ีเปนมิตรตอ
สิ่งแวดลอม ถามี
ราคาท่ีนาพอใจและ
สมเหตุสมผล
EP3: Components
of an
environmentally
EP3: ทานจะซ้ือ
รถยนตท่ีมีการผลิต
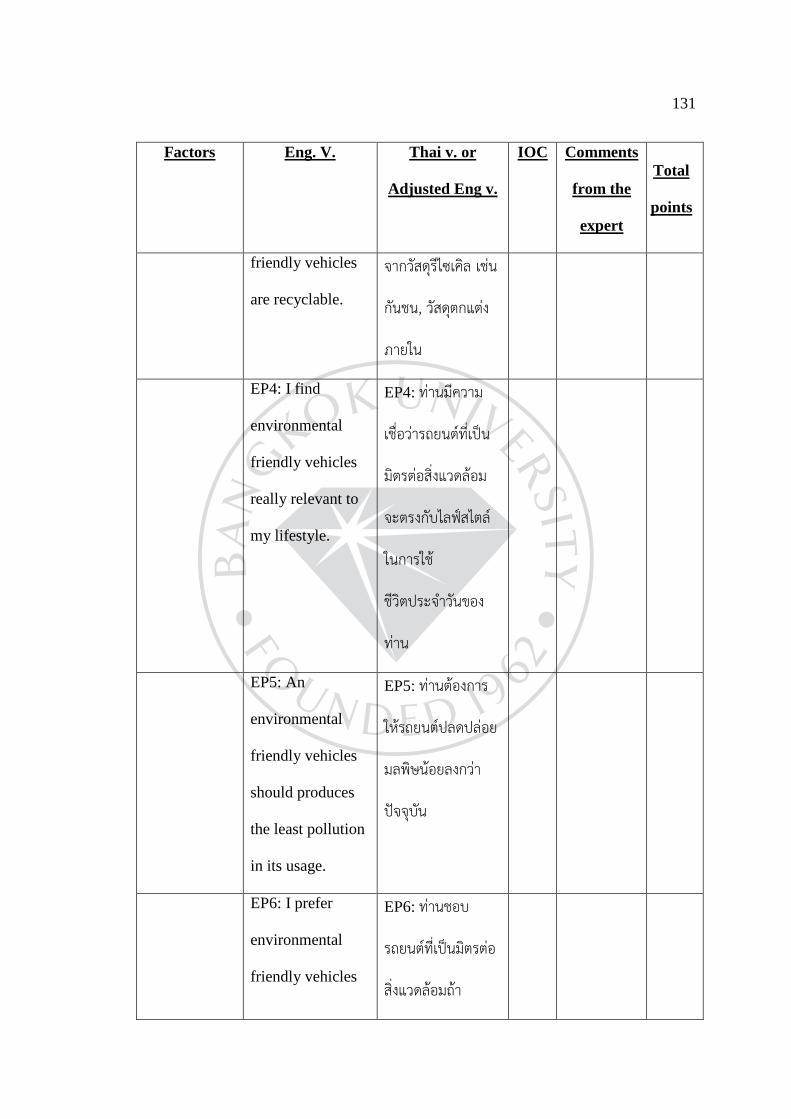
131
Factors Eng. V. Thai v. or
Adjusted Eng v.
IOC Comments
from the
expert
Total
points
friendly vehicles
are recyclable.
จากวัสดุรีไซเคิล เชน
กันชน, วัสดุตกแตง
ภายใน
EP4: I find
environmental
friendly vehicles
really relevant to
my lifestyle.
EP4: ทานมีความ
เชื่อวารถยนตท่ีเปน
มิตรตอสิ่งแวดลอม
จะตรงกับไลฟสไตล
ในการใช
ชีวิตประจําวันของ
ทาน
EP5: An
environmental
friendly vehicles
should produces
the least pollution
in its usage.
EP5: ทานตองการ
ใหรถยนตปลดปลอย
มลพิษนอยลงกวา
ปจจุบัน
EP6: I prefer
environmental
friendly vehicles
EP6: ทานชอบ
รถยนตท่ีเปนมิตรตอ
สิ่งแวดลอมถา
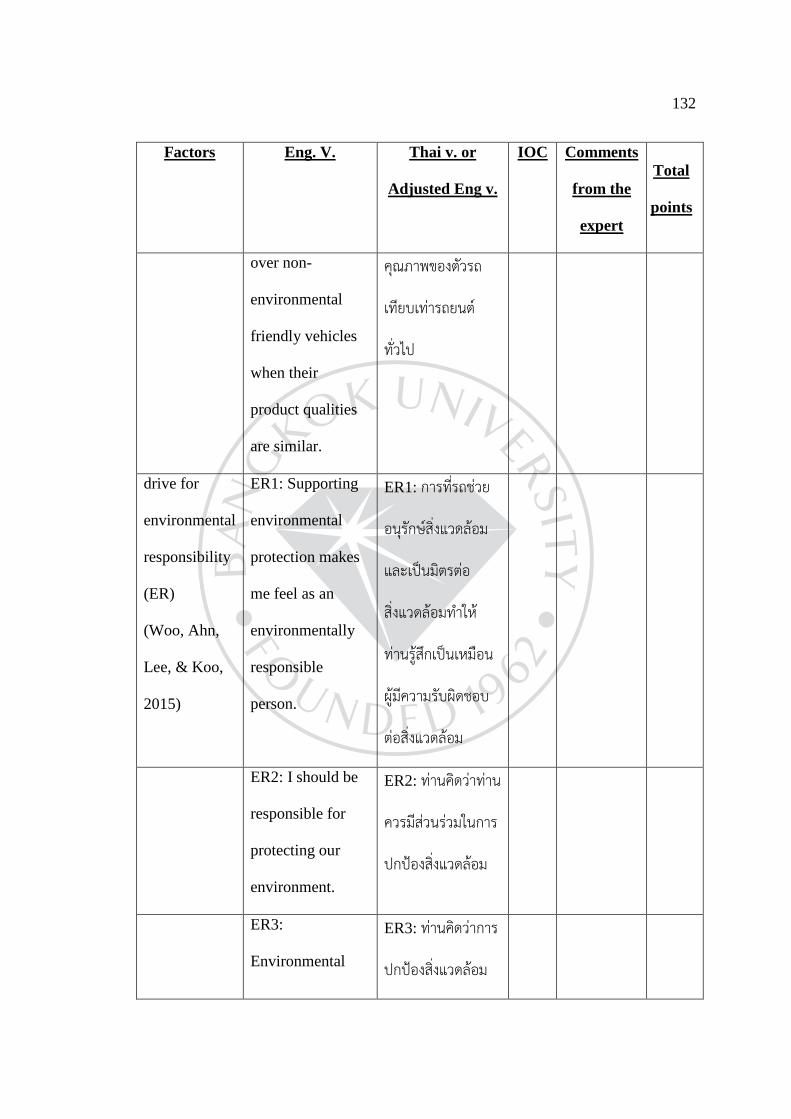
132
Factors Eng. V. Thai v. or
Adjusted Eng v.
IOC Comments
from the
expert
Total
points
over non-
environmental
friendly vehicles
when their
product qualities
are similar.
คุณภาพของตัวรถ
เทียบเทารถยนต
ท่ัวไป
drive for
environmental
responsibility
(ER)
(Woo, Ahn,
Lee, & Koo,
2015)
ER1: Supporting
environmental
protection makes
me feel as an
environmentally
responsible
person.
ER1: การท่ีรถชวย
อนุรักษสิ่งแวดลอม
และเปนมิตรตอ
สิ่งแวดลอมทําให
ทานรูสึกเปนเหมือน
ผูมีความรับผิดชอบ
ตอสิ่งแวดลอม
ER2: I should be
responsible for
protecting our
environment.
ER2: ทานคิดวาทาน
ควรมีสวนรวมในการ
ปกปองสิ่งแวดลอม
ER3:
Environmental
ER3: ทานคิดวาการ
ปกปองสิ่งแวดลอม
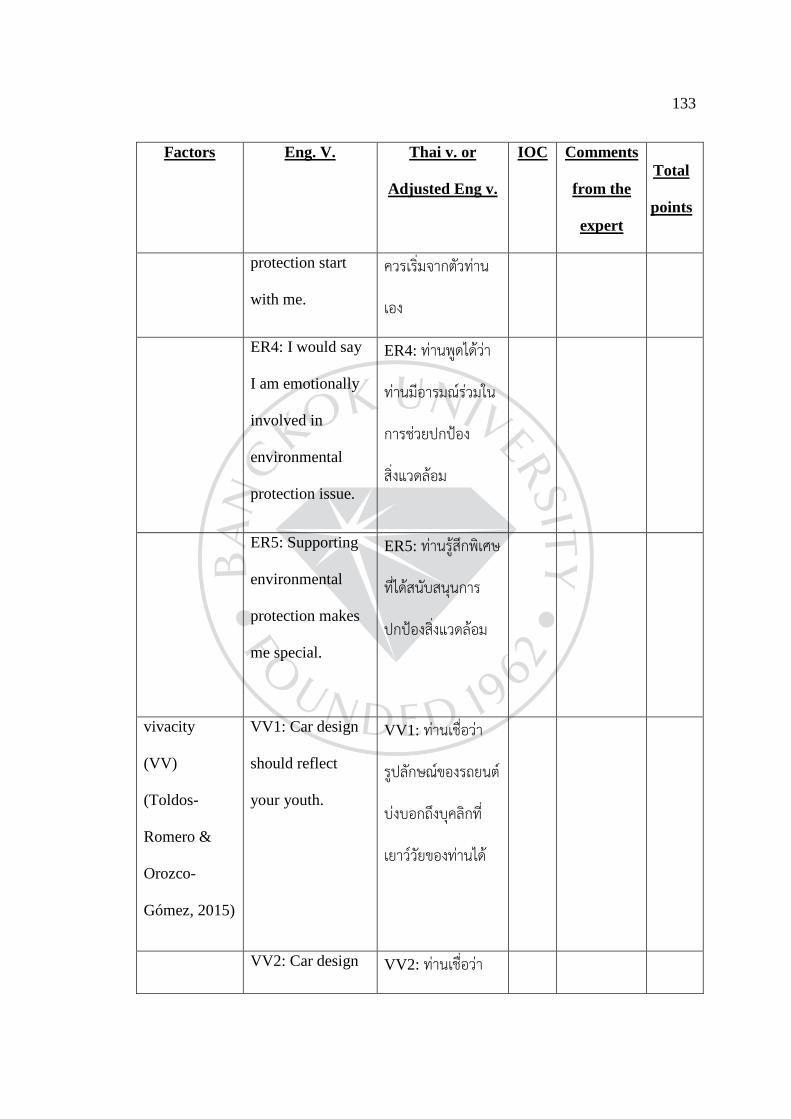
133
Factors Eng. V. Thai v. or
Adjusted Eng v.
IOC Comments
from the
expert
Total
points
protection start
with me.
ควรเริ่มจากตัวทาน
เอง
ER4: I would say
I am emotionally
involved in
environmental
protection issue.
ER4: ทานพูดไดวา
ทานมีอารมณรวมใน
การชวยปกปอง
สิ่งแวดลอม
ER5: Supporting
environmental
protection makes
me special.
ER5: ทานรูสึกพิเศษ
ท่ีไดสนับสนุนการ
ปกปองสิ่งแวดลอม
vivacity
(VV)
(Toldos-
Romero &
Orozco-
Gómez, 2015)
VV1: Car design
should reflect
your youth.
VV1: ทานเชื่อวา
รูปลักษณของรถยนต
บงบอกถึงบุคลิกท่ี
เยาววัยของทานได
VV2: Car design VV2: ทานเชื่อวา
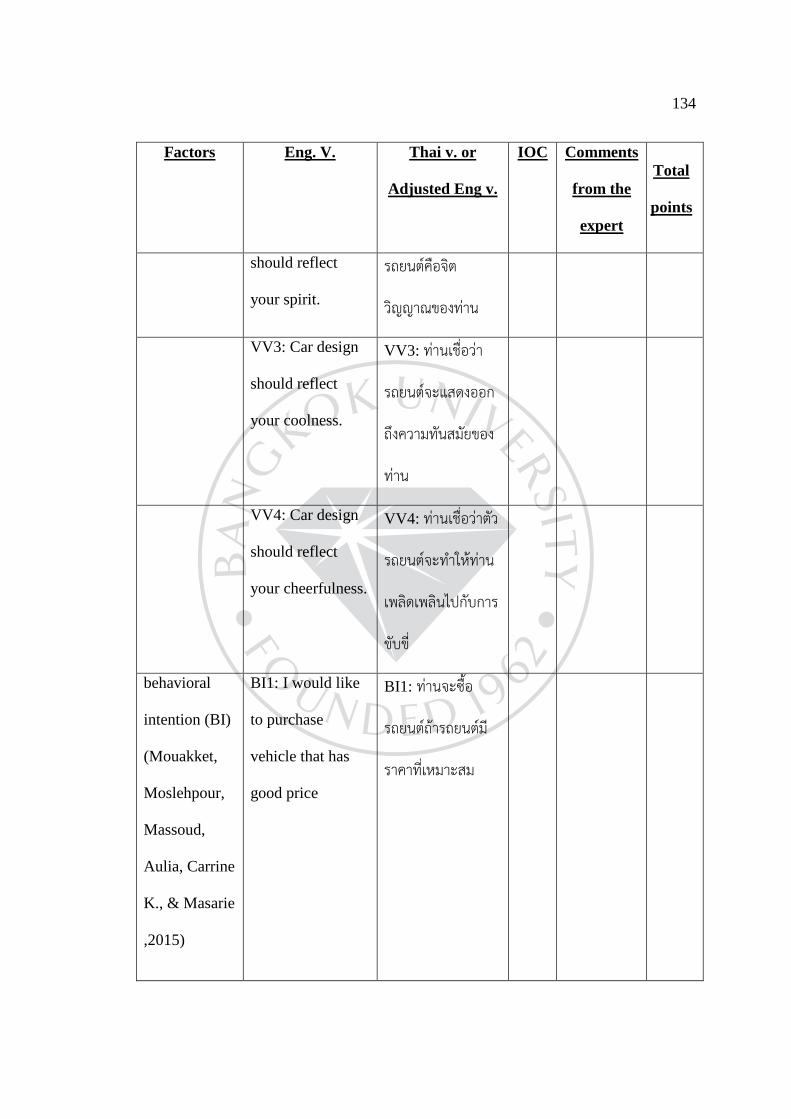
134
Factors Eng. V. Thai v. or
Adjusted Eng v.
IOC Comments
from the
expert
Total
points
should reflect
your spirit.
รถยนตคือจิต
วิญญาณของทาน
VV3: Car design
should reflect
your coolness.
VV3: ทานเชื่อวา
รถยนตจะแสดงออก
ถึงความทันสมัยของ
ทาน
VV4: Car design
should reflect
your cheerfulness.
VV4: ทานเชื่อวาตัว
รถยนตจะทําใหทาน
เพลิดเพลินไปกับการ
ขับข่ี
behavioral
intention (BI)
(Mouakket,
Moslehpour,
Massoud,
Aulia, Carrine
K., & Masarie
,2015)
BI1: I would like
to purchase
vehicle that has
good price
BI1: ทานจะซ้ือ
รถยนตถารถยนตมี
ราคาท่ีเหมาะสม
135
Factors Eng. V. Thai v. or
Adjusted Eng v.
IOC Comments
from the
expert
Total
points
BI2: I intend to
use cloud
computing
classroom to print
project, papers or
assignments this
term.
BI2: ทานตั้งใจจะซ้ือ
รถยนตเร็วๆ นี ้
BI2: I intend to
purchase vehicle
soon.
BI3: I encourage
my friends to try
Taiwanese bakery
product.
BI3: ทานจะแนะนํา
ใหเพ่ือนๆ ของทาน
ซ้ือรถยนตโดย
พิจารณาจากปจจัย
ในแบบสอบถามนี้
BI3: I will
recommended my
friend to purchase
vehicle by
considering
factors in this
questionnaire.
BI4: I will BI4: ทานจะแนะนํา
136
Factors Eng. V. Thai v. or
Adjusted Eng v.
IOC Comments
from the
expert
Total
points
recommended
cloud computing
classroom to
others.
ใหญาติพ่ีนองของ
ทานซ้ือรถยนตโดย
พิจารณาจากปจจัย
ในแบบสอบถามนี้
BI4: I encourage
my relative to
purchase vehicle
by considering
factors in this
questionnaire.
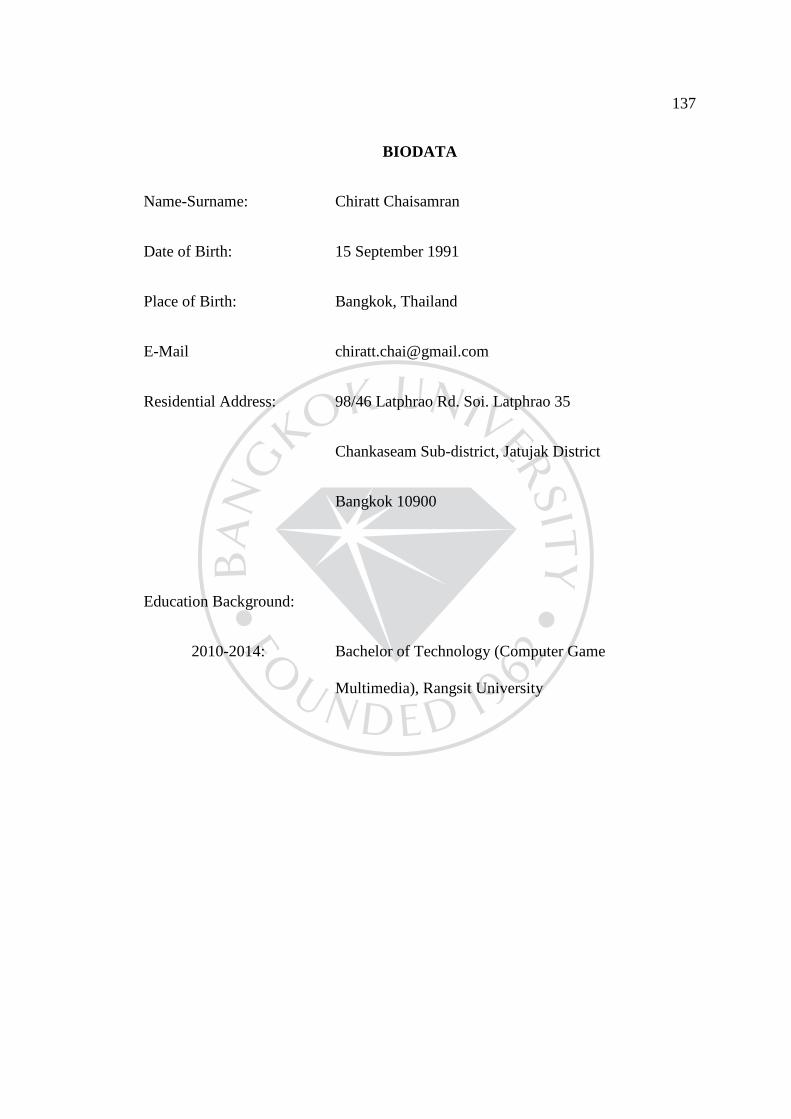
137
BIODATA
Name-Surname: Chiratt Chaisamran
Date of Birth: 15 September 1991
Place of Birth: Bangkok, Thailand
E-Mail [email protected]
Residential Address: 98/46 Latphrao Rd. Soi. Latphrao 35
Chankaseam Sub-district, Jatujak District
Bangkok 10900
Education Background:
2010-2014: Bachelor of Technology (Computer Game
Multimedia), Rangsit University
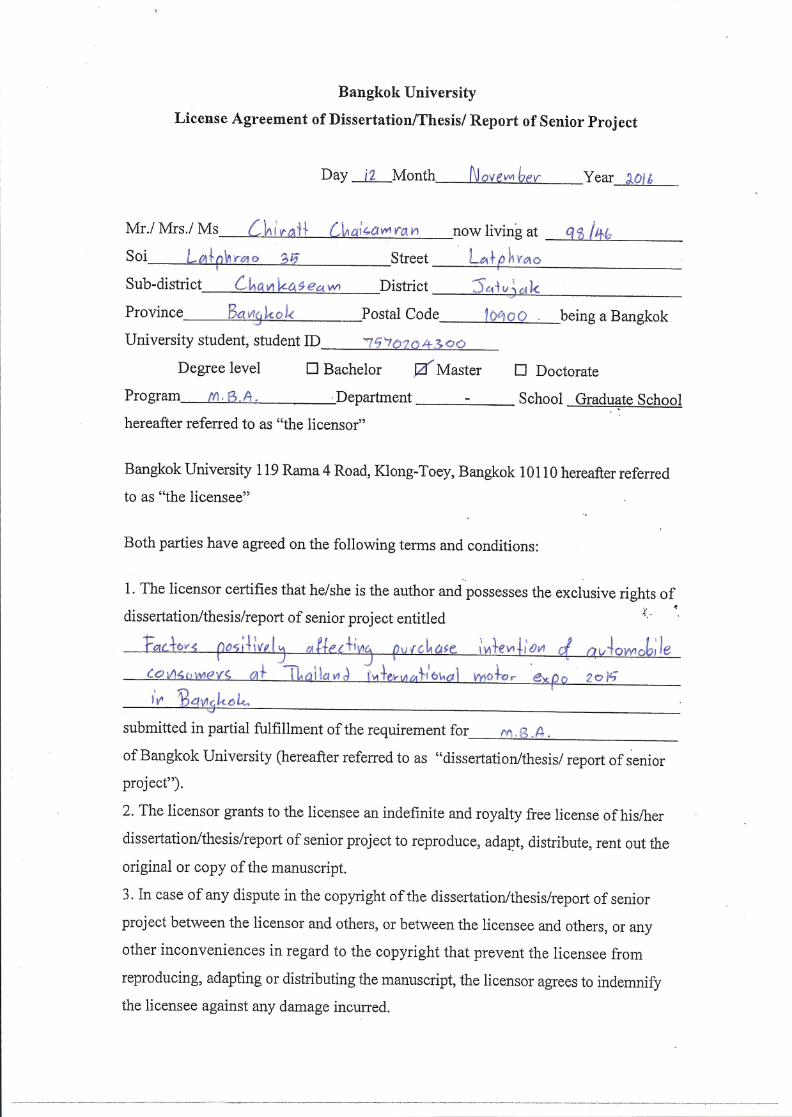

Recommended