20
15
Factsof the Property and Casualty Insurance Industry in Canada
Facts of the Property and Casualty Insurance Industry in Canada 2015
Facts of the Property and Casualty Insurance Industry in Canada 2015 is published by Insurance Bureau of
Canada (IBC). IBC is the trade association representing Canada’s private property and casualty (P&C) insurance
companies. Since 1972, IBC has published Facts to provide a snapshot of the state of the P&C insurance industry.
The data in Facts 2015 come from several national and international sources, including IBC. Data are from 2012,
2013, 2014 or 2015, depending on when sources released their information.
In some instances, fi gures may not add up to 100% as a result of rounding. Also, because sources collect data
in diff erent ways, there can be small diff erences among similar data.
37th edition, 2015 ISSN 1197 3404
© Insurance Bureau of Canada. All rights reserved.
IBC Facts 2015 • • • 1
President’s message
The year 2014 held many highlights for IBC as we
celebrated our 50th anniversary as the trade association
representing Canada’s private home, car and business
insurers.
For me, those highlights refl ected IBC’s successful
approach to leadership. We led eff ectively by stepping
forward as a valued partner.
In October, IBC took the lead in furthering the
much-needed national conversation on earthquake
preparedness by hosting a national earthquake
symposium in Vancouver, which was the fi rst event
of its kind in Canada. The 160 participants – scientists,
politicians, senior government staff and insurance
professionals – clearly found the symposium worthwhile,
and IBC has committed to creating further opportunities
for engagement. Steven Blaney, Canada’s Minister of
Public Safety and Emergency Preparedness, told the
audience that he was proud to have IBC on board.
“We will win on this issue [of earthquake preparedness]
and make Canadians safer if we work together in
partnership,” he said.
By working in partnership with the federal government,
IBC will build on the success of the symposium to make
the business case for a Natural Catastrophe Strategy, to
protect Canadians from the double threat of a major
earthquake and weather-related catastrophes, such as
fl ooding.
Leadership and partnership have gone hand in hand on
several other important IBC fi les. For example, we are
collaborating with the federal government in updating
Canada’s fl ood maps, which is crucial to reducing the risk
of fl ood damage across the country.
In another example, recently we partnered with the
Canadian Trucking Alliance in joint leadership to advance
the fi ght against cargo theft by establishing a national
reporting program. The program helps police, truckers
and insurers stem the fl ow of stolen goods, and thwart
the work of organized crime rings that cost our economy
$5 billion a year.
In 2015, we will continue to collaborate with
governments and partner with like-minded organizations
to make a positive diff erence in lives of Canadians. We
will do this at the same time as we lead the conversation
on the key priority issues for our industry:
• Driving change in Ontario auto reforms
• Advancing development of a Natural
Catastrophe Strategy
• Achieving a balanced regulatory environment.
Another way to understand our industry’s achievements
– and challenges – is through the numbers. IBC’s Facts
2015 is a snapshot of those numbers. Inside, you’ll fi nd all
of the benchmarks insurers use to measure their work,
including how much insurers collected in insurance
premiums, and how much they paid out in claims on
home, car and business insurance. You’ll also learn how
much our industry paid in taxes to various governments,
and how much insurers have in total and invested assets.
The numbers, the priorities, the partnerships and the
leadership successes – all of this information is crucial to
telling our industry’s story. We hope you fi nd this edition
of IBC’s Facts informative and insightful.
Don Forgeron
President and CEO,
Insurance Bureau of Canada
2 • • • IBC Facts 2015
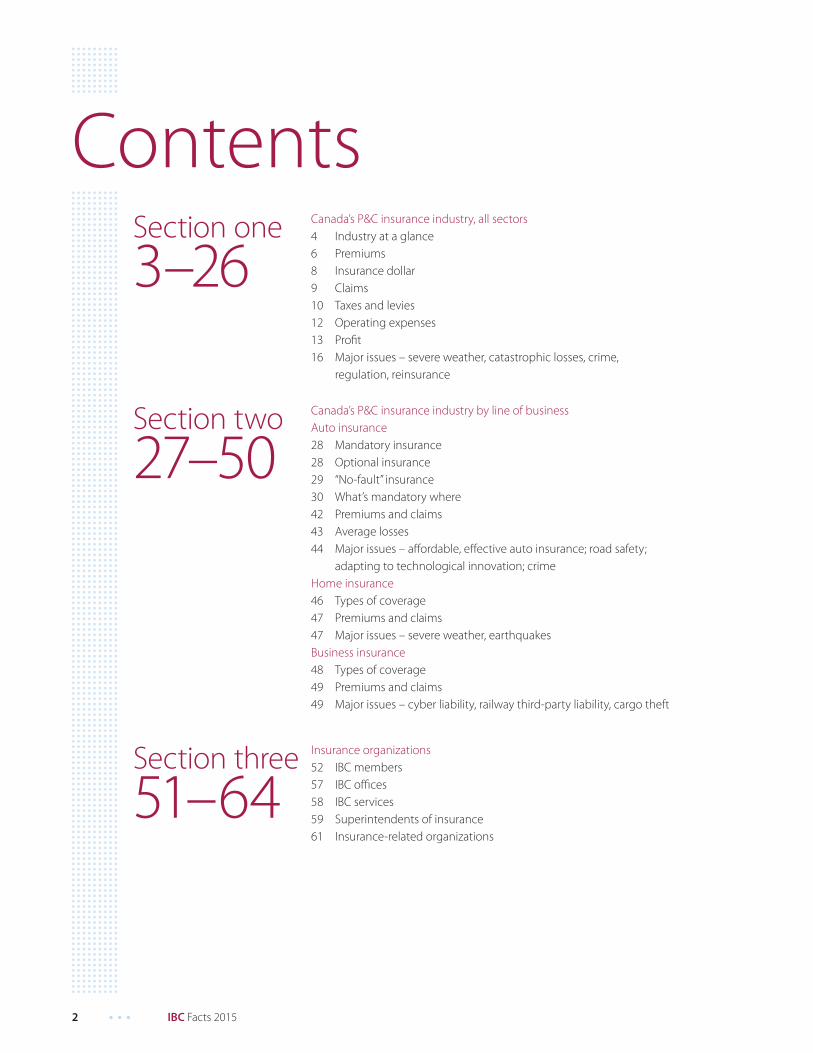
ContentsSection one
3–26Canada’s P&C insurance industry, all sectors
4 Industry at a glance
6 Premiums
8 Insurance dollar
9 Claims
10 Taxes and levies
12 Operating expenses
13 Profi t
16 Major issues – severe weather, catastrophic losses, crime,
regulation, reinsurance
Section three
51–64Insurance organizations
52 IBC members
57 IBC offi ces
58 IBC services
59 Superintendents of insurance
61 Insurance-related organizations
Section two
27–50Canada’s P&C insurance industry by line of business
Auto insurance
28 Mandatory insurance
28 Optional insurance
29 “No-fault” insurance
30 What’s mandatory where
42 Premiums and claims
43 Average losses
44 Major issues – aff ordable, eff ective auto insurance; road safety;
adapting to technological innovation; crime
Home insurance
46 Types of coverage
47 Premiums and claims
47 Major issues – severe weather, earthquakes
Business insurance
48 Types of coverage
49 Premiums and claims
49 Major issues – cyber liability, railway third-party liability, cargo theft
Canada’s P&C insurance industry,
all sectors
1
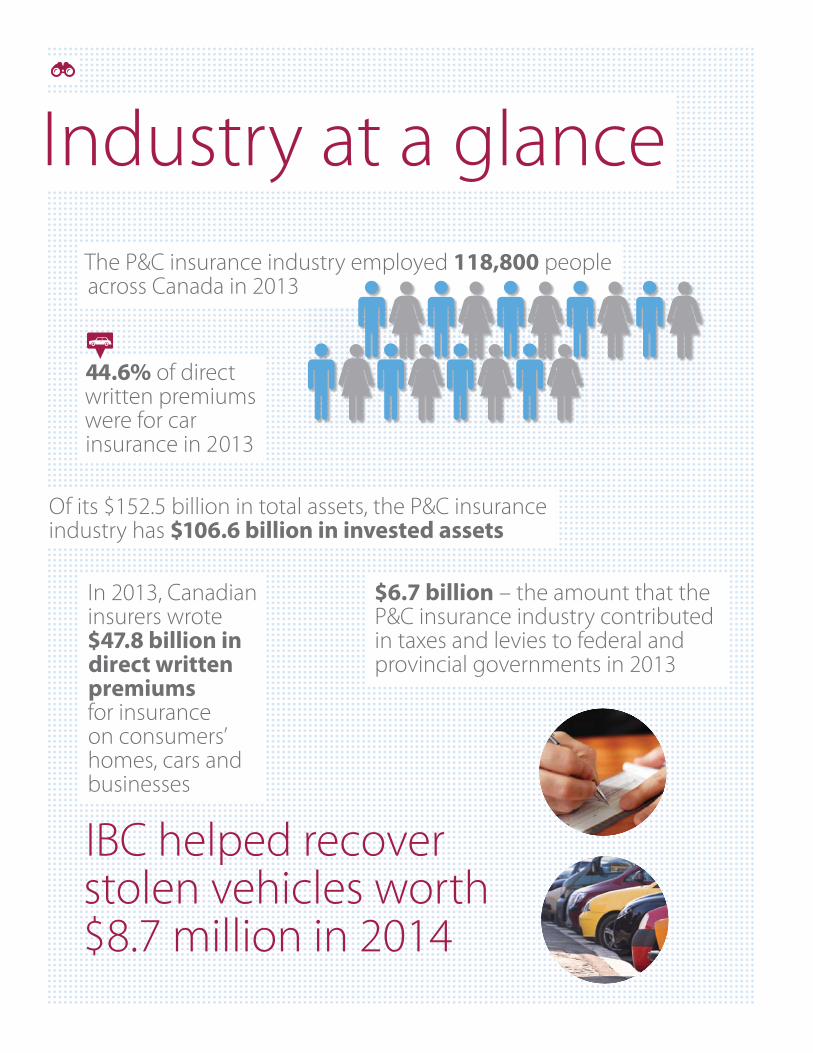
Industry at a glance
Of its $152.5 billion in total assets, the P&C insurance industry has $106.6 billion in invested assets
44.6% of direct written premiums were for car insurance in 2013
IBC helped recover stolen vehicles worth $8.7 million in 2014
In 2013, Canadian insurers wrote $47.8 billion in direct written premiums for insurance on consumers’ homes, cars and businesses
The P&C insurance industry employed 118,800 people across Canada in 2013
$6.7 billion – the amount that the P&C insurance industry contributed in taxes and levies to federal and provincial governments in 2013
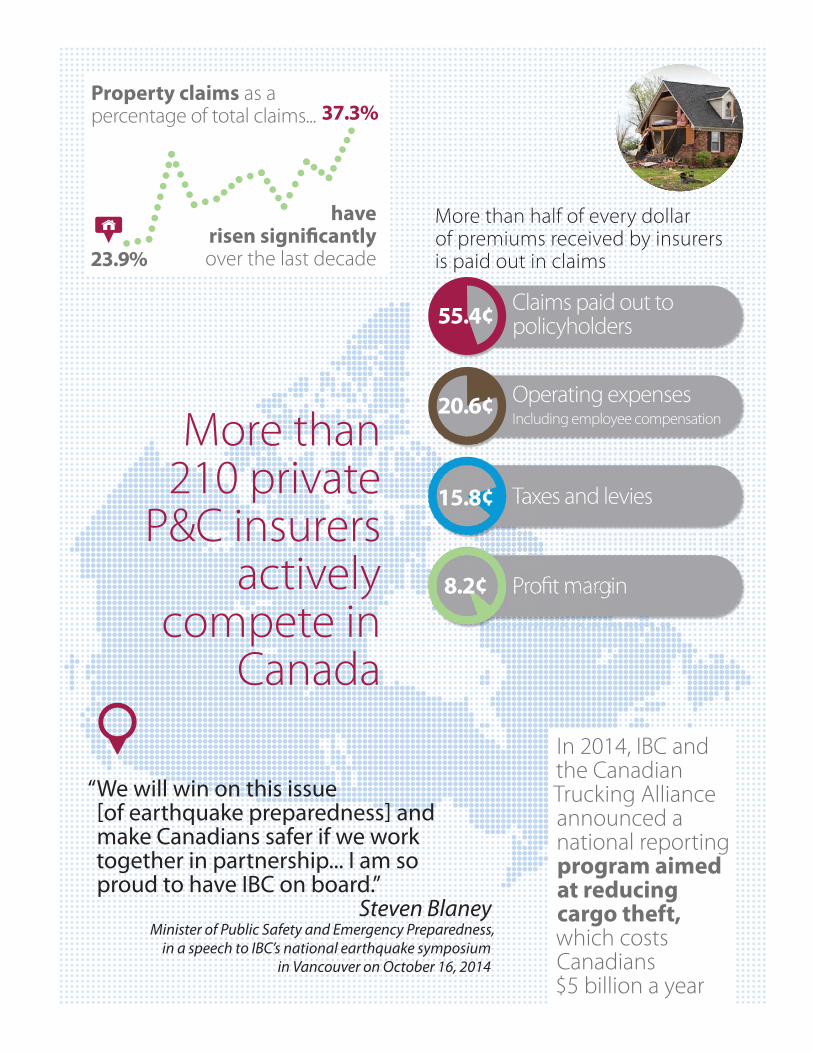
In 2014, IBC and the Canadian Trucking Alliance announced a national reporting program aimed at reducing cargo theft,, which costs Canadians $5 billion a year
“ We will win on this issue [of earthquake preparedness] and make Canadians safer if we work together in partnership... I am so proud to have IBC on board.”
Steven BlaneyMinister of Public Safety and Emergency Preparedness,
in a speech to IBC’s national earthquake symposium in Vancouver on October 16, 2014
More than 210 private
P&C insurers actively
compete in Canada
More than half of every dollar of premiums received by insurers is paid out in claims
Operating expensesIncluding employee compensation
Taxes and levies
Profi t margin
Claims paid out topolicyholders55.4¢
20.6¢
15.8¢
8.2¢
Property claims as a percentage of total claims...
have risen signifi cantly over the last decade23.9%
37.3%
6 • • • IBC Facts 2015
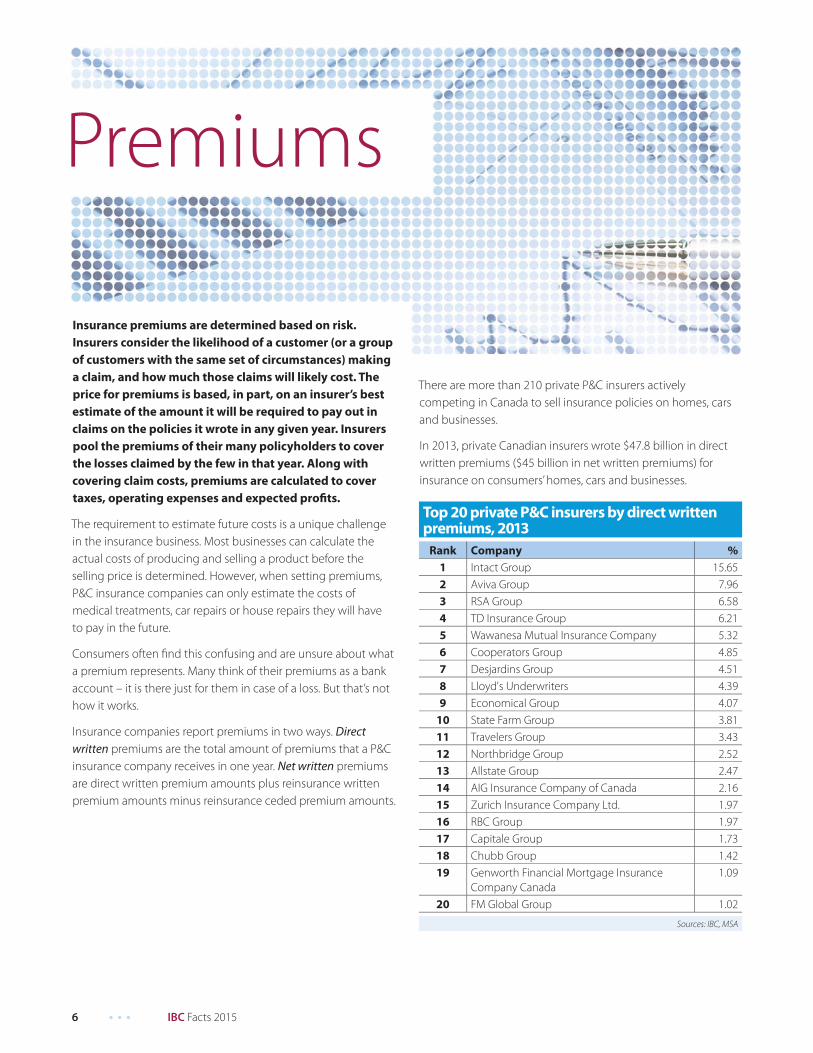
Premiums
There are more than 210 private P&C insurers actively
competing in Canada to sell insurance policies on homes, cars
and businesses.
In 2013, private Canadian insurers wrote $47.8 billion in direct
written premiums ($45 billion in net written premiums) for
insurance on consumers’ homes, cars and businesses.
Top 20 private P&C insurers by direct written premiums, 2013
Rank Company %
1 Intact Group 15.65
2 Aviva Group 7.96
3 RSA Group 6.58
4 TD Insurance Group 6.21
5 Wawanesa Mutual Insurance Company 5.32
6 Cooperators Group 4.85
7 Desjardins Group 4.51
8 Lloyd's Underwriters 4.39
9 Economical Group 4.07
10 State Farm Group 3.81
11 Travelers Group 3.43
12 Northbridge Group 2.52
13 Allstate Group 2.47
14 AIG Insurance Company of Canada 2.16
15 Zurich Insurance Company Ltd. 1.97
16 RBC Group 1.97
17 Capitale Group 1.73
18 Chubb Group 1.42
19 Genworth Financial Mortgage Insurance
Company Canada
1.09
20 FM Global Group 1.02
Sources: IBC, MSA
Insurance premiums are determined based on risk.
Insurers consider the likelihood of a customer (or a group
of customers with the same set of circumstances) making
a claim, and how much those claims will likely cost. The
price for premiums is based, in part, on an insurer’s best
estimate of the amount it will be required to pay out in
claims on the policies it wrote in any given year. Insurers
pool the premiums of their many policyholders to cover
the losses claimed by the few in that year. Along with
covering claim costs, premiums are calculated to cover
taxes, operating expenses and expected profi ts.
The requirement to estimate future costs is a unique challenge
in the insurance business. Most businesses can calculate the
actual costs of producing and selling a product before the
selling price is determined. However, when setting premiums,
P&C insurance companies can only estimate the costs of
medical treatments, car repairs or house repairs they will have
to pay in the future.
Consumers often fi nd this confusing and are unsure about what
a premium represents. Many think of their premiums as a bank
account – it is there just for them in case of a loss. But that’s not
how it works.
Insurance companies report premiums in two ways. Direct written premiums are the total amount of premiums that a P&C
insurance company receives in one year. Net written premiums
are direct written premium amounts plus reinsurance written
premium amounts minus reinsurance ceded premium amounts.
IBC Facts 2015 • • • 7
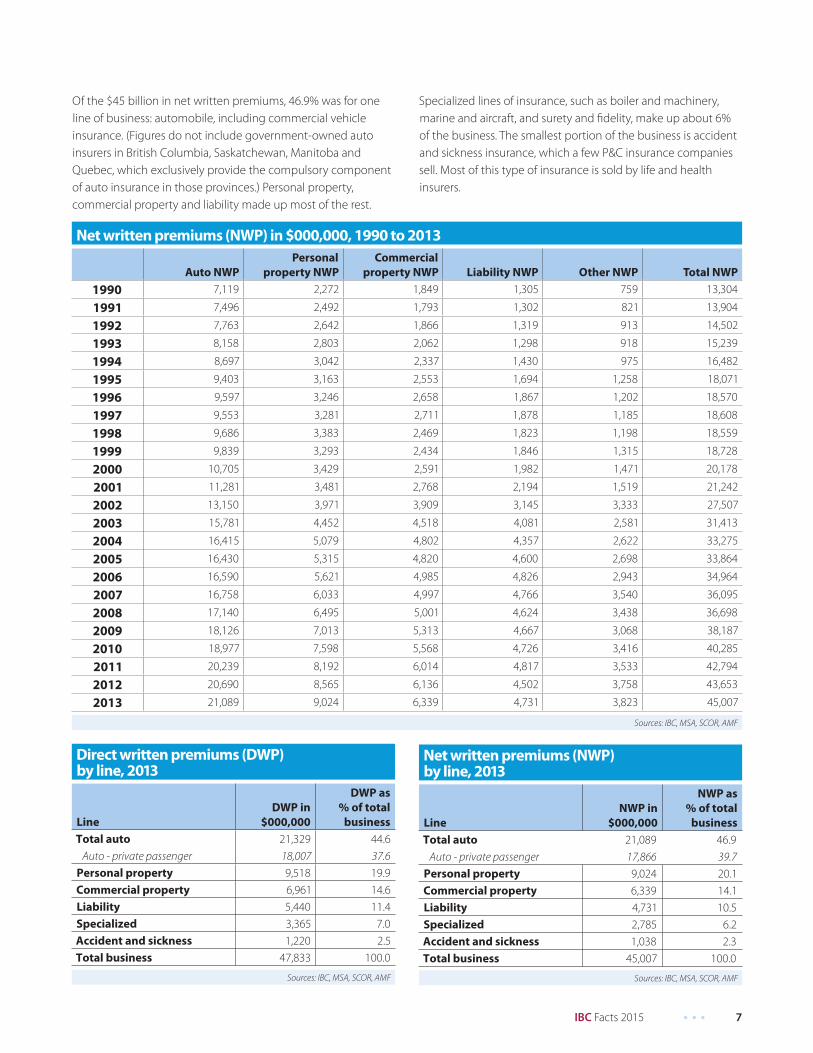
Net written premiums (NWP) in $000,000, 1990 to 2013
Auto NWP
Personal
property NWP
Commercial
property NWP Liability NWP Other NWP Total NWP
1990 7,119 2,272 1,849 1,305 759 13,304
1991 7,496 2,492 1,793 1,302 821 13,904
1992 7,763 2,642 1,866 1,319 913 14,502
1993 8,158 2,803 2,062 1,298 918 15,239
1994 8,697 3,042 2,337 1,430 975 16,482
1995 9,403 3,163 2,553 1,694 1,258 18,071
1996 9,597 3,246 2,658 1,867 1,202 18,570
1997 9,553 3,281 2,711 1,878 1,185 18,608
1998 9,686 3,383 2,469 1,823 1,198 18,559
1999 9,839 3,293 2,434 1,846 1,315 18,728
2000 10,705 3,429 2,591 1,982 1,471 20,178
2001 11,281 3,481 2,768 2,194 1,519 21,242
2002 13,150 3,971 3,909 3,145 3,333 27,507
2003 15,781 4,452 4,518 4,081 2,581 31,413
2004 16,415 5,079 4,802 4,357 2,622 33,275
2005 16,430 5,315 4,820 4,600 2,698 33,864
2006 16,590 5,621 4,985 4,826 2,943 34,964
2007 16,758 6,033 4,997 4,766 3,540 36,095
2008 17,140 6,495 5,001 4,624 3,438 36,698
2009 18,126 7,013 5,313 4,667 3,068 38,187
2010 18,977 7,598 5,568 4,726 3,416 40,285
2011 20,239 8,192 6,014 4,817 3,533 42,794
2012 20,690 8,565 6,136 4,502 3,758 43,653
2013 21,089 9,024 6,339 4,731 3,823 45,007
Sources: IBC, MSA, SCOR, AMF
Direct written premiums (DWP) by line, 2013
Line
DWP in
$000,000
DWP as
% of total
business
Total auto 21,329 44.6
Auto - private passenger 18,007 37.6
Personal property 9,518 19.9
Commercial property 6,961 14.6
Liability 5,440 11.4
Specialized 3,365 7.0
Accident and sickness 1,220 2.5
Total business 47,833 100.0
Sources: IBC, MSA, SCOR, AMF
Net written premiums (NWP) by line, 2013
Line
NWP in
$000,000
NWP as
% of total
business
Total auto 21,089 46.9
Auto - private passenger 17,866 39.7
Personal property 9,024 20.1
Commercial property 6,339 14.1
Liability 4,731 10.5
Specialized 2,785 6.2
Accident and sickness 1,038 2.3
Total business 45,007 100.0
Sources: IBC, MSA, SCOR, AMF
Of the $45 billion in net written premiums, 46.9% was for one
line of business: automobile, including commercial vehicle
insurance. (Figures do not include government-owned auto
insurers in British Columbia, Saskatchewan, Manitoba and
Quebec, which exclusively provide the compulsory component
of auto insurance in those provinces.) Personal property,
commercial property and liability made up most of the rest.
Specialized lines of insurance, such as boiler and machinery,
marine and aircraft, and surety and fi delity, make up about 6%
of the business. The smallest portion of the business is accident
and sickness insurance, which a few P&C insurance companies
sell. Most of this type of insurance is sold by life and health
insurers.
8 • • • IBC Facts 2015
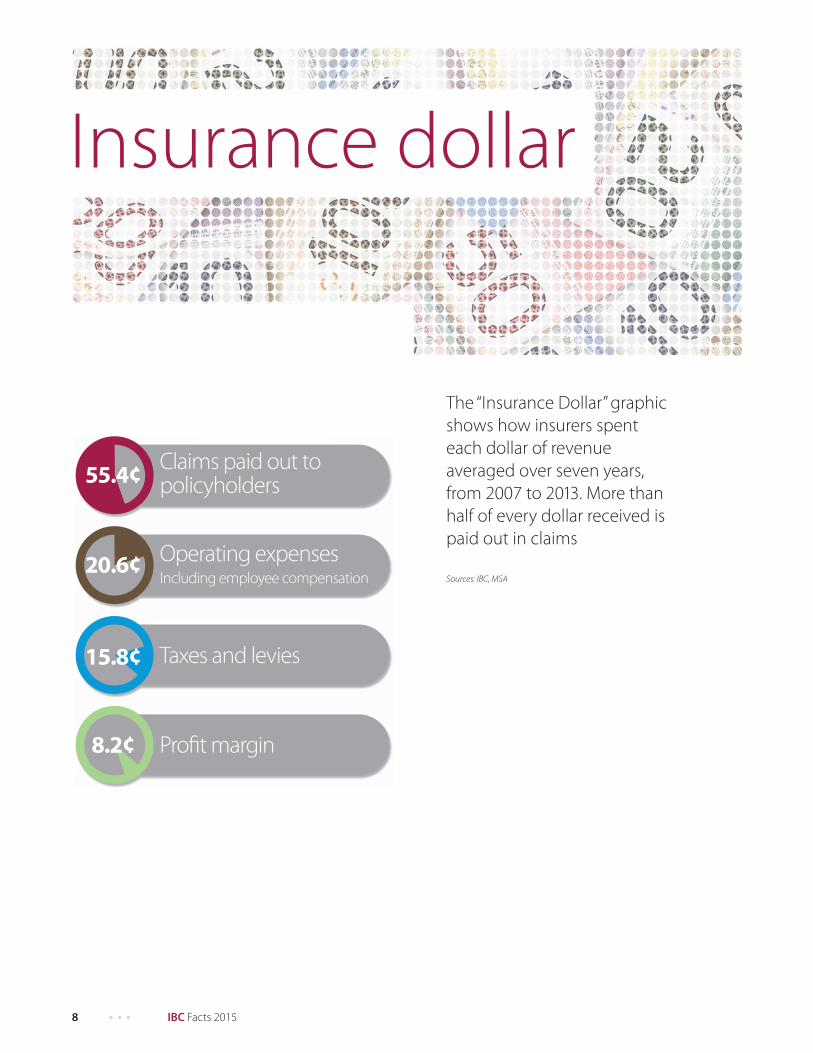
The “Insurance Dollar” graphic
shows how insurers spent
each dollar of revenue
averaged over seven years,
from 2007 to 2013. More than
half of every dollar received is
paid out in claims
Claims paid out topolicyholders
Insurance dollar
p y
Operating expensesIncluding employee compensation
Taxes and levies
Profi t margin
Claims paid out topolicyholders55.4¢
20.6¢
15.8¢
8.2¢
Sources: IBC, MSA
IBC Facts 2015 • • • 9
Net claims incurred (NCI) in $000,000, 1990 to 2013
Auto NCI
Personal
property NCI
Commercial
property NCI Liability NCI Other NCI Total NCI
1990 6,022 1,515 1,313 894 486 10,230
1991 5,799 1,920 1,516 943 498 10,676
1992 6,074 1,907 1,532 1,064 578 11,154
1993 6,420 1,974 1,430 1,004 661 11,490
1994 6,892 1,955 1,493 1,159 545 12,043
1995 7,342 2,003 1,504 1,218 773 12,840
1996 7,034 2,301 1,665 1,449 761 13,210
1997 7,221 2,112 1,838 1,406 613 13,190
1998 7,185 2,523 2,089 1,275 696 13,768
1999 7,475 2,152 1,758 1,438 659 13,483
2000 8,443 2,286 1,847 1,430 784 14,790
2001 9,431 2,316 2,031 1,495 887 16,161
2002 10,844 2,352 2,195 2,085 2,019 19,494
2003 12,028 2,574 2,161 2,632 993 20,388
2004 11,081 2,921 2,033 3,263 864 20,161
2005 10,626 3,570 3,356 3,071 944 21,568
2006 10,968 3,556 2,173 2,577 1,052 20,326
2007 11,753 3,842 2,589 2,642 990 21,817
2008 12,997 4,720 3,157 2,726 1,404 25,003
2009 13,472 5,071 3,454 2,878 1,464 26,338
2010 15,205 4,566 3,276 2,766 1,475 27,288
2011 14,607 5,336 4,087 2,977 1,560 28,567
2012 14,731 5,013 3,981 2,615 1,479 27,817
2013 15,125 6,161 4,699 2,486 1,650 30,120
Sources: IBC, MSA, SCOR, AMF
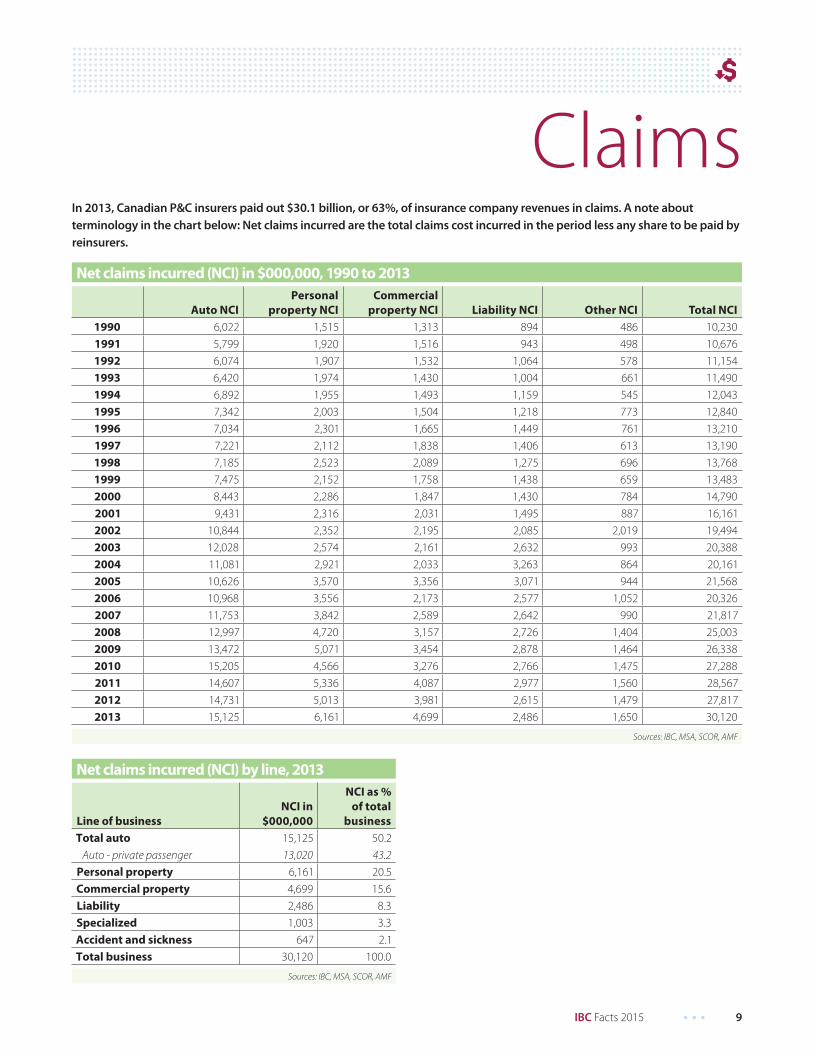
In 2013, Canadian P&C insurers paid out $30.1 billion, or 63%, of insurance company revenues in claims. A note about terminology in the chart below: Net claims incurred are the total claims cost incurred in the period less any share to be paid by reinsurers.
Net claims incurred (NCI) by line, 2013
Line of business
NCI in
$000,000
NCI as %
of total
business
Total auto 15,125 50.2
Auto - private passenger 13,020 43.2
Personal property 6,161 20.5
Commercial property 4,699 15.6
Liability 2,486 8.3
Specialized 1,003 3.3
Accident and sickness 647 2.1
Total business 30,120 100.0
Sources: IBC, MSA, SCOR, AMF
Claims
10 • • • IBC Facts 2015
Taxes and levies
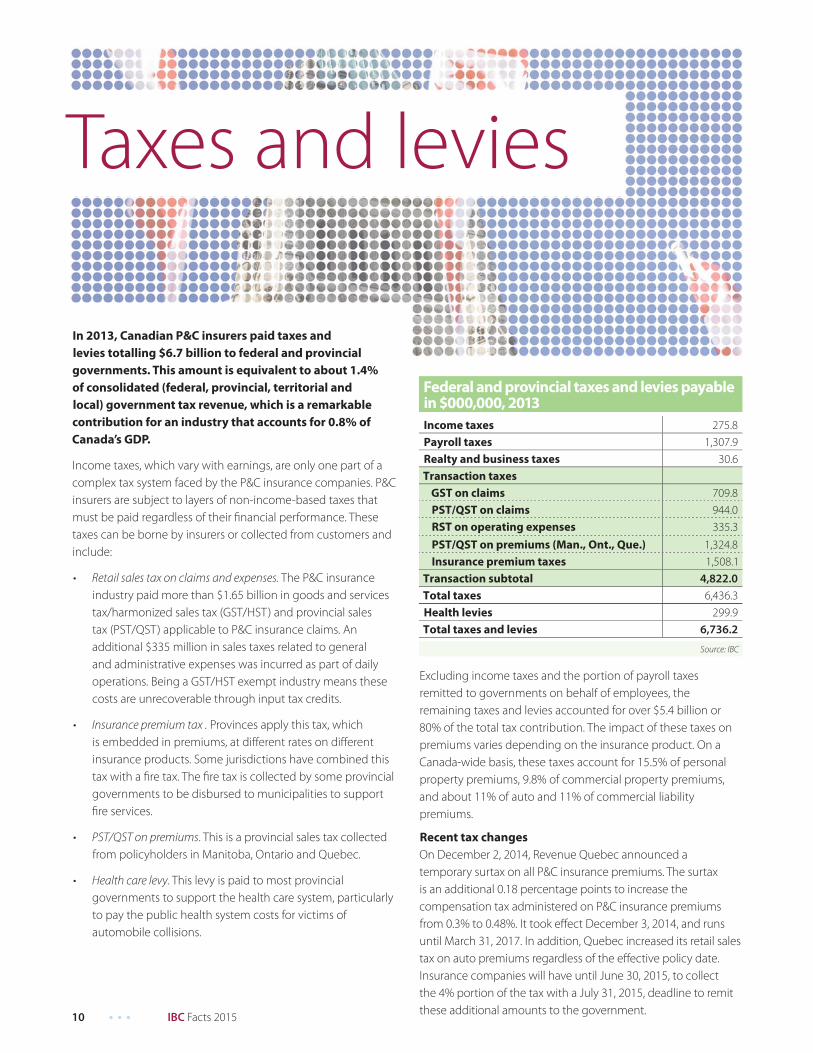
In 2013, Canadian P&C insurers paid taxes and
levies totalling $6.7 billion to federal and provincial
governments. This amount is equivalent to about 1.4%
of consolidated (federal, provincial, territorial and
local) government tax revenue, which is a remarkable
contribution for an industry that accounts for 0.8% of
Canada’s GDP.
Income taxes, which vary with earnings, are only one part of a
complex tax system faced by the P&C insurance companies. P&C
insurers are subject to layers of non-income-based taxes that
must be paid regardless of their fi nancial performance. These
taxes can be borne by insurers or collected from customers and
include:
• Retail sales tax on claims and expenses. The P&C insurance
industry paid more than $1.65 billion in goods and services
tax/harmonized sales tax (GST/HST) and provincial sales
tax (PST/QST) applicable to P&C insurance claims. An
additional $335 million in sales taxes related to general
and administrative expenses was incurred as part of daily
operations. Being a GST/HST exempt industry means these
costs are unrecoverable through input tax credits.
• Insurance premium tax . Provinces apply this tax, which
is embedded in premiums, at diff erent rates on diff erent
insurance products. Some jurisdictions have combined this
tax with a fi re tax. The fi re tax is collected by some provincial
governments to be disbursed to municipalities to support
fi re services.
• PST/QST on premiums. This is a provincial sales tax collected
from policyholders in Manitoba, Ontario and Quebec.
• Health care levy. This levy is paid to most provincial
governments to support the health care system, particularly
to pay the public health system costs for victims of
automobile collisions.
Federal and provincial taxes and levies payable in $000,000, 2013
Income taxes 275.8
Payroll taxes 1,307.9
Realty and business taxes 30.6
Transaction taxes
GST on claims 709.8
PST/QST on claims 944.0
RST on operating expenses 335.3
PST/QST on premiums (Man., Ont., Que.) 1,324.8
Insurance premium taxes 1,508.1
Transaction subtotal 4,822.0Total taxes 6,436.3
Health levies 299.9
Total taxes and levies 6,736.2
Source: IBC
Excluding income taxes and the portion of payroll taxes
remitted to governments on behalf of employees, the
remaining taxes and levies accounted for over $5.4 billion or
80% of the total tax contribution. The impact of these taxes on
premiums varies depending on the insurance product. On a
Canada-wide basis, these taxes account for 15.5% of personal
property premiums, 9.8% of commercial property premiums,
and about 11% of auto and 11% of commercial liability
premiums.
Recent tax changes
On December 2, 2014, Revenue Quebec announced a
temporary surtax on all P&C insurance premiums. The surtax
is an additional 0.18 percentage points to increase the
compensation tax administered on P&C insurance premiums
from 0.3% to 0.48%. It took eff ect December 3, 2014, and runs
until March 31, 2017. In addition, Quebec increased its retail sales
tax on auto premiums regardless of the eff ective policy date.
Insurance companies will have until June 30, 2015, to collect
the 4% portion of the tax with a July 31, 2015, deadline to remit
these additional amounts to the government.
IBC Facts 2015 • • • 11
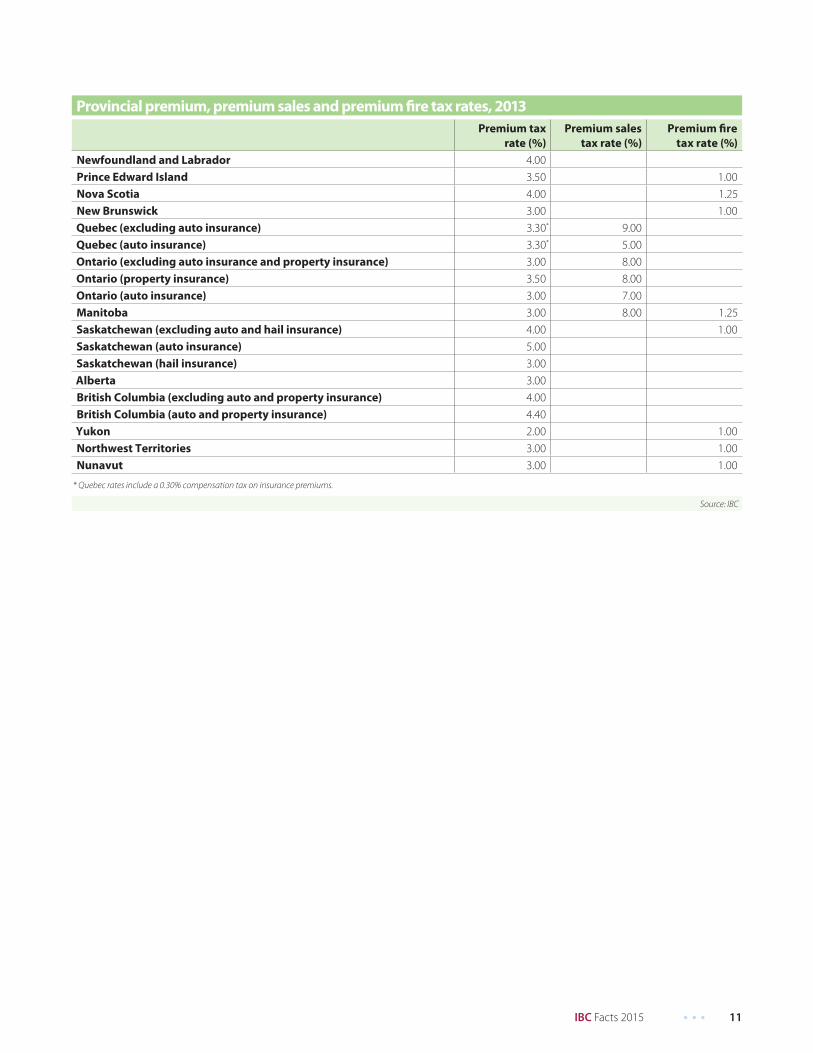
Provincial premium, premium sales and premium fi re tax rates, 2013
Premium tax
rate (%)
Premium sales
tax rate (%)
Premium fi re
tax rate (%)
Newfoundland and Labrador 4.00
Prince Edward Island 3.50 1.00
Nova Scotia 4.00 1.25
New Brunswick 3.00 1.00
Quebec (excluding auto insurance) 3.30* 9.00
Quebec (auto insurance) 3.30* 5.00
Ontario (excluding auto insurance and property insurance) 3.00 8.00
Ontario (property insurance) 3.50 8.00
Ontario (auto insurance) 3.00 7.00
Manitoba 3.00 8.00 1.25
Saskatchewan (excluding auto and hail insurance) 4.00 1.00
Saskatchewan (auto insurance) 5.00
Saskatchewan (hail insurance) 3.00
Alberta 3.00
British Columbia (excluding auto and property insurance) 4.00
British Columbia (auto and property insurance) 4.40
Yukon 2.00 1.00
Northwest Territories 3.00 1.00
Nunavut 3.00 1.00
* Quebec rates include a 0.30% compensation tax on insurance premiums.
Source: IBC
12 • • • IBC Facts 2015
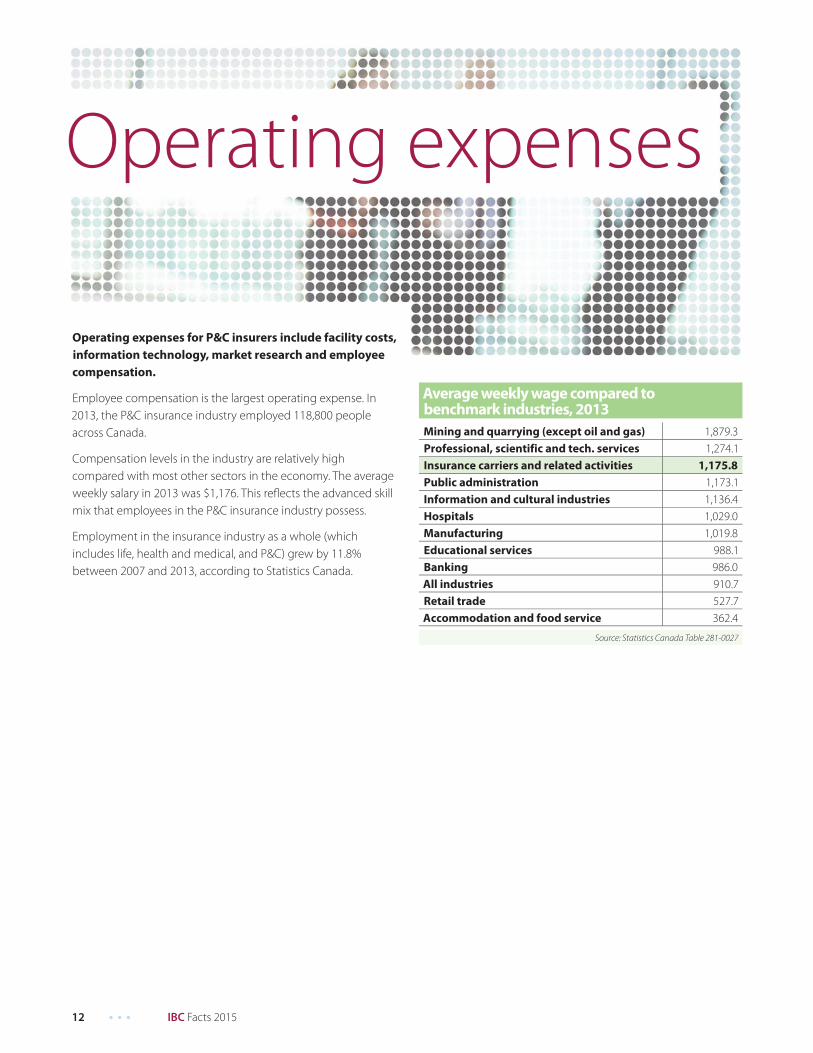
Average weekly wage compared tobenchmark industries, 2013
Mining and quarrying (except oil and gas) 1,879.3
Professional, scientific and tech. services 1,274.1
Insurance carriers and related activities 1,175.8
Public administration 1,173.1
Information and cultural industries 1,136.4
Hospitals 1,029.0
Manufacturing 1,019.8
Educational services 988.1
Banking 986.0
All industries 910.7
Retail trade 527.7
Accommodation and food service 362.4
Source: Statistics Canada Table 281-0027
Operating expenses
Operating expenses for P&C insurers include facility costs,
information technology, market research and employee
compensation.
Employee compensation is the largest operating expense. In
2013, the P&C insurance industry employed 118,800 people
across Canada.
Compensation levels in the industry are relatively high
compared with most other sectors in the economy. The average
weekly salary in 2013 was $1,176. This refl ects the advanced skill
mix that employees in the P&C insurance industry possess.
Employment in the insurance industry as a whole (which
includes life, health and medical, and P&C) grew by 11.8%
between 2007 and 2013, according to Statistics Canada.
IBC Facts 2015 • • • 13
The P&C insurance industry is highly regulated by government
and is required by law to invest its assets prudently. More than
80% of invested assets are placed in bonds.
Of its $152.5 billion in total assets, the P&C insurance industry
has $106.6 billion in invested assets. This makes the Canadian
P&C insurance industry a major stakeholder and investor in
the national economy. P&C insurers invest mainly in domestic
government and corporate bonds, and in preferred and
common stocks. These investments produce a steady fl ow
of income and balance the more variable income from the
underwriting side of the business, which tends to fl uctuate
from year to year.
Investments in $000,000 as of December 31, 2013
Bonds Shares Mortgages Real estate Term deposits Other Total
87,258 14,063 873 98 3,163 1,108 106,562
81.9% 13.2% 0.8% 0.1% 3.0% 1.0% 100.0%
Sources: IBC, MSA, SCOR, AMF
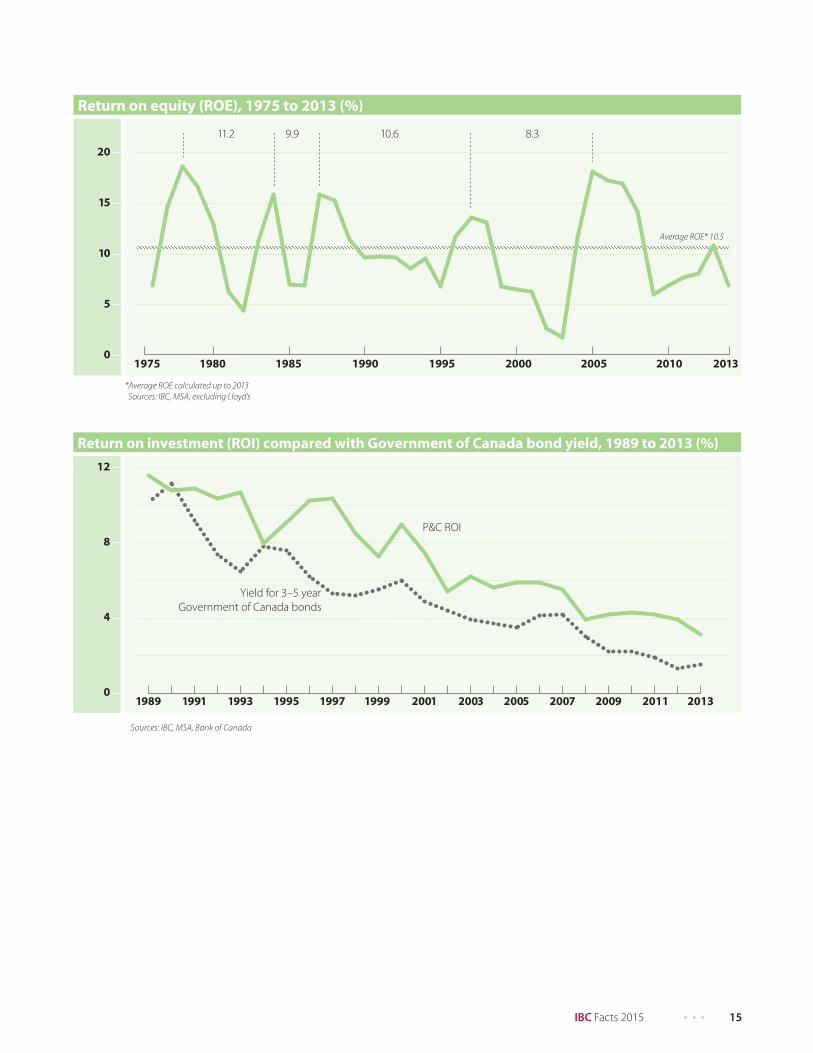
Profit
Profi t or return on equity in the P&C insurance industry
is cyclical. It has fl uctuated around an average of 10.4%
for the 38 years since 1975. The 2013 industry return on
equity was 6.9%.
Return on equity comes from two revenue streams –
underwriting and investment earnings.
In 2013, underwriting posted gains for the 11th consecutive
year. The 2013 net underwriting revenue was $648 million.
Before 2003, underwriting posted losses for 24 years in a row.
On investment, 2013 was a year of relatively low returns of 3.1%.
Return on investment moves in lockstep with the yields for
3- and 5-year Government of Canada bonds, which have fallen
for the last two decades. Investment income for 2013 was
$3.3 billion.
14 • • • IBC Facts 2015
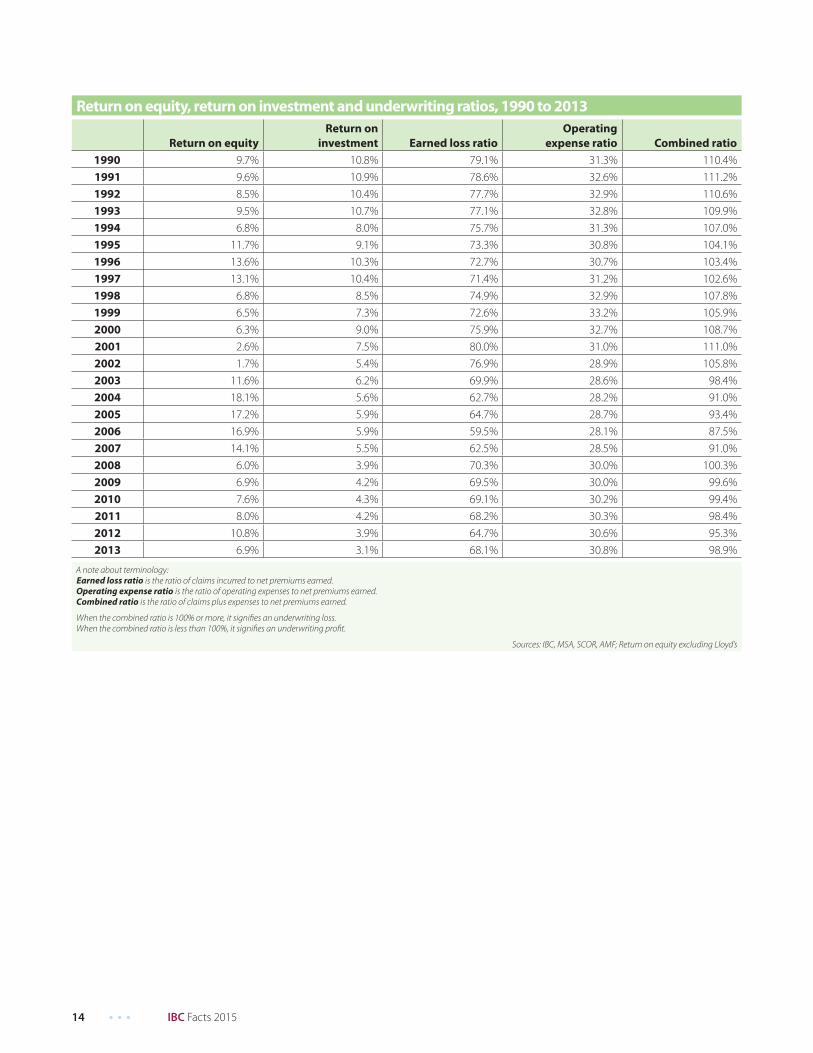
Return on equity, return on investment and underwriting ratios, 1990 to 2013
Return on equity
Return on
investment Earned loss ratio
Operating
expense ratio Combined ratio
1990 9.7% 10.8% 79.1% 31.3% 110.4%
1991 9.6% 10.9% 78.6% 32.6% 111.2%
1992 8.5% 10.4% 77.7% 32.9% 110.6%
1993 9.5% 10.7% 77.1% 32.8% 109.9%
1994 6.8% 8.0% 75.7% 31.3% 107.0%
1995 11.7% 9.1% 73.3% 30.8% 104.1%
1996 13.6% 10.3% 72.7% 30.7% 103.4%
1997 13.1% 10.4% 71.4% 31.2% 102.6%
1998 6.8% 8.5% 74.9% 32.9% 107.8%
1999 6.5% 7.3% 72.6% 33.2% 105.9%
2000 6.3% 9.0% 75.9% 32.7% 108.7%
2001 2.6% 7.5% 80.0% 31.0% 111.0%
2002 1.7% 5.4% 76.9% 28.9% 105.8%
2003 11.6% 6.2% 69.9% 28.6% 98.4%
2004 18.1% 5.6% 62.7% 28.2% 91.0%
2005 17.2% 5.9% 64.7% 28.7% 93.4%
2006 16.9% 5.9% 59.5% 28.1% 87.5%
2007 14.1% 5.5% 62.5% 28.5% 91.0%
2008 6.0% 3.9% 70.3% 30.0% 100.3%
2009 6.9% 4.2% 69.5% 30.0% 99.6%
2010 7.6% 4.3% 69.1% 30.2% 99.4%
2011 8.0% 4.2% 68.2% 30.3% 98.4%
2012 10.8% 3.9% 64.7% 30.6% 95.3%
2013 6.9% 3.1% 68.1% 30.8% 98.9%
A note about terminology:
Earned loss ratio is the ratio of claims incurred to net premiums earned.
Operating expense ratio is the ratio of operating expenses to net premiums earned.
Combined ratio is the ratio of claims plus expenses to net premiums earned.
When the combined ratio is 100% or more, it signifi es an underwriting loss.
When the combined ratio is less than 100%, it signifi es an underwriting profi t.
Sources: IBC, MSA, SCOR, AMF; Return on equity excluding Lloyd’s
IBC Facts 2015 • • • 15
Return on investment (ROI) compared with Government of Canada bond yield, 1989 to 2013 (%)
4
12
8
01989
P&C ROI
Yield for 3–5 year
Government of Canada bonds
1991 1993 1995 1997 1999 2001 2003 2005 2007 2009 20132011
Return on equity (ROE), 1975 to 2013 (%)
11.2
*Average ROE calculated up to 2013
Sources: IBC, MSA; excluding Lloyd’s
9.9 10.6 8.3
5
10
15
20
01975 1980 1985 1990 1995 2000 2005 2010 2013
Average ROE* 10.5
Sources: IBC, MSA, Bank of Canada
16 • • • IBC Facts 2015
Major issues
Severe weather
Property damage caused by severe weather is now the
leading cause of property insurance claims. It exceeds
fi re damage in some areas of the country.
The resulting increase in insured losses (losses covered by
insurance) from natural catastrophes has been a long-term
trend. Payouts from extreme weather have more than doubled
every fi ve to 10 years since the 1980s. For each of the past six
years, they have been near or above $1 billion in Canada. In
2012, losses hit $1.2 billion. And in 2013, losses were a historic
$3.4 billion, due to fl oods in Alberta and Toronto. In 2014, losses
again approached $1 billion. By comparison, insured losses
averaged $400 million a year over the 25-year period from 1983
to 2008.
Through IBC, the P&C insurance industry is taking the lead
on encouraging communities and consumers to adapt
to increasing severe weather by protecting themselves.
Industry priorities include municipal sewer and stormwater
infrastructure improvements, sound water management
policies, eff ective land use policies, more resilient communities
and buildings, and updated building codes. All of these factors
can help prevent urban fl ooding. In particular, they can reduce
the likelihood of sewer and stormwater infrastructure failure.
This will reduce the sewer backups that lead to basement
fl ooding and insurance claims.
In November 2013, IBC unveiled its municipal risk assessment
tool (MRAT) to help municipalities measure sewer and
stormwater infrastructure risk. The only tool of its kind in the
world, MRAT uses three data streams – municipal infrastructure
data (such as age of sewers), insurer claims data, and
current and future climate data – to identify vulnerabilities
in infrastructure. Cities will use this information to plan and
prioritize repairs.
Three Canadian cities – Coquitlam, British Columbia; Hamilton,
Ontario; and Fredericton, New Brunswick – have been
successful pilot communities for MRAT.
IBC is also engaged in research with Natural Resources Canada
to examine the economic costs associated with the severe
weather of climate change. By looking at two communities
(Mississauga, Ontario, and Halifax, Nova Scotia), the research
aims to provide an approach and toolkit for municipalities to
assess economic costs. This will allow the municipalities to
make the business case for adaptation.
The P&C industry’s overall goal is to promote adaptation to
safeguard Canadians from the eff ect of severe weather and
control rising claims costs.
IBC Facts 2015 • • • 17
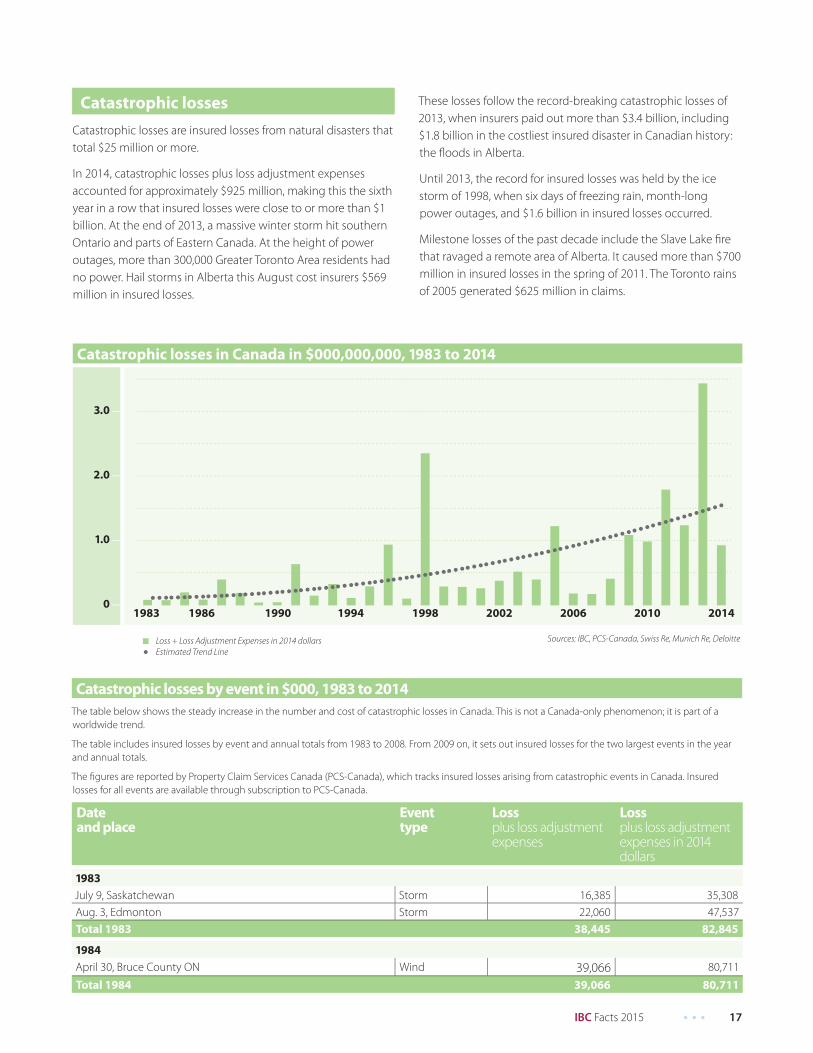
Catastrophic losses in Canada in $000,000,000, 1983 to 2014
Loss + Loss Adjustment Expenses in 2014 dollars
Estimated Trend Line
Sources: IBC, PCS-Canada, Swiss Re, Munich Re, Deloitte
1.0
2.0
3.0
01983 1986 1990 1994 1998 2002 2006 2010 2014
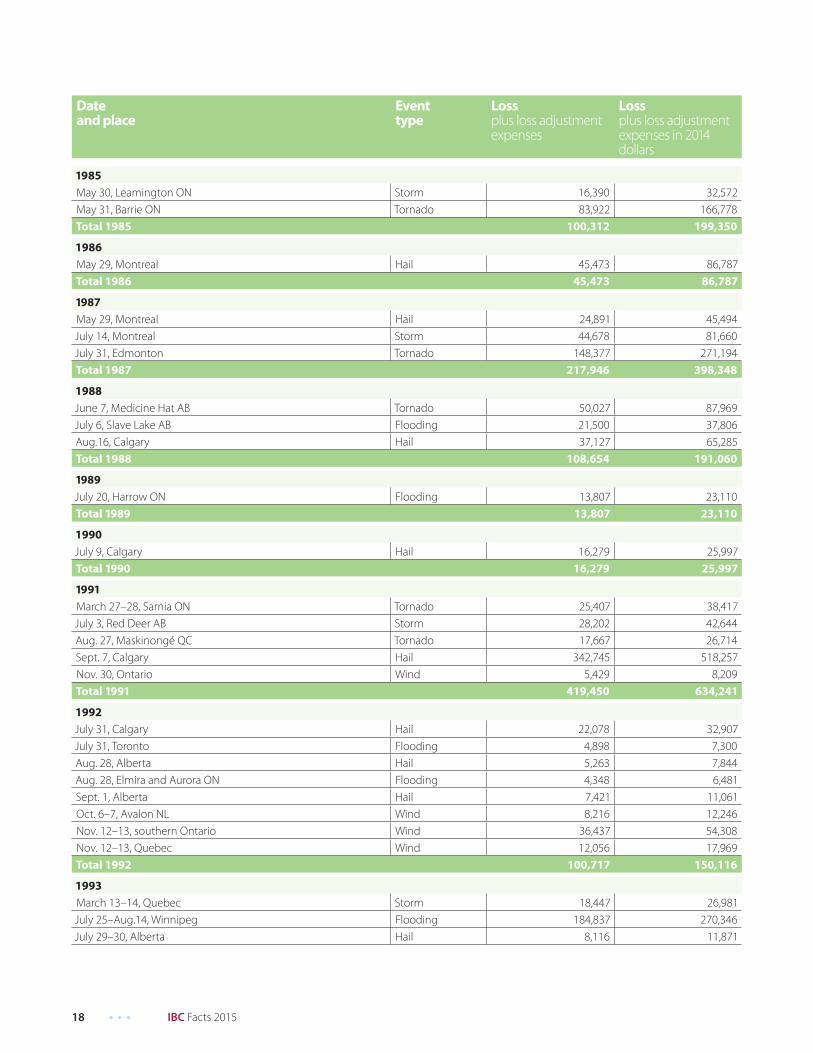
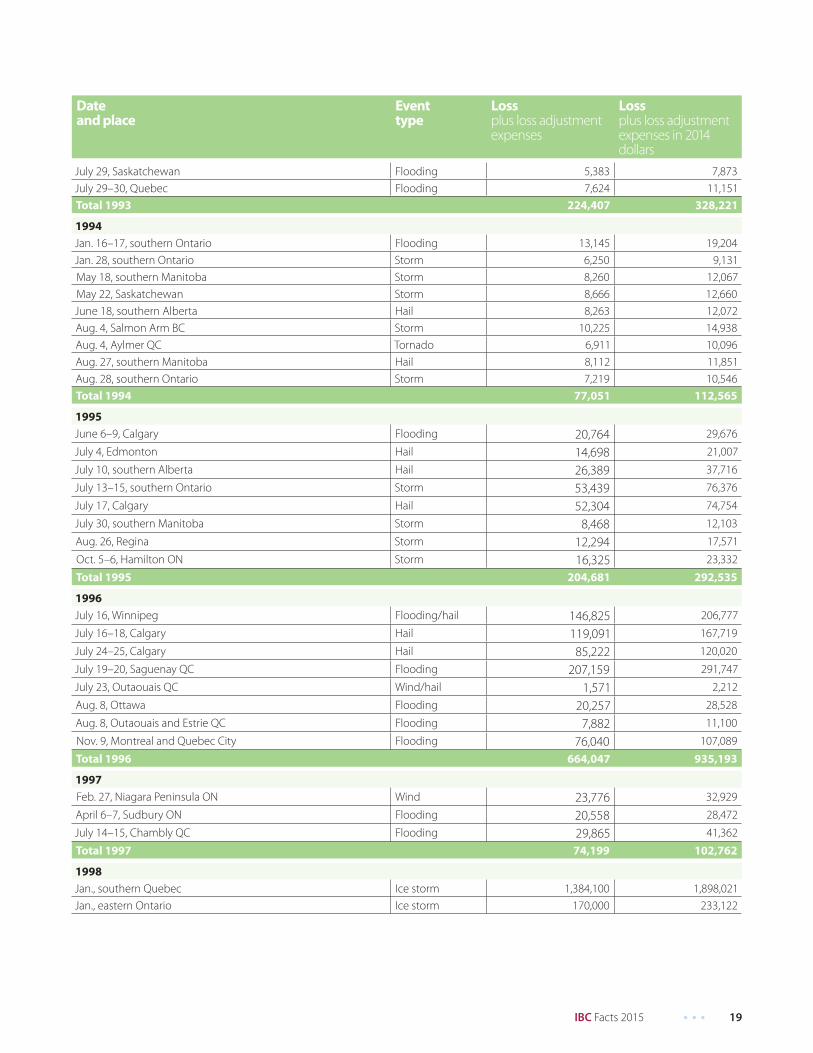
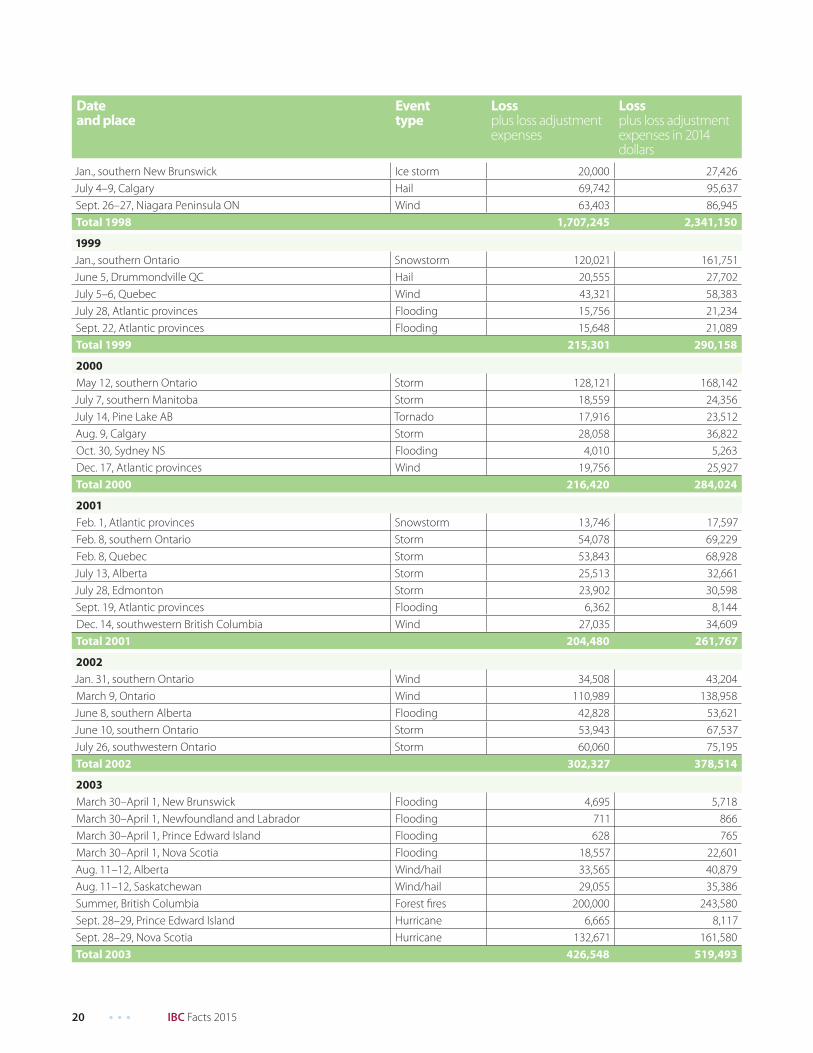
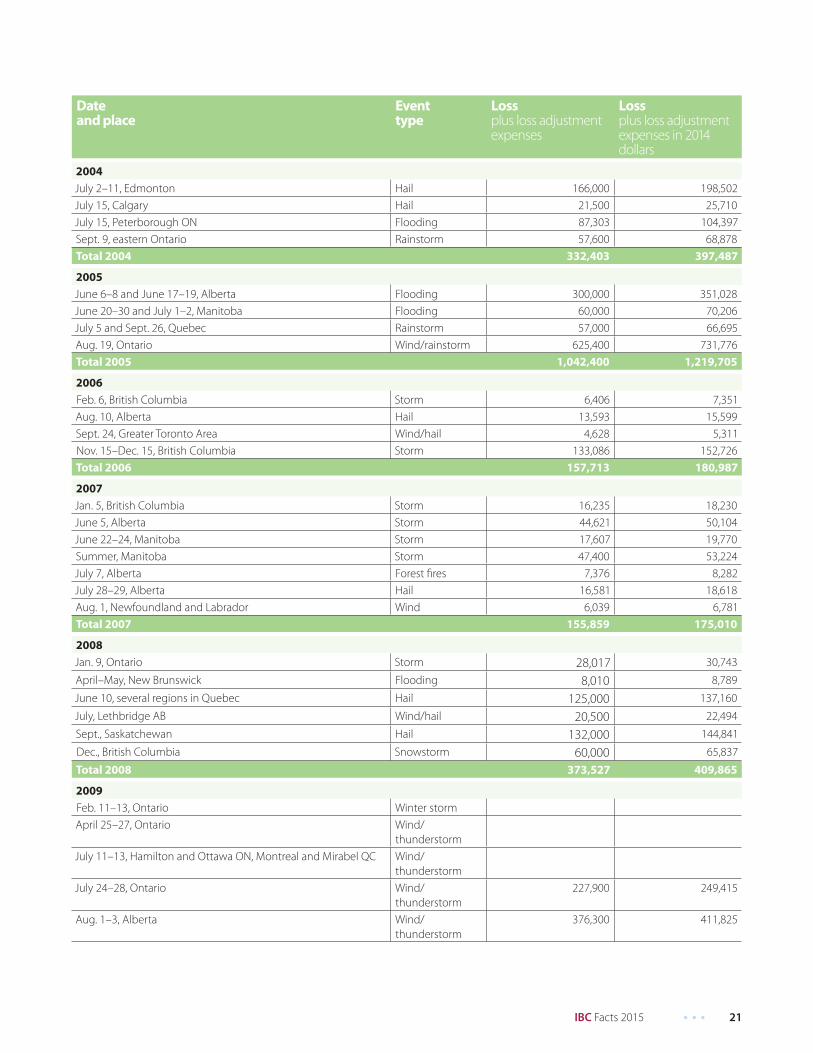
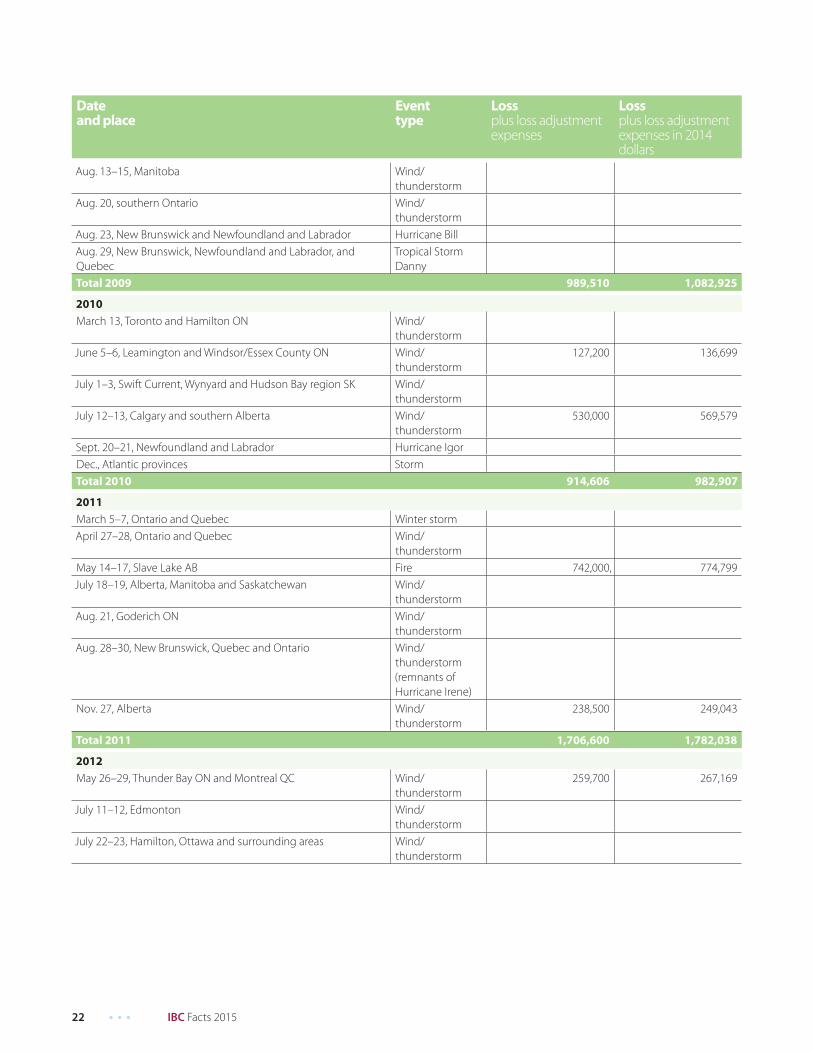
The table below shows the steady increase in the number and cost of catastrophic losses in Canada. This is not a Canada-only phenomenon; it is part of a
worldwide trend.
The table includes insured losses by event and annual totals from 1983 to 2008. From 2009 on, it sets out insured losses for the two largest events in the year
and annual totals.
The fi gures are reported by Property Claim Services Canada (PCS-Canada), which tracks insured losses arising from catastrophic events in Canada. Insured
losses for all events are available through subscription to PCS-Canada.
Dateand place
Eventtype
Lossplus loss adjustmentexpenses
Lossplus loss adjustmentexpenses in 2014dollars
1983
July 9, Saskatchewan Storm 16,385 35,308
Aug. 3, Edmonton Storm 22,060 47,537
Total 1983 38,445 82,845
1984
April 30, Bruce County ON Wind 39,066 80,711
Total 1984 39,066 80,711
Catastrophic losses
Catastrophic losses are insured losses from natural disasters that
total $25 million or more.
In 2014, catastrophic losses plus loss adjustment expenses
accounted for approximately $925 million, making this the sixth
year in a row that insured losses were close to or more than $1
billion. At the end of 2013, a massive winter storm hit southern
Ontario and parts of Eastern Canada. At the height of power
outages, more than 300,000 Greater Toronto Area residents had
no power. Hail storms in Alberta this August cost insurers $569
million in insured losses.
These losses follow the record-breaking catastrophic losses of
2013, when insurers paid out more than $3.4 billion, including
$1.8 billion in the costliest insured disaster in Canadian history:
the fl oods in Alberta.
Until 2013, the record for insured losses was held by the ice
storm of 1998, when six days of freezing rain, month-long
power outages, and $1.6 billion in insured losses occurred.
Milestone losses of the past decade include the Slave Lake fi re
that ravaged a remote area of Alberta. It caused more than $700
million in insured losses in the spring of 2011. The Toronto rains
of 2005 generated $625 million in claims.
Catastrophic losses by event in $000, 1983 to 2014
18 • • • IBC Facts 2015
Dateand place
Eventtype
Lossplus loss adjustmentexpenses
Lossplus loss adjustmentexpenses in 2014dollars
1985
May 30, Leamington ON Storm 16,390 32,572
May 31, Barrie ON Tornado 83,922 166,778
Total 1985 100,312 199,350
1986
May 29, Montreal Hail 45,473 86,787
Total 1986 45,473 86,787
1987
May 29, Montreal Hail 24,891 45,494
July 14, Montreal Storm 44,678 81,660
July 31, Edmonton Tornado 148,377 271,194
Total 1987 217,946 398,348
1988
June 7, Medicine Hat AB Tornado 50,027 87,969
July 6, Slave Lake AB Flooding 21,500 37,806
Aug.16, Calgary Hail 37,127 65,285
Total 1988 108,654 191,060
1989
July 20, Harrow ON Flooding 13,807 23,110
Total 1989 13,807 23,110
1990
July 9, Calgary Hail 16,279 25,997
Total 1990 16,279 25,997
1991
March 27–28, Sarnia ON Tornado 25,407 38,417
July 3, Red Deer AB Storm 28,202 42,644
Aug. 27, Maskinongé QC Tornado 17,667 26,714
Sept. 7, Calgary Hail 342,745 518,257
Nov. 30, Ontario Wind 5,429 8,209
Total 1991 419,450 634,241
1992
July 31, Calgary Hail 22,078 32,907
July 31, Toronto Flooding 4,898 7,300
Aug. 28, Alberta Hail 5,263 7,844
Aug. 28, Elmira and Aurora ON Flooding 4,348 6,481
Sept. 1, Alberta Hail 7,421 11,061
Oct. 6–7, Avalon NL Wind 8,216 12,246
Nov. 12–13, southern Ontario Wind 36,437 54,308
Nov. 12–13, Quebec Wind 12,056 17,969
Total 1992 100,717 150,116
1993
March 13–14, Quebec Storm 18,447 26,981
July 25–Aug.14, Winnipeg Flooding 184,837 270,346
July 29–30, Alberta Hail 8,116 11,871
IBC Facts 2015 • • • 19
Dateand place
Eventtype
Lossplus loss adjustmentexpenses
Lossplus loss adjustmentexpenses in 2014dollars
July 29, Saskatchewan Flooding 5,383 7,873
July 29–30, Quebec Flooding 7,624 11,151
Total 1993 224,407 328,221
1994
Jan. 16–17, southern Ontario Flooding 13,145 19,204
Jan. 28, southern Ontario Storm 6,250 9,131
May 18, southern Manitoba Storm 8,260 12,067
May 22, Saskatchewan Storm 8,666 12,660
June 18, southern Alberta Hail 8,263 12,072
Aug. 4, Salmon Arm BC Storm 10,225 14,938
Aug. 4, Aylmer QC Tornado 6,911 10,096
Aug. 27, southern Manitoba Hail 8,112 11,851
Aug. 28, southern Ontario Storm 7,219 10,546
Total 1994 77,051 112,565
1995
June 6–9, Calgary Flooding 20,764 29,676
July 4, Edmonton Hail 14,698 21,007
July 10, southern Alberta Hail 26,389 37,716
July 13–15, southern Ontario Storm 53,439 76,376
July 17, Calgary Hail 52,304 74,754
July 30, southern Manitoba Storm 8,468 12,103
Aug. 26, Regina Storm 12,294 17,571
Oct. 5–6, Hamilton ON Storm 16,325 23,332
Total 1995 204,681 292,535
1996
July 16, Winnipeg Flooding/hail 146,825 206,777
July 16–18, Calgary Hail 119,091 167,719
July 24–25, Calgary Hail 85,222 120,020
July 19–20, Saguenay QC Flooding 207,159 291,747
July 23, Outaouais QC Wind/hail 1,571 2,212
Aug. 8, Ottawa Flooding 20,257 28,528
Aug. 8, Outaouais and Estrie QC Flooding 7,882 11,100
Nov. 9, Montreal and Quebec City Flooding 76,040 107,089
Total 1996 664,047 935,193
1997
Feb. 27, Niagara Peninsula ON Wind 23,776 32,929
April 6–7, Sudbury ON Flooding 20,558 28,472
July 14–15, Chambly QC Flooding 29,865 41,362
Total 1997 74,199 102,762
1998
Jan., southern Quebec Ice storm 1,384,100 1,898,021
Jan., eastern Ontario Ice storm 170,000 233,122
20 • • • IBC Facts 2015
Dateand place
Eventtype
Lossplus loss adjustmentexpenses
Lossplus loss adjustmentexpenses in 2014dollars
Jan., southern New Brunswick Ice storm 20,000 27,426
July 4–9, Calgary Hail 69,742 95,637
Sept. 26–27, Niagara Peninsula ON Wind 63,403 86,945
Total 1998 1,707,245 2,341,150
1999
Jan., southern Ontario Snowstorm 120,021 161,751
June 5, Drummondville QC Hail 20,555 27,702
July 5–6, Quebec Wind 43,321 58,383
July 28, Atlantic provinces Flooding 15,756 21,234
Sept. 22, Atlantic provinces Flooding 15,648 21,089
Total 1999 215,301 290,158
2000
May 12, southern Ontario Storm 128,121 168,142
July 7, southern Manitoba Storm 18,559 24,356
July 14, Pine Lake AB Tornado 17,916 23,512
Aug. 9, Calgary Storm 28,058 36,822
Oct. 30, Sydney NS Flooding 4,010 5,263
Dec. 17, Atlantic provinces Wind 19,756 25,927
Total 2000 216,420 284,024
2001
Feb. 1, Atlantic provinces Snowstorm 13,746 17,597
Feb. 8, southern Ontario Storm 54,078 69,229
Feb. 8, Quebec Storm 53,843 68,928
July 13, Alberta Storm 25,513 32,661
July 28, Edmonton Storm 23,902 30,598
Sept. 19, Atlantic provinces Flooding 6,362 8,144
Dec. 14, southwestern British Columbia Wind 27,035 34,609
Total 2001 204,480 261,767
2002
Jan. 31, southern Ontario Wind 34,508 43,204
March 9, Ontario Wind 110,989 138,958
June 8, southern Alberta Flooding 42,828 53,621
June 10, southern Ontario Storm 53,943 67,537
July 26, southwestern Ontario Storm 60,060 75,195
Total 2002 302,327 378,514
2003
March 30–April 1, New Brunswick Flooding 4,695 5,718
March 30–April 1, Newfoundland and Labrador Flooding 711 866
March 30–April 1, Prince Edward Island Flooding 628 765
March 30–April 1, Nova Scotia Flooding 18,557 22,601
Aug. 11–12, Alberta Wind/hail 33,565 40,879
Aug. 11–12, Saskatchewan Wind/hail 29,055 35,386
Summer, British Columbia Forest fi res 200,000 243,580
Sept. 28–29, Prince Edward Island Hurricane 6,665 8,117
Sept. 28–29, Nova Scotia Hurricane 132,671 161,580
Total 2003 426,548 519,493
IBC Facts 2015 • • • 21
Dateand place
Eventtype
Lossplus loss adjustmentexpenses
Lossplus loss adjustmentexpenses in 2014dollars
2004
July 2–11, Edmonton Hail 166,000 198,502
July 15, Calgary Hail 21,500 25,710
July 15, Peterborough ON Flooding 87,303 104,397
Sept. 9, eastern Ontario Rainstorm 57,600 68,878
Total 2004 332,403 397,487
2005
June 6–8 and June 17–19, Alberta Flooding 300,000 351,028
June 20–30 and July 1–2, Manitoba Flooding 60,000 70,206
July 5 and Sept. 26, Quebec Rainstorm 57,000 66,695
Aug. 19, Ontario Wind/rainstorm 625,400 731,776
Total 2005 1,042,400 1,219,705
2006
Feb. 6, British Columbia Storm 6,406 7,351
Aug. 10, Alberta Hail 13,593 15,599
Sept. 24, Greater Toronto Area Wind/hail 4,628 5,311
Nov. 15–Dec. 15, British Columbia Storm 133,086 152,726
Total 2006 157,713 180,987
2007
Jan. 5, British Columbia Storm 16,235 18,230
June 5, Alberta Storm 44,621 50,104
June 22–24, Manitoba Storm 17,607 19,770
Summer, Manitoba Storm 47,400 53,224
July 7, Alberta Forest fi res 7,376 8,282
July 28–29, Alberta Hail 16,581 18,618
Aug. 1, Newfoundland and Labrador Wind 6,039 6,781
Total 2007 155,859 175,010
2008
Jan. 9, Ontario Storm 28,017 30,743
April–May, New Brunswick Flooding 8,010 8,789
June 10, several regions in Quebec Hail 125,000 137,160
July, Lethbridge AB Wind/hail 20,500 22,494
Sept., Saskatchewan Hail 132,000 144,841
Dec., British Columbia Snowstorm 60,000 65,837
Total 2008 373,527 409,865
2009
Feb. 11–13, Ontario Winter storm
April 25–27, Ontario Wind/
thunderstorm
July 11–13, Hamilton and Ottawa ON, Montreal and Mirabel QC Wind/
thunderstorm
July 24–28, Ontario Wind/
thunderstorm
227,900 249,415
Aug. 1–3, Alberta Wind/
thunderstorm
376,300 411,825
22 • • • IBC Facts 2015
Dateand place
Eventtype
Lossplus loss adjustmentexpenses
Lossplus loss adjustmentexpenses in 2014dollars
Aug. 13–15, Manitoba Wind/
thunderstorm
Aug. 20, southern Ontario Wind/
thunderstorm
Aug. 23, New Brunswick and Newfoundland and Labrador Hurricane Bill
Aug. 29, New Brunswick, Newfoundland and Labrador, and
Quebec
Tropical Storm
Danny
Total 2009 989,510 1,082,925
2010
March 13, Toronto and Hamilton ON Wind/
thunderstorm
June 5–6, Leamington and Windsor/Essex County ON Wind/
thunderstorm
127,200 136,699
July 1–3, Swift Current, Wynyard and Hudson Bay region SK Wind/
thunderstorm
July 12–13, Calgary and southern Alberta Wind/
thunderstorm
530,000 569,579
Sept. 20–21, Newfoundland and Labrador Hurricane Igor
Dec., Atlantic provinces Storm
Total 2010 914,606 982,907
2011
March 5–7, Ontario and Quebec Winter storm
April 27–28, Ontario and Quebec Wind/
thunderstorm
May 14–17, Slave Lake AB Fire 742,000, 774,799
July 18–19, Alberta, Manitoba and Saskatchewan Wind/
thunderstorm
Aug. 21, Goderich ON Wind/
thunderstorm
Aug. 28–30, New Brunswick, Quebec and Ontario Wind/
thunderstorm
(remnants of
Hurricane Irene)
Nov. 27, Alberta Wind/
thunderstorm
238,500 249,043
Total 2011 1,706,600 1,782,038
2012
May 26–29, Thunder Bay ON and Montreal QC Wind/
thunderstorm
259,700 267,169
July 11–12, Edmonton Wind/
thunderstorm
July 22–23, Hamilton, Ottawa and surrounding areas Wind/
thunderstorm
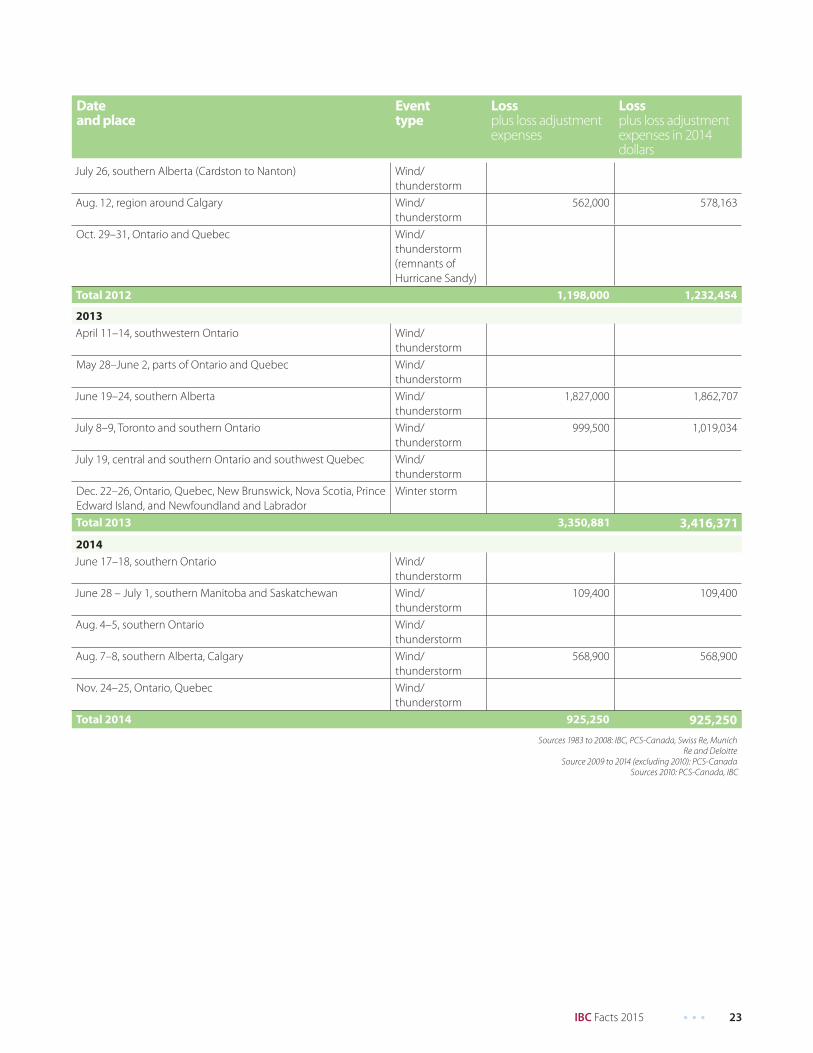
IBC Facts 2015 • • • 23
Dateand place
Eventtype
Lossplus loss adjustmentexpenses
Lossplus loss adjustmentexpenses in 2014dollars
July 26, southern Alberta (Cardston to Nanton) Wind/
thunderstorm
Aug. 12, region around Calgary Wind/
thunderstorm
562,000 578,163
Oct. 29–31, Ontario and Quebec Wind/
thunderstorm
(remnants of
Hurricane Sandy)
Total 2012 1,198,000 1,232,454
2013
April 11–14, southwestern Ontario Wind/
thunderstorm
May 28–June 2, parts of Ontario and Quebec Wind/
thunderstorm
June 19–24, southern Alberta Wind/
thunderstorm
1,827,000 1,862,707
July 8–9, Toronto and southern Ontario Wind/
thunderstorm
999,500 1,019,034
July 19, central and southern Ontario and southwest Quebec Wind/
thunderstorm
Dec. 22–26, Ontario, Quebec, New Brunswick, Nova Scotia, Prince
Edward Island, and Newfoundland and Labrador
Winter storm
Total 2013 3,350,881 3,416,371
2014
June 17–18, southern Ontario Wind/
thunderstorm
June 28 – July 1, southern Manitoba and Saskatchewan Wind/
thunderstorm
109,400 109,400
Aug. 4–5, southern Ontario Wind/
thunderstorm
Aug. 7–8, southern Alberta, Calgary Wind/
thunderstorm
568,900 568,900
Nov. 24–25, Ontario, Quebec Wind/
thunderstorm
Total 2014 925,250 925,250
Sources 1983 to 2008: IBC, PCS-Canada, Swiss Re, Munich
Re and Deloitte
Source 2009 to 2014 (excluding 2010): PCS-Canada
Sources 2010: PCS-Canada, IBC
24 • • • IBC Facts 2015
Crime
Insurance crime takes on many forms and costs Canadian
insurers millions each year. The cost of insurance crime
is refl ected in higher premiums. A signifi cant amount of
insurance crime involves opportunistic fraud when individual
policyholders make false or exaggerated claims.
Organized crime rings also perpetrate various forms of
insurance crime, such as auto theft, staged collisions and
associated service provider fraud. Associated service provider
fraud occurs when participants make false claims for accident
benefi ts and vehicle damage in collusion with rehabilitation
facilities and auto repair shops.
Through IBC, the P&C insurance industry investigates organized
insurance crime throughout Canada.
Cargo theft is one example of a rapidly escalating crime that
costs Canadians up to $5 billion a year. It is a signifi cant problem
in transportation hubs in southern Ontario, as well as in
Vancouver and Montreal.
In 2013, IBC and the Canadian Trucking Alliance (CTA),
supported by law enforcement agencies, launched a national
program to fi ght cargo theft. The Cargo Theft Reporting
program helps the trucking community, insurers and authorities
share timely information to crack down on cargo theft.
IBC works with law enforcement agencies and insurers to
identify criminal activity and combat fraud. There are a
signifi cant number of cases of fraud in southern Ontario
medical and rehabilitation clinics, including an increase in
identity fraud. IBC educates consumers about protecting
themselves.
Regulation
The federal and provincial governments regulate the P&C
insurance industry. Regulations related to solvency are
managed by the federal Offi ce of the Superintendent of
Financial Institutions. Provincial governments are responsible for
the regulation of market conduct.
It is not possible to precisely determine the total cost to the
industry of compliance with regulatory requirements. However,
it is believed that these costs could be as high as hundreds of
millions of dollars, annually.
Through IBC, the P&C insurance industry advocates to level
the playing fi eld for business, strengthen public confi dence in
the insurance market and reduce expensive and unnecessary
regulations.
There is a particularly strong regulatory presence in auto
insurance, which has strict rules governing claims handling,
underwriting and complaints management. These rules are
intended to protect consumers against unfair or inappropriate
market practices.
Provincial regulators administer rate approval systems for auto
insurance. These systems can be cumbersome and costly,
and also cause delays in the industry’s ability to respond to
changing market conditions.
Through IBC, the P&C insurance industry engages with
regulators from the federal and provincial governments on a
regular basis. This is to ensure that new regulatory initiatives
are well justifi ed and do not result in excessive burdens on the
industry or costs to consumers. These eff orts aim to encourage
harmony between legislative and regulatory frameworks for
insurance across provinces and territories. Enhancing the
effi ciency and cost eff ectiveness of insurance regulation could
bring signifi cant benefi ts to consumers.
IBC Facts 2015 • • • 25
Reinsurance
Reinsurance is insurance for insurers. Reinsurers, which are
often international corporations, spread their risks by
supporting “primary” insurers in several countries and in many
regions around the world.
Insurance companies pay premiums to reinsurers in exchange
for having a portion of their claims paid by them. Reinsurance
provides primary insurers with additional capital and protection
if a major loss or catastrophe occurs. Reinsurance is one of
many tools insurers use to guarantee that they will meet every
obligation to pay claims.
In recent years, reinsurers have helped insurance companies
pay claims from several major events. Among these was the
fl ooding in Alberta in 2013.

26 • • • IBC Facts 2015
Canada’s P&C insurance industry
by line of business
2
28 • • • IBC Facts 2015
Mandatory insurance
There are three kinds of mandatory coverage:
Accident benefi ts (AB) coverage helps people recover
from injuries sustained in a collision. It pays for medical care,
rehabilitation, income replacement and other benefi ts to aid
the recovery of collision victims, including drivers, passengers
and pedestrians. In the case of a death, this coverage also
provides funeral expenses and survivor benefi ts. This insurance
is mandatory in all provinces except Newfoundland and
Labrador. In some provinces, it is referred to as “Section B”
benefi ts.
Accident benefi ts are paid on a no-fault basis. This means that
the benefi ts are available to anyone injured in a vehicle collision
regardless of whether he or she was “at fault” for the collision.
See the next page for more detail on no-fault insurance.
Third-party liability (TPL) coverage protects the insured
driver and/or owner of the vehicle if the motor vehicle injures
or kills someone or damages someone’s property through the
fault of the driver. Third-party liability coverage is required by
law in all provinces, and in some provinces may include direct
compensation property damage (DCPD) coverage.
DCPD covers damage to an insured vehicle and to any property
inside the vehicle when another motorist is responsible for the
collision. It is called direct compensation because drivers collect
from their own insurer, even though someone else is at fault.
DCPD is mandatory in Ontario, Quebec, New Brunswick and
Nova Scotia. The Prince Edward Island government intends to
implement DCPD in 2015.
Uninsured auto coverage protects an insured person if he or
she is injured through the fault of a driver who does not have
auto insurance or is unidentifi ed.
Optional insurance
Collision and comprehensive insurance are optional in all
provinces except Saskatchewan and Manitoba, where both are
mandatory.
Collision coverage pays for the cost of repairing or replacing a
vehicle following a collision with another vehicle or object, such
as a tree, house, guardrail or pothole. Comprehensive coverage
pays for repairs to or replacement of a vehicle for damage
caused by something other than a collision, such as fi re, theft,
vandalism or wind.
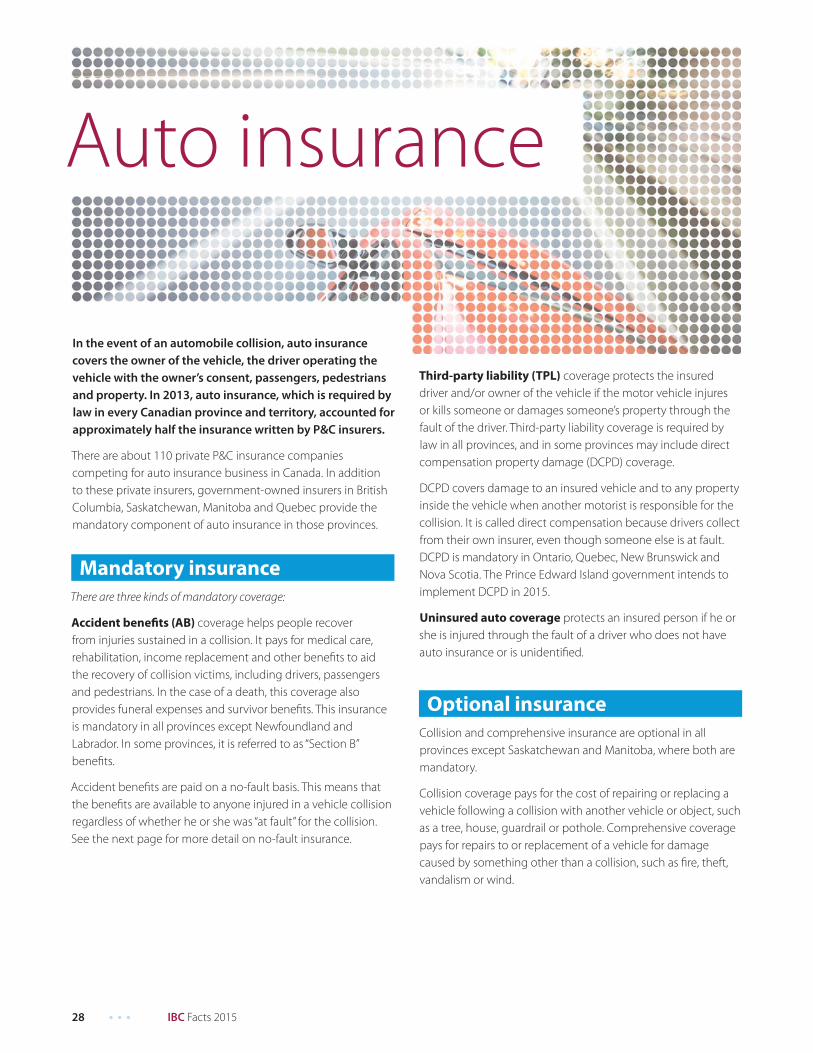
Auto insurance
In the event of an automobile collision, auto insurance covers the owner of the vehicle, the driver operating the vehicle with the owner’s consent, passengers, pedestrians and property. In 2013, auto insurance, which is required by law in every Canadian province and territory, accounted for approximately half the insurance written by P&C insurers.
There are about 110 private P&C insurance companies
competing for auto insurance business in Canada. In addition
to these private insurers, government-owned insurers in British
Columbia, Saskatchewan, Manitoba and Quebec provide the
mandatory component of auto insurance in those provinces.
IBC Facts 2015 • • • 29
“No-fault” insurance
The concept of “no-fault” insurance developed over time as a
way to reduce the legal and administrative costs associated
with having to prove fault in a vehicle collision.
Before “no fault,” insurers required those involved in a collision
to establish which driver was at fault. The insurer of the at-fault
driver would be responsible for covering the losses resulting
from injuries arising from the incident to those who were
not at fault. This process was lengthy and required expensive
investigation and often litigation.
In a pure no-fault car insurance system, if a person is injured
or his or her car is damaged in a collision, the person deals
directly with his or her own insurance company, regardless of
who is at fault.
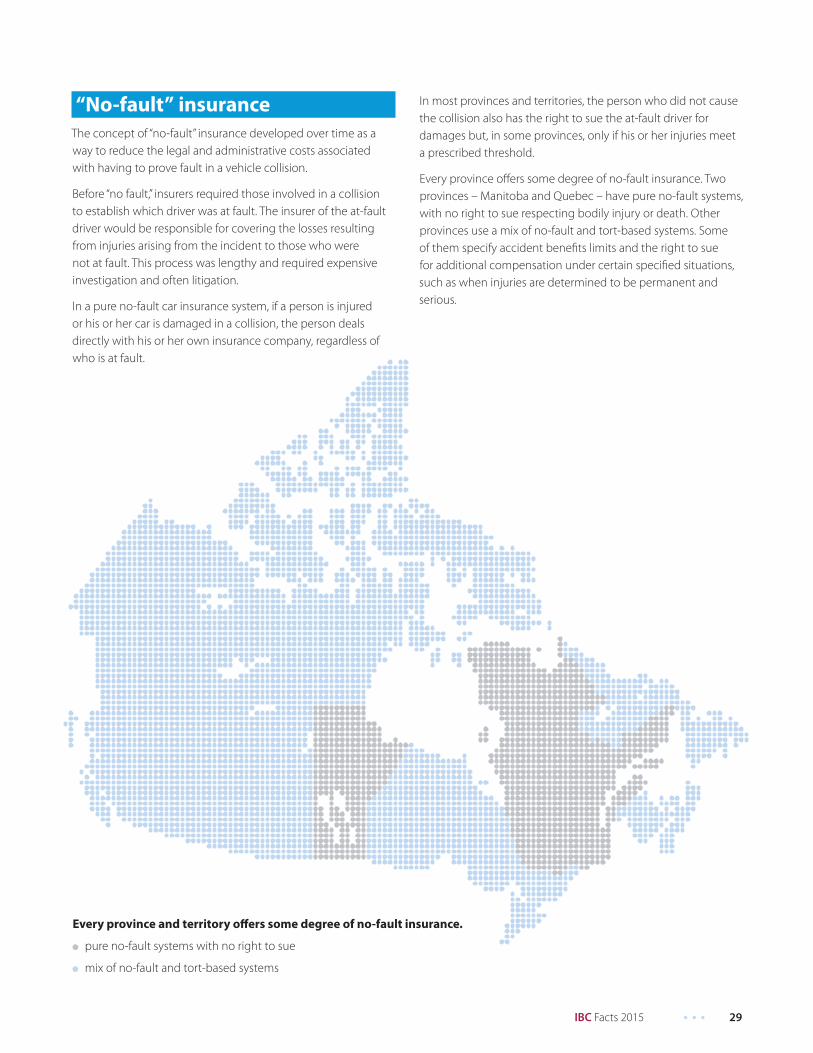
Every province and territory off ers some degree of no-fault insurance.
l pure no-fault systems with no right to sue
l mix of no-fault and tort-based systems
In most provinces and territories, the person who did not cause
the collision also has the right to sue the at-fault driver for
damages but, in some provinces, only if his or her injuries meet
a prescribed threshold.
Every province off ers some degree of no-fault insurance. Two
provinces – Manitoba and Quebec – have pure no-fault systems,
with no right to sue respecting bodily injury or death. Other
provinces use a mix of no-fault and tort-based systems. Some
of them specify accident benefi ts limits and the right to sue
for additional compensation under certain specifi ed situations,
such as when injuries are determined to be permanent and
serious.
30 • • • IBC Facts 2015
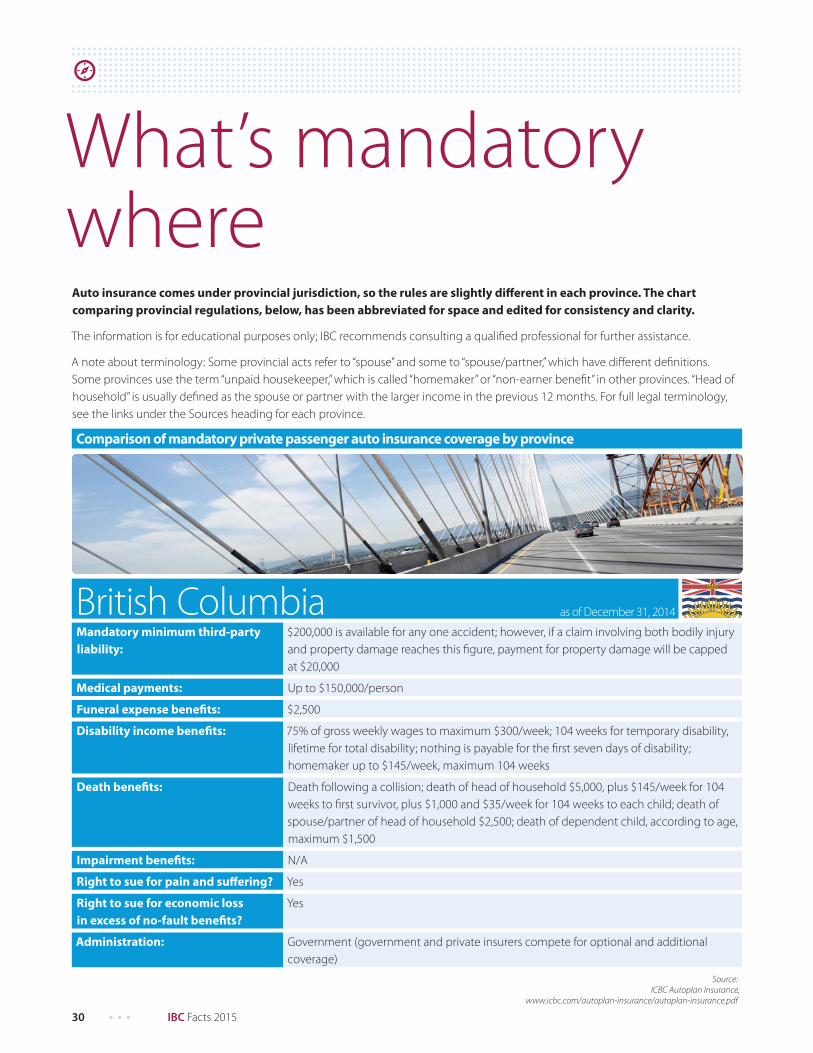
British ColumbiaMandatory minimum third-party
liability:
$200,000 is available for any one accident; however, if a claim involving both bodily injury
and property damage reaches this fi gure, payment for property damage will be capped
at $20,000
Medical payments: Up to $150,000/person
Funeral expense benefi ts: $2,500
Disability income benefi ts: 75% of gross weekly wages to maximum $300/week; 104 weeks for temporary disability,
lifetime for total disability; nothing is payable for the fi rst seven days of disability;
homemaker up to $145/week, maximum 104 weeks
Death benefi ts: Death following a collision; death of head of household $5,000, plus $145/week for 104
weeks to fi rst survivor, plus $1,000 and $35/week for 104 weeks to each child; death of
spouse/partner of head of household $2,500; death of dependent child, according to age,
maximum $1,500
Impairment benefi ts: N/A
Right to sue for pain and suff ering? Yes
Right to sue for economic loss
in excess of no-fault benefi ts?
Yes
Administration: Government (government and private insurers compete for optional and additional
coverage)
Source:
ICBC Autoplan Insurance,
www.icbc.com/autoplan-insurance/autoplan-insurance.pdf
Auto insurance comes under provincial jurisdiction, so the rules are slightly diff erent in each province. The chart
comparing provincial regulations, below, has been abbreviated for space and edited for consistency and clarity.
The information is for educational purposes only; IBC recommends consulting a qualifi ed professional for further assistance.
A note about terminology: Some provincial acts refer to “spouse” and some to “spouse/partner,” which have diff erent defi nitions.
Some provinces use the term “unpaid housekeeper,” which is called “homemaker” or “non-earner benefi t” in other provinces. “Head of
household” is usually defi ned as the spouse or partner with the larger income in the previous 12 months. For full legal terminology,
see the links under the Sources heading for each province.
Comparison of mandatory private passenger auto insurance coverage by province
What’s mandatory where
as of December 31, 2014
IBC Facts 2015 • • • 31
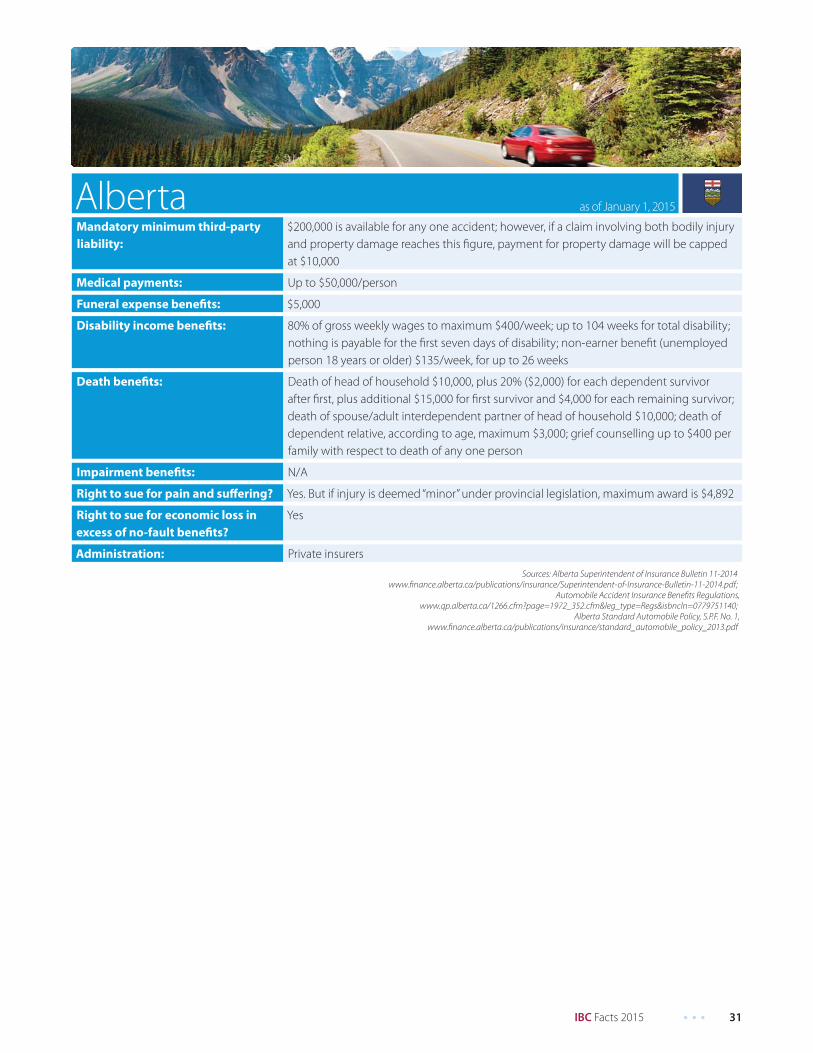
AlbertaMandatory minimum third-party
liability:
$200,000 is available for any one accident; however, if a claim involving both bodily injury
and property damage reaches this fi gure, payment for property damage will be capped
at $10,000
Medical payments: Up to $50,000/person
Funeral expense benefi ts: $5,000
Disability income benefi ts: 80% of gross weekly wages to maximum $400/week; up to 104 weeks for total disability;
nothing is payable for the fi rst seven days of disability; non-earner benefi t (unemployed
person 18 years or older) $135/week, for up to 26 weeks
Death benefi ts: Death of head of household $10,000, plus 20% ($2,000) for each dependent survivor
after fi rst, plus additional $15,000 for fi rst survivor and $4,000 for each remaining survivor;
death of spouse/adult interdependent partner of head of household $10,000; death of
dependent relative, according to age, maximum $3,000; grief counselling up to $400 per
family with respect to death of any one person
Impairment benefi ts: N/A
Right to sue for pain and suff ering? Yes. But if injury is deemed “minor” under provincial legislation, maximum award is $4,892
Right to sue for economic loss in
excess of no-fault benefi ts?
Yes
Administration: Private insurers
Sources: Alberta Superintendent of Insurance Bulletin 11-2014
www.fi nance.alberta.ca/publications/insurance/Superintendent-of-Insurance-Bulletin-11-2014.pdf;
Automobile Accident Insurance Benefi ts Regulations,
www.qp.alberta.ca/1266.cfm?page=1972_352.cfm&leg_type=Regs&isbncln=0779751140;
Alberta Standard Automobile Policy, S.P.F. No. 1,
www.fi nance.alberta.ca/publications/insurance/standard_automobile_policy_2013.pdf
as of January 1, 2015
32 • • • IBC Facts 2015
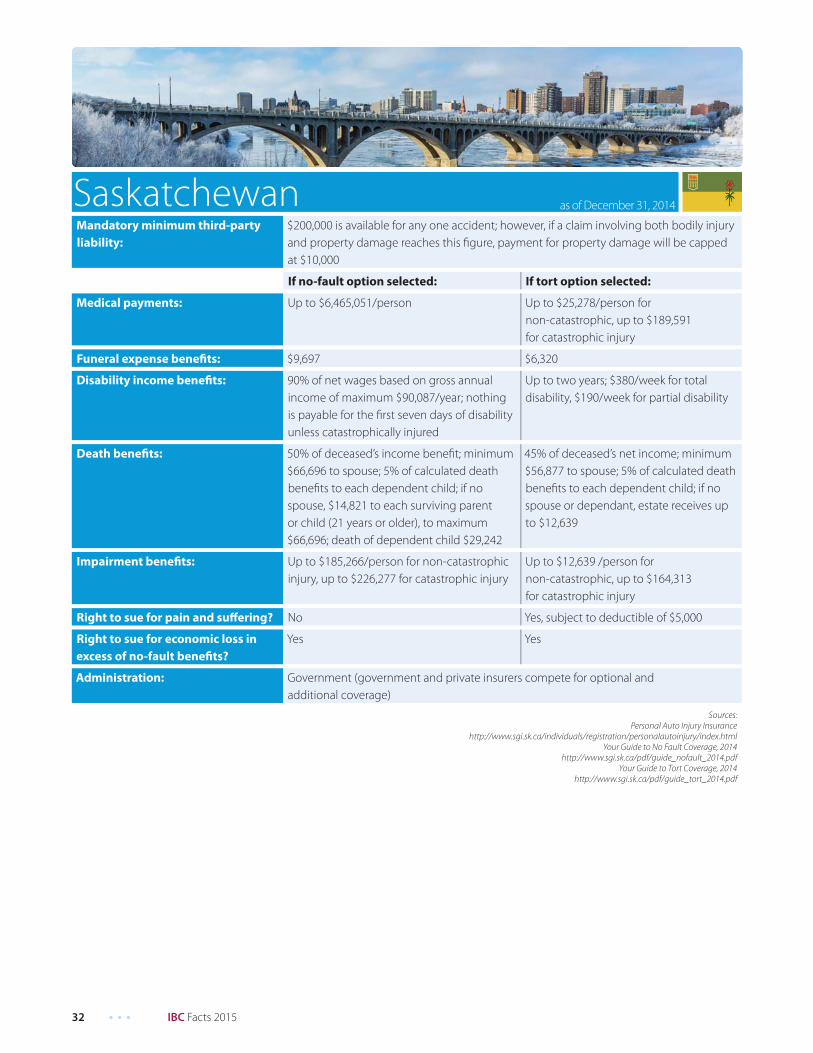
SaskatchewanMandatory minimum third-party
liability:
$200,000 is available for any one accident; however, if a claim involving both bodily injury
and property damage reaches this fi gure, payment for property damage will be capped
at $10,000
If no-fault option selected: If tort option selected:
Medical payments: Up to $6,465,051/person Up to $25,278/person for
non-catastrophic, up to $189,591
for catastrophic injury
Funeral expense benefi ts: $9,697 $6,320
Disability income benefi ts: 90% of net wages based on gross annual
income of maximum $90,087/year; nothing
is payable for the fi rst seven days of disability
unless catastrophically injured
Up to two years; $380/week for total
disability, $190/week for partial disability
Death benefi ts: 50% of deceased’s income benefi t; minimum
$66,696 to spouse; 5% of calculated death
benefi ts to each dependent child; if no
spouse, $14,821 to each surviving parent
or child (21 years or older), to maximum
$66,696; death of dependent child $29,242
45% of deceased’s net income; minimum
$56,877 to spouse; 5% of calculated death
benefi ts to each dependent child; if no
spouse or dependant, estate receives up
to $12,639
Impairment benefi ts: Up to $185,266/person for non-catastrophic
injury, up to $226,277 for catastrophic injury
Up to $12,639 /person for
non-catastrophic, up to $164,313
for catastrophic injury
Right to sue for pain and suff ering? No Yes, subject to deductible of $5,000
Right to sue for economic loss in
excess of no-fault benefi ts?
Yes Yes
Administration: Government (government and private insurers compete for optional and
additional coverage)
Sources:
Personal Auto Injury Insurance
http://www.sgi.sk.ca/individuals/registration/personalautoinjury/index.html
Your Guide to No Fault Coverage, 2014
http://www.sgi.sk.ca/pdf/guide_nofault_2014.pdf
Your Guide to Tort Coverage, 2014
http://www.sgi.sk.ca/pdf/guide_tort_2014.pdf
as of December 31, 2014
IBC Facts 2015 • • • 33
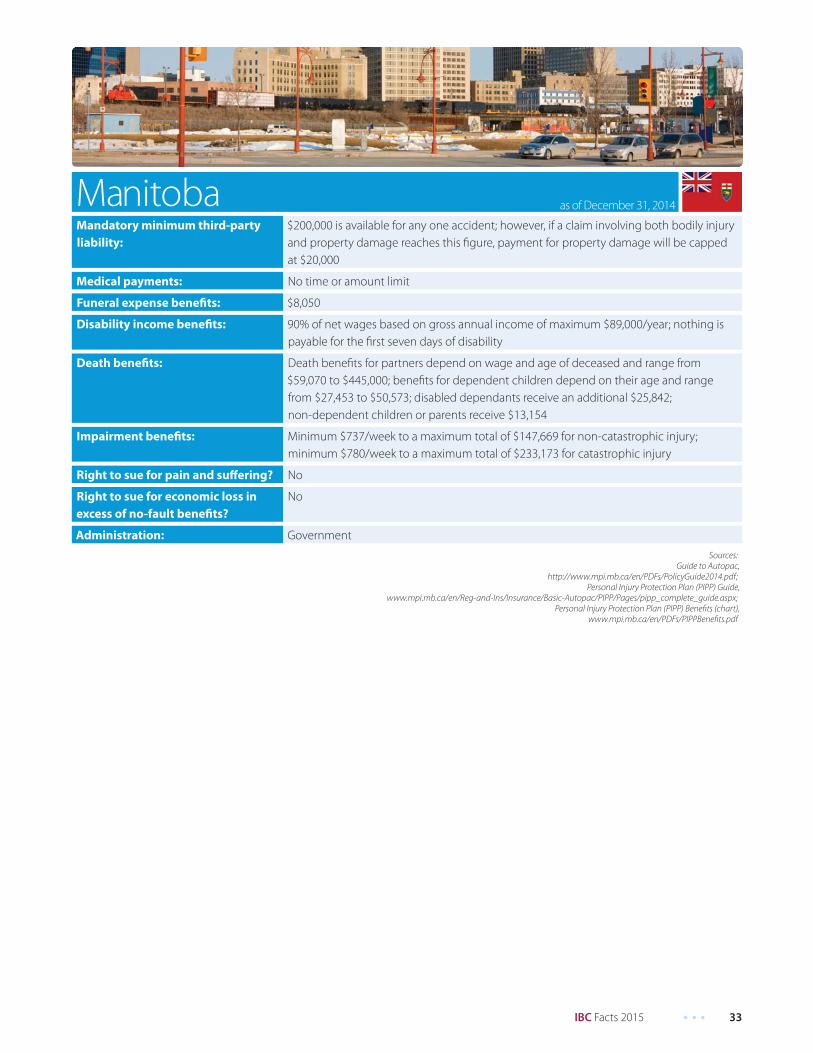
ManitobaMandatory minimum third-party
liability:
$200,000 is available for any one accident; however, if a claim involving both bodily injury
and property damage reaches this fi gure, payment for property damage will be capped
at $20,000
Medical payments: No time or amount limit
Funeral expense benefi ts: $8,050
Disability income benefi ts: 90% of net wages based on gross annual income of maximum $89,000/year; nothing is
payable for the fi rst seven days of disability
Death benefi ts: Death benefi ts for partners depend on wage and age of deceased and range from
$59,070 to $445,000; benefi ts for dependent children depend on their age and range
from $27,453 to $50,573; disabled dependants receive an additional $25,842;
non-dependent children or parents receive $13,154
Impairment benefi ts: Minimum $737/week to a maximum total of $147,669 for non-catastrophic injury;
minimum $780/week to a maximum total of $233,173 for catastrophic injury
Right to sue for pain and suff ering? No
Right to sue for economic loss in
excess of no-fault benefi ts?
No
Administration: Government
Sources:
Guide to Autopac,
http://www.mpi.mb.ca/en/PDFs/PolicyGuide2014.pdf;
Personal Injury Protection Plan (PIPP) Guide,
www.mpi.mb.ca/en/Reg-and-Ins/Insurance/Basic-Autopac/PIPP/Pages/pipp_complete_guide.aspx;
Personal Injury Protection Plan (PIPP) Benefi ts (chart),
www.mpi.mb.ca/en/PDFs/PIPPBenefi ts.pdf
as of December 31, 2014
34 • • • IBC Facts 2015
OntarioMandatory minimum third-party
liability:
$200,000 is available for any one accident; however, if a claim involving both bodily injury
and property damage reaches this fi gure, payment for property damage will be capped
at $10,000
Medical payments: Up to $3,500 for minor injury; up to $50,000/person for non-minor and non-catastrophic
injury for up to 10 years; up to $1 million for catastrophic injury; attendant care up to
$36,000 for non-minor and non-catastrophic injury up to 104 weeks
Funeral expense benefi ts: $6,000 (if optional indexation coverage is purchased, this amount may be higher)
Disability income benefi ts: Income Replacement Benefi t: 70% of gross wages to maximum $400/week, minimum
$185/week for 104 weeks (longer if victim is unable to pursue any suitable occupation);
nothing is payable for the fi rst seven days of disability
Non-earner Benefi t (disabled unemployed persons, students enrolled in education full
time, or students who completed their education less than one year before the accident
and are not employed): $185/week for 104 weeks; 26-week wait; limit two years; if student
(as defi ned above) is still disabled after 104 weeks, Non-earner Benefi t is $320/week. Not
available if the insured is eligible for, and elects to receive, the income replacement or
caregiver benefi t
Death benefi ts: Death within 180 days of accident (or three years if continuously disabled prior to death);
$25,000 minimum to spouse, $10,000 to each surviving dependant, $10,000 to each
parent/guardian (if optional indexation coverage is purchased, these amounts may be
higher)
Impairment benefi ts: N/A
Right to sue for pain and suff ering? Yes, if injury meets severity test (called “threshold”), and subject to deductible. Lawsuit
allowed only if injured person dies or sustains permanent and serious disfi gurement
and/or impairment of important physical, mental or psychological function. The court
assesses damages and deducts $30,000 ($15,000 for a Family Law Act claim)
Right to sue for economic loss in
excess of no-fault benefi ts?
Yes. Income replacement award above no-fault benefi t is based on net income after
deductions for income tax, Canada Pension and Employment Insurance. Injured person
may sue for 70% of net income loss before trial, 100% of gross after trial; also for medical,
rehabilitation and related costs when injury meets severity test for pain and suff ering
claims
Administration: Private insurers
Sources:
Ontario Automobile Policy,
www.fsco.gov.on.ca/en/auto/forms/Documents/OAP-1-Application-and-Endorsement-Forms/1215E.1.pdf;
Statutory Accident Benefi ts Schedule (SABS), Insurance Act, O. Reg. 34/10,
www.e-laws.gov.on.ca/html/regs/english/elaws_regs_100034_e.htm;
Financial Services Commission of Ontario: Auto Bulletins,
www.fsco.gov.on.ca/en/auto/autobulletins/Pages/default.aspx
as of December 31, 2014
IBC Facts 2015 • • • 35
QuebecPrivate Insurance
Public Insurance
Mandatory minimum third-party
liability:
$50,000 is available for any one accident; liability limits relate to property damage claims
within Quebec and to personal injury and property damage claims outside Quebec
Medical payments: No time or amount limit
Funeral expense benefi ts: $5,046
Disability income benefi ts: 90% of net wages based on gross annual income of maximum $69,500/year; nothing is
payable for the fi rst seven days of disability; indexed
Death benefi ts: Death any time after accident; benefi ts depend on gross annual income multiplied by a
factor between one and fi ve, depending on age of the victim; benefi ts for spouse range
from $67,340 to $347,500; benefi ts for dependent children depend on their age and
range from $31,985 to $58,924; if there is no surviving spouse/dependant, parents or
estate receive $53,973
Impairment benefi ts: Up to $236,131
Right to sue for pain and suff ering? No
Right to sue for economic loss in
excess of no-fault benefi ts?
No
Administration: Bodily injury: government; property damage: private insurers
Sources:
The Insurance Policy for All Quebecers: Accident Victim,
www.saaq.gouv.qc.ca/en/accident_victim/insurance_policy/index.php;
Accident Victim - Compensation Table, 2015
www.saaq.gouv.qc.ca/en/accident_victim/insurance_policy/compensation_table.php
Accident Victim - Table of Death Benefi ts, 2015
www.saaq.gouv.qc.ca/en/accident_victim/insurance_policy/death_table.php
as of January 1, 2015
36 • • • IBC Facts 2015
New BrunswickMandatory minimum third-party
liability:
$200,000 is available for any one accident; however, if a claim involving both bodily injury
and property damage reaches this fi gure, payment for property damage will be capped
at $20,000
Medical payments: Up to $50,000/person; four-year time limit
Funeral expense benefi ts: $2,500
Disability income benefi ts: Maximum $250/week; 104 weeks for partial disability, lifetime for total disability; must
be disabled for at least seven days to qualify; unpaid housekeeper $100/week, maximum
52 weeks
Death benefi ts: Death within 180 days after accident (or two years if continuously disabled prior to
death); death of head of household $50,000, plus $1,000 to each dependent survivor
after fi rst; death of spouse/partner of head of household $25,000; death of dependant
$5,000
Impairment benefi ts: N/A
Right to sue for pain and suff ering? Yes. But if injury is deemed “minor” under provincial legislation, maximum award is
$7,612.50
Right to sue for economic loss in
excess of no-fault benefi ts?
Yes
Administration: Private insurers
Source:
New Brunswick Standard Owner’s Policy N.B.P.F. No.1,
www.gnb.ca/0062/InsuranceBranch/PDF/Bulletins/StandardOwnersAct-E.pdf
Injury Regulation, NB Reg 2003-20
www.canlii.org/en/nb/laws/regu/nb-reg-2003-20/106597/nb-reg-2003-20.html
Financial and Consumer Services Commission. Notice Re: Annual Indexation PDF
http://0101.nccdn.net/1_5/17a/088/09d/SuperintendentNotice_2015-01-28-Final.pdf
as of January 1, 2015
IBC Facts 2015 • • • 37
Nova ScotiaMandatory minimum third-party
liability:
$500,000 is available for any one accident
Medical payments: Up to $50,000/person; four-year time limit (Consumers have option to purchase
additional coverage)
Funeral expense benefi ts: $2,500 (Consumers have option to purchase additional coverage)
Disability income benefi ts: Maximum $250/week; 104 weeks for partial disability, lifetime for total disability; must be
disabled for at least seven days to qualify; unpaid housekeeper $100/week, maximum
52 weeks (Consumers have option to purchase additional coverage)
Death benefi ts: Death within 180 days after accident (or two years if continuously disabled prior to
death); death of head of household $25,000, plus $1,000 to each dependent survivor
after fi rst; death of spouse/partner $25,000; death of dependant $5,000 (Consumers have
option to purchase additional coverage)
Impairment benefi ts: N/A
Right to sue for pain and suff ering? Yes. But if injury is deemed “minor” under provincial legislation, maximum award is $8,352
Right to sue for economic loss in
excess of no-fault benefi ts?
Yes
Administration: Private insurers
Sources:
Nova Scotia Standard Automobile Policy NSPF No.1, 2013,
http://www.novascotia.ca/fi nance/site-fi nance/media/fi nance/SPF1-64103-01_2013.pdf
Automobile Insurance Contract Mandatory Conditions Regulations
www.novascotia.ca/just/regulations/regs/imandcon.htm
Offi ce of the Superintendent of Insurance Bulletin (Nova Scotia)
www.novascotia.ca/fi nance/en/home/insurance/bulletins.aspx
as of January 1, 2015
38 • • • IBC Facts 2015
Prince Edward IslandMandatory minimum third-party
liability:
$200,000 is available for any one accident; however, if a claim involving both bodily
injury and property damage reaches this fi gure, payment for property damage will be
capped at $10,000
Medical payments: Up to $50,000/person; four-year time limit
Funeral expense benefi ts: $2,500
Disability income benefi ts: Maximum $250/week; 104 weeks for partial disability, lifetime for total disability;
must be disabled for at least seven days to qualify; unpaid housekeeper $100/week,
maximum 52 weeks
Death benefi ts: Death within 180 days after accident (or two years if continuously disabled prior to
death); death of head of household $50,000, plus $1,000 to each dependent survivor
after fi rst; death of spouse of head of household $25,000; death of dependant $5,000
Impairment benefi ts: N/A
Right to sue for pain and suff ering? Yes. But if injury is deemed “minor” under provincial regulation, maximum award is $7,500
Right to sue for economic loss in
excess of no-fault benefi ts?
Yes
Administration: Private insurers
Sources:
Insurance Act, RSPEI 1988, c I-4,
http://canlii.ca/en/pe/laws/stat/rspei-1988-c-i-4/latest/rspei-1988-c-i-4.html
Prince Edward Island Standard Automobile Policy S.P.F. No.1,
http://www.gov.pe.ca/photos/original/ELJ_SampleAuto.pdf
as of January 1, 2015
IBC Facts 2015 • • • 39
Newfoundland and LabradorMandatory minimum third-party
liability:
$200,000 is available for any one accident; however, if a claim involving both bodily injury
and property damage reaches this fi gure, payment for property damage will be capped
at $20,000
Medical payments: (Optional to buy) Up to $25,000/person; four-year time limit
Funeral expense benefi ts: (Optional to buy) $1,000
Disability income benefi ts: (Optional to buy) Maximum $140/week; 104 weeks for partial disability, lifetime for total
disability; must be disabled for at least seven days to qualify; unpaid housekeeper
$70/week, maximum 12 weeks
Death benefi ts: (Optional to buy) Death within 180 days after accident (or two years if continuously
disabled prior to death); death of head of household $10,000, plus $1,000 to each
dependent survivor after fi rst; death of spouse $10,000; death of dependant $2,000
Impairment benefi ts: N/A
Right to sue for pain and suff ering? Yes. Awards are subject to deductible of $2,500
Right to sue for economic loss in
excess of no-fault benefi ts?
Yes
Administration: Private insurers
Sources:
Automobile Insurance Act, Chapter A-22, an Act Respecting Automobile Insurance,
http://assembly.nl.ca/Legislation/sr/statutes/a22.htm;
Newfoundland & Labrador Standard Automobile Policy S.P.F. No.1 (not available online)
as of January 1, 2015
40 • • • IBC Facts 2015
YukonMandatory minimum third-party
liability:
$200,000 is available for any one accident; however, if a claim involving both bodily injury
and property damage reaches this fi gure, payment for property damage will be capped
at $10,000
Medical payments: Up to $10,000/person; two-year time limit
Funeral expense benefi ts: $2,000
Disability income benefi ts: 80% of gross weekly wages to maximum $300/week; 104 weeks for temporary or total
disability; nothing is payable for the fi rst seven days of disability; unpaid housekeeper
$100/week, maximum 26 weeks
Death benefi ts: Death of head of household $10,000, plus $2,000 to each dependent survivor other
than the fi rst, and 1% of total principal sum to each dependant/survivor after fi rst, for
104 weeks; death of spouse of head of household $10,000; death of dependent relative,
according to age, maximum $3,000
Impairment benefi ts: N/A
Right to sue for pain and suff ering? Yes
Right to sue for economic loss in
excess of no-fault benefi ts?
Yes
Administration: Private insurers
Sources:
Insurance Act, O.I.C. 1988/090, www.gov.yk.ca/legislation/regs/oic1988_090.pdf;
Yukon Territories Standard Automobile Policy S.P.F. No.1 (not available online)
as of December 31, 2014
IBC Facts 2015 • • • 41
Northwest Territories and Nunavut*
Mandatory minimum third-party
liability:
$200,000 is available for any one accident; however, if a claim involving both bodily injury
and property damage reaches this fi gure, payment for property damage will be capped
at $10,000
Medical payments: Up to $25,000/person; four-year time limit
Funeral expense benefi ts: $1,000
Disability income benefi ts: 80% of gross weekly wages to maximum $140/week; 104 weeks for temporary disability;
lifetime for total disability; nothing is payable for the fi rst seven days of disability; unpaid
housekeeper $100/week, maximum 12 weeks
Death benefi ts: Death within 180 days after accident (or two years if continuously disabled prior to
death); death of head of household $10,000, plus $1,500 to single survivor or $2,500 to
each survivor after fi rst if more than one; death of spouse of head of household $10,000;
death of dependant $2,000
Impairment benefi ts: N/A
Right to sue for pain and suff ering? Yes
Right to sue for economic loss in
excess of no-fault benefi ts?
Yes
Administration: Private insurers
*as of December 31, 2014
Sources:
Northwest TerritoriesInsurance Act, R.S.N.W.T. 1988, c.I-4, www.justice.gov.nt.ca/PDF/ACTS/Insurance.pdf;
Northwest Territories Standard Automobile Policy S.P.F. No.1 (not available online)
NunavutInsurance Act, R.S.N.W.T.1988, c.I-4,
www.justice.gov.nu.ca/apps/search/docSearch.aspx (search “Insurance act” in title);
Nunavut Territories Standard Automobile Policy S.P.F. No.1 (not available online)
42 • • • IBC Facts 2015
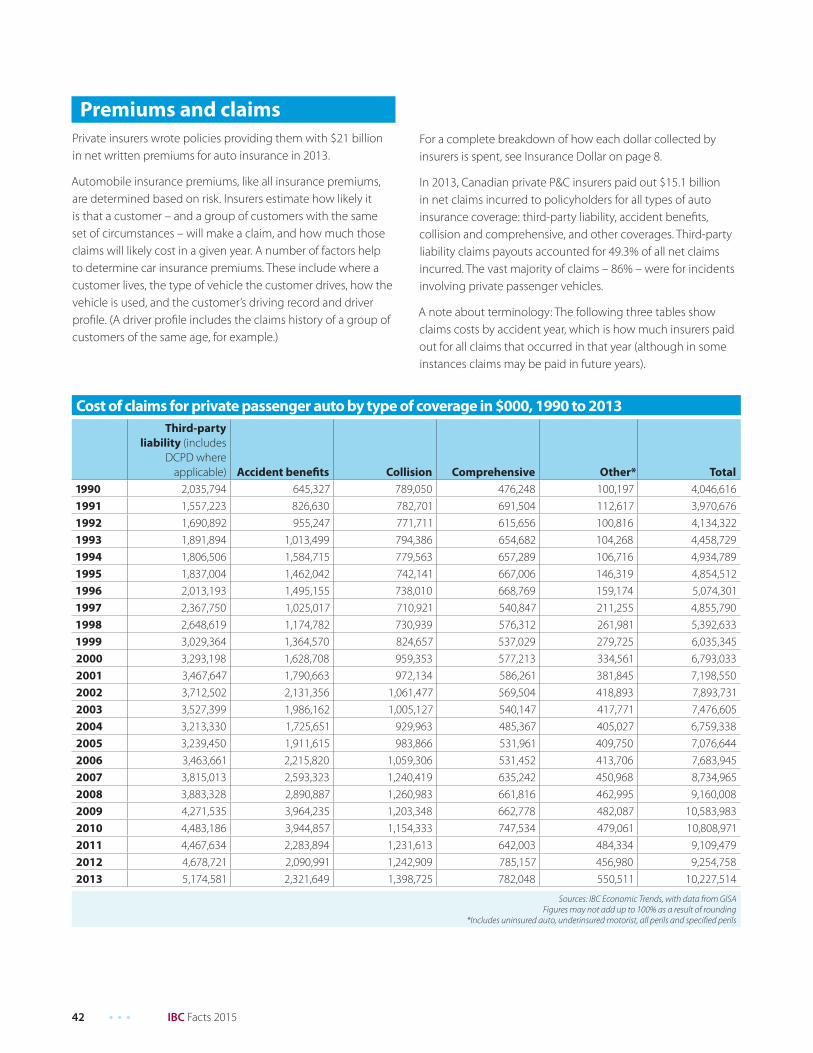
Cost of claims for private passenger auto by type of coverage in $000, 1990 to 2013Third-party
liability (includes DCPD where
applicable) Accident benefits Collision Comprehensive Other* Total1990 2,035,794 645,327 789,050 476,248 100,197 4,046,6161991 1,557,223 826,630 782,701 691,504 112,617 3,970,6761992 1,690,892 955,247 771,711 615,656 100,816 4,134,3221993 1,891,894 1,013,499 794,386 654,682 104,268 4,458,7291994 1,806,506 1,584,715 779,563 657,289 106,716 4,934,789 1995 1,837,004 1,462,042 742,141 667,006 146,319 4,854,512 1996 2,013,193 1,495,155 738,010 668,769 159,174 5,074,301 1997 2,367,750 1,025,017 710,921 540,847 211,255 4,855,790 1998 2,648,619 1,174,782 730,939 576,312 261,981 5,392,633 1999 3,029,364 1,364,570 824,657 537,029 279,725 6,035,345 2000 3,293,198 1,628,708 959,353 577,213 334,561 6,793,033 2001 3,467,647 1,790,663 972,134 586,261 381,845 7,198,550 2002 3,712,502 2,131,356 1,061,477 569,504 418,893 7,893,731 2003 3,527,399 1,986,162 1,005,127 540,147 417,771 7,476,605 2004 3,213,330 1,725,651 929,963 485,367 405,027 6,759,338 2005 3,239,450 1,911,615 983,866 531,961 409,750 7,076,644 2006 3,463,661 2,215,820 1,059,306 531,452 413,706 7,683,945 2007 3,815,013 2,593,323 1,240,419 635,242 450,968 8,734,965 2008 3,883,328 2,890,887 1,260,983 661,816 462,995 9,160,008 2009 4,271,535 3,964,235 1,203,348 662,778 482,087 10,583,983 2010 4,483,186 3,944,857 1,154,333 747,534 479,061 10,808,971 2011 4,467,634 2,283,894 1,231,613 642,003 484,334 9,109,479 2012 4,678,721 2,090,991 1,242,909 785,157 456,980 9,254,758 2013 5,174,581 2,321,649 1,398,725 782,048 550,511 10,227,514
Sources: IBC Economic Trends, with data from GISAFigures may not add up to 100% as a result of rounding
*Includes uninsured auto, underinsured motorist, all perils and specified perils
Premiums and claimsPrivate insurers wrote policies providing them with $21 billion in net written premiums for auto insurance in 2013.
Automobile insurance premiums, like all insurance premiums, are determined based on risk. Insurers estimate how likely it is that a customer – and a group of customers with the same set of circumstances – will make a claim, and how much those claims will likely cost in a given year. A number of factors help to determine car insurance premiums. These include where a customer lives, the type of vehicle the customer drives, how the vehicle is used, and the customer’s driving record and driver profile. (A driver profile includes the claims history of a group of customers of the same age, for example.)
For a complete breakdown of how each dollar collected by insurers is spent, see Insurance Dollar on page 8.
In 2013, Canadian private P&C insurers paid out $15.1 billion in net claims incurred to policyholders for all types of auto insurance coverage: third-party liability, accident benefits, collision and comprehensive, and other coverages. Third-party liability claims payouts accounted for 49.3% of all net claims incurred. The vast majority of claims – 86% – were for incidents involving private passenger vehicles.
A note about terminology: The following three tables show claims costs by accident year, which is how much insurers paid out for all claims that occurred in that year (although in some instances claims may be paid in future years).
IBC Facts 2015 • • • 43
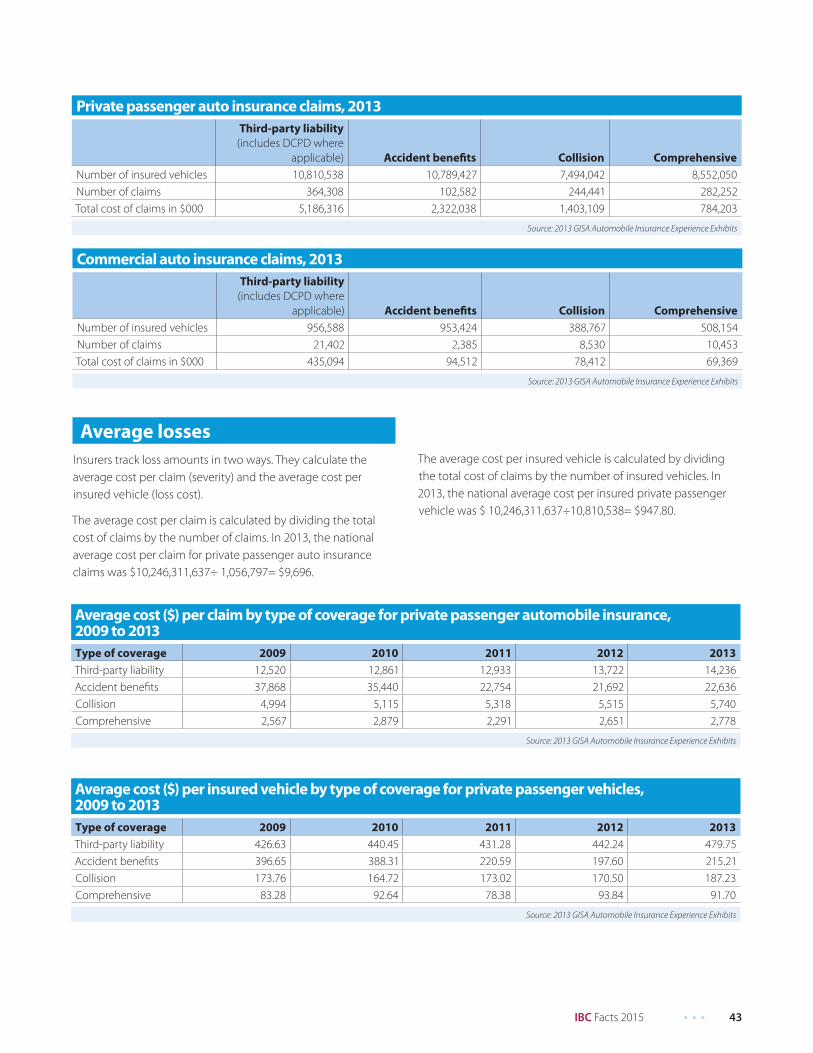
Private passenger auto insurance claims, 2013
Third-party liability
(includes DCPD where
applicable) Accident benefi ts Collision Comprehensive
Number of insured vehicles 10,810,538 10,789,427 7,494,042 8,552,050
Number of claims 364,308 102,582 244,441 282,252
Total cost of claims in $000 5,186,316 2,322,038 1,403,109 784,203
Source: 2013 GISA Automobile Insurance Experience Exhibits
Commercial auto insurance claims, 2013
Third-party liability
(includes DCPD where
applicable) Accident benefi ts Collision Comprehensive
Number of insured vehicles 956,588 953,424 388,767 508,154
Number of claims 21,402 2,385 8,530 10,453
Total cost of claims in $000 435,094 94,512 78,412 69,369
Source: 2013 GISA Automobile Insurance Experience Exhibits
Average losses
Insurers track loss amounts in two ways. They calculate the
average cost per claim (severity) and the average cost per
insured vehicle (loss cost).
The average cost per claim is calculated by dividing the total
cost of claims by the number of claims. In 2013, the national
average cost per claim for private passenger auto insurance
claims was $10,246,311,637÷ 1,056,797= $9,696.
Average cost ($) per claim by type of coverage for private passenger automobile insurance, 2009 to 2013
Type of coverage 2009 2010 2011 2012 2013
Third-party liability 12,520 12,861 12,933 13,722 14,236
Accident benefi ts 37,868 35,440 22,754 21,692 22,636
Collision 4,994 5,115 5,318 5,515 5,740
Comprehensive 2,567 2,879 2,291 2,651 2,778
Source: 2013 GISA Automobile Insurance Experience Exhibits
Average cost ($) per insured vehicle by type of coverage for private passenger vehicles, 2009 to 2013
Type of coverage 2009 2010 2011 2012 2013
Third-party liability 426.63 440.45 431.28 442.24 479.75
Accident benefi ts 396.65 388.31 220.59 197.60 215.21
Collision 173.76 164.72 173.02 170.50 187.23
Comprehensive 83.28 92.64 78.38 93.84 91.70
Source: 2013 GISA Automobile Insurance Experience Exhibits
The average cost per insured vehicle is calculated by dividing
the total cost of claims by the number of insured vehicles. In
2013, the national average cost per insured private passenger
vehicle was $ 10,246,311,637÷10,810,538= $947.80.
44 • • • IBC Facts 2015
Major issues – aff ordable, eff ective auto insurance
An ongoing concern of the insurance industry is aff ordable and
eff ective auto insurance. In Canada, provincial governments
regulate almost all aspects of auto insurance, from what type
of mandatory benefi ts are included, to the approval of rates,
to how insurers treat their customers. The insurance industry
continually works with provincial governments to improve the
auto insurance product and system, with the goal of balancing
aff ordability with adequate, eff ective benefi ts for all those who
drive.
In Ontario, for example, where auto insurance premiums
are high compared to the rest of the country, insurers have
proposed several reforms to the provincial government to
address issues such as escalating health care and treatment
costs, and insurance fraud. Some measures have already been
implemented, and the government is taking steps to enact
further changes.
The insurance industry has also worked with the Alberta
government to bring about positive change in the auto
insurance system. After years of discussion, Alberta has
recently revamped its rate regulation system for auto insurance,
establishing a more fl exible, effi cient and competitive rate-
approval system that will ultimately benefi t Alberta drivers.
In Alberta, New Brunswick, Nova Scotia and Prince Edward
Island, caps on general damage claims for minor injuries such
as sprains, strains and associated whiplash-type disorders have
been eff ective in keeping rates aff ordable.
Major issues – road safety
The number of motor vehicle collision deaths and injuries
continues to decline in Canada as a result of improved driver
behaviour, improved vehicle design and, to some extent, better
road networks.
In 1990, 3,963 people died in traffi c accidents, while in 2012
(the most recent year for which Transport Canada statistics
are available), 2,077 died. This is a reduction of about 48%. The
decline in the rate of injuries has also been signifi cant. In 1990,
262,680 Canadians were injured in collisions; this was reduced
to 165,172 by 2012, which is a reduction of 37%.
Many of today’s most eff ective road safety measures are the
result, in part, of insurer advocacy. Insurers were leaders in
the push for the universal use of seatbelts. Insurers have also
advocated for stronger penalties for drinking and driving,
and for better traffi c law enforcement, which have made a
signifi cant impact on driver behaviours. The industry played a
big role in the introduction of graduated driver licensing in all
provinces, which also improved safety.
New road safety concerns, such as driver distraction, are
emerging. Insurers are helping to identify the factors that lead
to increased risk and are working to implement measures that
will help keep Canadians safe.
Reducing driver distraction is IBC’s latest advocacy focus to
improve driver behaviour. IBC has been advocating strongly for
education about the dangers of distracted driving since 2007,
when it launched a national public awareness campaign on the
issue. All provinces and territories in Canada, except Nunavut,
now ban the use of hand-held electronic devices, including
cellphones, while driving.
Despite these advances, driver distraction – particularly texting
while driving – remains a serious road safety threat. For example,
driver distraction was the leading cause of road fatalities in
Ontario in 2013, surpassing both impaired driving and speed-
related accidents.
In 2014, both the Nova Scotia and Ontario governments
announced their intention to increase fi nes for texting while
driving.
Improved vehicle design – including airbags, energy-absorbing
car frames and anti-lock braking systems – has also contributed
to the reduction in deaths and injuries from collisions.
Of course, some vehicles are safer than others. The Canadian
Loss Experience Automobile Rating (CLEAR) system identifi es
the average size and frequency of insurance claims for most
makes and models of cars. Most insurance companies use
CLEAR to rate vehicles based on their safety record and the cost
to repair or replace them, and then off er lower premiums for
cars with a better rating.
Major issues – adapting to technological innovation
Technological innovations such as autonomous vehicles and
telematics will have an enormous impact on the P&C insurance
industry.
Several car manufacturers predict that autonomous cars will
be on the road within the next few years. In 2014, the Ontario
government launched a pilot to allow the on-road testing of
such vehicles.
Driverless cars are expected to provide many benefi ts,
including less traffi c congestion, improved road safety and a
vast reduction in collisions. However, autonomous vehicles
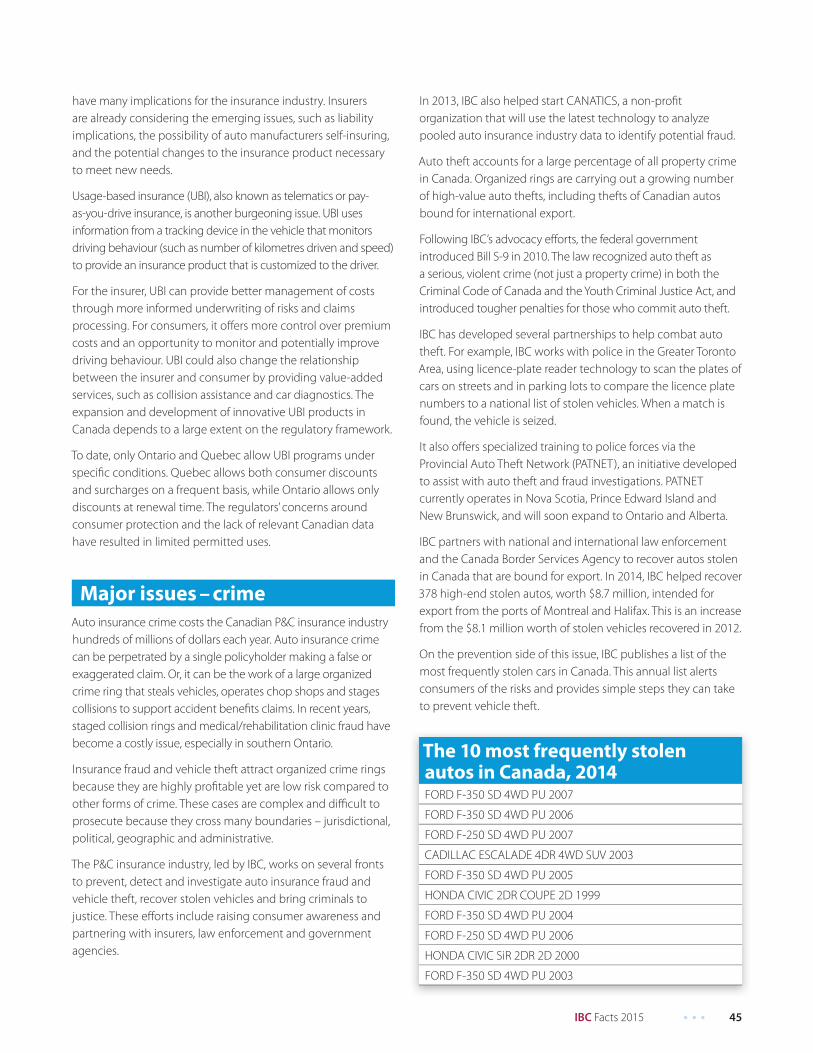
IBC Facts 2015 • • • 45
have many implications for the insurance industry. Insurers
are already considering the emerging issues, such as liability
implications, the possibility of auto manufacturers self-insuring,
and the potential changes to the insurance product necessary
to meet new needs.
Usage-based insurance (UBI), also known as telematics or pay-
as-you-drive insurance, is another burgeoning issue. UBI uses
information from a tracking device in the vehicle that monitors
driving behaviour (such as number of kilometres driven and speed)
to provide an insurance product that is customized to the driver.
For the insurer, UBI can provide better management of costs
through more informed underwriting of risks and claims
processing. For consumers, it off ers more control over premium
costs and an opportunity to monitor and potentially improve
driving behaviour. UBI could also change the relationship
between the insurer and consumer by providing value-added
services, such as collision assistance and car diagnostics. The
expansion and development of innovative UBI products in
Canada depends to a large extent on the regulatory framework.
To date, only Ontario and Quebec allow UBI programs under
specifi c conditions. Quebec allows both consumer discounts
and surcharges on a frequent basis, while Ontario allows only
discounts at renewal time. The regulators’ concerns around
consumer protection and the lack of relevant Canadian data
have resulted in limited permitted uses.
Major issues – crime
Auto insurance crime costs the Canadian P&C insurance industry
hundreds of millions of dollars each year. Auto insurance crime
can be perpetrated by a single policyholder making a false or
exaggerated claim. Or, it can be the work of a large organized
crime ring that steals vehicles, operates chop shops and stages
collisions to support accident benefi ts claims. In recent years,
staged collision rings and medical/rehabilitation clinic fraud have
become a costly issue, especially in southern Ontario.
Insurance fraud and vehicle theft attract organized crime rings
because they are highly profi table yet are low risk compared to
other forms of crime. These cases are complex and diffi cult to
prosecute because they cross many boundaries – jurisdictional,
political, geographic and administrative.
The P&C insurance industry, led by IBC, works on several fronts
to prevent, detect and investigate auto insurance fraud and
vehicle theft, recover stolen vehicles and bring criminals to
justice. These eff orts include raising consumer awareness and
partnering with insurers, law enforcement and government
agencies.
In 2013, IBC also helped start CANATICS, a non-profi t
organization that will use the latest technology to analyze
pooled auto insurance industry data to identify potential fraud.
Auto theft accounts for a large percentage of all property crime
in Canada. Organized rings are carrying out a growing number
of high-value auto thefts, including thefts of Canadian autos
bound for international export.
Following IBC’s advocacy eff orts, the federal government
introduced Bill S-9 in 2010. The law recognized auto theft as
a serious, violent crime (not just a property crime) in both the
Criminal Code of Canada and the Youth Criminal Justice Act, and
introduced tougher penalties for those who commit auto theft.
IBC has developed several partnerships to help combat auto
theft. For example, IBC works with police in the Greater Toronto
Area, using licence-plate reader technology to scan the plates of
cars on streets and in parking lots to compare the licence plate
numbers to a national list of stolen vehicles. When a match is
found, the vehicle is seized.
It also off ers specialized training to police forces via the
Provincial Auto Theft Network (PATNET), an initiative developed
to assist with auto theft and fraud investigations. PATNET
currently operates in Nova Scotia, Prince Edward Island and
New Brunswick, and will soon expand to Ontario and Alberta.
IBC partners with national and international law enforcement
and the Canada Border Services Agency to recover autos stolen
in Canada that are bound for export. In 2014, IBC helped recover
378 high-end stolen autos, worth $8.7 million, intended for
export from the ports of Montreal and Halifax. This is an increase
from the $8.1 million worth of stolen vehicles recovered in 2012.
On the prevention side of this issue, IBC publishes a list of the
most frequently stolen cars in Canada. This annual list alerts
consumers of the risks and provides simple steps they can take
to prevent vehicle theft.
The 10 most frequently stolen autos in Canada, 2014FORD F-350 SD 4WD PU 2007
FORD F-350 SD 4WD PU 2006
FORD F-250 SD 4WD PU 2007
CADILLAC ESCALADE 4DR 4WD SUV 2003
FORD F-350 SD 4WD PU 2005
HONDA CIVIC 2DR COUPE 2D 1999
FORD F-350 SD 4WD PU 2004
FORD F-250 SD 4WD PU 2006
HONDA CIVIC SiR 2DR 2D 2000
FORD F-350 SD 4WD PU 2003
46 • • • IBC Facts 2015
Types of coverage
Home insurance generally covers a homeowner’s residential
building, outbuildings, contents, additional living expenses (if
an insured event damages the home so that it is uninhabitable
during the repairs) and personal liability. Tenant’s insurance
generally covers loss or damage to personal belongings,
additional living expenses and personal liability.
There are various types of policies:
• An all-perils policy provides coverage for a home and
its contents from loss or damage from all perils except
those specifi cally excluded. A peril is a chance event that
is unexpected and accidental. Some perils are excluded
from comprehensive policies – for example, earthquakes.
Coverage for this peril may be purchased as a policy add-on.
However, there are some excluded perils, such as overland
fl ooding, for which home insurance may not be available.
• A broad-form policy provides coverage for a home from loss
or damage from all perils except those specifi cally excluded,
but only insures contents for perils that are specifi cally
named in the policy.
• A standard, basic or named perils policy provides coverage
for a home and its contents for perils specifi cally named in
the policy.
• A no-frills policy provides very basic coverage for properties
that do not meet an insurer’s normal underwriting
standards.
Home insurance
Unlike auto insurance, home or personal property
insurance is not mandatory by law. However, it provides
coverage for an individual’s single largest investment – a
home. In fact, most banks and mortgage holders require
proof of insurance on property used as security for the
loan.
As the second largest line of P&C policies after auto insurance,
home or personal property insurance includes home,
condominium, cottage, mobile home and tenant’s insurance. It
covers the property, personal belongings and personal liability
of the policyholder and the policyholder’s spouse or partner,
children (with age limits) and dependants (with age and other
limits).
Like all insurance premiums, a number of risk factors are
considered to determine the price an individual pays for home
insurance; for example, the neighbourhood and the frequency
and types of past claims in that area; the cost to replace a
home’s contents and restore a home to its previous condition;
the condition and age of the roof; the type of heating, electrical
and plumbing systems; and details about any additional
structures on the property.
Insurers analyze these risks to estimate how likely it is that
a policyholder – or a group of people with the same set of
circumstances – will make a claim, and how much that claim
will cost.
IBC Facts 2015 • • • 47
Premiums and claims
In 2013, private P&C insurers wrote $9 billion in net written
premiums for personal property insurance and paid out
$6.2 billion for net claims incurred.
Major issues – severe weather
Severe weather events are taking their toll on Canadians with
frighteningly greater frequency, disrupting lives and costing
billions of dollars in insured and uninsured losses. For the past
six consecutive years, insured losses caused by large natural
catastrophes have hovered around or surpassed the $1 billion
mark. In 2014, insured damage caused by natural disasters
was $925 million, including loss adjustment expenses. This is a
record high; by comparison, total insured losses averaged $400
million a year over a 25-year period from 1983 to 2008.
Canadian communities have been seeing more severe weather,
especially fl ash rainstorms, hailstorms and snowstorms. These
events can overburden sewer and stormwater infrastructure,
resulting in sewers backing up into homes and businesses.
Communities with aging sewer and stormwater infrastructure
are simply not equipped to handle these intense storms
The P&C insurance industry leads national strategies to help
Canadians build resilience and adapt to this new weather reality.
IBC developed the municipal risk assessment tool (MRAT) as a
predictive tool to help municipalities identify vulnerabilities in
their sewer and stormwater infrastructure. The tool helps them
prioritize improvements to prevent sewer backups and keep
basements dry.
Developed with fi nancial support from Natural Resources
Canada and launched in 2013, MRAT combines information
about municipal infrastructure, climate and insurance claims
to give city engineers a revealing picture of current and future
vulnerabilities projected forward to 2020 and 2050.
In addition to MRAT, the P&C insurance industry advocates at
all government levels for more funds for sewer and stormwater
infrastructure. It also informs individuals across the country
about home maintenance and preventive measures they can
take to help protect their property.
Major issues – earthquakes
A large-scale earthquake has the potential to be the most
serious natural disaster to happen in Canada. Both British
Columbia and the Quebec City-Montreal-Ottawa corridor are
particularly susceptible. A major earthquake in either of these
regions would have severe economic implications for the
region and the country as a whole.
IBC is committed to leading a national conversation on how to
make the country and Canadians more resilient to earthquake
risk. In 2014, IBC held a two-day symposium in Vancouver, B.C.,
which brought together 160 stakeholders, including federal
and provincial politicians, experts from several disciplines and
insurers to discuss how to strengthen Canada’s resilience to
earthquake risk. At the event, IBC raised the need for a public-
private partnership to address the fi nancial risk of a major quake,
which would have a negative eff ect on the country’s economic
and fi scal well-being, and the potential to cause systemic
insolvency for the P&C insurance industry.
Earthquake damage is not covered under a typical home
insurance policy but can be purchased as a policy add-on.
Individuals living in earthquake-prone areas in Quebec, Ontario
and British Columbia could benefi t from having this coverage.
Earthquake insurance may have a higher deductible than
coverage for other perils and generally covers loss or damage to
property that is directly caused by earth movement.
48 • • • IBC Facts 2015
Business insurance
- Commercial property insurance is designed to protect
the physical assets of a business against loss or damage
from a broad range of causes. Physical assets include:
- Equipment
- Inventory and supplies
- Offi ce furniture and fi xtures
- Computers and electronics
- Personal property of employees while on-site
- Customer property at your business site
- Lighting systems
- Windows
- Outdoor signs
• Directors’ and offi cers’ insurance covers areas such as actual
or alleged errors, breach of duty, errors or omissions, neglect
and misleading statements.
• Errors and omissions or professional liability insurance
covers individuals and organizations who give professional
advice (for example, consultants and fi nancial planners).
It protects them if clients claim damages as a result of
inaccurate advice, misrepresentation, negligence, or
violation of good faith and fair dealing.
• Business interruption insurance can cover against lost
earnings during the period of a shutdown due to an event
such as a fi re or riot. It can cover the time the business
needs to resume profi tability. Some business owners buy
additional insurance to cover extra operating expenses – for
example, a new telephone system, extra advertising costs,
rentals and moving costs – if the business must carry on at
another location or outsource work during the shutdown.
Operating a business comes with an element of risk
and unpredictability. Businesses, including non-profi t
organizations such as charities, buy insurance as
part of an eff ective risk management plan. In larger
enterprises, risk managers evaluate any perils to the
business, implement programs to reduce and manage
those dangers, and buy insurance to backstop remaining
exposures.
Smaller businesses without the benefi t of risk managers depend
more on the advice of insurance representatives to identify
risks and help them choose the appropriate insurance to guard
against potential losses.
Much like any other business, home-based businesses require
coverage for possible business-related losses. For example, a
home-based business owner may require commercial liability
coverage since business risks are not covered by the liability
section of a home insurance policy.
Types of coverage
There are various types of business insurance policies:
• Commercial general liability covers a business and its
employees for actions against them that result in bodily
injury, property damage, personal injury, advertising injury,
tenant’s legal liability, and other types of loss or damage to
third parties.
IBC Facts 2015 • • • 49
Premiums and claims
In 2013, private P&C insurers wrote $6.3 billion in net written
premiums for commercial property insurance and paid out $4.7
billion in net claims incurred.
Also in 2013, private P&C insurers wrote $4.7 billion in net
written premiums for commercial liability insurance and paid
out $2.5 billion in net claims incurred.
Major issues – cyber liability
Any business dealing with personal or sensitive data is at
risk of being targeted by cybercriminals. The expansion of
technology and reliance on sharing information online has
made cyber-attacks a very profi table business for fraudsters. The
frequency and sophistication of public breaches and network
interruptions at major organizations has contributed to a
demand for cyber liability coverage.
In 2014, the Heartbleed bug was discovered as a security
vulnerability in software used in many secure websites around
the world. With the potential to expose private data, the bug
caused the temporary shutdown of many electronic systems,
including the Canada Revenue Agency system.
IBC is currently investigating a Canadian perspective on the
cyber risk posed to insurance companies.
Major issues – railway third-party liability
Following the Lac-Mégantic train disaster in 2013 and the
subsequent concerns about shipping hazardous materials by
rail, IBC participated in the public consultation process and
review of the adequacy of third-party liability coverage by the
Canadian Transportation Agency (CTA).
Tragically, the derailment killed 47 residents and destroyed
the downtown of the small Quebec community. With
environmental clean-up costs expected to exceed $200 million
along with potential damages awards from several pending
lawsuits, the rail company’s third-party liability coverage of
$25 million falls short of what will be needed.
The review could lead to future regulatory changes that will
undoubtedly aff ect commercial insurance writers. CTA may
change how it administers the current regulatory framework,
propose revisions to the regulatory framework and consult
with stakeholders on these proposed regulatory changes. IBC
continues to follow this issue closely.
Major issues – cargo theft
Stealing and then selling truck cargo – usually consumer goods,
including electronics, frozen food and clothing – has become
a lucrative business for organized crime rings in Canada.
According to the Canadian Trucking Alliance, cargo theft costs
at least $5 billion each year. Because drivers and trucking
companies fear damaging their reputation and business, cargo
theft often goes unreported, making it diffi cult to recover
goods and prosecute criminals.
In the spring of 2014, IBC and the Canadian Trucking Alliance
launched a national reporting program to enable insurers
and trucking association members to report cargo loss
online. IBC analyzes the data and promptly shares it with a
national network of law enforcement partners, including
Canadian and American border authorities. These partners
can ask IBC to search its database to help improve reporting,
identify and recover stolen property, raise awareness and
bring criminals to justice.
Since its launch in March 2014, the Cargo Crime Reporting
Program has received over 219 reports of cargo-related thefts,
involving goods valued at approximately $15 million and
leading to $5 million in recovered goods. Insurers are promptly
reporting their cargo theft losses to IBC and in much larger
volumes than in previous years.

50 • • • IBC Facts 2015
Insurance organizations
3
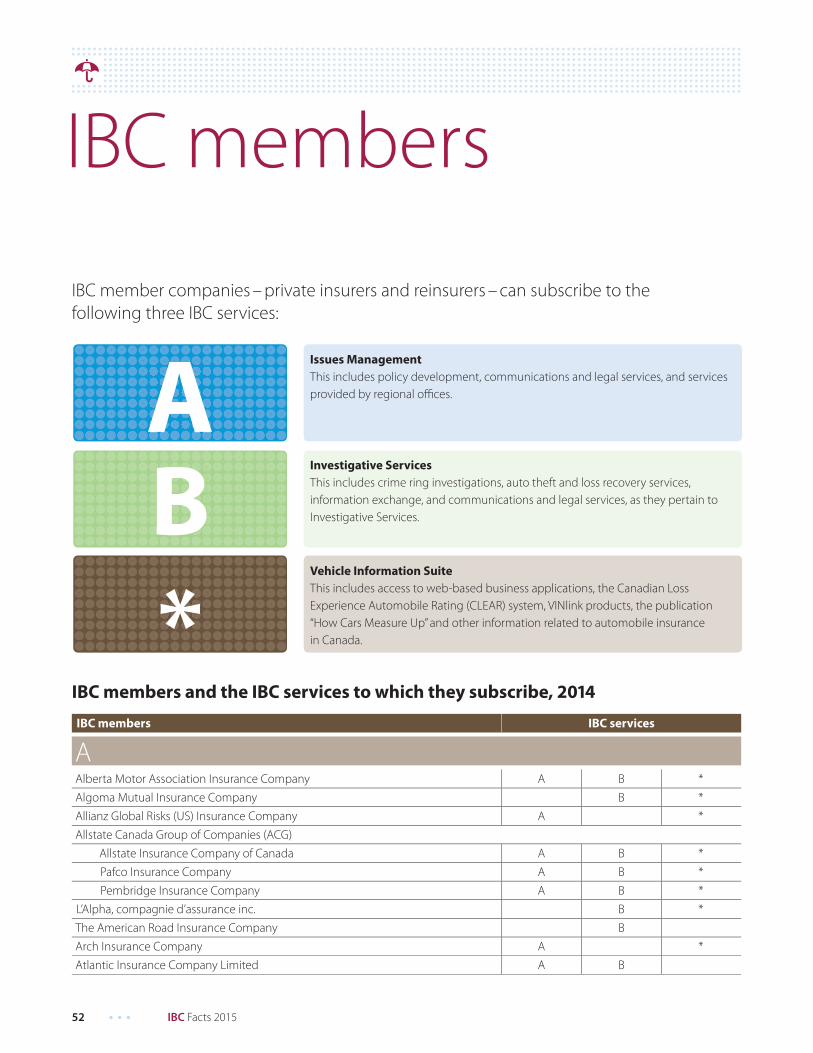
52 • • • IBC Facts 2015
IBC members IBC services
AAlberta Motor Association Insurance Company A B *
Algoma Mutual Insurance Company B *
Allianz Global Risks (US) Insurance Company A *
Allstate Canada Group of Companies (ACG)
Allstate Insurance Company of Canada A B *
Pafco Insurance Company A B *
Pembridge Insurance Company A B *
L’Alpha, compagnie d’assurance inc. B *
The American Road Insurance Company B
Arch Insurance Company A *
Atlantic Insurance Company Limited A B
IBC member companies – private insurers and reinsurers – can subscribe to the
following three IBC services:
IBC members and the IBC services to which they subscribe, 2014
IBC members
AIssues Management
This includes policy development, communications and legal services, and services
provided by regional offi ces.
BInvestigative Services
This includes crime ring investigations, auto theft and loss recovery services,
information exchange, and communications and legal services, as they pertain to
Investigative Services.
*Vehicle Information Suite
This includes access to web-based business applications, the Canadian Loss
Experience Automobile Rating (CLEAR) system, VINlink products, the publication
“How Cars Measure Up” and other information related to automobile insurance
in Canada.
BBBBBBBBBBBBBBBBBBBBBBBBBBBBBBBBBBBBBBBBBBBBBBBBBBBBBBBBBBBBB
********************************
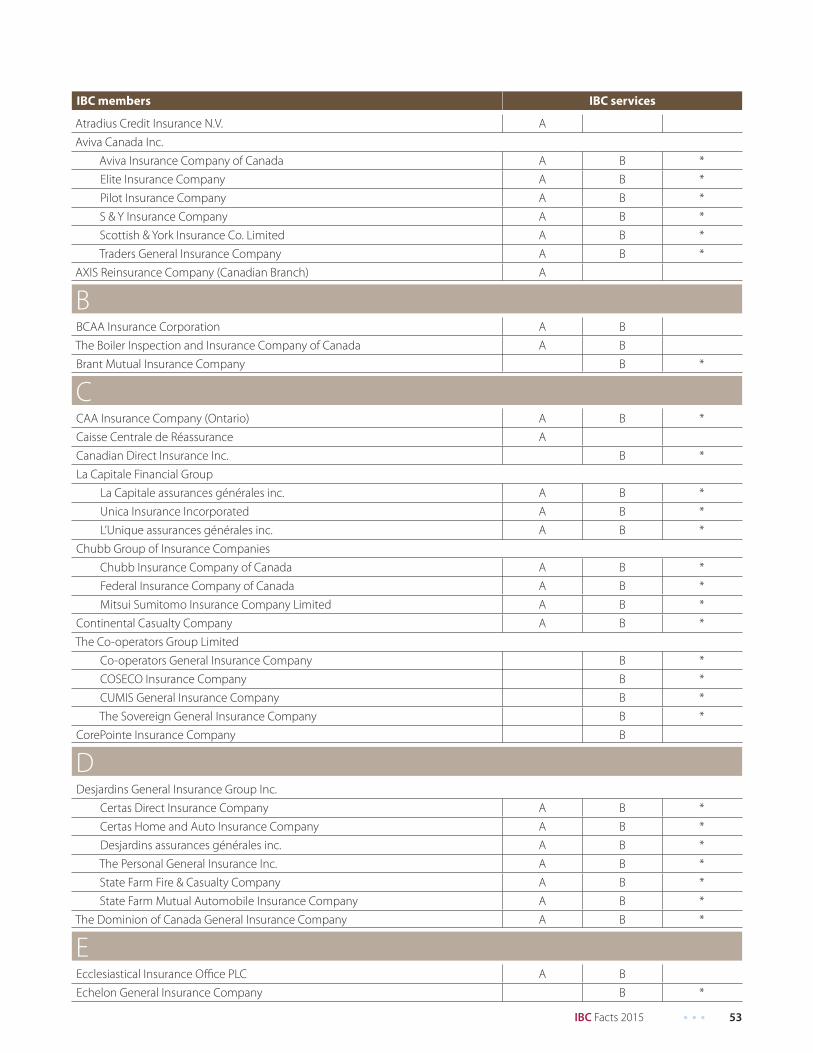
IBC Facts 2015 • • • 53
IBC members IBC services
Atradius Credit Insurance N.V. A
Aviva Canada Inc.
Aviva Insurance Company of Canada A B *
Elite Insurance Company A B *
Pilot Insurance Company A B *
S & Y Insurance Company A B *
Scottish & York Insurance Co. Limited A B *
Traders General Insurance Company A B *
AXIS Reinsurance Company (Canadian Branch) A
BBCAA Insurance Corporation A B
The Boiler Inspection and Insurance Company of Canada A B
Brant Mutual Insurance Company B *
CCAA Insurance Company (Ontario) A B *
Caisse Centrale de Réassurance A
Canadian Direct Insurance Inc. B *
La Capitale Financial Group
La Capitale assurances générales inc. A B *
Unica Insurance Incorporated A B *
L’Unique assurances générales inc. A B *
Chubb Group of Insurance Companies
Chubb Insurance Company of Canada A B *
Federal Insurance Company of Canada A B *
Mitsui Sumitomo Insurance Company Limited A B *
Continental Casualty Company A B *
The Co-operators Group Limited
Co-operators General Insurance Company B *
COSECO Insurance Company B *
CUMIS General Insurance Company B *
The Sovereign General Insurance Company B *
CorePointe Insurance Company B
DDesjardins General Insurance Group Inc.
Certas Direct Insurance Company A B *
Certas Home and Auto Insurance Company A B *
Desjardins assurances générales inc. A B *
The Personal General Insurance Inc. A B *
State Farm Fire & Casualty Company A B *
State Farm Mutual Automobile Insurance Company A B *
The Dominion of Canada General Insurance Company A B *
EEcclesiastical Insurance Offi ce PLC A B
Echelon General Insurance Company B *
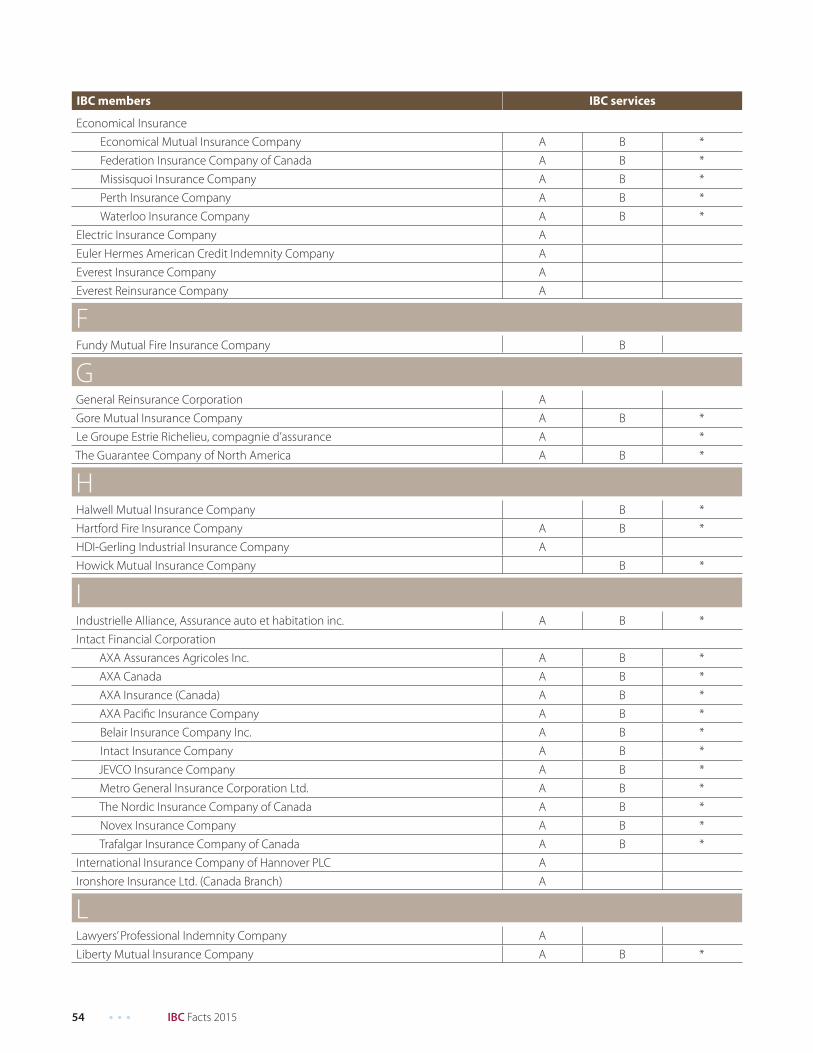
54 • • • IBC Facts 2015
IBC members IBC services
Economical Insurance
Economical Mutual Insurance Company A B *
Federation Insurance Company of Canada A B *
Missisquoi Insurance Company A B *
Perth Insurance Company A B *
Waterloo Insurance Company A B *
Electric Insurance Company A
Euler Hermes American Credit Indemnity Company A
Everest Insurance Company A
Everest Reinsurance Company A
FFundy Mutual Fire Insurance Company B
GGeneral Reinsurance Corporation A
Gore Mutual Insurance Company A B *
Le Groupe Estrie Richelieu, compagnie d’assurance A *
The Guarantee Company of North America A B *
HHalwell Mutual Insurance Company B *
Hartford Fire Insurance Company A B *
HDI-Gerling Industrial Insurance Company A
Howick Mutual Insurance Company B *
IIndustrielle Alliance, Assurance auto et habitation inc. A B *
Intact Financial Corporation
AXA Assurances Agricoles Inc. A B *
AXA Canada A B *
AXA Insurance (Canada) A B *
AXA Pacifi c Insurance Company A B *
Belair Insurance Company Inc. A B *
Intact Insurance Company A B *
JEVCO Insurance Company A B *
Metro General Insurance Corporation Ltd. A B *
The Nordic Insurance Company of Canada A B *
Novex Insurance Company A B *
Trafalgar Insurance Company of Canada A B *
International Insurance Company of Hannover PLC A
Ironshore Insurance Ltd. (Canada Branch) A
LLawyers’ Professional Indemnity Company A
Liberty Mutual Insurance Company A B *
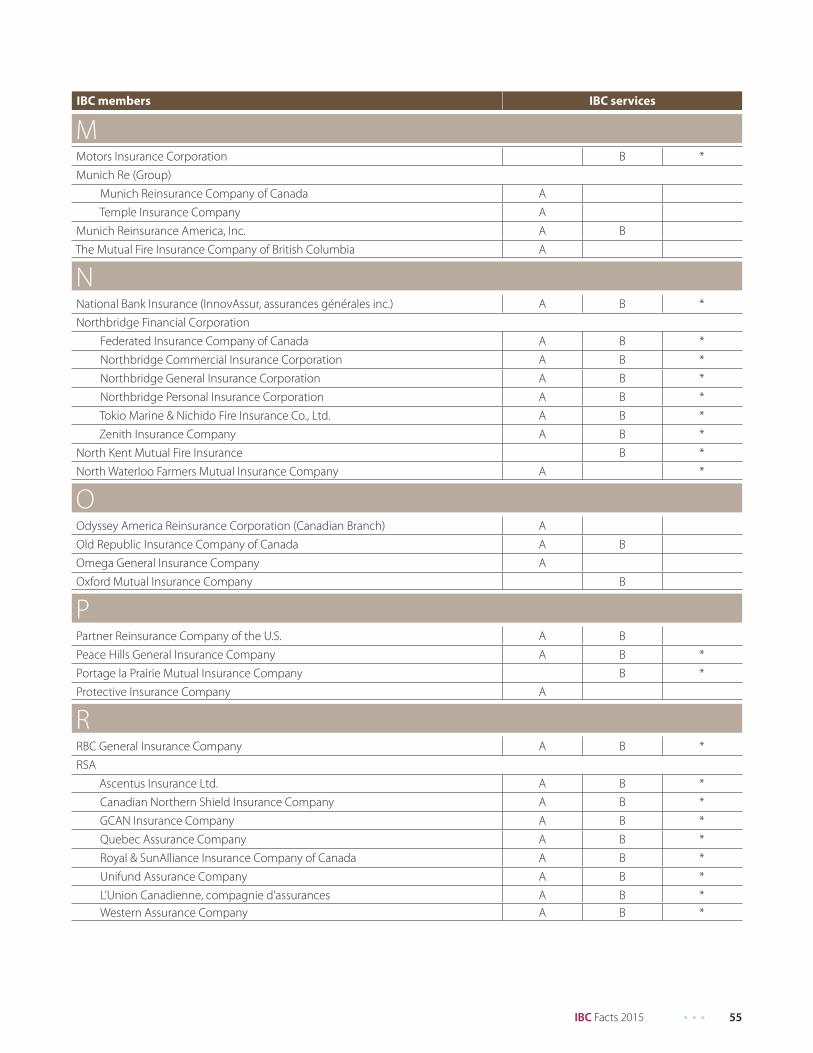
IBC Facts 2015 • • • 55
IBC members IBC services
MMotors Insurance Corporation B *
Munich Re (Group)
Munich Reinsurance Company of Canada A
Temple Insurance Company A
Munich Reinsurance America, Inc. A B
The Mutual Fire Insurance Company of British Columbia A
NNational Bank Insurance (InnovAssur, assurances générales inc.) A B *
Northbridge Financial Corporation
Federated Insurance Company of Canada A B *
Northbridge Commercial Insurance Corporation A B *
Northbridge General Insurance Corporation A B *
Northbridge Personal Insurance Corporation A B *
Tokio Marine & Nichido Fire Insurance Co., Ltd. A B *
Zenith Insurance Company A B *
North Kent Mutual Fire Insurance B *
North Waterloo Farmers Mutual Insurance Company A *
OOdyssey America Reinsurance Corporation (Canadian Branch) A
Old Republic Insurance Company of Canada A B
Omega General Insurance Company A
Oxford Mutual Insurance Company B
PPartner Reinsurance Company of the U.S. A B
Peace Hills General Insurance Company A B *
Portage la Prairie Mutual Insurance Company B *
Protective Insurance Company A
RRBC General Insurance Company A B *
RSA
Ascentus Insurance Ltd. A B *
Canadian Northern Shield Insurance Company A B *
GCAN Insurance Company A B *
Quebec Assurance Company A B *
Royal & SunAlliance Insurance Company of Canada A B *
Unifund Assurance Company A B *
L’Union Canadienne, compagnie d’assurances A B *
Western Assurance Company A B *
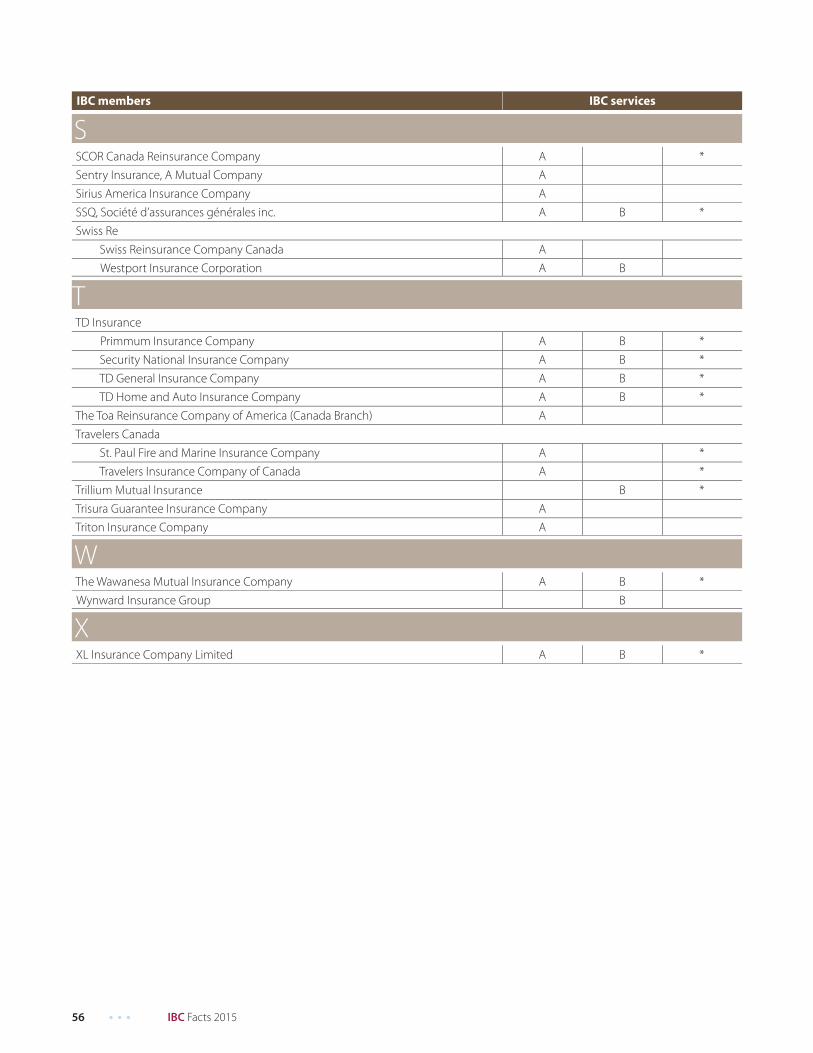
56 • • • IBC Facts 2015
IBC members IBC services
SSCOR Canada Reinsurance Company A *
Sentry Insurance, A Mutual Company A
Sirius America Insurance Company A
SSQ, Société d’assurances générales inc. A B *
Swiss Re
Swiss Reinsurance Company Canada A
Westport Insurance Corporation A B
TTD Insurance
Primmum Insurance Company A B *
Security National Insurance Company A B *
TD General Insurance Company A B *
TD Home and Auto Insurance Company A B *
The Toa Reinsurance Company of America (Canada Branch) A
Travelers Canada
St. Paul Fire and Marine Insurance Company A *
Travelers Insurance Company of Canada A *
Trillium Mutual Insurance B *
Trisura Guarantee Insurance Company A
Triton Insurance Company A
WThe Wawanesa Mutual Insurance Company A B *
Wynward Insurance Group B
XXL Insurance Company Limited A B *
TTrilliuu
T iTTrisur
mm MMutuaal Insurannccee
GG CCa GGuaranteee nnsuraance CCommppappannyy
TTrilliuumm MMutuaal Insurannccee
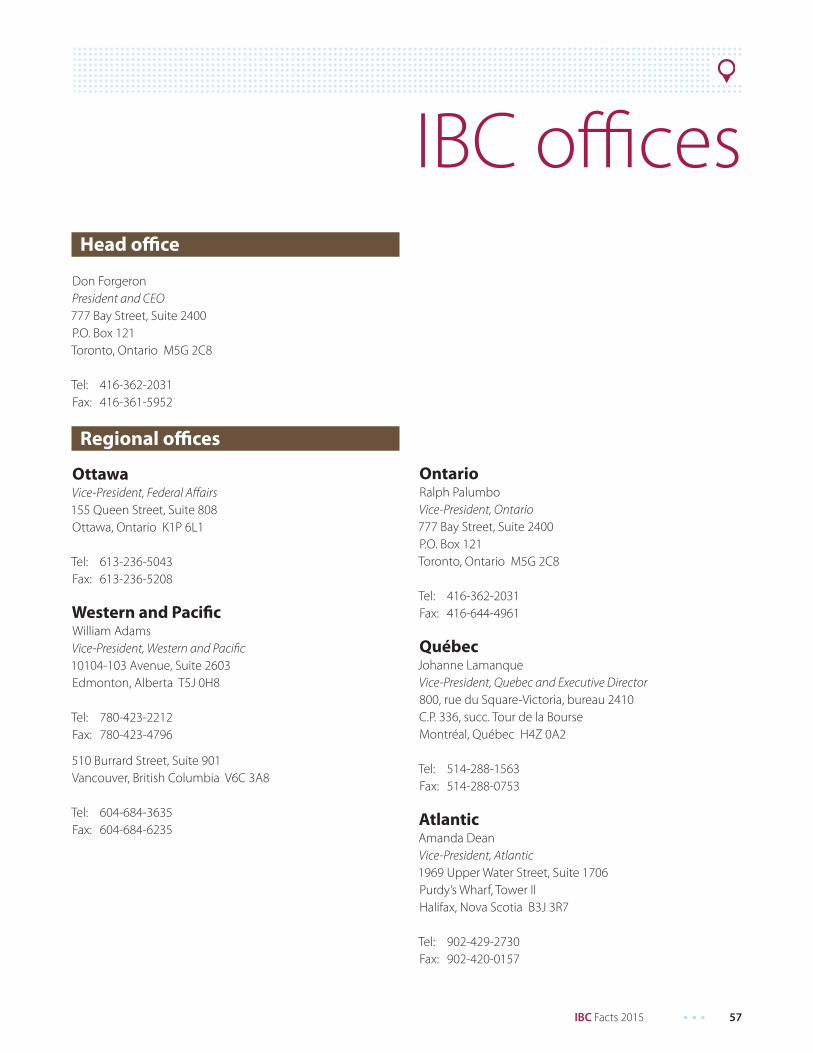
IBC Facts 2015 • • • 57
Head offi ce
Don Forgeron
President and CEO
777 Bay Street, Suite 2400
P.O. Box 121
Toronto, Ontario M5G 2C8
Tel: 416-362-2031
Fax: 416-361-5952
Regional offi ces
OttawaVice-President, Federal Aff airs
155 Queen Street, Suite 808
Ottawa, Ontario K1P 6L1
Tel: 613-236-5043
Fax: 613-236-5208
Western and Pacifi cWilliam Adams
Vice-President, Western and Pacifi c
10104-103 Avenue, Suite 2603
Edmonton, Alberta T5J 0H8
Tel: 780-423-2212
Fax: 780-423-4796
510 Burrard Street, Suite 901
Vancouver, British Columbia V6C 3A8
Tel: 604-684-3635
Fax: 604-684-6235
OntarioRalph Palumbo
Vice-President, Ontario
777 Bay Street, Suite 2400
P.O. Box 121
Toronto, Ontario M5G 2C8
Tel: 416-362-2031
Fax: 416-644-4961
QuébecJohanne Lamanque
Vice-President, Quebec and Executive Director
800, rue du Square-Victoria, bureau 2410
C.P. 336, succ. Tour de la Bourse
Montréal, Québec H4Z 0A2
Tel: 514-288-1563
Fax: 514-288-0753
AtlanticAmanda Dean
Vice-President, Atlantic
1969 Upper Water Street, Suite 1706
Purdy’s Wharf, Tower II
Halifax, Nova Scotia B3J 3R7
Tel: 902-429-2730
Fax: 902-420-0157
IBC offi ces
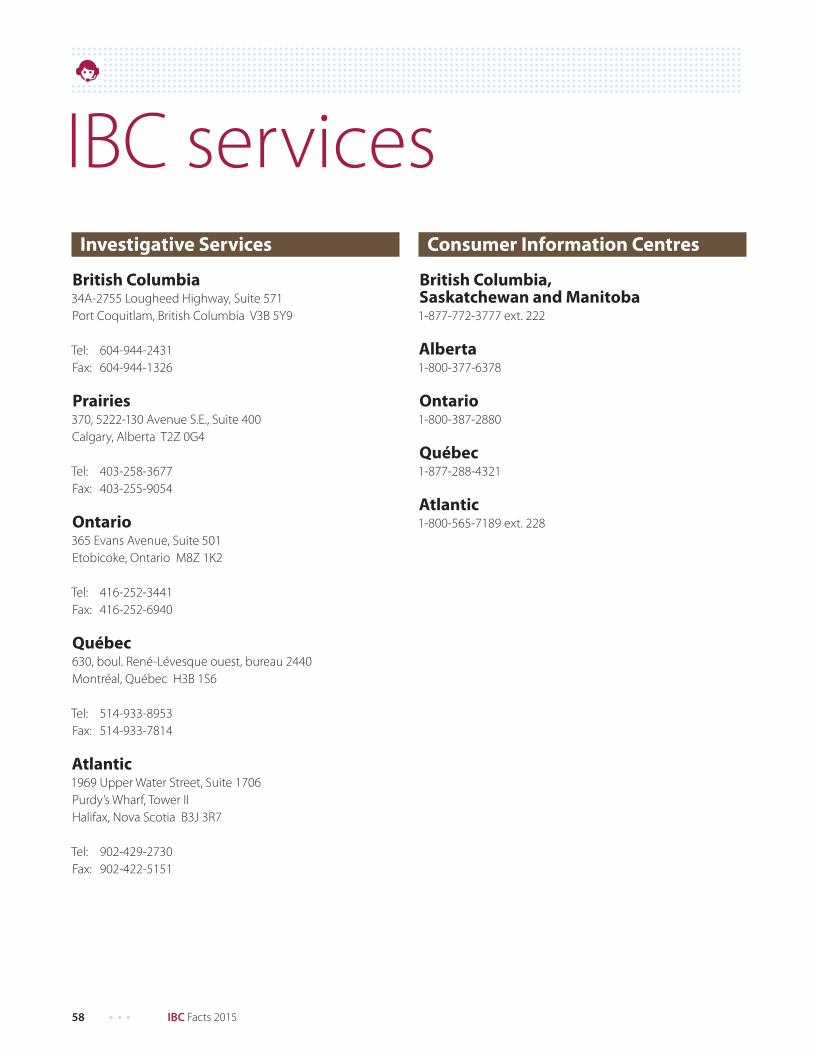
58 • • • IBC Facts 2015
Investigative Services
British Columbia34A-2755 Lougheed Highway, Suite 571
Port Coquitlam, British Columbia V3B 5Y9
Tel: 604-944-2431
Fax: 604-944-1326
Prairies370, 5222-130 Avenue S.E., Suite 400
Calgary, Alberta T2Z 0G4
Tel: 403-258-3677
Fax: 403-255-9054
Ontario365 Evans Avenue, Suite 501
Etobicoke, Ontario M8Z 1K2
Tel: 416-252-3441
Fax: 416-252-6940
Québec630, boul. René-Lévesque ouest, bureau 2440
Montréal, Québec H3B 1S6
Tel: 514-933-8953
Fax: 514-933-7814
Atlantic1969 Upper Water Street, Suite 1706
Purdy’s Wharf, Tower II
Halifax, Nova Scotia B3J 3R7
Tel: 902-429-2730
Fax: 902-422-5151
Consumer Information Centres
British Columbia, Saskatchewan and Manitoba 1-877-772-3777 ext. 222
Alberta1-800-377-6378
Ontario1-800-387-2880
Québec1-877-288-4321
Atlantic1-800-565-7189 ext. 228
IBC services
IBC Facts 2015 • • • 59
as of January 1, 2015
CanadaJeremy Rudin
Superintendent
Offi ce of the Superintendent of Financial Institutions Canada
255 Albert Street
Ottawa, Ontario K1A 0H2
Tel: 613-990-7788
Fax: 613-990-5591
www.osfi -bsif.gc.ca
British ColumbiaCarolyn Rogers
Superintendent and Chief Executive Offi cer
Financial Institutions Commission of British Columbia
555 West Hastings Street, Suite 2800
P.O. Box 12116
Vancouver, British Columbia V6B 4N6
Tel: 604-660-3555
Fax: 604-660-3365
Email: fi com@fi combc.ca
www.fi c.gov.bc.ca
AlbertaMark Prefontaine
Superintendent of Insurance
Alberta Treasury Board and Finance
Financial Sector Regulation and Policy (FSRP)
9515-107 Street, Room 402
Terrace Building
Edmonton, Alberta T5K 2C3
Tel: 780-427-8322
Fax: 780-420-0752
www.fi nance.alberta.ca
SaskatchewanDavid Wild
Superintendent of Insurance
Financial Institutions Division
Financial and Consumer Aff airs Authority
1919 Saskatchewan Drive, Suite 601
Regina, Saskatchewan S4P 4H2
Tel: 306-787-6700
Fax: 306-787-9006
Email: fi [email protected]
www.sfsc.gov.sk.ca
ManitobaJim Scalena
Superintendent of Financial Institutions
Financial Institutions Regulation Branch
207-400 St. Mary Avenue
Winnipeg, Manitoba R3C 4K5
Tel: 204-945-2542
Fax: 204-948-2268
Email: [email protected]
www.gov.mb.ca/fi rb
OntarioBrian Mills
Acting Chief Executive Offi cer and Superintendent
of Financial Services
Financial Services Commission of Ontario
5160 Yonge Street, 17th Floor
P.O. Box 85
Toronto, Ontario M2N 6L9
Tel: 416-250-7250
Fax: 416-590-7070
Toll-free: 1-800-668-0128
www.fsco.gov.on.ca
QuébecLouis Morisset
President and Chief Executive Offi cer
Autorité des marchés fi nanciers
(Agence nationale d’encadrement du secteur fi nancier)
800, square Victoria, 22e étage
C.P. 246, Tour de la Bourse
Montréal, Québec H4Z 1G3
Tel: 514-395-0337
Fax: 514-873-3090
Toll-free: 1-877-525-0337
Place de la Cité, tour Cominar
2640, boulevard Laurier, bureau 400
Québec, Québec G1V 5C1
Tel: 418-525-0337
Fax: 418-525-9512
Email: [email protected]
www.lautorite.qc.ca
Superintendents of insurance
60 • • • IBC Facts 2015
New BrunswickAngela Mazerolle
Superintendent of Insurance
Financial and Consumer Services Commission
225 King Street, Suite 200
Fredericton, New Brunswick E3B 1E1
Tel: 506-658-3060
Fax: 506-658-3059
Email: [email protected]
www.fcnb.ca
Nova ScotiaDouglas Murphy
Superintendent of Insurance
Department of Finance and Treasury Board,
Financial Institutions Division
P.O. Box 2271
Halifax, Nova Scotia B3J 3C8
Tel: 902-424-6331
Fax: 902-424-1298
Email: [email protected]
www.novascotia.ca/fi nance
Prince Edward IslandRobert A. Bradley
Superintendent of Insurance
Department of Environment, Labour and Justice
Shaw Building, 4th Floor
95 Rochford Street
P.O. Box 2000
Charlottetown, Prince Edward Island C1A 7N8
Tel: 902-368-6478
Fax: 902-368-5283
Email: [email protected]
www.gov.pe.ca
Newfoundland and LabradorCraig Whalen
Deputy Superintendent of Insurance
Service NL
2nd Floor W. Block, Confederation Building
100 Prince Philip Drive
P.O. Box 8700
St. John’s NL A1B 4J6
Tel: 709-729-2570
Fax: 709-729-4151
Email: [email protected]
www.gov.nl.ca
YukonFiona Charbonneau
Superintendent of Insurance
Professional Licensing and Regulatory Aff airs (C-5)
Mailing address: P.O. Box 2703 C-5
Whitehorse, Yukon Y1A 2C6
Physical location: 307 Black Street
Whitehorse, Yukon Y1A 2N1
Tel: 867-667-5111
Fax: 867-667-3609
Email: [email protected]
www.gov.yk.ca
Northwest TerritoriesDouglas Doak
Superintendent of Insurance
Treasury Division, Department of Finance
4922-48th Street
P.O. Box 1320
YK Centre, 3rd Floor
Yellowknife, Northwest Territories X1A 2L9
Tel: 867-920-3423
Fax: 867-873-0325
Email: [email protected]
www.fi n.gov.nt.ca
NunavutDan Carlson
Superintendent of Insurance
Department of Finance
P.O. Box 2260
Iqaluit, Nunavut X0A 0H0
Tel: 867-975-6813
Fax: 867-975-5845
Email: [email protected]
www.fi nance.gov.nu.ca
IBC Facts 2015 • • • 61
ADR Institute of Canada, Inc.
234 Eglinton Avenue East, Suite 405
Toronto, Ontario M4P 1K5
Tel: 416-487-4733
Fax: 416-487-4429
Toll-free: 1-877-475-4353
Email: [email protected]
www.adrcanada.ca
Appraisal Institute of Canada
Institut canadien des évaluateurs
403-200 Catherine Street
Ottawa, Ontario K2P 2K9
Tel: 613-234-6533
Fax: 613-234-7197
Email: [email protected]
www.aicanada.ca
Canadian Association of
Direct Relationship Insurers (CADRI)
250 Consumers Road, Suite 301
Toronto, Ontario M2J 4V6
Tel: 416-773-0101
Fax: 416-495-8723
Email: [email protected]
www.cadri.com
Canadian Association of
Financial Institutions in Insurance
21 St. Clair Avenue East, Suite 802
Toronto, Ontario M4T 1L9
Tel: 416-494-9224
Fax: 416-967-6320
Email: [email protected]
www.cafii.com
Canadian Association of Fire Investigators
Association canadienne des enquêteurs incendie
c/o Golden Planners Inc.
310-1390 Prince of Wales Drive
Ottawa, Ontario K2C 3N6
Tel: 613-228-1934
Fax: 613-565-2173
Email: [email protected]
www.cafi.ca
Canadian Association of Insurance Women
www.caiw-acfa.com
Canadian Association of Mutual Insurance Companies
311 McArthur Avenue, Suite 205
Ottawa, Ontario K1L 6P1
Tel: 613-789-6851
Fax: 613-789-7665
www.camic.ca
Canadian Board of Marine Underwriters
2233 Argentia Road, Suite 100
Mississauga, Ontario L5N 2X7
Tel: 905-826-4768
Fax: 905-826-4873
Email: [email protected]
www.cbmu.com
Canadian Boiler and Machinery Underwriters’
Association
c/o Boiler Inspection and Insurance Company
of Canada
250 Yonge Street, Suite 3000
Toronto, Ontario M5B 2L7
Tel: 416-216-7201
Fax: 416-363-0538
www.cbmua.org
Insurance-relatedorganizations
62 • • • IBC Facts 2015
Canadian Council of Insurance Regulators (CCIR)
CCIR Secretariat
5160 Yonge Street
P.O. Box 85
Toronto, Ontario M2N 6L9
Tel: 416-590-7290
Fax: 416-226-7878
Email: [email protected]
www.ccir-ccrra.org
Canadian Fire Safety Association (CFSA)
2800 14th Avenue, Suite 2010
Markham, Ontario L3R 0E4
Tel: 416-492-9417
Fax: 416-491-1670
Email: [email protected]
www.canadianfi resafety.com
Canadian Independent Adjusters’ Association (CIAA)
Centennial Centre
5401 Eglinton Avenue West, Suite 100
Toronto, Ontario M9C 5K6
Tel: 416-621-6222
Fax: 416-621-7776
Toll-free: 1-877-255-5589
Email: [email protected]
www.ciaa-adjusters.ca
Canadian Institute of Actuaries
360 Albert Street, Suite 1740
Ottawa, Ontario K1R 7X7
Tel: 613-236-8196
Fax: 613-233-4552
Email: head.offi [email protected]
www.actuaries.ca
Canadian Insurance Accountants Association (CIAA)
Association canadienne des comptables d’assurance
2800 14th Avenue, Suite 2010
Markham, Ontario L3R 0E4
Tel: 416-971-7800
Fax: 416-491-1670
Email: [email protected]
www.ciaa.org
Canadian Insurance Claims Managers Association
c/o Insurance Bureau of Canada
777 Bay Street, Suite 2400
P.O. Box 121
Toronto, Ontario M5G 2C8
Tel: 416-362-2031
Fax: 416-361-5952
www.cicma.ca
Canadian Life and Health Insurance Association Inc.
TD South Tower
79 Wellington Street West, Suite 2300
Toronto, Ontario M5K 1G8
Tel: 416-777-2221
Fax: 416-777-1895
Email: [email protected]
www.clhia.ca
Centre for Study of Insurance Operations (CSIO)
110 Yonge Street, Suite 500
Toronto, Ontario M5C 1T4
Tel: 416-360-1773
Toll-free: 1-800-463-2746
1155, rue University, bureau 1305
Montréal, Québec H3B 3A7
Tel: 514-393-8200
Toll-free: 1-877-393-2372
Email: [email protected]
www.csio.com
Facility Association (FA)
777 Bay Street, Suite 2400
P.O. Box 121
Toronto, Ontario M5G 2C8
Tel: 416-863-1750
Fax: 416-868-0894
Toll-free: 1-800-268-9572
Email: [email protected]
www.facilityassociation.com
Fire Prevention Canada
3332 McCarthy Road
P.O. Box 37009
Ottawa, Ontario K1V 0W0
Tel: 613-749-3844
Email: info@fi precan.ca
www.fi precan.ca
IBC Facts 2015 • • • 63
Fire Underwriters Survey
Email: admin@fi reunderwriters.ca
www.fi reunderwriters.ca
Atlantic Canada:
238 Brownlow Avenue, Suite 300
Dartmouth, Nova Scotia B3B 1Y2
Tel: 1-877-634-8564
Ontario
150 Commerce Valley Drive West
Markham, Ontario L3T 7Z3
Tel: 1-800-268-8080
Québec
255, boulevard Crémazie Est, 2e étage
Montréal, Québec H2M 1M2
Tel: 1-800-263-5361
Western Canada
3999 Henning Drive
Burnaby, British Columbia V5C 6P9
Tel: 1-800-665-5661
General Insurance OmbudService (GIO)
10 Milner Business Court, Suite 701
Toronto, Ontario M1B 3C6
Tel: 416-299-6931
Fax: 416-299-4261
Toll-free: 1-877-225-0446
Email: [email protected]
www.giocanada.org
Groupement des assureurs automobiles (GAA)
800, rue du Square-Victoria, bureau 2410
C.P. 336, succ. Tour de la Bourse
Montréal, Québec H4Z 0A2
Tel: 514-288-4321
Fax: 514-288-0753
Email: [email protected]
www.gaa.qc.ca
www.info.insurance.ca
Institute for Catastrophic Loss Reduction (ICLR)
20 Richmond Street East, Suite 210
Toronto, Ontario M5C 2R9
Tel: 416-364-8677
Fax: 416-364-5889
Email: [email protected]
www.iclr.org
Insurance Brokers Association of Canada (IBAC)
18 King Street East, Suite 1210
Toronto, Ontario M5C 1C4
Tel: 416-367-1831
Fax: 416-367-3687
Email: [email protected]
www.ibac.ca
Insurance Bureau of Canada (IBC)
777 Bay Street, Suite 2400
P.O. Box 121
Toronto, Ontario M5G 2C8
Tel: 416-362-2031
Fax: 416-361-5952
www.ibc.ca
Insurance Institute of Canada (IIC)
18 King Street East, 6th Floor
Toronto, Ontario M5C 1C4
Tel: 416-362-8586
Fax: 416-362-1126
Toll-free: 1-866-362-8585
Email: [email protected]
www.insuranceinstitute.ca
Nuclear Insurance Association of Canada
401 Bay Street, Suite 1600
Toronto, Ontario M5H 2Y4
Tel: 416-646-6232
Fax: 416-363-0406
www.niac.biz
Property and Casualty Insurance Compensation
Corporation (PCICC)
20 Richmond Street East, Suite 210
Toronto, Ontario M5C 2R9
Tel: 416-364-8677
Fax: 416-364-5889
Email: [email protected]
www.pacicc.ca
Reinsurance Research Council (RRC)
c/o Funnel Communications Inc.
189 Queen Street East, Suite 1
Toronto, Ontario M5A 1S2
Tel: 416-968-0183
Fax: 416-968-6818
Email: [email protected]
www.rrccanada.org
Risk and Insurance Management Society, Inc.
1881 Steeles Avenue West, Suite 332
Toronto, Ontario M3H 0A1
Tel: 416-636-9745
Email: [email protected]
www.rimscanada.ca
64 • • • IBC Facts 2015
Surety Association of Canada
6299 Airport Road, Suite 709
Mississauga, Ontario L4V 1N3
Tel: 905-677-1353
Fax: 905-677-3345
Email: [email protected]
www.surety-canada.com
Traffi c Injury Research Foundation (TIRF)
171 Nepean Street, Suite 200
Ottawa, Ontario K2P 0B4
Tel: 613-238-5235
Fax: 613-238-5292
Toll-free: 1-877-238-5235
Email: [email protected]
www.tirf.ca
Underwriters Laboratories of Canada (ULC)
7 Underwriters Road
Toronto, Ontario M1R 3A9
Tel: 416-757-3611
Fax: 416-757-8727
Toll-free: 1-866-937-3852
Email: [email protected]
www.ulc.ca

ibc.ca
@InsuranceBureau,
@BAC_Quebec,
@IBC_Atlantic,
@IBC_Ontario,
@IBC_West
416-362-2031
Recommended