
EY’s attractiveness surveyScotland 2016
Scotland moves into the global fast lane

Contents
2Welcome
4Performance in 2015
6A big increase in FDI job creation
7Perceptions of Scotland as an FDI location slip back
10Sectors
11Origins of FDI into Scotland
EY 2016 attractiveness survey
Scotland
12FDI activities
14National performance being driven by regional powerhouses
17The FDI performance of Scottish cities
20Methodology
21Conclusion
EY’s attractiveness surveys are widely recognised by our clients, the media and major public stakeholders as a key source of insight on foreign direct investment (FDI). Examining the attractiveness of a particular region or country as an investment destination, the surveys are designed to help businesses to make investment decisions and governments to remove barriers to future growth. A two-step methodology analyses both the reality and perception of FDI in the respective country or region. Findings are based on the views of representative panels of international and local opinion leaders and decision-makers.
Scotland attractiveness report is part of the EY Economics for Business programme which provides knowledge, analysis and insight to help business understand the economic environments in which they operate.
ey.com/uk/economics ey.com/ukas [email protected]
Follow: markgregoryeconomics.ey.com www.linkedin.com/in/markgregoryuk @MarkGregoryEY
WelcomeEY’s annual study of Foreign Direct Investment (FDI) into Scotland reveals the country’s most impressive performance on record and I’m delighted to introduce our findings in the 2016 Scottish Attractiveness report. Our research and analysis demonstrates in no uncertain terms that Scotland is a commanding economic force within the UK and beyond.
2
The results are outstanding. In 2015 Scotland achieved its highest number of projects in any year since EY’s FDI database was launched in 1997. With a phenomenal growth rate of 51%, Scotland secured an increased share of total UK projects as well as a significant rise in the number of FDI jobs.
This data proves that Scotland has been resilient in managing to weather the oil and gas price volatility storm whilst also being able to flourish in other sectors. Business services, software, scientific research and food sectors offer strength and diversity for Scotland.
Scotland’s perceived attractiveness for foreign investors remains at a reassuring level: 7% of companies who are yet to invest in the UK ranked Scotland as the most attractive region; a particularly encouraging sign. This is of significant note given that the ‘halo effect’, created by the landmark events in 2014, appears to be ebbing, with Scotland’s attractiveness slipping back to 4% from 6%.
There are also important opportunities open for exploitation. Scotland could focus on developing stronger relationships among the newer and emerging origin sources of FDI. Although China and India rank among the UK’s top five original sources, they did not appear in Scotland’s top 10. Scotland also trails behind other UK regions in terms of where Headquarters are established.
Manufacturing in the UK performed well, predominantly driven by the North of England and the Midlands. The picture for this sector in Scotland, however, has not been as strong. There has been a decline in machinery and equipment projects, creating fewer jobs per project in comparison to England’s Northern Powerhouse.
Collectively, the regions have performed extremely well and are largely responsible for the UK’s 20% growth in FDI projects with almost 90% of the UK’s growth coming from outside London and the South East. Leading the pack is Scotland with the greatest number of projects outside London.
The UK’s agenda to devolve power has resonated positively with investors who are helping to rebalance economic activity across the country. However, awareness of UK devolution appears to be limited, and knowledge of regional changes could bring further benefits.
Growth in regional economies and the latest FDI figures should not be taken for granted. Now is not the time for Scotland to rest on its laurels. Regional performance is also increasing across European countries, posing greater competition for Scotland and the UK. Continued improvements to infrastructure and skills development will be necessary in order for Scotland to attract more inward investment in the future.
Mark Harvey EY Senior Partner, Scotland
3EY 2016 Scotland attractiveness survey
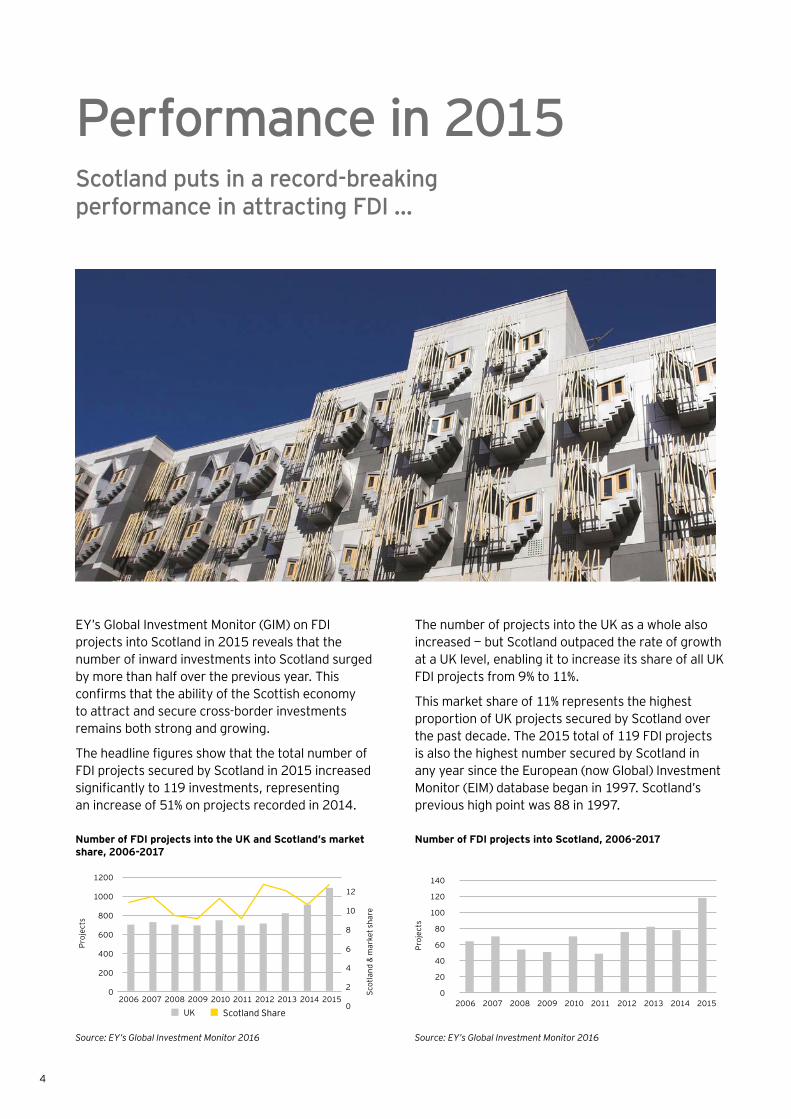
EY’s Global Investment Monitor (GIM) on FDI projects into Scotland in 2015 reveals that the number of inward investments into Scotland surged by more than half over the previous year. This confirms that the ability of the Scottish economy to attract and secure cross-border investments remains both strong and growing.
The headline figures show that the total number of FDI projects secured by Scotland in 2015 increased significantly to 119 investments, representing an increase of 51% on projects recorded in 2014.
The number of projects into the UK as a whole also increased — but Scotland outpaced the rate of growth at a UK level, enabling it to increase its share of all UK FDI projects from 9% to 11%.
This market share of 11% represents the highest proportion of UK projects secured by Scotland over the past decade. The 2015 total of 119 FDI projects is also the highest number secured by Scotland in any year since the European (now Global) Investment Monitor (EIM) database began in 1997. Scotland’s previous high point was 88 in 1997.
Number of FDI projects into the UK and Scotland’s market share, 2006-2017
Source: EY’s Global Investment Monitor 2016
UK Scotland Share2006 2007 2008 2009 2010 2011 2012 2013 2014 2015
1200
1000
800
600
400
200
0
12
10
8
6
4
2
0
Proj
ects
Scot
land
& m
arke
t sha
re
Number of FDI projects into Scotland, 2006-2017
Source: EY’s Global Investment Monitor 2016
2006 2007 2008 2009 2010 2011 2012 2013 2014 2015
140
120
100
80
60
40
20
0
Proj
ects
Performance in 2015Scotland puts in a record-breaking performance in attracting FDI …
4
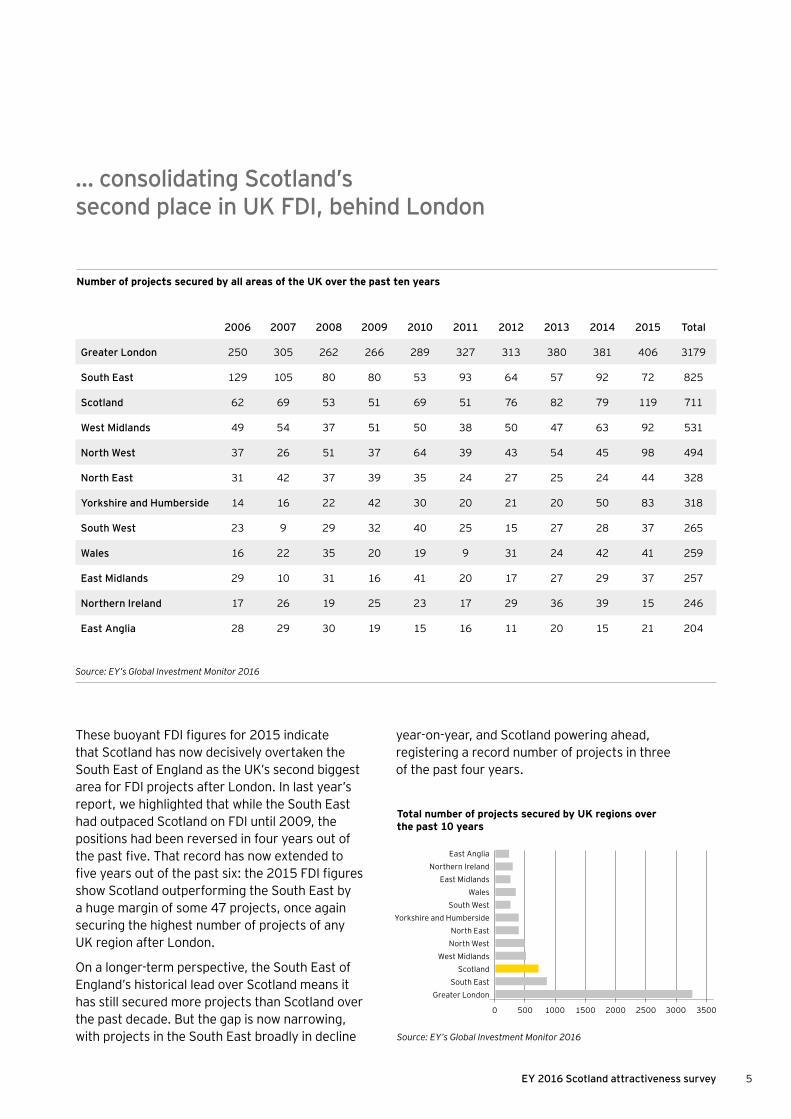
… consolidating Scotland’s second place in UK FDI, behind London
These buoyant FDI figures for 2015 indicate that Scotland has now decisively overtaken the South East of England as the UK’s second biggest area for FDI projects after London. In last year’s report, we highlighted that while the South East had outpaced Scotland on FDI until 2009, the positions had been reversed in four years out of the past five. That record has now extended to five years out of the past six: the 2015 FDI figures show Scotland outperforming the South East by a huge margin of some 47 projects, once again securing the highest number of projects of any UK region after London.
On a longer-term perspective, the South East of England’s historical lead over Scotland means it has still secured more projects than Scotland over the past decade. But the gap is now narrowing, with projects in the South East broadly in decline
year-on-year, and Scotland powering ahead, registering a record number of projects in three of the past four years.
2006 2007 2008 2009 2010 2011 2012 2013 2014 2015 Total
Greater London 250 305 262 266 289 327 313 380 381 406 3179
South East 129 105 80 80 53 93 64 57 92 72 825
Scotland 62 69 53 51 69 51 76 82 79 119 711
West Midlands 49 54 37 51 50 38 50 47 63 92 531
North West 37 26 51 37 64 39 43 54 45 98 494
North East 31 42 37 39 35 24 27 25 24 44 328
Yorkshire and Humberside 14 16 22 42 30 20 21 20 50 83 318
South West 23 9 29 32 40 25 15 27 28 37 265
Wales 16 22 35 20 19 9 31 24 42 41 259
East Midlands 29 10 31 16 41 20 17 27 29 37 257
Northern Ireland 17 26 19 25 23 17 29 36 39 15 246
East Anglia 28 29 30 19 15 16 11 20 15 21 204
Number of projects secured by all areas of the UK over the past ten years
Source: EY’s Global Investment Monitor 2016
Total number of projects secured by UK regions over the past 10 years
Source: EY’s Global Investment Monitor 2016
0 2000500 25001000 30001500 3500
East AngliaNorthern Ireland
East MidlandsWales
South WestYorkshire and Humberside
North EastNorth West
West MidlandsScotland
South EastGreater London
5EY 2016 Scotland attractiveness survey
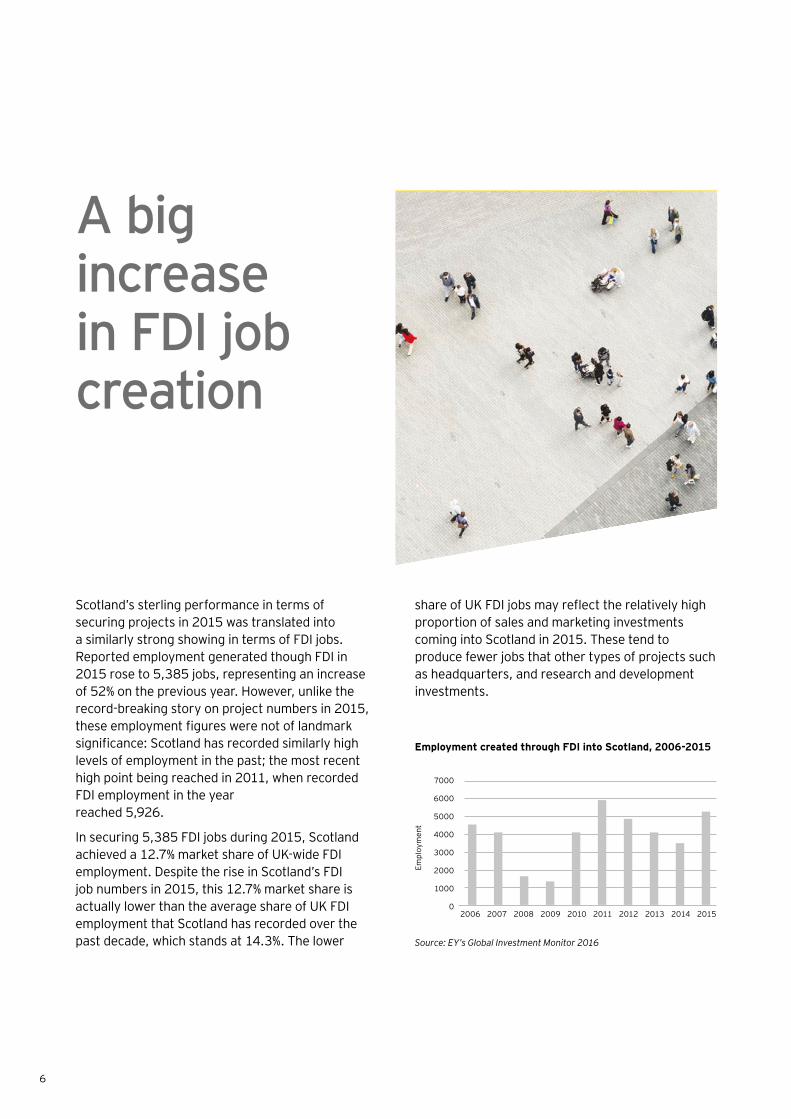
A big increase in FDI job creation
Scotland’s sterling performance in terms of securing projects in 2015 was translated into a similarly strong showing in terms of FDI jobs. Reported employment generated though FDI in 2015 rose to 5,385 jobs, representing an increase of 52% on the previous year. However, unlike the record-breaking story on project numbers in 2015, these employment figures were not of landmark significance: Scotland has recorded similarly high levels of employment in the past; the most recent high point being reached in 2011, when recorded FDI employment in the year reached 5,926.
In securing 5,385 FDI jobs during 2015, Scotland achieved a 12.7% market share of UK-wide FDI employment. Despite the rise in Scotland’s FDI job numbers in 2015, this 12.7% market share is actually lower than the average share of UK FDI employment that Scotland has recorded over the past decade, which stands at 14.3%. The lower
share of UK FDI jobs may reflect the relatively high proportion of sales and marketing investments coming into Scotland in 2015. These tend to produce fewer jobs that other types of projects such as headquarters, and research and development investments.
Employment created through FDI into Scotland, 2006-2015
Source: EY’s Global Investment Monitor 2016
2006 2007 2008 2009 2010 2011 2012 2013 2014 2015
7000
6000
5000
4000
3000
2000
1000
0
Empl
oym
ent
6
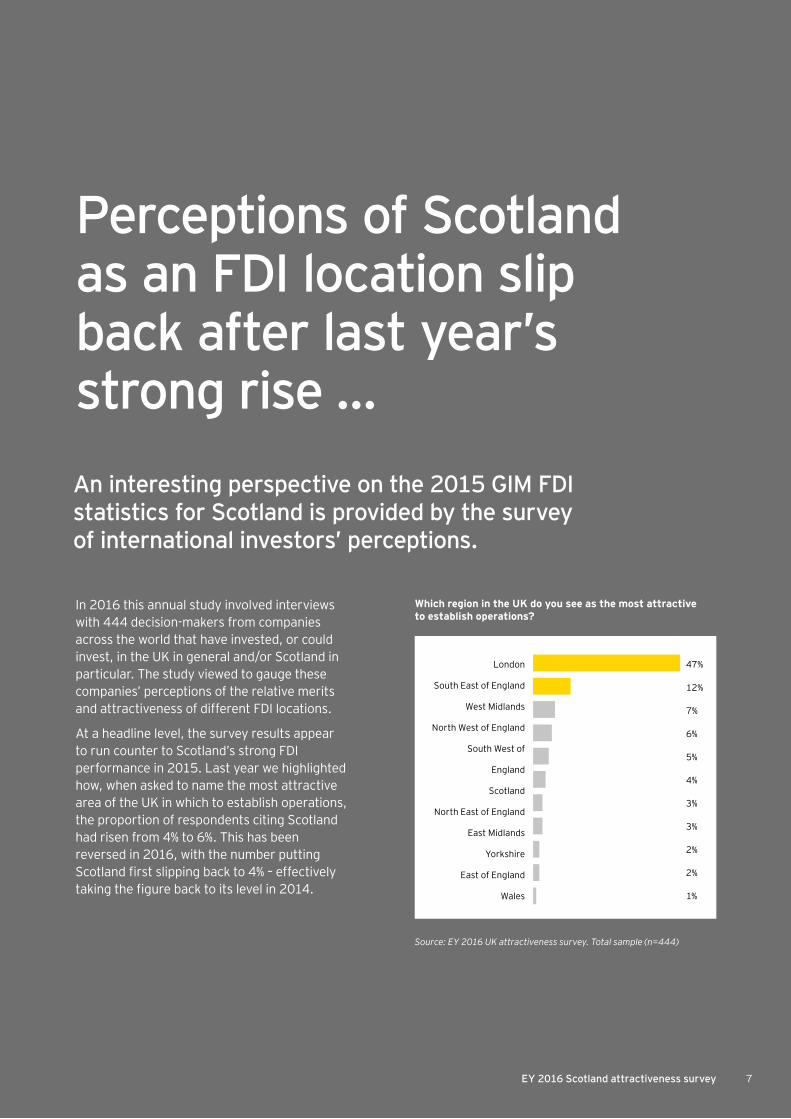
Perceptions of Scotland as an FDI location slip back after last year’s strong rise …
In 2016 this annual study involved interviews with 444 decision-makers from companies across the world that have invested, or could invest, in the UK in general and/or Scotland in particular. The study viewed to gauge these companies’ perceptions of the relative merits and attractiveness of different FDI locations.
At a headline level, the survey results appear to run counter to Scotland’s strong FDI performance in 2015. Last year we highlighted how, when asked to name the most attractive area of the UK in which to establish operations, the proportion of respondents citing Scotland had risen from 4% to 6%. This has been reversed in 2016, with the number putting Scotland first slipping back to 4% – effectively taking the figure back to its level in 2014.
An interesting perspective on the 2015 GIM FDI statistics for Scotland is provided by the survey of international investors’ perceptions.
Which region in the UK do you see as the most attractive to establish operations?
Source: EY 2016 UK attractiveness survey. Total sample (n=444)
London
South East of England
West Midlands
North West of England
South West of
England
Scotland
North East of England
East Midlands
Yorkshire
East of England
Wales
47%
12%
7%
6%
5%
4%
3%
3%
2%
2%
1%
7EY 2016 Scotland attractiveness survey
… but Scotland’s fundamentals remain strong …
However, a closer look reveals a number of reasons why this change should not be regarded too negatively. One is that the findings on regional perceptions are by their nature, volatile year-on-year. Another is that last year’s result, as we noted at the time, was undoubtedly influenced by the short-term ‘halo effect’ from Scotland’s high-profile events in 2014, such as the Commonwealth Games and Ryder Cup. Indeed, 2015’s record-breaking crop of FDI projects may partly reflect the continued follow-through from that landmark year.
Also, the proportion of international investors in our 2016 survey citing Scotland as the UK’s most attractive FDI location is significantly higher than the 4% headline figure among two key groups of businesses: financial intermediation firms (6%), and those companies that have yet to invest in the UK (7%). All of this points to the continued strength of Scotland’s global FDI brand; a resilience that has manifested itself both in the country’s expanding flow of FDI projects in 2015, and also in the rising proportion of new — as opposed to expansion — investments within that continued strong project flow.
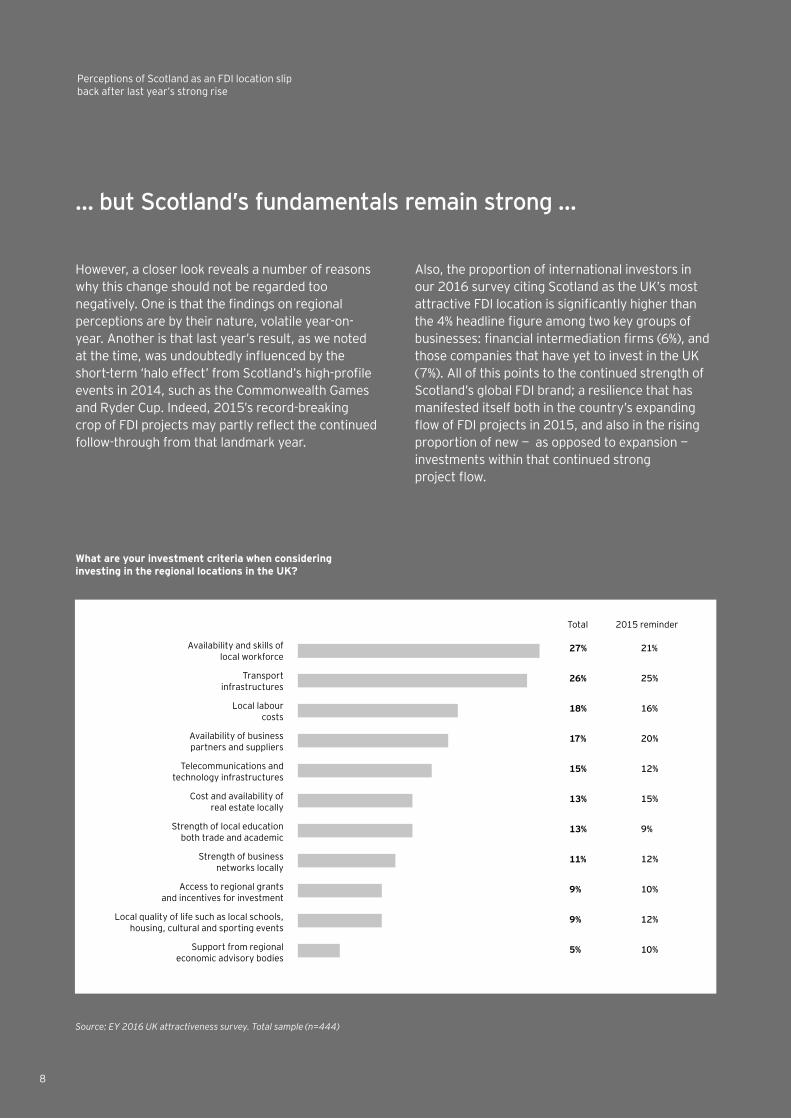
Availability and skills of local workforce
Transport infrastructures
Local labour costs
Availability of business partners and suppliers
Telecommunications and technology infrastructures
Cost and availability of real estate locally
Strength of local education both trade and academic
Strength of business networks locally
Access to regional grants and incentives for investment
Local quality of life such as local schools, housing, cultural and sporting events
Support from regional economic advisory bodies
27%
26%
18%
17%
15%
13%
13%
11%
9%
9%
5%
21%
25%
16%
20%
12%
15%
9%
12%
10%
12%
10%
2015 reminderTotal
What are your investment criteria when considering investing in the regional locations in the UK?
Source: EY 2016 UK attractiveness survey. Total sample (n=444)
8
Perceptions of Scotland as an FDI location slip back after last year’s strong rise
… as investors focus on skills and transport links
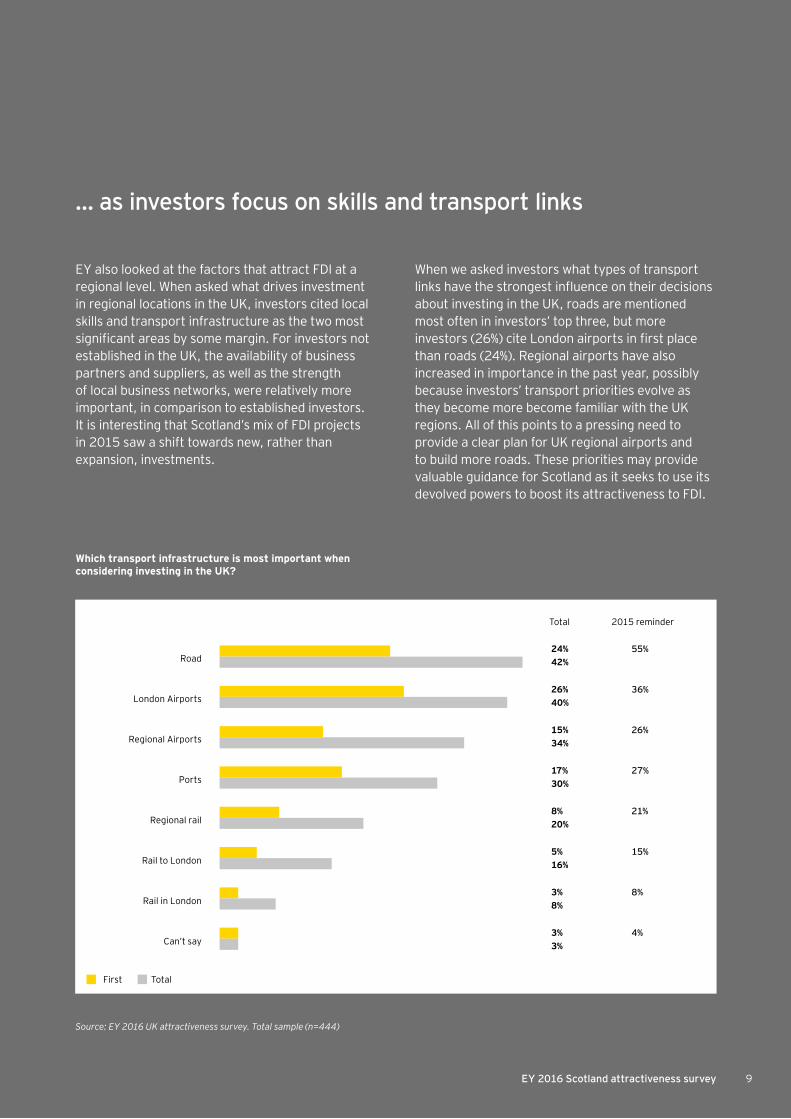
EY also looked at the factors that attract FDI at a regional level. When asked what drives investment in regional locations in the UK, investors cited local skills and transport infrastructure as the two most significant areas by some margin. For investors not established in the UK, the availability of business partners and suppliers, as well as the strength of local business networks, were relatively more important, in comparison to established investors. It is interesting that Scotland’s mix of FDI projects in 2015 saw a shift towards new, rather than expansion, investments.
When we asked investors what types of transport links have the strongest influence on their decisions about investing in the UK, roads are mentioned most often in investors’ top three, but more investors (26%) cite London airports in first place than roads (24%). Regional airports have also increased in importance in the past year, possibly because investors’ transport priorities evolve as they become more become familiar with the UK regions. All of this points to a pressing need to provide a clear plan for UK regional airports and to build more roads. These priorities may provide valuable guidance for Scotland as it seeks to use its devolved powers to boost its attractiveness to FDI.
24% 42%
26% 40%
15% 34%
17% 30%
8% 20%
5% 16%
3% 8%
3% 3%
55%
36%
26%
27%
21%
15%
8%
4%
Road
London Airports
Regional Airports
Ports
Regional rail
Rail to London
Rail in London
Can’t say
First Total
2015 reminderTotal
Which transport infrastructure is most important when considering investing in the UK?
Source: EY 2016 UK attractiveness survey. Total sample (n=444)
9EY 2016 Scotland attractiveness survey
SectorsA surge in utility supply, business services and software FDI projects
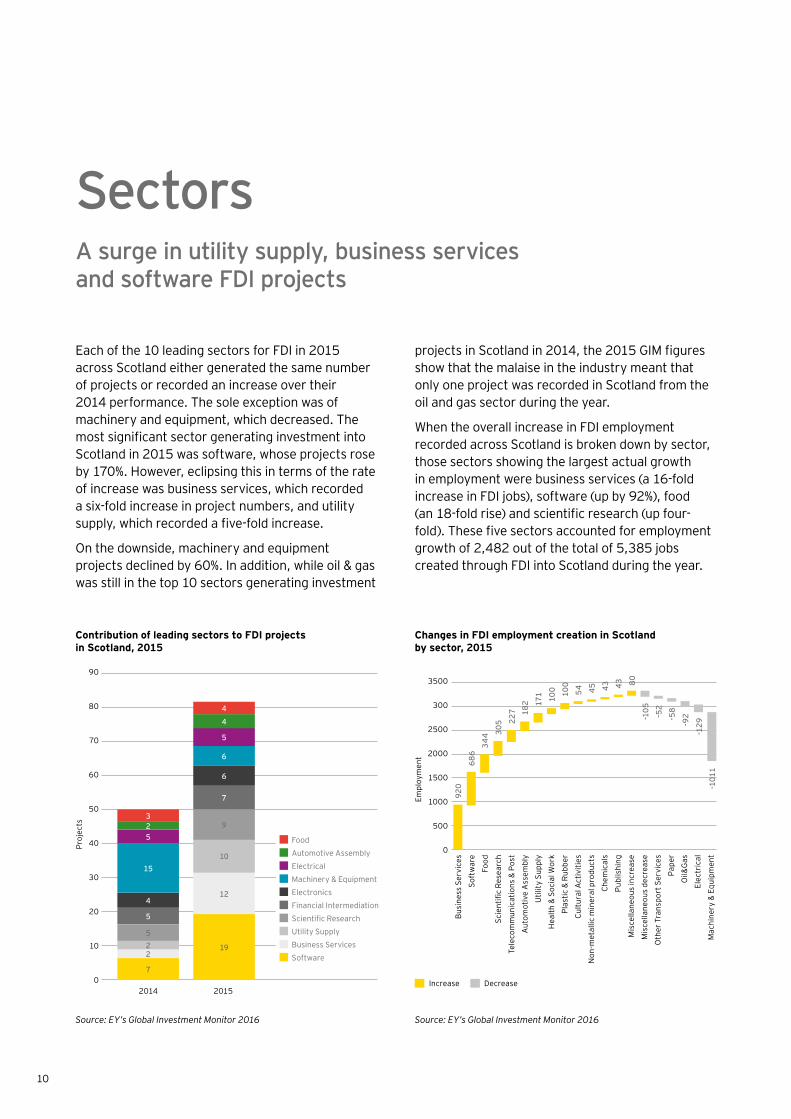
Each of the 10 leading sectors for FDI in 2015 across Scotland either generated the same number of projects or recorded an increase over their 2014 performance. The sole exception was of machinery and equipment, which decreased. The most significant sector generating investment into Scotland in 2015 was software, whose projects rose by 170%. However, eclipsing this in terms of the rate of increase was business services, which recorded a six-fold increase in project numbers, and utility supply, which recorded a five-fold increase.
On the downside, machinery and equipment projects declined by 60%. In addition, while oil & gas was still in the top 10 sectors generating investment
projects in Scotland in 2014, the 2015 GIM figures show that the malaise in the industry meant that only one project was recorded in Scotland from the oil and gas sector during the year.
When the overall increase in FDI employment recorded across Scotland is broken down by sector, those sectors showing the largest actual growth in employment were business services (a 16-fold increase in FDI jobs), software (up by 92%), food (an 18-fold rise) and scientific research (up four-fold). These five sectors accounted for employment growth of 2,482 out of the total of 5,385 jobs created through FDI into Scotland during the year.
Contribution of leading sectors to FDI projects in Scotland, 2015
Changes in FDI employment creation in Scotland by sector, 2015
Source: EY’s Global Investment Monitor 2016 Source: EY’s Global Investment Monitor 2016
2
12
2
10
5
9
5
7
4
6
15
6
5
5
2
4
3
4
7
19
2014 2015
90
80
70
60
50
40
30
20
10
0
Proj
ects
Busi
ness
Ser
vice
s
Soft
war
e
Food
Scie
ntifi
c Re
sear
ch
Tele
com
mun
icat
ions
& P
ost
Aut
omot
ive
Ass
embl
y
Util
ity S
uppl
y
Hea
lth &
Soc
ial W
ork
Plas
tic &
Rub
ber
Cultu
ral A
ctiv
ities
Non
-met
allic
min
eral
pro
duct
s
Chem
ical
s
Publ
ishi
ng
Mis
cella
neou
s in
crea
se
Mis
cella
neou
s de
crea
se
Oth
er T
rans
port
Ser
vice
s
Pape
r
Oil&
Gas
Elec
tric
al
Mac
hine
ry &
Equ
ipm
ent
3500
300
2500
2000
1500
1000
500
0
Empl
oym
ent
920
686
344 30
5 227 18
2 171 10
0
-105
-129
-101
1
-52
-58
-92
54 45 43 43 80
100
Increase
Food
Automotive Assembly
Electrical
Machinery & Equipment
Electronics
Financial Intermediation
Scientific Research
Utility Supply
Business Services
Software
Decrease
10
Origins of FDI into ScotlandProven strengths need to be extended to newer FDI markets
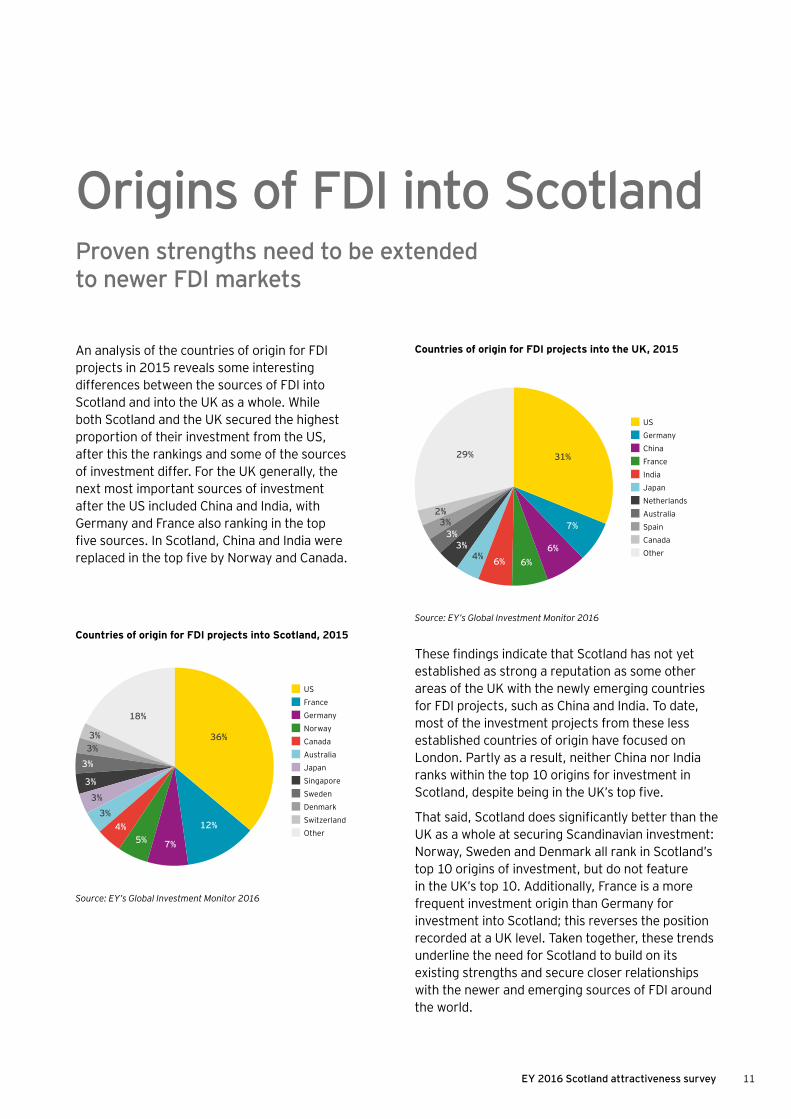
An analysis of the countries of origin for FDI projects in 2015 reveals some interesting differences between the sources of FDI into Scotland and into the UK as a whole. While both Scotland and the UK secured the highest proportion of their investment from the US, after this the rankings and some of the sources of investment differ. For the UK generally, the next most important sources of investment after the US included China and India, with Germany and France also ranking in the top five sources. In Scotland, China and India were replaced in the top five by Norway and Canada.
These findings indicate that Scotland has not yet established as strong a reputation as some other areas of the UK with the newly emerging countries for FDI projects, such as China and India. To date, most of the investment projects from these less established countries of origin have focused on London. Partly as a result, neither China nor India ranks within the top 10 origins for investment in Scotland, despite being in the UK’s top five.
That said, Scotland does significantly better than the UK as a whole at securing Scandinavian investment: Norway, Sweden and Denmark all rank in Scotland’s top 10 origins of investment, but do not feature in the UK’s top 10. Additionally, France is a more frequent investment origin than Germany for investment into Scotland; this reverses the position recorded at a UK level. Taken together, these trends underline the need for Scotland to build on its existing strengths and secure closer relationships with the newer and emerging sources of FDI around the world.
Countries of origin for FDI projects into the UK, 2015
Source: EY’s Global Investment Monitor 2016
Countries of origin for FDI projects into Scotland, 2015
Source: EY’s Global Investment Monitor 2016
US
France
Germany
Norway
Canada
Australia
Japan
Singapore
Sweden
Denmark
Switzerland
Other
US
Germany
China
France
India
Japan
Netherlands
Australia
Spain
Canada
Other
36%
31%
12%
7%
6%
7%
6%
5%
6%
4%
4%
3%
3%
3%
3%
3%
3%
3%
2%
3%
3%
18%
29%
11EY 2016 Scotland attractiveness survey
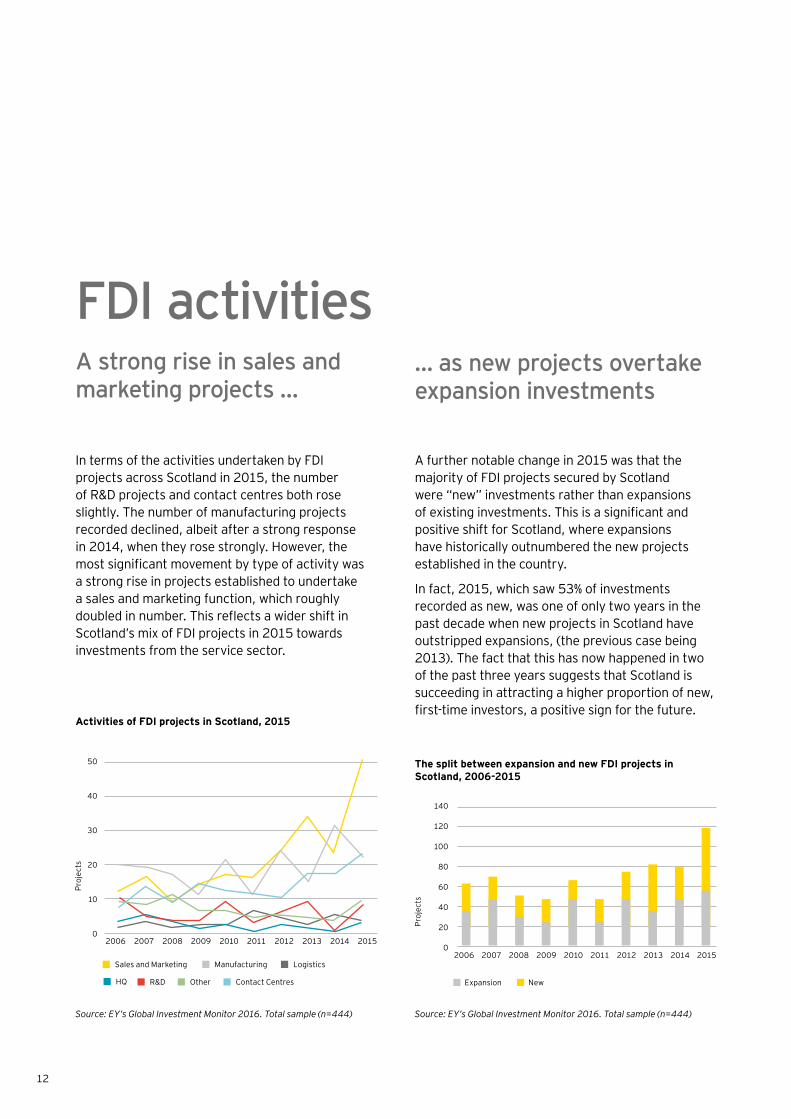
FDI activitiesA strong rise in sales and marketing projects …
A further notable change in 2015 was that the majority of FDI projects secured by Scotland were “new” investments rather than expansions of existing investments. This is a significant and positive shift for Scotland, where expansions have historically outnumbered the new projects established in the country.
In fact, 2015, which saw 53% of investments recorded as new, was one of only two years in the past decade when new projects in Scotland have outstripped expansions, (the previous case being 2013). The fact that this has now happened in two of the past three years suggests that Scotland is succeeding in attracting a higher proportion of new, first-time investors, a positive sign for the future.
… as new projects overtake expansion investments
In terms of the activities undertaken by FDI projects across Scotland in 2015, the number of R&D projects and contact centres both rose slightly. The number of manufacturing projects recorded declined, albeit after a strong response in 2014, when they rose strongly. However, the most significant movement by type of activity was a strong rise in projects established to undertake a sales and marketing function, which roughly doubled in number. This reflects a wider shift in Scotland’s mix of FDI projects in 2015 towards investments from the service sector.
Activities of FDI projects in Scotland, 2015
Source: EY’s Global Investment Monitor 2016. Total sample (n=444)
Proj
ects
Sales and Marketing
R&D
Manufacturing
Other
Logistics
Contact CentresHQ
2006 2007 2008 2009 2010 2011 2012 2013 2014 2015
50
40
30
20
10
0
The split between expansion and new FDI projects in Scotland, 2006-2015
Source: EY’s Global Investment Monitor 2016. Total sample (n=444)
Expansion New
2006 2007 2008 2009 2010 2011 2012 2013 2014 2015
140
120
100
80
60
40
20
0
Proj
ects
12
Looking at the biggest FDI projects in terms of job creation, 10 projects announced across Scotland in 2015 reported that they would each create 200 or more jobs. These included several manufacturing investments as well as an announcement of an R&D centre investment. The remaining large-scale
projects were recorded as being driven by sales/marketing-type activities or call-centre operations. In reality, some administrative back office functions are often recorded as sales and marketing activities, which can provide a slightly different impression from the actual function undertaken.
Largest projects in Scotland in 2015 in terms of job creation
Source: EY’s Global Investment Monitor 2016
Company name City Origin country Jobs Project type Activity
JP Morgan Glasgow City USA 500 Expansion Sales & Marketing
Webhelp Groupe Argyll and Bute France 400 New Contact Centre
Lockheed Martin UK Glasgow City USA 327 New Research & Development
Webhelp East Ayrshire France 300 Expansion Contact Centre
Marine Harvest Fife Norway 260 Expansion Manufacturing
Jabil Circuit Inc West Lothian USA 212 Expansion Sales & Marketing
Concentrix Renfrewshire USA 200 Expansion Sales & Marketing
ThyssenKrupp AG South Lanarkshire Germany 200 Expansion Manufacturing
HGS Europe Scottish Borders India 200 Expansion Contact Centre
CGI France Edinburgh City Canada 200 Expansion Shared Services Centre
13EY 2016 Scotland attractiveness survey
National performance being driven by regional powerhouses
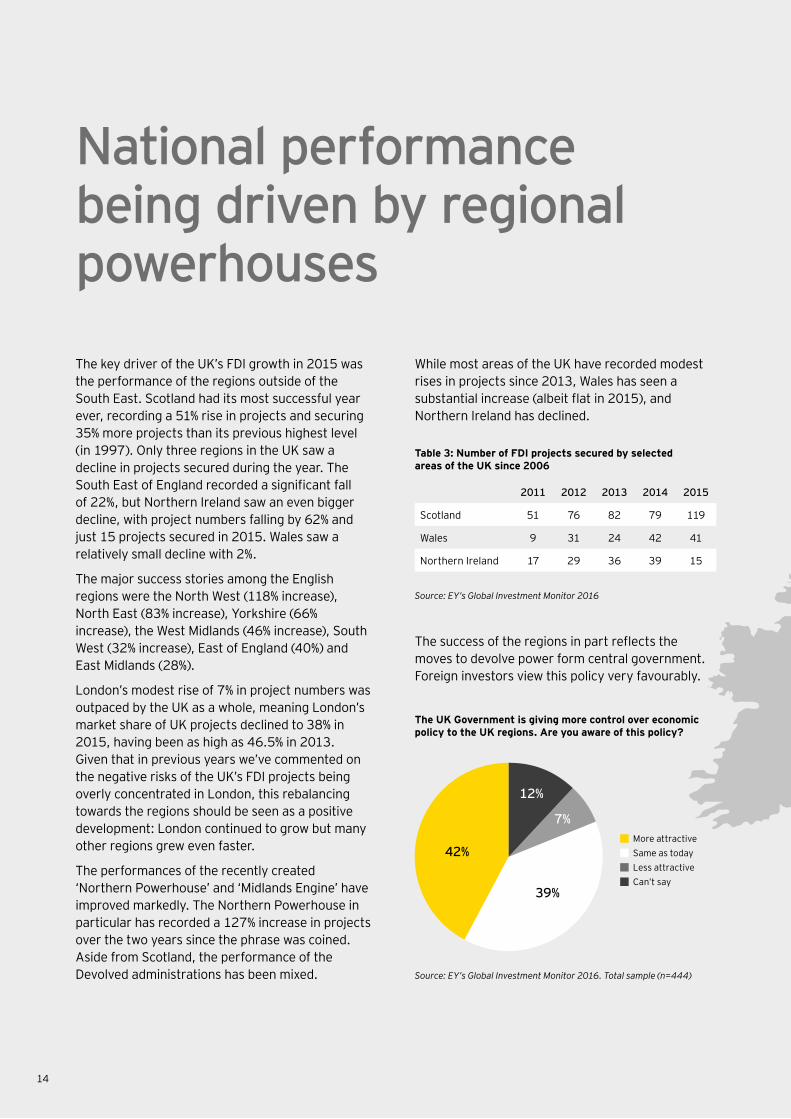
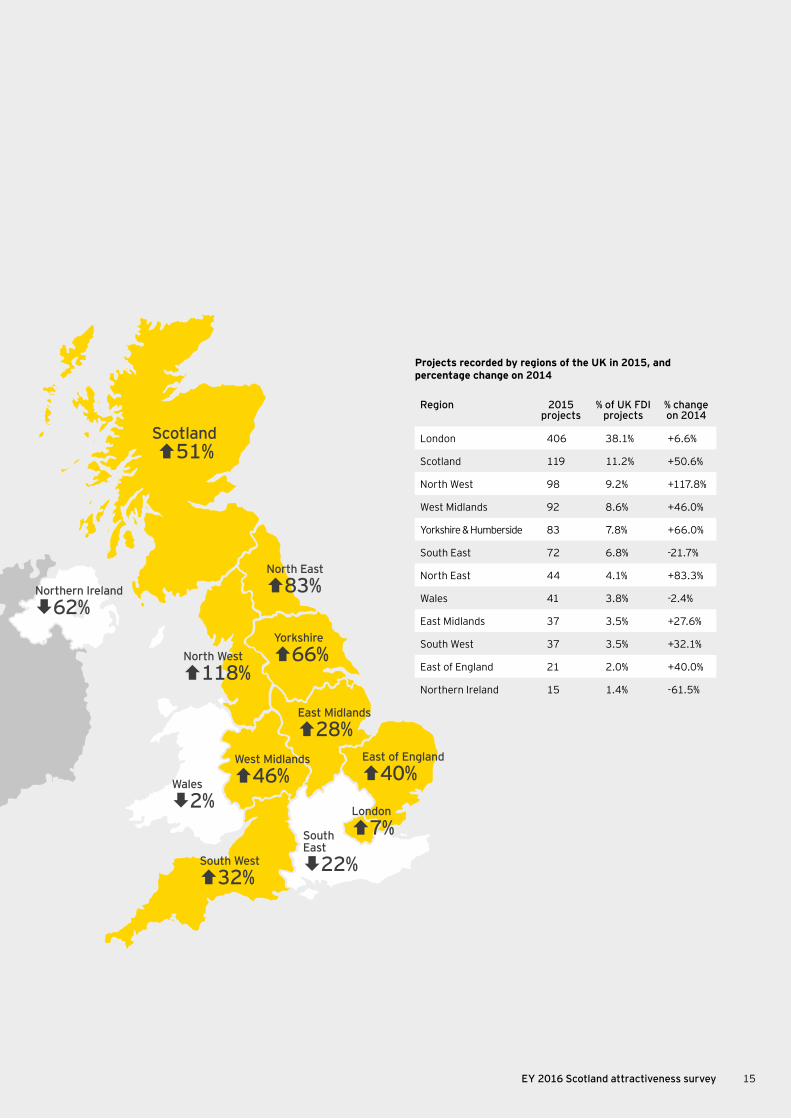
The key driver of the UK’s FDI growth in 2015 was the performance of the regions outside of the South East. Scotland had its most successful year ever, recording a 51% rise in projects and securing 35% more projects than its previous highest level (in 1997). Only three regions in the UK saw a decline in projects secured during the year. The South East of England recorded a significant fall of 22%, but Northern Ireland saw an even bigger decline, with project numbers falling by 62% and just 15 projects secured in 2015. Wales saw a relatively small decline with 2%.
The major success stories among the English regions were the North West (118% increase), North East (83% increase), Yorkshire (66% increase), the West Midlands (46% increase), South West (32% increase), East of England (40%) and East Midlands (28%).
London’s modest rise of 7% in project numbers was outpaced by the UK as a whole, meaning London’s market share of UK projects declined to 38% in 2015, having been as high as 46.5% in 2013. Given that in previous years we’ve commented on the negative risks of the UK’s FDI projects being overly concentrated in London, this rebalancing towards the regions should be seen as a positive development: London continued to grow but many other regions grew even faster.
The performances of the recently created ‘Northern Powerhouse’ and ‘Midlands Engine’ have improved markedly. The Northern Powerhouse in particular has recorded a 127% increase in projects over the two years since the phrase was coined. Aside from Scotland, the performance of the Devolved administrations has been mixed.
The success of the regions in part reflects the moves to devolve power form central government. Foreign investors view this policy very favourably.
2011 2012 2013 2014 2015
Scotland 51 76 82 79 119
Wales 9 31 24 42 41
Northern Ireland 17 29 36 39 15
Table 3: Number of FDI projects secured by selected areas of the UK since 2006
The UK Government is giving more control over economic policy to the UK regions. Are you aware of this policy?
42%
39%
12%
7%
Source: EY’s Global Investment Monitor 2016
Source: EY’s Global Investment Monitor 2016. Total sample (n=444)
While most areas of the UK have recorded modest rises in projects since 2013, Wales has seen a substantial increase (albeit flat in 2015), and Northern Ireland has declined.
More attractive Same as today Less attractive Can’t say
14
Yorkshire
66%
North East
83%
North West
118%
Northern Ireland
62%
West Midlands
46%
East Midlands
28%East of England
40%Wales
2%
South West
32%
London
7%South East
22%
Scotland51%
Region 2015 projects
% of UK FDI projects
% change on 2014
London 406 38.1% +6.6%
Scotland 119 11.2% +50.6%
North West 98 9.2% +117.8%
West Midlands 92 8.6% +46.0%
Yorkshire & Humberside 83 7.8% +66.0%
South East 72 6.8% -21.7%
North East 44 4.1% +83.3%
Wales 41 3.8% -2.4%
East Midlands 37 3.5% +27.6%
South West 37 3.5% +32.1%
East of England 21 2.0% +40.0%
Northern Ireland 15 1.4% -61.5%
Projects recorded by regions of the UK in 2015, and percentage change on 2014
15EY 2016 Scotland attractiveness survey

16
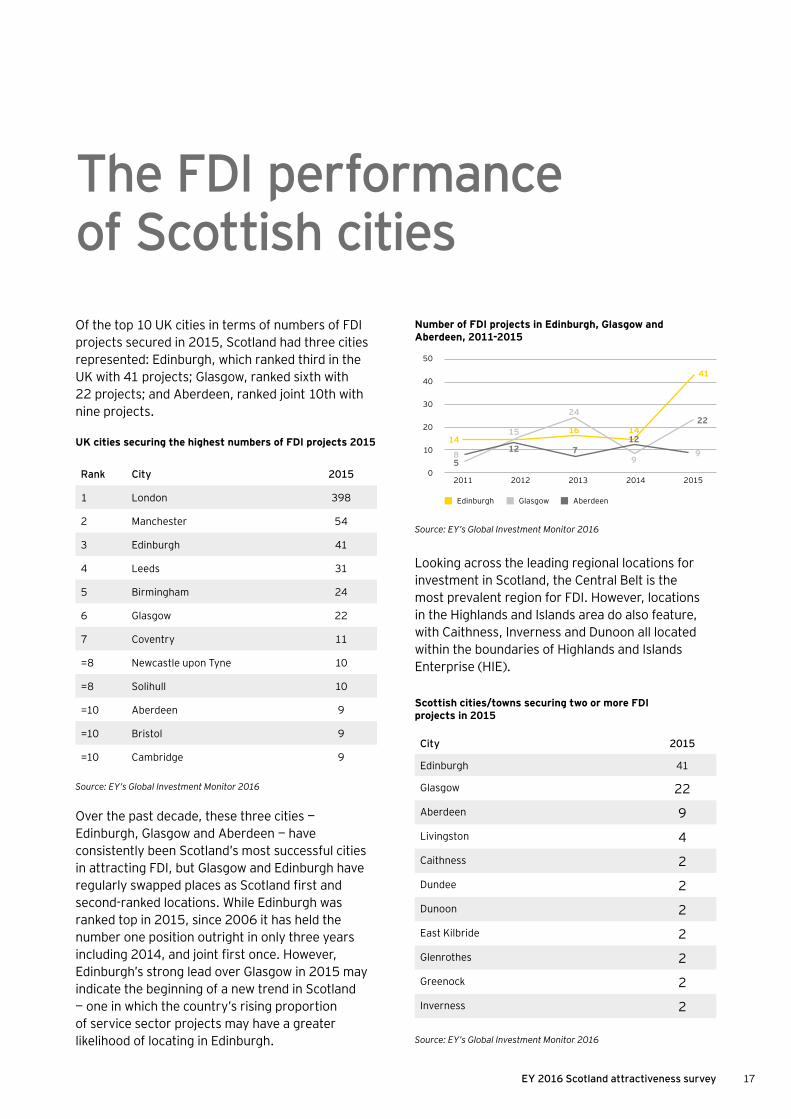
The FDI performance of Scottish citiesOf the top 10 UK cities in terms of numbers of FDI projects secured in 2015, Scotland had three cities represented: Edinburgh, which ranked third in the UK with 41 projects; Glasgow, ranked sixth with 22 projects; and Aberdeen, ranked joint 10th with nine projects.
Over the past decade, these three cities — Edinburgh, Glasgow and Aberdeen — have consistently been Scotland’s most successful cities in attracting FDI, but Glasgow and Edinburgh have regularly swapped places as Scotland first and second-ranked locations. While Edinburgh was ranked top in 2015, since 2006 it has held the number one position outright in only three years including 2014, and joint first once. However, Edinburgh’s strong lead over Glasgow in 2015 may indicate the beginning of a new trend in Scotland — one in which the country’s rising proportion of service sector projects may have a greater likelihood of locating in Edinburgh.
Looking across the leading regional locations for investment in Scotland, the Central Belt is the most prevalent region for FDI. However, locations in the Highlands and Islands area do also feature, with Caithness, Inverness and Dunoon all located within the boundaries of Highlands and Islands Enterprise (HIE).
City 2015
Edinburgh 41
Glasgow 22
Aberdeen 9
Livingston 4
Caithness 2
Dundee 2
Dunoon 2
East Kilbride 2
Glenrothes 2
Greenock 2
Inverness 2
Scottish cities/towns securing two or more FDI projects in 2015
Number of FDI projects in Edinburgh, Glasgow and Aberdeen, 2011-2015
Rank City 2015
1 London 398
2 Manchester 54
3 Edinburgh 41
4 Leeds 31
5 Birmingham 24
6 Glasgow 22
7 Coventry 11
=8 Newcastle upon Tyne 10
=8 Solihull 10
=10 Aberdeen 9
=10 Bristol 9
=10 Cambridge 9
UK cities securing the highest numbers of FDI projects 2015
Source: EY’s Global Investment Monitor 2016
Source: EY’s Global Investment Monitor 2016
Source: EY’s Global Investment Monitor 2016
Edinburgh Glasgow Aberdeen
1414
41
16
8 99
24
15
5712
2011 2012 2013 2014 2015
50
40
30
20
10
0
12
22
17EY 2016 Scotland attractiveness survey
Spotlight on Edinburgh and Glasgow
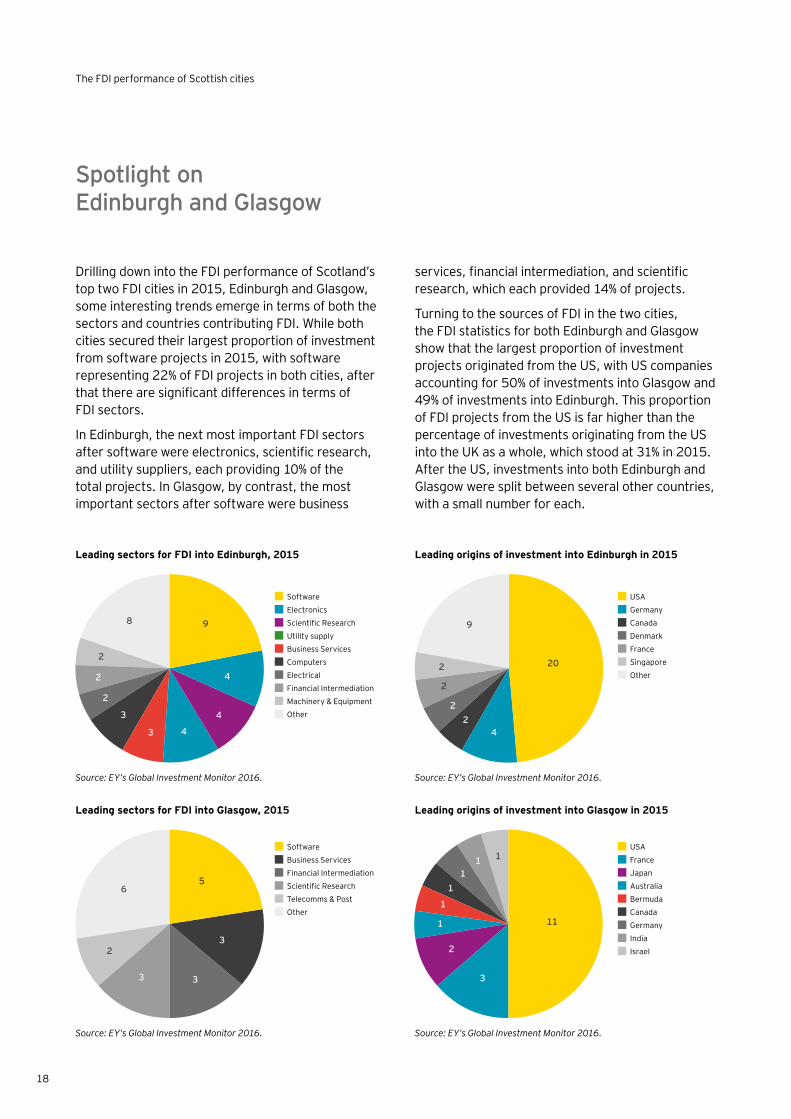
Drilling down into the FDI performance of Scotland’s top two FDI cities in 2015, Edinburgh and Glasgow, some interesting trends emerge in terms of both the sectors and countries contributing FDI. While both cities secured their largest proportion of investment from software projects in 2015, with software representing 22% of FDI projects in both cities, after that there are significant differences in terms of FDI sectors.
In Edinburgh, the next most important FDI sectors after software were electronics, scientific research, and utility suppliers, each providing 10% of the total projects. In Glasgow, by contrast, the most important sectors after software were business
services, financial intermediation, and scientific research, which each provided 14% of projects.
Turning to the sources of FDI in the two cities, the FDI statistics for both Edinburgh and Glasgow show that the largest proportion of investment projects originated from the US, with US companies accounting for 50% of investments into Glasgow and 49% of investments into Edinburgh. This proportion of FDI projects from the US is far higher than the percentage of investments originating from the US into the UK as a whole, which stood at 31% in 2015. After the US, investments into both Edinburgh and Glasgow were split between several other countries, with a small number for each.
Leading sectors for FDI into Edinburgh, 2015 Leading origins of investment into Edinburgh in 2015
Leading sectors for FDI into Glasgow, 2015 Leading origins of investment into Glasgow in 2015
Source: EY’s Global Investment Monitor 2016. Source: EY’s Global Investment Monitor 2016.
Source: EY’s Global Investment Monitor 2016. Source: EY’s Global Investment Monitor 2016.
Software
Electronics
Scientific Research
Utility supply
Business Services
Computers
Electrical
Financial Intermediation
Machinery & Equipment
Other
USA
Germany
Canada
Denmark
France
Singapore
Other
USA
France
Japan
Australia
Bermuda
Canada
Germany
India
Israel
Software
Business Services
Financial Intermediation
Scientific Research
Telecomms & Post
Other
9
5
20
11
4
3
2
1
1
11
1 1
22
2
2
9
3
33
2
6
4
4
43
3
2
2
2
8
18
The FDI performance of Scottish cities
The EU referendum may be influencing investor views of the UK’s future attractiveness …
Since our survey in 2015, the UK Government has decided to hold a referendum on the UK’s membership of the European Union (EU). Some 78% of all respondents to our perception survey were aware of the upcoming referendum on the UK’s membership of the EU when asked in early 2016, compared to only 55% of investors who were aware of the possibility in 2015.
Access to the European Single Market (ESM) has consistently been identified by as an important element of the UK’s overall attractiveness by foreign investors in our surveys since 2014. In 2016, 79% of investors cited access to the ESM as a key feature of the UK’s attractiveness, up from 72% last year and 63% the year before. It is possible therefore that a decision by the UK to leave the EU could, if it changes the terms of access to the ESM for UK based businesses, potentially impact the UK’s future FDI performance. Depending on the nature of the change, the impact could be in either a positive or negative direction.
When asked about how either a significant or substantial decline in the terms of access to the ESM would impact the UK’s attractiveness over 50% of investors in both cases said it would have a negative effect whereas only 7% viewed it positively. It seems clear therefore that a risk of change in the terms of access to the ESM is a significant concern for investors. Interestingly, the degree of change is less important, any reduction in the terms of access currently enjoyed has a significant negative impact on perceptions of the UK’s attractiveness for FDI, which suggest this is a very important issue for the majority of investors.
… and this seems to be feeding through into lower investor perceptions of future attractiveness.
The scale of change in future perceptions of the UK goes beyond what we would expect from the decline in the UK’s score on its key attributes. As the UK’s ranking has fallen in relative as well as absolute terms, there appears to be a UK specific effect related in part at least to the upcoming EU referendum. It seems reasonable to conclude that, without any future actions taken by the UK Government to mitigate any adverse effects of the UK leaving the EU, a poorer level of access to the ESM would reduce UK FDI in future. There may be scope for increased FDI from investors attracted by changes to the UK investment regime but the UK’s relatively high attractiveness ranking on most attributes suggests the scope for additional stimulation of FDI may be limited.
Action needs to be taken now to secure the UK’s leadership position.
Whatever the outcome of the EU referendum vote, our analysis has identified a number of areas for action to strengthen the UK’s attractiveness as a destination for FDI. Our recommendations are set out on the next page. In line with official UK Government policy, we have assumed that the UK will vote to remain in the EU on June 23rd. Should the UK vote to leave, we would expect to prepare updated recommendations once the implications of the change in the status become clearer.
Investor views of the EU referendum
19EY 2016 Scotland attractiveness survey
ConclusionOur research and analysis demonstrates in no uncertain terms that Scotland is a commanding economic force within the UK and beyond.
However, it is important that Scotland builds on the exceptional FDI performance showcased in this report. The nation should not expect to continue to achieve similar results into the future without determined efforts to keep improving its attractiveness to inward investors and secure more FDI.
Given the right actions, there are sound reasons for believing this can be achieved. Already, a significant rise in FDI projects in regions across the UK has been accomplished with less than 40% of investors around the world being aware of the UK’s devolution agenda. With increased knowledge of the opportunities on offer in the UK’s regions, Scotland is superbly placed to boost its performance further.
A closer analysis of Scotland’s mix of FDI in 2015 reveals further grounds for optimism – while also highlighting areas where more can be done. In terms of sectors, Scotland’s sparkling performance in attracting software projects and business services bodes well for the economy and skills base. But the drop in manufacturing projects — admittedly following a very strong 2014 — suggests Scotland maybe losing out to the revitalised Northern Powerhouse in this area, and suggests a fresh look may be needed at how to redress the competitive balance.
Equally positive for Scotland’s skills base is its impressive showing in R&D projects. However, its relative underperformance in attracting Headquarters investments indicates that Scotland might benefit from renewing its offer for these projects.
And in terms of the countries contributing to FDI, Scotland has some proven strengths in attracting projects from territories such as the US, Canada and continental Europe. But the country needs to build on this base by continuing to promote its advantages as an FDI location with investors from the newer and emerging FDI sources such as China and India.
Turning to actions to take, investments in transport infrastructure and skills development will clearly be key to Scotland’s marketability for FDI — and we are already seeing a return on these. At least in part, Scotland’s strong performance appears to reflect the strength of its universities and their growing collaboration with business, providing a foretaste of the substantial benefits a concerted skills “rebalancing” programme could create.
As Scotland looks at how to sustain the outstanding results reported in this study, it’s important to bear in mind that the increased importance of regional economies is not unique to the UK, but is happening across Europe — and brings more competition for Scotland and other UK regions. So, while we’ve had a great year for FDI, now is not the time for Scotland to rest on its laurels.
20
Methodology
* Investment projects by companies in these categories are included in certain instances e.g. details of a specific new hotel investment or retail outlet would not be recorded, but if the hotel or retail company were to establish a headquarters facility or a distribution centre, this project would qualify for inclusion in the database.
The “real” attractiveness of Europe for foreign investors
Our evaluation of the reality of FDI in Europe is based on EY Global Investment Monitor (GIM). This database tracks those FDI projects that have resulted in the creation of new facilities and new jobs. By excluding portfolio investments and M&A, it shows the reality of investment in manufacturing and services by foreign companies across the continent.
Data is widely available on FDI. An investment in a company is normally included in FDI data if the foreign investor acquires more than 10% of the company’s equity and takes a role in its management. FDI includes equity capital, reinvested earnings and intracompany loans.
But our figures also include investments in physical assets, such as plant and equipment. And this data provides valuable insights into:
• How FDI projects are being undertaken
• What activities are being invested in
• Where projects are located
• Who is carrying out these projects
The GIM is a leading online information provider, tracking inward investment across Europe. This flagship business information tool from EY is the most detailed source of data on cross-border investment projects and trends throughout Europe. The GIM is frequently used by government bodies, private sector organizations and corporations looking to identify significant trends in employment, industry, business and investment.
The GIM database focuses on investment announcements, the number of new jobs created and, where identifiable, the associated capital investment. Projects are identified through the daily monitoring of more than 10,000 news sources. To confirm the accuracy of the data collected, the research team aims to directly contact more than 70% of the companies undertaking these investments.
The following categories of investment projects are excluded from GIM:
• M&A and joint ventures (unless these result in new facilities or new jobs being created)
• License agreements
• Retail and leisure facilities, hotels and real estate*
• Utilities (including telecommunications networks, airports, ports and other fixed infrastructure)*
• Extraction activities (ores, minerals and fuels)*
• Portfolio investments (pensions, insurance and financial funds)
• Factory and other production replacement investments (e.g., replacing old machinery without creating new employment)
• Not-for-profit organizations (charitable foundations, trade associations and government bodies)
The “perceived” attractiveness of Europe and its competitors for foreign investors We define the attractiveness of a country or area as the combination of its image, investors’ level of confidence in it as an investment destination and the perception of its ability to provide the most competitive benefits for FDI.
The research was conducted by the CSA Institute from February to April 2016, via telephone interviews with a representative group of 1,469 international decision-makers.
Our sample group included representatives from:
• European businesses — 48%
• North American businesses — 33%
• Asian businesses — 15%
• South American businesses — 1%
• Middle Eastern businesses — 1%
• Businesses from other regions — 2%
Overall, 65% of the 1,469 companies surveyed have a presence in Europe. And of the non-European companies, 30% have established operations in Europe.
21EY 2016 Scotland attractiveness survey

About EYEY is a global leader in assurance, tax, transaction and advisory services. The insights and quality services we deliver help build trust and confidence in the capital markets and in economies the world over. We develop outstanding leaders who team to deliver on our promises to all of our stakeholders. In so doing, we play a critical role in building a better working world for our people, for our clients and for our communities.
EY refers to the global organization, and may refer to one or more, of the member firms of Ernst & Young Global Limited, each of which is a separate legal entity. Ernst & Young Global Limited, a UK company limited by guarantee, does not provide services to clients. For more information about our organization, please visit ey.com.
Ernst & Young LLPThe UK firm Ernst & Young LLP is a limited liability partnership registered in England and Wales with registered number OC300001 and is a member firm of Ernst & Young Global Limited.
Ernst & Young LLP, 1 More London Place, London, SE1 2AF.
© 2016 Ernst & Young LLP. Published in the UK. All Rights Reserved.
ED None
In line with EY’s commitment to minimise its impact on the environment, this document has been printed on paper with a high recycled content.
Information in this publication is intended to provide only a general outline of the subjects covered. It should neither be regarded as comprehensive nor sufficient for making decisions, nor should it be used in place of professional advice. Ernst & Young LLP accepts no responsibility for any loss arising from any action taken or not taken by anyone using this material.
ey.com/uk
EY | Assurance | Tax | Transactions | Advisory
Recommended