Exploring Ligand Structure and Thermodynamics of the
Malachite Green RNA Aptamer
by
Jason Bernard Da Costa
A thesis
presented to the University of Waterloo
in fulfillment of the
thesis requirement for the degree of
Doctor of Philosophy
in
Chemistry
Waterloo, Ontario, Canada, 2012
© Jason Bernard Da Costa 2012

ii
Author’s Declaration
I hereby declare that I am the sole author of this thesis. This is a true copy of the thesis, including any
required final revisions, as accepted by my examiners.
I understand that my thesis may be made electronically available to the public.

iii
Abstract
RNA aptamers are in vitro sequences of RNA that have a high affinity for their target ligand.
They have applications in therapeutics, biosensors and molecular machines. While the practical
applications of aptamers are increasing, it is important to study their structure and thermodynamics to
improve the understanding of these molecular tools. The malachite green aptamer (MGA) provides a
model system to study the interactions between aptamer and ligand that do not involve hydrogen
bonding between ligand and receptor. While the original application of this aptamer was abandoned,
study of the MGA binding pocket revealed an electronegative environment that was harnessed for
catalysis. MGA binding also supported the notion that aptamers bind by adaptive binding. Adaptive
binding is the ability of molecules to mold themselves around the structure of a ligand thereby
incorporating it into their three-dimensional fold.
To further expand our understanding of MGA binding and to clarify conflicting reports of
affinities, we conducted isothermal calorimetry binding studies. The results reveal that the entropy of
complex formation plays a large role in determining binding affinity and ligand specificity. This data
combined with previous structural studies show that metal ions are required to stabilize the complexes
with non-native ligands, whereas, the complex with the original selection target is stable at low salt
and in the absence of divalent metal ions. Next, competitive binding studies using isothermal titration
calorimetry were conducted with the aim of understanding the adaptive nature of RNA. The results of
these studies reveal that there are limits to the adaptability of the aptamer. Binding of one type of
ligand reduces the affinity of the aptamer pocket to a differently shaped ligand, even if this second
ligand has a significantly higher affinity.
The ability of MGA to change ligand preference based on buffer conditions, and the previously
reported catalysis suggested that RNA may have a potential supporting multiple functions in the same
molecule. To investigate this possibility we attempted to select an aptamer that supports both ligand
binding and catalysis. By conducting both a DNA and RNA selection we hoped to add to the

iv
collection of DNA and RNA aptamers selected for the same target. There are currently too few of
these to determine if any correlation can be made between DNA and RNA sequences that bind the
same target. The target of the selection was fluorescein diacetate (FDA), which was chosen with the
aim that it would allow the exploration of the inherent potential of the selected aptamer to cleave FDA
to fluorescein. The RNA selection proved to be more successful and an attempt was made to
characterize the binding of the aptamer to its target fluorescein diacetate. Unfortunately there were
complications with the binding assays, but future work is proposed that should address the issues.
In order to expand the MGA catalytic repertoire attempts were made to synthesize new ligands
that could exploit the catalytic potential of the MGA binding pocket. Unfortunately these attempts
were unsuccessful, however further attempts are recommended. The MGA used in this study was
transcribed in vitro using T7 RNA polymerase. This process is known to add extra nucleotides to the
end of the transcription product. Attempts were made to eliminate the n+1 product by introducing a
ribozyme or DNAzyme. These were met with difficulties resulting in low yield, however mass
spectrometry revealed that n and n+1 MGA bind to ligand. This, along with secondary structure
prediction suggests that MGA n+1 behaves the same as n.
Overall, the results presented here provide insights into the capabilities of RNA aptamers with
respect to ligand binding and catalysis.

v
Acknowledgements
I would like to thank my supervisor, Dr. Thorsten Dieckmann, for his continued support and
encouragement, as well as the opportunity to work on this research project. I would like to thank my
committee members; Dr. John Honek , Dr. J. Guy Guillemette, and Dr. Richard Manderville for their
time, support and advice. I would like to thank Dr. Richard Smith and Jannet Venne for their
assistance with mass spectrometry and NMR spectroscopy. I would also like to thank Dr. Elaine
Collins for her work preparing the aptamer template plasmids. For assistance in daily lab activities I
would like to thank past and present members of my lab; in particular Jenna Collier, Marie Claire
Lacassin, Cveta Manassieve, Jeffrey Lai and Mike Piazza. I would also like to thank the University of
Waterloo, the Chemistry department administrative staff, the chemistry graduate student community
(all graduate students in biochemistry especially). Lastly but definitely not the least I would like to
thank my family for their support and love, without which none of this would be possible. Thank you.

vi
Dedication
To my family,
Victor, Bula, Gary, Carol

vii
Table of Contents
Author’s Declaration II
Abstract III
Acknowledgements V
Dedication VI
List of Figures X
List of Tables
XII
List of Abbreviations XIII
Chapter 1: Structure and Thermodynamics of Drug-RNA Aptamer Interactions
1
1. Introduction 1
RNA involved in translation 1
RNA involved in regulation 2
2. RNA in therapeutics 3
Targeting RNA with Drugs 3
RNA as a drug 4
3. Large biomolecule RNA aptamers interactions 5
HIV Rev peptide 5
HIV Tat 5
TAR-HIV RNA 6
MS2 coat protein 7
RNA polymerase 7
Initiation factors 8
Prion protein 9
Human immunoglobulin G 9
4. Drug/Small molecule RNA aptamers interactions 10
Neomycin 10
Tetracycline 12
Tobramycin and streptomycin 12
Purine 13
S-Adenosyl methionine 14
5. Thermodynamic parameters 15
6. Conclusions 17
7. Research Outline 19

viii
Chapter 2: Structure and Thermodynamics in the Malachite Green RNA Aptamer
21
1. Introduction 21
2. Results 25
Initial binding experiments 25
Isothermal titration calorimetry experiments 28
3. Discussion 29
Entropy driven binding 29
Metal ions control specificity 31
Comparison to previously reported affinities 33
Electrostatic contributions 34
Enthalpy-Entropy compensation 35
4. Conclusion 35
5. Materials and Methods 38
Ligand preparation 38
Synthesis of RNA 38
Isothermal titration calorimetry studies 39
NMR spectroscopy 39
Fluorescence binding studies 40
Equilibrium dialysis experiments 40
Chapter 3: Further Exploration of the Malachite Green RNA Aptamer Binding Pocket
42
1. Introduction 42
2. Results and Discussion 45
Charactertization of free RNA by NMR spectroscopy 45
Competitive isothermal titration calorimetry experiments 48
Computational investigation 51
3. Conclusion and Future Work 53
4. Materials and Methods 55
RNA preparation 55
ITC studies 55
NMR experiments 56
Computational experiments 57
Chapter 4: Selection of a Fluorescein Binding Aptamer 58
1. Introduction 58
SELEX 58
RNA versus DNA aptamers 59
Fluorescein as target 62
2. Results 65
Aptamer selection 65
RNA binding experiments 69
3. Discussion 71
Aptamer selection 71
RNA binding experiments 71

ix
4. Conclusions and Future Work 72
5. Materials and Methods 73
DNA selection 73
Colony PCR 75
Binding tests 75
Chapter 5: Reconstructing MGA Template and Ligand to Improve Catalytic Activity
77
1. Introduction 77
Ribozymes 80
DNAzyme 80
Catalytic aptamers 81
2. Results and Discussion 81
MGA template modification 81
Changes in ligand 85
3. Conclusion and Future Work 88
4. Thesis Conclusions 88
5. Materials and Methods 88
HH and HDV MGA DNA template preparation 88
Ribozyme cleavage reaction 89
DNAzyme cleavage reaction 89
RNA mass spectrometry procedure 90
Dye reactions 90
References 92
1. Chapter 1 92
2. Chapter 2 99
3. Chapter 3 102
4. Chapter 4 104
5. Chapter 5 107
Appendix 112
x
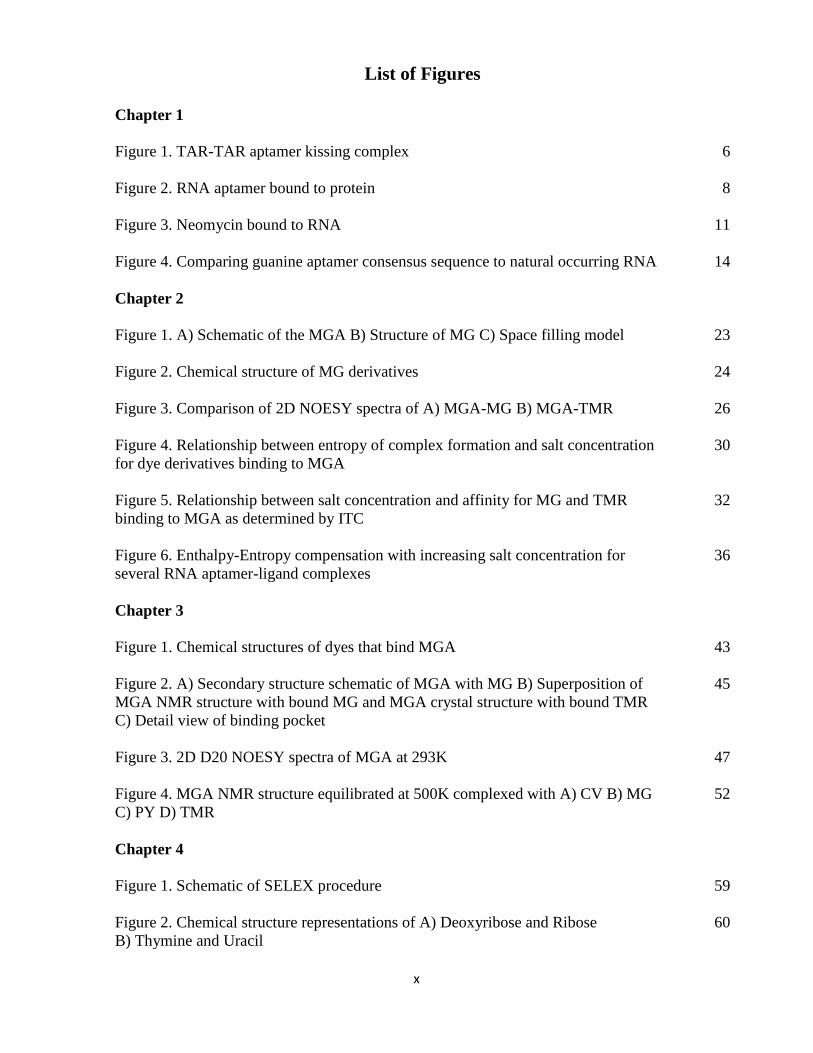
List of Figures
Chapter 1
Figure 1. TAR-TAR aptamer kissing complex
6
Figure 2. RNA aptamer bound to protein
8
Figure 3. Neomycin bound to RNA
11
Figure 4. Comparing guanine aptamer consensus sequence to natural occurring RNA
14
Chapter 2
Figure 1. A) Schematic of the MGA B) Structure of MG C) Space filling model
23
Figure 2. Chemical structure of MG derivatives
24
Figure 3. Comparison of 2D NOESY spectra of A) MGA-MG B) MGA-TMR
26
Figure 4. Relationship between entropy of complex formation and salt concentration
for dye derivatives binding to MGA
30
Figure 5. Relationship between salt concentration and affinity for MG and TMR
binding to MGA as determined by ITC
32
Figure 6. Enthalpy-Entropy compensation with increasing salt concentration for
several RNA aptamer-ligand complexes
36
Chapter 3
Figure 1. Chemical structures of dyes that bind MGA
43
Figure 2. A) Secondary structure schematic of MGA with MG B) Superposition of
MGA NMR structure with bound MG and MGA crystal structure with bound TMR
C) Detail view of binding pocket
45
Figure 3. 2D D20 NOESY spectra of MGA at 293K
47
Figure 4. MGA NMR structure equilibrated at 500K complexed with A) CV B) MG
C) PY D) TMR
52
Chapter 4
Figure 1. Schematic of SELEX procedure
59
Figure 2. Chemical structure representations of A) Deoxyribose and Ribose
B) Thymine and Uracil
60
xi
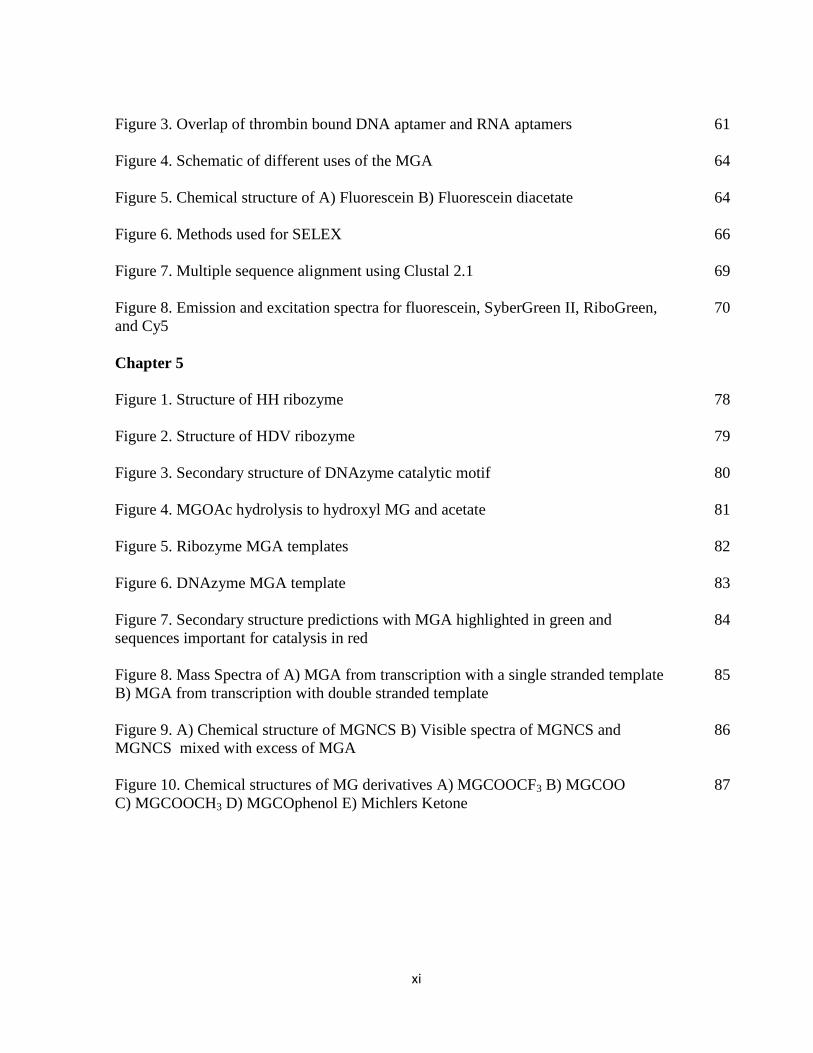
Figure 3. Overlap of thrombin bound DNA aptamer and RNA aptamers
61
Figure 4. Schematic of different uses of the MGA
64
Figure 5. Chemical structure of A) Fluorescein B) Fluorescein diacetate
64
Figure 6. Methods used for SELEX
66
Figure 7. Multiple sequence alignment using Clustal 2.1
69
Figure 8. Emission and excitation spectra for fluorescein, SyberGreen II, RiboGreen,
and Cy5
70
Chapter 5
Figure 1. Structure of HH ribozyme
78
Figure 2. Structure of HDV ribozyme
79
Figure 3. Secondary structure of DNAzyme catalytic motif
80
Figure 4. MGOAc hydrolysis to hydroxyl MG and acetate
81
Figure 5. Ribozyme MGA templates
82
Figure 6. DNAzyme MGA template
83
Figure 7. Secondary structure predictions with MGA highlighted in green and
sequences important for catalysis in red
84
Figure 8. Mass Spectra of A) MGA from transcription with a single stranded template
B) MGA from transcription with double stranded template
85
Figure 9. A) Chemical structure of MGNCS B) Visible spectra of MGNCS and
MGNCS mixed with excess of MGA
86
Figure 10. Chemical structures of MG derivatives A) MGCOOCF3 B) MGCOO
C) MGCOOCH3 D) MGCOphenol E) Michlers Ketone
87
xii
List of Tables
Chapter 1
Table 1: Summary of RNA binding thermodynamic data
16
Chapter 2
Table 1: ITC determined thermodynamic parameters for MG, TMR, PY and CV
at various salt concentrations, pH 6.7 at 25oC
29
Chapter 3
Table 1: ITC determined thermodynamic parameters for MG and TMR binding
MGAPY or MGACV complexes at different salt concentrations, pH 6.7 at 25oC
48
Table 2: Ratio of binding values obtained directly over binding values from
competition experiment
49

xiii
List of Abbreviations
CV : crystal violet
DIS : dimerization initiation site
DNA : Deoxyribonucleic acid
FDA : fluorescein diacetate
HDV MGA : HDV ribozyme appended to MGA
HDV: hepatitis delta virus
HH MGA : HH ribozyme appended to MGA
HH: hammer head
HIV : human immunodeficiency virus
IgG : immunoglobulin G
ITC : isothermal titration calorimetry
Kd : dissociation constant
lncRNA : long non-coding RNA
MG : malachite green
MGA : malachite green aptamer
MGACV: MGA pre-bound to CV
MGAMG: MGA pre-bound to MG
MGApre: MGA pre-bound to either PY or CV
MGAPY: MGA pre-bound to PY
MGATMR: MGA pre-bound to TMR
MGNCS : malachite green isothiocyanate
miRNA : micro RNA
mRNA : messenger RNA
ncRNA : non coding RNA

xiv
NMR : nuclear magnetic resonance
PCR : polymerase chain reaction
PEG : polyethylene glycol
piRNA : piwi interacting RNA
PY: pyronin Y
REV : regulator of virion expression
RNA : Ribonucleic acid
rRNA : ribosomal RNA
SELEX : Systematic evolution of ligands by exponential enrichment
siRNA : small interfering RNA
snoRNA : small nucleolar RNA
TAR :trans-activation reponse element
Tat : trans activator of transcription
TMR : tetramethylrosamine
tRNA : transfer RNA
VEGF : vascular endothelial growth factor
X-Gal : bromo-chloro-indolyl-galactopyranoside
ΔG : free energy change
ΔH : enthalpy change
ΔS : entropy change
1
Chapter 1: Structure and Thermodynamics of Drug-RNA Aptamer Interactions
1. Introduction
Ribonucleic acid (RNA) participates in many cellular processes including protein
translation, signalling, and regulation (Bartel 2007, Beringer 2008). The first function of RNA
identified was the transfer of information from deoxyribonucleic acid (DNA) to proteins. The
RNA was termed messenger RNA or mRNA (Brenner, Meselson and Jacob 1961). In this
model DNA is responsible for information storage and proteins are responsible for catalytic
function (Crick 1958, Crick et al. 1961). The discovery that RNA was capable of catalyzing
RNA cleavage changed the perception of RNA’s function (Guerrier-Takada et al. 1983, Cech,
Zaug and Grabowski 1981). RNA sequences that are capable of catalytic activity are called
ribozymes. This discovery led to the proposal of the RNA world hypothesis which suggests
that early life went through a stage where RNA was responsible for information storage and
catalytic function (Gilbert 1986).
RNA involved in translation
The discovery of mRNA was followed by the identification of ribosomal RNA or
rRNA (Kay 1968) and transfer RNA or tRNA (Morris and Demoss 1965). rRNA interacts
with specific proteins to form the ribosome (Tso 1962). The ribosome is responsible for
translation of mRNA code to protein sequence, it achieves this through interactions with
tRNA and mRNA (Salas et al. 1967). tRNA assists the transcription of codons by acting as a
translator (Bock, Soll and Cherayil 1967). The ribosome brings together mRNA, based on
complementary interaction of mRNA and tRNA codons (Harvey Lodish 2000). Then rRNA
catalyzes a peptidyl transferase reaction to elongate amino acid chain forming proteins
(Nissen et al. 2000). The discovery that the RNA component of the ribosome that is

2
responsible for this catalysis supports the idea of an RNA world. This function of RNA
showed that large proteins required RNA to be synthesized and were possible after RNA
developed this ability (Cech 2009).
RNA involved in regulation
In the past 50 years more classes of RNA have been identified; these include small
interfering RNA or siRNA (Hamilton and Baulcombe 1999), micro RNA or miRNA (Bartel
2007), small nucleolar RNA or snoRNA (Ganot, Caizergues-Ferrer and Kiss 1997), piwi
interacting RNA or piRNA (Grivna et al. 2006), long non-coding RNA or lncRNA (Ben
Amor et al. 2009) and riboswitches (Winkler, Cohen-Chalamish and Breaker 2002). RNA has
also been observed recently to function as an extracellular signalling molecule (Dinger,
Mercer and Mattick 2008). These RNA function in conjunction with protein molecules to
achieve gene regulation, each of the different RNA are described in more detail below.
siRNA and miRNA are short sequences of RNA that by Watson Crick base pairing
form double stranded strands with target RNA. These double stranded RNA are targeted by
cellular degradation mechanisms (Hannon and Rossi 2004). The difference between siRNA
and miRNA lies in the role they play, siRNA are largely regarded as defense against
exogenous RNA while miRNA is responsible for regulation of endogenous genes (Carthew
and Sontheimer 2009). snoRNA identifies RNA for modification and guides protein to
modification site. These modifications, including methylation and pseudouridylation, are
important for proper folding in rRNA and tRNA (Balakin, Smith and Fournier 1996). piRNA
are a testis specific class of RNA.
They participate in gene silencing similar to miRNA and siRNA, and have been found to
target sequences that are prone to relocating themselves within the genome also known as

3
transposons (Wahid et al. 2009). With the exception of mRNA the above mentioned RNA are
non-coding RNA (ncRNA), meaning that they have function other than providing the code for
translation. Long ncRNA are ncRNA that are longer than 200 nucleotides. lncRNA can be
processed to make siRNA or miRNA but are also functional as regulators in long form (Ben
Amor et al. 2009). Riboswitches are sequences of RNA that bind to a specific small molecule,
the binding event causes a change in structure that regulates transcription of a neighbouring
gene (Winkler, Nahvi and Breaker 2002).
2. RNA in therapeutics
The roles RNA plays in cells make it an appealing target for molecular therapeutic and
diagnostic applications. RNA also makes for a potential drug molecule due to the variety of
molecules it can bind. Using systematic evolution of ligands by exponential enrichment
(SELEX) (Ellington and Szostak 1990, Tuerk and Gold 1990) it is possible to select for an
RNA that targets a specific molecule. RNA sequences identified by SELEX to have a high
affinity for a target are referred to as aptamers (Ellington and Szostak 1990).
An overview of two approaches to utilizing the properties of RNA including targeting
RNA with a drug and using RNA itself as a drug will be provided. This is followed by a
review of RNA aptamer : protein/RNA interactions and RNA aptamer : small molecule
interactions that have medical implications.
Targeting RNA with Drugs
Types of RNA that have been targeted using small molecule drugs include rRNA,
tRNA and mRNA (Thomas and Hergenrother 2008). Of the mentioned RNA targets only
rRNA is targeted directly, the other two involve indirect effects. Targeting tRNA involves
inhibition of aminoacyl-tRNA synthetases, which are responsible for attaching amino acids to
4
cognate tRNA (Jarvest et al. 2002). While targeting mRNA involves using naturally occurring
riboswitch regulation by providing ligand mimics to regulate mRNA (Blount and Breaker
2006).
rRNA has long been a target for antibiotic drugs (Fourmy, Recht and Puglisi 1998),
however as more is learned about rRNA function more specific drugs are being developed.
For example significant progress has been made in targeting rRNA to reduce the incidence of
nonsense mutations that are associated with the Duchenne muscular dystrophy phenotype.
There are currently multiple drugs in phase I and II clinical trials (Muntoni and Wood 2011)
pertaining to this neuromuscular disorder. PTC124 is currently being tested in phase III trials.
It is a small molecule which binds to the 60S ribosome and allows for selective translational
bypass of nonsense mutations (Wilton 2007). These nonsense mutations are responsible for
build-up of incorrectly translated protein that leads to disease conditions (Welch et al. 2007).
RNA as a drug
Currently there are several aptamers in phase I and II clinical trials (Bouchard,
Hutabarat and Thompson 2010). These include aptamers for treatment of coronary artery
bypass (Dyke et al. 2006), macular degeneration (Ng et al. 2006) and acute myeologenous
leukemia (Bates et al. 2009). Macugen is an aptamer based drug that targets vascular
endothelial growth factor (VEGF) currently available for treatment of macular degeneration
(Deissler and Lang 2008). This aptamer is conjugated to a polyethylene glycol (PEG) to
increase its lifetime in vivo. PEG increases the lifetime of biomolecules in vivo by changing
the biomolecules hydrophobicity and electrostatic binding properties (Veronese and Mero
2008). PEGylation turns the main disadvantages of RNA drugs, the low lifetime due to

5
degradation, into advantage by allowing tailoring of the lifetime of the drug based on size of
PEG (Bouchard et al. 2010).
3. Large biomolecule RNA aptamer interactions
Many efforts have been directed at developing aptamers that target the human
immunodeficiency virus or HIV by specifically targeting the HIV regulator of virion
expression (Rev) peptide, trans-activation response element (TAR) HIV RNA or HIV trans
activator of transcription (Tat) peptide (Lebars et al. 2008, Matsugami et al. 2003, Ye et al.
1999).
HIV Rev peptide
The HIV Rev peptide binds to the envelope gene, specifically to the Rev response
element. It is responsible for transporting mRNA that encodes viral proteins to the cytoplasm
(Zapp et al. 1991, Tiley et al. 1992, Heaphy et al. 1991). The study of the structures of HIV
rev peptide in complex with RNA aptamers demonstrates how RNA can influence the
structure of its ligand. Depending on the RNA sequence, the peptide binds in either an α-
helical or elongated form (Ye et al. 1999). This knowledge is important if the peptide RNA
complex is to be targeted.
HIV Tat
The HIV Tat peptide binds to TAR HIV RNA and is necessary for transcription
initiation, an important part of the viral life cycle (Frankel 1992). The HIV Tat aptamer
complex was studied by using the simplest analog of Tat, an argininamide molecule
(Matsugami et al. 2003). Argininamide was used as an analog of Tat since the peptide is an
arginine rich peptide and an arginine was implicated in binding to the TAR region (Tao and
Frankel 1992). This revealed the aptamer was binding two argininamide molecules suggesting
6
that it interacts with two arginine residues on the peptide (Matsugami et al. 2003). Inhibition
of binding of Tat to TAR was observed when Tat is captured by the aptamer (Yamamoto et al.
2000).
TAR-HIV RNA
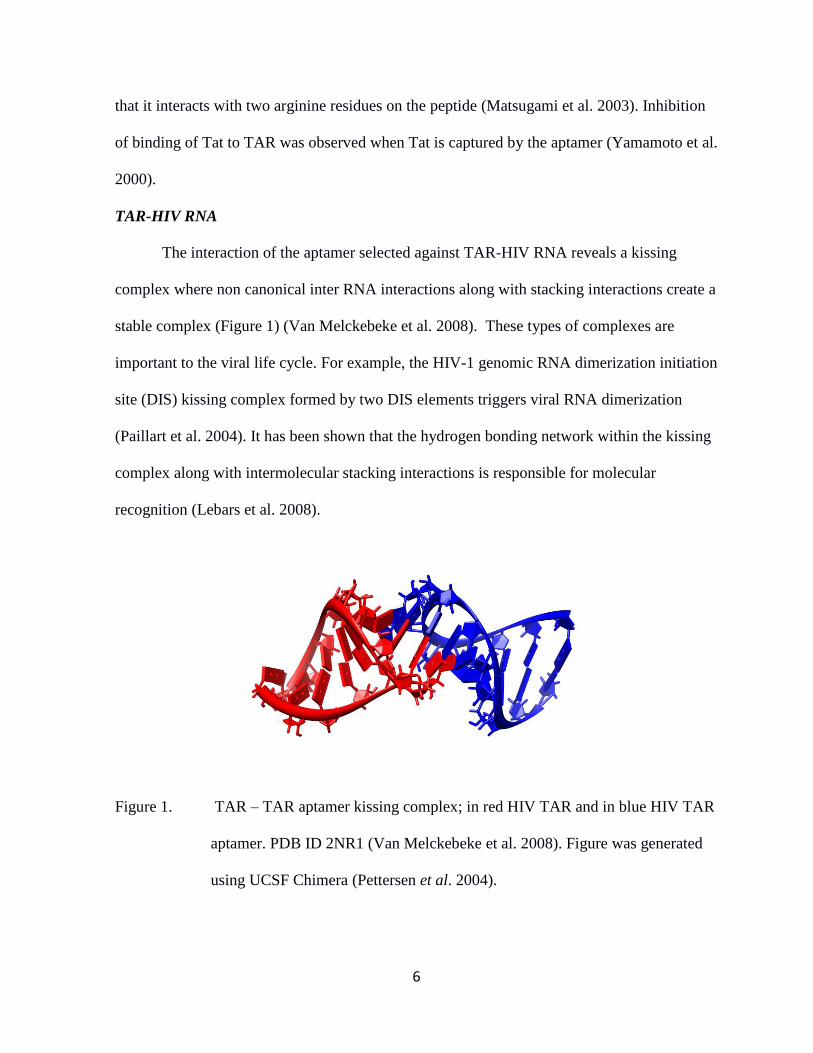
The interaction of the aptamer selected against TAR-HIV RNA reveals a kissing
complex where non canonical inter RNA interactions along with stacking interactions create a
stable complex (Figure 1) (Van Melckebeke et al. 2008). These types of complexes are
important to the viral life cycle. For example, the HIV-1 genomic RNA dimerization initiation
site (DIS) kissing complex formed by two DIS elements triggers viral RNA dimerization
(Paillart et al. 2004). It has been shown that the hydrogen bonding network within the kissing
complex along with intermolecular stacking interactions is responsible for molecular
recognition (Lebars et al. 2008).
Figure 1. TAR – TAR aptamer kissing complex; in red HIV TAR and in blue HIV TAR
aptamer. PDB ID 2NR1 (Van Melckebeke et al. 2008). Figure was generated
using UCSF Chimera (Pettersen et al. 2004).
7
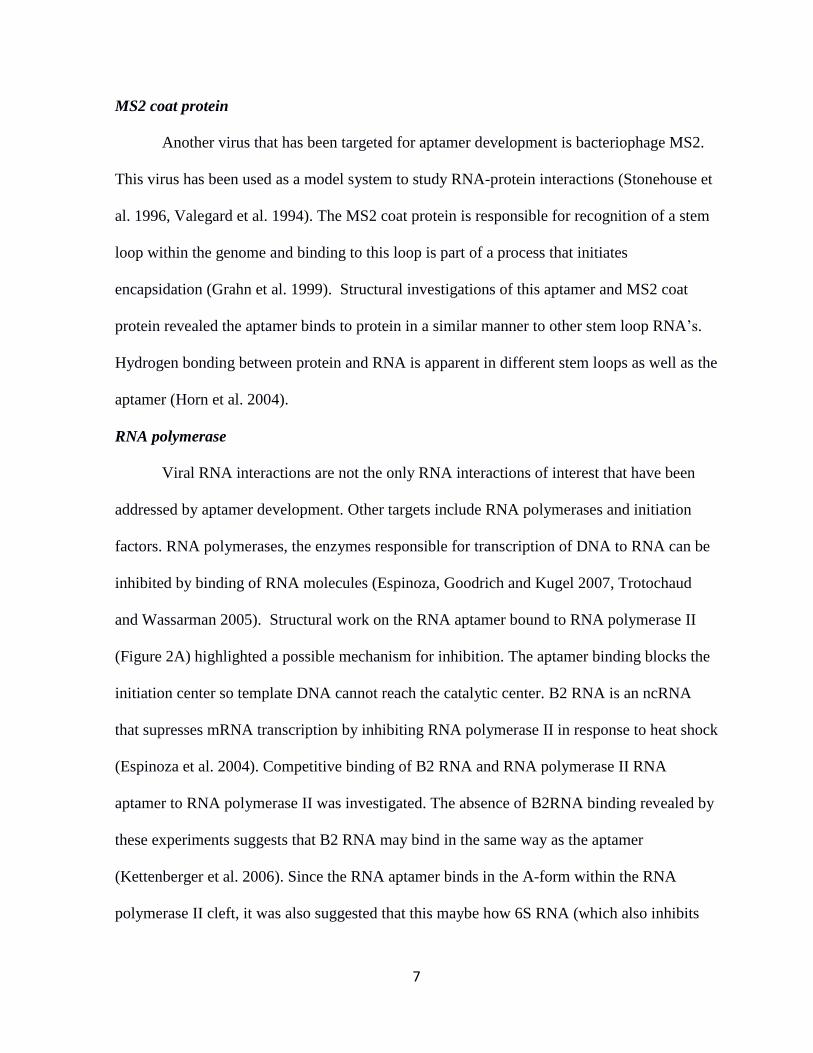
MS2 coat protein
Another virus that has been targeted for aptamer development is bacteriophage MS2.
This virus has been used as a model system to study RNA-protein interactions (Stonehouse et
al. 1996, Valegard et al. 1994). The MS2 coat protein is responsible for recognition of a stem
loop within the genome and binding to this loop is part of a process that initiates
encapsidation (Grahn et al. 1999). Structural investigations of this aptamer and MS2 coat
protein revealed the aptamer binds to protein in a similar manner to other stem loop RNA’s.
Hydrogen bonding between protein and RNA is apparent in different stem loops as well as the
aptamer (Horn et al. 2004).
RNA polymerase
Viral RNA interactions are not the only RNA interactions of interest that have been
addressed by aptamer development. Other targets include RNA polymerases and initiation
factors. RNA polymerases, the enzymes responsible for transcription of DNA to RNA can be
inhibited by binding of RNA molecules (Espinoza, Goodrich and Kugel 2007, Trotochaud
and Wassarman 2005). Structural work on the RNA aptamer bound to RNA polymerase II
(Figure 2A) highlighted a possible mechanism for inhibition. The aptamer binding blocks the
initiation center so template DNA cannot reach the catalytic center. B2 RNA is an ncRNA
that supresses mRNA transcription by inhibiting RNA polymerase II in response to heat shock
(Espinoza et al. 2004). Competitive binding of B2 RNA and RNA polymerase II RNA
aptamer to RNA polymerase II was investigated. The absence of B2RNA binding revealed by
these experiments suggests that B2 RNA may bind in the same way as the aptamer
(Kettenberger et al. 2006). Since the RNA aptamer binds in the A-form within the RNA
polymerase II cleft, it was also suggested that this maybe how 6S RNA (which also inhibits
8
RNA polymerase II (Trotochaud and Wassarman 2005)) binds to the RNA polymerase II, this
cleft naturally accommodates B-form DNA templates (Kettenberger et al. 2006).
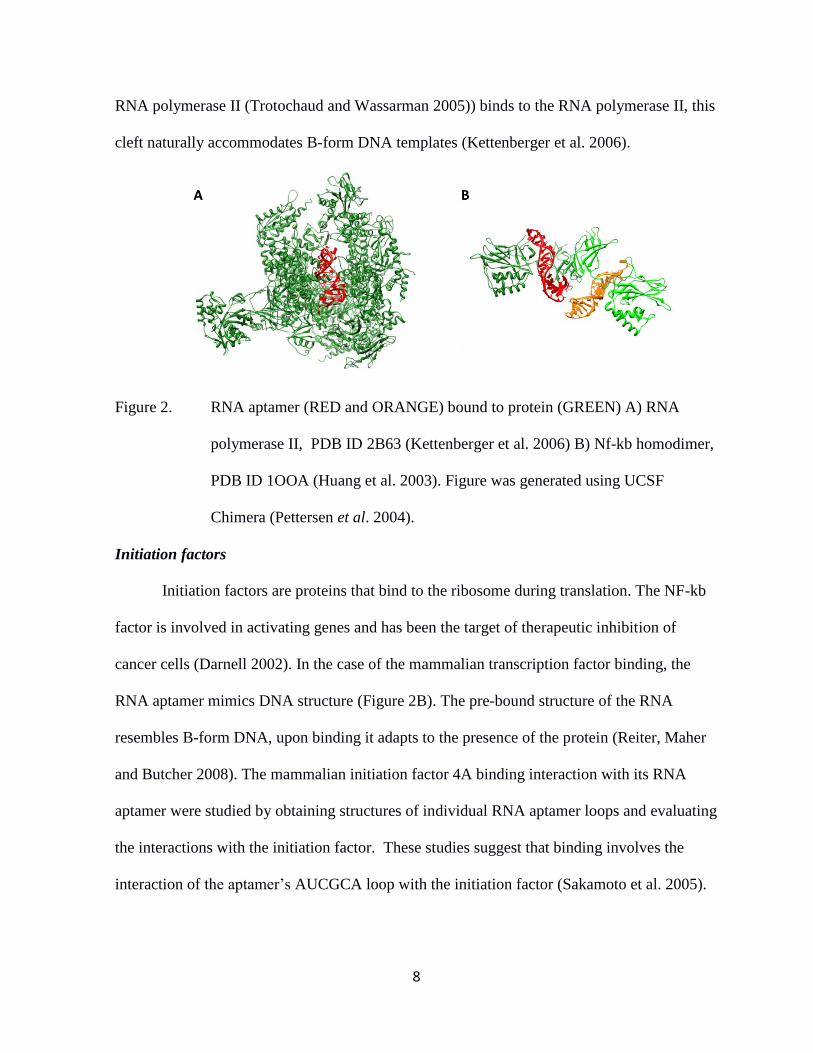
Figure 2. RNA aptamer (RED and ORANGE) bound to protein (GREEN) A) RNA
polymerase II, PDB ID 2B63 (Kettenberger et al. 2006) B) Nf-kb homodimer,
PDB ID 1OOA (Huang et al. 2003). Figure was generated using UCSF
Chimera (Pettersen et al. 2004).
Initiation factors
Initiation factors are proteins that bind to the ribosome during translation. The NF-kb
factor is involved in activating genes and has been the target of therapeutic inhibition of
cancer cells (Darnell 2002). In the case of the mammalian transcription factor binding, the
RNA aptamer mimics DNA structure (Figure 2B). The pre-bound structure of the RNA
resembles B-form DNA, upon binding it adapts to the presence of the protein (Reiter, Maher
and Butcher 2008). The mammalian initiation factor 4A binding interaction with its RNA
aptamer were studied by obtaining structures of individual RNA aptamer loops and evaluating
the interactions with the initiation factor. These studies suggest that binding involves the
interaction of the aptamer’s AUCGCA loop with the initiation factor (Sakamoto et al. 2005).

9
Future structural work may reveal how these aptamers could interfere with the factors
interacting with the ribosome.
Prion protein
RNA aptamers have also been used to study protein targets whose primary function
does not involve interaction with RNA, such as prion proteins and immunoglobulins. Prion
proteins are infectious particles responsible for diseases like Creutzfeldt Jacob disease and
spongiform encephalopathies (Huang et al. 1994). The RNA aptamer for bovine prion utilizes
the electrostatic interaction between its phosphate backbone and lysine clusters, along with
stacking interactions between its GGGG quadruplex and a tryptophan residue to achieve
binding (Mashima et al. 2009). Prion protein has been found to bind to amyloid –β oligomers
leading to synaptic dysfunction. This aptamer has been proposed for development as a
therapeutic agent for Alzheimer's disease, since the prion protein plays a role in impairment of
synaptic plasticity (Lauren et al. 2009). The prion aptamer has already been shown to reduce
the formation of prion protein in infected cells, most likely by preventing prion protein from
interacting with native proteins (Proske et al. 2002).
Human immunoglobulin G
Human immunoglobulin G (IgG) is a protein responsible for identifying pathogens
(Litman et al. 1993). The structure of human IgG bound to its aptamer reveals the interactions
that make it specific for this particular immunoglobulin. These involve stacking interactions
with Tyr373; unlike other protein RNA interactions, the binding is not driven by the
interaction of negatively charged phosphate and positively charged surface of protein
(Nomura et al. 2010). This is significant because it has expanded the type of ligand that can be
considered a target for aptamer development.
10
4. Drug/Small molecule RNA aptamer interactions
Neomycin
The antibiotics that target rRNA have been investigated further by the development of
aptamers that bind them with high affinity and specificity. Neomycin B is an aminoglycoside
antibiotic that inhibits a variety of RNA-mediated biological functions (Fourmy et al. 1998).
The structure-function relationship of Neomycin B and other aminoglycosides has been
studied with relation to the ribosome. Two binding sites have been identified, one on helix 44
of the small ribosomal unit and the other on helix 69 of the large ribosomal subunit. In the
small ribosomal subunit, neomycin binds within a pocket formed by an A : A base pairing and
an unpaired A. These residues are responsible for increasing affinity to cognate tRNA –
mRNA. When antibiotic is bound the ribosome is immobilized into high affinity configuration
recognizing both cognate and non-cognate tRNA-mRNA complexes leading to miscoding
(Magnet and Blanchard 2005). In the large ribosomal subunit, it binds within a helix with
binding stabilized by contacts including a CAAUAC loop and G1906. This helix is swung
away from an interface of subunit association by the ribosome recycling factor (RRF).
Binding of the antibiotic restores interactions destabilized by the RRF and inhibits ribosome
recycling (Borovinskaya et al. 2007). Neomycin B in complex with HIV-1 DIS (previous
mentioned) has since been crystallized and its structure determined. This binding interaction
is similar to that involved in the small ribosomal unit (Bernacchi et al. 2007, Freisz et al. 2008,
Ennifar et al. 2003). These structures reveal that the mode of interaction between RNA and
Neomycin B can vary. The binding of Neomycin B to its aptamer has been investigated to
obtain a better understanding of aminoglycosides RNA interactions, Figure 3 shows a few of
the different structures of Neomycin B RNA binding pockets.

11
Figure 3. Neomycin B bound to RNA. A) Neomycin B aptamer, PDB ID 1NEM (Jiang
et al. 1999) B) HIV Tat, PDB ID 1QD3 (Faber et al. 2000) C) 30S ribosome
Neomycin binding site, PDB ID 2QAN (Borovinskaya et al. 2007) D) 50S
ribosome Neomycin B binding site, PDB ID 2QAO (Borovinskaya et al. 2007)
E) HIV DIS complex, PDB ID 3C7R (Freisz et al. 2008). Neomycin B is
colored PURPLE. RNA is color coded A-RED, U-CYAN, G-GREEN, C-
YELLOW. Figure was generated using UCSF Chimera (Pettersen et al. 2004).
Neomycin B binds to the aptamer within a pocket consisting of three consecutive GU
base pairs and a flap formed by an adenine base (Jiang et al. 1999). This pocket is different
from the aforementioned binding sites. Further investigation of this interaction determined
that hydrogen bonding interactions between aptamer and ligand were the major mechanism
responsible for binding (Cowan et al. 2000). A more recent study used NMR techniques to

12
show that protonation of Neomycin B accompanies binding its cognate aptamer,
demonstrating the ability of RNA to influence its ligand (Freire et al. 2007). The
thermodynamic differences in binding of these complexes and other RNA complexes will be
discussed in the following section.
Other antimicrobial agents have been used as targets for development of aptamers.
These include tetracycline, tobramycin and streptomycin. Characterization of these complexes
has clarified different aspects of RNA small molecule interactions and most of these aptamers
have also been used to develop biosensors for medical applications (Liu, Cao and Lu 2009).
For example the tobramycin aptamer has been incorporated as part of an aptasensor that can
detect tobramycin and other aminoglycosides in human serum (Gonzalez-Fernandez et al.
2011).
Tetracycline
Tetracycline, tobramycin and streptomycin are antibiotics that like neomycin, target
the bacterial ribosome. The tetracycline aptamer boasts a more complicated aptamer structure
than usually obtained by SELEX against a small molecule. The tetracycline aptamer consists
of three helices, creating a binding site out of tertiary contacts between the helices. ITC
studies of the tetracycline riboswitch revealed a two-step binding mechanism driven by
favourable enthalpy. Tetracycline’s interaction with the 30S ribosomal subunit is stabilized by
hydrogen bonding interactions as opposed to the aptamer which has stacking interactions with
two rings of tetracycline (Xiao, Edwards and Ferre-D'Amare 2008, Brodersen et al. 2000).
Tobramycin and Streptomycin
The structures of two aptamers selected for tobramycin have been solved. Both
aptamer tobramycin complexes revealed that the antibiotic binds within a deep groove and has

13
multiple hydrogen bonding contacts with the RNA. While both aptamers share the binding
motif, one uses a base bulge to widen RNA major groove while the other has three mismatch
pairs. Since both aptamers have comparable binding affinities this example reveals that
changes to the binding site can be diverse (Jiang and Patel 1998, Jiang et al. 1997). The
streptomycin aptamer has also been studied by the same group that investigated the structure
of tobramycin and neomycin aptamers. This aptamer consists of S turns that create a cavity to
encapsulate streptomycin (Tereshko, Skripkin and Patel 2003).
Purine
Naturally occurring aptamers consist mainly of riboswitches, these sequences affect
the secondary structure upon binding its ligand to allow for transcription of the following
sequence. Similarity between an artificially selected aptamer and naturally occurring RNA
can be seen in purine binding RNAs. The structure of the purine riboswitch has been obtained
and reveals that the ligand is encapsulated by the RNA. Kinetic studies of this binding
interaction suggest that the ligand first engages in Watson-Crick base pairing with Y74
followed by a loop closure that traps the ligand in the binding pocket and subsequent
formation of hydrogen bonds between ligand and RNA (Gilbert et al. 2006). Furthermore
mutation studies of the purine riboswitch reveal the ability of RNA to form bound-like
structure through ligand mimicking. The term ligand mimicking is used to describe a receptor
mimicking the presence of a ligand with a residue that has characteristics of the ligand. The
mutant purine riboswitch is inactive, with one of its nucleotides (G39) occupying the active
site (Delfosse et al. 2010). While the structure is not yet available, other biochemical methods
suggest that an artificially selected adenine aptamer has a similar dependence on hydrogen
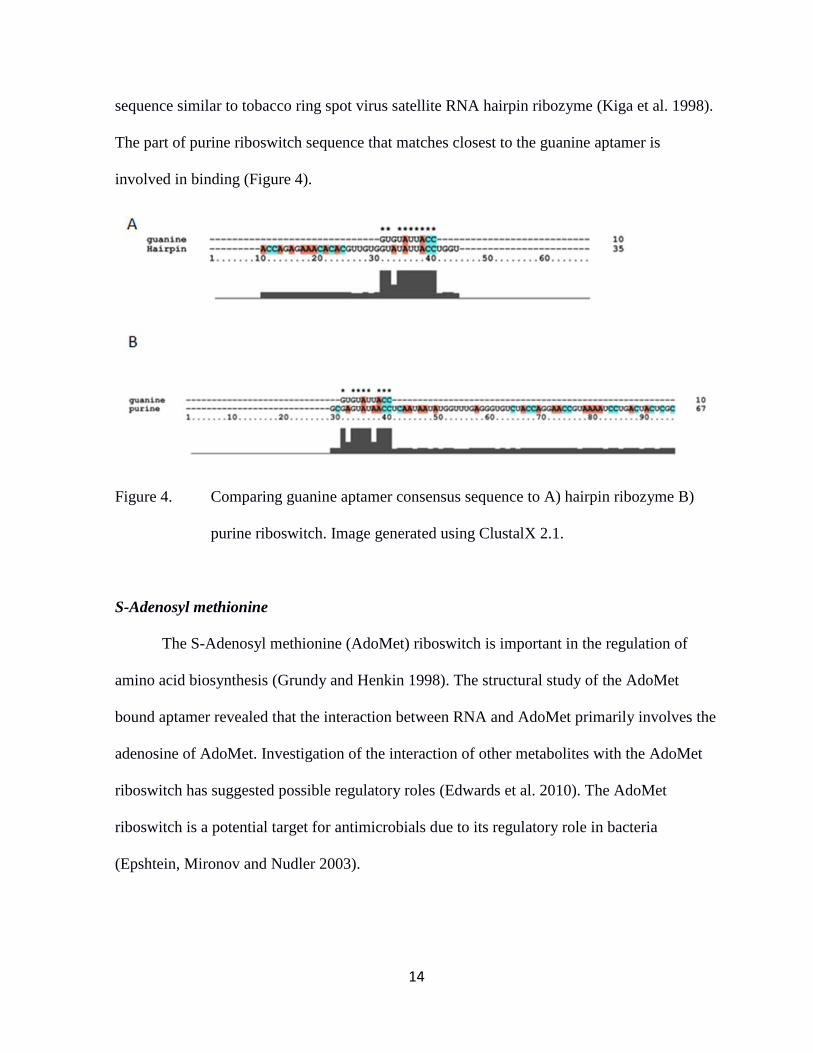
bonding versus stacking interactions (Meli et al. 2002). The guanine aptamer has a consensus
14
sequence similar to tobacco ring spot virus satellite RNA hairpin ribozyme (Kiga et al. 1998).
The part of purine riboswitch sequence that matches closest to the guanine aptamer is
involved in binding (Figure 4).
Figure 4. Comparing guanine aptamer consensus sequence to A) hairpin ribozyme B)
purine riboswitch. Image generated using ClustalX 2.1.
S-Adenosyl methionine
The S-Adenosyl methionine (AdoMet) riboswitch is important in the regulation of
amino acid biosynthesis (Grundy and Henkin 1998). The structural study of the AdoMet
bound aptamer revealed that the interaction between RNA and AdoMet primarily involves the
adenosine of AdoMet. Investigation of the interaction of other metabolites with the AdoMet
riboswitch has suggested possible regulatory roles (Edwards et al. 2010). The AdoMet
riboswitch is a potential target for antimicrobials due to its regulatory role in bacteria
(Epshtein, Mironov and Nudler 2003).
15
5. Thermodynamic parameters
The binding of two molecules is generally discussed in terms of the free energy
change (ΔG), the enthalpy change (ΔH), the entropy change (ΔS) and dissociation constant
(Kd). The thermodynamic parameters involved in binding interactions are related to each other
by the Gibbs Helmholz equation (Equation 1).
ΔG = ΔH – TΔS (Equation 1)
ΔG is related to the binding affinity by Equation 2, with (R) being the gas constant and (T) the
absolute temperature.
ΔG = - RT ln(1/Kd) (Equation 2)
Kd is the dissociation constant defined and can be defined as the rate ligand enters binding
pocket over the rate at which the ligand leaves binding pocket. It is apparent from these
equations that binding is stronger, Kd lower, the more negative is the value of ΔG. From
Equation 1 it can be gleaned that a negative ΔH will push the value of ΔG to a larger negative
value. Likewise, a positive value for ΔS will push the value of ΔG to a larger negative value.
A negative value of ΔH will be referred to as favourable ΔH and is associated with the
increase of interactions between ligand and receptor, while a positive value of ΔH will be
referred to as unfavourable ΔH and is associated with reducing number of interactions
(Jelesarov and Bosshard 1999). A negative value of ΔS will be referred to as unfavourable ΔS
and is associated with a decrease in randomness (e.g. restricting movement) while a positive
value of ΔS will be referred to as favourable ΔS and is associated with an increase in
randomness (e.g. release of water molecules) (Jelesarov and Bosshard 1999).
Table 1 shows a summary of thermodynamic data for binding of the above mentioned
RNA targets. The general trend is that binding is driven by favourable ΔH with some
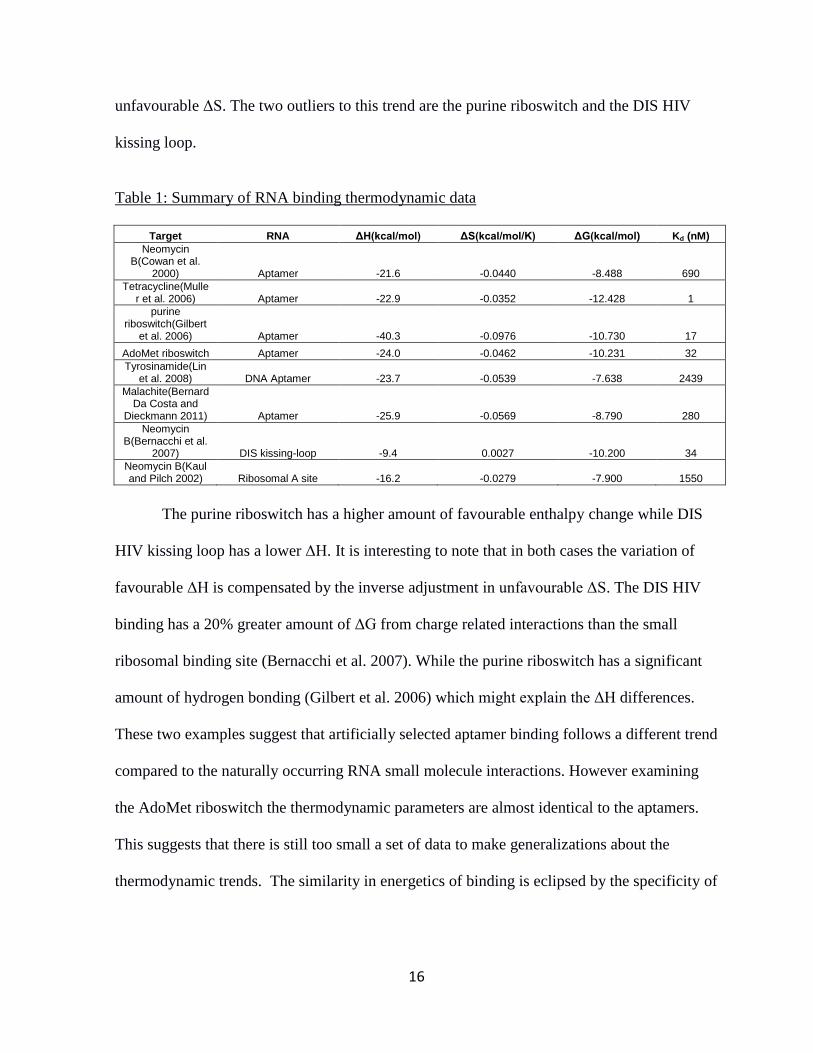
16
unfavourable ΔS. The two outliers to this trend are the purine riboswitch and the DIS HIV
kissing loop.
Table 1: Summary of RNA binding thermodynamic data
Target RNA ΔH(kcal/mol) ΔS(kcal/mol/K) ΔG(kcal/mol) Kd (nM)
Neomycin B(Cowan et al.
2000) Aptamer -21.6 -0.0440 -8.488 690
Tetracycline(Muller et al. 2006) Aptamer -22.9 -0.0352 -12.428 1
purine riboswitch(Gilbert
et al. 2006) Aptamer -40.3 -0.0976 -10.730 17
AdoMet riboswitch Aptamer -24.0 -0.0462 -10.231 32
Tyrosinamide(Lin et al. 2008) DNA Aptamer -23.7 -0.0539 -7.638 2439
Malachite(Bernard Da Costa and
Dieckmann 2011) Aptamer -25.9 -0.0569 -8.790 280
Neomycin B(Bernacchi et al.
2007) DIS kissing-loop -9.4 0.0027 -10.200 34
Neomycin B(Kaul and Pilch 2002) Ribosomal A site -16.2 -0.0279 -7.900 1550
The purine riboswitch has a higher amount of favourable enthalpy change while DIS
HIV kissing loop has a lower ΔH. It is interesting to note that in both cases the variation of
favourable ΔH is compensated by the inverse adjustment in unfavourable ΔS. The DIS HIV
binding has a 20% greater amount of ΔG from charge related interactions than the small
ribosomal binding site (Bernacchi et al. 2007). While the purine riboswitch has a significant
amount of hydrogen bonding (Gilbert et al. 2006) which might explain the ΔH differences.
These two examples suggest that artificially selected aptamer binding follows a different trend
compared to the naturally occurring RNA small molecule interactions. However examining
the AdoMet riboswitch the thermodynamic parameters are almost identical to the aptamers.
This suggests that there is still too small a set of data to make generalizations about the
thermodynamic trends. The similarity in energetics of binding is eclipsed by the specificity of

17
each binding pocket created by differences in sequence and geometry of the binding pocket
(Appendix Table A1).
6. Conclusions
A common trend seen with the aptamers selected for larger biomolecules is that they
mimic the type of interactions that already exist in organisms. This is seen clearly in the
aptamer for TAR HIV RNA, which forms a kissing complex similar to that seen in HIV DIS
(Van Melckebeke et al. 2008, Paillart et al. 2004). This phenomenon is implied by the work
with RNA polymerase II aptamer and B2RNA competitive binding to RNA polymerase II
(Kettenberger et al. 2006).
In the case of aptamers for antibiotics, the naturally occurring RNA that binds to the
same targets has clear differences in their binding pockets. This is a reflection of the
evolution of RNA, since the naturally occurring RNA did not have a selection pressure driven
purely by affinity to target, but rather by their function within the system (cell/virus). As seen
in the case of tobramycin with two aptamers that use different means to widen the binding
pocket (Jiang and Patel 1998, Jiang et al. 1997) and multiple ATP aptamers (Huang and
Szostak 2003) it is possible to have variations of sequences that have strong binding affinity
and nature has had multiple variations to explore other functions.
The closer relatives to artificially selected aptamers, riboswitches, do at least in the
case of adenine, share similarity. Another example of similarity in sequence between
artificially selected aptamer and naturally occurring RNA is that of the ATP aptamer binding
motif which was found in a bacterial virus (Shu and Guo 2003). The aptamers that select for
small molecules do provide a window into the capacity for function that RNA has, and the
roles it could have played in a prebiotic world.

18
The number of aptamers is increasing as methods to select them become more routine,
even including in silico techniques (Chushak and Stone 2009). 2'-Locked RNA aptamers are
aptamers where there is a 2'O, 4'-C methylene link which confers RNA C3' endo
conformation. This change results in an entropic constraint that leads to increased affinity for
target (Schmidt et al. 2004). This, along with other developments in degradation resistant
nucleotides (Minakawa et al. 2008) promises many applications for aptamers to come.
RNA binding usually involves adaptive interactions and this has been seen for binding
to peptides and small molecules (Patel et al. 1997, Ye et al. 1999, Flinders et al. 2004). This
makes it important to probe the conformational mobility and thermodynamics of binding so
that the aptamer target molecule interaction is characterized. This line of investigation can be
supplemented by site-directed modification of the aptamer to change the spatial configuration
or the energy of the binding interaction. For example the binding affinity of tRNAGln to
glutaminyl-tRNA synthetase was improved by studying the related aptamer, the
improvements did not involve the RNA protein contacts but instead were driven by tertiary
structure stabilization of the RNA (Lee and McClain 2004). Another important reason for the
study of structure and thermodynamics of RNA-ligand interactions is to understand the nature
of RNA-induced modifications of the ligand itself. A good example of such behaviour is seen
in the conformational changes induced by malachite green molecules binding to cognate
aptamer, and these changes are significant enough to change the optical properties of the dye
molecule (Nguyen et al. 2004). This type of binding interaction could expand modalities of
drug interactions, such as aptamer-assisted pro-drug delivery.
Understanding the nature of the interactions between target and drug molecule has
improved the rational design of protein targeting molecules (Noble, Endicott and Johnson

19
2004). The structure-function paradigm is being applied to rational design of biologically
active therapeutic RNA. This effort is assisted by the use of aptamer models to understand
nature of RNA-molecule interactions.
7. Research Outline
The following chapters describe our studies of RNA ligand interactions in binding and
catalysis. This involves the malachite green aptamer (MGA) which was selected to bind
malachite green dye (MG) (Baugh, Grate and Wilson 2000). MG or 4-[(4-
dimethylaminophenyl)-phenyl-methyl]-N,N-dimethylaniline has been used in aquaculture
industry to treat fish and fish eggs due to its antiseptic, antibacterial and antifungal properties
(Hall and Unestam 1980, Alderman 1985). MG has been found to inhibit enzymes including
acetylcholinesterase (Kucukkilinc and Ozer 2008) and multidrug-binding repressor protein
QacR (Peters et al. 2011).
An introduction to MGA and the thermodynamic studies done with MGA binding, to
MG and derivatives, is covered in chapter 2. This chapter was published under the title
“Entropy and MG2+
control ligand affinity and specificity in the malachite green binding
RNA aptamer” in Molecular BioSystems (Appendix Note A1). The introduction has been
expanded and the rest of the paper has been reproduced with permission from RCS publishing
(Appendix Note A2). These experiments pointed to a significant difference in the binding of
the different derivatives. To further explore the nature of binding pocket, competition binding
studies were conducted and are discussed in chapter 3. Chapter 3 has been submitted for
publication under the title “Not so adaptive binding: Ligand competition in an RNA aptamer”
and is currently under review. In addition to material submitted for publication chapter 3
contains preliminary computational work. The multiple capabilities revealed by our binding

20
studies and previously discovered catalytic capacity (discussed in chapter 2) stimulated the
attempt to select a new aptamer and determine if this varied capacity would be replicated.
This selection is discussed in chapter 4 along with a brief comparison of DNA and RNA
aptamers for the same target. Finally a report of the attempts to purify MGA of uniform
sequence length and attempts to expand the catalytic repertoire of MGA are covered in
chapter 5.

21
Chapter 2: Structure and Thermodynamics in the Malachite Green RNA Aptamer
1. Introduction
Aptamers have been developed for a wide variety of targets and are excellent
model systems for RNA-ligand interactions (Chapter 1). The mode of binding in different
aptamers varies greatly depending on their targets and selection procedure. For example,
the Neomycin B RNA aptamer binding is driven largely by hydrogen bonding (Cowan et
al. 2000) while the malachite green RNA aptamer (MGA) binding is driven by
electrostatic and stacking interactions (Flinders et al. 2004). MGA has been utilized as a
bioprobe in combination with microtubules (Hirabayashi et al. 2006), as a fluorescent
sensor (Xu and Lu 2010, Zhang et al. 2009), an assay for malachite green (MG) (Stead et
al. 2010), as part of a diagnostic molecular automata (Hirabayashi, Ohashi and Kubo
2010) and for the validation of molecular docking software (Detering and Varani 2004).
MGA was originally engineered for binding specificity to the tri-phenyl dye
malachite green (Grate and Wilson 1999) The secondary structure of MGA and chemical
structure of MG are shown in Figure 1 A and B, respectively. The purpose behind
selecting this aptamer was to harness MG’s destructive potential. MG has been found to
generate hydroxyl radical from water when irradiated with red laser light and these
radicals damage surrounding biomolecules (Liao, Roider and Jay 1994). The design
involved appending MGA into the non coding region of a target gene. MG is then
introduced and binds to MGA. Subsequent irradiation of target region leads to formation
of radicals which damage the mRNA and damaged mRNA would be degraded by the cell
(Grate and Wilson 1999). The discovery of siRNA which can target mRNA sequences for
degradation (Hamilton and Baulcombe 1999) without the need to introduce a carcinogenic
dye made such a method obsolete. However MGA proved useful in exploring the potential

22
of aptamers in molecular biology, the insertion of this sequence in S.cerevisiae resulted in
cell cycle regulation by MG. MGA was capable of doing this without the use of laser
irradiation. The structural changes upon binding MG were sufficient to prevent the 40S
ribosomal subunit to interact with cyclin gene transcripts (Grate and Wilson 2001).
The structure of the aptamer bound to ligand was initially solved by X-ray
crystallography in complex with the MG derivative tetramethylrosamine (TMR) (Figure
2) (Baugh, Grate and Wilson 2000) and later by NMR spectroscopy in complex with the
original selection target MG (Flinders et al. 2004) (Figure 1C). The binding pocket of the
MGA (Figure 1A) consists of a base quadruple (C7:G24:A31:G29) and a Watson-Crick
base pair (G8:C28) which serve as stacking platforms for malachite green (MG, Figure
1B). In addition, the nucleotides A9 and A30 are positioned in such a way that they almost
completely close the pocket on one side (Figure 1C) (Flinders et al. 2004, Baugh et al.
2000). The other residues in the internal loop region of the aptamer act as linkers and
anchors, for the nucleotides that are in contact with the ligand.
The major difference between the structures of the MGA-TMR and the MGA-MG
complexes is that in order to accommodate the non-planar MG, the aptamer undergoes a
small rearrangement that can be best described as a rotation of the upper part of the
binding pocket relative to the lower part (Flinders et al. 2004). This provides enough
space to accommodate the rings of MG in the binding pocket, but also leads to a loss of
some stacking interactions. Both structures reveal a lack of hydrogen bonding between
MGA and ligand, this provides an excellent model system to study the role of electrostatic
and stacking interactions.

23
Figure 1. (A) Schematic of the MGA complex used in these studies. Nucleotides that
form the top and bottom of the binding pocket are shown in orange and
blue, respectively. (B) Structure of malachite green (MG). (C) Space filling
model of the MGA binding pocket from the solution structure (1Q8N). The
ligand is shown as ball and stick model. Same colour scheme as in (A).
Graphics prepared with UCSF Chimera (Pettersen et al. 2004).
The study of the MGA-ligand interactions have shown that ligands can undergo
significant changes in their electronic structure and charge distribution when bound inside
an RNA binding pocket (Nguyen et al. 2002). The MG molecule responds to the unique
electrostatic environment inside the RNA aptamer with a redistribution of its positive
charge as well as a conformational change (Nguyen et al. 2004). These observations
suggested that the environment inside the RNA binding pocket can have a significant
effect on the chemical properties of the bound ligand. Further studies revealed that the
malachite green aptamer can indeed act as a ribozyme when presented with a suitable

24
substrate molecule. An acetyl-ester derivative of malachite green undergoes an accelerated
hydrolysis reaction when bound to the aptamer (Brackett and Dieckmann 2006), this
reaction is discussed further in chapter 5.
The abovementioned studies and applications of the MGA and other aptamers indicate
the need for a generalized understanding of ligand–RNA interactions as basis for further
developments. Isothermal titration calorimetry (ITC) has been established as a standard
method for the detailed study of the thermodynamics of RNA–small molecule and RNA–
protein interactions (Chapter 1) as well as RNA folding processes (Feig 2007). Insights into
the thermodynamic forces that drive ligand binding and dissociation open a way for a better
understanding of these important interactions that are the basis for drug action and catalysis.
We have conducted ITC studies investigating the binding of MGA to MG under a variety of
solution conditions. In addition to binding of MGA to MG, MGA binding to MG derivatives
was investigated. MG derivatives tested included tetramethylrosamine (TMR), pyronin Y
(PY), and crystal violet (CV). Figure 2 shows the structure of these derivatives. PY has a
planar structure similar to TMR, but lacks the third ring, while crystal violet (CV) has a non-
planar structure similar to MG, with an extra dimethylamine group on ring C.
Figure 2. Chemical structure of MG derivatives used in this study: A) Crystal violet
(CV) B) Tetramethylrosamine (TMR) C) Pyronin Y (PY).

25
2. Results
Initial binding experiments
The primary method to determine thermodynamic parameters of MGA binding to
ligands was ITC studies. Initially two other methods were attempted to determine binding
constants, equilibrium dialysis and fluorescence intensity titrations. These along with NMR
studies provided the motivation to investigate the binding of MGA to derivatives.
In the course of NMR studies of MGA in complex with MG, TMR and PY it became
apparent that the complexes with TMR and PY were not as stable as the corresponding MG
complex under the NMR conditions (low salt, no divalent metal ions). This appeared to be a
contradiction with the affinities reported in the original study (Baugh et al. 2000) where both
TMR and PY formed more stable complexes with MGA than the original ligand MG. The Kd
values for MG, TMR and PY were reported as 800 nM, 40 nM, and 225 nM, respectively.
These values were determined at low salt but in the presence of divalent metal ions (10 mM
K-cacodylate pH 5.8, 10 mM MgCl2, 10 mM KCl). In our NMR studies, divalent metal ions
were avoided to ensure sample stability during data acquisition and low salt was necessary to
prevent the formation of RNA dimers.

26
Figure 3. Comparison of 2D NOESY spectra of A) MGA-MG and B) MGA-TMR
complexes in 100% D2O at 293K. The spectra were acquired on a Bruker
DRX 600 MHz spectrometer in 10 mM potassium phosphate buffer, pH 6.0
and 10 mM KCl.
Figure 3 shows a comparison of 2D NOESY spectra of 1:1 mixtures of MGA:MG and
MGA:TMR. It is clearly apparent that the TMR spectrum shows much broader and fewer
cross-peaks than the corresponding MG spectrum, indicating a less dynamic complex (faster
exchange between free and bound RNA or multiple conformations). In order to address these
apparent contradictions, preliminary equilibrium dialysis experiments were conducted to
determine binding affinities under conditions closer to those used in the NMR studies (100
mM phosphate buffer, 50 mM KCl, pH 6.0).

27
Equilibrium dialysis was conducted using DispoEquilibrium DIALYZER (Havard
Apparatus, Massachusetts, USA). The DIALZYER consists of two chambers connected by a
semipermeable membrane. MG and derivatives can pass through membrane, while MGA due
to larger size can not. MGA is added to one chamber and due to the membrane is trapped
there. MG or derivative is added to the other chamber and allowed to equilibrate. Binding of
MG or derivative to MGA, shifts equilibrium of free ligand, causing more to move into MGA
chamber.
These experiments showed that PY had a significantly lower affinity (8.35±3.7 µM)
than MG (0.26±0.08 µM) under these conditions (Figure B1 in Appendix). These initial
results prompted us to thoroughly investigate the binding behaviour of MGA in complex with
its ligands using fluorescence based titration studies.
Fluorescence titration studies relied on the change in fluorescence properties of the
ligands when bound to MGA (Baugh et al. 2000). The fluorescence binding experiments were
conducted using a Nanodrop fluorometer to test all four dyes whose affinities had been
previously reported. This method was chosen since it required minimal amounts of RNA and
closely resembled the methodology used in the original study. The binding affinity was
determined by using the change in fluorescence as concentration of MGA was increased while
ligand concentration was kept constant in 50 mM phosphate buffer, 150 mM NaCl, pH 6.7.
The dissociation constants for the MGA complexes formed with MG, TMR, CV and
PY were found to be 2.73±0.6 µM , 0.8±0.2 µM , 7.6±1.7 µM and 7.6±1.1 µM , respectively
(see Figure B2 in Appendix). These results confirm the trend seen in the equilibrium dialysis
study, but do not explain the low stability of the TMR complex seen in the NMR studies.

28
Surprisingly, CV, which was thought to not interact with the aptamer, seems to have a binding
affinity similar to PY, but PY shows a much weaker binding than seen in the original study
(Baugh et al. 2000). Overall these results indicated that a more comprehensive analysis of the
binding behaviour of MGA with these ligands under a broad range of salt conditions was
needed in order to understand binding specificity and affinity.
Isothermal titration calorimetry experiments
ITC is based on monitoring the enthalpy involved in a reaction that occurs as a ligand
is gradually added to a reaction cell containing receptor. The instrument monitors the
temperature and the energy required to maintain the temperature of the reaction cell. It also
determines the energy required to maintain the temperature of a reference cell. This energy is
subtracted from the energy required to maintain the temperature of the reaction cell, the
difference corresponds to the energy involved in the reaction (Wiseman et al. 1989, Ladbury
2004). The analysis of this data provides ΔH, ΔS, ΔG and Kd as reported by Wiseman et al.
ITC studies were conducted at three different salt concentrations (1 mM, 150 mM, 1.0
M NaCl) and in the presence of the divalent metal ion (10 mM MgCl2). Thermodynamic
parameters for the four ligands obtained from these experiments are summarized in Table 1.
Overall, the affinity of the ligands increased with salt concentration. The binding of CV at 1
mM salt was below detection threshold and the high salt value could not be determined
because CV precipitated at 1 M salt. The presence of MgCl2 at low salt concentrations in
general increases affinity, reaching almost a third of the Kd at 150 mM NaCl for MG and
TMR, and half the Kd at 150 mM for PY. The only exception is CV where the change in
affinity in the presence of Mg2+
is not significant. MGA has comparable affinity for TMR and

29
MG, with TMR binding slightly tighter at higher salt concentrations and in the presence of
Mg2+
. On the other hand, MG has a higher affinity at low salt in the absence of Mg2+
. Both
TMR and MG bind significantly tighter than PY and CV which have similar affinities at 150
mM salt, with PY improving in the presence of magnesium. For all four ligands increasing
salt concentration or the addition of Mg2+
leads to tighter binding. The lower Kd values are
predominantly caused by more favourable entropy terms. The exception is PY for which the
entropy term does not change significantly in the presence of higher salt or divalent ions.
Table 1. ITC determined thermodynamic parameters for MG, TMR, PY and CV at
various salt concentrations, pH 6.7 at 25oC.
Dye Salt Concentration Kd(M)a ΔH(kcal/mol)a ΔS(cal/mol/deg)a ΔG(kcal/mol)a
MG 1 mM NaCl 0.80±0.06 -29.23±1.69 -70.13±5.83 -8.33±0.06
150 mM NaCl 0.28±0.07 -25.93±2.24 -56.87±7.92 -8.98±0.14 1 M NaCl 0.37±0.06 -25.76±2.64 -56.93±8.54 -8.79±0.10
1 mM NaCl 10 mM MgCl2 0.10±0.01 -23.10±1.35 -45.37±4.42 -9.58±0.04
TMR 1 mM NaCl 1.06±0.08 -25.23±2.94 -57.27±10.01 -8.16±0.05
150 mM NaCl 0.28±0.04 -18.32±1.09 -31.43±3.55 -8.95±0.08
1 M NaCl 0.14±0.05 -13.46±0.44 -13.63±1.07 -9.39±0.18 1 mM NaCl 10 mM MgCl2 0.08±0.02 -17.29±1.51 -25.50±5.26 -9.69±0.12
PY 1 mM NaCl 14.28±5.04 -13.36±2.22 -22.53±7.94 -6.64±0.20 150 mM NaCl 4.08±0.20 -17.81±0.38 -35.03±1.20 -7.37±0.03
1 M NaCl 2.65±0.42 -15.34±1.03 -25.93±3.71 -7.61±0.09
1 mM NaCl 10 mM MgCl2 1.65±0.67 -16.94±1.77 -30.20±6.52 -7.94±0.23
CV 150 mM NaCl 4.45±0.08 -78.27±14.60 -280.0±49.15 -7.35±0.09
1 mM NaCl 10 mM MgCl2 3.79±0.12 -54.48±9.71 -158.0±32.60 -7.40±0.01
a Average of three independent measurements each. Curves were fit to a single binding site model. For a typical ITC isotherm see Figure B3 in Appendix.
3. Discussion
Entropy Driven Binding
The thermodynamic characteristics of the interactions between MGA and four
different derivatives of MG were measured under four different buffer conditions by
isothermal titration calorimetry. The binding affinity of MGA for each dye is predominantly
controlled by the entropy of binding (Figure 4). CV is the most flexible of the four ligands

30
and also has the most even distribution of partial charge prior to binding. Hence it suffers the
largest entropy penalty upon binding when it is forced into a restricted conformation and
localized charge distribution that is dictated by the RNA binding pocket. At 150 mM
monovalent salt concentration TMR and PY have similar binding entropy values, whereas
MG binding is accompanied by a larger entropy penalty. This can be rationalized because in
TMR and PY rings A and B are planar due to the bridging oxygen atoms. On the other hand,
the MG molecule is more flexible in its free form with rings A and B able to rotate
independent of each other and hence it shows a larger entropy penalty upon binding.
Figure 4. Relationship between entropy of complex formation and salt concentration for
dye derivatives binding to MGA.
This behavior is similar to that observed for intercalation binding of small molecule
ligands to DNA. Intercalators show a thermodynamic signature with a large favourable

31
enthalpy contribution originating predominantly from stacking interactions which is countered
by a near zero or unfavourable entropy component. The latter is caused by the need to
reorganize the structures of nucleic acid and ligand into more rigid or entropically less
favourable conformations (Chaires 2008). The observation of this kind of thermodynamic
signature makes sense for the MGA complexes because ligand binding and recognition in
these molecules does not involve any hydrogen bonding interactions between RNA and
ligand, relying exclusively on stacking as well as electrostatic interactions (Baugh et al. 2000,
Flinders et al. 2004).
Metal ions control specificity
Interestingly, the entropy penalty for PY binding does not significantly decrease at
higher salt concentrations or in the presence of Mg2+
as seen for the binding of MG and most
clearly for TMR. PY differs from TMR and MG by the lack of the third phenyl ring (Ring C).
Hence it seems that the changes in binding entropy at low and high salt can be largely
attributed to interactions between the MGA and ring C of the ligand. An examination of the
crystal structure of the MGA-TMR complex (Baugh et al. 2000) and the NMR structure of the
MGA-MG complex (Flinders et al. 2004) shows that A30 which is stacked against ring C of
the ligand is part of a bulge/loop structure consisting of A30, A31, U32 and G33. Previous
mutation studies have shown that this structure element is important for binding of MG and
TMR (Flinders et al. 2004). Interestingly, in the crystal structure a Sr2+
ion is positioned in
such way, that it can interact with the phosphate oxygen atoms of A30, A31 and G33. This
suggests that the presence of divalent ions (Mg2+
) or a sufficiently high concentration of
monovalent ions (KCl or NaCl) is needed to stabilize this element of the binding pocket and
thereby the interaction with the ligand. This becomes especially noticeable when ligands other

32
than the original selection target (MG) are bound. The preference for a divalent metal ion is
not surprising considering the presence of Mg2+
during the original selection procedure (10
mM MgCl2) (Grate and Wilson 1999).
The influence of magnesium on binding affinities is interesting because it shows that
the ligand specificity of the MGA is controlled by the solution conditions. While the aptamer
has a lower affinity for all the ligands at low salt concentrations (Figure 5), the binding
affinity of MGA for MG is higher than its affinity for TMR at low salt. This is the reverse of
what is seen at high salt concentrations where TMR has higher affinity.
Figure 5. Relationship between salt concentration and affinity for MG and TMR binding
to MGA as determined by ITC.
Even though the effect is small, this change in ligand preference is significant in an
aptamer selected solely for binding to one target (MG). The ability of MGA to change its

33
ligand preference depending on the solution conditions demonstrates the large influence of
environmental factors on RNA selection/evolution and also highlights the adaptability of
RNA.
Comparison to Previously Reported Affinities
The binding affinities reported here differ from some of the values previously reported
in the literature (Baugh et al. 2000, Babendure, Adams and Tsien 2003, Flinders et al. 2004,
Wang et al. 2009). The affinity for TMR (Kd = 0.08±0.02 µM ) is similar to that originally
reported by Baugh et al. (Kd = 0.04 µM ) (Baugh et al. 2000). These affinities were
determined under comparable buffer conditions. Baugh et al. used fluorescence intensity or
anisotropy to follow titrations of MGA with TMR and PY. They also reported the binding
affinity for MG and CV. These values were determined by competitive inhibition of TMR
binding. The affinity of MG reported by Baugh et al. (Kd = 0.80 µM ) is lower than our value
(Kd = 0.10 µM ), which is similar to that determined by Babendure et al. (Kd = 0.117 µM )
(Babendure et al. 2003). The latter value was determined by following the fluorescence
intensity of MG during a titration. This discrepancy is likely due to the use of a pre-bound
MGA-TMR complex. With a preformed binding pocket that is matched to the planar TMR
molecule, the binding of MG is kinetically unfavourable and the reported Kd value might not
be determined at equilibrium. It should be noted that the affinity for MG was also determined
by Wang et al. (Wang et al. 2009) using fluorescence intensity. However, their studies were
carried out at a higher pH and lower MgCl2 concentration (Kd = 1.03±0.53 µM). The concept
of a preformed binding pocket reducing affinity for other ligands is supported by the low
affinity for CV (Kd > 1 mM) as reported by Baugh et al.. The conformation of CV deviates
significantly from that of TMR and thus it would have difficulty to replace TMR in a
34
preformed complex. This would explain the large difference to our value (Kd = 3.79±0.12 µM
) which was determined for CV binding to an unoccupied RNA pocket. One puzzling
observation is that the affinity for PY reported by Baugh et al. (Kd = 0.225 µM ) is
significantly higher than the value found in our ITC (Kd = 1.65±0.67 µM ) and fluorescence
intensity-based studies (Kd = 7.6 µM , no Mg2+
) under comparable buffer concentrations. This
difference could potentially be a result of intercalation/unspecific binding of PY in addition to
the regular binding inside the MGA pocket. PY is known to bind to nucleic acids via
intercalation in double stranded regions with a preference for RNA (Darzynkiewicz et al.
1986, Kapuscinski and Darzynkiewicz 1987). However, under the conditions used in our
studies we do not see any evidence of significant intercalation for PY or any of the other dyes.
Electrostatic contributions
For aptamers where the binding affinity was studied as a function of salt
concentration, the common trend is in general a decrease in affinity and an increase in entropy
penalty as salt concentration increases (Cowan et al. 2000, Hossain and Kumar 2009, Islam
and Kumar 2009, Stampfl et al. 2007). This observation is typically rationalized by the
decrease in polyelectrostatic interactions or a destabilization of bound complex and can be
utilized to reveal the effect of hydrogen bonds which are unaffected by the salt concentration.
Since the MGA complexes lack hydrogen bonding interactions between ligand and RNA, it
was expected that the affinity would decrease as salt concentration increases. However the
effect we see is an increase in affinity with increasing salt concentration. As discussed above,
this effect is most likely due to a structural stabilization of the binding pocket by metal ions.
Wyman (Wyman 1964) and Tanford (Tanford 1969) have proposed the following equation
for describing the electrostatic contribution due to ion release for DNA/protein interactions:

35
ΔGelec=ZфRT ln[Na+] (Equation 1)
Z is the apparent charge on the bound ligand, and ф is the fraction of Na+ bound per nucleic
acid phosphate. –Zф can be obtained from the slope of a log Ka versus log [Na+] plot
(Mascotti and Lohman 1990, Record, Lohman and Dehaseth 1976).
log Ka/ log [Na+] = -Zф (Equation 2)
These equations have previously been used to analyze the thermodynamic properties of the
Neomycin (Cowan et al. 2000) and L-tyrosinamide aptamers (Lin et al. 2008). In both these
cases the Zф value was a positive one since the slope from equation (2) was negative. Using
this positive value of Zф in equation (1) results in a negative value for ΔGelec, since log[Na+]
is a negative value for concentrations below 1 M. For the MGA complexes in our study, the
slope of log Ka vs. log [Na+] is positive (see Figure B4 in Appendix) and thus results in a
positive value for ΔGelec. This suggests that the electrostatic contribution from ion release is
not favourably assisting complex formation in the case of MGA. It is important to note that
equations (1) and (2) were intended to account for the polyelectrostatic effect which suggests
that a large part of nucleic acid binding interactions involves the entropy from the
displacement of Na+ ions. In the case of MGA this effect is probably masked by the structural
stabilization outlined above.
Enthalpy-Entropy Compensation
Enthalpy-entropy compensation is seen for the binding of the different ligands to
MGA as a function of salt concentration. This phenomenon has been observed for a variety of
biomolecules (Cooper et al. 2001). The slope of a line generated by plotting entropy vs.
enthalpy at different salt concentrations for the different ligands produces a linear correlation
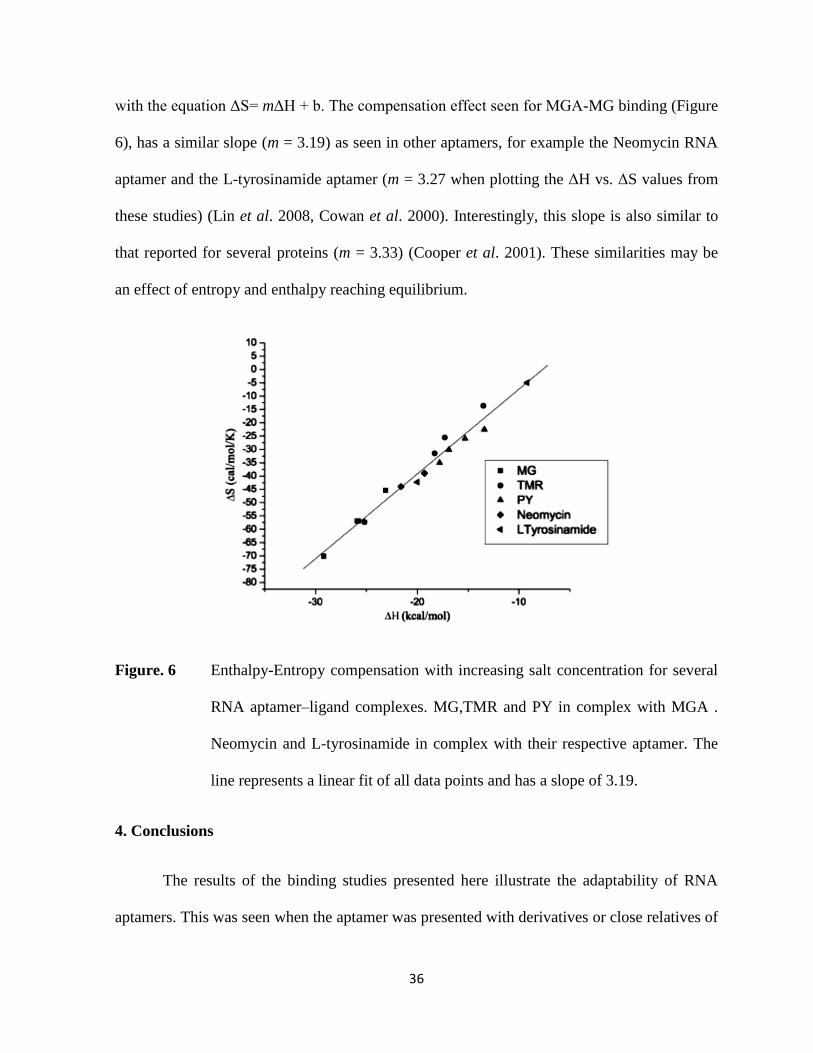
36
with the equation ΔS= mΔH + b. The compensation effect seen for MGA-MG binding (Figure
6), has a similar slope (m = 3.19) as seen in other aptamers, for example the Neomycin RNA
aptamer and the L-tyrosinamide aptamer (m = 3.27 when plotting the ΔH vs. ΔS values from
these studies) (Lin et al. 2008, Cowan et al. 2000). Interestingly, this slope is also similar to
that reported for several proteins (m = 3.33) (Cooper et al. 2001). These similarities may be
an effect of entropy and enthalpy reaching equilibrium.
Figure. 6 Enthalpy-Entropy compensation with increasing salt concentration for several
RNA aptamer–ligand complexes. MG,TMR and PY in complex with MGA .
Neomycin and L-tyrosinamide in complex with their respective aptamer. The
line represents a linear fit of all data points and has a slope of 3.19.
4. Conclusions
The results of the binding studies presented here illustrate the adaptability of RNA
aptamers. This was seen when the aptamer was presented with derivatives or close relatives of

37
the original selection target. This property of small RNAs would be a significant advantage
when it comes to responding to a changing environment and selection pressure in a pre-biotic
setting. The functional adaptability would have allowed early RNA sequence pools to quickly
diverge and expand their abilities during the establishment phase of an “RNA world” (Joyce
and Orgel 1993).
The comparison of the results from our study and the previous studies discussed above
also illustrates the necessity for taking solution conditions into account when comparing
structures and binding properties for RNA aptamers. Even though the original in vitro
selection utilized magnesium ions as buffer component, the NMR study of the MGA-MG
complex (Flinders et al. 2004) did not reveal any beneficial effect of adding Mg2+
ions to the
solution. In fact, the rapid degradation of the samples in the presence of magnesium and the
difficulty of obtaining monomeric RNA hairpins at higher salt led to the use of a low salt
buffer for the structure determination. On the other hand, the MGA-TMR complex yielded
very poor quality NMR spectra under these conditions which were puzzling at the time
because of the high affinity of TMR that was seen in binding studies. The necessity of high
salt or Mg2+
for the formation of a stable MGA-TMR complex that is revealed by the ITC
study explains these observations.
The results of the ITC binding studies illustrate the importance of the third ring for
MGA binding. MG and TMR both have a high affinity with different entropy values due to
the differences in planarity and rigidity. PY which is planar but lacks the third ring shows an
affinity similar to CV which has the third ring but is non-planar. This suggests a crucial
interaction between the third ring of the ligand and MGA. The solvent conditions affect the
affinity and specificity of MGA for the different dyes. At low salt, MGA has the highest

38
affinity for MG, while at high salt MGA has highest affinity for TMR. This is consistent with
the crystal structure of the TMR-MGA complex which shows a possible binding site for a
divalent metal (Baugh et al. 2000). These observations suggest that the optimal structure for
MGA to bind MG versus TMR might be different, with MGA bound to TMR structure
requiring added stability provided by divalent ion. To investigate this phenomena further
competition binding experiments were undertaken discussed in the following chapter.
5. Materials and Methods
Ligand Preparation
Malachite green was purchased from Sigma Aldrich (Sigma-Aldrich Corporation,
Milwaukee, U.S.A). Tetramethylrosamine was purchased from Invitrogen (Invitrogen
Corporation, California, U.S.A). Pyronin Y was purchased from Acros Organics (Acros
Organics, Geel, Belgium). Crystal Violet was purchased from Fisher Scientific (Fisher
Scientific Company, Ottawa, Ontario, Canada). Dyes were dissolved in water to make 20 mM
stock solutions. Dilutions for different buffer conditions were prepared from these stocks.
Synthesis of RNA
The MG aptamer used for ITC was prepared enzymatically from a synthetic DNA
template by using T7 RNA polymerase and unlabeled NTPs (Milligan et al. 1987, Milligan
and Uhlenbeck 1989), as described previously (Flinders et al. 2004). After transcription, the
pyrophosphate was removed by centrifugation and the RNA was collected by precipitation
with ethanol. The RNA was then separated from NTPs and aborted products on a 12% PAGE.
The resulting RNA band was then run on a HiPrep 16/10 DEAE FF anion-exchange column,
39
followed by desalting on a Hiprep 26/10 Desalting column and lyophilization to dryness. All
columns used for RNA preparation were purchased from GE Healthcare, Uppsala, Sweden.
Isothermal titration calorimetry studies
Experiments were performed at 25 oC on a MicroCal ITC 200 microcalorimeter
(MicroCal, Inc., Northampton, Massachusetts, U.S.A). The 10-15 μM RNA solution was
prepared by dissolving lyophilized RNA in pH 6.7 10 mM sodium phosphate buffer at desired
salt concentration. The 100-150 μM dye solutions were prepared by dissolving solid dye in
pH 6.7 10 mM sodium phosphate buffer at desired salt concentration. The ITC cell was filled
with RNA solution and was titrated with dye solution from the syringe. Each experiment
consisted of 16 injections of 2.54 µl every 300 s, with a first injection of 0.5 µl to a final
molar ratio of 2:1 dye:RNA. In order to account for heat of dilution of dye solution, a blank
run with buffer in cell and dye in syringe was run and subtracted from the experimental run.
All data sets were analyzed using the Origin software package provided by MicroCal and
fitted to a one set of sites binding model that assumes a single set of equivalent binding sites.
NMR Spectroscopy
NMR experiments were conducted and analyzed by Dr. Thorsten Dieckmann. All spectra were
collected on a Bruker DRX-600 spectrometer equipped with a HCN triple resonance, triple-
axis PFG probe. Quadrature detection for the indirect dimensions in multidimensional
experiments was achieved using the States-TPPI method (Marion et al. 1989). The two-
dimensional NOESY spectra (Kumar, Ernst and Wüthrich 1980) in 100% D2O were acquired
at 293 K with a mixing time of 250 ms. All NMR samples were in standard 5 mm NMR tubes

40
with final RNA concentrations of 0.8 to 1.8 mM in 10 mM potassium phosphate buffer, pH
6.0 and 10 mM KCl and a 10% excess of ligand
Fluorescence Binding Studies
MGA solutions were prepared at concentrations between 0.2 and 13 µM. To each
solution dye was added to get a final concentration of 1 µM. The series had a final buffer
concentration of 50 mM phosphate buffer, 150 mM NaCl at pH 6.7. The sample fluorescence
was measured on a NanoDrop 3300 fluorometer (Thermo Fisher Scientific Company, Ottawa,
Ontario, Canada). For MG and CV, there was no detectable fluorescence in the absence of
RNA. The emission maxima were 656 nm and 646 nm, respectively, when bound to the
aptamer. The fluorescence increase was measured at 656 nm for MG and 646 nm for CV. For
TMR and PY significant fluorescence was detected in the absence of RNA, therefore a ratio
of bound fluorescence and unbound fluorescence was used. TMR bound fluorescence was
measured at 584 nm and unbound was measured at 576 nm. PY bound fluorescence was
measured at 576 nm and unbound was measured at 566 nm. The resulting curves were fitted
to the equation y = (Bmax*x)/(Kd+x) using Origin 8.0 (OriginLab Corporation, Northampton,
U.S.A).
Equilibrium dialysis experiments
Equilibrium dialysis was conducted using Dispo Equilibrium Dialyzer tubes (Harvard
Apparatus, Massachusetts, U.S.A). Both dye and RNA were dissolved in a 100 mM
phosphate buffer, 50 mM KCl, pH 6.7 buffer. The tubes were prepared with MGA (5 µM) in
the receptor chamber and a range of dye concentration (5 µM -20 µM) were added to the
ligand chamber. After 32 hours of equilibration in the dark at room temperature with gentle

41
agitation, a 50 µl sample was taken from each chamber and added to 450 µl acetic acid.
Absorbance was measured at 546 nm on a Cary 4000 UV/Visible Spectrometer (Agilent
Technologies). The binding curves were fitted to the equation y = (Bmax*x)/(Kd+x) using
Origin 8.0 (OriginLab Corporation, Northampton, U.S.A).

42
Chapter 3: Further exploration of the malachite green RNA aptamer binding pocket
1. Introduction
Competition or displacement binding isothermal titration calorimetry (ITC) studies
involve studying the interaction of a ligand “A” titrated into a receptor that is occupied by a
ligand “B”. This method has multiple applications including determining if both ligands have
the same binding mode, characterizing a high affinity binding ligand and observing
conformation flexibility.
The model used to fit competitive binding ITC data has been previously reported for
multiple injections (Wang 1995, Sigurskjold 2000). The report for continuous injection was
verified using simulated data and binding of cytidine monophosphate to RNaseA (Markova
and Hallen 2004). The continuous injection method has several advantages over multiple
injections. The chief benefit is the time involved in the experiments, continuous injections
require significantly less time. The increase in speed of experiment does not decrease the
amount of points collected along the isotherm curve, this method allows for more points along
the isotherm curve.
The competition binding ITC has been used for studying interleukin receptor binding
(Lupardus, Birnbaum and Garcia 2010), as well as other receptor ligand interactions. In these
cases a low affinity ligand is first bound to lower the affinity of a high affinity ligand to a
measurable affinity. The conformation flexibility and binding mode of different ligands to
cytochrome p450 has been investigated using competition binding. This along with NMR
studies concluded that using the same residues cytochrome p450 creates two distinct binding
niches depending on the ligand (Muralidhara, Negi and Halpert 2007).

43
Competitive binding ITC was selected in order to further explore the changes that
MGA undergoes when accommodating different ligands inside a free or occupied binding
pocket. The previous chapter summarized the investigation of the binding of MG derivatives
to MGA. These derivatives included pyronin Y (PY), crystal violet (CV) and
tetramethylrosamine (TMR). Figure 1 shows the chemical structures of related dyes that bind
to MGA. Pyronin Y (PY) has a planar structure similar to TMR, but lacks the third ring, while
crystal violet (CV) has a non-planar structure similar to MG, with an extra dimethylamine
group on ring C.
Figure 1. Chemical structures of dyes that bind to MGA A) MG (rings are labeled A,B,C) B)
CV C) TMR D) PY.
Initial binding studies illustrated that the MGA binding pocket has the ability to adapt
to recognize these related molecules (Baugh, Grate and Wilson 2000). This is consistent with
the concept of adaptive binding. MG and TMR have higher affinities to MGA than CV and
PY under all tested conditions. A comparison of our recent isothermal titration calorimetry
studies (Bernard Da Costa and Dieckmann 2011) with the earlier binding studies by Baugh et
al. that used a competition binding assay (Baugh et al. 2000) indicated that there might be
differences in the way the free RNA and an aptamer with an already occupied binding site
interact with a potential ligand. The work done in the previous chapter showed that MGA

44
changes its preference from the original ligand MG to TMR in the presence of Mg2+
. This
observation emphasizes the environment dependent character of RNA-ligand interactions.
Two structures of MGA have been determined to date; a crystal structure of the
aptamer bound to tetramethylrosamine (TMR) (Baugh et al. 2000) and a solution NMR
structure of the complex with MG (Flinders et al. 2004). The MGA binding pocket consists of
a base quadruple (C7, G24, G29, A31) and a Watson-Crick base pair (G8, C28) with two base
triples (C10, G23, A27 and U11, A22, A26) and a U turn motif providing the supporting
frame work. A comparison of the two MGA structures in complex with MG and TMR
(Figure 2) shows that the most significant difference lies in the stacking patterns of the RNA
bases at the top and bottom of the pocket. The G8:C28 base pair and the upper part of the
pocket are rotated in the MG complex relative to their position the TMR complex. This leads
to an un-stacking of G8 and ring A of the ligand thereby making room for the non-planar
structure of MG. Another important element of the binding pockets is A30 which stacks with
ring C of the ligand. A30 is part of a bulge/loop structure consisting of A30, A31, U32 and
G33. In the crystal structure a Sr2+
ion is positioned to interact with the phosphate oxygen
atoms of A30, A31 and G33, whereas no divalent ions were present in the buffer used for the
NMR studies.

45
Figure 2. A) Secondary structure schematic of MGA with MG shown as green triangle. B)
Superposition of the MGA NMR structure with bound MG (Green, PDB ID 1Q8N)
and the MGA crystal structure with bound TMR (Purple, PDB ID 1F1T). The purple
spheres indicate the position of Sr2+
ions in crystal structure. C) Detail view of the
binding pocket of the superimposed structures; top : back view, bottom : front view.
Figure was generated using UCSF Chimera (Pettersen et al. 2004).
We have conducted competition binding experiments where PY or CV were pre-
bound to MGA (MGAPY and MGACV) while MG or TMR were titrated in. These experiments
illustrate how the aptamer adapts to a ligand when the binding pocket is already occupied by
another small molecule
2. Results and Discussion
Characterization of free RNA by NMR spectroscopy
One of the key principles of adaptive binding in RNA aptamers is the absence of
structure in the ligand- free RNA binding pocket. In order to establish if the MGA follows this
46
principle, we analyzed the amount of structure present in the aptamer RNA in absence of the
ligand by high resolution NMR spectroscopy (Figure 3). Both the original aptamer sequence
designed by Grate et al. and a modified version that was used for the NMR studies with an
unsymmetrical stem and a UUCG tetraloop instead of the GAAA loop were prepared and
analyzed by homonuclear NMR spectroscopy. Both sequences behaved identically. In the
absence of ligand, the spectra acquired in H2O indicate that the first 6 base pairs in stem 1 and
the stem-loop starting at G12:C21 are formed and contain stable base pairs. This is confirmed
by the observation of sequential NOE patterns typical for A-form RNA and the
UUCG/GNRA hairpin loops in NOESY spectra acquired in D2O and H2O. The signals
originating from nucleotides in the internal loop/ligand binding site are heavily overlapped
and show very few NOEs. All visible NOEs between aromatic protons originate from
nucleotides in the two stem regions. The signal dispersion and the amount of NOEs observed
increases drastically after addition of either malachite green or tetramethylrosamine ligand
(Figure 3 C and D).
The analysis of the NOE data indicates that the aptamer does not have a preferred
structure for most nucleotides in the internal loop in the absence of MG or TMR. However,
there is evidence for the formation of the G29:C7 base pair at the top of stem 1. Stacking
NOEs between the C6:G33 base pair and a purine residue that is base paired to a cytidine
nucleotide suggest that this base pair, which becomes part of the base quadruple formed by
C7, G29, G24 and A31, is already preformed in the ligand free RNA. The structures of the
MGA-MG and MGA-TMR complexes (Figure 2) show that the binding pocket adopts a
somewhat different structure when binding MG (a non-planar ligand) versus TMR (a ligand
with planar rings A + B). Since part of the base quadruple is pre-formed in the free form and
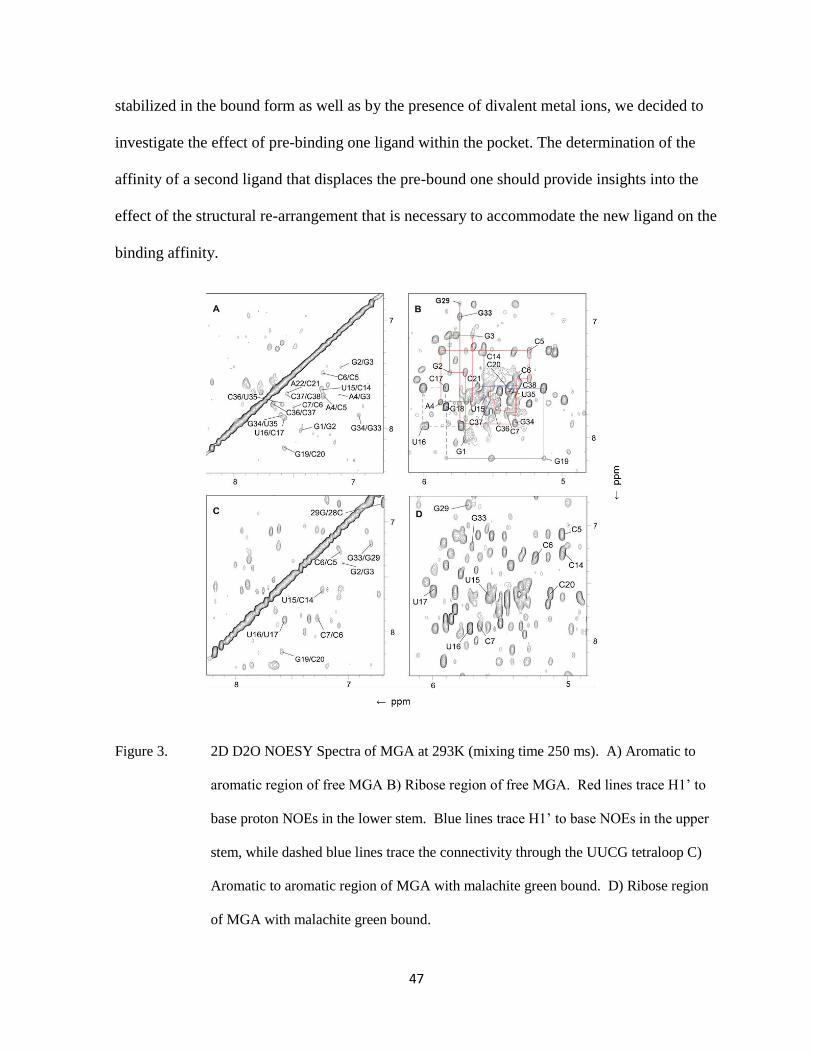
47
stabilized in the bound form as well as by the presence of divalent metal ions, we decided to
investigate the effect of pre-binding one ligand within the pocket. The determination of the
affinity of a second ligand that displaces the pre-bound one should provide insights into the
effect of the structural re-arrangement that is necessary to accommodate the new ligand on the
binding affinity.
Figure 3. 2D D2O NOESY Spectra of MGA at 293K (mixing time 250 ms). A) Aromatic to
aromatic region of free MGA B) Ribose region of free MGA. Red lines trace H1’ to
base proton NOEs in the lower stem. Blue lines trace H1’ to base NOEs in the upper
stem, while dashed blue lines trace the connectivity through the UUCG tetraloop C)
Aromatic to aromatic region of MGA with malachite green bound. D) Ribose region
of MGA with malachite green bound.
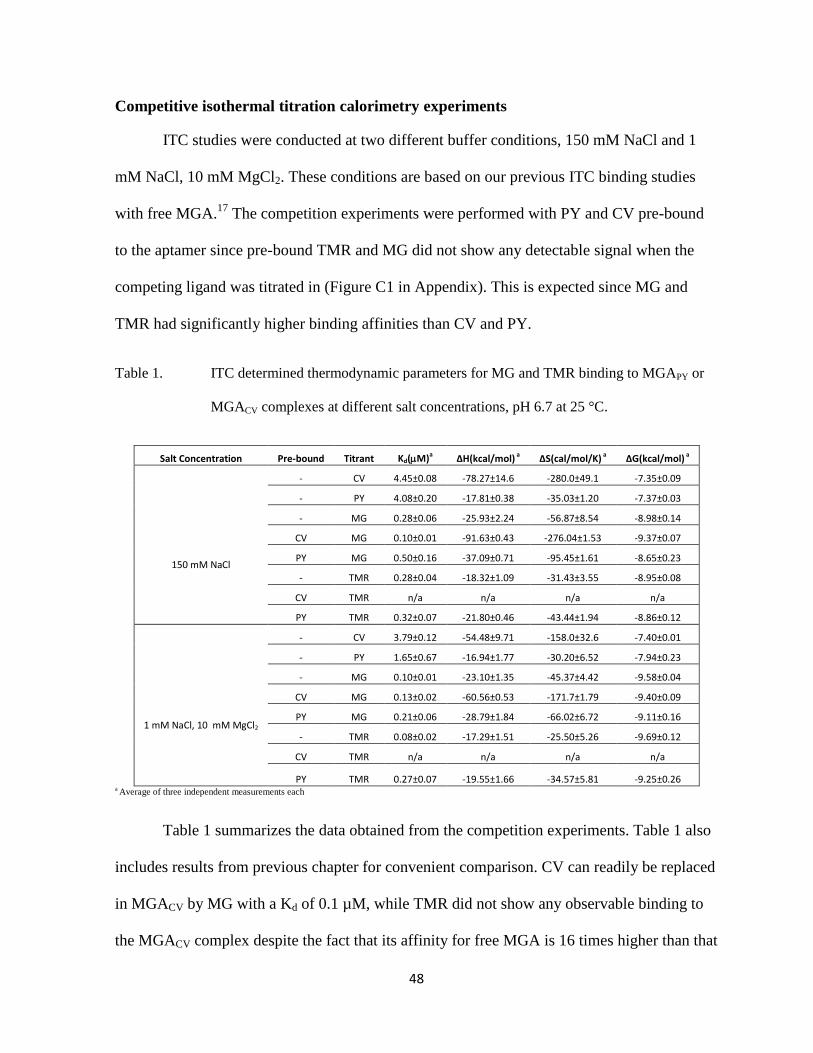
48
Competitive isothermal titration calorimetry experiments
ITC studies were conducted at two different buffer conditions, 150 mM NaCl and 1
mM NaCl, 10 mM MgCl2. These conditions are based on our previous ITC binding studies
with free MGA.17
The competition experiments were performed with PY and CV pre-bound
to the aptamer since pre-bound TMR and MG did not show any detectable signal when the
competing ligand was titrated in (Figure C1 in Appendix). This is expected since MG and
TMR had significantly higher binding affinities than CV and PY.
Table 1. ITC determined thermodynamic parameters for MG and TMR binding to MGAPY or
MGACV complexes at different salt concentrations, pH 6.7 at 25 °C.
Salt Concentration Pre-bound Titrant Kd(M)a ΔH(kcal/mol) a ΔS(cal/mol/K) a ΔG(kcal/mol) a
- CV 4.45±0.08 -78.27±14.6 -280.0±49.1 -7.35±0.09
- PY 4.08±0.20 -17.81±0.38 -35.03±1.20 -7.37±0.03
150 mM NaCl
- MG 0.28±0.06 -25.93±2.24 -56.87±8.54 -8.98±0.14
CV MG 0.10±0.01 -91.63±0.43 -276.04±1.53 -9.37±0.07
PY MG 0.50±0.16 -37.09±0.71 -95.45±1.61 -8.65±0.23
- TMR 0.28±0.04 -18.32±1.09 -31.43±3.55 -8.95±0.08
CV TMR n/a n/a n/a n/a
PY TMR 0.32±0.07 -21.80±0.46 -43.44±1.94 -8.86±0.12
- CV 3.79±0.12 -54.48±9.71 -158.0±32.6 -7.40±0.01
- PY 1.65±0.67 -16.94±1.77 -30.20±6.52 -7.94±0.23
1 mM NaCl, 10 mM MgCl2
- MG 0.10±0.01 -23.10±1.35 -45.37±4.42 -9.58±0.04
CV MG 0.13±0.02 -60.56±0.53 -171.7±1.79 -9.40±0.09
PY MG 0.21±0.06 -28.79±1.84 -66.02±6.72 -9.11±0.16
- TMR 0.08±0.02 -17.29±1.51 -25.50±5.26 -9.69±0.12
CV TMR n/a n/a n/a n/a
PY TMR 0.27±0.07 -19.55±1.66 -34.57±5.81 -9.25±0.26 a Average of three independent measurements each
Table 1 summarizes the data obtained from the competition experiments. Table 1 also
includes results from previous chapter for convenient comparison. CV can readily be replaced
in MGACV by MG with a Kd of 0.1 µM, while TMR did not show any observable binding to
the MGACV complex despite the fact that its affinity for free MGA is 16 times higher than that
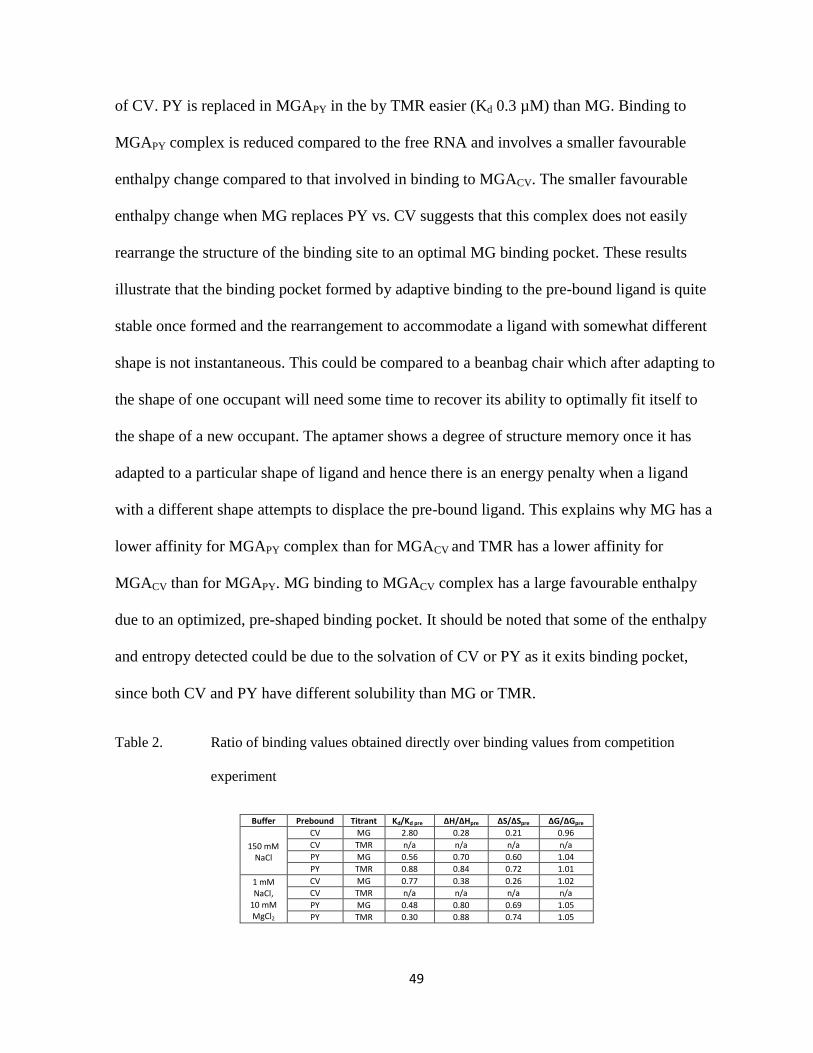
49
of CV. PY is replaced in MGAPY in the by TMR easier (Kd 0.3 µM) than MG. Binding to
MGAPY complex is reduced compared to the free RNA and involves a smaller favourable
enthalpy change compared to that involved in binding to MGACV. The smaller favourable
enthalpy change when MG replaces PY vs. CV suggests that this complex does not easily
rearrange the structure of the binding site to an optimal MG binding pocket. These results
illustrate that the binding pocket formed by adaptive binding to the pre-bound ligand is quite
stable once formed and the rearrangement to accommodate a ligand with somewhat different
shape is not instantaneous. This could be compared to a beanbag chair which after adapting to
the shape of one occupant will need some time to recover its ability to optimally fit itself to
the shape of a new occupant. The aptamer shows a degree of structure memory once it has
adapted to a particular shape of ligand and hence there is an energy penalty when a ligand
with a different shape attempts to displace the pre-bound ligand. This explains why MG has a
lower affinity for MGAPY complex than for MGACV and TMR has a lower affinity for
MGACV than for MGAPY. MG binding to MGACV complex has a large favourable enthalpy
due to an optimized, pre-shaped binding pocket. It should be noted that some of the enthalpy
and entropy detected could be due to the solvation of CV or PY as it exits binding pocket,
since both CV and PY have different solubility than MG or TMR.
Table 2. Ratio of binding values obtained directly over binding values from competition
experiment
Buffer Prebound Titrant Kd/Kd pre ΔH/ΔHpre ΔS/ΔSpre ΔG/ΔGpre
150 mM NaCl
CV MG 2.80 0.28 0.21 0.96
CV TMR n/a n/a n/a n/a
PY MG 0.56 0.70 0.60 1.04
PY TMR 0.88 0.84 0.72 1.01
1 mM NaCl,
10 mM MgCl2
CV MG 0.77 0.38 0.26 1.02
CV TMR n/a n/a n/a n/a
PY MG 0.48 0.80 0.69 1.05
PY TMR 0.30 0.88 0.74 1.05

50
In order to illustrate the differences between combinations of complex formation, we
have calculated the ratios of the thermodynamic parameters for MG or TMR binding to free
MGA (Bernard Da Costa and Dieckmann 2011) , over the values for MG or TMR binding to
MGApre (Table 2). For Kd a ratio above one means that the ligand has higher affinity for
MGApre while below one indicates that the ligand has higher affinity for free MGA. For ΔH a
ratio above one indicates the ligand has larger favourable enthalpy change for interactions
with MGA while a value below one means that the ligand has larger favourable enthalpy
change when binding to MGApre. For ΔS a ratio above one means ligand has a larger
unfavourable entropy contribution when binding to MGA, while values below one indicate
that the ligand has larger unfavourable entropy contributions when binding to MGApre.
Interestingly, the ratio for ΔG is close to one in all cases; displaying an example of entropy-
enthalpy compensation29
. This phenomenon suggests that biomolecules work within a limited
free energy window, where favourable enthalpy interactions are balanced by the necessary
unfavourable entropy needed to make interactions
TMR binding to MGAPY has values close to those for binding to free MGA (ratio is
close to one) at 150 mM NaCl. However, in the presence of 10 mM Mg2+
TMR binding to
MGAPY is slightly reduced. This suggests that the stabilization of the pocket provided by
Mg2+
reduces the ability of the aptamer to accommodate TMR.
MG binding to MGACV has a significantly higher affinity compared to binding to free
MGA at 150 mM NaCl. This is accompanied by a large increase in favourable enthalpy
change and unfavourable entropy change. However, in the presence of 10 mM Mg2+
the
binding affinity is similar to binding affinity to free MGA with a comparable enthalpy change
and a slight increase in unfavourable entropy. The increase in unfavourable entropy in this

51
case is consistent between the two conditions suggesting it may have more to do with the
solvation of CV than the binding event. The increase in binding affinity seen at 150 mM NaCl
suggests that MG can interact more efficiently with a pre-formed binding pocket if the
previous ligand had a similar shape as in the case of CV. In the presence of Mg2+
, which
stabilizes the internal loop region that includes the binding pocket, the RNA loses some of its
plasticity and hence the ability of MG to replace CV is reduced. This observation agrees with
our previous report that MGA changes its ligand preference from MG to TMR in the presence
of 10 mM Mg2+
.
MG binding to MGAPY shows a decrease in affinity under both buffer conditions
compared to binding to MGA (0.56 and 0.48). The favourable enthalpy at both buffer
conditions was comparable to MGA binding but there is an increase in unfavourable entropy
(0.60 and 0.69). Taken together with the lower binding affinity this suggests that MGAPY has
a pocket that doesn’t allow optimal interactions as seen in MG binding MGACV.
Computational Investigation
Computational methods have been used to probe conformation flexibility in
biomolecules along with other methods (Muralidhara et al. 2007). These simulations provide
insight into the subtle changes in conformation that accompany binding. An unpublished
communication from Dr. Charles Wilson used molecular dynamic simulation to supplement
kinetic studies revealing that the interactions that unraveled at 500K in simulation were the
same interactions that were least formed in folding transition state ensemble. These residues
whose interactions with ligand were least formed were identified as A30, A9 and G24. The
simulation was conducted with potassium ions and using AMBER. Based on our results that

52
reveal the importance of the role of Mg2+
, we have attempted to repeat the simulations using
magnesium ions.
The NMR structure of MGA was used in the simulations since it represents the
solution structure of the aptamer. The derivatives were placed in MGA and the solution was
heated to 500K. The complexes were then equilibrated at 500K. Equilibration was determined
to be complete when the potential energy of the system plateaued (Figure C2 in Appendix).
Examining the equilibrated structures shows that the distortion of the binding pocket is
correlated with the binding affinity to ligand. MGACV has the most distorted binding pocket
followed by MGAPY, while MGATMR and MGAMG have the least distortion from reported
binding pocket (Figure 4). Computational experiments have to be continued to yield more
insights into the unfolding process as the ligand leaves binding pocket, these experiments are
discussed in the following section.
Figure 4. MGA NMR structure equilibrated at 500K complexed with A) CV B) MG C)
PY D) TMR. Figure was generated using UCSF Chimera (Pettersen et al.
2004).

53
3. Conclusions and Future Work
In summary, the ITC experiments described here show that MGA maintains a certain
level of structural memory of the initial target it binds, even when challenged with a
competing ligand that has a higher affinity for the free RNA than the pre-bound one. The
plasticity of the free RNA aptamer allows it to adapt to somewhat differently shaped ligands,
planar and non-planar tri-phenyl dye derivatives in this case. However, once the RNA has
adopted the optimal fold for a specific shape of ligand it maintains this fold at least partially
for some time after the ligand leaves the pocket. This results in an energy penalty for binding
a differently shaped ligand, because the pocket needs to be partially unfolded in order to
accommodate the new binding partner.
This effect is most likely due to the ligand bound structure of the RNA representing an
energy minimum in the RNA folding pathway. Hence the molecule becomes kinetically
trapped in the adopted conformation and requires additional energy and time to return to an
unfolded state that can readily adapt to a different ligand. Fully characterizing this behaviour
is critical for understanding the way in which small molecules interact with RNA aptamers,
for example in biosensors where initial binding of a lower affinity ligand can potentially
prevent detection of a high affinity target or in drug development where interactions between
different potential ligands can reduce the efficiency of an RNA targeting drug in vivo.
The results presented here also explain the apparent contradiction between the binding
affinities for MG (Kd = 800 nM at 10 mM Mg2+
) and CV (Kd > 1mM at 10 mM Mg2+
)
reported (Baugh et al. 2000) and our recent ITC studies (Kd = 100 nM for MG and 3.8 μM for
CV at 10 mM Mg2+
) (Bernard Da Costa and Dieckmann 2011). The earlier affinities were
determined indirectly by measuring changes in TMR fluorescence anisotropy in competition

54
experiments. The data presented here shows that a planar ligand like TMR cannot easily
replace a non-planar ligand like CV during the time-frame of a typical binding experiment
(approximately fifteen minutes for the ITC studies) and thus the Kd values determined from
the competitive fluorescence studies significantly underestimate the affinity of MG and CV.
This possibility needs to be taken into account when designing experiments that characterize
RNA aptamer –ligand interactions.
Further ITC experiments will be conducted to examine the presence of a specific Mg2+
binding site. This will be done by having MGA in a buffer without Mg2+
placed in the cell and
titrating Mg2+
into cell. This experiment will help confirm the role of Mg2+
suggested by our
recent work. Further computational experiments will involve cooling down complexes
currently at 500 K down to 300 K. This annealing process should allow for MGA to adapt to
its ligand. After the complexes are equilibrated at 300K it will be used for two separate
experiments. The first experiment will involve removal of the ligand and equilibration of the
empty MGA to observe how the pocket adjusts after ligand is removed. The second
experiment will involve the slow extraction of the ligand and determination of the energy
involved in extracting the ligand. This energy can be used to determine the affinity of the
ligand for the complex (Lee and Olson 2006, Villa, Wohnert and Stock 2009). The affinity
determined will then be compared to the affinities we have previously determined by ITC.
This approach will also allow for the examination of the unfolding process more closely as the
force used to pull ligand can be adjusted and correlated with the interactions with MGA that
are broken.
55
4. Materials and Methods
RNA preparation
The RNA used for ITC and NMR spectroscopy was prepared enzymatically from a
synthetic DNA template by using T7 RNA polymerase and unlabeled NTPs (Milligan et al.
1987, Milligan and Uhlenbeck 1989). After transcription magnesium pyrophosphate was
removed by centrifugation and the RNA was collected by precipitation with ethanol. The
RNA was then separated from NTPs and aborted transcription products by PAGE using a
12% gel. The RNA product was then extracted from the gel by electro-elution and run on a
HiPrep 16/10 DEAE FF anion-exchange column (GE Healthcare, Uppsala, Sweden), followed
by salt removal on a Hiprep 26/10 Desalting column (GE Healthcare, Uppsala, Sweden) and
lyophilization to dryness.
NMR samples for studying exchangeable protons were prepared by dissolving the
lyophilized RNA in a 90% H2O / 10% D2O solution. Samples used for studying non-
exchangeable protons were prepared by dissolving the RNA in 99.996% D2O (Cambridge
Isotopes, Andover, Massachusetts, U.S.A). All NMR samples were 500 μL in standard 5 mm
NMR tubes with final RNA concentrations of 0.8 to 1.8 mM in 10 mM KCl and 10 mM
potassium phosphate buffer, pH 5.8.
ITC studies
Experiments were performed at 25 °C on a MicroCal ITC 200 microcalorimeter
(MicroCal, Inc., Northampton, Massachusetts, U.S.A). The 10–15 μM RNA solution was
prepared by dissolving lyophilized RNA in 10 mM sodium phosphate buffer, pH 6.7 at the
desired salt concentration. The 100–150 μM dye solutions were prepared by dissolving solid
56
dye in 10 mM sodium phosphate buffer, pH 6.7 at the desired salt concentration. RNA and
dye for the preparation of pre-bound samples (MGACV or MGAPY) were mixed in a 1:2 ratio.
The ITC cell was filled with the pre-bound RNA solution and titrated with the second ligand
(MG or TMR) solution from the syringe. Each experiment consisted of a single injection over
396 sec at a continuous flow of 0.1 μL/s to a final molar ligand /RNA ratio of 1.5. In order to
account for heat of dilution of dye solution, a blank run with the pre-bound dye buffered in
cell and second dye in syringe was run and subtracted from the experimental run. The validity
of the data obtained by continuous injection was verified by comparing the data obtained via
the standard multiple injection method with a corresponding continuous injection set (Table
C1 in Appendix). No significant differences for binding constants or thermodynamic
parameters were found. All data sets were analyzed using the Origin software package
provided by MicroCal and fitted to a competitive binding model.
NMR experiments
NMR experiments were conducted and analyzed by Dr. Thorsten Dieckmann. All
spectra were collected on a Bruker DRX-600 spectrometer equipped with a HCN triple
resonance, triple-axis PFG probe. Solvent suppression for samples in 90% H2O / 10% D2O
was achieved using 11-spin echo pulse sequences (Sklenar and Bax 1987) or WATERGATE
(Piotto, Saudek and Sklenar 1992). Quadrature detection for the indirect dimensions in
multidimensional experiments was 2D CITY-TOCSY (Briand and Ernst 1991) with a mixing-
time of 50 ms, a DQF-COSY (Piantini, Sørensen and Ernst 1982), and NOESY spectra with
mixing times of 250, 200, and 50 ms in 100% D2O were measured at 293 K. The spectra were
analyzed and assigned as previously described (Flinders et al. 2004).

57
Computational experiments
Computational experiments were conducted with the guidance of Dr. Pierre-Nicholas
Roy, using a method similar to that used by Jason Tao to explore MG derivatives in MGA,
these included MGOAc, MGOH and MGO. This involved inserting the derivative into the
NMR structure of MGA using xleap. Mg2+
ions were added using xleap before solvating the
complex in a 30Ǻ rectangular water box. The system was then minimized using 1000 steps
with the solute held fixed, followed by a 10 ps MD at 300 K while placing 25 kcal/mol Ǻ
restraints on all solute atoms and counter ions. Then the restraints were reduced gradually to 0
kcal/mol Ǻ. The system was then annealed by increasing temperature gradually (10 K per 10
ps) to 500 K. The system was then equilibrated at 500 K for 30 ps. Computation were all
performed using AMBER either on sharcnet.ca or roycluster.uwaterloo.ca.

58
Chapter 4: Selection of a Fluorescein Binding Aptamer
1. Introduction
The word aptamer is derived from the latin aptus meaning to fit and mer the unit used
to measure the length of nucleotides (Ellington and Szostak 1990). Naturally occurring
riboswitches have been identified as aptamers (Winkler, Cohen-Chalamish and Breaker 2002).
However, many aptamers, including the first biomolecule to be identified as an aptamer
(Ellington and Szostak 1990), have been artificially selected through a method known as
Systematic Evolution of Ligands by Exponential Enrichment (SELEX) (Ellington and Szostak
1990, Tuerk and Gold 1990, Proske et al. 2005).
SELEX
Briefly, this involves starting with a pool of random sequences, applying a selection
pressure (usually a column with a ligand bound), enriching the pool by polymerase chain
reaction (PCR) of the nucleic acid sequences that survive the first round of selection pressure.
This is followed by repeating the process on the new pool (Figure 1). This is repeated until the
pool converges to a few unique sequences that have a high affinity for the target. This
technique has been used to select aptamers for a wide variety of targets from small molecules
to whole cells (Barbas et al. 2010, Shi, Hoffman and Lis 1999, Holeman et al. 1998).
The use of the SELEX method has itself evolved and may include multiple selection
pressures and negative selection pressures (Stoltenburg, Reinemann and Strehlitz 2007). The
selection pressure step has expanded from simple columns to include magnetic beads (Nutiu
and Li 2005), capillary electrophoresis (Mendonsa and Bowser 2004), flow cytometry (Blank
et al. 2001), surface plasmon resonance (Misono and Kumar 2005), and in silico methods

59
(Chushak and Stone 2009). There are currently two aptamer databases that are attempting to
amalgamate all the data available to increase the understanding of the SELEX process
(http://aptamer.icmb.utexas.edu/ and http://aptamer.freebase.com/).
Figure 1 Schematic of SELEX procedure. Red arrows indicate DNA SELEX. Green
arrows indicate RNA SELEX.
RNA versus DNA Aptamer
Both DNA and RNA aptamers show robust binding affinities for various targets
(Neves et al. 2010, Baugh, Grate and Wilson 2000, Dieckmann et al. 1995). There are two
key differences in the building blocks of DNA and RNA. Firstly, as the name suggests RNA
has a ribose sugar moiety while DNA has a deoxyribose, in which the 2’ OH is absent (Figure
2a). Secondly, DNA uses thymine as a pyrimidine base instead of uracil (Figure 2b). The lack
of the 2’ OH gives DNA greater stability, while in RNA this group can participate in a self
cleavage reaction. The lack of the 2’ OH also leads to a difference in preferred sugar

60
puckering which affects the overall structure DNA forms.
Figure 2. Chemical structure representations of A) Deoxyribose and Ribose B) Thymine
and Uracil.
The effect of these differences can be seen in DNA and RNA aptamers that bind the
same ligand. These ligands include lysozyme (Potty et al. 2011), thrombin (Long et al. 2008),
human immunodeficiency virus trans-acting responsive element (HIV TAR) (Darfeuille et al.
2006), hemin (Liu et al. 2009a), interferon γ (Min et al. 2008), vascular endothelial growth
factor (VEGF) (Ng et al. 2006), and dopamine (Walsh and DeRosa 2009). In the case of
lysozyme, HIV TAR, VEGF and dopamine, the selected DNA aptamer is the analog of the
RNA selected aptamer. The lysozyme DNA aptamer has a lower affinity than the RNA
aptamer but is less sensitive to salt concentration. The lysozyme RNA aptamer Kd increases
270 fold when concentration of NaCl in buffer is increased by 20 mM, while the DNA
aptamer Kd only increases 2 fold. This suggests that electrostatic contribution is significant in
the lysozyme RNA aptamer (Potty et al. 2011). Regardless of its lower affinity, the lysozyme
DNA aptamer has been used as an electrochemical sensor (Li et al. 2010) and for the
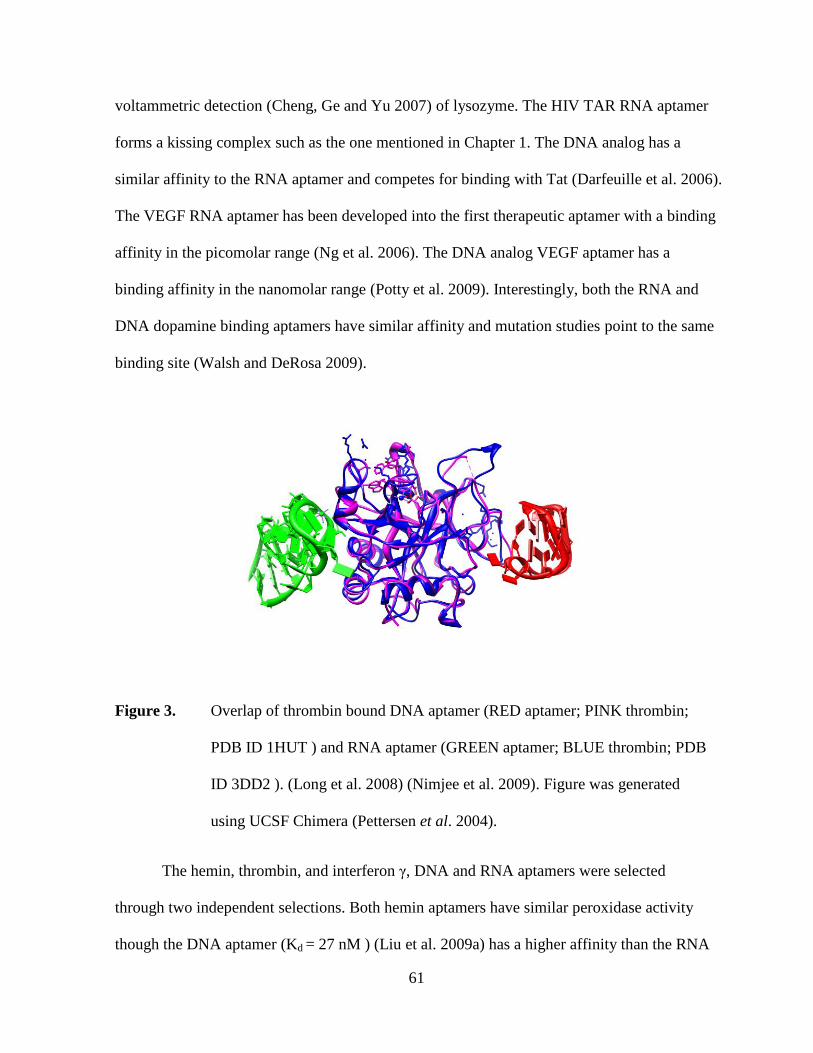
61
voltammetric detection (Cheng, Ge and Yu 2007) of lysozyme. The HIV TAR RNA aptamer
forms a kissing complex such as the one mentioned in Chapter 1. The DNA analog has a
similar affinity to the RNA aptamer and competes for binding with Tat (Darfeuille et al. 2006).
The VEGF RNA aptamer has been developed into the first therapeutic aptamer with a binding
affinity in the picomolar range (Ng et al. 2006). The DNA analog VEGF aptamer has a
binding affinity in the nanomolar range (Potty et al. 2009). Interestingly, both the RNA and
DNA dopamine binding aptamers have similar affinity and mutation studies point to the same
binding site (Walsh and DeRosa 2009).
Figure 3. Overlap of thrombin bound DNA aptamer (RED aptamer; PINK thrombin;
PDB ID 1HUT ) and RNA aptamer (GREEN aptamer; BLUE thrombin; PDB
ID 3DD2 ). (Long et al. 2008) (Nimjee et al. 2009). Figure was generated
using UCSF Chimera (Pettersen et al. 2004).
The hemin, thrombin, and interferon γ, DNA and RNA aptamers were selected
through two independent selections. Both hemin aptamers have similar peroxidase activity
though the DNA aptamer (Kd = 27 nM ) (Liu et al. 2009a) has a higher affinity than the RNA

62
aptamer (Kd 0.8 µM) (Liu et al. 2009b). The presence of peroxidase activity in both cases
supports the idea that RNA and DNA are capable of catalysis given the right ligand. The
crystal structures of both DNA and RNA aptamers bound to thrombin have been solved.
These reveal that the thrombin RNA and DNA aptamers bind at different sites and have
different binding interactions (Figure 3) (Long et al. 2008, Nimjee et al. 2009). While no
crystal structure is available for the interferon γ aptamers, based on their sequences it is safe
to conclude that they have different binding modes. The interferon γ RNA aptamer sequence
(Kubik et al. 1997) is
5’GGAGGACGAUGCGGACACCGUUAAUCUGAGGCCCUGUCCUAUUCCUUCACGCCUCAGA3’ while the
DNA aptamer sequence (Balasubrananian et al. 1998) is 5’GGGGTTGGT TGTGTTGGGTGTTGTGT3’.
An electrochemical detection of interferon-γ with these aptamers by Ban C. et al. showed that
the RNA aptamer had an order of magnitude lower detection limit than the DNA aptamer
(Min et al. 2008). Briefly, this involved attaching aptamer to a gold electrode and monitoring
the charge transfer resistance. This value is correlated with the amount of ligand interaction
with the electrode surface, which is related to affinity to the aptamer.
The difference in sequence and binding seen from selections of RNA and DNA
aptamers compared to using analogs of a selected aptamer suggest that more data is required
to fully understand the correlation between RNA and DNA sequence structure-function
relationship. This was the rationale for trying both an RNA and DNA aptamer selection.
Fluorescein as target
The aptamer target was selected in order to provide the possibility for practical
applications. One of the practical applications of aptamers, as mentioned in Chapter 1, is as

63
signalling molecules. Detection methods for monitoring signals include electrochemical (Min
et al. 2008), colorimetric (Stojanovic and Landry 2002), piezoelectric (Bini et al. 2007), and
fluorescence (Stojanovic and Kolpashchikov 2004). Two examples of the ways to use
fluorescence as detection method include the use of the malachite green RNA (MGA) aptamer
chimeric probe for the detection of adenosine and the binary MGA aptamer for the detection
of target nucleotide sequences. In the chimeric probe, the MGA is appended to an adenosine
aptamer. The addition of a bridge sequence complementary to a part of MGA and part of the
adenosine aptamer keeps secondary structure of MGA from folding and binding MG. The
presence of adenosine causes the interaction with the bridge sequence to weaken and allows
MGA to fold and bind MG, produces a detectable signal (Figure 4a) (Xu and Lu 2010). In the
binary probe, MGA is split in two with each half attached to part of the target sequence.
Binding to the target sequence brings the two halves together which allows for the binding of
MG which produces a detectable signal (Figure 4b) (Kolpashchikov 2005).
Fluorescein has a significantly higher quantum yield of fluorescence than MG. MG
has very little fluorescence when free and increases when bound making it useful as sensor in
conjunction with MGA. Fluorescein is fluorescent when free in solution, while fluorescence is
quenched by guanosine when bound to a DNA aptamer (Unruh et al. 2005). The acetylated
fluorescein molecule has virtually no fluorescence (Figure 5). We have conducted a selection
for an aptamer targeted at fluorescein diacetate (FDA) to add to the repertoire of signalling
molecules and further explore RNAs capacity for catalysis. The application here would be to
use FDA in conjunction with a catalytic aptamer to produce detectable fluorescence signal.

64
Figure 4 Schematic of different uses of the MGA. A) MGA (green line) attached to
adenosine aptamer (red line) with the bridge sequence (purple line); adenosine
(red pentagon) is added then MG (green triangle) is bound and fluorescence is
produced. B) Part of target sequence (blue line) attached to half of MGA
(green line), both target sequences binding to target brings the MGA halves
together to allow for MG binding and fluorescence produced.
Figure 5 Chemical structure of A) Fluorescein B) Fluorescein diacetate
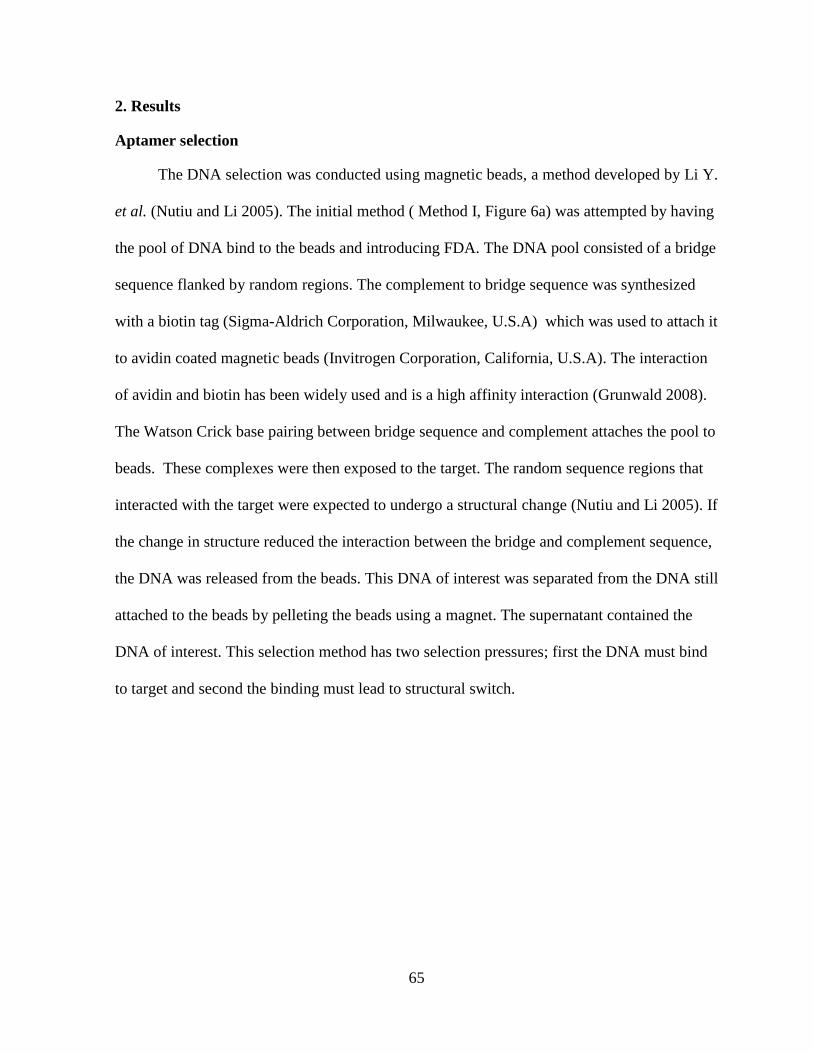
65
2. Results
Aptamer selection
The DNA selection was conducted using magnetic beads, a method developed by Li Y.
et al. (Nutiu and Li 2005). The initial method ( Method I, Figure 6a) was attempted by having
the pool of DNA bind to the beads and introducing FDA. The DNA pool consisted of a bridge
sequence flanked by random regions. The complement to bridge sequence was synthesized
with a biotin tag (Sigma-Aldrich Corporation, Milwaukee, U.S.A) which was used to attach it
to avidin coated magnetic beads (Invitrogen Corporation, California, U.S.A). The interaction
of avidin and biotin has been widely used and is a high affinity interaction (Grunwald 2008).
The Watson Crick base pairing between bridge sequence and complement attaches the pool to
beads. These complexes were then exposed to the target. The random sequence regions that
interacted with the target were expected to undergo a structural change (Nutiu and Li 2005). If
the change in structure reduced the interaction between the bridge and complement sequence,
the DNA was released from the beads. This DNA of interest was separated from the DNA still
attached to the beads by pelleting the beads using a magnet. The supernatant contained the
DNA of interest. This selection method has two selection pressures; first the DNA must bind
to target and second the binding must lead to structural switch.

66
Figure 6. Methods used for SELEX I) Method I: DNA pool is attached to beads, FDA is
added, magnet is applied, and supernatant contains DNA of interest II) Method
II: FDA is attached to beads, DNA or RNA pool is added, magnet is applied,
supernatant discarded, and pellet contains DNA or RNA of interest.
The second method (method II, Figure 6b) attempted involved having FDA bound to
beads and introducing DNA pool. In this method, FDA was bound to the avidin coated beads
via a biotin linker. The DNA pool in this case does not require a bridge sequence. However,
the DNA pool used did contain a bridge sequence flanked by random regions. The DNA that
interacts with FDA was pulled into pellet along with beads using a magnet. The supernatant
containing DNA that does not interact with DNA was then removed and discarded. The pellet
was then dissolved in denaturing buffer. This prevents DNA from folding and interaction with
FDA. When the beads were pelleted this time, the DNA of interest was in the supernatant.

67
The DNA of interest was then amplified using PCR. The minimum number of PCR
cycles required to produce detectable amounts of DNA was determined. This was done by
taking running samples from different numbers of PCR cycles on an agarose gel with ethidum
bromide stain. As selection rounds are repeated the amount of DNA in the pool that has
affinity for the target should increase leading to a decrease in the number of PCR cycles
required to obtain detectable amounts of DNA.
The selection using method I did not lead to any reduction in PCR cycles required to
detect DNA by the eighth selection round. Using method II, the first selection round the PCR
had thirty cycles and by the eighth selection round the PCR required twenty cycles (Figure D1,
in Appendix).
In order to determine if sequences of DNA had converged, colony PCR was performed
using the DNA pool from round eight. Colony PCR was done using a kit purchased from
Invitrogen (Invitrogen Corporation, California, U.S.A). The DNA sequences were inserted
into a vector containing coding sequence for β-galactosidase α peptide regulated by the lac
operon (Hu, Kornacker and Hochschild 2000, Vieira and Messing 1982). The vectors were
then transformed into E. coli cells. The cells were plated on LB plates containing bromo-
chloro-indolyl-galactopyranoside (X-Gal) and isopropyl β-D-thiogalactoside (IPTG). IPTG
triggers the expression of lac operon. Insertion of DNA into vector disrupts the sequence of β-
galactosidase α peptide. Colonies that have a vector with a DNA insert were not able to break
down X-gal, due to disrupted β-galactosidase α peptide. These colonies appear white; colonies
that appear blue have a vector with no DNA insert. β-galactosidase α peptide breaks down X-
gal into 5-bromo-4-chloro-3-hydroxyindole, which breaks down into 5,5’-dibromo-4,4’-
dichloro-indigo, which gives cell blue color (Gabelsberger, Liebl and Schleifer 1993). Several
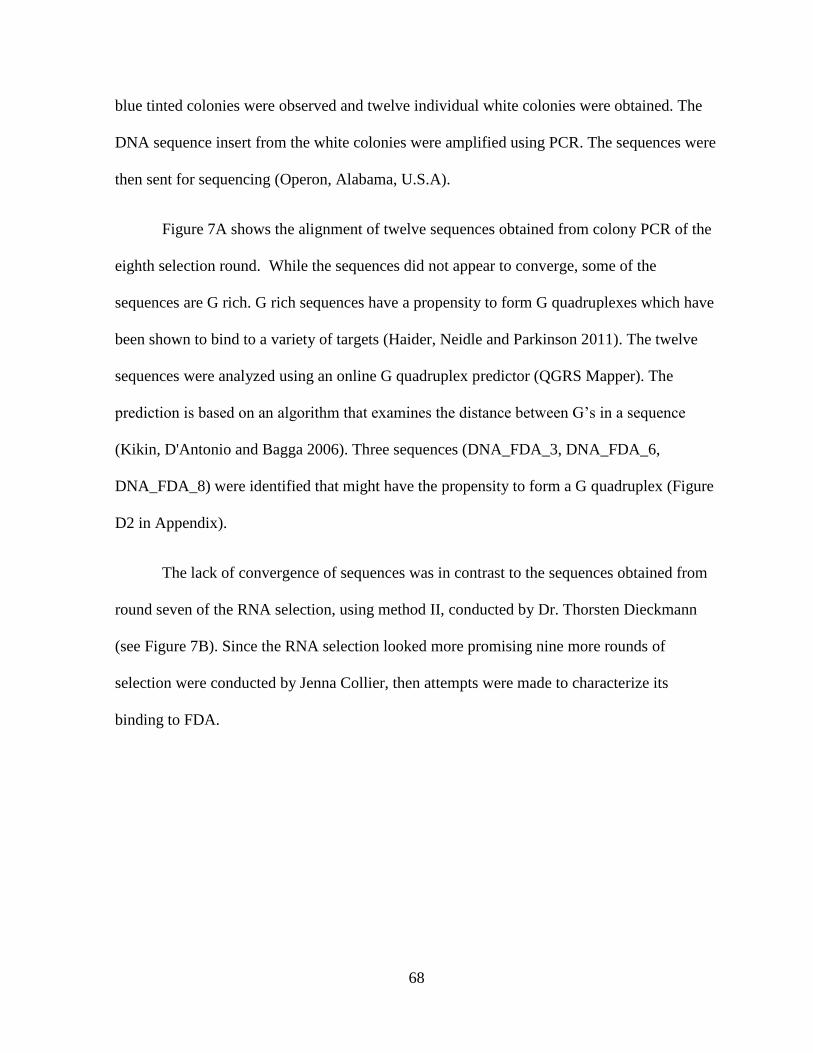
68
blue tinted colonies were observed and twelve individual white colonies were obtained. The
DNA sequence insert from the white colonies were amplified using PCR. The sequences were
then sent for sequencing (Operon, Alabama, U.S.A).
Figure 7A shows the alignment of twelve sequences obtained from colony PCR of the
eighth selection round. While the sequences did not appear to converge, some of the
sequences are G rich. G rich sequences have a propensity to form G quadruplexes which have
been shown to bind to a variety of targets (Haider, Neidle and Parkinson 2011). The twelve
sequences were analyzed using an online G quadruplex predictor (QGRS Mapper). The
prediction is based on an algorithm that examines the distance between G’s in a sequence
(Kikin, D'Antonio and Bagga 2006). Three sequences (DNA_FDA_3, DNA_FDA_6,
DNA_FDA_8) were identified that might have the propensity to form a G quadruplex (Figure
D2 in Appendix).
The lack of convergence of sequences was in contrast to the sequences obtained from
round seven of the RNA selection, using method II, conducted by Dr. Thorsten Dieckmann
(see Figure 7B). Since the RNA selection looked more promising nine more rounds of
selection were conducted by Jenna Collier, then attempts were made to characterize its
binding to FDA.
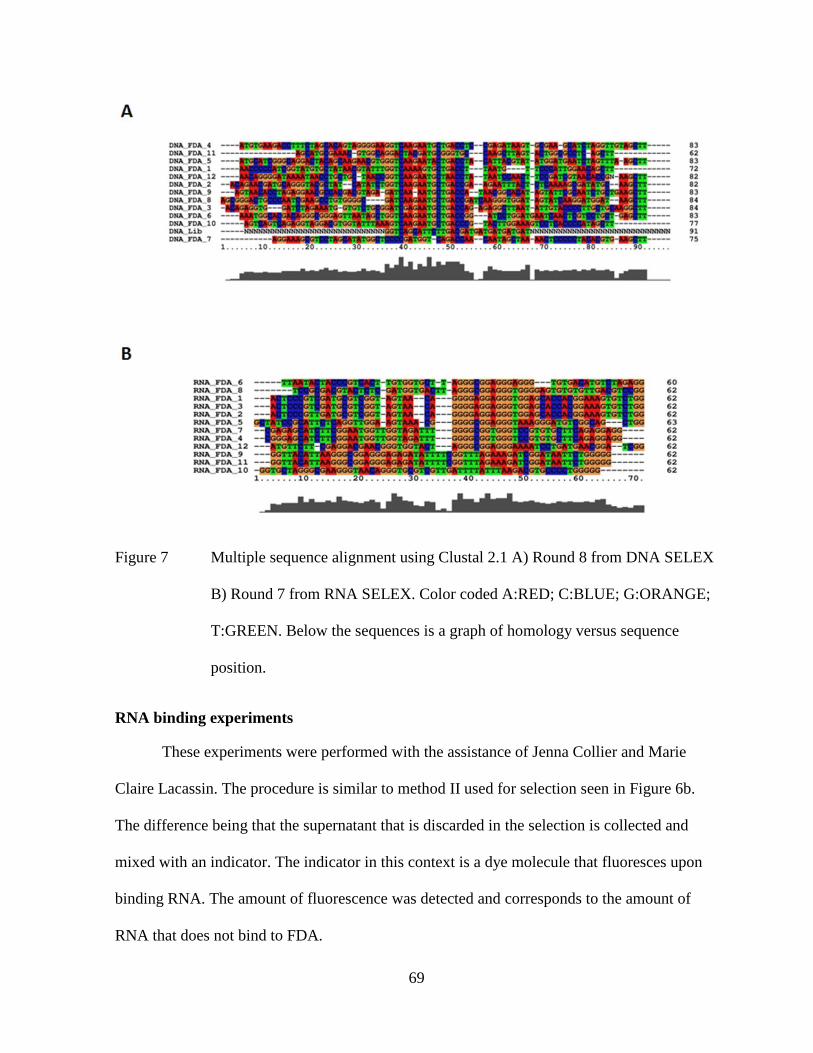
69
Figure 7 Multiple sequence alignment using Clustal 2.1 A) Round 8 from DNA SELEX
B) Round 7 from RNA SELEX. Color coded A:RED; C:BLUE; G:ORANGE;
T:GREEN. Below the sequences is a graph of homology versus sequence
position.
RNA binding experiments
These experiments were performed with the assistance of Jenna Collier and Marie
Claire Lacassin. The procedure is similar to method II used for selection seen in Figure 6b.
The difference being that the supernatant that is discarded in the selection is collected and
mixed with an indicator. The indicator in this context is a dye molecule that fluoresces upon
binding RNA. The amount of fluorescence was detected and corresponds to the amount of
RNA that does not bind to FDA.

70
The first indicator used was SyberGreen II (Invitrogen Corporation, California,
U.S.A). This indicator is commonly used in RNA gels in place of ethidium bromide. Results
obtained using SyberGreen II were inconsistent leading to the use of RiboGreen (Invitrogen
Corporation, California, U.S.A). RiboGreen is advertised for optimal determination of RNA
concentration in solution versus SyberGreen which is optimized for gel use. However these
results were inconsistent as well. The initial control used was RNA exposed to beads which
had no FDA bound. A control with FDA bound to beads and no RNA revealed the source of
inconsistency. It appeared that some of the FDA hydrolyzed to fluorescein and was in solution.
Since both SyberGreen II and RiboGreen share emission maxima with fluorescein, the
fluorescence measurement did not accurately represent binding. The next indicator tested,
Cy5 (Invitrogen Corporation, California, U.S.A), was obtained since it has a different
emission maxima (Figure 8). Unfortunately experiments with Cy5 showed interaction of Cy5
with beads. Fluorescence measurements are summarized in Table D1 in Appendix.
Figure 8. Emission (solid line) and Excitation spectra (dash lines) for fluorescein (red),
SyberGreen II (blue), RiboGreen (black) and Cy5 (green). Created using
Invitrogen SpectraViewer (Invitrogen Corporation, California, U.S.A).
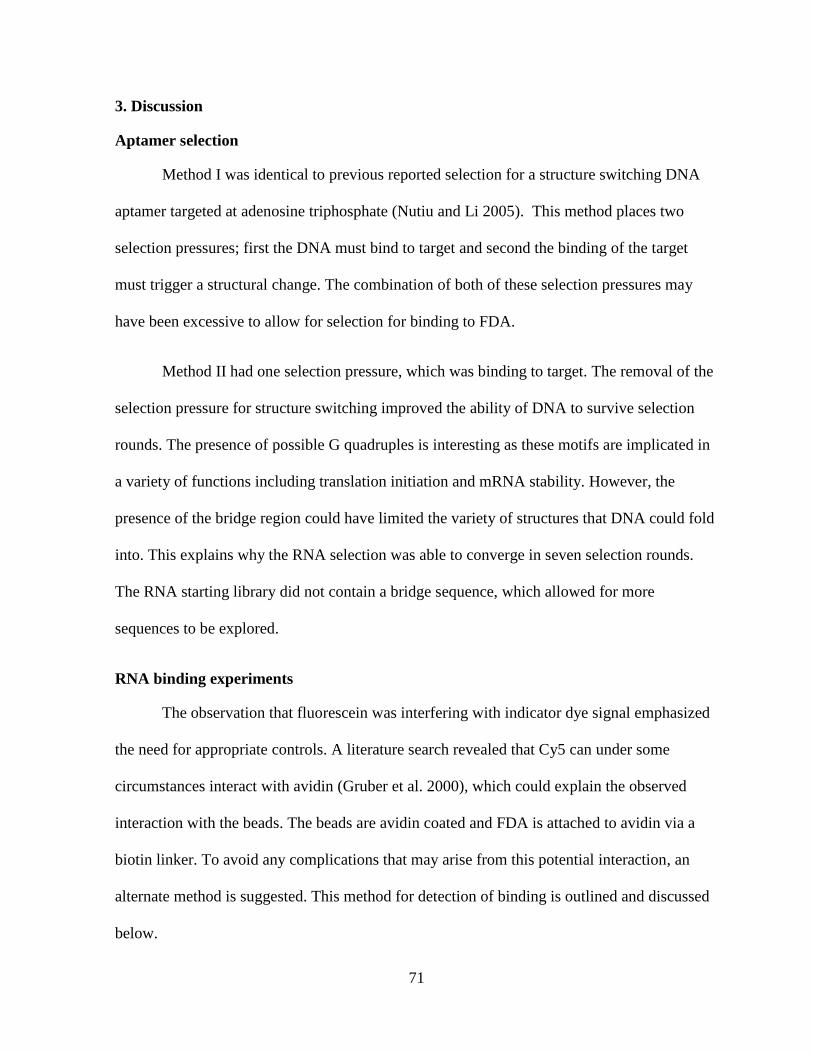
71
3. Discussion
Aptamer selection
Method I was identical to previous reported selection for a structure switching DNA
aptamer targeted at adenosine triphosphate (Nutiu and Li 2005). This method places two
selection pressures; first the DNA must bind to target and second the binding of the target
must trigger a structural change. The combination of both of these selection pressures may
have been excessive to allow for selection for binding to FDA.
Method II had one selection pressure, which was binding to target. The removal of the
selection pressure for structure switching improved the ability of DNA to survive selection
rounds. The presence of possible G quadruples is interesting as these motifs are implicated in
a variety of functions including translation initiation and mRNA stability. However, the
presence of the bridge region could have limited the variety of structures that DNA could fold
into. This explains why the RNA selection was able to converge in seven selection rounds.
The RNA starting library did not contain a bridge sequence, which allowed for more
sequences to be explored.
RNA binding experiments
The observation that fluorescein was interfering with indicator dye signal emphasized
the need for appropriate controls. A literature search revealed that Cy5 can under some
circumstances interact with avidin (Gruber et al. 2000), which could explain the observed
interaction with the beads. The beads are avidin coated and FDA is attached to avidin via a
biotin linker. To avoid any complications that may arise from this potential interaction, an
alternate method is suggested. This method for detection of binding is outlined and discussed
below.

72
4. Conclusions and Future work
Our attempt to obtain a DNA aptamer for FDA will be repeated with a starting library
similar to the one used for the RNA aptamer selection. The bridging region is ideal for
selection of an aptamer with structure switching capability; however since structure switching
isn’t the chief goal, this setup would not be necessary for our purposes. Removing selection
pressure for structure switching should expand the number of sequences explored.
The binding properties of the RNA aptamer sequences will be further studied using
radioactively labelled RNA. This method has been previously used for determining binding
affinity of aptamers (Gopinath S. et al. 2006) and by Dr. Dieckmann in the RNA selection
process to monitor increase in binding to beads. Briefly described, the process involves
dephosphorylation of 5’ of RNA using calf intestinal alkaline phosphatase followed
attachment of adenosine triphosphate [γ32
P] to RNA using T4 polynucleotide kinase. This
RNA is introduced to FDA bound beads, followed by ten washes to remove RNA that doesn’t
bind; the RNA that stays bound is then measured using a scintillation counter.
RNA sequences with the highest affinity will then be shortened to determine the
minimal binding sequence. At this point the DNA analog of the minimal sequence will be
investigated for FDA binding based on the occurrence of DNA analog binding as mentioned
previously. The sequences will then be tested for the presence of FDA hydrolysis by
monitoring fluorescein fluorescence.
If no catalytic activity is detected a new selection will be conducted using a pool
containing FDA binding sequences and selection pressure for hydrolysis will be applied. The
application of selection pressure for activity utilizes a substrate that is linked to both column
73
and RNA pool sequences. RNA that modifies the substrate through cleavage is separated from
the sequences that stay attached to the column and thus can be isolated for enrichment
(Wilson and Szostak 1999). A similar approach can be used in the search for FDA
hydrolyzing RNA.
5. Materials and Methods
DNA selection
The random DNA library (approximately 1015
molecules) was obtained courtesy of Dr.
Juewen Liu with the following sequence:
5’ACGATGCGGGTGCCAAGCTTN30
GGTCAGCATTCTTGACG ATGATGATGATGAT
N30
GCGGAGCGTGGCAGG 3’, along with the primer 1: 5’ACGATGCGGGTGCCA
AGCTTA3’(A is ribo-terminated A in primer 3), primer 2: 5’CCTGCCACGCTCGCAAG3’
and BiotinDNA: BGGTCAGCATTCTTGACGATGATGATGATGAT3’ (B biotin attached)
which is used in method II. As mentioned the DNA selection was preformed based on a
previously described method (Nutiu and Li 2005).
For method I, 2 nmol of the DNA library, 10 nmol of BDNA and 2.5 nmol each of
primer 1 and primer 2 were incubated in wash and binding (WB) buffer (100 mM NaCl, 500
mM KCl, 10 mM MgCl2, 100 mM phosphate buffer pH 7) at 277 K overnight. This mixture
was then incubated with 200 μL of washed avidin-coated magnetic beads (Invitrogen
Corporation, California, U.S.A) for 30 min at room temperature. The beads were washed with
ten volumes of WB buffer. The beads were then pulled to bottom using a magnet and the
supernatant was then removed. The beads were then washed ten more times with 200 µl of
WB buffer. Then 0.1 mM FDA was added to beads and allowed to equilibrate for 30 min. The

74
beads were then pulled to bottom using a magnet and the supernatant containing DNA of
interest was collected.
For method II, 2 nmol of the DNA library and 2.5 nmol each of primer 1 and primer 2
were incubated in wash and binding (WB) buffer (100 mM NaCl, 500 mM KCl, 10 mM
MgCl2, 100 mM phosphate buffer pH 7) at 277 K overnight. This mixture was then incubated
with 200 μL of washed avidin-coated magnetic beads (Invitrogen Corporation, California,
U.S.A) for 30 min at room temperature. The beads were washed with ten volumes of WB
buffer. The beads were then pulled to bottom using a magnet and the supernatant was then
removed. The beads were then washed ten more times with 200 µl of WB buffer. Then 200 µl
of 10 mM KOH was added to beads. This solution was allowed to incubate for 10 mins at
room temperature. The beads were then pulled to bottom using a magnet and the supernatant
containing DNA of interest was removed.
The solution containing DNA of interest was amplified using ribo-terminated primer 3
and primer 2. The number of cycles required was determined by running 30 cycles and
collecting samples at 10, 15, 20 and 30 cycles. These were run on an agarose gel with
ethidium bromide stain. After determining the number of cycles required a 300 µl PCR was
run. After phenol chloroform extraction and ethanol precipitation the DNA was treated with
90 µl of 0.25 M NaOH at 363 K for 10 min. Followed by neutralization by addition of 10 µl
of 3 M sodium acetate pH 5.5. The DNA was then ethanol precipitated and run on a PAGE
gel. For the next rounds, the purified DNA from the previous round was mixed with primer 1,
primer 2 and BDNA. This mixture was denatured at 363 K for 5 mins and annealed at room
temperature for 30 minutes in WB buffer before addition of 200 μL washed avidin-coated
magnetic beads for 15 min. Protocols for PCR are located in Table D2 in Appendix.
75
Colony PCR
Colony PCR was done using a kit from Invitrogen (Invitrogen Corporation, California,
U.S.A) and following their procedure. Briefly descirbed, DNA from the round to be
sequenced was amplified using PCR with an addition elongation step. This step adds
adenosine runs to the 3’ end of the sequence. Then the DNA was cloned into a vector and
vector was transformed into cells. The cells were then plated on lysogeny broth (LB) plates
with ampicillin and X-gal. In 12 hours white colonies were visible and some with a blue tint
(Figure D3, Appendix). Blue colonies indicated a lack of insertion of vector and were not
picked. White colonies are picked with pipette tip and mixed with PCR solution. This PCR
includes an extra heating step to denature the cells and release DNA. After PCR the DNA is
extracted using the phenol chloroform method and ethanol precipitated and then sent for
sequencing. Our sequences were sent to Operon (Operon, Alabama, U.S.A). PCR protocols
for elongation and colony preparation are in Table D2 in Appendix.
Binding test
RNA concentration was determined using a NanoDrop 2000 (Thermo Fisher Scientific
Company, Ontario, Canada) by measuring absorbance at 260 nm. The RNA was then diluted
to a 1 uM solution in WB buffer. 40 µl of RNA 1 uM solution was then added to 50 µl of
washed avidin-coated magnetic beads. The solution was allowed to incubate for 10 min at
room temperature. The beads were then pulled to bottom using a magnet and the supernatant
was collected. This solution was mixed with an equal volume of indicator solution and
fluorescence was measured using NanoDrop 3300 (Thermo Fisher Scientific Company,
Ontario, Canada). SyberGreen II indicator solution was made by adding 1 ul from
concentrated stock (Invitrogen Corporation, California, U.S.A) to 199 µl WB buffer.

76
RiboGreen indicator solution was made by adding 1 ul from concentrated stock (Invitrogen
Corporation, California, U.S.A) to 199 µl WB buffer. Cy5 indicator solution was made by
adding 5 ul from concentrated stock (Invitrogen Corporation, California, U.S.A) to 195 µl
WB buffer.
77
Chapter 5: Reconstructing MGA template and ligand to improve catalytic activity
1. Introduction
This chapter covers two projects that have not fully achieved their end goal. The first
project involves the design of alternate MGA DNA templates in order to maximize uniform
length products from T7 polymerase transcription. The motivation for this project was to
ensure that the investigation of MGA was not compromised by presence of MGA with extra
nucleotides appended to 3’ tail. The attempt involved using enzymes, ribozymes and
DNAzymes, both of which are discussed below. The second project involves the design of a
new ligand for MGA. The intent was to provide MGA with a substrate that it would be able to
catalyze into a product faster than background. The notion that RNA aptamers can have
catalytic activity based on ligand provided without the need for selection pressure for catalytic
activity during SELEX is discussed below.
Ribozymes
Ribozymes are catalytic RNA sequences. The two ribozymes used in this work are the
hammerhead and hepatitis delta virus ribozymes. Hammerhead (HH) ribozyme is found in
plant viruses, this naturally occurring ribozyme cleaves phosphodiester bonds. This cleavage
reaction is important for viroid replication (Prody et al. 1986, Pley, Flaherty and McKay
1994, Branch and Robertson 1984). The minimal catalytic sequence of the hammerhead
ribozyme was determined and contains three stem regions and a catalytic core (Figure 1)
(Scott, Finch and Klug 1995). Three nucleotides have been identified that play key roles in
cleavage. G5 is responsible for positioning the substrate while G12 and G8 have been
implicated in an acid-base catalysis reaction (Peracchi et al. 1998, Martick et al. 2008, Scott
2007). The full length ribozyme has higher activity achieved by optimization of the

78
positioning of these three nucleotides by tertiary interactions of stems (Martick and Scott
2006). Interestingly this ribozyme has been identified within fungi, archea and bacteria
(Perreault et al. 2011).
The second ribozyme also plays an important role in viral replication and is found in
the hepatitis delta virus (HDV) (Kuo et al. 1988). The HDV ribozyme contains five helices
which are connected by a double psuedoknot (Figure 2) and is responsible for a cleavage
reaction similar to HH ribozyme (FerreDamare, Zhou and Doudna 1998). In this case the
ribozyme works with a divalent cation to achieve cleavage reaction (Shih and Been 2002).
The divalent metal acts as a general acid along with C75 to achieve acid-base catalysis (Chen
et al. 2010). This ribozyme has also been shown to induce conformational changes in its RNA
substrate (Ke et al. 2004), a trait shared by MGA and other aptamers discussed in Chapter 1.
Figure 1. Structure of HH ribozyme, A) Crystal structure obtained using 2’-O-methyl
cytosine to prevent cleavage (PDB 1MME). B) Secondary structure schematic.
In both A) and B); Purple represents nucleotide where cleavage occurs (any
nucleotide but G); Green represents the conserved sequences; Red represents
other nucleotides (Scott, Finch and Klug 1995). Figure was generated using
UCSF Chimera (Pettersen et al. 2004).
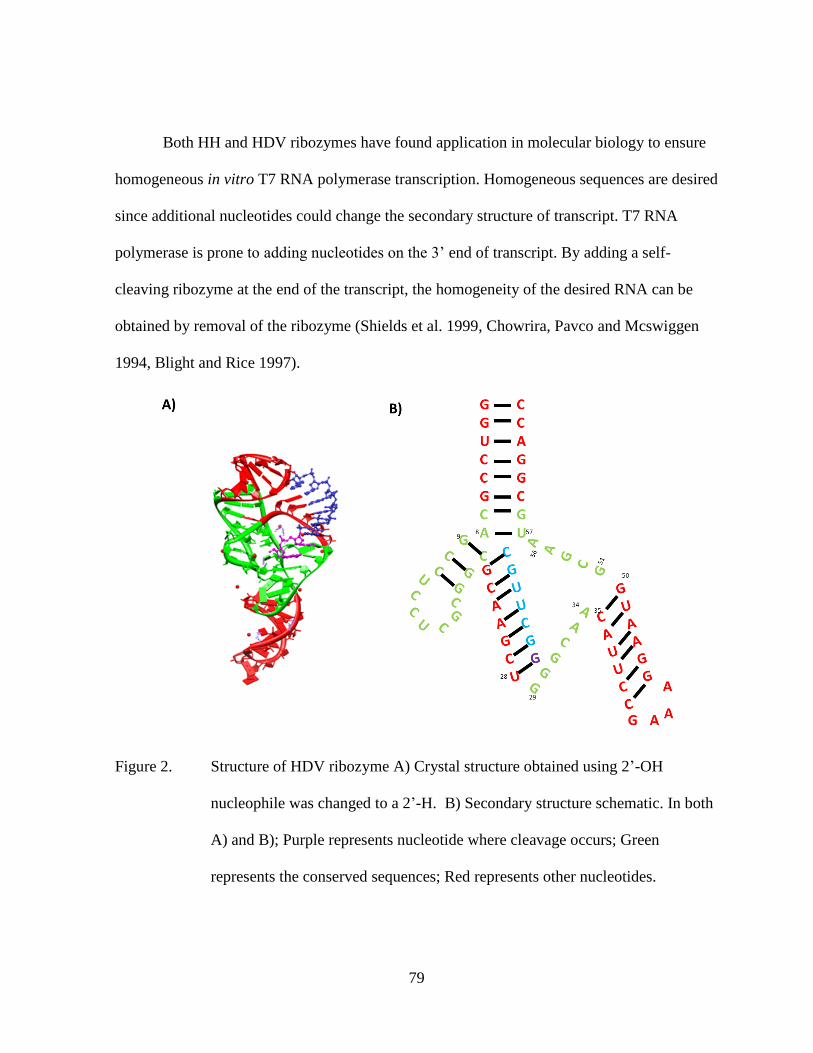
79
Both HH and HDV ribozymes have found application in molecular biology to ensure
homogeneous in vitro T7 RNA polymerase transcription. Homogeneous sequences are desired
since additional nucleotides could change the secondary structure of transcript. T7 RNA
polymerase is prone to adding nucleotides on the 3’ end of transcript. By adding a self-
cleaving ribozyme at the end of the transcript, the homogeneity of the desired RNA can be
obtained by removal of the ribozyme (Shields et al. 1999, Chowrira, Pavco and Mcswiggen
1994, Blight and Rice 1997).
Figure 2. Structure of HDV ribozyme A) Crystal structure obtained using 2’-OH
nucleophile was changed to a 2’-H. B) Secondary structure schematic. In both
A) and B); Purple represents nucleotide where cleavage occurs; Green
represents the conserved sequences; Red represents other nucleotides.
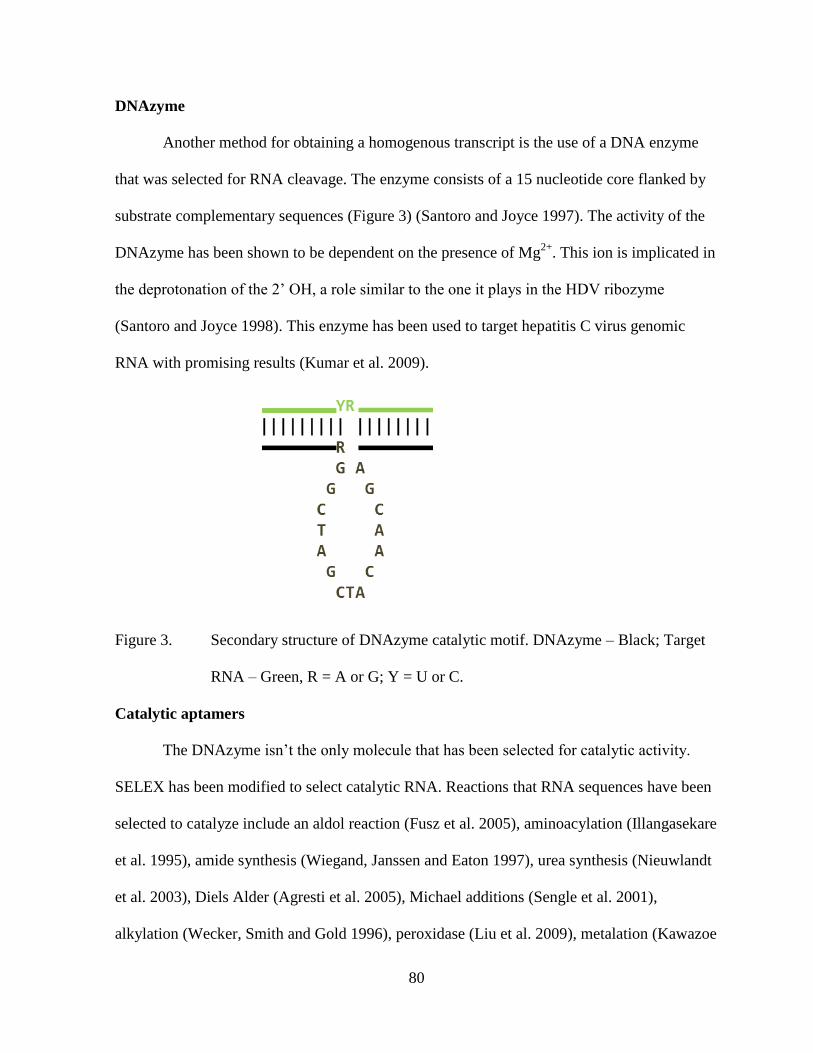
80
DNAzyme
Another method for obtaining a homogenous transcript is the use of a DNA enzyme
that was selected for RNA cleavage. The enzyme consists of a 15 nucleotide core flanked by
substrate complementary sequences (Figure 3) (Santoro and Joyce 1997). The activity of the
DNAzyme has been shown to be dependent on the presence of Mg2+
. This ion is implicated in
the deprotonation of the 2’ OH, a role similar to the one it plays in the HDV ribozyme
(Santoro and Joyce 1998). This enzyme has been used to target hepatitis C virus genomic
RNA with promising results (Kumar et al. 2009).
Figure 3. Secondary structure of DNAzyme catalytic motif. DNAzyme – Black; Target
RNA – Green, R = A or G; Y = U or C.
Catalytic aptamers
The DNAzyme isn’t the only molecule that has been selected for catalytic activity.
SELEX has been modified to select catalytic RNA. Reactions that RNA sequences have been
selected to catalyze include an aldol reaction (Fusz et al. 2005), aminoacylation (Illangasekare
et al. 1995), amide synthesis (Wiegand, Janssen and Eaton 1997), urea synthesis (Nieuwlandt
et al. 2003), Diels Alder (Agresti et al. 2005), Michael additions (Sengle et al. 2001),
alkylation (Wecker, Smith and Gold 1996), peroxidase (Liu et al. 2009), metalation (Kawazoe

81
et al. 2001) and cofactor dependent redox reaction (Tsukiji, Pattnaik and Suga 2003).
Interestingly, the RNA with peroxidase activity was selected for binding to hemin (Liu et al.
2009) and the metalation activity was seen in a RNA selected for binding to N-
methylmesoporphyrin (Kawazoe et al. 2001). These aptamers were selected for binding and
had inherent catalytic activity. This is also seen in MGA which was selected for binding MG.
MG has a positive charge which resulted in a selection pressure for an electronegative pocket.
This was harnessed by catalysis of a reaction with a positive transition state and MGA has
been shown to catalyze the hydrolysis of acetoxy derivative of MG (MGOAc) (Figure 4) at
1000-fold over background of the same reaction pathway (Brackett and Dieckmann 2006).
Figure 4. MGOAc hydrolysis to hydroxy MG and acetate.
2. Results and Discussion
MGA template modification
The first attempt to obtain homogenous RNA was to append HDV to the 3' end of the
MGA. A second template was designed with HH to the 5’ and 3’ ends of MGA. Both
template are shown in Figure 5. HDV and HH modified clones were designed and developed
by Dr. Elaine Collins (San Jose State University, California, USA). The template were
designed using Assembly PCR Oligo Maker (Rydzanicz, R. et al. 2005)

82
(http://startrek.ccs.yorku.ca/Epjohnson/AssemblyPCRoligomaker.html ).The modified DNA
templates were obtained from Sigma-Aldrich (Sigma-Aldrich, Missouri, U.S.A) and
following PCR was then inserted into a vector . The vector was then transfected into cells.
This allowed for large scale preparation of the templates, since large quantities of the cells
could be grown. The DNA was then purified using a DNA purification kit (Qiagen). Then the
DNA was excised from vector using restriction enzymes, and after purification the DNA was
used in transcription reactions.
HH MGA template CCATTATGCTGAGTGATATCCCCTCTGATCGCCCTCAGACTACTCAGGCACTCCTGCTTTGCCATGGGCCATGGCAGCTGAGGGCTGACCGCTCTCGGTCATTGCTTACCTCAGCTGCCTCAGATCTCTGAGGCAGGACTACTCAGGCACTCCTGCTTTGAGGTTTT
ATTTGGTTCCTAGC
HDV MGA template CCATTATGCTGAGTGATATCCCCTCGCTGACCGCTCTCGGTCCATTGCTTAGAGGGGCCAGCCGACGTCTGGGTCGGAGGAGC
GCCCGGGCTGGACCCGTAGAAGCCTACCGCTTACCCAGT
Figure 5. Ribozyme MGA templates: Highlighted in yellow is T7 promoter; in Green is
MGA DNA; in Red and Purple is ribozyme; in Purple are residues important
for catalysis
After the templates were purified, the RNA was transcribed as previously described.
The RNA was then purified and dissolved in catalysis buffer (50 mM Tris pH 7.0, 100 mM
NaCl, 10 mM MgCl2). The concentration of magnesium was increased but did not result in
more cleavage consistent with previous report by Chowrira et al. (Chowrira et al. 1994). HH
ribozyme was not as active as HDV, since a large amount of uncleaved RNA was found after
twelve hours. (Figure E1 in Appendix).
In an attempt to obtain cleaved homogenous RNA, without the addition of significant
length, a template was designed that could be cleaved by the DNAzyme (Figure 6). The
change in length of the sequence is significantly smaller than HDV or HH MGA templates.
The enzyme did cleave some of the product, a significant portion was left uncleaved, and
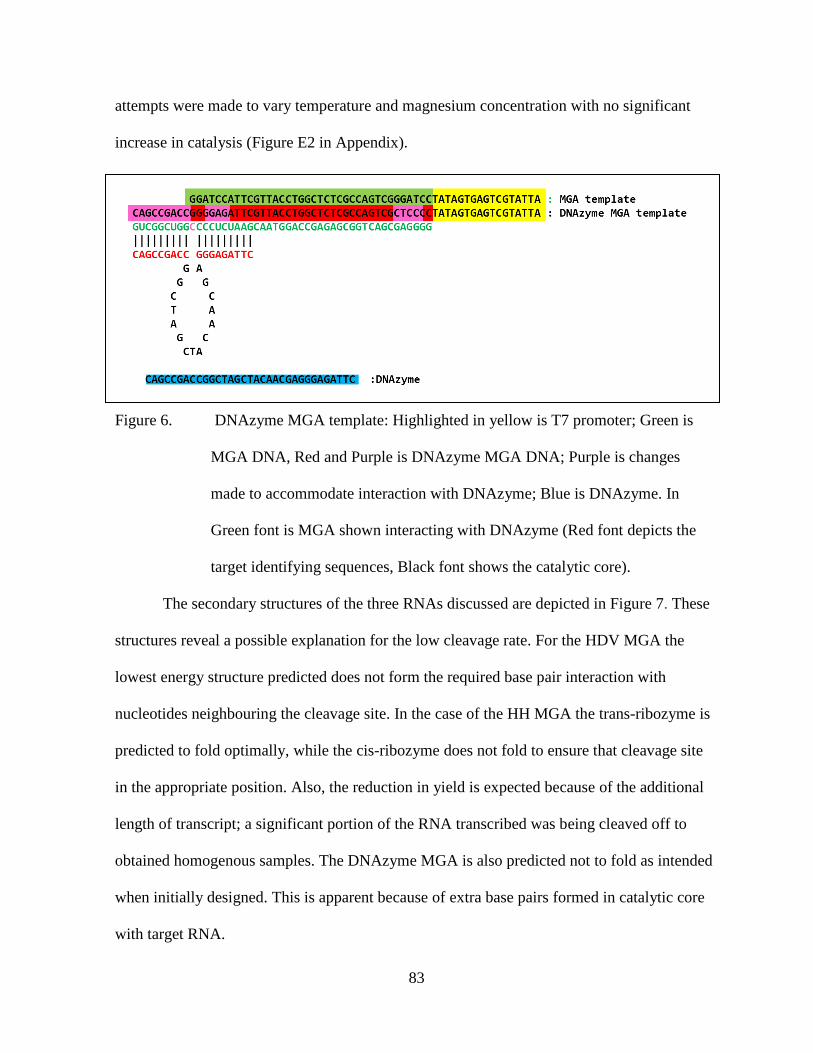
83
attempts were made to vary temperature and magnesium concentration with no significant
increase in catalysis (Figure E2 in Appendix).
Figure 6. DNAzyme MGA template: Highlighted in yellow is T7 promoter; Green is
MGA DNA, Red and Purple is DNAzyme MGA DNA; Purple is changes
made to accommodate interaction with DNAzyme; Blue is DNAzyme. In
Green font is MGA shown interacting with DNAzyme (Red font depicts the
target identifying sequences, Black font shows the catalytic core).
The secondary structures of the three RNAs discussed are depicted in Figure 7. These
structures reveal a possible explanation for the low cleavage rate. For the HDV MGA the
lowest energy structure predicted does not form the required base pair interaction with
nucleotides neighbouring the cleavage site. In the case of the HH MGA the trans-ribozyme is
predicted to fold optimally, while the cis-ribozyme does not fold to ensure that cleavage site
in the appropriate position. Also, the reduction in yield is expected because of the additional
length of transcript; a significant portion of the RNA transcribed was being cleaved off to
obtained homogenous samples. The DNAzyme MGA is also predicted not to fold as intended
when initially designed. This is apparent because of extra base pairs formed in catalytic core
with target RNA.

84
Figure 7. Secondary structure predictions with MGA highlighted in Green and sequences
important for catalysis in Red. A) HH ribozyme MGA RNA B) HDV ribozyme
MGA RNA C) DNAzyme MGA RNA and DNAzyme (separated by &). A)
and B) Generated using mfold. C) Generated using Vienna RNAcofold.
Another method attempted involved addition of a 2’-O methyl group to 3’ of MGA
template DNA, this has previously been reported to reduce n+1 transcription products (Kao,
Zheng and Rudisser 1999). Unfortunately this produced an additional band which was
detected during the gel purification step (Figure E3 in Appendix). This phenomenon was not
investigated further.
To determine if there was a significant presence of n+1 RNA mass spectrometry
experiments were conducted. The analysis of mass spectrometry data revealed two peaks
with the first peak at 12578 mass identified as n and the second peak at 12905 mass identified
as n+1 (Figure 8A). Using a molecular weight calculator

85
(http://www.currentprotocols.com/tools/dnarnaprotein-molecular-weight-calculator), the mass
of n is predicted at 12521 Da and n+1 at 12850 Da. A sample containing MGA mixed with
MG was then run. This spectrum showed presence of n+1 binding dyes (Figure E4 in
Appendix). Also, a secondary fold prediction of MGA with an extra nucleotide did not result
in a significant change in structure (Figure E5 in Appendix), and the use of double stranded
template DNA reduced the amount of n+1 significantly (Figure 8B). Based on these findings,
n+1 MGA was deemed to be similar enough to MGA that further attempts to isolate
homogenous MGA were deprioritized.
Figure 8. Mass spectra of A) MGA from transcription with a single stranded template B)
MGA from transcription with double stranded template
Changes in Ligand
MGA has previously been shown to have catalytic activity (Brackett and Dieckmann
2006) when provided with an ester derivative of MG. In order to investigate the catalytic
potential of MGA attempts were made to design new MG derivatives. The attempt to change
mass

86
the ligand for MGA was met with limited success. MGA binds to MGNCS as seen by a shift
in visible spectra (Figure 9). However no reaction was observed when this complex was
exposed to lysine (Figure E7 in Appendix). This reaction was attempted since fluorescein
isothiocyanate is commonly used to covalently attach fluorescein to peptides (Johnson,
Yguerabide and Taylor 1984, Breier and Ziegelhoffer 2000) and MGNCS has been used for
the same application (Golding et al. 1998). The covalent bond found is a thiourea bond by
reaction of the side chain amine of lysine and isothiocyanate group (Breier and Ziegelhoffer
2000). While the electronegative pocket would stabilize positive transitions states it maybe
that the pocket does not allow for optimal interaction of the lysine with the ligand. The
hydrolysis reaction that MGA catalyzes requires that water be able to enter pocket. Lysine is a
bigger molecule and the pocket does not facilitate the entry of a small molecule other than
ligand.
Figure 9. A) Chemical structure of MGNCS B) Visible Spectra of MGNCS (Red) and
MGNCS mixed with excess of MGA (Purple).
Since formation of a bond would meet with the same difficulty as thiourea bond
formation, that is the entry of the second substrate. An attempt was made to synthesize
MGCOOCF3 (Figure 10A), in order to observe if MGA could catalyze another hydrolysis
reaction. This reaction would be similar to MGOAc hydrolysis but would result in MGCOO-

87
which due to the negative charge would be ejected from MGA pocket. However this molecule
was hydrolyzed in water at a fast rate. This was determined by mixing MGCOOCF3 in both
water and methanol solutions, each of the solutions were then analyzed by mass spectrometry
(Figure E8 in Appendix). In water the sample spectra contained a 375 peak, which suggests
MGCOO (Figure 10B). In methanol the sample spectra contained a 387 peak, which suggests
MGCOOCH3 (Figure 10C). In order to reduce the rate of hydrolysis an attempt was made to
synthesize MGCOphenol (Figure 10D), however the product proved to be insoluble in water.
Since attempts to design a ligand that would undergo a reaction other than the
previously reported ester hydrolysis that MGA could catalyze were not successful, the next
approach involved placing the same ester group deeper within the pocket. Michlers ketone
(Figure 10E) was purchased in order to synthesize a molecule with an ester group at central
carbon, based on a report of it its reactivity with acetyl chloride (Gilman and Heck 1930).
However this synthesis was unsuccessful.
Figure 10. Chemical structures of MG derivatives A) MGCOOCF3 B) MGCOO C)
MGCOOCH3 D) MGCOphenol E) Michlers Ketone

88
3. Conclusions and Future Work
While the strategy of using ribozymes to ensure homogenous transcripts is an elegant
one, it may not be cost effective for a short aptamer. It appears that the gel purification
method used does leave some n+1 sequence; however, in the case reported here these
sequences appear to be functional. It is worthwhile to use the HDV template to generate a
large amount of homogenous RNA and conduct ITC experiments to compare our current ITC
data. The synthesis of new MGA derivatives should be attempted beginning with further
experiments with Michlers ketone, more specifically a synthesis reaction involving Michlers
ketone and benzyl chloride that was previously reported (Gilman and Heck 1930).
4. Thesis Conclusions
The goal of this work has been to show the capacity of RNA for function. Our work
with MGA has shown that varying the salt concentration was able to change the preference of
ligand. Secondly we have shown that binding of MGA can be influenced by a pre-bound
ligand. These characteristics suggest that RNA is capable of maintaining the capacity for
functions not selected for. This would have been an excellent ability in a prebiotic world,
since one pool of RNA could develop multiple functions. These characteristics should be kept
in mind while developing applications for MGA, since the solution conditions effects its
binding ability. Our work with MGA also reaffirms the need to preform characterisations
under different solution conditions. The NMR experiments were conducted in the absence of
Mg2+
to avoid issues with degradation.
5. Materials and Methods
HH and HDV MGA DNA template preparation
In order to prepare the necessary templates Sure2 competent cells containing pUC18
89
plasmid, designed by Dr. Elaine Collins, were grown on lysogeny (LB) plates containing
ampicillin (100 µg/mL). A single isolated colony from the plate was used to inoculate 100 mL
of LB broth. Culture was incubated at 37oC for 12 h. The cells were then spun down at 4000 g
for 30 min. The plasmid from the pellet was purified using Qiagen Plasmid Plus Purification
Kit (Qiagen, Toronto, Canada). The protocol provided by Qiagen (Qiagen, Toronto, Canada)
was followed to obtain the plasmid in water. The plasmid was then linearized with Bam H1
(Fermentas, Burlington, Canada). Completion of digestion was observed by running a 1%
agarose gel containing ethidium bromide. The reaction mixture was then purified using
Qiagen PCR purification kit (Qiagen, Toronto, Canada) and concentration of purified DNA
was determined using absorbance at 260 nm. Transcription reaction was performed using the
protocol described in Chapter 2, the same protocol was used for double stranded and single
stranded MGA templates.
Ribozyme Cleavage Reaction
RNA from transcription was dissolved in cleavage buffer I (50 mM Tris HCl, pH 7.5,
100 mM NaCl and 10 mM MgCl2). This mixture incubated at 90oC for 5 min then at 4
oC for 5
min, this hot and cold cycle was repeated three times. The solution was then allowed to react
at 37oC for 4 hrs. The resulting solution was then run of a 12% polyacrylamide gel and
purified on columns according to the protocol described in Chapter 2.
DNAzyme Cleavage Reaction
RNA from transcription using DNAzyme MGA template was dissolved in cleavage
buffer II (50 mM Tris HCl, pH 7.5, 150 mM NaCl, and 10 mM MgCl2. The concentration of
RNA was determined using absorbance at 260 nm. DNAzyme was added to RNA for a final
molar ratio of 1:1. This mixture incubated at 90oC for 5 min then at 4
oC for 5 min. The

90
solution was then allowed to react at 37oC for 4 hrs. The resulting solution was then run of a
12% polyacrylamide gel and purified on columns according to protocol described in Chapter
2.
RNA Mass Spectrometry Procedure
RNA samples for MS were ethanol precipitated using two times the volume of ethanol
and one tenth the volume of 3 M ammonium acetate. The procedure used for mass
spectrometry analysis was adapted from a procedure reported by Gooding K.B, et al.
(Gooding et al. 2004, Greig and Robinson 2000). Samples were dissolved in 50%
isopropanol, 25% water and 25% acetonitrile. Then they were run on a Micromass Q-TOF
Ultima Global (Waters Cooperation, Masssachusetts, U.S.A) with negative electrospray
ionization. The resulting spectra were processed using software provided by Waters
Cooperation, Masssachusetts, U.S.A.
Dye reactions
MGNCS lysine
MGNCS was purchased from Invitrogen, Ontario, Canada. The dye was weighed and
dissolved in acetonitrile for storage as a 100 µM stock solution. A solution with final
concentration of 5 µM MGNCS and 32 µM MGA was prepared in 50 mM NaCl, 25 mM
phosphate buffer at pH 5, lysine was added to a final solution of 10 µM. The background
reaction was observed with same concentration of MGNCS and buffer in the absence of
MGA.
Lysine MG product was synthesized by mixing MGNCS with excess lysine in a pH 9
phosphate buffer for 60 min, procedure was based on a previous report (Johnson, Yguerabide
and Taylor 1984). The visible spectra of lysine MG had a maximum at 590 nm (Figure E6 in

91
Appendix), there was no change in presence of MGA. The catalysis reaction was measured by
monitoring decrease in MGNCS maximum at 630 nm (Figure E7 in Appendix).
.
MGCOOCF3
First, MGCOOH was synthesized according to published report(Cho et al. 2003). The
synthesis involved stirring dimethylaniline and 4-carboxy benzaldehyde in concentrated HCl
for 12 hrs under nitrogen. This was followed by neutralization with NaOH and extraction into
ether. The solution was then dried with sodium sulfate. The leuco-base was purified by flash
chromatography using 9:1 hexane and ethyl acetate. The leuco-base was then dissolved in
chloroform with an excess of 2,3-dichloro-5,6-dicyano-1,4-benzoquinone. The dye was then
purified by flash chromatography using 5:1 chloroform and methanol. Positive ESI mass
spectrometry was used to confirm the formation of the desired product. MGCOOH was then
reacted with 2,2,2-Trifluoroethanol in dichloromethane, this was done following the protocol
reported by Srinivas K., et al. (Srinivas, Mahender and Das 2003). MGCOphenol synthesis
followed the same procedure with phenol instead of 2,2,2-trifluoroethanol.
Michlers Ketone
Michlers ketone was purchased from Sigma-Aldrich, Missouri, U.S.A. The alcohol
was synthesized following procedure report by Dumur F., et al.(Dumur et al. 2008). Briefly,
this involved boiling in THF in the presence of sodium borohydride. The alcohol was then
reacted with excess acetyl chloride. Positive ESI mass spectrometry was used to confirm the
formation of the desired product, which was absent, in this case (Figure E9 in Appendix).
92
References
1. Chapter 1
Alderman, D. (1985) Malachite green - a review. Journal of Fish Diseases, 289-298.
Balakin, A. G., L. Smith & M. J. Fournier (1996) The RNA World of the Nucleolus - Two
Major Families of Small RNAs Defined By Different Box Elements With Related
Functions. Cell, 86, 823-834.
Bartel, D. P. (2007) MicroRNAs: Genomics, biogenesis, mechanism, and function (Reprinted
from Cell, vol 116, pg 281-297, 2004). Cell, 131, 11-29.
Bates, P. J., D. A. Laber, D. M. Miller, S. D. Thomas & J. O. Trent (2009) Discovery and
development of the G-rich oligonucleotide AS1411 as a novel treatment for cancer.
Experimental and Molecular Pathology, 86, 151-164.
Baugh, C., D. Grate & C. Wilson (2000) 2.8 angstrom crystal structure of the malachite green
aptamer. Journal of Molecular Biology, 301, 117-128.
Ben Amor, B., S. Wirth, F. Merchan, P. Laporte, Y. d'Aubenton-Carafa, J. Hirsch, A. Maizel,
A. Mallory, A. Lucas, J. M. Deragon, H. Vaucheret, C. Thermes & M. Crespi (2009)
Novel long non-protein coding RNAs involved in Arabidopsis differentiation and
stress responses. Genome Research, 19, 57-69.
Beringer, M. (2008) Modulating the activity of the peptidyl transferase center of the
ribosome. RNA, 14, 795-801.
Bernacchi, S., S. Freisz, C. Maechling, B. Spiess, R. Marquet, P. Dumas & E. Ennifar (2007)
Aminoglycoside binding to the HIV-1 RNA dimerization initiation site:
thermodynamics and effect on the kissing-loop to duplex conversion. Nucleic Acids
Research, 35, 7128-7139.
Bernard Da Costa, J. & T. Dieckmann (2011) Entropy and Mg2+
control ligand affinity and
specificity in the malachite green binding RNA aptamer. Molecular Biosystems, 7,
2156-63.
Blount, K. F. & R. R. Breaker (2006) Riboswitches as antibacterial drug targets. Nature
Biotechnology, 24, 1558-1564.
Bock, R. M., D. Soll & J. D. Cherayil (1967) Mechanism of codon recognition by tRNA.
Indian Journal of Biochemistry, 4, 25-27.
Borovinskaya, M., R. Pai, W. Zhang, B. Schuwirth, J. Holton, G. Hirokawa, H. Kaji, A. Kaji
& J. Cate (2007) Structural basis for aminoglycoside inhibition of bacterial ribosome
recycling. Nature Structural & Molecular Biology, 14, 727-732.
Bouchard, P. R., R. M. Hutabarat & K. M. Thompson. 2010. Discovery and Development of
Therapeutic Aptamers. Annual Review of Pharmacology and Toxicology, 237-257.
Brenner, S., M. Meselson & F. Jacob (1961) Unstable intermediate carrying information from
genes to ribosomes for protein synthesis. Nature, 190, 576-581.
Brodersen, D. E., W. M. Clemons Jr, A. P. Carter, R. J. Morgan-Warren, B. T. Wimberly &
V. Ramakrishnan (2000) The Structural Basis for the Action of the Antibiotics
Tetracycline, Pactamycin, and Hygromycin B on the 30S Ribosomal Subunit. Cell,
103, 1143-1154.
Carthew, R. W. & E. J. Sontheimer (2009) Origins and Mechanisms of miRNAs and siRNAs.
Cell, 136, 642-655.
Cech, T. R. (2009) Crawling Out of the RNA World. Cell, 136, 599-602.

93
Cech, T. R., A. J. Zaug & P. J. Grabowski (1981) In vitro splicing of the ribosomal RNA
precursor of Tetrahymena: involvement of a guanosine nucleotide in the excision of
the intervening sequence. Cell, 27, 487-96.
Chushak, Y. & M. O. Stone. 2009. In silico selection of RNA aptamers. Nucleic Acids
Research, e87.
Cowan, J. A., T. Ohyama, D. Q. Wang & K. Natarajan (2000) Recognition of a cognate RNA
aptamer by neomycin B: quantitative evaluation of hydrogen bonding and electrostatic
interactions. Nucleic Acids Research., 28, 2935-2942.
Crick, F. H. (1958) On protein synthesis. Symposia of the Society for Experimental Biology,
12, 138-63.
Crick, F. H., S. Brenner, Watstobi.Rj & L. Barnett (1961) General nature of genetic code for
proteins. Nature, 192, 1227-&.
Darnell, J. E., Jr. 2002. Transcription factors as targets for cancer therapy. Nature Reviews
Cancer, 740-9.
Deissler, H. L. & G. E. Lang (2008) Effect of VEGF(165) and the VEGF Aptamer Pegaptanib
(Macugen (R)) on the Protein Composition of Tight Junctions in Microvascular
Endothelial Cells of the Retina. Klinische Monatsblatter Fur Augenheilkunde, 225,
863-867.
Delfosse, V., P. Bouchard, E. Bonneau, P. Dagenais, J. Lemay, D. Lafontaine & P. Legault
(2010) Riboswitch structure: an internal residue mimicking the purine ligand. Nucleic
Acids Research, 38, 2057-2068.
Dinger, M., T. Mercer & J. Mattick (2008) RNAs as extracellular signaling molecules.
Journal of Molecular Endocrinology, 40, 151-159.
Dyke, C. K., S. R. Steinhubl, N. S. Kleiman, R. O. Cannon, L. G. Aberle, M. Lin, S. K.
Myles, C. Melloni, R. A. Harrington, J. H. Alexander, R. C. Becker & C. P. Rusconi
(2006) First-in-human experience of an antidote-controlled anticoagulant using RNA
aptamer technology - A phase 1a pharmacodynamic evaluation of a drug-antidote pair
for the controlled regulation of factor IXa activity. Circulation, 114, 2490-2497.
Edwards, A., F. Reyes, A. Heroux & R. Batey (2010) Structural basis for recognition of S-
adenosylhomocysteine by riboswitches. RNA, 16, 2144-2155.
Ellington, A. D. & J. W. Szostak (1990) In vitro selection of RNA molecules that bind
specific ligands. Nature, 346, 818-822.
Ennifar, E., J. Paillart, R. Marquet, B. Ehresmann, C. Ehresmann, P. Dumas & P. Walter
(2003) HIV-1 RNA dimerization initiation site is structurally similar to the ribosomal
A site and binds aminoglycoside antibiotics. Journal of Biological Chemistry, 278,
2723-2730.
Epshtein, V., A. S. Mironov & E. Nudler (2003) The riboswitch-mediated control of sulfur
metabolism in bacteria. Proceedings of the National Academy of Sciences of the
United States of America, 100, 5052-5056.
Espinoza, C., T. Allen, A. Hieb, J. Kugel & J. Goodrich (2004) B2 RNA binds directly to
RNA polymerase II to repress transcript synthesis. Nature Structural & Molecular
Biology, 11, 822-829.
Espinoza, C. A., J. A. Goodrich & J. F. Kugel. 2007. Characterization of the structure,
function, and mechanism of B2 RNA, an ncRNA repressor of RNA polymerase II
transcription. In RNA, 583-96. United States.
94
Faber, C., H. Sticht, K. Schweimer & P. Rosch (2000) Structural rearrangements of HIV-1
Tat-responsive RNA upon binding of neomycin B. Journal of Biological Chemistry,
275, 20660-20666.
Flinders, J., S. C. DeFina, D. M. Brackett, C. Baugh, C. Wilson & T. Dieckmann (2004)
Recognition of planar and nonplanar ligands in the malachite green-RNA aptamer
complex. Chembiochem, 5, 62-72.
Fourmy, D., M. I. Recht & J. D. Puglisi (1998) Binding of neomycin-class aminoglycoside
antibiotics to the A-site of 16 S rRNA. Journal of Molecular Biology, 277, 347-362.
Frankel, A. D. (1992) Activation of HIV transcription by Tat. Curr Opin Genet Dev, 2, 293-8.
Freire, F., I. Cuesta, F. Corzana, J. Revuelta, C. Gonzalez, M. Hricovini, A. Bastida, J.
Jimenez-Barbero & J. L. Asensio (2007) A simple NMR analysis of the protonation
equilibrium that accompanies aminoglycoside recognition: Dramatic alterations in the
neomycin-B protonation state upon binding to a 23-mer RNA aptamer. Chemical
Communications, 174-176.
Freisz, S., K. Lang, R. Micura, P. Dumas & E. Ennifar (2008) Binding of aminoglycoside
antibiotics to the duplex form of the HIV-1 genomic RNA dimerization initiation site.
Angewandte Chemie-International Edition, 47, 4110-4113.
Ganot, P., M. Caizergues-Ferrer & T. Kiss (1997) The family of box ACA small nucleolar
RNAs is defined by an evolutionarily conserved secondary structure and ubiquitous
sequence elements essential for RNA accumulation. Genes & Development, 11, 941-
56.
Gilbert, S., C. Stoddard, S. Wise & R. Batey (2006) Thermodynamic and kinetic
characterization of ligand binding to the purine riboswitch aptamer domain. Journal of
Molecular Biology, 363, 624-624.
Gilbert, W. (1986) Origin of life - the RNA world. Nature, 319, 618-618.
Gonzalez-Fernandez, E., N. de-los-Santos-Alvarez, M. J. Lobo-Castanon, A. J. Miranda-
Ordieres & P. Tunon-Blanco. 2011. Impedimetric aptasensor for tobramycin detection
in human serum. Biosensors and Bioelectronics, 2354-60.
Grahn, E., N. J. Stonehouse, J. B. Murray, S. van den Worm, K. Valegard, K. Fridborg, P. G.
Stockley & L. Liljas (1999) Crystallographic studies of RNA hairpins in complexes
with recombinant MS2 capsids: implications for binding requirements. RNA, 5, 131-8.
Grivna, S., E. Beyret, Z. Wang & H. Lin (2006) A novel class of small RNAs in mouse
spermatogenic cells. Genes & Development, 20, 1709-1714.
Grundy, F. J. & T. M. Henkin (1998) The S box regulon: a new global transcription
termination control system for methionine and cysteine biosynthesis genes in Gram-
positive bacteria. Molecular Microbiology, 30, 737-749.
Guerrier-Takada, C., K. Gardiner, T. Marsh, N. Pace & S. Altman (1983) The RNA moiety of
ribonuclease P is the catalytic subunit of the enzyme. Cell, 35, 849-57.
Hall, L. & T. Unestam (1980) The effect of fungicides on survival of the crayfish plague
fungus, aphanomyces astaci, oomycetes, growing on fish scales. Mycopathologia, 72,
131-134.
Hamilton, A. & D. Baulcombe (1999) A species of small antisense RNA in
posttranscriptional gene silencing in plants. Science, 286, 950-952.
Hannon, G. J. & J. J. Rossi (2004) Unlocking the potential of the human genome with RNA
interference. Nature, 431, 371-378.

95
Harvey Lodish, A. B., S Lawrence Zipursky, Paul Matsudaira, David Baltimore, and James
Darnell. 2000. Molecular Cell Biology. W. H. Freeman and Company.
Heaphy, S., J. T. Finch, M. J. Gait, J. Karn & M. Singh (1991) Human immunodeficiency
virus type 1 regulator of virion expression, rev, forms nucleoprotein filaments after
binding to a purine-rich "bubble" located within the rev-responsive region of viral
mRNAs. Proceedings of the National Academy of Sciences of the United States of
America, 88, 7366-7370.
Horn, W., M. Convery, N. Stonehouse, C. Adams, L. Liljas, S. Phillips & P. Stockley (2004)
The crystal structure of a high affinity RNA stem-loop complexed with the
bacteriophage MS2 capsid: Further challenges in the modeling of ligand-RNA
interactions. RNA, 10, 1776-1782.
Huang, D. B., D. Vu, L. A. Cassiday, J. M. Zimmerman, L. J. Maher & G. Ghosh (2003)
Crystal structure of NF-kappa B (p50)(2) complexed to a high-affinity RNA aptamer.
Proceedings of the National Academy of Sciences of the United States of America,
100, 9268-9273.
Huang, Z., J. M. Gabriel, M. A. Baldwin, R. J. Fletterick, S. B. Prusiner & F. E. Cohen (1994)
Proposed three-dimensional structure for the cellular prion protein. Proceedings of the
National Academy of Sciences of the United States of America, 91, 7139-43.
Huang, Z. & J. W. Szostak (2003) Evolution of aptamers with a new specificity and new
secondary structures from an ATP aptamer. RNA, 9, 1456-63.
Jarvest, R. L., J. M. Berge, V. Berry, H. F. Boyd, M. J. Brown, J. S. Elder, A. K. Forrest, A.
P. Fosberry, D. R. Gentry, M. J. Hibbs, D. D. Jaworski, P. J. O'Hanlon, A. J. Pope, S.
Rittenhouse, R. J. Sheppard, C. Slater-Radosti & A. Worby (2002) Nanomolar
inhibitors of Staphylococcus aureus methionyl tRNA synthetase with potent
antibacterial activity against gram-positive pathogens. Journal of Medicinal
Chemistry, 45, 1959-1962.
Jelesarov, I. & H. R. Bosshard (1999) Isothermal titration calorimetry and differential
scanning calorimetry as complementary tools to investigate the energetics of
biomolecular recognition. Journal of Molecular Recognition, 12, 3-18.
Jiang, L. C., A. Majumdar, W. D. Hu, T. J. Jaishree, W. K. Xu & D. J. Patel (1999)
Saccharide-RNA recognition in a complex formed between neomycin B and an RNA
aptamer. Structure, 7, 817-827.
Jiang, L. C. & D. J. Patel (1998) Solution structure of the tobramycin-RNA aptamer complex.
Nature Structural and Molecular Biology, 5, 769-774.
Jiang, L. C., A. K. Suri, R. Fiala & D. J. Patel (1997) Saccharide-RNA Recognition in an
Aminoglycoside Antibiotic-RNA Aptamer Complex. Chemistry & Biology, 4, 35-50.
Kaul, M. & D. S. Pilch (2002) Thermodynamics of aminoglycoside-rRNA recognition: The
binding of neomycin-class aminoglycosides to the A site of 16S rRNA. Biochemistry,
41, 7695-7706.
Kay, J. 1968. Role of ribosomal RNA (rRNA) synthesis in effects of phytohaemagglutinin
(PHA) on lymphocytes. Federation Proceedings, 717-719.
Kettenberger, H., A. Eisenfuhr, F. Brueckner, M. Theis, M. Famulok & P. Cramer (2006)
Structure of an RNA polymerase II-RNA inhibitor complex elucidates transcription
regulation by noncoding RNAs. Nature Structural & Molecular Biology, 13, 44-48.

96
Kiga, D., Y. Futamura, K. Sakamoto & S. Yokoyama (1998) An RNA aptamer to the
xanthine/guanine base with a distinctive mode of purine recognition. Nucleic Acids
Research, 26, 1755-1760.
Kucukkilinc, T. & I. Ozer. 2008. Inhibition of electric eel acetylcholinesterase by
triarylmethane dyes. Chemico-Biological Interactions, 309-311.
Lauren, J., D. A. Gimbel, H. B. Nygaard, J. W. Gilbert & S. M. Strittmatter (2009) Cellular
prion protein mediates impairment of synaptic plasticity by amyloid-beta oligomers.
Nature, 457, 1128-32.
Lebars, I., P. Legrand, A. Aime, N. Pinaud, S. Fribourg & C. Di Primo (2008) Exploring
TAR-RNA aptamer loop-loop interaction by X-ray crystallography, UV spectroscopy
and surface plasmon resonance. Nucleic Acids Research, 36, 7146-7156.
Lee, D. & W. H. McClain (2004) Aptamer redesigned tRNA is nonfunctional and degraded in
cells. RNA, 10, 7-11.
Lin, P. H., S. L. Yen, M. S. Lin, Y. Chang, S. R. Louis, A. Higuchi & W. Y. Chen (2008)
Microcalorimetrics studies of the thermodynamics and binding mechanism between L-
tyrosinamide and aptamer. Journal of Physical Chemistry B, 112, 6665-6673.
Litman, G. W., J. P. Rast, M. J. Shamblott, R. N. Haire, M. Hulst, W. Roess, R. T. Litman, K.
R. Hinds-Frey, A. Zilch & C. T. Amemiya (1993) Phylogenetic diversification of
immunoglobulin genes and the antibody repertoire. Molecular Biology and Evolution,
10, 60-72.
Liu, J., Z. Cao & Y. Lu (2009) Functional nucleic acid sensors. Chemical Reviews, 109, 1948-
98.
Magnet, S. & J. S. Blanchard (2005) Molecular insights into aminoglycoside action and
resistance. Chemical Reviews, 105, 477-497.
Mashima, T., A. Matsugami, F. Nishikawa, S. Nishikawa & M. Katahira (2009) Unique
quadruplex structure and interaction of an RNA aptamer against bovine prion protein.
Nucleic Acids Research, 37, 6249-6258.
Matsugami, A., S. Kobayashi, K. Ouhashi, S. Uesugi, R. Yamamoto, K. Taira, S. Nishikawa,
P. Kumar & M. Katahira (2003) Structural basis of the highly efficient trapping of the
HIV Tat protein by an RNA aptamer. Structure, 11, 533-545.
Meli, M., J. Vergne, J. L. Decout & M. C. Maurel. 2002. Adenine-aptamer complexes: a
bipartite RNA site that binds the adenine nucleic base. Journal of Biological
Chemistry, 2104-11.
Minakawa, N., M. Sanji, Y. Kato & A. Matsuda. 2008. Investigations toward the selection of
fully-modified 4'-thioRNA aptamers: optimization of in vitro transcription steps in the
presence of 4'-thioNTPs. Bioorganic & Medicinal Chemistry, 9450-6.
Morris, D. & J. Demoss (1965) Role of aminoacyl-transfer ribonucleic acid in regulation of
ribonucleic acid synthesis in Escherichia Coli. Journal of Bacteriology, 90, 1624-
1630.
Muller, M., J. Weigand, O. Weichenrieder & B. Suess (2006) Thermodynamic
characterization of an engineered tetracycline-binding riboswitch. Nucleic Acids
Research, 34, 2607-2617.
Muntoni, F. & M. J. A. Wood (2011) Targeting RNA to treat neuromuscular disease. Nature
Reviews Drug Discovery, 10, 621-637.

97
Ng, E. W. M., D. T. Shima, P. Calias, E. T. Cunningham, D. R. Guyer & A. P. Adamis (2006)
Pegaptanib, a targeted anti-VEGF aptamer for ocular vascular disease. Nature Reviews
Drug Discovery, 5, 123-132.
Nguyen, D. H., T. Dieckmann, M. E. Colvin & W. H. Fink (2004) Dynamics studies of a
malachite Green-RNA complex revealing the origin of the red-shift and energetic
contributions of stacking interactions. Journal of Physical Chemistry B, 108, 1279-
1286.
Nissen, P., J. Hansen, N. Ban, P. B. Moore & T. A. Steitz (2000) The structural basis of
ribosome activity in peptide bond synthesis. Science, 289, 920-930.
Noble, M., J. Endicott & L. Johnson (2004) Protein kinase inhibitors: Insights into drug
design from structure. Science, 303, 1800-1805.
Nomura, Y., S. Sugiyama, T. Sakamoto, S. Miyakawa, H. Adachi, K. Takano, S. Murakami,
T. Inoue, Y. Mori, Y. Nakamura & H. Matsumura (2010) Conformational plasticity of
RNA for target recognition as revealed by the 2.15 A crystal structure of a human
IgG-aptamer complex. Nucleic Acids Research, 7822-9.
Paillart, J. C., M. Shehu-Xhilaga, R. Marquet & J. Mak (2004) Dimerization of retroviral
RNA genomes: an inseparable pair. Nature Reviews Microbiology, 2, 461-72.
Patel, D. J., A. K. Suri, F. Jiang, L. Jiang, P. Fan, R. A. Kumar & S. Nonin (1997) Structure,
Recognition and Adaptive Binding in RNA Aptamer Complexes. Journal of
Molecular. Biology., 272, 645-664.
Peters, K. M., B. E. Brooks, M. A. Schumacher, R. A. Skurray, R. G. Brennan & M. H.
Brown (2011) A single acidic residue can guide binding site selection but does not
govern QacR cationic-drug affinity. PLoS One, 6, e15974.
Pettersen, E. F., T. D. Goddard, C. C. Huang, G. S. Couch, D. M. Greenblatt, E. C. Meng &
T. E. Ferrin (2004) UCSF chimera - A visualization system for exploratory research
and analysis. Journal of Computational Chemistry, 25, 1605-1612.
Proske, D., S. Gilch, F. Wopfner, H. M. Schatzl, E. L. Winnacker & M. Famulok (2002)
Prion-protein-specific aptamer reduces PrPSc formation. Chembiochem, 3, 717-25.
Reiter, N., L. Maher & S. Butcher (2008) DNA mimicry by a high-affinity anti-NF-kappa B
RNA aptamer. Nucleic Acids Research, 36, 1227-1236.
Sakamoto, T., A. Oguro, G. Kawai, T. Ohtsu & Y. Nakamura (2005) NMR structures of
double loops of an RNA aptamer against mammalian initiation factor 4A. Nucleic
Acids Research, 33, 745-754.
Salas, M., M. B. Hille, J. A. Last, A. J. Wahba & S. Ochoa (1967) Translation of genetic
message: Effect of initiation factors on binding of formyl-methionyl-tRNA to
ribosomes. Proceedings of the National Academy of Sciences of the United States of
America, 57, 387-&.
Schmidt, K. S., S. Borkowski, J. Kurreck, A. W. Stephens, R. Bald, M. Hecht, M. Friebe, L.
Dinkelborg & V. A. Erdmann (2004) Application of locked nucleic acids to improve
aptamer in vivo stability and targeting function. Nucleic Acids Research, 5757-65.
England.
Shu, D. & P. Guo (2003) A viral RNA that binds ATP and contains a motif similar to an
ATP-binding aptamer from SELEX. Journal of Biological Chemistry, 278, 7119-
7125.
Stonehouse, N. J., D. J. Scott, S. Fonseca, J. Murray, C. Adams, A. R. Clarke, K. Valegard, R.
Golmohammadi, S. van den Worm, L. Liljas & P. G. Stockley (1996) Molecular
98
interactions in the RNA bacteriophage MS2. Biochemical Society Transactions, 24,
412S.
Tao, J. S. & A. D. Frankel (1992) Specific binding of argnine to TAR RNA. Proceedings of
the National Academy of Sciences of the United States of America, 89, 2723-2726.
Tereshko, V., E. Skripkin & D. Patel (2003) Encapsulating streptomycin within a small 40-
mer RNA. Chemistry & Biology, 10, 175-187.
Thomas, J. R. & P. J. Hergenrother (2008) Targeting RNA with small molecules. Chemical
Reviews, 108, 1171-224.
Tiley, L. S., M. H. Malim, H. K. Tewary, P. G. Stockley & B. R. Cullen (1992) Identification
of a high-affinity RNA-binding site for the human immunodeficiency virus type 1 Rev
protein. Proceedings of the National Academy of Sciences of the United States of
America, 89, 758-762.
Trotochaud, A. E. & K. M. Wassarman. 2005. A highly conserved 6S RNA structure is
required for regulation of transcription. Nature Structural & Molecular Biology, 313-
9.
Tso, P. O. P. (1962) Ribosomes - ribonucleoprotein particles. Annual Review of Plant
Physiology and Plant Molecular Biology, 13, 45-&.
Tuerk, C. & L. Gold (1990) Systematic evolution of ligands by exponential enrichment: RNA
ligands to bacteriophage T4 DNA polymerase. Science, 249, 505-510.
Valegard, K., J. B. Murray, P. G. Stockley, N. J. Stonehouse & L. Liljas (1994) Crystal
structure of an RNA bacteriophage coat protein-operator complex. Nature, 371, 623-6.
Van Melckebeke, H., M. Devany, C. Di Primo, F. Beaurain, J. J. Toulme, D. L. Bryce & J.
Boisbouvier (2008) Liquid-crystal NMR structure of HIV TAR RNA bound to its
SELEX RNA aptamer reveals the origins of the high stability of the complex.
Proceedings of the National Academy of Sciences of the United States of America,
105, 9210-9215.
Veronese, F. M. & A. Mero (2008) The impact of PEGylation on biological therapies.
Biodrugs, 22, 315-329.
Wahid, F., T. Khan, K. H. Hwang & Y. Y. Kim (2009) Piwi-interacting RNAs (piRNAs) in
animals: The story so far. African Journal of Biotechnology, 8, 4002-4006.
Welch, E. M., E. R. Barton, J. Zhuo, Y. Tomizawa, W. J. Friesen, P. Trifillis, S. Paushkin, M.
Patel, C. R. Trotta, S. W. Hwang, R. G. Wilde, G. Karp, J. Takasugi, G. M. Chen, S.
Jones, H. Ren, Y. C. Moon, D. Corson, A. A. Turpoff, J. A. Campbell, M. M. Conn,
A. Khan, N. G. Almstead, J. Hedrick, A. Mollin, N. Risher, M. Weetall, S. Yeh, A. A.
Branstrom, J. M. Colacino, J. Babiak, W. D. Ju, S. Hirawat, V. J. Northcutt, L. L.
Miller, P. Spatrick, F. He, M. Kawana, H. Feng, A. Jacobson, S. W. Peltz & H. L.
Sweeney (2007) PTC124 targets genetic disorders caused by nonsense mutations.
Nature, 447, 87-U6.
Wilton, S. (2007) PTC124, nonsense mutations and Duchenne muscular dystrophy.
Neuromuscular Disorders, 17, 719-20.
Winkler, W., A. Nahvi & R. R. Breaker (2002) Thiamine derivatives bind messenger RNAs
directly to regulate bacterial gene expression. Nature, 419, 952-956.
Winkler, W. C., S. Cohen-Chalamish & R. R. Breaker (2002) An mRNA structure that
controls gene expression by binding FMN. Proceedings of the National Academy of
Sciences of the United States of America, 99, 15908-15913.

99
Xiao, H., T. Edwards & A. Ferre-D'Amare (2008) Structural Basis for Specific, High-Affinity
Tetracycline Binding by an In Vitro Evolved Aptamer and Artificial Riboswitch.
Chemistry & Biology, 15, 1125-1137.
Yamamoto, R., M. Katahira, S. Nishikawa, T. Baba, K. Taira & P. K. Kumar. 2000. A novel
RNA motif that binds efficiently and specifically to the tat protein of HIV and inhibits
the trans-activation by Tat of transcription in vitro and in vivo. Genes Cells, 371-88.
Ye, X., A. Gorin, R. Frederick, W. Hu, A. Majumdar, W. Xu, G. McLendon, A. Ellington &
D. Patel (1999) RNA architecture dictates the conformations of a bound peptide.
Chemistry & Biology, 6, 657-669.
Zapp, M. L., T. J. Hope, T. G. Parslow & M. R. Green (1991) Oligomerization and RNA
binding domains of the type 1 human immunodefieciency virus Rev protein: A dual
function for an arginine-rich binding motif. Proceedings of the National Academy of
Sciences of the United States of America, 88, 7734-7738.
2. Chapter 2
Babendure, J. R., S. R. Adams & R. Y. Tsien (2003) Aptamers switch on fluorescence of
triphenylmethane dyes. Journal of the American Chemical Society, 125, 14716-14717.
Baugh, C., D. Grate & C. Wilson (2000) 2.8 angstrom crystal structure of the malachite green
aptamer. Journal of Molecular Biology, 301, 117-128.
Brackett, D. M. & T. Dieckmann (2006) Aptamer to ribozyme: the intrinsic catalytic potential
of a small RNA. Chembiochem, 7, 839-43.
Chaires, J. B. (2008) Calorimetry and thermodynamics in drug design. Annual Review of
Biophysics, 37, 135-151.
Cooper, A., C. M. Johnson, J. H. Lakey & M. Nollmann (2001) Heat does not come in
different colours: entropy-enthalpy compensation, free energy windows, quantum
confinement, pressure perturbation calorimetry, solvation and the multiple causes of heat
capacity effects in biomolecular interactions. Biophysical Chemistry, 93, 215-230.
Cowan, J. A., T. Ohyama, D. Q. Wang & K. Natarajan (2000) Recognition of a cognate RNA
aptamer by neomycin B: quantitative evaluation of hydrogen bonding and electrostatic
interactions. Nucleic Acids Research, 28, 2935-2942.
Darzynkiewicz, Z., J. Kapuscinski, S. P. Carter, F. A. Schmid & M. R. Melamed (1986)
Cytostatic and cytotoxic properties of pyronin-Y - relation to mitochondrial localization of the
dye and its interaction with RNA. Cancer Research, 46, 5760-5766.
Detering, C. & G. Varani (2004) Validation of automated docking programs for docking and
database screening against RNA drug targets. Journal of Medicinal Chemistry, 47, 4188-
4201.

100
Feig, A. L. (2007) Applications of isothermal titration calorimetry in RNA biochemistry and
biophysics. Biopolymers, 87, 293-301.
Flinders, J., S. C. DeFina, D. M. Brackett, C. Baugh, C. Wilson & T. Dieckmann (2004)
Recognition of planar and nonplanar ligands in the malachite green-RNA aptamer complex.
Chembiochem, 5, 62-72.
Grate, D. & C. Wilson (1999) Laser-mediated, site-specific inactivation of RNA transcripts.
Proceedings of the National Academy of Sciences of the United States of America, 96, 6131-
6136.
Grate, D. & C. Wilson (2001) Inducible regulation of the S-cerevisiae cell cycle mediated by
an RNA aptamer-ligand complex. Bioorganic & Medicinal Chemistry, 9, 2565-2570.
Hamilton, A. & D. Baulcombe (1999) A species of small antisense RNA in
posttranscriptional gene silencing in plants. Science, 286, 950-952.
Hirabayashi, M., H. Ohashi & T. Kubo (2010) Design of Bio-Inspired Multi-Stage
Regulations for Diagnostic Molecular Automata. Journal of Computational and Theoretical
Nanoscience, 7, 831-839.
Hirabayashi, M., S. Taira, S. Kobayashi, K. Konishi, K. Katoh, Y. Hiratsuka, M. Kodaka, T.
Q. P. Uyeda, N. Yumoto & T. Kubo (2006) Malachite green-conjugated microtubules as
mobile bioprobes selective for malachite green aptamers with capturing/releasing ability.
Biotechnology and Bioengineering, 94, 473-480.
Hossain, M. & G. S. Kumar (2009) DNA binding of benzophenanthridine compounds
sanguinarine versus ethidium: Comparative binding and thermodynamic profile of
intercalation. Journal of Chemical Thermodynamics, 41, 764-774.
Islam, M. M. & G. S. Kumar (2009) Small molecule-RNA interaction: Spectroscopic and
calorimetric studies on the binding by the cytotoxic protoberberine alkaloid coralyne to single
stranded polyribonucleotides. Biochimica Et Biophysica Acta-General Subjects, 1790, 829-
839.
Joyce, G. F. & L. E. Orgel. 1993. Prospect for understanding the origin of the RNA world.
The RNA World, eds. R. E. Gesteland & J. F. Atkins. Plainview, NY: Cold Spring Harbor
Laboratory Press.
Kapuscinski, J. & Z. Darzynkiewicz (1987) Interactions of pyronin-Y with nucleic-acids.
Cytometry, 8, 129-137.
Kumar, A., R. R. Ernst & K. Wüthrich (1980) A two-dimensional nuclear Overhauser
enhancement (2D NOE) experiment for the elucidation of complete proton-proton cross-

101
relaxation networks in biological macromolecules. Biochemical and Biophysical Research
Communications, 95, 1-6.
Ladbury, J. E. (2004) Application of isothermal titration calorirnetry in the biological
sciences: Things are heating up! Biotechniques, 37, 885-887.
Liao, J. C., J. Roider & D. G. Jay (1994) Chromophore-assisted laser inactivation of proteins
is mediated by the photogeneration of free-radicals. Proceedings of the National Academy of
Sciences of the United States of America, 91, 2659-2663.
Lin, P. H., S. L. Yen, M. S. Lin, Y. Chang, S. R. Louis, A. Higuchi & W. Y. Chen (2008)
Microcalorimetrics studies of the thermodynamics and binding mechanism between L-
tyrosinamide and aptamer. Journal of Physical Chemistry B, 112, 6665-6673.
Marion, D., M. Ikura, R. Tschudin & A. Bax (1989) Rapid recording of 2d NMR spectra
without phase cycling - application to the study of hydrogen exchange in proteins. Journal of
Magnetic Resonance, 85, 393-399.
Mascotti, D. P. & T. M. Lohman (1990) Thermodynamic extent of counterion release upon
binding oligolysines to single-stranded nucleic-acids. Proceedings of the National Academy of
Sciences of the United States of America, 87, 3142-3146.
Milligan, J. F., D. R. Groebe, G. W. Witherell & O. C. Uhlenbeck (1987) Oligoribonucleotide
synthesis using T7-RNA polymerase and synthetic DNA templates. Nucleic Acids Research,
15, 8783-8798.
Milligan, J. F. & O. C. Uhlenbeck (1989) Synthesis of small RNAs using T7 RNA
polymerase. Methods in Enzymology, eds. J. E. Dahlberg & J. Abelson, 51-62. New York:
Academic Press.
Nguyen, D. H., S. C. DeFina, W. H. Fink & T. Dieckmann (2002) Binding to an RNA
aptamer changes the charge distribution and conformation of malachite green. Journal of the
American Chemical Society, 124, 15081-15084.
Nguyen, D. H., T. Dieckmann, M. E. Colvin & W. H. Fink (2004) Dynamics studies of a
malachite Green-RNA complex revealing the origin of the red-shift and energetic
contributions of stacking interactions. Journal of Physical Chemistry B, 108, 1279-1286.
Pettersen, E. F., T. D. Goddard, C. C. Huang, G. S. Couch, D. M. Greenblatt, E. C. Meng &
T. E. Ferrin (2004) UCSF chimera - A visualization system for exploratory research and
analysis. Journal of Computational Chemistry, 25, 1605-1612.
Record, M. T., T. M. Lohman & P. Dehaseth (1976) Ion effects on ligand-nucleic acid
interactions. Journal of Molecular Biology, 107, 145-158.

102
Stampfl, S., A. Lempradl, G. Koehler & R. Schroeder (2007) Monovalent ion dependence of
neomycin B binding to an RNA aptamer characterized by spectroscopic methods.
Chembiochem, 8, 1137-45.
Stead, S. L., H. Ashwin, B. Johnston, J. A. Tarbin, M. Sharman, J. Kay & B. J. Keely (2010)
An RNA-Aptamer-Based Assay for the Detection and Analysis of Malachite Green and
Leucomalachite Green Residues in Fish Tissue. Analytical Chemistry, 82, 2652-2660.
Tanford, C. (1969) Extension of Theory of Linked Functions to Incorporate Effects of Protein
Hydration. Journal of Molecular Biology, 39, 539-544.
Wang, T. J., J. A. Hoy, M. H. Lamm & M. Nilsen-Hamilton (2009) Computational and
Experimental Analyses Converge to Reveal a Coherent Yet Malleable Aptamer Structure That
Controls Chemical Reactivity. Journal of the American Chemical Society, 131, 14747-14755.
Wiseman, T., S. Williston, J. F. Brandts & L. N. Lin (1989) Rapid measurement of binding
constants and heats of binding using a new titration calorimeter. Analytical Biochemistry, 179,
131-137.
Wyman, J. (1964) Linked Functions and Reciprocal Effects in Hemoglobin - a 2nd Look.
Advances in Protein Chemistry, 19, 223-286.
Xu, W. C. & Y. Lu (2010) Label-Free Fluorescent Aptamer Sensor Based on Regulation of
Malachite Green Fluorescence. Analytical Chemistry, 82, 574-578.
Zhang, X., A. S. R. Potty, G. W. Jackson, V. Stepanov, A. Tang, Y. Liu, K. Kourentzi, U.
Strych, G. E. Fox & R. C. Willson (2009) Engineered 5S ribosomal RNAs displaying
aptamers recognizing vascular endothelial growth factor and malachite green. Journal of
Molecular Recognition, 22, 154-161.
3. Chapter 3
Baugh, C., D. Grate & C. Wilson (2000) 2.8 angstrom crystal structure of the malachite green
aptamer. Journal of Molecular Biology, 301, 117-128.
Bernard Da Costa, J. & T. Dieckmann (2011) Entropy and Mg2+ control ligand affinity and
specificity in the malachite green binding RNA aptamer. Molecular Biosystems, 7, 2156-63.
Briand, J. & R. R. Ernst (1991) Computer-optimized homonuclear TOCSY experiments with
suppression of cross relaxation. Chemical Physics Letters, 185, 276-285.
Flinders, J., S. C. DeFina, D. M. Brackett, C. Baugh, C. Wilson & T. Dieckmann (2004)
Recognition of planar and nonplanar ligands in the malachite green-RNA aptamer complex.
Chembiochem, 5, 62-72.

103
Lee, M. S. & M. A. Olson (2006) Calculation of absolute protein-ligand binding affinity using
path and endpoint approaches. Biophysical Journal, 90, 864-877.
Lupardus, P. J., M. E. Birnbaum & K. C. Garcia (2010) Molecular Basis for Shared Cytokine
Recognition Revealed in the Structure of an Unusually High Affinity Complex between IL-13
and IL-13R alpha 2. Structure, 18, 332-342.
Markova, N. & D. Hallen (2004) The development of a continuous isothermal titration
calorimetric method for equilibrium studies. Analytical Biochemistry, 331, 77-88.
Milligan, J. F., D. R. Groebe, G. W. Witherell & O. C. Uhlenbeck (1987) Oligoribonucleotide
synthesis using T7-RNA polymerase and synthetic DNA templates. Nucleic Acids Research.,
15, 8783-8798.
Milligan, J. F. & O. C. Uhlenbeck (1989) Synthesis of small RNAs using T7 RNA
polymerase. Methods in Enzymology, eds. J. E. Dahlberg & J. Abelson, 51-62. New York:
Academic Press.
Muralidhara, B. K., S. S. Negi & J. R. Halpert (2007) Dissecting the thermodynamics and
cooperativity of ligand binding in cytochrome P450eryF. Journal of the American Chemical
Society, 129, 2015-2024.
Pettersen, E. F., T. D. Goddard, C. C. Huang, G. S. Couch, D. M. Greenblatt, E. C. Meng &
T. E. Ferrin (2004) UCSF chimera - A visualization system for exploratory research and
analysis. Journal of Computational Chemistry, 25, 1605-1612.
Piantini, U., O. W. Sørensen & R. R. Ernst (1982) Multiple quantum filters for elucidating
NMR coupling networks. Journal of the American Chemical Society, 104, 6800-6801.
Piotto, M., V. Saudek & V. Sklenar (1992) Gradient-tailored excitation for single-quantum
NMR spectroscopy of aqueous solutions. Journal of Biomolecular NMR, 2, 661-665.
Sigurskjold, B. W. (2000) Exact analysis of competition ligand binding by displacement
isothermal titration calorimetry. Analytical Biochemistry, 277, 260-266.
Sklenar, V. & A. Bax (1987) Spin-echo water suppression for the generation of pure-phase
two-dimensional NMR spectra. Journal of Magnetic Resonance, 74, 469-479.
Villa, A., J. Wohnert & G. Stock (2009) Molecular dynamics simulation study of the binding
of purine bases to the aptamer domain of the guanine sensing riboswitch. Nucleic Acids
Research, 37, 4774-4786.
Wang, Z. X. (1995) An exact mathematical expression for describing competitive binding of
two different ligands to a protein molecule. Febs Letters, 360, 111-4.
104
4. Chapter 4
Balasubrananian, V., L. Nguyen, S. Balasubramanian & M. Ramanathan (1998) Interferon-
gamma-inhibitory oligodeoxynucleotides alter the conformation of interferon-gamma.
Molecular Pharmacology, 53, 926-932.
Barbas, A. S., J. Mi, B. M. Clary & R. R. White (2010) Aptamer applications for targeted
cancer therapy. Future Oncology, 6, 1117-26.
Baugh, C., D. Grate & C. Wilson (2000) 2.8 angstrom crystal structure of the malachite green
aptamer. Journal of Molecular Biology, 301, 117-128.
Bini, A., M. Minunni, S. Tombelli, S. Centi & M. Mascini (2007) Analytical performances of
aptamer-based sensing for thrombin detection. Analytical Chemistry, 3016-3019.
Blank, M., T. Weinschenk, M. Priemer & H. Schluesener (2001) Systematic evolution of a
DNA aptamer binding to rat brain tumor microvessels - Selective targeting of endothelial
regulatory protein pigpen. Journal of Biological Chemistry, 276, 16464-16468.
Cheng, A., B. Ge & H. Yu (2007) Aptamer-based biosensors for label-free voltammetric
detection of lysozyme. Analytical Chemistry, 79, 5158-5164.
Chushak, Y. & M. O. Stone (2009) In silico selection of RNA aptamers. Nucleic Acids
Research, e87.
Darfeuille, F., S. Reigadas, J. Hansen, H. Orum, C. Di Primo & J. Toulme (2006) Aptamers
targeted to an RNA hairpin show improved specificity compared to that of complementary
oligonucleotides. Biochemistry, 45, 12076-12082.
Dieckmann, T., E. Fujikawa, X. Xhao, J. Szostak & J. Feigon (1995) Structural Investigations
of RNA and DNA aptamers in Solution. Journal of Cellular Biochemistry, 56-56.
Ellington, A. D. & J. W. Szostak (1990) In vitro selection of RNA molecules that bind
specific ligands. Nature, 346, 818-822.
Gabelsberger, J., W. Liebl & K. H. Schleifer (1993) Cloning and characterization of Beta-
Galactoside and Beta-Glucoside hydrolyzing enzymes of thermotoga-maritima. Fems
Microbiology Letters, 109, 131-137.
Gopinath , S., Balasundaresan, D., Akitomi, J., & Mizuno, H. (2006) An RNA aptamer that
discriminates Bovine Factor IX from Human Factor IX. Journal of Biochemistry, 140, 667-
676.
Gruber, H. J., C. D. Hahn, G. Kada, C. K. Riener, G. S. Harms, W. Ahrer, T. G. Dax & H. G.
Knaus (2000) Anomalous fluorescence enhancement of Cy3 and Cy3.5 versus anomalous
105
fluorescence loss of Cy5 and Cy7 upon covalent linking to IgG and noncovalent binding to
avidin. Bioconjugate Chemistry, 11, 696-704.
Grunwald, C. (2008) A brief introduction to the streptavidin-biotin system and its usage in
modern surface based assays. Zeitschrift Fur Physikalische Chemie-International Journal of
Research in Physical Chemistry & Chemical Physics, 222, 789-821.
Haider, S. M., S. Neidle & G. N. Parkinson (2011) A structural analysis of G-
quadruplex/ligand interactions. Biochimie, 93, 1239-1251.
Holeman, L. A., S. L. Robinson, J. W. Szostak & C. Wilson (1998) Isolation and
characterization of fluorophore-binding RNA aptamers. Folding & Design, 3, 423-431.
Hu, J. C., M. G. Kornacker & A. Hochschild (2000) Escherichia coli one- and two-hybrid
systems for the analysis and identification of protein-protein interactions. Methods-a
Companion to Methods in Enzymology, 20, 80-94.
Kikin, O., L. D'Antonio & P. S. Bagga (2006) QGRS Mapper: a web-based server for
predicting G-quadruplexes in nucleotide sequences. Nucleic Acids Research, 34, W676-
W682.
Kolpashchikov, D. M. (2005) Binary malachite green aptamer for fluorescent detection of
nucleic acids. Journal of the American Chemical Society, 127, 12442-3.
Kubik, M., C. Bell, T. Fitzwater, S. Watson & D. Tasset (1997) Isolation and characterization
of 2'-fluoro-, 2'-amino-, and 2'-fluoro/amino-modified RNA ligands to human IFN-gamma
that inhibit receptor binding. Journal of Immunology, 159, 259-267.
Li, L., Z. Chen, H. Zhao, L. Guo & X. Mu (2010) An aptamer-based biosensor for the
detection of lysozyme with gold nanoparticles amplification. Sensors and actuators B-
chemical, 149, 110-115.
Liu, M., T. Kagahara, H. Abe & Y. Ito (2009a) Direct In Vitro Selection of Hemin-Binding
DNA Aptamer with Peroxidase Activity. Bulletin of the Chemical Society of Japan, 82, 99-
104.
Liu, M., T. Kagahara, H. Abe & Y. Ito (2009b) In vitro selection of hemin-binding catalytic
RNA. Bioorganic & Medicinal Chemistry Letters, 19, 1484-1487.
Long, S., M. Long, R. White & B. Sullenger (2008) Crystal structure of an RNA aptamer
bound to thrombin. RNA, 14, 2504-2512.
Mendonsa, S. & M. Bowser (2004) In vitro selection of high-affinity DNA ligands for human
IgE using capillary electrophoresis. Analytical Chemistry, 76, 5387-5392.

106
Min, K., M. Cho, S. Han, Y. Shim, J. Ku & C. Ban (2008) A simple and direct
electrochemical detection of interferon-gamma using its RNA and DNA aptamers. Biosensors
& Bioelectronics, 23, 1819-1824.
Misono, T. & P. Kumar (2005) Selection of RNA aptamers against human influenza virus
hemagglutinin using surface plasmon resonance. Analytical Biochemistry, 342, 312-317.
Neves, M. A. D., O. Reinstein, M. Saad & P. E. Johnson (2010) Defining the secondary
structural requirements of a cocaine-binding aptamer by a thermodynamic and mutation
study. Biophysical Chemistry, 153, 9-16.
Ng, E. W. M., D. T. Shima, P. Calias, E. T. Cunningham, D. R. Guyer & A. P. Adamis (2006)
Pegaptanib, a targeted anti-VEGF aptamer for ocular vascular disease. Nature Reviews Drug
Discovery, 5, 123-132.
Nimjee, S., S. Oney, Z. Volovyk, K. Bompiani, S. Long, M. Hoffman & B. Sullenger (2009)
Synergistic effect of aptamers that inhibit exosites 1 and 2 on thrombin. RNA, 15, 2105-2111.
Nutiu, R. & Y. Li (2005) In vitro selection of structure-switching signaling aptamers.
Angewandte Chemie-International Edition, 44, 1061-1065.
Pettersen, E. F., T. D. Goddard, C. C. Huang, G. S. Couch, D. M. Greenblatt, E. C. Meng &
T. E. Ferrin (2004) UCSF chimera - A visualization system for exploratory research and
analysis. Journal of Computational Chemistry, 25, 1605-1612.
Potty, A., K. Kourentzi, H. Fang, G. Jackson, X. Zhang, G. Legge & R. Willson (2009)
Biophysical Characterization of DNA Aptamer Interactions with Vascular Endothelial
Growth Factor. Biopolymers, 91, 145-156.
Potty, A., K. Kourentzi, H. Fang, P. Schuck & R. Willson (2011) Biophysical characterization
of DNA and RNA aptamer interactions with hen egg lysozyme. International Journal of
Biological Macromolecules, 48, 392-397.
Proske, D., M. Blank, R. Buhmann & A. Resch (2005) Aptamers - basic research, drug
development, and clinical applications. Appl. Microbiol. Biotechnol., 69, 367-374.
Shi, H., B. E. Hoffman & J. T. Lis (1999) RNA aptamers as effective protein antagonists in a
multicellular organism. Proceedings of the National Academy of Sciences of the United States
of America, 96, 10033-10038.
Stojanovic, M. & D. Landry (2002) Aptamer-based colorimetric probe for cocaine. Journal
of the American Chemical Society, 124, 9678-9679.
Stojanovic, M. N. & D. M. Kolpashchikov (2004) Modular aptameric sensors. Journal of the
American Chemical Society, 126, 9266-70.

107
Stoltenburg, R., C. Reinemann & B. Strehlitz. 2007. SELEX-A (r)evolutionary method to
generate high-affinity nucleic acid ligands. Biomolecular Engineering, 381-403.
Tuerk, C. & L. Gold (1990) Systematic evolution of ligands by exponential enrichment: RNA
ligands to bacteriophage T4 DNA polymerase. Science, 249, 505-510.
Unruh, J., G. Gokulrangan, G. Wilson & C. Johnson (2005) Fluorescence properties of
fluorescein, tetramethylrhodamine and Texas Red linked to a DNA aptamer. Photochemistry
and Photobiology, 81, 682-690.
Vieira, J. & J. Messing (1982) The PUC plasmids, an M13MP7-derived system for insertion
mutagenesis and sequencing with synthetic universal primers. Gene, 19, 259-268.
Walsh, R. & M. DeRosa (2009) Retention of function in the DNA homolog of the RNA
dopamine aptamer. Biochemical and Biophysical Research Communications, 388, 732-735.
Wilson, D. S. & J. W. Szostak (1999) In vitro selection of functional nucleic acids. Annual
Review of Biochemistry, 68, 611-647.
Winkler, W. C., S. Cohen-Chalamish & R. R. Breaker (2002) An mRNA structure that
controls gene expression by binding FMN. Proceedings of the National Academy of Sciences
of the United States of America, 99, 15908-15913.
Xu, W. C. & Y. Lu (2010) Label-Free Fluorescent Aptamer Sensor Based on Regulation of
Malachite Green Fluorescence. Analytical Chemistry, 82, 574-578.
5. Chapter 5
Agresti, J. J., B. T. Kelly, A. Jaschke & A. D. Griffiths (2005) Selection of ribozymes that
catalyse multiple-turnover Diels-Alder cycloadditions by using in vitro compartmentalization.
Proceedings of the National Academy of Sciences of the United States of America, 102,
16170-16175.
Blight, K. & C. Rice (1997) Secondary structure determination of the conserved 98-base
sequence at the 3' terminus of hepatitis C virus genome RNA. Journal of Virology, 71, 7345-
7352.
Brackett, D. M. & T. Dieckmann (2006) Aptamer to ribozyme: the intrinsic catalytic potential
of a small RNA. Chembiochem, 7, 839-43.
Branch, A. & H. Robertson (1984) A Replication Cycle for Viroids and other Small Infectious
RNAS. Science, 223, 450-455.
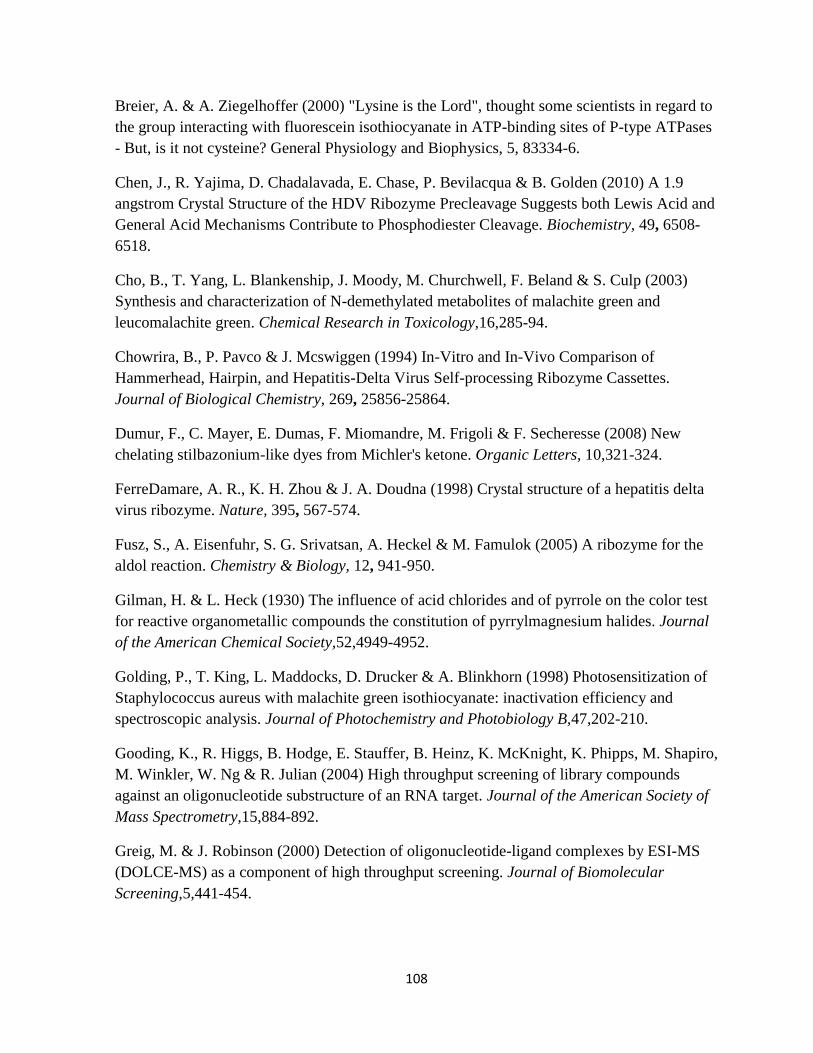
108
Breier, A. & A. Ziegelhoffer (2000) "Lysine is the Lord", thought some scientists in regard to
the group interacting with fluorescein isothiocyanate in ATP-binding sites of P-type ATPases
- But, is it not cysteine? General Physiology and Biophysics, 5, 83334-6.
Chen, J., R. Yajima, D. Chadalavada, E. Chase, P. Bevilacqua & B. Golden (2010) A 1.9
angstrom Crystal Structure of the HDV Ribozyme Precleavage Suggests both Lewis Acid and
General Acid Mechanisms Contribute to Phosphodiester Cleavage. Biochemistry, 49, 6508-
6518.
Cho, B., T. Yang, L. Blankenship, J. Moody, M. Churchwell, F. Beland & S. Culp (2003)
Synthesis and characterization of N-demethylated metabolites of malachite green and
leucomalachite green. Chemical Research in Toxicology,16,285-94.
Chowrira, B., P. Pavco & J. Mcswiggen (1994) In-Vitro and In-Vivo Comparison of
Hammerhead, Hairpin, and Hepatitis-Delta Virus Self-processing Ribozyme Cassettes.
Journal of Biological Chemistry, 269, 25856-25864.
Dumur, F., C. Mayer, E. Dumas, F. Miomandre, M. Frigoli & F. Secheresse (2008) New
chelating stilbazonium-like dyes from Michler's ketone. Organic Letters, 10,321-324.
FerreDamare, A. R., K. H. Zhou & J. A. Doudna (1998) Crystal structure of a hepatitis delta
virus ribozyme. Nature, 395, 567-574.
Fusz, S., A. Eisenfuhr, S. G. Srivatsan, A. Heckel & M. Famulok (2005) A ribozyme for the
aldol reaction. Chemistry & Biology, 12, 941-950.
Gilman, H. & L. Heck (1930) The influence of acid chlorides and of pyrrole on the color test
for reactive organometallic compounds the constitution of pyrrylmagnesium halides. Journal
of the American Chemical Society,52,4949-4952.
Golding, P., T. King, L. Maddocks, D. Drucker & A. Blinkhorn (1998) Photosensitization of
Staphylococcus aureus with malachite green isothiocyanate: inactivation efficiency and
spectroscopic analysis. Journal of Photochemistry and Photobiology B,47,202-210.
Gooding, K., R. Higgs, B. Hodge, E. Stauffer, B. Heinz, K. McKnight, K. Phipps, M. Shapiro,
M. Winkler, W. Ng & R. Julian (2004) High throughput screening of library compounds
against an oligonucleotide substructure of an RNA target. Journal of the American Society of
Mass Spectrometry,15,884-892.
Greig, M. & J. Robinson (2000) Detection of oligonucleotide-ligand complexes by ESI-MS
(DOLCE-MS) as a component of high throughput screening. Journal of Biomolecular
Screening,5,441-454.

109
Illangasekare, M., G. Sanchez, T. Nickles & M. Yarus (1995) Aminoacyl-Rna Synthesis
Catalyzed By an Rna. Science, 267, 643-647.
Johnson, D., J. Yguerabide & P. Taylor (1984) Effect of rotational diffusion on fluorescence
quenching by iodide - assessment of solute assessability to nepsilon-fluorescein
isothiocyanate-lysine-23-cobra alpha-toxin bound to the acetylcholine-receptor. Biophysical
Society, 20814-3998.
Kao, C., M. Zheng & S. Rudisser (1999) A simple and efficient method to reduce
nontemplated nucleotide addition at the 3 ' terminus of RNAs transcribed by T7 RNA
polymerase. RNA, 5, 1268-1272.
Kawazoe, N., N. Teramoto, H. Ichinari, Y. Imanishi & Y. Ito (2001) In vitro selection of
nonnatural ribozyme-catalyzing porphyrin metalation. Biomacromolecules, 2, 681-686.
Ke, A., K. Zhou, F. Ding, J. H. Cate & J. A. Doudna (2004) A conformational switch controls
hepatitis delta virus ribozyme catalysis. Nature, 429, 201-5.
Kumar, D., I. Chaudhury, P. Kar & R. Das (2009) Site-specific cleavage of HCV genomic
RNA and its cloned core and NS5B genes by DNAzyme. Journal of Gastroenterology and
hepatology, 24, 872-878.
Kuo, M. Y., L. Sharmeen, G. Dinter-Gottlieb & J. Taylor (1988) Characterization of self-
cleaving RNA sequences on the genome and antigenome of human hepatitis delta virus.
Journal of Virology, 62, 4439-44.
Liu, M., T. Kagahara, H. Abe & Y. Ito (2009) In vitro selection of hemin-binding catalytic
RNA. Bioorganic & Medicinal Chemistry Letters, 19, 1484-1487.
Martick, M., T. S. Lee, D. M. York & W. G. Scott (2008) Solvent structure and hammerhead
ribozyme catalysis. Chemistry & Biology, 15, 332-42.
Martick, M. & W. Scott (2006) Tertiary contacts distant from the active site prime a ribozyme
for catalysis. Cell, 126, 309-320.
Nieuwlandt, D., M. West, X. Cheng, G. Kirshenheuter & B. Eaton (2003) The first example
of an RNA urea synthase: Selection through the enzyme active site of human neutrophile
elastase. Chembiochem, 4, 651-654.
Peracchi, A., J. MatulicAdamic, S. L. Wang, L. Beigelman & D. Herschlag (1998) Structure-
function relationships in the hammerhead ribozyme probed by base rescue. RNA, 4, 1332-
1346.
110
Perreault, J., Z. Weinberg, A. Roth, O. Popescu, P. Chartrand, G. Ferbeyre & R. Breaker
(2011) Identification of Hammerhead Ribozymes in All Domains of Life Reveals Novel
Structural Variations. Plos Computational Biology, 7.
Pley, H. W., K. M. Flaherty & D. B. McKay (1994) Three-dimensional structure of a
hammerhead ribozyme. Nature, 372, 68-74.
Prody, G. A., J. T. Bakos, J. M. Buzayan, I. R. Schneider & G. Bruening (1986) Autolytic
processing of dimeric plant virus satellite RNA. Science, 231, 1577-1580.
Rydzanicz, R., Zhao, S. X. & Johnson, P. E. (2005) Assembly PCR oligo maker: a tool for
designing oligodeoxynucleotides for constructing long DNA molecules for RNA production.
Nucleic Acids Research, 33, 521-525.
Santoro, S. & G. Joyce (1997) A general purpose RNA-cleaving DNA enzyme. Proceedings
of the National Academy of Sciences of the United States of America, 94, 4262-4266.
Santoro, S. & G. Joyce (1998) Mechanism and utility of an RNA-cleaving DNA enzyme.
Biochemistry, 37, 13330-13342.
Scott, W. (2007) Morphing the minimal and full-length hammerhead ribozymes: implications
for the cleavage mechanism. Biological Chemistry, 388, 727-735.
Scott, W. G., J. T. Finch & A. Klug (1995) The crystal structure of an all-RNA hammerhead
ribozyme - a proposed mechanism for RNA catalytic cleavage. Cell, 81, 991-1002.
Sengle, G., A. Eisenfuhr, P. S. Arora, J. S. Nowick & M. Famulok (2001) Novel RNA
catalysts for the Michael reaction. Chemistry & Biology, 8, 459-473.
Shields, T. P., E. Mollova, L. S. Marie, M. R. Hansen & A. Pardi (1999) High-performance
liquid chromatography purification of homogenous-length RNA produced by trans cleavage
with a hammerhead ribozyme. RNA, 5, 1259-1267.
Shih, I. & M. Been (2002) Catalytic strategies of the hepatitis delta virus ribozymes. Annual
Review of Biochemistry, 887-917.
Srinivas, K., I. Mahender & B. Das (2003) Silica chloride: A versatile heterogeneous catalyst
for esterification and transesterification. Synthesis, 16,2479-2482.
Tsukiji, S., S. Pattnaik & H. Suga (2003) An alcohol dehydrogenase ribozyme. Nature
Structural Biology, 10, 713-717.
Wecker, M., D. Smith & L. Gold (1996) In vitro selection of a novel catalytic RNA:
Characterization of a sulfur alkylation reaction and interaction with a small peptide. RNA, 2,
982-994.

111
Wiegand, T., R. Janssen & B. Eaton (1997) Selection of RNA amide syntheses. Chemistry &
Biology, 4, 675-683.

112
Appendix
Table A1: RNA sequences for various targets with structural features identified to showcase the
difference in sequence and structure
Target Sequence Notable Structural Features
Neomycin B GGACUGGGCGAGAAGUUUAGUCC three consecutive GU base pairs
Tetracycline GGGCCUAAAACAUACCAGAGAUCGCCACCCGCGCUUUAAUCUGGAGAGGUGAAGAAUACGACCACCUAGGCUC three helices
Tobramycin GGGACUUGGUUUAGGUAAUGAGUCCC UG,GU,GA,UU base pairs
Streptomycin GGAUCGCAUUUGGACUUCUGCC/CGGCACCACGGUCGGAUC S turns
Purine GCGAGUAUAACCUCAAUAAUAUGGUUUGAGGGUGUCUACCAGGAACCGUAAAAUCCUGACUACUCGC
Encapsulating ligand, base pairing with Y74
Guanine GGCACGUGUAUUACCCUAGUGGUCGACGUGCC structure not available
SAM GGACGAGGAGCGCUGCAAGCGAGAGCCCGAAGCUCGUCCGUUCAAACGGCGCUCA Psuedoknot
HIV Rev GGUGUCUUGGAGUGCUGAUCGGACACC
UAU triple, hydrogen bonding with Arg 35 and Arg 39, elongated form
HIV Rev GGCUGGACUCGUACUUCGGUACUGGAGAAACAGCC UAU triple, stacking of Trp45, helical form
HIV TAR GGCUGGUCCCAGACGACC kissing complex
HIV DIS CUUGCUGAAGUGCACACGCAAG kissing complex
HIV Tat GGGAGCUUGAUCCCGGAAACGGUCGAUCGCUCCC two adjacent UAU triples
MS2 coat protein CCGGAGGUCACCACGGG
A10 makes three hydrogen bonds with target
RNA polymerase II ACAGCACUGAUUGCGGUCGAGGUAGCUUGAUGG A-form helix
Bovine prp GGAGGAGGAGGA GGGG tetraplane
Human IgG GGAGGUGCUCCGAAAGGAACUCCA G7 stacking with Tyr373
NF-kb factor GAUACUUGAAACUGUAAGGUUGGCGUAUC resembles B-form DNA
Mammalian factor 4A
GGAGAUCGCACUCCACAUGUGAGUGAGGCCGAAACAUAGAUUCGAGAGGAGGCUCACA AUCGCA loop

113
Note A1. First page of “Entropy and MG2+ control ligand affinity and specificity in the
malachite green binding RNA aptamer”
114
Note A2. Permission to reproduce paper for Chapter 2
Dear Jason
The Royal Society of Chemistry (RSC) hereby grants permission for the use of your paper(s) specified
below in the printed and microfilm version of your thesis. You may also make available the PDF
version of your paper(s) that the RSC sent to the corresponding author(s) of your paper(s) upon
publication of the paper(s) in the following ways: in your thesis via any website that your university
may have for the deposition of theses, via your university’s Intranet or via your own personal
website. We are however unable to grant you permission to include the PDF version of the paper(s)
on its own in your institutional repository. The Royal Society of Chemistry is a signatory to the STM
Guidelines on Permissions (available on request).
Please note that if the material specified below or any part of it appears with credit or
acknowledgement to a third party then you must also secure permission from that third party before
reproducing that material.
Please ensure that the thesis states the following:
Reproduced by permission of The Royal Society of Chemistry
and include a link to the paper on the Royal Society of Chemistry’s website.
pubs.rsc.org/en/content/article/landing/2011/mb/c1mb05075c
Please ensure that your co-authors are aware that you are including the paper in your thesis.
Regards
Gill Cockhead
Publishing Contracts & Copyright Executive
Gill Cockhead (Mrs), Publishing Contracts & Copyright Executive
Royal Society of Chemistry, Thomas Graham House
Science Park, Milton Road, Cambridge CB4 0WF, UK
Tel +44 (0) 1223 432134, Fax +44 (0) 1223 423623
http://www.rsc.org
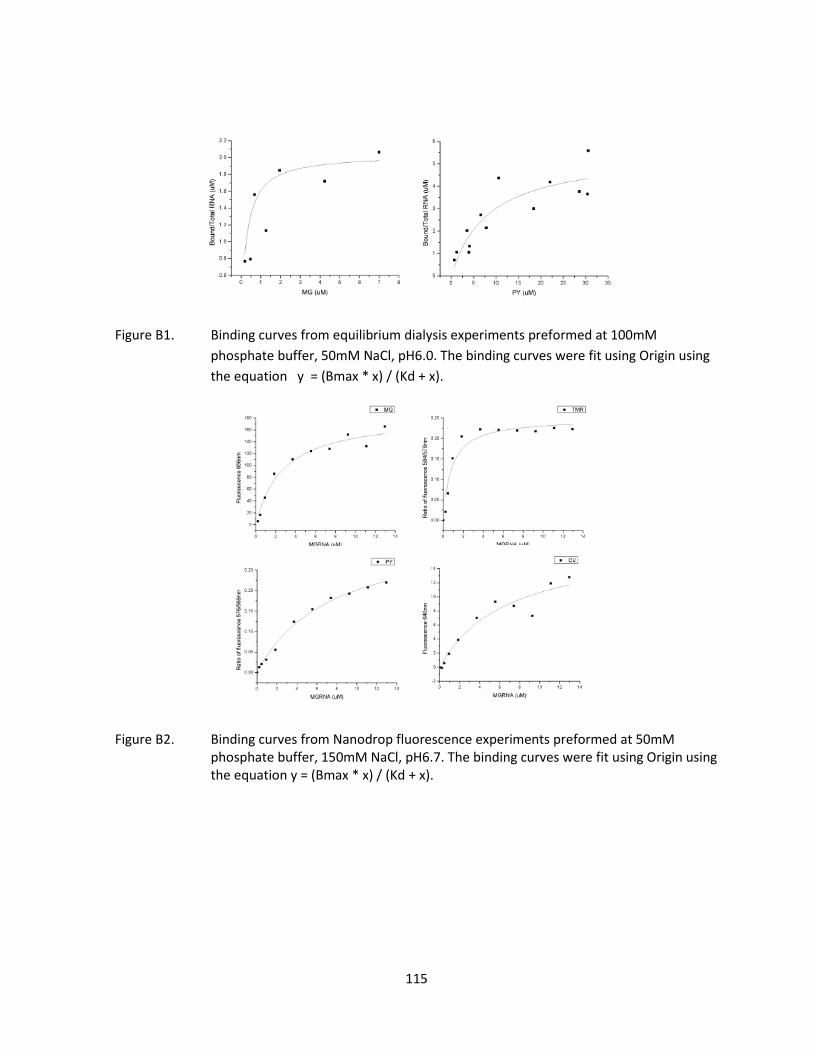
115
Figure B1. Binding curves from equilibrium dialysis experiments preformed at 100mM
phosphate buffer, 50mM NaCl, pH6.0. The binding curves were fit using Origin using
the equation y = (Bmax * x) / (Kd + x).
Figure B2. Binding curves from Nanodrop fluorescence experiments preformed at 50mM phosphate buffer, 150mM NaCl, pH6.7. The binding curves were fit using Origin using the equation y = (Bmax * x) / (Kd + x).

116
Figure B3. Right: Typical ITC raw data showing heat generated over time as dye is injected into
cell containing MGA RNA. Left: Integrated data fitted using Origin to a single binding
site model which provides Kd, ΔH, ΔS values. Experiments were preformed at 10mM
phosphate buffer with varying salt concentrations (1mM, 150mM, 1M) , pH 6.7.
Figure B4. Plot of log Ka versus log [Na+] for MG, TMR and PY binding to MGA. Data points were
fit using linear regression (Excel) to generate lines and equations. Linear regression
fits of shown as solid lines (_____) MG data (y = 0.1306x + 6.5273, R2 = 0.7426), TMR
data (y = 0.29x + 6.8315, R2 = 0.9925), and PY data (y = 0.245x +5.5827, R2 = 0.9996).
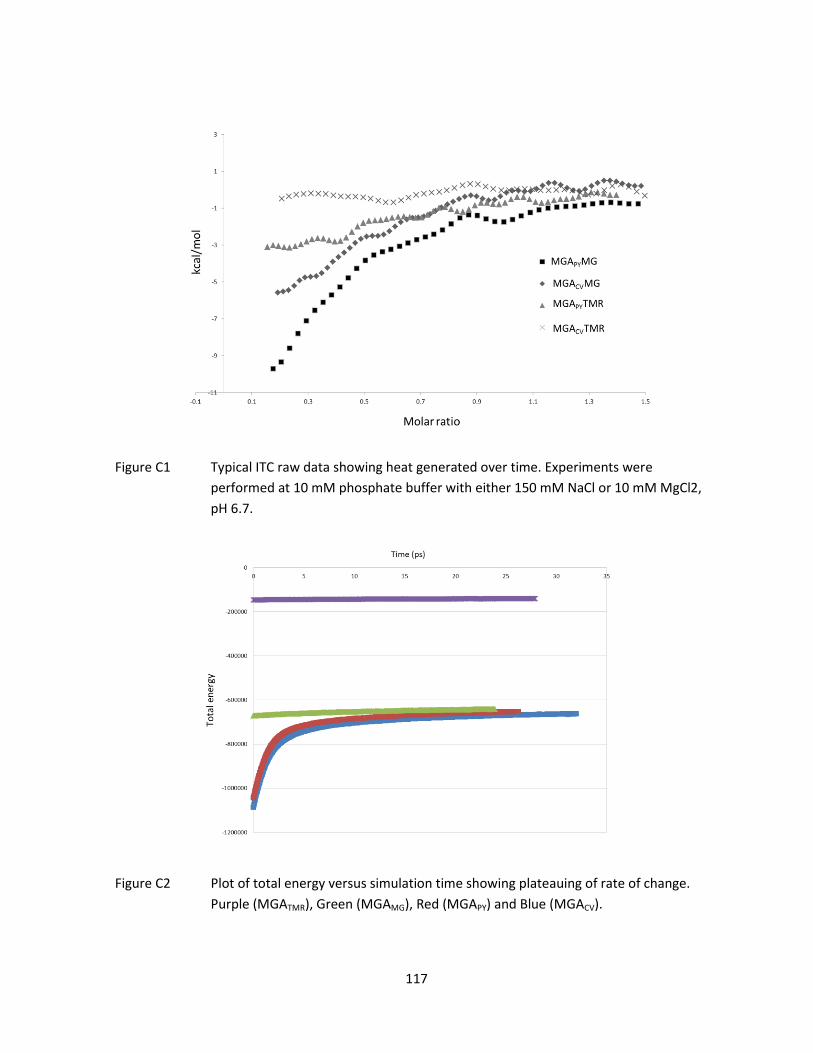
117
Figure C1 Typical ITC raw data showing heat generated over time. Experiments were
performed at 10 mM phosphate buffer with either 150 mM NaCl or 10 mM MgCl2,
pH 6.7.
Figure C2 Plot of total energy versus simulation time showing plateauing of rate of change.
Purple (MGATMR), Green (MGAMG), Red (MGAPY) and Blue (MGACV).

118
Table C1. Comparing multiple injection and single injection values obtained from ITC at 25oC in
10mM phosphate buffer 150mM NaCl, pH 6.7
Figure D1. DNA presence after n cycles of PCR after selection Round 1 lane 1: 0 cycles, lane 2:
10 cycles, lane 3: 20 cycles, lane 4: 30 cycles. DNA presence after n cycles of PCR
after selection Round 8 lane 5: 0 cycles, lane 6: 10 cycles, lane 7: 20 cycles. Gel
stained with ethidium bromide.
> DNA_FDA_3
ACAGAGGTGGATCTAGAAATGGTGTCTGCGGATCGAGAATGCTGACCAGAGAGGCTTAATATTGTACCCCTTGCTGCAAGGCT
T
> DNA_FDA_6
AAATGGCACGACAGGGCGGGAGTTAATAGCTGGTCAAGAATGCTGACCGGATCCTGGATGAATCAACTCGTCCTGCTGAGCTT
> DNA_FDA_8

119
AGCGGGACTGCCCAATCGAAGCCTGTGGGGCGATCAAGAATGCTGACCGATCAAGGGTGGATAGTATCAAGGATGGATAAGCT
T
Figure D2. Predicted quadruplex forming unit highlight and G involved underlined, identified
using QGRS mapper.
Table D1. Fluorescent measurement assay with Cy5 showing RNA interaction with avidin
RNA RFU % bound Wavelength measured
Excitation source
Ligand on beads Indicator Dye
Before application on beads 880.3 n/a 665 White FDA Cy5
After pull down 404.4 54 665 White FDA Cy5
Before application on beads 804.1 n/a 665 White None Cy5
After pull down 419.1 48 665 White None Cy5
Table D2. PCR Protocols
Protocol
Selection Round Step 1: 95oC 10 min
Step 2: 94oC 45 sec
Step 3: 50oC 1 min 25 sec
Step 4: 72oC 1 min 25 sec
Step 2 to 4 repeated n times, n = #cycles
Cooled to 4oC
Elongation PCR Step 1: 95oC 10 min
Step 2: 94oC 45 sec
Step 3: 50oC 1 min 25 sec
Step 4: 72oC 1 min 25 sec
Step 2 to 4 repeated n times, n = #cycles
Step 5: 72oC 10 min (elongation)
Cooled to 4oC
Colony PCR Step 1: 94oC 10 min
Step 2: 94oC 3 min
Step 3: 45oC 1 min
Step 4: 72oC 2 min
Step 2 to 4 repeated 3 times
Step 5: 94oC 45 sec
Step 6: 50oC 1 min 25 sec
Step 7: 72oC 1 min 55 sec
Step 2 to 4 repeated n times, n = 18 cycles
Cooled to 4oC
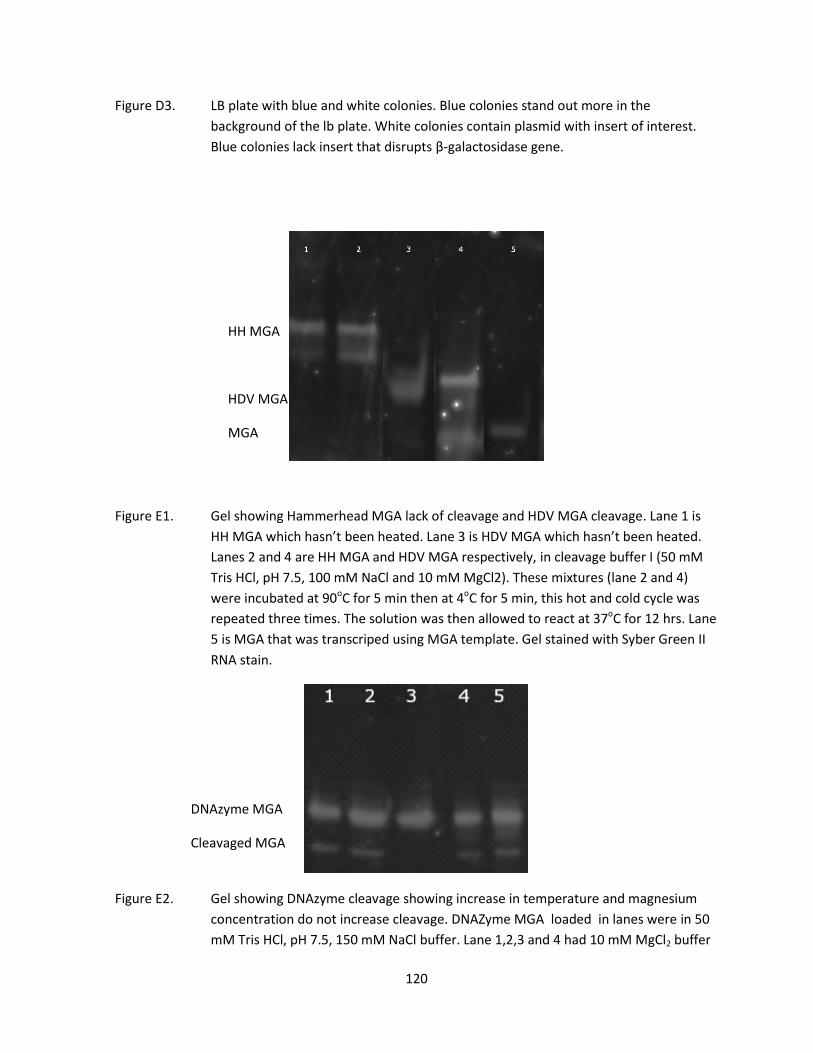
120
Figure D3. LB plate with blue and white colonies. Blue colonies stand out more in the
background of the lb plate. White colonies contain plasmid with insert of interest.
Blue colonies lack insert that disrupts β-galactosidase gene.
Figure E1. Gel showing Hammerhead MGA lack of cleavage and HDV MGA cleavage. Lane 1 is
HH MGA which hasn’t been heated. Lane 3 is HDV MGA which hasn’t been heated.
Lanes 2 and 4 are HH MGA and HDV MGA respectively, in cleavage buffer I (50 mM
Tris HCl, pH 7.5, 100 mM NaCl and 10 mM MgCl2). These mixtures (lane 2 and 4)
were incubated at 90oC for 5 min then at 4oC for 5 min, this hot and cold cycle was
repeated three times. The solution was then allowed to react at 37oC for 12 hrs. Lane
5 is MGA that was transcriped using MGA template. Gel stained with Syber Green II
RNA stain.
Figure E2. Gel showing DNAzyme cleavage showing increase in temperature and magnesium
concentration do not increase cleavage. DNAZyme MGA loaded in lanes were in 50
mM Tris HCl, pH 7.5, 150 mM NaCl buffer. Lane 1,2,3 and 4 had 10 mM MgCl2 buffer
DNAzyme MGA
Cleavaged MGA
HH MGA
HDV MGA
MGA

121
and lane 5 had 50 mM MgCl2. DNAZyme MGA mixture in lanes 2, 4 and 5 incubated
at 90oC for 5 min then at 4oC for 5 min. The solution was then allowed to react at
37oC for 4 hrs. DNAzme MGA mixture in lane 1 was incubated at 90oC for 5 min then
at 4oC for 5 min, this was repeated three times. Then the solution was allowed to
react at 42oC for 8 hrs. DNAzyme MGA mixture in lane 3 was not heated. Gel was
stained with Syber Green II RNA stain.
Figure E3. Lane on left is RNA transcribed using 2’ O-methyl template; Lane on right is RNA
transcribed with regular template. In lane on left clearly observable are two equally
bright peaks (brightness is correlated to concentration). Gel was stained with
ethidium bromide.
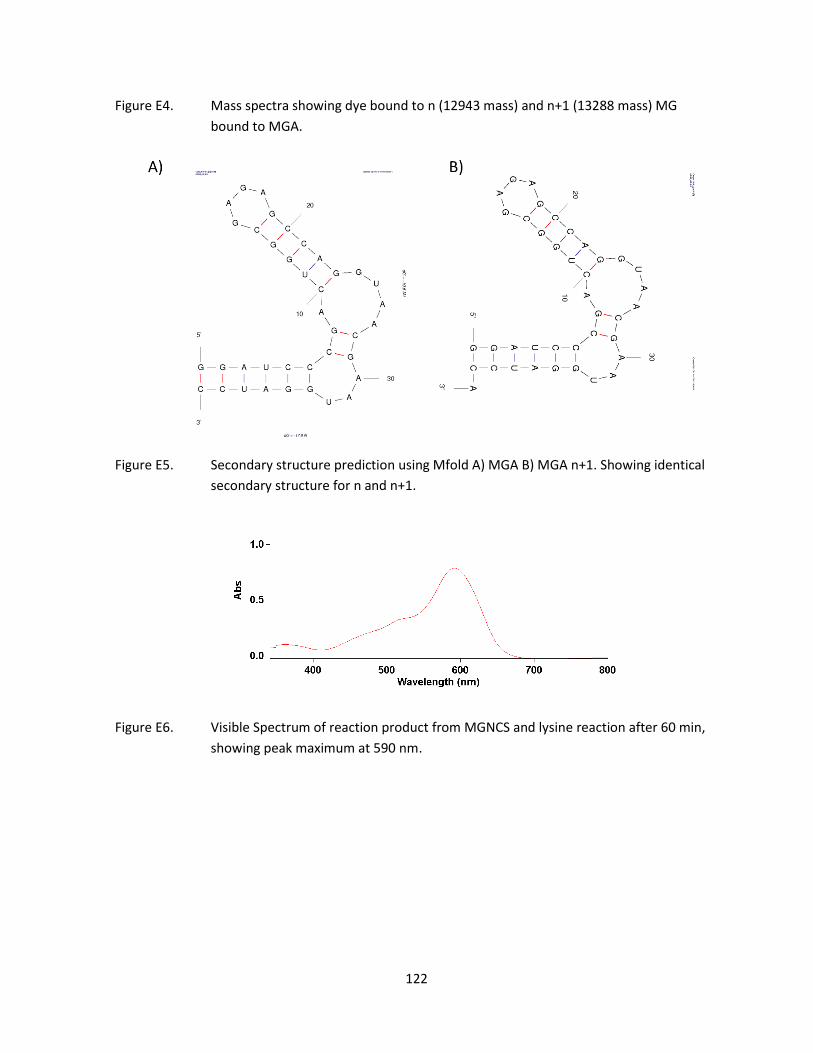
122
Figure E4. Mass spectra showing dye bound to n (12943 mass) and n+1 (13288 mass) MG
bound to MGA.
Figure E5. Secondary structure prediction using Mfold A) MGA B) MGA n+1. Showing identical
secondary structure for n and n+1.
Figure E6. Visible Spectrum of reaction product from MGNCS and lysine reaction after 60 min,
showing peak maximum at 590 nm.

123
Figure E7. Monitoring reaction of MGNCS and lysine in the presence of MGA (◊) and in the
absence of MGA (□). Both reactions are in 50 mM NaCl, 25 mM phosphate buffer, pH
5.0 and room temperature. The appears to be no increase in rate due to presence of
MGA seen by the nearly identically slopes.
Figure E8. Mass spectra of reaction product of MGCOOCF3 mixed with A) water with peak at
375 m/z suggesting MGCOO B) methanol with peak at 389 m/z suggesting
MGCOOCH3.
m/z

124
Figure D9. Mass spectra of reaction product of Michlers ketone (268 m/z) and acetyl chloride,
expected ester product would have mass of approximately 312 m/z.
m/z
Recommended