
University of Texas at El PasoDigitalCommons@UTEP
Open Access Theses & Dissertations
2014-01-01
Experimental Studies of LOX/CH4 Uni-ElementShear Coaxial Injector GeometryVanessa Dorado-MartinezUniversity of Texas at El Paso, [email protected]
Follow this and additional works at: https://digitalcommons.utep.edu/open_etdPart of the Aerospace Engineering Commons
This is brought to you for free and open access by DigitalCommons@UTEP. It has been accepted for inclusion in Open Access Theses & Dissertationsby an authorized administrator of DigitalCommons@UTEP. For more information, please contact [email protected].
Recommended CitationDorado-Martinez, Vanessa, "Experimental Studies of LOX/CH4 Uni-Element Shear Coaxial Injector Geometry" (2014). Open AccessTheses & Dissertations. 1231.https://digitalcommons.utep.edu/open_etd/1231
EXPERIMENTAL STUDIES OF LOX/CH4 UNI-ELEMENT SHEAR COAXIAL
INJECTOR GEOMETRY
VANESSA DORADO
Department of Mechanical Engineering
APPROVED:
Ahsan Choudhuri, Ph.D., Chair
Norman Love, Ph.D.
Tzu-Liang Tseng, Ph.D.
Charles H. Ambler, Ph.D.
Dean of the Graduate School

Copyright ©
by
Vanessa Dorado
2014

Dedication
I would like to dedicate this thesis to my parents, who saw my potential before I ever did.
Thank you for giving me both a vision and the strength to pursue it.

EXPERIMENTAL SPRAY ATOMIZATION STUDIES OF UNI-ELEMENT
SHEAR COAXIAL INJECTOR PLATE GEOMETRY FOR LOX/CH4
COMBUSTION AND PROPULSION RESEARCH
by
VANESSA DORADO, B.S. Mechanical Engineering
THESIS
Presented to the Faculty of the Graduate School of
The University of Texas at El Paso
in Partial Fulfillment
of the Requirements
for the Degree of
Master of Science
Department of Mechanical Engineering
THE UNIVERSITY OF TEXAS AT EL PASO
August 2014

v
Acknowledgements
I would like to acknowledge everyone whose work made this project possible: first and
foremost my advisor and cSETR director, Dr. Ahsan Choudhuri for giving me this invaluable
opportunity, Nate Robinson for his kind guidance and support, and all the team members that
ever contributed to this project, specially Robert Ellis, Gabriel Trujillo, Luis Sanchez, Juan
Barragan, Christopher Navarro, and Jesus Flores. Finally, I would like to extend my gratitude to
NASA for supporting this research venture and to LSAMP’s Bridge to the Doctorate Program for
generously funding my graduate studies.

vi
Abstract
The Center for Space Exploration Technology Research (cSETR) has developed a set of
shear coaxial injectors as part of a system-level approach to study LOX/CH4 combustion. This
thesis describes the experimental studies involved in the characterization of the effects produced
by two design injection face plate variables: post thickness and recession length. A testing
program was developed to study the injectors’ atomization process using LN2 as a substitute for
LOX in cold flow and the flame anchoring mechanisms in hot firings. The cold flow testing
stage was conducted to obtain liquid core measurements and compare its behavior between the
different geometric configurations. Shadowgraph technique was used during this testing stage to
obtain these measurements and compare them to previously published data and core length
mathematical models. The inlet conditions were selected to obtain mixture ratios in the 2-4 range
and a wide range of high momentum flux ratios (30-150). Particle Image Velocimetry (PIV) was
also used in the testing of the three injectors to assess their atomization performance and their
fragmentation behaviors. Results show that changes in central post thickness and co-annular
orifice recession length with respect to the injection plate have quantifiable effects in the
generated spray flow field, despite not being accounted for in traditional break up calculations.
The observations and results of this investigation lead to a proof of concept demonstration in a
combustion setting to support the study of flame anchoring mechanisms, also discussed in this
work.

vii
Table of Contents
Acknowledgements v
Abstract ...................................................................................................................... vi
Table of Contents ....................................................................................................... vii
Nomenclature ............................................................................................................. ix
List of Tables ............................................................................................................. x
Table of Figures ......................................................................................................... xi
Chapter 1 : Introduction 1
1.1 Background ....................................................................................................... 1
1.2 Project Overview .............................................................................................. 2
1.2.1 Problem Statement ................................................................................... 3
1.2.2 Thesis Scope ............................................................................................ 3
1.2.3 Objectives ................................................................................................ 4
Chapter 2 : Literature Review 5
2.1 LOX/CH4 in Rocket Propulsion ....................................................................... 5
2.2 Shear Coaxial Injection ..................................................................................... 6
2.3 LOX/H2 Sprays and Combustion ...................................................................... 7
2.4 LOX/CH4 Spray Diagnostics ............................................................................ 8
2.4.1 Numerical Studies and Simulations ......................................................... 8
2.4.2 Experimental Development ..................................................................... 10
Chapter 3 : Technical Approach 13
3.1 Test Article Description ....................................................................................... 13
3.1.1 Shear Coaxial Injector Set ....................................................................... 14
3.1.2 Combustion System and Testing Facilities Overview ............................. 17
3.2 Combustion System Demonstration ................................................................. 21
3.3 Cold Flow Testing............................................................................................. 23
3.3.1 Methodology ............................................................................................ 24

viii
3.3.2 Experimental Setup .................................................................................. 28
3.3.3 Flow Visualization Techniques................................................................ 31
3.4 Hot Firing Tests ................................................................................................ 38
Chapter 4 : Results 40
4.1 Cold Flow Tests ................................................................................................... 40
4.1.1 Shadowgraph Technique .......................................................................... 42
4.1.2 PIV Tests .................................................................................................. 49
Chapter 5 : Conclusion 51
5.1 Summary of Findings ........................................................................................ 51
5.2 Future Work ...................................................................................................... 51
References .................................................................................................................. 52
Appendix B ................................................................................................................ 55
Appendix C ................................................................................................................ 59
Curriculum Vitae ....................................................................................................... 60

ix
Nomenclature
Cd = discharge coefficient
D = liquid injection exit diameter
Isp = specific impulse
J = gas to liquid momentum flux ratio
K = fluid flow exit coefficient
L = jet breakup length
L0 = jet breakup length (without gas flow)
m� = mass flow rate
MR = mixture ratio
µG = dynamic viscosity of gas
µL = dynamic viscosity of liquid
Oh = Ohnesorge number
P = pressure
Pc = chamber pressure
ρG = gas density, evaluated at injector exit
ρL = liquid density
Re = Reynolds Number
σ = surface tension
σX = standard deviation
τL = recession length
τθ = LOX post thickness
Vr= gas to liquid velocity ratio
W� = steady weight flow rate
We= Weber Number

x
List of Tables
Table 3-1 Final cold flow test matrix ............................................................................................ 26
Table 3-2Schlieren system specifications ..................................................................................... 32
Table 4-1 LN2 fluid properties ...................................................................................................... 40
Table 4-2 Average fluid properties recorded for gaseous methane during cold flow testing ....... 41
Table 4-3 L/D Measurements vs. Models ..................................................................................... 47
Table 4-4 Non-dimensional Spray Diagnostics Parameters ......................................................... 48

xi
Table of Figures
Figure 2-1 Plot of LOX core length measurements from Woodward’s study as well as those from
Boniface and Reeb against gas-to-liquid J ...................................................................................... 8
Figure 2-2 Visual representations in Salgues et.al shear coaxial injection studies ....................... 12
Figure 3-1 Permanent cSETR injection test article assembly ....................................................... 14
Figure 3-2 Geometric variables in cross sectional areas of shear coaxial injection face plates,
from left to right: Injector A, B and C .......................................................................................... 16
Figure 3-3 MOAC cross sectional area and components.............................................................. 18
Figure 3-4 Ignition source: swirl torch igniter .............................................................................. 19
Figure 3-5 Blast-proof facilities at UTEP's Goddard Laboratory ................................................. 21
Figure 3-6 MOAC assembly prior to shakedown testing ............................................................. 22
Figure 3-7 Gas-gas hot firing ........................................................................................................ 23
Figure 3-8 LN2 and LOX properties comparison ......................................................................... 25
Figure 3-9 Predicted We number behavior with varying MR values ........................................... 27
Figure 3-10 LN2/GCH4 delivery system configuration ............................................................... 30
Figure 3-11 Liquid nitrogen jet visualization with Schlieren Imaging ......................................... 32
Figure 3-12 Shadowgraph imaging system layout........................................................................ 33
Figure 3-13 Cold flow shakedown test with Shadowgraph imaging using deionized water ........ 34
Figure 3-14 Hardware assembly during LN2/GCH4 tests ............................................................ 35
Figure 3-15 Experimental setup for LN2/GHC4 cold flow tests with PIV .................................. 36
Figure 3-16 Poor quality LN2/GCH4 shadowgraph images displaying freezing (left) and fogging
(right) ............................................................................................................................................ 37
Figure 3-17 Hot firings flow schematic ........................................................................................ 38
Figure 4-1 Typical inlet and chamber pressure profiles for an LN2/GCH4 run ........................... 42
Figure 4-2 Cold flow tests' interrogation area and scale ............................................................... 43
Figure 4-3Color flow distribution for Case #1, from left to right: Injector A, B, and C .............. 44
Figure 4-4 Injector core length comparisons with fragmentation models .................................... 45
Figure 4-5 Plot of LOX core length measurements from Boniface, Reeb, Woodward, and this
study against gas-to liquid momentum flux ratio ......................................................................... 48
Figure 4-6 PIV Image sequence for Injector A ............................................................................. 49
Figure 4-7 PIV Image sequence for Injector B ............................................................................. 49
Figure 4-8 PIV Image sequence for Injector C ............................................................................. 50
Figure 4-9 Untraceable ligaments observed during PIV testing ................................................... 50
Figure 5-1 Roger D Woodward et.al's shear coaxial injector configuration for LOX/GH2 ......... 54
Figure 5-2 Eberhart et.al's swirl coaxial injector element profile and dimensions ....................... 54
Figure 5-3 Zong and Yang's shear coaxial injector geometry and configuration ......................... 54

1
Chapter 1 : Introduction
1.1 Background
The work presented in this thesis is part of an applied propulsion research and education
program at the Center for Space Exploration Technology Research (cSETR), a NASA University
Research Center, at The University of Texas at El Paso. Among the goals of this research center,
is to produce a body of research that will benefit the characterization of methane as a low-
toxicity alternative propellant for aerospace and propulsion applications. The selection of this
propellant stems from the fact that, even though LOX/CH4 maintains the energy density levels
characteristic of bipropellant systems and features the highest vacuum specific impulse for
hydrocarbons, the development of flight hardware specific to it has lagged1. Benefits in mass
allocation and compatibility with liquid oxygen’s cryogenic storage temperature are some of the
most notable reasons that have placed methane as a feasible alternative to hydrogen as a fuel for
rocket propulsion. Additionally, if considered against hypergolic propellants, methane offers
lower toxicity levels and more simplified safety requirements.
The cSETR has constructed this project and the facilities that support it to the end of
advancing the body of knowledge associated with the development of LOX/CH4 combustion and
propulsion technology. The Liquid Oxygen and Hydrocarbons Ignition Physics team was formed
to materialize the characterization efforts of LOX/CH4 combustion by building upon the heritage
of systems developed for this bipropellant combination and other theoretical studies and applying
them towards the development of a reduced-scale LOX/CH4 combustion system. The
experimental nature of this project’s investigative approach has led to the design, development,
and integration of a series of components that facilitate the study of the processes leading to the
generation of thrust for liquid rocket engines running on LOX/CH4, namely, the ignition,
2
injection, and combustion of these propellants. The ignition and injection stages consist of
individual subsystems requiring their own hardware development and multi-phase testing
programs. Both of these stages are intended to be integrated into a single, modular combustion
system to facilitate hot- firing testing and ignition physics studies.
1.2 Project Overview
The spray atomization of the propellants as they are injected into the combustion chamber
has been associated with the uniformity and overall quality of the fuel burning process, leading
to an interest in the optimization of injector plate geometry. Under the aforementioned efforts at
cSETR, a test article set consisting of three uni-element shear coaxial injectors was developed to
support the spray atomization studies of LOX/CH4. The study of two geometric variables led to
the design and manufacture of the test articles: liquid post thickness and fuel injection port
recession. It is unclear how and to what extent these variables affect the breakup and mixing of
propellants. All three injectors were submitted to an identical testing program in order to
establish a comparison between the fluid dynamics observed in each case. The arrival to a
conclusion as to which configuration produces the most desirable spray characteristics would
move forward the design optimization of LOX/CH4 injection hardware.
Testing was conducted at the Goddard Propulsion Laboratory located in the University of
Texas at El Paso in two major phases: cold flow testing and hot-firing testing. The former
focused on placing methane and the injection hardware in the context of spray atomization
literature to assess the translatability of previous studies conducted for other propellants and
hardware configurations to those developed at cSETR. The latter phase sought to contribute
experimental knowledge in LOX/CH4 flame dynamics and ignition physics, while validating
each individual component as a technology demonstration.

3
1.2.1 Problem Statement
A combination of thorough numerical and experimental studies of the combustion and
injection processes associated with any propellant is essential to obtain a solid understanding of
its behavior and, therefore, its implementation in rocket engine design. The problem to address is
the scarcity of experimental knowledge of the effect of certain geometric variables in the shear
coaxial injection, one of the simplest and widely used injection configurations, of LOX/CH4.
Previous experimental studies have reportedly used heritage hardware that has been developed
for other propellant combinations without certainty of the extent to which projections of
propellant behavior translate to LOX/CH4. Various sources cite the importance, albeit at different
degrees, of parameters such as J, We, and Oh numbers, but in most cases, these parameters do
not address the sizing differences in the annular fuel injection ports, the thickness of the LOX
post, and the presence of a recession with respect of the injector face plate. These geometric
constraints have not been discussed at length although they have a direct effect liquid core/ gas
film interaction and, therefore, on the jet breakup.
Furthermore, the interaction observed during combustion between the injector’s atomized
fluid jet and the ignition source’s propellant stream has left another gap of knowledge to be
explored. Documented numerical analysis and computational simulations of this and the
atomization process would benefit from experimental validation of projected fluid dynamics in
LOX/CH4 shear coaxial injectors.
1.2.2 Thesis Scope
The sub-system relevant to this thesis is the injection system responsible of introducing
the propellants onto the combustion chamber. This thesis seeks to describe the experimental
studies associated with the atomization of methane and the spray diagnostics used to complete

4
the test program of cSETR's injection hardware. Brief discussions of the test article’s design and
the relevance and progress of this subject in the scientific community are included. This work
focuses on the fluid dynamics produced by the injector configurations developed for this project
and the implications of the injector plate geometry changes. This thesis also discusses the
methodology followed during the test article set’s testing program, the results obtained from
these experiments, and its integration as a fundamental component of the system level testing of
a LOX/CH4 combustion system.
1.2.3 Objectives
The objectives of the spray atomization studies featured in this thesis are the following:
1. Characterize cSETR’s injection test article set in a manner that the effects of its design
variables are understood and applicable to subsequent designs. This entails the study of
the liquid jet’s structure in a cold flow setting.
2. Complete an injection test program that uses methane as a propellant and allows the
comparison of the observed atomization performance with that documented for hydrogen.
3. Support the system level testing of cSETR’s LOX/CH4 combustion system, while
increasing the understanding of the injectors design’s effect on the combustion process.
This will allow for the analysis of the flame front propagation inside a combustion
chamber for the three plate injector geometries developed at cSETR.
5
Chapter 2 : Literature Review
2.1 LOX/CH4 in Rocket Propulsion
The benefits of adopting methane as an alternative fuel for liquid rocket engines are not
only one of the driving reasons for this project but also the cause of a renewed interest in
developing LOX/CH4 hardware. In 2009, the company Aerojet published the results of the 870
lbf (3.87 kN) testing of an LOX/LCH4 engine and torch igniter, citing the dearth of “serious
development” for this propellant combination since the 1960s 2. The hardware assembly used for
this testing program was a modified residual from the Aerojet Kistler Program, which was
developed for oxygen/ethanol testing. The observed combustion process described in this paper
is described as consistently stable in a Pc range of 111-190 psia. The company also demonstrated
the ability to operate with methane as it transitioned from a two-phase fluid during startup to a
sub-cooled liquid-liquid steady state. As a film coolant, methane was shown to be less effective.
However, high combustion performance and reliable spark ignition using LOX/LCH4 was
deemed achievable.
NASA Johnson Space Center’s Morpheus Project has been developing an autonomous,
reusable, rocket-powered Vertical Takeoff/ Vertical Landing vehicle for lunar precision landing
since 20103. The project intended this to be a “green” propellant lander, leading to the selection
of having a LOX/CH4 propulsion system. The availability, safety, compatibility, and potential in-
situ utilization of LOX/CH4 are cited as some of the reasons for this bi-propellant system’s
technology maturation. Operating as a blow down system, the main engine has a throttable, film-
cooled design and the ability to produce up to 4300 lbf (19.13 kN). Its reaction control system is
also devised as a LOX/CH4 propulsion system. JSC has collaborated and overseen cSETR's
methane characterization studies.

6
A partnership of European and Russian industries has also initiated technological
campaigns for LOX/CH4 concepts. The project VOLGA was presented in 2002, and it seeks to
undergo experimental and theoretical activities to develop this propellant combination primarily
for large liquid reusable booster applications4. The result of this venture has been the outline of
technical targets for an engine, from which a thrust range of 4000 kN, an MR of 3.5, and an Isp of
320s at sea level can be highlighted. This development has also surfaced methane’s
improvements over kerosene regarding the ecological behavior of the combustion byproducts
and combustion stability, among others5. More recently, the American aerospace company
SpaceX began the discussion in 2009 of Raptor, a reusable staged methane-fueled rocket engine
concept. The development of this concept has been associated with Mars exploration and its
facilitating its testing is expected to require significant enhancements to be made to NASA’s
Stennis testing facilities6.
2.2 Shear Coaxial Injection
In the early 1990s, the method for determining the operational region of cryogenic
coaxial injector was known as hydrogen temperature ramping. It consisted on inducing a
spontaneous instability by hot firing a set of injectors in a combustion chamber. However, the
spray parameters involved in the presence or absence of combustion instabilities were not well
understood. When showing the effect of propellant injection temperature in a 20,000 lbf
LOX/LH2 rocket engine, Wanhainen, Parish, and Conrad showed that rather than due to
hydrogen temperature variations, observed instability was due to the velocity ratio of the injected
liquid and gas. This premise led others to infer that a decline in droplet burning efficiency was a
probable cause and triggered investigations of the fluid dynamics involved in the liquid and gas
velocities’ interaction. One of the most significant contributions in the field of coaxial injection

7
and atomization was authored by investigators of the Pennsylvania State University. Their
studies focused on injector response, recirculation zone formation, and droplet characteristics
and were conducted using mixtures of water/air and LN2/GN2 to simulate liquid oxygen and
gaseous fuel interaction. Kaltz et.al used a shear coaxial injector showcasing a 0.1 in (2.54mm)
recession length in the central post. An analytical model suggested that at certain frequencies, the
injector response may become unstable after the fuel temperature decreases to a certain point.
Preliminary LVD measurements suggested the formation of a recirculation zone, which was yet
to be sized. A Phase Doppler Particle Analyzer system was not able to operate and measure
droplet parameters in full-flow velocities during LN2/GN due to the formation a dense spray7.
2.3 LOX/H2 Sprays and Combustion
The study conducted by Woodward et.al is relevant to cSETR’s experimental injection
system characterization since, like the cold flow experiments described in this thesis, the testing
conducted by Woodward was done with an unignited mixture and analyzed with shadowgraph
techniques, except that the propellants used were LOX/GH2. The main purpose of that
investigation was to verify that the classical breakup profile for shear coaxial injectors (the
presence of an intact core breaking up into ligaments and eventually into atomized droplets in the
downstream region) was still true for momentum flux ratios that lie beyond the already
demonstrated 1-5 range8. Several tests at high momentum flux ratios (20-150) were conducted
with a shear coaxial LOX/GH2 injector and it was found that the LOX core presented a
sinusoidal behavior that eventually stayed true to the classical breakup profile. The investigators
used a strobe-lit system and reported that no droplets were visible from the acquired images.
Some uncertainty and lost visual data occurred from window damage, low spatial resolution, and
a gap between windows of visual access. Core length measurements were compared to various
8
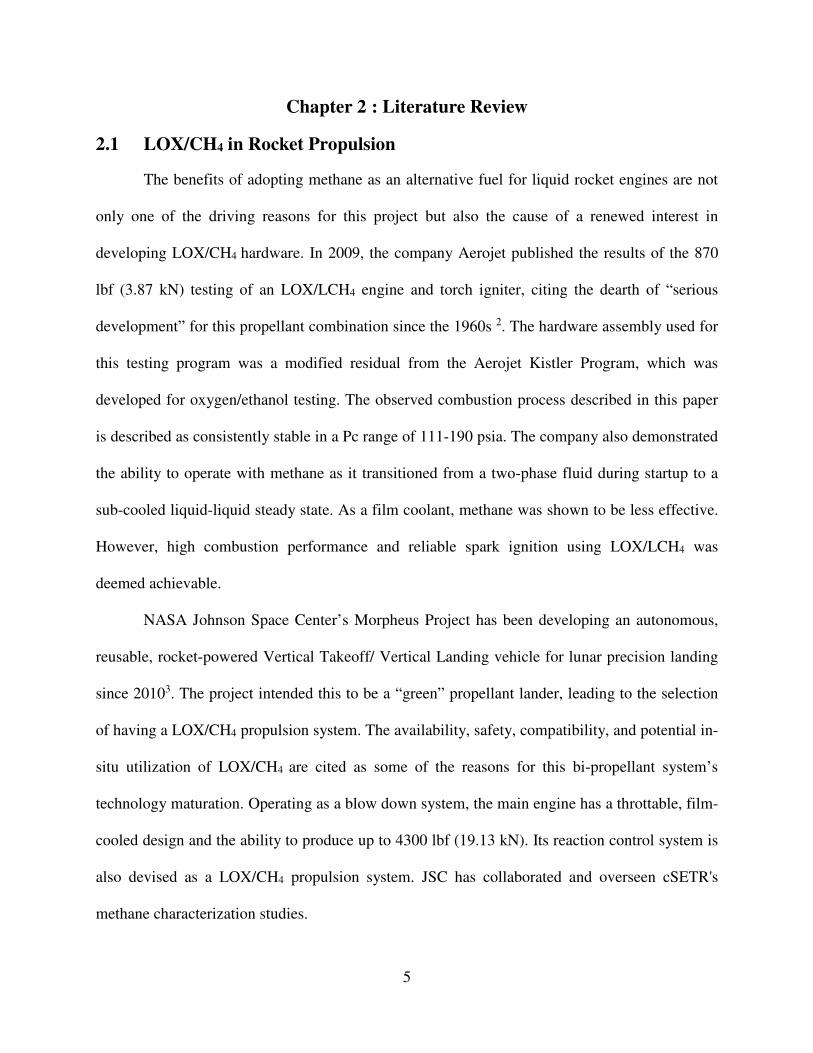
mathematical models developed for non-combustion conditions with the purpose of determining
their applicability in real rocket engine design. A total of nine models were made available to
compare observed core lengths, but only the projections by Woodward et.al, Davis’s two-phase
subcritical, and Eroglu et.al were not under-predicted by at least an order of magnitude.
Figure 2-1 Plot of LOX core length measurements from Woodward’s study as well as those from
Boniface and Reeb against gas-to-liquid J
2.4 LOX/CH4 Spray Diagnostics
Both numerical and experimental studies are important aspect of a propellant’s
characterization process. The following are some of the studies from which the project outlined
by cSETR for LOX/CH4 spray and atomization has been building from.
2.4.1 Numerical Studies and Simulations
Three-dimensional simulations are one of the means of improving the understanding of
combustion dynamics. A work published by Huo and Yang in 2011 describes the flame
stabilization mechanisms of LOX/CH4 at supercritical conditions for a shear coaxial injector. The
injector geometry is also referred as “typical” and was meant to match that of a previously

9
published experimental study and consisted on a central LOX stream separated from the co-
flowing gaseous methane by a 0.38mm LOX post. Two and three-dimensional Large-Eddy
Simulations (LES) were performed for supercritical pressures considering a laminar flamelet
model and a flamelet/progress-variable approach. In combustion conditions, formation of
primary and secondary flames was observed. Overall, strong 3D flow structures dominated the
mixing and combustion processes, and the flame appeared to follow the ligaments of oxygen
being shed from the liquid jet1. The investigators observed that the flame consistently anchored
in the recirculation zone after a splitter plate confirming known LOX/CH4 mechanisms.
Earlier, in 2009 the results of a numerical study of LOX/CH4 spray mixing and
combustion at supercritical conditions were published by the University of Salento, Italy. Their
work consisted of property calculation and CFD simulation of these processes in shear coaxial
injectors. The authors argued that combustion knowledge in methane could not be directly
transferred to methane technology because at typical injection conditions, hydrogen and methane
exhibit fundamental differences: hydrogen is far in the supercritical region while methane is near
critical. Also, hydrogen exhibits a behavior resembling of ideal gas while some of methane
properties’ behavior deviates significantly from it9. The density and isobaric specific heat was
plotted for oxygen and methane as functions of temperatures using NIST data, ideal gas
formulations, the Soave-Redlich-Kwong (SRK) equation of state, and the Peng-Robinson
Equation of state. The simulation process began with cold flow conditions, and from these
solutions, combustion and reactive scenarios were modeled. The geometry used for these
simulation was described as being that of a “typical methane-oxygen shear coaxial injector”. In
four simulated cases using NIST and SRK models, discrepancies in predicted core length were
observed. Furthermore, the activation of turbulence model LES showed eddy formations in the
10
oxidizer/fuel interface and small instability waves immediately downstream of the injector.
Although these observation establish a prediction baseline, the authors conclude that in the case
of supercritical combustion of LOX/CH4, the conditions could not be presently and accurately
predicted by commercial CFD codes.
2.4.2 Experimental Development
The combustion of LOX/CH4 was investigated experimentally by the German Aerospace
Center DLR Lampoldshausen by developing a micro-combustor equipped with optical access
and a uni-element shear coaxial injector10. This combustor served as an inspiration to cSETR's
MOAC (Multi-Purpose Optically Accessible Combustor) and its associated injection system.
The spray diagnostics used at DLR Lampoldshausen for this development program were
Schlieren photography and OH-radical visualization, both with the capability to reach frame
rates of up to several tens of kHz. The investigation covered an approximate J range of 0.2- 2.5
in hot firing tests and compared the breakup length of LOX/CH4 and LOX/H2. The findings
suggest that the general break-up behavior of both fuels as a function of J has similar tendencies.
However, the authors conclude that in order to scale LOX/H2 hardware for methane-fueled
propulsion systems, the interaction between combustion and atomization must be explored in
addition to characterizing the fluid dynamics of the spray with non-dimensional parameters.
In 2009, an experimental study of a full-scale swirl coaxial injector designed to study
combustion instabilities for LOX/LCH4 was published by the University of Alabama in
Huntsville. The study consisted of conducting cold flow tests at ambient back pressure using
filtered and deionized tap water. The actual design of the injector was reportedly developed in
accordance to “classical swirl injector design parameters”11. The flow rates were varied and their
spraying behavior analyzed with backlit and stroboscopic systems, as well as with a Phase

11
Doppler Particle Analyzer. The study focused on obtaining free cone spray angles and the
droplets’ Sauter mean diameters as a function of their radial position with respect to the center of
the spray. It was found that variances in mass flow rate produced changes in droplet size and
velocity but had a negligible effect in free cone spray angle. Eberhart and his collaborators
concluded that the viscosity and surface tension of water were dissimilar to those of LOX to the
point of impeding an accurate assessment of the true quality of the atomization for its final
application. The authors expressed interest in conducting future studies with liquid and gaseous
co-flow in the fuel annulus that allow studying the effects of post recess length.
Salgues et al. from Pennsylvania State University experimentally compared two single
element swirl coaxial injectors to a shear coaxial injector using LOX/GCH4 as propellants under
repeated conditions12. Of the two swirl injectors, one was designed to have a higher fuel velocity
than the other. The experimental study targeted a MR of 3 at a Pc of 4 bar. The optical
diagnostics used to analyze the liquid core breakup profile and flame structure produced for each
test article were OH Planar Laser Induced Fluorescence (OH-PLIF), OH* chemiluminescence,
laser light scattering and shadowgraph imaging. The velocity ratio of propellants was a major
parameter to describe atomization quality, and from it, parameters such as Weber Number,
Momentum Ratio, and Momentum Flux ratio were calculated. The Weber number was calculated
to be 65,400 and 8,400 for the swirl injectors, and 438, 293 for the shear coaxial injector. It was
observed that the swirl injector produced a liquid sheet that exited the LOX post as a radially
expanding hollow cone. This motion created more contact area with the high speed methane,
which in turn improved the atomization quality. On the other hand, the shear coaxial maintained
a somewhat unaffected liquid jet until further downstream of the combustion chamber. In a
combustion scenario, higher injector efficiencies were observed to hold an OH-PLIF signal is

12
closer to the injector face, with decreasing efficiency signifying a dispersion from the injector
centerline.
Figure 2-2 Visual representations in Salgues et.al shear coaxial injection studies
It should be noted that the investigators experienced difficulty in igniting LOX/GCH4
mixtures and comparisons between instantaneous chemiluminescence and OH-PLIF signal position
could not be made to determine whether an inner flame front close to the evaporating LOX core
existed, since disagreements in the visual data suggested it. Finally, combustion was detected away
from the chamber’s center, possibly due to the recirculation of unburned methane. The burning of the
fuel in such unfocused areas is associated with a decrease in combustion efficiency and has been
reported as an issue with LOX/CH4 combustion. A comparison of the shear coaxial injector
geometries of this and other studies can be found in Appendix A.

13
Chapter 3 : Technical Approach
In liquid bipropellant rocket engines, the design of the injector has a direct effect on how
smooth and stable the combustion inside the rocket’s chamber is. To prevent destructive surges
in the combustion chamber, it is desirable that no unburned propellant is accumulated before its
injection. A method to prevent this sort of accumulation is to provide even and effective mixing
of the propellants, a key factor in injection hardware design13. The quality of the mixing process
relates to the configuration of the injector face plate, which must be selected with other design
parameters in mind, such as: local MRs, structural integrity during operation, and injector orifice
size, a variable affecting droplet size.
3.1 Test Article Description
The shear coaxial type injector is used in gaseous fuel/liquid oxidizer type applications,
and its defining feature is the presence of two concentric orifices. Its operation consists of
flowing a jet of liquid oxidizer that, upon exiting the injector face plate, comes in contact with
the fuel in a gaseous state, exiting from a surrounding annular port, and travelling at a speed that
is at least one order of magnitude higher than the oxidizer’s velocity. The difference in the
oxidizer and fuel velocities produce a surface instability between the fluids and a shearing effect
responsible for droplet formation. The traditional atomization profile observed in shear coaxial
injection involves the formation of a relatively short liquid core in the central fluid. The droplets
formed in its vicinity signify mixing level of the propellants, which is a factor that affects the
amount of available surface area for burning.
The major factor driving the body size and design of the single injection element test
article was its interface with the combustion chamber. The interface had to possess the feature of
14
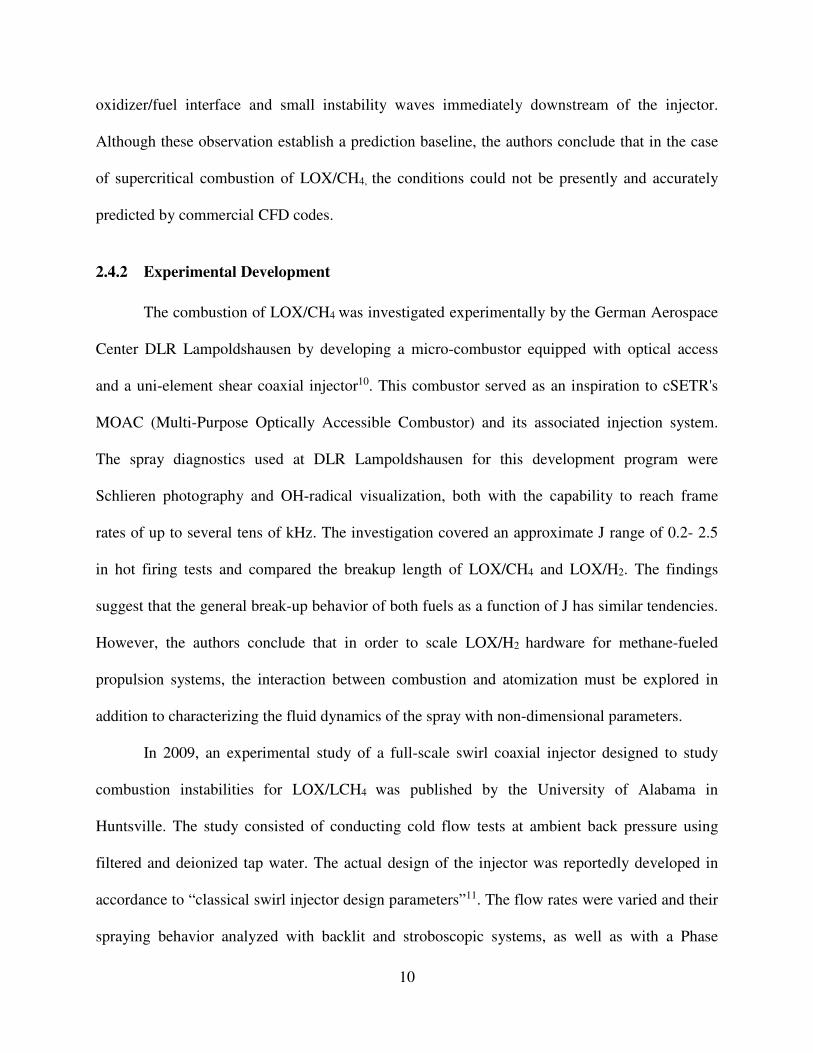
modularity to enable the test articles to be exchanged with relative ease while maintaining the
integrity of the equipment. The assembly and major design features of the test article are
discussed in this section.
Figure 3-1 Permanent cSETR injection test article assembly
3.1.1 Shear Coaxial Injector Set
The injector in use is assembled in such a way that its face plate is aligned with the
combustion chamber wall containing the allocated circumference. The allowed circumference
has a 50 mm diameter and is intended to accommodate any injection device conforming to this
constraint. During assembly, the injector is introduced into this circular space from the inside of
the combustion chamber. Once the selected injector is in place, a retainer is aligned from the
opposite side of this wall and bolted to the combustion chamber with a series of Allen head
screws. When conducting any type of testing requiring the pressurization of the combustion
chamber, RTV silicon is applied to the back of the injector face to ensure proper sealing of the
test article.
Each injector consists of a unified body that already permanently holds the fuel and
oxidizer ports and gas manifold in place by the use of welding and brazing techniques. This

15
leaves only the need of two ¼” FNPT ports to connect to the propellant feed system. The
oxidizer pathway flows directly and lengthwise across the injector body’s center starting from
the rear. The fuel pathway, on the other hand, begins at a port located on the side that feeds
perpendicularly to the oxidizer. The gaseous fuel is fed onto an internal manifold chamber that
surrounds the LOX post and allows the gas to be released annularly at a uniform pressure and
velocity.
The injectors are labeled as A, B and C for testing purposes and each is identical to the
others in all respects except for one variable in the face plate injection orifices geometry. The
sizing of the injection area and port diameters was completed using the following equations
developed by Huzel and Huang. The design process assumed a 20% pressure drop across the
injector and a K value of 1.514.
���� = � �.� ����� �������� = � .������ �
����� !.�"
In all three injectors the face plate orifices have the exact same injection areas: 3.14 mm2
in the central liquid orifices and 2.84 mm2 in the annular gas orifices. The central liquid orifice
in all cases has a diameter of 2 mm (0.0787 in). Each of the injectors has been labeled according
to the variations in their face plate and can be explained as follows:
Injector A: Baseline design, with a fuel outer annulus diameter of 5.2 mm and liquid post
thickness (τθ) of 1.42 mm.
Injector B: the liquid post thickness τθ is increased to a value of 2.26 mm, resulting in a thinner
film of surrounding gas during atomization.
Injector C: a recession length τL of 5 mm with respect to the face plate is added, sinking the LOX
post and otherwise retaining the same geometrical configuration as injector A. Introducing a

16
recession with respect to the injection plate surface results in the brief mixing of the fluids prior
to their complete exit from the injector’s body.
Figure 3-2 Geometric variables in cross sectional areas of shear coaxial injection face plates,
from left to right: Injector A, B and C
Spray Parameters
The evaluation of the following parameters is an important aspect of the description of
shear coaxial injection:
(1) Momentum Flux Ratio: J= �$%&��&%&�
(2) Weber number: We= '%$(%&)��$*&
+
(3) Ohnesorge number: Oh= ,&
'�&+*&)-�
, where UG is the velocity of the gaseous fluid at the outlet and UL is the velocity of the outgoing
liquid jet.
These parameters can be experimentally calculated from the injection test articles’ orifice
geometry and the inlet flow conditions, thereby allowing the analysis of the resulting spray
atomization process. The first parameter, J, is a specification used in liquid rocket engines that

17
use coaxial injection, which typically have a momentum flux ratio that falls in a range of 2 to
118.
It is of paramount importance to note that for a given inlet condition (a set of liquid/gas
mass flow rates) these three parameters will have identical magnitudes for the three test articles.
This will be true as long as the fluid properties are consistent, since the liquid orifice diameter is
the same for all injectors, as is the fuel injection orifice areas. The hypothesis at this stage of the
project is that the geometric variations present in the test articles, which are unaccounted for in
these parameters, will produce visually discernible changes in the spray profile observed by each
test article. If this is proven to be true and these changes can be quantified as different mass flow
rates are tested, the geometric variable producing the most favorable break-up profile could be
adopted to develop future, optimized iterations of this type of injection hardware.
3.1.2 Combustion System and Testing Facilities Overview
The following are the other major components of this experimental program. Each of
them was developed and validated individually and played a major role at some point of the
injector set’s characterization.
Multipurpose Optically Accessible Combustor (MOAC)
The Multipurpose Optically Accessible Combustor (MOAC) is a small-scale combustion
chamber that has the ability to produce 71 N of thrust and sustain an Isp of 368 s for up to 30
seconds using LOX/LCH4. The total combustion volume is 80x80x150mm and the throat of the
converging section located at one of its ends has a diameter of 6mm. The chamber was
manufactured from Stainless Steel 304 with a wall thickness of 4.2 cm. The maximum allowable
pressure and temperature have been rated as 290 psia (2MPa) and 3000K respectively, but it is
recommended that these levels are not sustained for periods of time exceeding 20-30 seconds.

18
Figure 3-3 MOAC cross sectional area and components
The optical access is granted by four fused quartz windows, each with a thickness of 3.5
cm. Two large windows are positioned to comprise the area of combustion and two smaller ones
are intended as access points for a laser sheet or other optical diagnostics. The large windows are
secured by mounting brackets secured with 20 m5 SS 316 hex head bolts, while the mounting
brackets for the smaller windows are secured with 10 m3 SS 316 hex head bolts. Modularity is
an important feature of the MOAC, since it houses the injector and allows for its simple removal
and replacement like that as well as for other instrumentation’s. Several ports are built into the
MOAC to facilitate the installation of temperature and pressure instrumentation. One of these, a
NPT port is used for the interface with the torch ignition system.
The internal pressure created during operation adds a self-sealing capability to the
chamber, but other measures must be taken to ensure proper sealing. Pieces of alumina silica
gasket are cut to match the interfacing metal-to-metal surfaces of the window mounting brackets.
Additionally, RTV silicone is applied to the edges when anticipating high chamber pressures and
left to cure once the assembly has been prepared for testing.
Injector Assembly
Visible Area
Converging
Section Face plate

19
Swirl Torch Igniter
The swirl torch igniter is the ignition source developed in house for this project. It has
undergone an iterative process to empirically improve the reliability and range of ignition. The
torch ignition system houses an internal swirl that triggers the mixing of propellants by the
momentum of colliding injections. The oxidizer flows down the main channel and interacts with
four tangential methane inlets that form a swirl that causes the mixing of the propellants prior to
ignition. The injection distance (the distance that the oxidizer flows until coming in contact with
the fuel) was increased from 1/4” to 1”15. The latest iteration of the torch igniter consists of a
unified body containing both oxidizer and fuel injection manifolds. The mixed propellants are
then ignited using via spark ignition. This consists of a tungsten lead surrounded by silica
ceramic that supports an electrical arc. The arching is initiated by a 25 kV step up transformer.
Figure 3-4 Ignition source: swirl torch igniter
Facilities and Other Capabilities
The cryogenic delivery system used for combustion experiments is located inside a blast-
proof bunker inside the Goddard Propulsion Laboratory. The delivery pipeline network consists
of two main lines, one for the oxidizer and one for the fuel, and each counts with its own pre-
chill and purge branch. The delivery lines are made of high purity 304 Stainless Steel to ensure
compatibility with LOX, and they are supported by a stainless steel L-bar structure. The size of

20
the delivery lines was selected to limit the Reynolds number to be less than 2000 as a means to
reduce detonation risks in the liquid oxygen line and control heat losses. The lines feed into the
combustion test article, which may be set up in an atmospheric conditions test stand or inside a
vacuum chamber, also known as a Multipurpose Altitude Simulation System (MASS). A set of
Kevlar panels separate the cryogenic storage tanks from the experimental setup to protect the
hardware in case of an outburst in the tanks.
The logistics of the experiments are ultimately controlled remotely from a room adjacent to
the bunker by the manipulation of a Graphical User Interface (GUI) created with LabView. The
programming of the PCI cards is performed using National Instrument’s DAQ Assistant tool.
The data acquisition process is achieved by the channeling of the instrumentation wires to an
excitation signal and a data sampling module. The program and its graphical interface allow the
user to configure running times during the tests, select a stopping mode (manual, automatic, or
emergency), and command the actuator valves through an array of solid state relays. The wiring
of the DARCS is present inside the bunker to couple with two main categories of components:
controlling and metering devices. The controlling connections allow for the activation and
deactivation of one or more components represented in the patch panel in either side of the
system, while the metering components feed the response to the display monitors in the control
room. Also, the experiments can be remotely monitored and recorded by a four channel Digital
Video Recording (DVR) system.

21
Figure 3-5 Blast-proof facilities at UTEP's Goddard Laboratory
A similar interface between propellant delivery system, controls, and data acquisition
system exists for experiments mounted outside of the bunker, such as the cold flow test not
requiring blast-proof protection. The deliver-controls interface will have a different scale and
configuration according to the needs of the specific tests, and each flow schematic with its
respective GUI will be outlined for each test matrix.
3.2 Combustion System Demonstration
The integrated combustion system was assembled and tested in the Spring 2012 term in a
hot firing setting to assess its functionality and performance. The first iteration of the swirl torch
igniter and one of the shear coaxial injector were assembled onto the MOAC and fed with the
cryogenic delivery system installed at the Goddard Laboratory’s blast-proof bunker.

22
Figure 3-6 MOAC assembly prior to shakedown testing
Two different shakedown tests were performed. The first test consisted of running air and
gaseous methane at an O/F ratio of 17.3. Poor mixing and flame blowout were major issues to
address when controlling the injection velocity of both gaseous fluids, since the shear coaxial
injector is designed for co-flowing liquid and gas. In the end, the mixture was successfully
ignited, and the MOAC proved the ability to contain the flame and byproducts while allowing
this process to be recorded through its windows. The second test consisted of running a gaseous
oxygen and methane mixture at an MR of 3.5. Several runs were made to progress the MR to an
O2/CH4 stoichiometric value of 4.0 with volumetric flow rates of 42 LPM for oxygen and 56
LPM for methane. The range of injection pressures was 40-50 psi, and the duration of the firings
was limited to 25 seconds in all cases. The MOAC was able to withstand and support these
conditions as well. Hard ignitions were observed when the order in which the propellants were
introduced was not the appropriate one; specifically, when methane was injected first to avoid
blowouts of the torch igniter flame with the oxygen flow. Adjustments in pressures and flow

23
rates were made to allow both propellants to be injected simultaneously, but the torch igniter had
to remain turned on for as long as ignition was needed.
Figure 3-7 Gas-gas hot firing
No damage or crack propagation was observed in the quartz windows post-test. However,
disassembling the large windows from the MOAC posed some difficulties due to the thermal
expansion of the chamber. This problem can be mitigated with pre-sanding of the windows and
ensuring proper sizing during assembly.
3.3 Cold Flow Testing
Cold flow testing is often used to improve the understanding of the fluids’ behavior prior
to hot-firing a specimen. The characterization of injectors used to support LOX/CH4 testing has
not been an exception. For example, the testing of Aerojet’s modified platelet injector involved
cold flow tests of the hardware with water to verify injection uniformity and determine hydraulic
resistance2. The value of these studies lies in that the injection process is isolated from the
chemical reactions present during combustion.
In this project’s cold flow testing stage, the purpose was to obtain a general idea of the
behavioral tendencies of the propellants as they were injected out of each of the test articles. The

24
cold flow tests involved the computation of spray parameters and the integration of flow
visualization techniques. Ranges of mass flow rates, temperatures, and pressures were laid out to
establish a framework for the project.
3.3.1 Methodology
A test matrix was designed to compare the behavior of propellants as they are injected
onto a slightly pressurized (Pc~17 psia) combustion chamber in cold flow through different
injector geometries. Initially, the main success criterion of the cold flow testing was simply that
enough high quality images were collected to determine which of the three injectors produces the
best atomization. A large test matrix consisting of a MR range of 1-8 was laid out as well as
retesting sessions with gradual increments in chamber pressure. However, after completing
preliminary runs at low and high mixture ratios and consultation sessions, it was determined that
a MR range of 2-4 produced the observations that were the most relevant and valuable to the
injector characterization discussion. Chamber pressure is not only a variable that is not involved
in the computation of spray parameters, it also proved to have negligible effects in tests
conducted at other testing facilities whose pressurization capabilities exceeded those of the
Goddard Propulsion Laboratory. Therefore, the high pressure tests were suspended, and the runs
lying outside of the newly narrowed MR range were discarded. During the test planning phase, it
was decided that quantitative data was attainable with the available flow visualization systems
and that a more complete assessment of the flow field would be completed.
The selection process of the propellants to be used in the cold flow took into
consideration two main factors: similarity of the fluid properties involved in LOX/GCH4
interaction and safety of the system operation. Using gaseous methane as the fuel injected
through the annular orifice was a logical choice for characterization purposes. There were several

25
candidates for the central liquid fluid as there was precedence for using water, liquid nitrogen,
and liquid oxygen in this type of tests. Due to safety issues and to enable the testing to be
conducted outside of the blast-proof facilities as to not conflict with other projects’ testing
schedules, LOX was no longer a feasible option. A study comparing the behavior of the
properties relevant during breakup (density, surface tension) in their cryogenic state was
performed for LN2 and LOX. Based on the comparison, LN2 was selected as a substitute to LOX
during cold flow testing. The properties were plotted for the entirety of the pressure ranges that
could be expected during operation.
Figure 3-8 LN2 and LOX properties comparison

26
Cold flow testing was conducted in an atmospheric aluminum rig at the Goddard
Laboratory. The same inlet conditions were targeted for each injector to cover the same mixture
ratio and momentum flux ratio ranges and establish a comparison between the test articles.
Optical diagnostics will be put in place to record the breakup process and assess the findings
post-test. A detailed description of the test matrix and the flow visualization systems follows.
Test Matrix
The mixture ratio range (2-4) was selected to resemble the burning O/F ratios of typical
methane engines and the values near the stoichiometric O/F ratio. The tests were also developed
to study a momentum flux ratio range that lies above what are considered to be high J values,
since it has been suggested that the spraying process would be identified near the injection
plate16. A total of four different MR values were tested with the addition of a LN2-only run to
assess the jet without the shearing effect. Targeted values for mass flow rates, mixture ratios and
J are shown in Table 3.1.
Table 3-1 Final cold flow test matrix
In the inert mixture, the LN2 flow rate was meant to be kept constant while the methane
flow rate was varied to test the different mixture ratios. The maintenance of the flow rates was
Case # GCH4 Mass
Flow rate, kg/s
(lbm/s)
LN2 Mass Flow
rate, kg/s (lbm/s)
MR
Vr=
UG/UL
J= (ρGUG2) /
(ρLUL2)
0 0 0.01±0.002
(0.022±0.004)
∞ - -
1 0.0025±0.005
(0.0055±0.011)
0.01±0.002
(0.022±0.004)
~4.0 105 30
2 0.0028±0.005
(0.0066±0.011)
0.01±0.002
(0.022±0.004)
~3.5 120 45
3 0.0035±0.005
(0.0077±0.011)
0.01±0.002
(0.022±0.004)
~3.0 145 55
4 0.0045±0.005
(0.0099±0.011)
0.01±0.002
(0.022±0.004)
~2.0 230 150

27
achieved by setting the tank pressures beforehand and ensuring that the desired flow rate would
be outputted.
In order to calculate these targeted values, the fluid properties that would be actually
observed during the experiments had to be predicted. The surface tension of the liquid nitrogen
was taken to be 0.004N/m, for instance. With targeted mass flow rates and velocities, a
prediction of the spray parameters was also possible as seen in the case of momentum flux ratios
in the above table. The Oh number, which described only the liquid core for a given condition
was calculated to be approximately 0.0014. In the case of We numbers, the expected values were
plotted with respect to MR.
Figure 3-9 Predicted We number behavior with varying MR values
Core length analysis
The core length is a parameter that has been used in previous experimental studies to
study and develop liquid core fragmentation models. This parameter is obtained by normalizing
the jet breakup length measurements and normalizing them by the central liquid core diameter,
which in this project is 2 mm. The core breakup length was one of the most significant outputs of
the cold flow tests and it was obtained with the shadowgraph technique visualization.

28
A comparison between core fragmentation models and measured values in this study is
needed to correlate the obtained results with existing literature on jet core length analysis. From
the fragmentation models discussed in the Literature Review section, two were selected as
baseline predictions for the core breakup lengths.
Woodward model: 0.0025'�$�&)(!.1123*!.��34(!.�� (1)
Davis model: �"
567.� (2)
The Woodward relation was favored over another very similar model by the same author
for its applicability to nitrogen data, which has substituted oxygen as a central fluid in these
experiments. Similarly, the Davis model was selected over another of this author’s correlations
since the above model is applicable to two-phase coaxial jets in subcritical conditions, namely
cases where both the ambient and the co-annular fluids are in gaseous state and interacting with a
liquid jet8.
3.3.2 Experimental Setup
One shear coaxial injector at the time was mounted on the MOAC and operated on an
atmospheric aluminum rig. The experiments were conducted with an inert mixture that was
exhausted from the combustion chamber onto a venting duct. The three major components of the
test setup that enable the collection of data are the propellant delivery system, the LabView data
acquisition system that monitors and records the flow properties, and the flow visualization
system.
Delivery System
To calculate the mass flow of liquid nitrogen, a cavitating venturi flow meter paired with
a differential pressure transducer was installed on the cryogenic delivery line and used as an

29
orifice. Knowing the dimensions of this venturi as well as the fluid properties and the discharge
coefficient, the flow rates for given pressure drops across the venturi can be calculated. The
following equation, which is valid for downstream pressures totaling 80% of the upstream
pressure readings, is used to calculate volume flow rate.
8� = �9:;<2(=> − =�)@(1 − B1) Where At=0.0081cm2, Cd~0.95, β=d/D and the LN2 density is evaluated at 200 psia and
110 K. This formula gives accurate volumetric flow rate as long as nitrogen is liquid at both
inlets of the differential pressure transducer. This is verified by measuring the downstream
temperature to be less than 110K, which ensures there is liquid at the downstream point. After
setting a tank pressure, P1 and P2 values were recorded to obtain a pressure drop values. The
calculated volume flow rates were inputted to obtain a plot and a relationship with mass flow
rates in Excel. For ease of calculation in LabView, a simplified curve fit was found relating mass
flow rate in kg/s to pressure drop in psia and is shown below. The R2 value was calculated to be
~0.998.
C� = .0023(∆=)."
Gaseous methane flow rates were measured using the readings of a volumetric flow
meter. The readings were noted to then be adjusted with pressures set in the methane tank. The
change in working fluid is then performed since the instrument is calibrated for nitrogen gas.
From a calibration table for several common gases provided in the instrumentation manual, the
measured volume flow rate of the gaseous methane is divided by a factor of 0.75. With
measurements from a thermocouple and pressure transducer located in the entrance of the
methane flow path, the density was obtained and used to calculate the mass flow rate of the

30
methane. The methane pressure was adjusted to obtain the mass flow rate desired and provide a
known tank pressure value prior to testing. The following curve fit equation is used to make
conversions from volume (LPM) to mass (kg/s) flow rate when setting the desired flow meter
readings and when analyzing the data post-testing:
(1) C� = 0.00178� � G 0.0038� − 0.0003
A schematic of the propellant delivery system can be observed in Figure 3.9.
Figure 3-10 LN2/GCH4 delivery system configuration
Instrumentation List
• 2 x Omega Cryogenic Pressure Transducer
o 0-250 psia
o Used at the injector feed ports to measure inlet pressure to the test article (one for
each line)
• 1 x Sensonetics Fast Response Pressure Transducer
o 0-300 psia
o Used to record and monitor Pc in the MOAC
• 3 x Omega E-Type Thermocouple
o 2 installed at both injector feed ports to the test article (one for each line)
o 1 installed at in the top face of the MOAC to monitor chamber temperature

31
• 1 x Stellar Differential Pressure Transducer
o 0-25 psia
o Used to take the differential pressure across the venturi to calculate LN2 mass
flow rate
• 1 x Omega Flow Meter
o 0-200 Liters per Minute
o Used to take the measurement of the volumetric flow rate of the methane into the
test article
• 1 x DANTEC Dynamics high-speed camera
o Used to collect imaging data at a high frequency
• 1 x LED light source
o Illuminates the background of the MOAC’s quartz windows
• 1 x Edmond Optics light diffusing plate
o Filters the light to provide an adequate background for shadowgraph imaging
3.3.3 Flow Visualization Techniques
The visualization of the liquid core and its breakup mechanisms as it fragments
into droplets of ignitable mixture is major product of this study, and several flow visualization
techniques were considered and tested to this end. Throughout the project, Schlieren imaging,
shadowgraph technique, high speed color recording, and particle image velocimetry were used in
some degree or another. A description of each technique and its role in the project follows.
Schlieren Imaging
Schlieren imaging is considered a simple photo-optical technique and these type of
systems allow the user to visualize the density variations occurring during fluid interaction of
transparent media through light refraction. The installation and operation of a Z-type Schlieren
system was part of the early injector characterization efforts at cSETR. The optical system had a
traditional configuration and was used to visualize preliminary cold flow runs with liquid
nitrogen and candle flames14. The images obtained were not used for any rigorous liquid core or
flame analyses, but served to compliment the project’s flow visualization capabilities and
provide an expectation for future recordings and optical diagnostics. Some specifications of the
optical system’s major components are as follows:

32
Table 3-2Schlieren system specifications
Component Type/ Description Quantity
Camera Monochrome CCD 1
Light source Specialty halogen, Oriel1000 W 1
Mirror 6” diameter, 24” focus length, F no.= 4 2
Figure 3-11 Liquid nitrogen jet visualization with Schlieren Imaging
Shadowgraph Technique
The optical diagnostics hardware used to retrieve shadowgraph imaging data consisted of
a specialized National Instruments processor, a high speed DANTEC SpeedSense, S/N: 105
camera, and a timer box. The backlighting of the system was achieved with a light diffusing plate
manufactured by Edmond Optics and a pulsing LED source. The program used for data analysis
was DANTEC’s Dynamic Studio software installed in an adjacent PC.

33
Figure 3-12 Shadowgraph imaging system layout
The initial installation of the system was done on a work bench inside the Challenger-
Columbia Structures and Materials Research Facility at UTEP, and its shakedown testing was
performed with deionized water and gaseous nitrogen. The goal of these tests, more than the
gathering of scientific data, was to obtain information about the capabilities of the system at hand
regarding image quality, the focusing and calibration processes, as well as the synchronization
between software and hardware. From these runs, it was understood that the collection of liquid
water, or in later tests with condensation from cryogenic flow, in the walls of the MOAC would
hinder the visualization of the jets significantly. A sense of the flow rate control required to
avoid this was obtained with the pressurization of a water tank, as well as estimates of the time
frames needed to obtain a comprehensive observation of the flow. It was determined that after a
short time interval (`1-2 seconds) the behavior of the jet was stabilized and due to the high
frequencies that the optical equipment was capable of reaching, a large amount of visual data
could be obtained in less than one minute. An individual frame taken during the water
shakedown tests is shown in Figure 3.12.

34
Figure 3-13 Cold flow shakedown test with Shadowgraph imaging using deionized water
Once the optical system was integrated and tested it was transferred to an aluminum
testing rig inside the Goddard Propulsion Laboratory. After training with a representative from
DANTEC several fine tuning sessions, the recording settings were decided to be a collection of
3200 images per run, at a frequency of 200 Hz, over a period of 16 seconds. To arrive at this
duration, it had to be ensured that each video would encompass from the beginning of the
interaction between the LN2 and GCH4 so that it would allow for several instantaneous
measurements after recording. Additional specifications (DANTEC Dynamic Studio v3.12
User’s Guide) of the shadowgraph system are:
Model: 9070
Max. Resolution: 1280x800 pixels
Bit depth (bits): 8, 12
Frame per second (FPS):3140/1570
Min. exposure time (μseconds):1
Pixel size (microns): 20

35
Initially, the cold flow tests were expected to produce exclusively qualitative data. It was
at the prospect of collecting and comparing jet lengths that a means to ensure accurate
measurements was required. The measurement process entailed obtaining a precise scale in the
image processing software. More specifically, the clarity of each individual image must be such
that the outgoing fluids can be measured in the millimeter scale provided by the software’s
calibrated database. To do this, a calibration procedure was followed each time a new database
(set of individual sessions) was created. The calibration procedure of the image processing
software can be found in the Appendix C. Once the database is calibrated and all connections are
verified, the test conductors can prepare for a cold flow run. As outlined in the procedure, the
interior of the MOAC must be previewed during cooling to ensure proper focus and lighting of
the outgoing fluids. The high speed camera must be fixed on the aluminum testing rig on the
same plane as the MOAC, the LED source, and the light diffusing plate.
Figure 3-14 Hardware assembly during LN2/GCH4 tests

36
PIV Testing
PIV testing was incorporated to support the observations and analyses made with the
shadowgraph system. In the MOAC, two windows encompass the entire combustion area while
the two smaller ones are 3 cm across to allow for a laser sheet to be inserted into the chamber for
this very purpose. The targeted flow condition was the same as Case #3 of the revised cold flow
test matrix. The propellant properties, test articles, and major hardware components remained
unchanged and only the optical diagnostics setup was modified. The same high speed camera
and software were used in these experiments, but the camera was placed in a vertical position to
accommodate the 90 degree angle with respect to the laser sheet required by the PIV system as
seen in Figure 3.15. Additionally, a 520 microns filter was placed in the high speed camera to
filter out the ambient light for “noise” cancelling effect. The laser used for these runs was a Dual
Power, class 4, Nd: YAG laser with a maximum power output of 400mJ. The pulse duration of
the laser firings is set to 4 ns and the unit has a frequency upper limit of 15 Hz.
Figure 3-15 Experimental setup for LN2/GHC4 cold flow tests with PIV
37
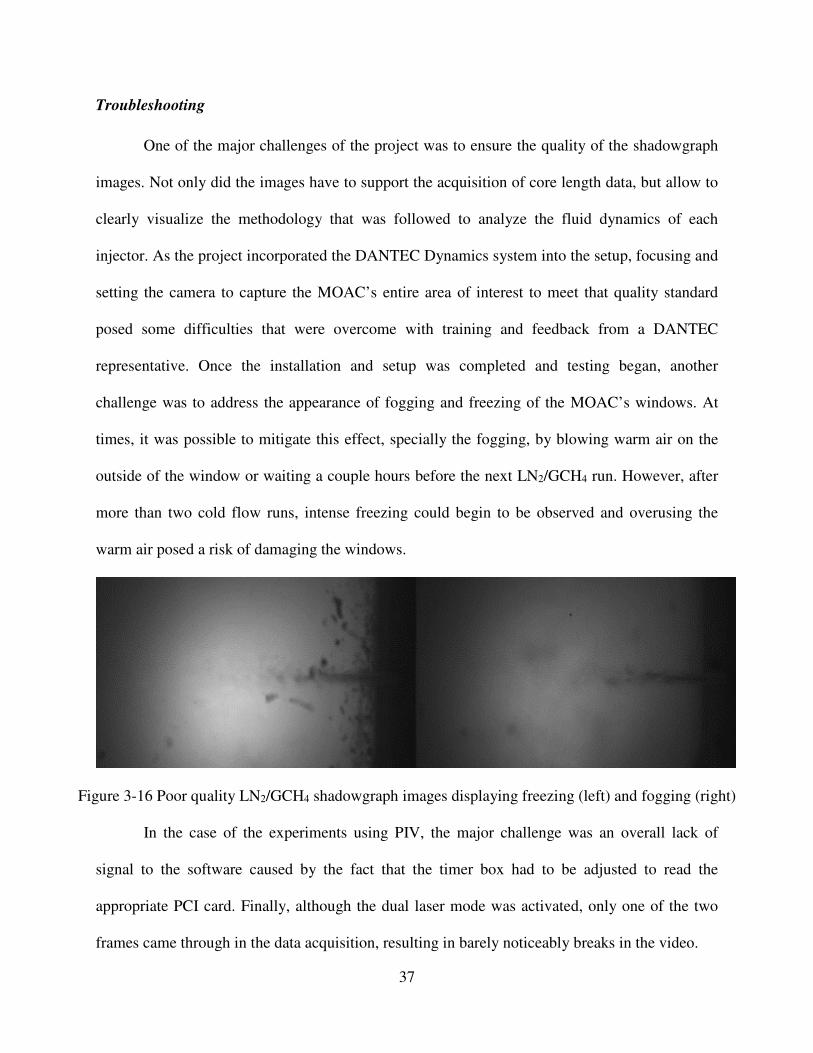
Troubleshooting
One of the major challenges of the project was to ensure the quality of the shadowgraph
images. Not only did the images have to support the acquisition of core length data, but allow to
clearly visualize the methodology that was followed to analyze the fluid dynamics of each
injector. As the project incorporated the DANTEC Dynamics system into the setup, focusing and
setting the camera to capture the MOAC’s entire area of interest to meet that quality standard
posed some difficulties that were overcome with training and feedback from a DANTEC
representative. Once the installation and setup was completed and testing began, another
challenge was to address the appearance of fogging and freezing of the MOAC’s windows. At
times, it was possible to mitigate this effect, specially the fogging, by blowing warm air on the
outside of the window or waiting a couple hours before the next LN2/GCH4 run. However, after
more than two cold flow runs, intense freezing could begin to be observed and overusing the
warm air posed a risk of damaging the windows.
Figure 3-16 Poor quality LN2/GCH4 shadowgraph images displaying freezing (left) and fogging (right)
In the case of the experiments using PIV, the major challenge was an overall lack of
signal to the software caused by the fact that the timer box had to be adjusted to read the
appropriate PCI card. Finally, although the dual laser mode was activated, only one of the two
frames came through in the data acquisition, resulting in barely noticeably breaks in the video.

38
3.4 Hot Firing Tests
The initial hot fire testing stage is to be a replica of the LN2/GCH4 test matrix since there
is precedent for the fluids’ behavior. These tests are to be conducted in the blast-proof facilities
and will involve injecting LOX and GCH4 into the MOAC and igniting the resulting mixture
with cSETR's swirl torch ignition system. The torch igniter will be fed with exclusively gaseous
propellants in a mixture ratio range previously tested for reliability. The ignition times must be
limited to 2-3 seconds for a total firing time of no more than 10 consecutive seconds. The
control of the LOX mass flow rate will be supported with the previous cavitating venturi
development performed for the Goddard’s propellant delivery system. The upper limit of the
mass flow rates will be dictated by the flow measurement instrumentation and adjusted to remain
in the MR range of 2-4. The configuration of the delivery lines and the mounting location of the
MOAC inside the MASS system are shown in Figure 3.17.
Figure 3-17 Hot firings flow schematic

39
The recording instrumentation available for these initial tests are a GoPro camera and the
high-speed SpeedSense camera used in the cold flow tests. The visual recording instrumentation
must be position outside of the MASS optical access window located on its side to avoid
damaging the cameras and other accessories. Since the MOAC must be securely fastened to a
stainless steel mounting plate resting on the inner rails of the MASS’s vacuum chamber, it is
necessary to raise the MOAC so that the quartz windows is in the same plane as the vacuum
chamber’s window and the camera lens. Subsequent testing ought to look into the incorporation
of OH luminescence capabilities.
It is recommended that for safety reasons, the testing is conducted without the
converging section, exhausting freely onto the ambient until a competent prediction of the
chamber pressure’s behavior. The alumina silica gaskets placed around the quartz windows
should be replaced after each testing session since they show degradation with used may cause
leaks or unintended fire hazards. Another preemptive measure is to place ceramic insulators
underneath the MOAC TO contain its thermal energy and limit the heat transfer to the mounting
surface.

40
Chapter 4 : Results
4.1 Cold Flow Tests
Thousands of images from over 40 testing and retesting sessions were retrieved with an
area of interest from the injector faceplate to the opposite end of the MOAC. Due to the nature of
the flow setup and conditions, there were variations between the targeted MR values and the
actual calculated values. Pressure, temperature, and image quality were monitored to ensure that
the tests reaching the values that were closest to the targets outlined in the test matrix were the
ones passed on for analysis. The remaining of this section describes the observations made of the
testing environment, the injected fluids, and the obtained core length data.
Propellant Injection
Table 4.1 shows the average fluid properties recorded for the liquid nitrogen during the
cold flow tests. This table shows the similarity and repeatability between the inlet conditions
observed for liquid nitrogen, which were attempted to be kept constant for the entirety of the
cold flow test matrix in each of the test articles.
Table 4-1 LN2 fluid properties
LN2 Average Fluid Properties Injector A tests Injector B tests Injector C tests
Inlet Pressure, MPa 1.51 1.20 1.40
Inlet Temperature, K 111.6 107.4 109.7
ρL, kg/m3 636.7 660.5 631.7
Exit Velocity, m/s 3.6 3.2 3.5
Re 77,592.4 63,536.8 74,714.6
Viscosity, µPa-s 59.7 66.9 58.4

41
Table 4.2 shows the average fluid properties recorded for the gaseous methane during the
cold flow tests. The gas, being the fluid varied to achieve the different MR values outlined in the
test matrix, was intended to be delivered in the same state throughout testing. The following
table compares the true resemblance of the inlet conditions at the annular injection port relevant
to the methane’s state, while other properties such as delivery pressure, Re, and exit velocity are
omitted due to their significant change in magnitude from test to test.
Table 4-2 Average fluid properties recorded for gaseous methane during cold flow testing
GCH4 Average Fluid Properties Injector A tests Injector B tests Injector C tests
Inlet Temperature, K 165.9 169.4 168.8
ρG, kg/m3 1.8 1.6 1.5
Viscosity, µPa-s 6.4 6.6 6.5
Chamber Pressure Profile
As mentioned above, the chamber pressure was monitored and recorded for several runs
and was consistently stable at ~17 psia. The slight pressurization (3-4 psia increase over
ambient) observed in the combustion chamber results from the flow buildup in the chamber,
which exits through the converging section and is then exhausted onto a venting duct. A pressure
profile for both delivery lines and the MOAC is shown in Figure 4.1. The moment were the
methane delivery valve is opened to cease the simultaneous flow of liquid nitrogen in both the
central and annular orifices can be observed to happen briefly after 3 seconds after the data
recording process began in this particular plot. In general, the behavior of the line and chamber
pressures was similar to this example in all recordings, in which a higher accumulation of LN2 in

42
the central injection inlet can be observed, as well as a drop in the annular inlet pressure once the
gaseous methane begins to flow after the pre-testing cooling is completed.
Figure 4-1 Typical inlet and chamber pressure profiles for an LN2/GCH4 run
4.1.1 Shadowgraph Technique
Liquid Core Breakup Length Measurements
Throughout the 3200 images recorded per run, a general pattern was observed that
consisted on initially observing a clearly defined liquid jet that gradually fell in intensity to a dim
and predominantly gaseous flow towards the end of the 16 second run. The significant variation
of jet length during this transition would have skewed an average core length measurement if the
entirety of the individual images had been considered. Therefore, a time interval showcasing
steady flow, meaning that the flow is neither immediate to pre-cooling nor in the process of final
vaporization, was located and selected as a pool for individual measurements since this was the
period the exhibited the least transient behavior. This steady state interval consisted of
approximately 300 images or 1.5 seconds in each run. Ten, evenly spread measurements were

43
taken using a calibrated measuring scale in DANTEC’s Dynamic Studio software. In instances
were ligament detachment were observed, the first obvious fragmentation of the liquid core was
considered as measuring point. From these measurements, the core breakup length, the parameter
directly compared to core length modeling projections and LOX/H2 breakup profiles, was
computed. This parameter is obtained by averaging the jet breakup length measurements and
normalizing the result by the central liquid core diameter (2 mm).
The visual measurements obtained from these tests can only be considered an
approximation of the true jet length since the intact core may be hidden a dense spray
indistinguishable from the liquid. The measuring error was approximated to be ±2mm. The
image quality in the visual pool of data was deemed sufficient if no fogging or condensation on
the windows prevent the measurement of the central liquid core.
Figure 4-2 Cold flow tests' interrogation area and scale
The visual data exhibits subtle but distinguishable differences between the jet lengths and
thicknesses produced by the injectors. A color flow distribution of Case #1 for injectors A, B,
and C is shown in Figure 4.3 is representative of these differences. The liquid nitrogen core
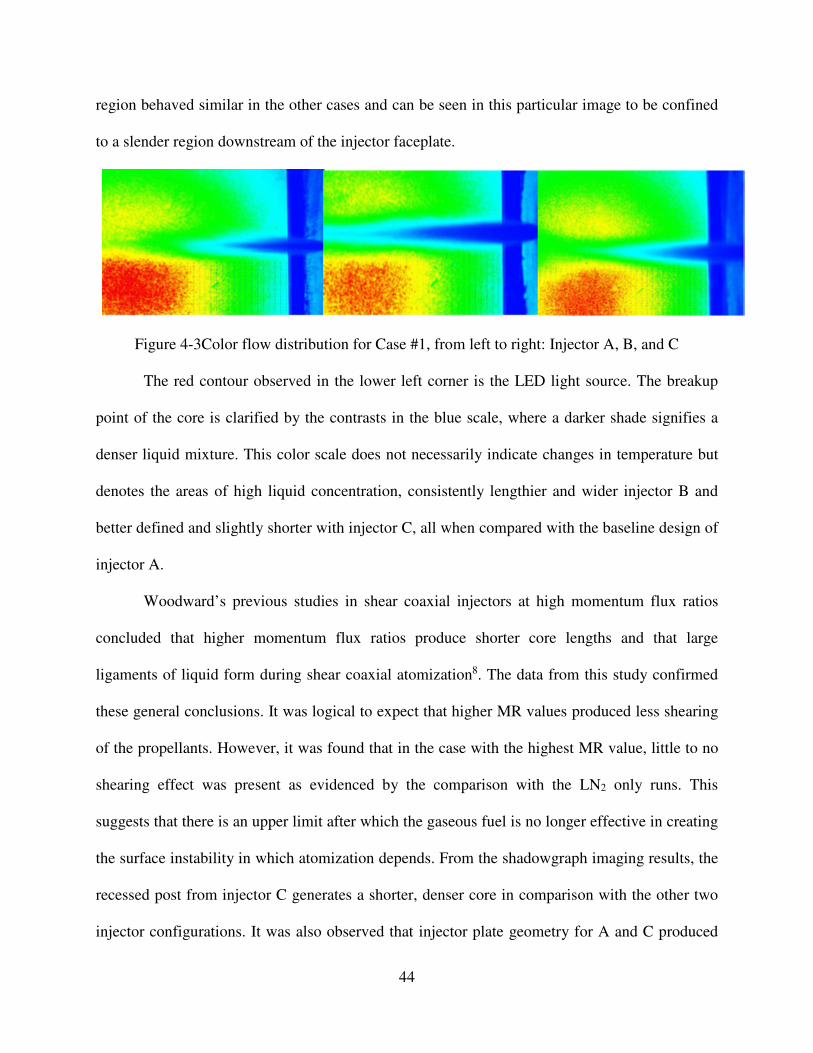
44
region behaved similar in the other cases and can be seen in this particular image to be confined
to a slender region downstream of the injector faceplate.
Figure 4-3Color flow distribution for Case #1, from left to right: Injector A, B, and C
The red contour observed in the lower left corner is the LED light source. The breakup
point of the core is clarified by the contrasts in the blue scale, where a darker shade signifies a
denser liquid mixture. This color scale does not necessarily indicate changes in temperature but
denotes the areas of high liquid concentration, consistently lengthier and wider injector B and
better defined and slightly shorter with injector C, all when compared with the baseline design of
injector A.
Woodward’s previous studies in shear coaxial injectors at high momentum flux ratios
concluded that higher momentum flux ratios produce shorter core lengths and that large
ligaments of liquid form during shear coaxial atomization8. The data from this study confirmed
these general conclusions. It was logical to expect that higher MR values produced less shearing
of the propellants. However, it was found that in the case with the highest MR value, little to no
shearing effect was present as evidenced by the comparison with the LN2 only runs. This
suggests that there is an upper limit after which the gaseous fuel is no longer effective in creating
the surface instability in which atomization depends. From the shadowgraph imaging results, the
recessed post from injector C generates a shorter, denser core in comparison with the other two
injector configurations. It was also observed that injector plate geometry for A and C produced

45
the shortest measure core length values recorded in testing. This means that increasing the
magnitude of geometric variable τIhas no positive effect in the atomization process, since more
spontaneous breakup indicates a more efficient spray production. Still, the effects of the slight
variations in breakup length produced by these different test articles are yet to be quantified in
combustion conditions. The plots in Figure 4-4 are graphic representations of these observations.
Figure 4-4 Injector core length comparisons with fragmentation models

46
Each vertical set of data points indicates a case. The measured jet length was determined
by evaluating the shadowgraph images during a steady state flow at the specified flow conditions
and locating the sharpest transition from a liquid (dark, dense shadow) to gas mixture (light gray
shadows). In the cases of large fragments, the measurement was taken at the primary
fragmentation or breakup.
The jet breakup length for each injector while running exclusively LN2 (without any
gaseous flow in the annular orifice) was measured to assess the break-up without the methane’s
shearing effect. The obtained values are hereafter referred to as L0 and are the following:
Injector A, L0 = 35.84mm
Injector B, L0 = 44.21mm
Injector C, L0 = 42.22mm
These measurements are compared to the breakup lengths observed for the various MR
values set in the cold flow tests by calculating a percentage difference, a comparison usually
made between two experimental quantities of the same category from which neither is
considered objectively correct:
% Difference = R STUVW XYZ[\(]\^_`a XYZ[\(STUVW XYZ[\b]\^_`a XYZ[\)/�R x 100%
All the other tests (both LN2 and GCH4 runs) were subjected to a comparison to the core
length models described in section 3.3.1 of this thesis. The percentage difference has also been
calculated for the core length measurements and the model projections calculated with the actual
experimental conditions retrieved. Table 4.3 contains the jet and breakup length for each run for
all three injectors and their comparison with Woodward’s and Davis’s core length prediction.

47
Table 4-3 L/D Measurements vs. Models
Injector Actual
MR
Average L
(Exper)
L Sample
σX
L0, L
% diff
L/D
(Exper)
Woodward
L/D
W., Exper
L/D % diff
Davis
L/D
D., Exper
L/D % diff
A
1.5 24.68 2.88 36.88 12.34 8.37 38.40 9.19 29.29
1.8 24.92 2.46 35.94 12.46 8.72 35.34 9.42 27.82
3.5 28.08 6.35 24.28 14.04 13.35 5.07 11.62 18.90
3.6 40.86 2.84 13.09 20.43 13.16 43.26 12.20 50.44
B
2.0 26.23 3.51 51.05 13.12 8.66 40.92 9.59 31.05
2.9 37.65 3.02 16.03 18.83 9.96 61.59 11.03 52.22
3.1 48.9 8.24 10.07 24.45 12.09 67.65 11.11 75.03
3.7 49.99 4.38 12.27 24.99 12.71 65.16 12.24 68.51
C
2.3 24.72 3.82 52.28 12.36 10.97 11.92 9.92 21.90
2.7 31.97 4.89 27.63 15.98 11.82 29.96 11.19 35.29
3.7 31.12 6.62 30.27 15.56 12.62 20.83 12.27 23.64
3.8 39.43 6.17 6.83 19.71 12.58 44.19 12.43 45.32
Core length measurements for Injectors A and C are the ones that most closely resemble
the Davis and Woodward fragmentation models, which can be seen to obtain fairly similar
approximations. As expected, the higher shearing velocities from the GCH4 had a more
significant effect on the liquid jet break up length. In general, the experimental core length
values were consistently greater than the projections for that flow condition. The overall
tendencies of the liquid cores seem to follow the mathematical models developed for sprays
generated with other propellants in cold flow. From the results, it was concluded that injector B
not only produces the longest cores but also deviates the most from the models

48
A plot including these data points as well as experimental data published by Boniface,
Reed, and Woodward et al [10] and the references cited in their study is shown in Figure 4.5.
Figure 4-5 Plot of LOX core length measurements from Boniface, Reeb, Woodward, and this
study against gas-to liquid momentum flux ratio
Table 4-4 Non-dimensional Spray Diagnostics Parameters
Injector Actual MR Vr J We Oh
A
1.5 203.4 149.2 722,456.7 0.0102
1.8 208.5 131.8 434,411.6 0.0096
3.5 146.1 46.2 174,582.3 0.0055
3.6 117.1 36.1 173,880.8 0.0050
B
2.0 217.6 120.4 464,931.1 0.011
2.9 159.7 59.9 191,287.5 0.0079
3.1 161.2 57.7 170,407.7 0.0062
3.7 118.6 35.5 117,427.1 0.0050

49
C
2.3 206.8 101.6 487,050.9 0.0084
2.7 136.9 55.6 303,459.6 0.0061
3.7 119.7 35.1 88,236.2 0.0048
3.8 113.3 32.9 85,216.8 0.0046
4.1.2 PIV Tests
Three runs replicating Case #3 were completed with the PIV system as the optical
diagnostics in place, one for each face plate configuration. Instants of the runs have been
captured in Figure 4.6-9 for injectors A. B, and C, respectively, in progressing order with respect
to time. In terms of general behavior, the PIV runs confirmed the assessment that, compared to
baseline design A, injector B produces a spray that flares more widely thanks to the reduced
shearing caused by having a thickerτI. Injector C, once again, produces the shortest spray after
having its 5 mm τd produce a short mixing period of the propellants prior to injection.
Figure 4-6 PIV Image sequence for Injector A
Figure 4-7 PIV Image sequence for Injector B

50
Figure 4-8 PIV Image sequence for Injector C
It was determined that all three injectors produce a highly dense liquid that separates into
large fragments of liquid, making it difficult for the software to identify and track individual
droplets. The droplets were to serve as traceable particles, and for this reason, velocity vector
maps were not obtained.
Figure 4-9 Untraceable ligaments observed during PIV testing
The instants that allowed visibility of the greatest amount of individual particles was the
end of the runs, when the injection of gas has begun to warm the injector bodies and the liquid
begins to vaporize more quickly. Unfortunately, the time window before the mixture begins to
exit the injector as invisible gas is too short to obtain reliable velocity data. For this reason, PIV
will only be reincorporated as a diagnostic tool for much lower flow rates and future injection
hardware iterations.

51
Chapter 5 : Conclusion
5.1 Summary of Findings
Changes in central post thickness and co-annular orifice recession length with respect to
the injection plate do not affect the injection area and for that reason have been largely
unaccounted for in parameters traditionally used to describe the spray atomization process.
Despite this omission, it was found that τI and τd have quantifiable effects in the generated
spray flow field. The cold flow experiments using methane supported Woodward’s equation and
Davis’s J correlation for breakup length, which were developed by testing with gaseous
hydrogen and nitrogen in cold flow, respectively. This fact suggests that LOX/GCH4 atomization
can be optimized to meet the efficiency levels of hydrogen and other fuels. The observations
from the recessed faceplate suggest an improvement in the increase of combustion chamber
length available for burning, one of the metrics for assessing atomization efficiency. Lastly, the
observed behavior of the propellants supports classical liquid core fragmentation for shear
coaxial injection at similar momentum flux ratio values, which has been described as an
atomization that results in large liquid structures rather than diffuse droplets.
5.2 Future Work
Although the extent to which other studies’ findings, particularly for LOX/H2, can
translate to methane atomization was observed to be within reason, particular ranges of J and
other parameters could be narrowed and further studied for specific applications. Furthermore,
the cold flow test matrix must be replicated in combustion conditions to study the flame
anchoring mechanisms of LOX/CH4 with cSETR’s injection hardware. Lastly, OH luminescence
and other applicable optical diagnostics would be valuable in further this combustion

52
References
1. Huo H, Yang V. Supercritical LOX/Methane Combustion Of A Shear Coaxial Injector.
AIAA Aerosp Sci Meet Incl New Horizons Forum Aerosp Expo. 2011;49th(January):1–13.
2. Neill T, Judd D, Veith E, Rousar D. Practical Uses Of Liquid Methane In Rocket Engine
Applications. Acta Astronaut.
3. Olansen J. /NASA/JSC. Project Morpheus. AIAA Houston Sect Horizons. 2012:5–11.
4. Zurbach S, Thomas JL, Moteurs S, Division RE. Recent Advances of LOX/Methane
Combustion For Liquid Rocket Engine Injector. 2002;(July):4321.
5. Jacques Borromee, Serge Eury, Alain Souchier Gds. Future European Reusable
Propulsion Systems. SNECMA Moteurs Sp Engines Div Forêt Vernon - Cedex - Fr.
6. Leone D. Spacex Could Begin Testing Methane-Fueled Engine At Stennis Next Year.
Spacenews. 2013.
7. Kaltz T, Milicic M, Glogowski M, Micci MM. Shear Coaxial Injector Spray
Characterization. 29th Jt Propuls Conf Exhib. 1993;AIAA 93-21.
8. Woodward RD, Pal S, Farhangi S, Et Al. LOX/GH 2 Shear Coaxial Injector Atomization
Studies At Large Momentum Flux Ratios. July 2006;:1–20.
9. Giorgi MG De, Leuzzi A. CFD Simulation Of Mixing And Combustion In Lox / Ch 4
Spray Under Supercritical Conditions. June 2009.
10. Oschwald M, Cuoco F, Yang B, Rosa M De. Atomization And Combustion In LOX / H 2
and LOX / CH 4 -Spray Flames. :3–7.
11. Eberhart CJ, Lineberry DM, Moser MD. Experimental Cold Flow Characterization of a
Swirl Coaxial Injector Element. 45th JPC AIAA. 2009;(August):1–14.
12. Salgues D, Mouis A-G, Lee S-Y, Kalitan D, Pal S, Santoro R. Shear And Swirl Coaxial
Injector Studies Of LOX/GCH4 Rocket Combustion Using Non-Intrusive Laser
Diagnostics. 44th AIAA Aerosp Sci Meet Exhib. 2006:1–14.
13. Huzel, D. Huang, D. (Rocketdyne Division, North American Aviation I. Design Of Liquid
Propellant Rocket Engines. (Division S And TI, Ed.). Washington D.C.: NASA; 1967.
14. Navarro CD. Development Of A High Pressure Optically Accessible Combustor And
Shear Co Axial Injector. 2012.

53
15. Sanchez, L., Ellis, R., Dorado, V., Choudhuri A. An Experimental Investigation Of A
LOX/CH4 Torch Ignition System For Propulsion Research. Am Inst Aeronaut Astronaut.
2014;50th Joint.
16. Candel, S., Herding, G., Snyder, R., Scouflaire, P., Rolon, C., Vingert, L., Habiballah, M.,
Grisch, F., PEALAT, M., Bouchardy, P., Stepowski, D., Cessou, A., and Colin, P.,
“Experimental Investigation of Shear Coaxial Cryogenic Jet Flames,” JPP, Vol. 14, No.5,
Sept-Oct 1998, pp. 826-834

54
Appendix A
Figure 5-1 Roger D Woodward et.al's shear coaxial injector configuration for LOX/GH2
Figure 5-2 Eberhart et.al's swirl coaxial injector element profile and dimensions
Figure 5-3 Zong and Yang's shear coaxial injector geometry and configuration

55
Appendix B
The following is a detailed testing procedure for LN2/GCH4 cold flow testing using
shadowgraph visualization techniques. Three roles have been assigned: Test conductor A
(supervising the LabView data acquisition system), Test conductor B (operating the flow
visualization system), and a hardware technician (operating the delivery system instrumentation).
Pretest
1. Hardware technician must inspect the testing rig and surrounding area.
a. Check the exhaust path is free from foreign objects and remove any found
b. Verify all propellant storage tanks are closed
c. Leak check the propellant delivery system with snoop at ~25 psia and fix any
leaks found
d. Perform a visual inspection to ensure the test article is in place and all instruments
and propellant lines are installed correctly
e. Put on PPE (Cryogenic handling gloves, apron, and face shield/safety glasses)
2. Test conductor A must complete the following data filing procedure for each session
a. Create a folder for the type of testing being performed i.e. “Cold- Geometry B
Testing”
b. Create a document that lists the inlet conditions for each test planned for that day
(desired inlet pressure/temperature) and name it according to the folder created in
a i.e. “Cold- Geometry B Testing 12-09-13 Record”
c. Leave a section in this document for comments that will contain the following
information
i. Changes done in the system configuration, i.e. part substitution
ii. Renaming of channels if any
iii. Troubleshooting procedures that might be useful for subsequent tests
iv. A brief identifiable observation of the test, e.g. excessive window fogging

56
3. Test conductor B must prepare all instrumentation related to the shadowgraph equipment
used during the test
a. Power ON high-speed camera and light source
b. Initiate DANTEC software on the desktop safely installed in the vicinity of the
test location
c. Preview the visual data feed to ensure that the focus, light, and chamber windows’
cleanliness are appropriate (image is clear and covers the entirety of the
chamber’s inner area).
d. End preview and verify that the “record” button is ready to activate the system
4. Test supervisor must now turn ON the power supplies and monitor readings and approve
the system’s functionality.
a. Each valve that will be used must be opened to ensure proper connection. The
conductor will specify which valve will be opened and the hardware technician
will confirm that it was opened via visual/audio inspection. This process will be
repeated for all valves
b. Ensure that all pressure transducers and thermocouples are reading ambient
conditions (13 +/- 1 psia and 297 +/- 3 K)
Testing Procedure
5. Hardware technician must then set the components to required testing conditions
a. Open all tanks that will be used. (1x LN2, 1x GCH4).
b. Set LN2 tank to 213 +/-5 psia and GCH4 tank to the pressure specified in the test
matrix outlined for the present test.
c. Open the manual valve located in the Oxidizer- Fluid bypass to permit cooling
6. Set GCH4 tank pressure according to the desired methane flow rate.
a. Open GCH4 tank and fuel line valve
b. Observe Omega flow meter reading and communicate to a test conductor.

57
c. Regulate GCH4 tank pressure until desired volumetric flow rate appears in the
flow meter’s reading (see equation (3)).
d. Close GCH4 tank and fuel line valve.
7. Cool propellant delivery line
a. Open LN2 tank valve
b. Ensure Needle valve is open to allow LN2 to exit the MOAC freely
c. Cease LN2 flow upon observation of the following visual cue: a visible liquid jet
reaches the midpoint of the MOAC’s length or beyond.
d. Immediately close the manual valve in the bypass.
8. Open LN2 tank and deliver to chill uncooled portions of the LOX line until a visible
liquid jet reaches the midpoint of the MOAC’s length or beyond.
9. Immediately begin to shut the Dragon needle valve gradually, until test supervisor A
confirms that the MOAC’s chamber pressure is indicated to be ~17 psi.
10. The methane tank valve is opened to allow its flow to the test article
11. Immediately coordinate the simultaneous recording of both visual and measurement data,
until the software collects the pre-specified number of frames (see Appendix A)
12. Notify the other team members that the propellants’ flow and all measurement activities
may be stopped at this time.
Post test
13. Each run will conclude with an examination of the recently obtained video, which will be
played for all team members to decide if the test needs to be repeated.
14. If the image evaluation passes its success criteria, close oxidizer/fuel propellant tanks
valves
15. Hardware technician may re-enter the bunker to shut down the system
a. Close all tank valves

58
b. Allow system to depressurize by opening all of the valves in the system
(depressurization is defined as all pressure transducers reading 13 +/- 1 psi and all
regulators indicating no pressure)
16. Open LN2 tank and begin to purge the delivery system (30 seconds)
17. Close LN2 tank
18. Test supervisors must now store recordings in the folders created in step 2 and rename
them to indicate test order i.e. Testing Video 12-09-13 Test 1
19. Turn off all power supplies
Red lines are implemented in our test script to avoid a catastrophic failure of the hardware or
facilities. Pressure and temperature redlines will stop the test script in case an overpressure of the
system occurs or the temperature of an instrument surpasses it operational range.
Red Lines:
• Line pressure must remain less than 230 psia
• Methane tank pressure must remain less than 230 psia
• Temperature readings must remain between 75K<T<350K for all thermocouples

59
Appendix C
DANTEC Dynamic Studio Calibration procedure for LN2/GCH4 cold flow tests visualization:
1. Power and initiate the DANTEC optical system in Acquisition Mode.
2. Position a ruler inside the MOAC’s interrogation area.
3. Supply an additional light source to illuminate the scale of the ruler
4. Preview the image in the PC to ensure the visibility of the scale
5. Acquire and record a sample of visual data
6. Play the sample, and if of satisfactory quality, select the “Save for Calibration” option
in the Acquired Data window.
7. A file will automatically be created in the database. Select and right-click on this file.
8. Select the “Measure to Scale” option.
9. A new window will appear. The user is now prompted to select Origin coordinates
and two additional points in the image: A and B
10. Click on and drag the placeholder labeled “O” to select an Origin.
11. Click on the A and B placeholders, one at the time and drag to the visible portion of
the ruler’s millimeter scale.
12. Set a starting and end point in such a manner that the true distance between A and B
can confidently be read from the scale, i.e. 30 mm.
13. Save the changes and go back to the Acquisition window.
14. Enable the rulers in the margin of the image and ensure that the dimensions match the
known size of the interrogation area.

60
Curriculum Vitae
Vanessa Dorado was born in El Paso in 1989. She attended school in the neighboring city
of Ciudad Juarez, Chihuahua until her high school graduation in 2007. Vanessa then enrolled in
El Paso Community College, where she worked as a writing tutor and became a member of the
Phi Theta Kappa honor society. In the spring of 2009, she was nominated to be a part of the
International Scholar Laureate Program engineering delegation to China and was awarded a
Louis Stokes Alliance for Minority Participation summer research assistantship. By the time the
summer research academy was over, Vanessa was enrolled full time as a UTEP student in the
Mechanical Engineering Department.
As a senior student, she was appointed a research assistant at the Center for Space
Exploration Technology Research (cSETR) and moved on to obtain her Bachelor’s degree in
Mechanical Engineering. Vanessa continued to work at cSETR as a graduate research assistant
until the completion of her Master’s degree in Mechanical Engineering. As a graduate student,
she was awarded a Bridge to the Doctorate Fellowship and completed internship programs at
both NASA Marshall Space Flight Center and Los Alamos National Laboratory. Vanessa
recently accepted a full-time position with Intergraph Inc. in Huntsville, AL.
Permanent address: 213 Argonaut Drive
Apartment 130
El Paso, TX 79912
This thesis/dissertation was typed by Vanessa Dorado.
Recommended


![INSTALL GUIDE OL-CH(RS)-CH4-[OL-RS-CH4]-EN](https://img.pdfslide.us/doc/110x75/6209525e101215143603cd62/install-guide-ol-chrs-ch4-ol-rs-ch4-en.jpg)