The Pennsylvania State University
The Graduate School
College of Earth and Mineral Sciences
EXPERIMENTAL CHARACTERIZATION AND MODELING OF
MULTIAXIAL PLASTICITY BEHAVIOR OF AUSTENITIC STAINLESS
STEEL 304L PRODUCED BY ADDITIVE MANUFACTURING
A Dissertation in
Materials Science and Engineering
by
Zhuqing Wang
© 2018 Zhuqing Wang
Submitted in Partial Fulfillment
of the Requirements
for the Degree of
Doctor of Philosophy
May 2018
ii
The dissertation of Zhuqing Wang was reviewed and approved * by the following:
Allison M. Beese
Assistant Professor of Materials Science and Engineering
Dissertation Advisor
Chair of Committee
Tarasankar DebRoy
Professor of Materials Science and Engineering
Hojong Kim
Assistant Professor of Materials Science and Engineering
Robert C. Voigt
Professor of Industrial and Manufacturing Engineering
Suzanne E. Mohney
Professor of Materials Science and Engineering
Chair of the Intercollege Graduate Degree Program in Materials Science and Engineering
*Signatures are on file in the Graduate School.
iii
Abstract
In additive manufacturing of metallic alloys, near-net shape 3D components are built
in a layer-by-layer fashion. Austenitic stainless steels have high strength and ductility, as
they tend to undergo a strain-induced martensitic phase transformation with plastic
deformation. The thesis focuses on quantifying process-microstructure-multiaxial
mechanical property relationships in additively manufactured 304L austenitic stainless
steel (SS304L) and developing a physically-based plasticity model for this material that
relates microstructural phase transformation to macroscopic mechanical properties.
The effect of processing parameters on microstructure and mechanical properties was
studied using pure SS304L walls. A grain growth model was used to describe austenite
grain size as a function of processing parameters and location. A Hall-Petch relationship
was used to explain the effect of austenite grain size and morphology on yield strength.
The effects of chemistry, stress state, and texture on martensitic phase transformation
were investigated using walls made using a mixture of SS304L powder and iron powder.
As the concentration of elements that increase the stacking fault energy of austenite
decreased, the austenite stability decreased, and the propensity for martensitic
transformation increased.
Multiaxial mechanical tests, including uniaxial tension, uniaxial compression, pure
shear, and combined tension and shear, were performed on the material. As the primary
texture resulted in a higher driving force for martensitic transformation under uniaxial
compression than uniaxial tension, the rate of phase transformation was higher under
uniaxial compression, which contradicted the trend in texture-free materials.
iv
A macroscopic plasticity model is proposed to describe the multiaxial plasticity
behavior for the material. This model makes use of a chemistry-, stress state-, and texture-
dependent martensitic transformation kinetics equation to incorporate the effect of
martensitic transformation on mechanical properties. The plasticity model was
implemented into a finite element code, and calibrated and validated using experimental
data. The good agreement between simulation and experimental results under the stress
states studied indicates the model is able to describe and predict the multiaxial mechanical
behavior of additively manufactured SS304L. The results in this thesis work enable the
use of additively manufactured stainless steels in structural applications, as it provides
quantitative links among processing, structure, and mechanical behavior.
v
Table of Contents
List of Figures .................................................................................................................. viii
List of Tables ................................................................................................................... xiii
Acknowledgments............................................................................................................. xv
Chapter 1 ............................................................................................................................. 1
Introduction .................................................................................................................................. 1
1.1. Additive manufacturing ........................................................................................................ 2
1.1.1. Directed energy deposition ............................................................................................ 2
1.1.2. Powder bed fusion .......................................................................................................... 3
1.2. Martensitic phase transformation .......................................................................................... 4
1.2.1. Effect of chemical composition ..................................................................................... 4
1.2.2. Effect of temperature ..................................................................................................... 6
1.2.3. Effect of strain rate ......................................................................................................... 7
1.2.4. Effect of stress state ....................................................................................................... 8
1.2.5. Effect of texture ............................................................................................................. 8
1.2.6. Effect of austenite grain size .......................................................................................... 8
1.3. Thesis outline ........................................................................................................................ 9
Chapter 2 ........................................................................................................................... 12
Material description ................................................................................................................... 12
Chapter 3 ........................................................................................................................... 15
Effect of processing parameters on microstructure and mechanical properties ......................... 15
3.1. Introduction ......................................................................................................................... 15
3.2. Experimental procedures .................................................................................................... 16
3.3. Results and discussion ........................................................................................................ 21
3.3.1. Overview ...................................................................................................................... 21
3.3.2 Effect of processing parameters on grain size and morphology ................................... 24
3.3.3 Effect of grain size and morphology on mechanical properties .................................... 32
3.3.4 Phase Transformation ................................................................................................... 37
3.4. Summary and conclusions .................................................................................................. 39
Chapter 4 ........................................................................................................................... 42
Effect of chemistry on martensitic phase transformation kinetics and mechanical properties .. 42
4.1. Introduction ......................................................................................................................... 42
4.2. Experimental procedures .................................................................................................... 44
4.3. Results and discussion ........................................................................................................ 50
vi
4.3.1 Overview ....................................................................................................................... 50
4.3.2. Effect of powder chemistry on microstructure and mechanical properties .................. 56
4.3.3. Effect of location on microstructure and mechanical properties .................................. 60
4.3.4. Martensitic phase transformation kinetics under uniaxial tension ............................... 62
4.4. Summary and conclusions .................................................................................................. 69
Chapter 5 ........................................................................................................................... 72
Effect of stress state and texture on martensitic phase transformation kinetics ......................... 72
5.1. Introduction ......................................................................................................................... 72
5.2. Experimental procedures .................................................................................................... 76
5.2.1. Uniaxial tension ........................................................................................................... 76
5.2.2. Plane strain tension and pure shear .............................................................................. 76
5.2.3. Uniaxial compression ................................................................................................... 78
5.2.4. Magnetic saturation ...................................................................................................... 80
5.3. Results ................................................................................................................................. 80
5.4. Discussion ........................................................................................................................... 85
5.4.1. Effect of stress state on martensitic transformation kinetics ........................................ 85
5.4.2. Effect of chemistry on martensitic phase transformation kinetics ............................... 90
5.4.3. Stress state-dependent martensitic phase transformation kinetics ............................... 90
5.5. Summary and conclusions .................................................................................................. 93
Chapter 6 ........................................................................................................................... 95
Plasticity model coupled with strain-induced martensitic transformation kinetics .................... 95
6.1. Introduction ......................................................................................................................... 95
6.2. Experimental procedures .................................................................................................... 98
6.2.1. Uniaxial tension and uniaxial compression ................................................................. 98
6.2.2. Multiaxial loading ........................................................................................................ 98
6.3. Plasticity model ................................................................................................................... 99
6.3.1. Yield surface .............................................................................................................. 100
6.3.2. Associated flow rule .................................................................................................. 100
6.3.3. Isotropic hardening law .............................................................................................. 101
6.3.4. Martensitic transformation kinetics ........................................................................... 102
6.4. Results and discussion ...................................................................................................... 102
6.4.1. Overview .................................................................................................................... 102
6.4.2. Model calibration ....................................................................................................... 103
6.4.3. Comparison between simulation and experimental results ........................................ 106
6.4.4. Model validation ........................................................................................................ 108
vii
6.5. Summary and conclusions ................................................................................................ 109
Chapter 7 ......................................................................................................................... 111
Summary and future work ....................................................................................................... 111
7.1. Summary and conclusions ................................................................................................ 111
7.2. Future work ....................................................................................................................... 113
Appendix ......................................................................................................................... 115
Published papers during Ph.D. study ....................................................................................... 115
Bibliography ................................................................................................................... 117
viii
List of Figures
Figure 1.1. Schematic of the directed energy deposition process. Figure from [11]. ......... 3
Figure 1.2. Schematic of the powder bed fusion process. Figure from [11]....................... 3
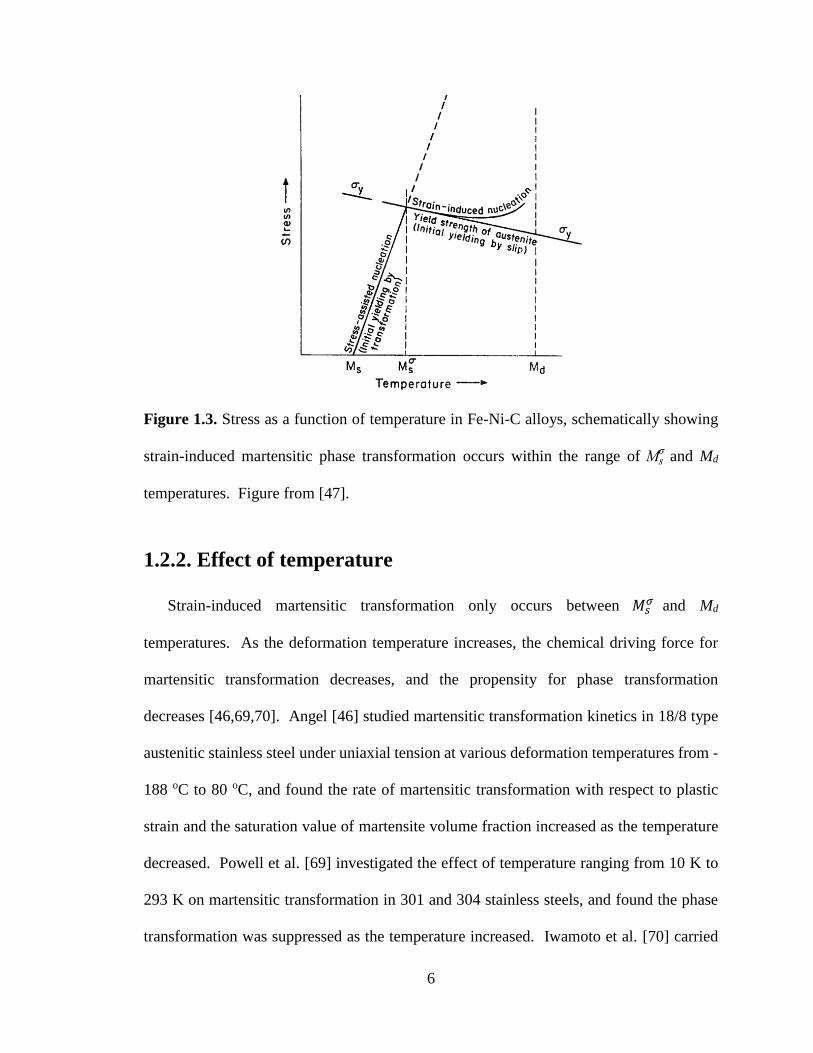
Figure 1.3. Stress as a function of temperature in Fe-Ni-C alloys, schematically showing
strain-induced martensitic phase transformation occurs within the range of Msσ
and Md temperatures. Figure from [47]. .......................................................... 6
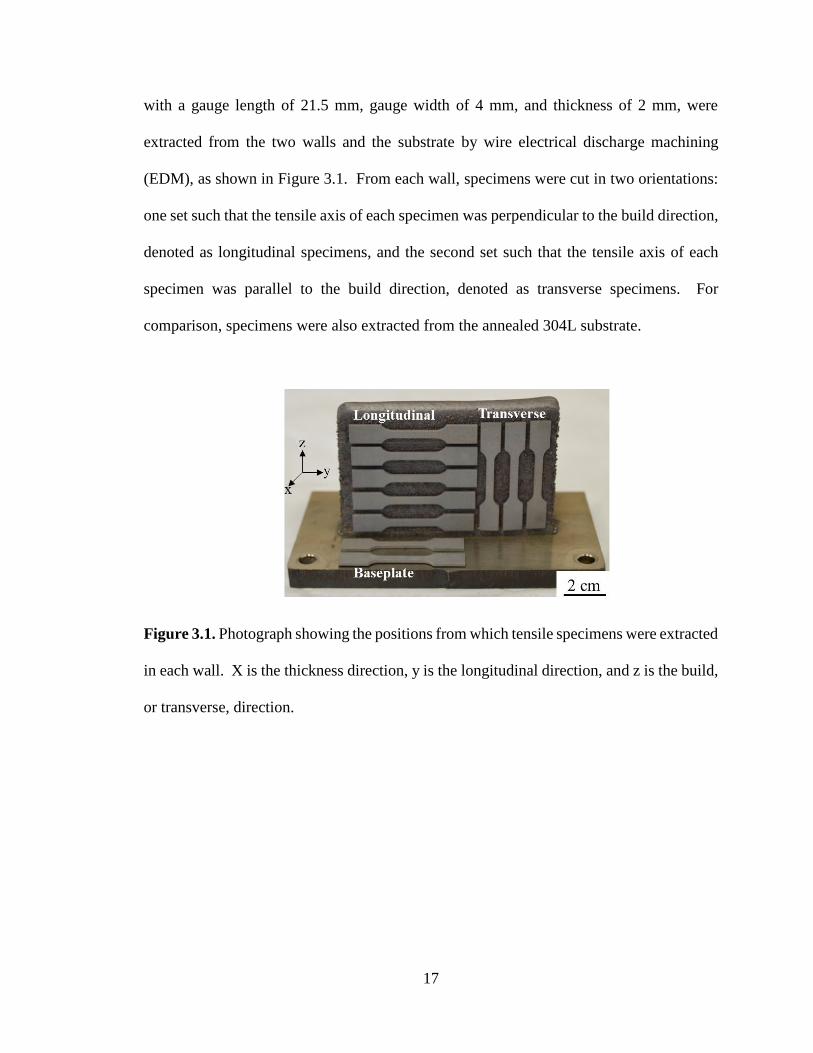
Figure 3.1. Photograph showing the positions from which tensile specimens were extracted
in each wall. X is the thickness direction, y is the longitudinal direction, and z
is the build, or transverse, direction. .............................................................. 17
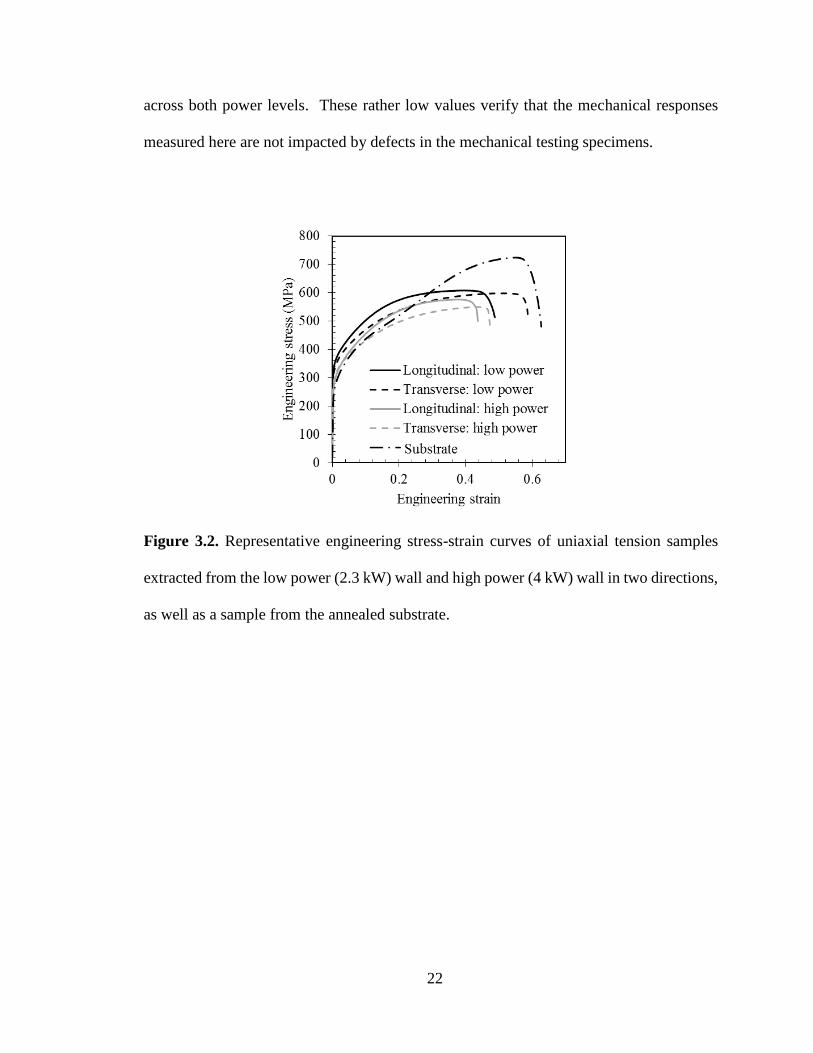
Figure 3.2. Representative engineering stress-strain curves of uniaxial tension samples
extracted from the low power (2.3 kW) wall and high power (4 kW) wall in
two directions, as well as a sample from the annealed substrate. .................. 22
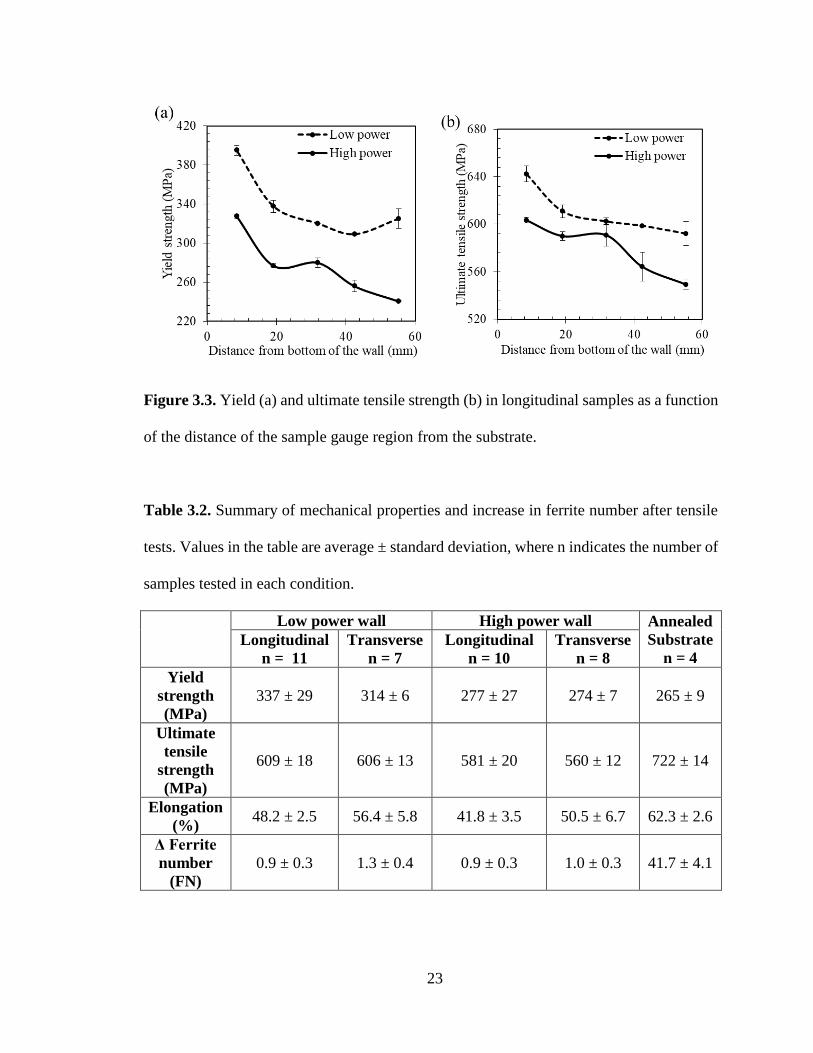
Figure 3.3. Yield (a) and ultimate tensile strength (b) in longitudinal samples as a function
of the distance of the sample gauge region from the substrate. ..................... 23
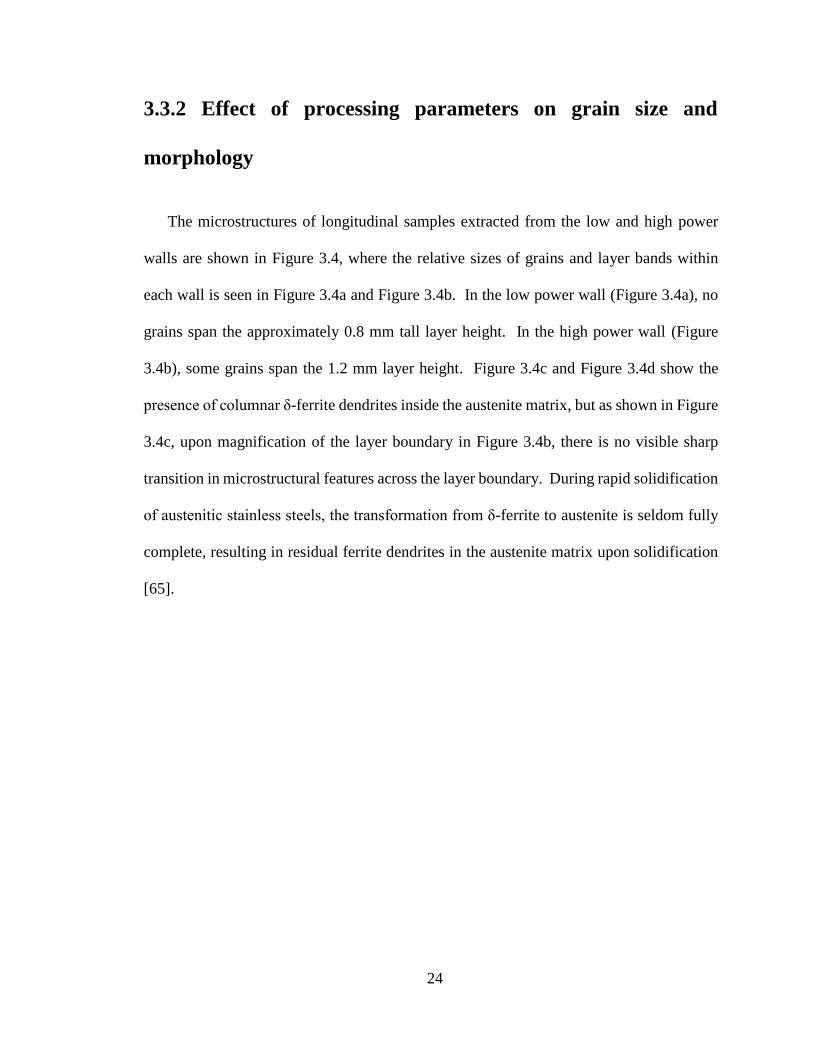
Figure 3.4. Optical micrographs of broken longitudinal samples in which the build
direction is vertical and subsequent build layers are horizontal in the images.
Dashed lines indicate the transition between subsequent build layers. (a) Image
of a sample extracted from the low power wall showing short grains within
single layers. (b) Image of a sample extracted from the high power wall
showing slightly elongated grains extending the full layers. (c) Zoom in of
inset in (b) showing the lack of a sharp transition in microstructural features
between subsequent build layers in which the bright phase is austenite and the
dark features are skeletal δ-ferrite dendrites. (d) Zoom in of inset in (c) showing
δ-ferrite dendrites in the austenite matrix. ..................................................... 25
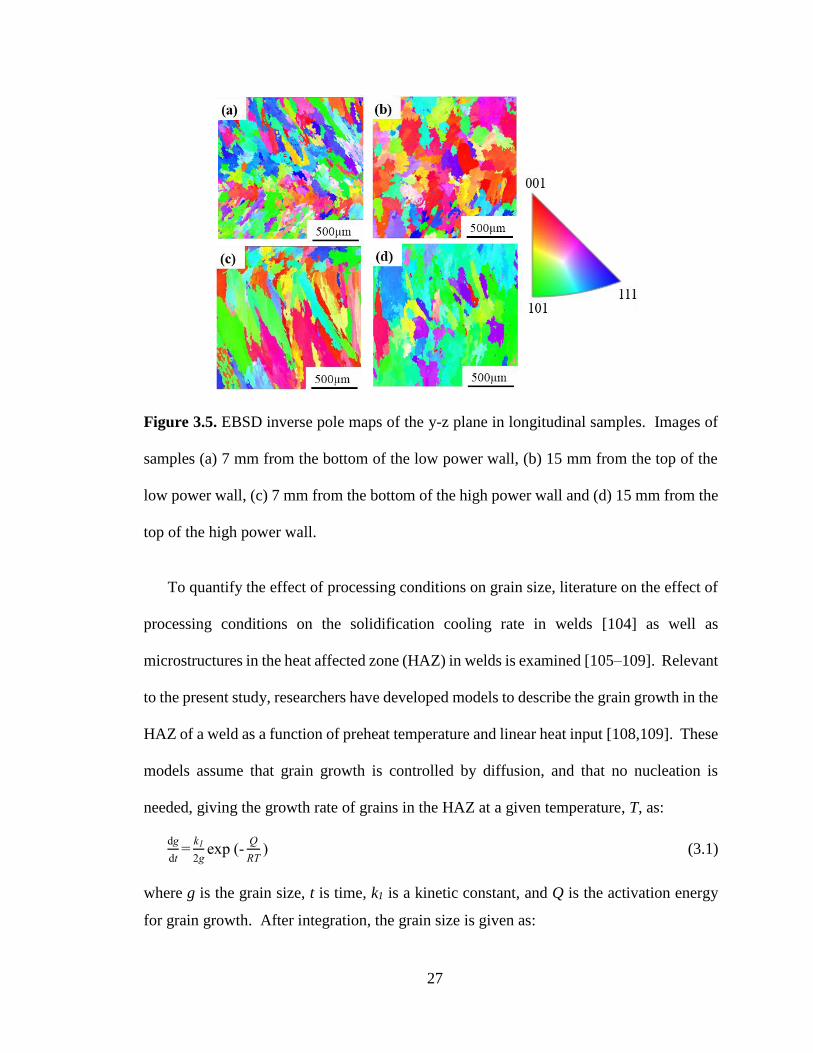
Figure 3.5. EBSD inverse pole maps of the y-z plane in longitudinal samples. Images of
samples (a) 7 mm from the bottom of the low power wall, (b) 15 mm from the
top of the low power wall, (c) 7 mm from the bottom of the high power wall
and (d) 15 mm from the top of the high power wall. ..................................... 27
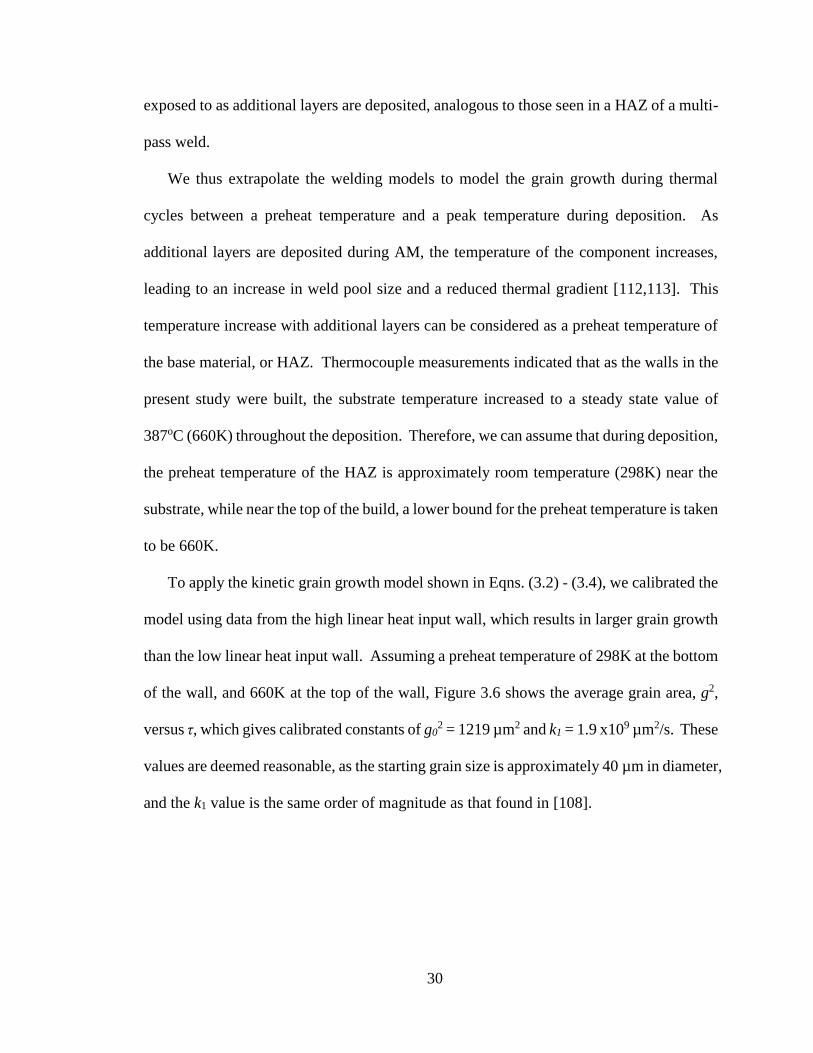
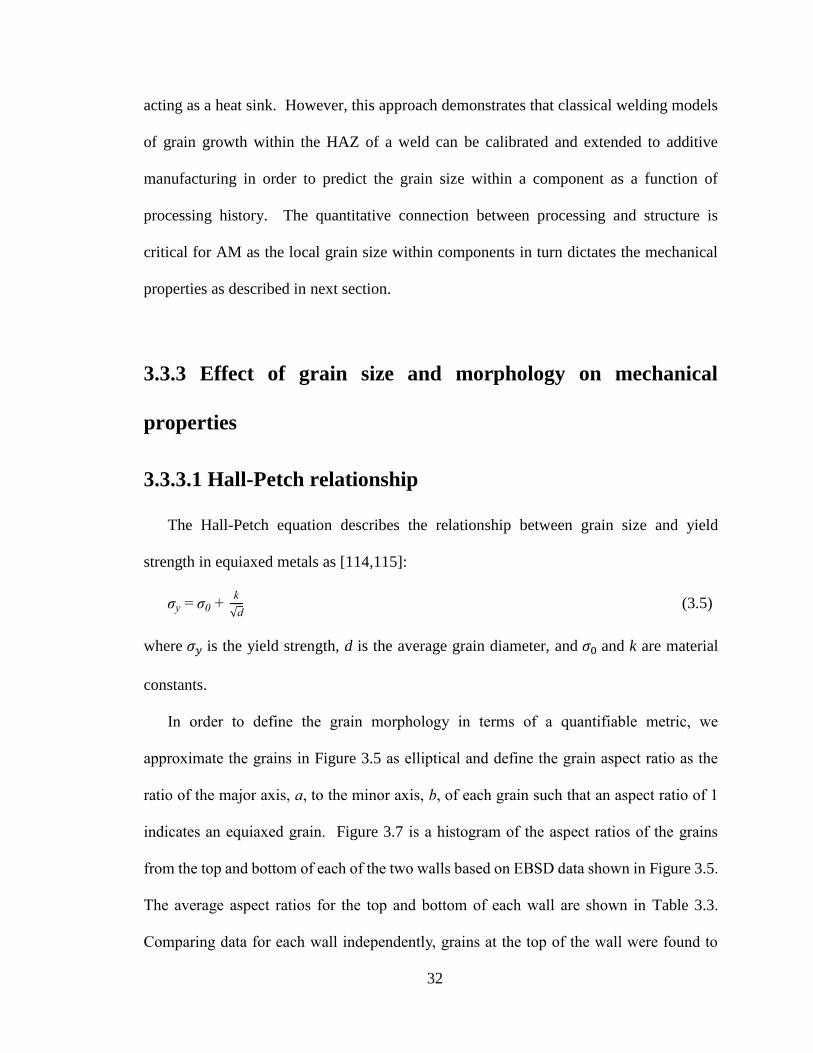
Figure 3.6. Average grain area versus time to heat for samples extracted 7 mm from the
bottom and 15 mm from the top of both the low power wall and the high power
ix
wall, where average grain size was extracted from EBSD data shown in Figure
3.5 and detailed in Table 3.3. Data from the high power wall (black symbols)
were used to fit the kinetic grain growth model, while data from the low power
wall are shown in gray. The fitted line was used to calibrate the kinetic grain
growth model to find the initial grain size, g0, and the kinetic constant, k1. This
calibrated model was used to predict grain growth as a function of processing
parameters for the low power wall. ................................................................ 31
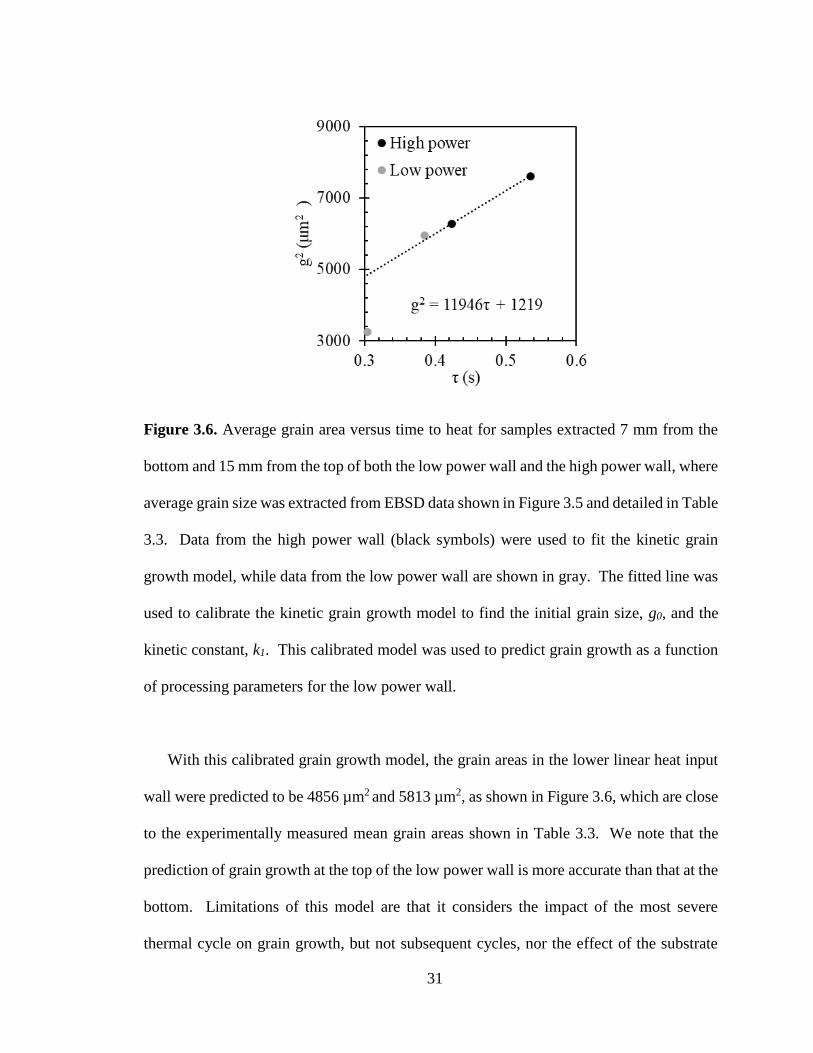
Figure 3.7. Histogram of grain aspect ratios for samples extracted 7 mm from the bottom,
and 15 mm from the top, of both low power and high power walls. Data was
extracted from EBSD maps, including those shown in Figure 3.5. ............... 33
Figure 3.8. Yield strength versus d-0.5, where d is the relevant grain diameter in the direction
of applied tensile load. The fitted line was used to determine the Hall-Petch
parameters, σ0 and k. ...................................................................................... 35
Figure 4.1. EDS maps of a representative region from the (a) bottom grip and (b) top grip
of a transverse specimen from the 90% SS304L wall showing uniform
distribution of major elements. ...................................................................... 45
Figure 4.2. Schematic of neutron diffraction experimental setup, in which diffraction
signals from length and thickness directions were collected. ........................ 48
Figure 4.3. Representative engineering stress-strain curves of uniaxial tension samples
extracted from 100%, 90%, and 80% SS304L walls in two directions,
compared with the annealed SS304L substrate. ............................................. 51
Figure 4.4. (a) Optical micrograph showing a lack-of-fusion pore in the 80% SS304L wall.
(b) Inset in (a) showing that tension applied in the transverse direction (denoted
by the vertical arrows) will open the lack-of-fusion pore. ............................. 52
Figure 4.5. (a) Yield strength, (b) ultimate tensile strength, and (c) Δ FN as a function of
distance of the sample gauge region from the substrate in the 80%, 90%, and
100% SS304L walls. ...................................................................................... 53
Figure 4.6. Measured temperature at the bottom of the substrate, and computationally
predicted temperature of the top layer of the build, as a function of the height
of the build. .................................................................................................... 55
x
Figure 4.7. EBSD phase maps from a longitudinal specimen extracted from the 90%
SS304L wall (a) before plastic deformation, and (b) after plastic deformation
under uniaxial tension to a total engineering strain of 66%. .......................... 57
Figure 4.8. True stress and FN as a function of true strain in representative samples from
(a) the top of the 100% SS304L wall, (b) the top of the 90% SS304L wall, (c)
the top of the 80% SS304L wall, and (d) the annealed SS304L substrate. Gray
symbols represent actual FN measured in stress-free conditions. .................. 64
Figure 4.9. Neutron diffraction patterns for a specimen from the annealed SS304L substrate
in the (a) length direction (Bank 1), and (b) thickness direction (Bank 2),
showing the contrast between signals in undeformed and deformed (66%
engineering strain under uniaxial tension) regions. ....................................... 65
Figure 4.10. Martensite content, c, measured by neutron diffraction as a function of the
corrected feritescope reading, SFe,c, showing a conversion factor, k, from
volume fraction of ferrite to volume fraction of martensite of 1.8. ............... 65
Figure 4.11. Martensite volume fraction, c, as a function of von Mises equivalent plastic
strain, 𝜀��𝑀𝑃 , in longitudinal samples at different locations from the (a) 90%, and
(b) 80% SS304L walls. Symbols correspond to experimental data and lines
correspond to calibrated transformation kinetics equations. .......................... 67
Figure 4.12. Transformation kinetics parameters (a) n, and (b) cmax as a function of Md30
temperature in longitudinal samples from different locations in the 80% and 90%
SS304L walls. The fitted lines were used to quantitatively link n and cmax to
the Md30 temperature. ..................................................................................... 69
Figure 5.1. Geometry of a multiaxial plasticity specimen (unit: mm) adapted from [157],
where 𝐹𝑣 and 𝐹ℎ represent the applied force in vertical and horizontal
directions, and β, the biaxial loading angle, is used to determine the ratio of the
vertical to horizontal forces. ........................................................................... 77
Figure 5.2. Schematic of the dual actuator hydraulic test frame for multiaxial testing. ... 78
Figure 5.3. Schematic of compression test with in situ neutron diffraction, in which
diffraction signals from axial and normal directions were collected. ............ 79
Figure 5.4. Martensite volume fraction, c, measured by magnetic saturation versus c
measured by magnetic permeability. .............................................................. 81
xi
Figure 5.5. Neutron diffraction patterns, along the loading direction, of a transverse
specimen from the 90% SS304L wall before and after uniaxial compression to
27% engineering strain. .................................................................................. 82
Figure 5.6. Martensite volume fraction, c, as a function of von Mises equivalent plastic
strain, 𝜀��𝑀𝑃 , determined by the internal standard method and Rietveld
refinement in a transverse compression specimen from the 90% SS304L. ... 83
Figure 5.7. Martensite volume fraction, c, as a function of von Mises equivalent plastic
strain, 𝜀��𝑀𝑃 , in longitudinal and transverse specimens from the 90% SS304L
wall under uniaxial tension and uniaxial compression. ................................. 83
Figure 5.8. Martensite volume fraction, c, as a function of von Mises equivalent plastic
strain, 𝜀��𝑀𝑃 , in specimens from the (a) 80 % SS304L wall and (b) 90% SS304L
wall under uniaxial tension, pure shear, and uniaxial compression. Symbols
correspond to experimental data and lines correspond to calibrated
transformation kinetics equations. ................................................................. 85
Figure 5.9. Inverse pole figures, determined by neutron diffraction, of a transverse
compression specimen from the 90% SS304L wall with plane normals parallel
to the (a) loading, or transverse, direction, and (b) normal, or longitudinal,
direction. ......................................................................................................... 86
Figure 5.10. Unitless driving force for martensitic transformation as a function of
orientation with φ2 = 45° for (a) uniaxial tension, (b) pure shear, and (c)
uniaxial compression. The orientations of longitudinal specimens are marked
as solid symbols at (35°, 90°, 45°). The orientations of transverse specimens
are marked as open symbols at (0°, 55°, 45°). ................................................ 89
Figure 6.1. Von Mises equivalent stress, 𝜎𝑣𝑀, , versus von Mises equivalent plastic strain,
𝜀��𝑀𝑃 , for representative specimens from (a) the 80% SS304L wall, and (b) the
90% SS304L wall. ........................................................................................ 103
Figure 6.2. Engineering yield stress in the transverse direction, σT, versus engineering yield
stress in the longitudinal direction, σL in the (a) 80% SS304L wall, and (b) 90%
SS304L wall. The von Mises yield surface, based on uniaxial tension in the
longitudinal direction, is also drawn. The symbols represent experimentally
measured yield points under the stress states studied. ................................. 105
xii
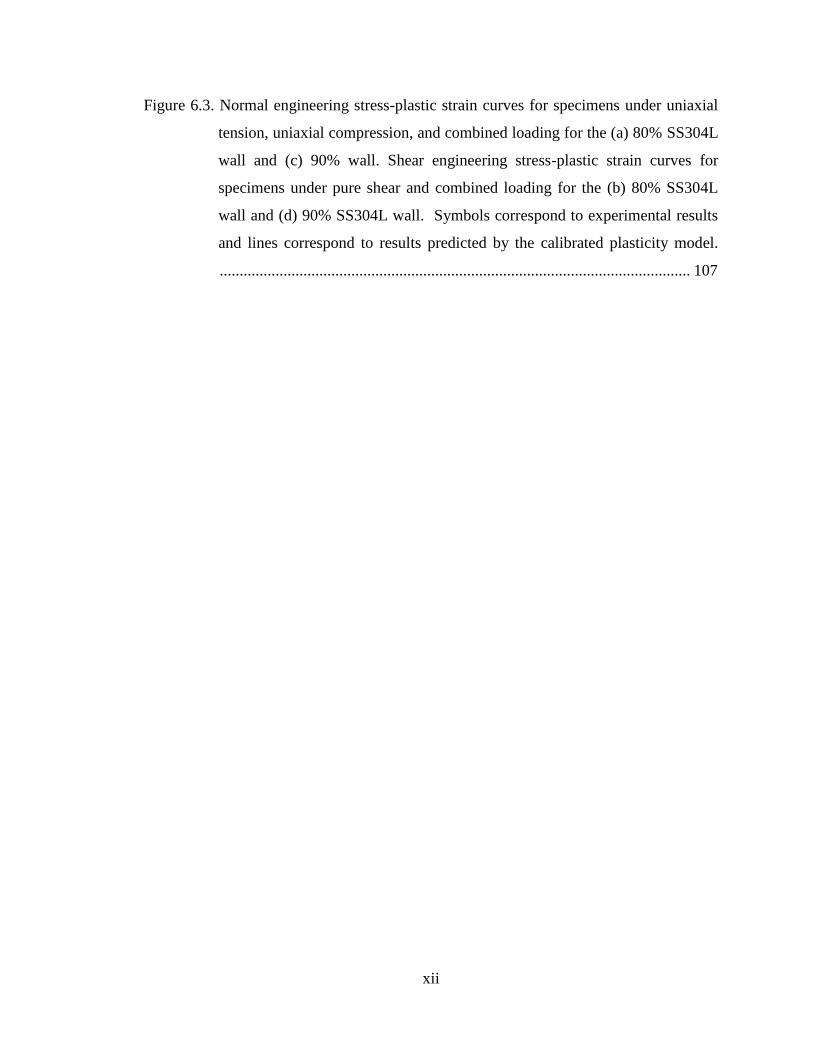
Figure 6.3. Normal engineering stress-plastic strain curves for specimens under uniaxial
tension, uniaxial compression, and combined loading for the (a) 80% SS304L
wall and (c) 90% wall. Shear engineering stress-plastic strain curves for
specimens under pure shear and combined loading for the (b) 80% SS304L
wall and (d) 90% SS304L wall. Symbols correspond to experimental results
and lines correspond to results predicted by the calibrated plasticity model.
...................................................................................................................... 107
xiii
List of Tables
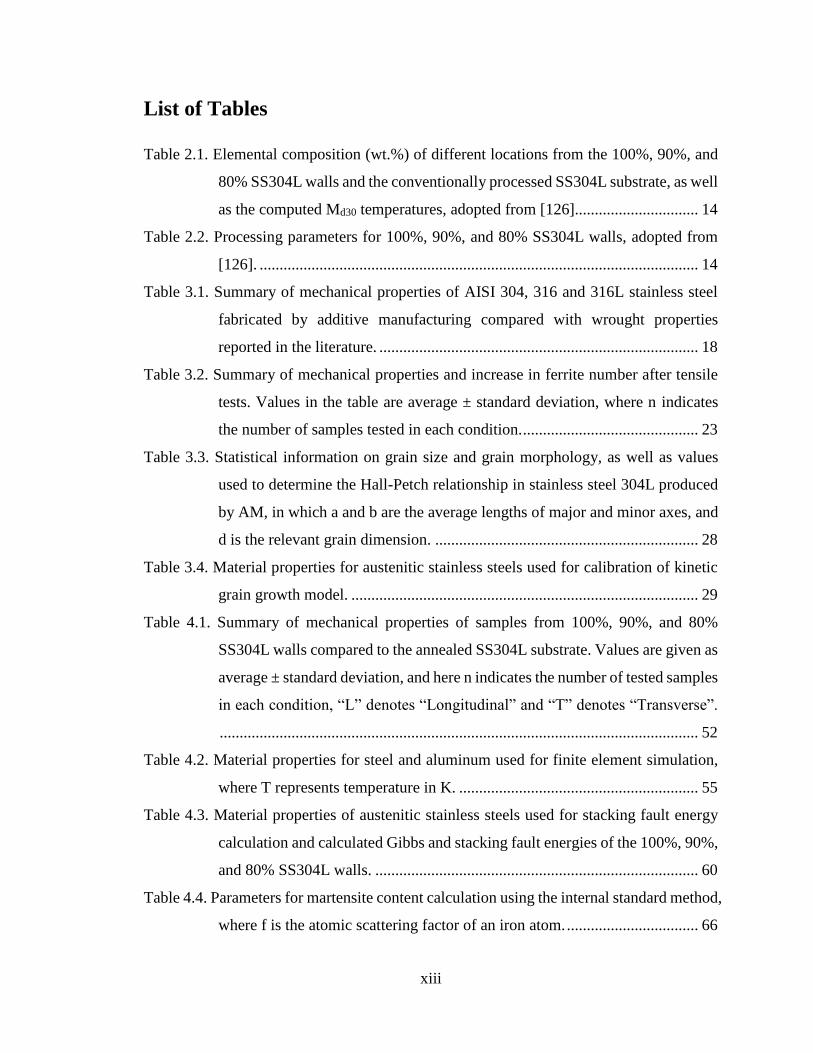
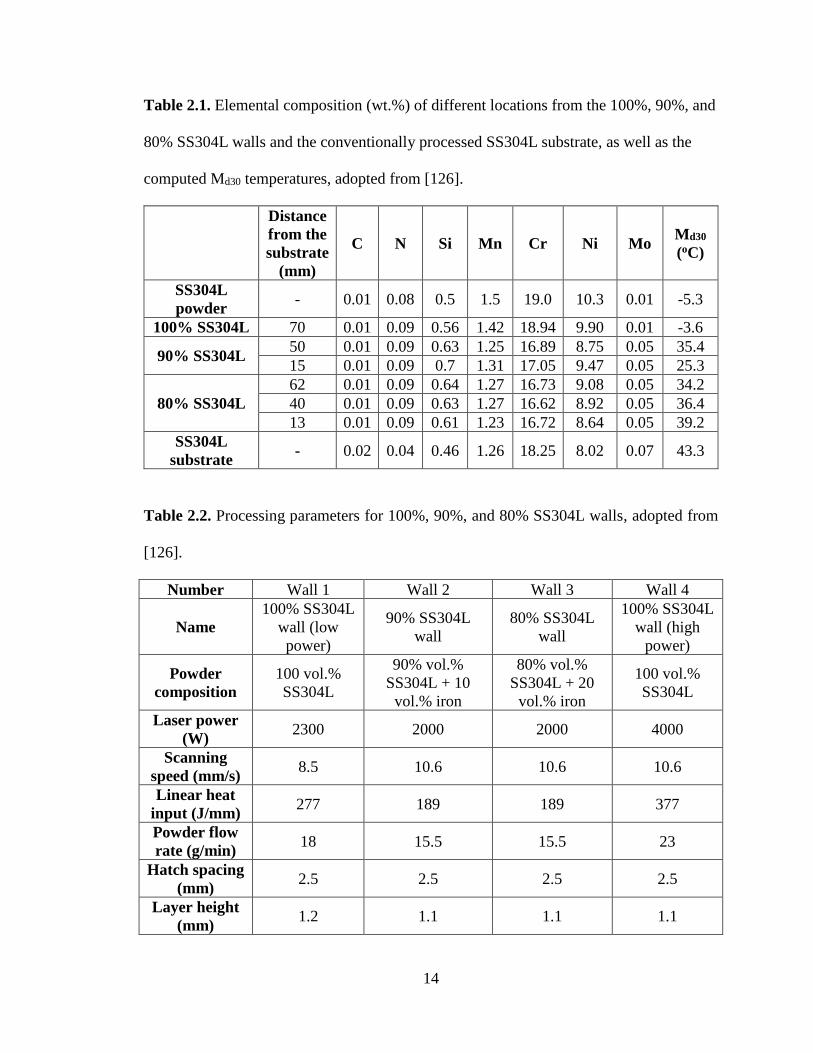
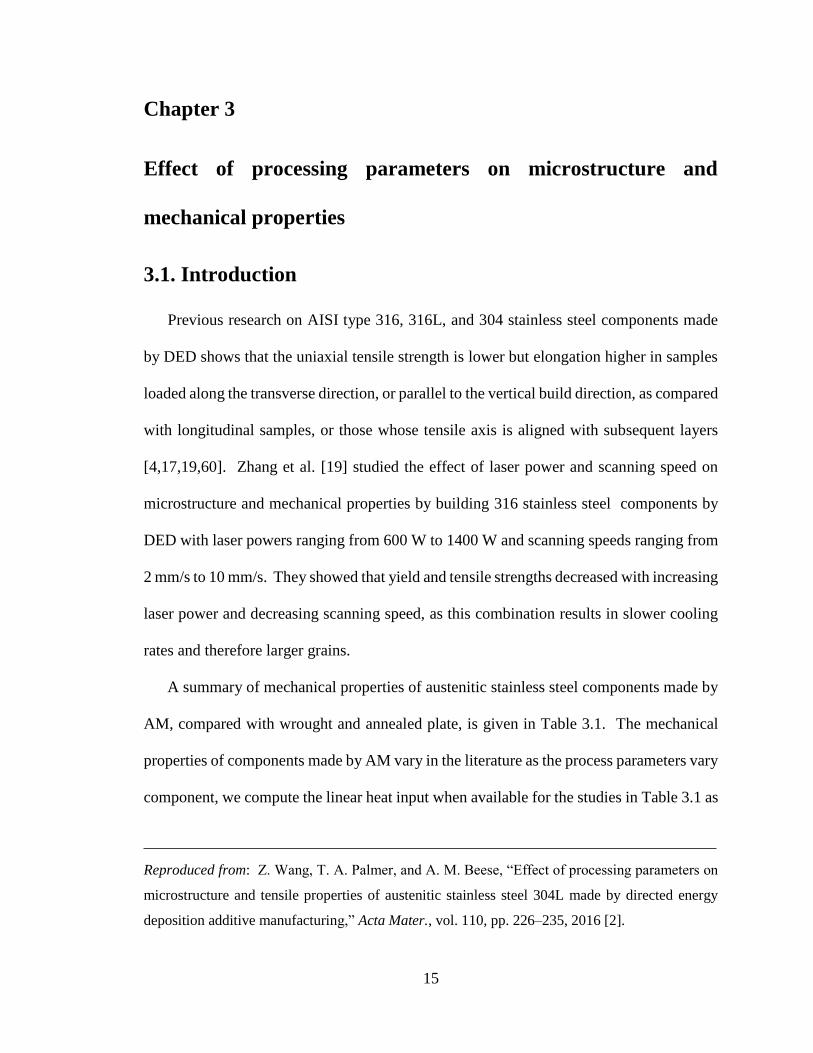
Table 2.1. Elemental composition (wt.%) of different locations from the 100%, 90%, and
80% SS304L walls and the conventionally processed SS304L substrate, as well
as the computed Md30 temperatures, adopted from [126]............................... 14
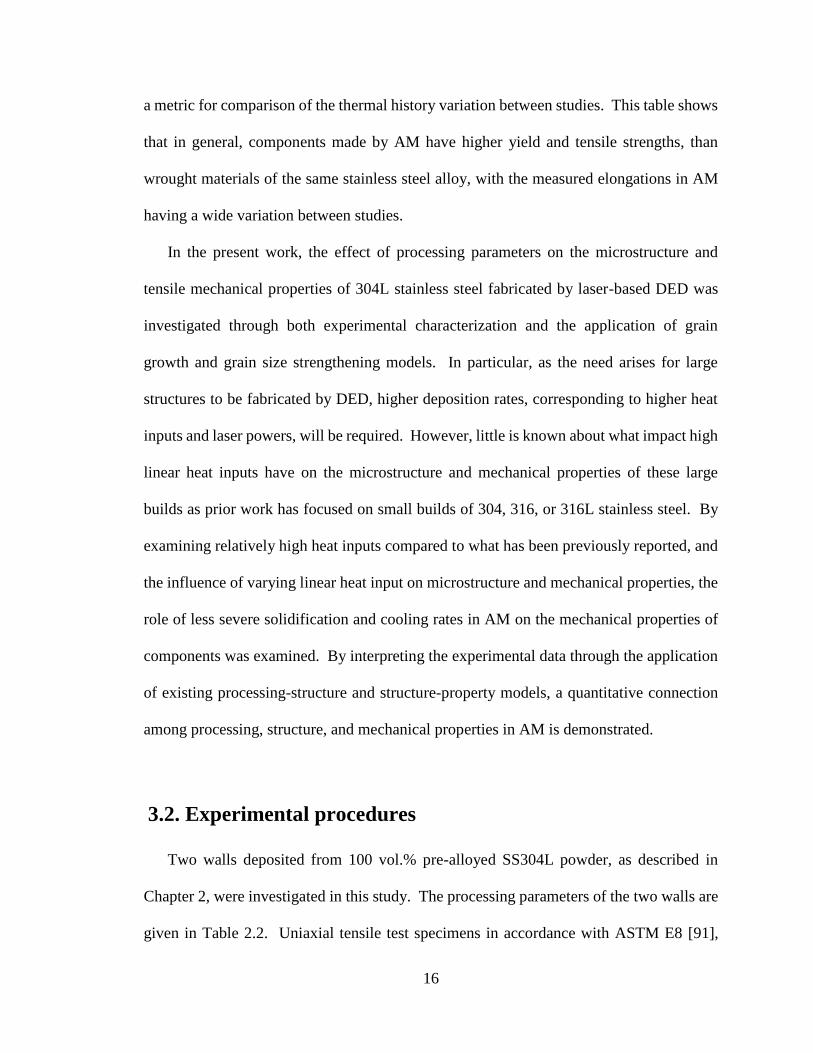
Table 2.2. Processing parameters for 100%, 90%, and 80% SS304L walls, adopted from
[126]. .............................................................................................................. 14
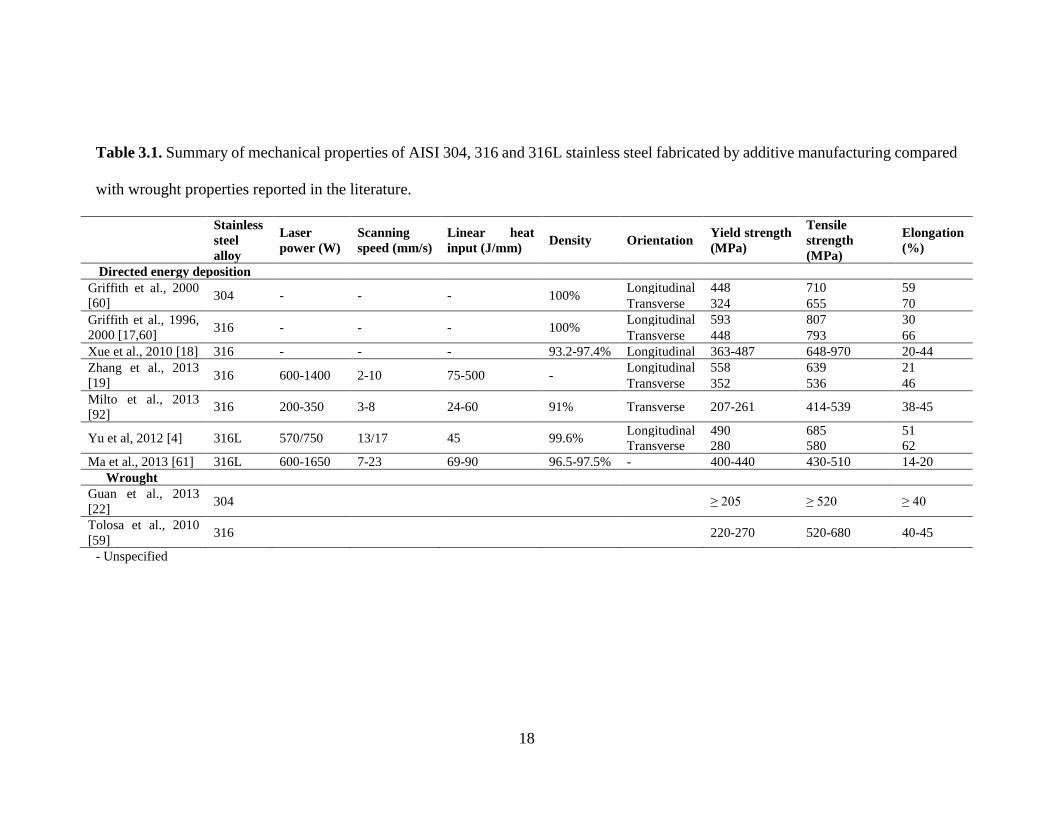
Table 3.1. Summary of mechanical properties of AISI 304, 316 and 316L stainless steel
fabricated by additive manufacturing compared with wrought properties
reported in the literature. ................................................................................ 18
Table 3.2. Summary of mechanical properties and increase in ferrite number after tensile
tests. Values in the table are average ± standard deviation, where n indicates
the number of samples tested in each condition. ............................................ 23
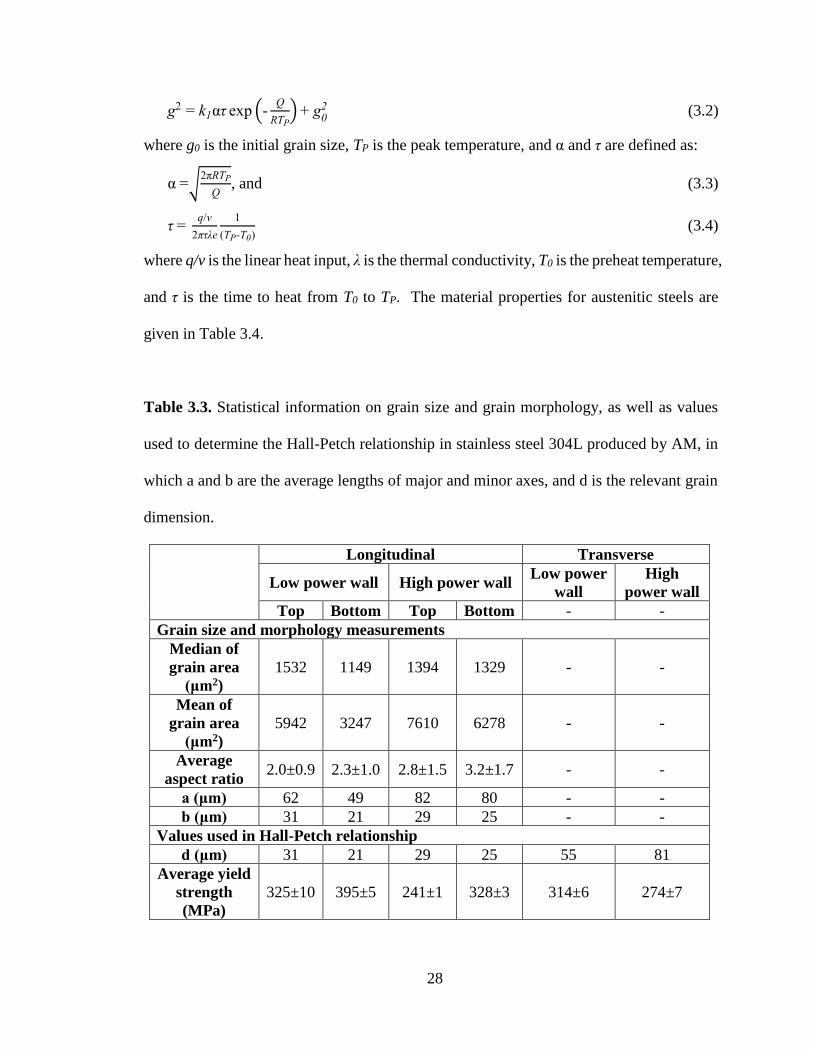
Table 3.3. Statistical information on grain size and grain morphology, as well as values
used to determine the Hall-Petch relationship in stainless steel 304L produced
by AM, in which a and b are the average lengths of major and minor axes, and
d is the relevant grain dimension. .................................................................. 28
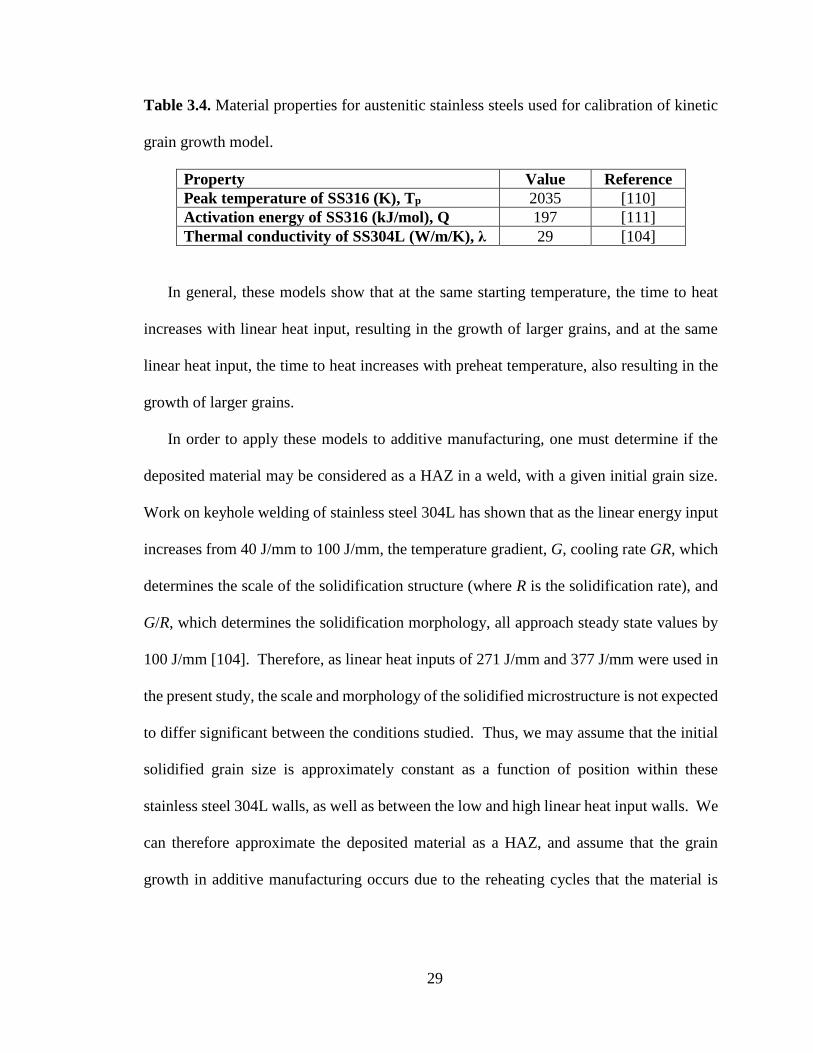
Table 3.4. Material properties for austenitic stainless steels used for calibration of kinetic
grain growth model. ....................................................................................... 29
Table 4.1. Summary of mechanical properties of samples from 100%, 90%, and 80%
SS304L walls compared to the annealed SS304L substrate. Values are given as
average ± standard deviation, and here n indicates the number of tested samples
in each condition, “L” denotes “Longitudinal” and “T” denotes “Transverse”.
........................................................................................................................ 52
Table 4.2. Material properties for steel and aluminum used for finite element simulation,
where T represents temperature in K. ............................................................ 55
Table 4.3. Material properties of austenitic stainless steels used for stacking fault energy
calculation and calculated Gibbs and stacking fault energies of the 100%, 90%,
and 80% SS304L walls. ................................................................................. 60
Table 4.4. Parameters for martensite content calculation using the internal standard method,
where f is the atomic scattering factor of an iron atom. ................................. 66
xiv
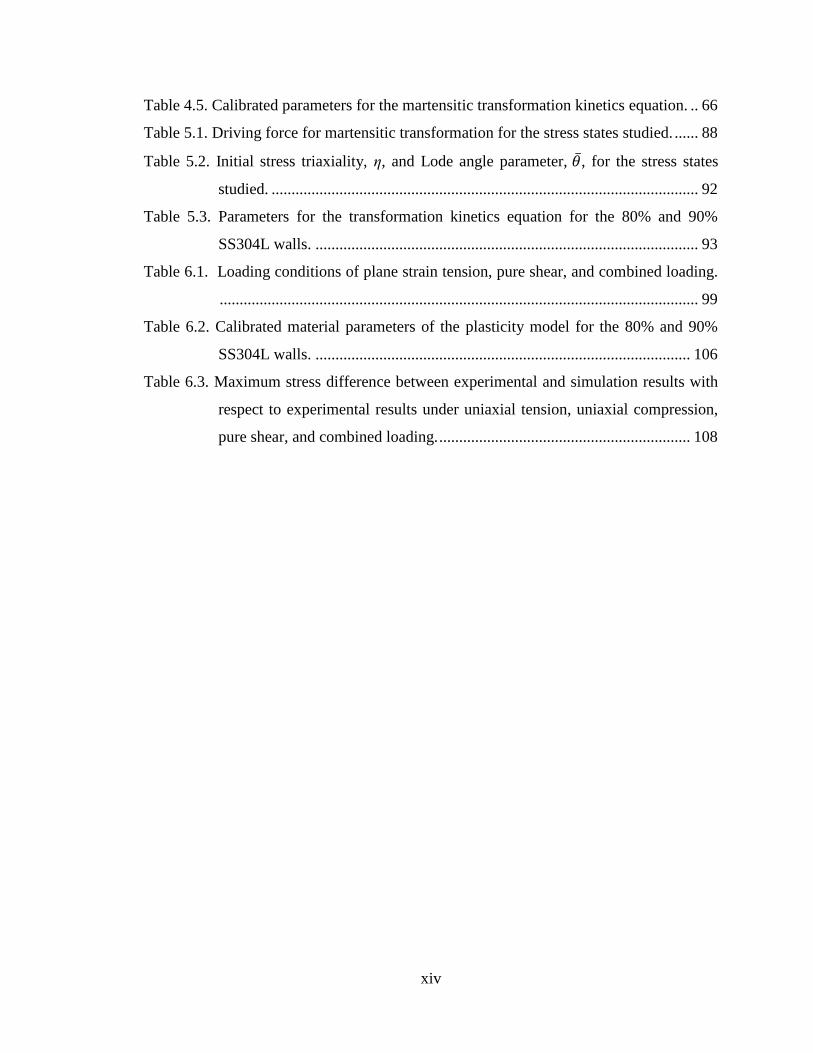
Table 4.5. Calibrated parameters for the martensitic transformation kinetics equation. .. 66
Table 5.1. Driving force for martensitic transformation for the stress states studied. ...... 88
Table 5.2. Initial stress triaxiality, η, and Lode angle parameter, ��, for the stress states
studied. ........................................................................................................... 92
Table 5.3. Parameters for the transformation kinetics equation for the 80% and 90%
SS304L walls. ................................................................................................ 93
Table 6.1. Loading conditions of plane strain tension, pure shear, and combined loading.
........................................................................................................................ 99
Table 6.2. Calibrated material parameters of the plasticity model for the 80% and 90%
SS304L walls. .............................................................................................. 106
Table 6.3. Maximum stress difference between experimental and simulation results with
respect to experimental results under uniaxial tension, uniaxial compression,
pure shear, and combined loading. ............................................................... 108

xv
Acknowledgments
First, I would like to express my sincere thanks to my advisor, Professor Allison Beese,
for her consistent guidance, encouragement, and support for my Ph.D. research and future
career. She has taught me how to be a good scientist, advisor, and mentor, and made my
graduate school meaningful and rewarding.
Besides my advisor, I would like to thank the rest of my committee, Professors
Tarasankar DebRoy, Hojong Kim, and Robert Voigt, for their insightful comments on my
research.
My sincere thanks also go to Dr. Dong Ma, Dr. Alexandru Stoica, and Mr. Matthew
Frost of Oak Ridge National Lab for technical support and helpful discussions.
I would like to thank my labmates, Lourdes Bobbio, Shipin Qin, and Alexander
Wilson-Heid. My research would not have been possibly done without their assistance and
encouragement.
I am grateful for the financial support provided by the National Science Foundation
that allowed me to pursue my Ph.D.
Most importantly, I would like to thank my family and friends for their invaluable
support and love, especially my father Feng Wang, my mother Lingkun Zhang, and my
husband Weinan Chen.
1
Chapter 1
Introduction
In additive manufacturing (AM) of metallic alloys, 3D near-net shape parts are
fabricated layer-by-layer through a repetitive process of the delivery of powder or wire
feedstock to a 2D layer, the melting of feedstock by a heat source (e.g. a laser, electron
beam, or electric arc [1]), the solidification of the molten material, and the fusion of the
deposited material to the substrate or previously deposited layers [2]. During AM, each
layer experiences rapid heating and cooling thermal cycles, resulting in location- and
direction-dependent microstructure and mechanical properties [3–5], which differ from
those in conventionally processed counterparts. AM has many advantages over
conventional manufacturing, including fabricating custom-designed products, producing
complex shaped components, and reducing the waste of raw materials [6,7]. AM has been
used to fabricate various metallic alloy systems, including Ti-6Al-4V [8–16], stainless
steels [4,17–26], aluminum alloys [27–31], cobalt-chromium alloys [32,33], and nickel-
base alloy [34–44].
Transformation Induced Plasticity (TRIP) steels have high strength and ductility, as
they may experience a strain-induced austenite-to-martensite phase transformation when
they are plastically deformed, or the applied the stress is above the yield strength. The
irreversible strain-induced phase transformation contributes to macroscopic strain
hardening and microscopic volume expansion [45–55]. The primary material in this work
is AISI type 304L austenitic stainless steel (SS304L), which belongs to the family of TRIP
steels. Due to the good mechanical properties and corrosion resistance, SS304L has been
widely used in petroleum, marine, and chemical industries [22,56].
2
When additively manufactured SS304L components with complex shapes are used in
structural applications, or anything that is load-bearing, the stress level and stress state vary
as a function of location. However, to the author’s knowledge, only mechanical behavior
under uniaxial tension and uniaxial compression of additively manufactured stainless steels
have been reported [17,19,57–61], which is insufficient to describe and predict the
performance of the components subjected to multiaxial stress states. This work will
provide guidance to design and use additively manufactured SS304L under multiaxial
loading states in structural applications, and study multiaxial plasticity behavior of
additively manufactured steels with retained austenite.
1.1. Additive manufacturing
This thesis focuses on laser-based and powder-based AM techniques, which have two
classes: directed energy deposition (DED) and powder bed fusion (PBF), as defined by
ISO/ASTM 52900 [62].
1.1.1. Directed energy deposition
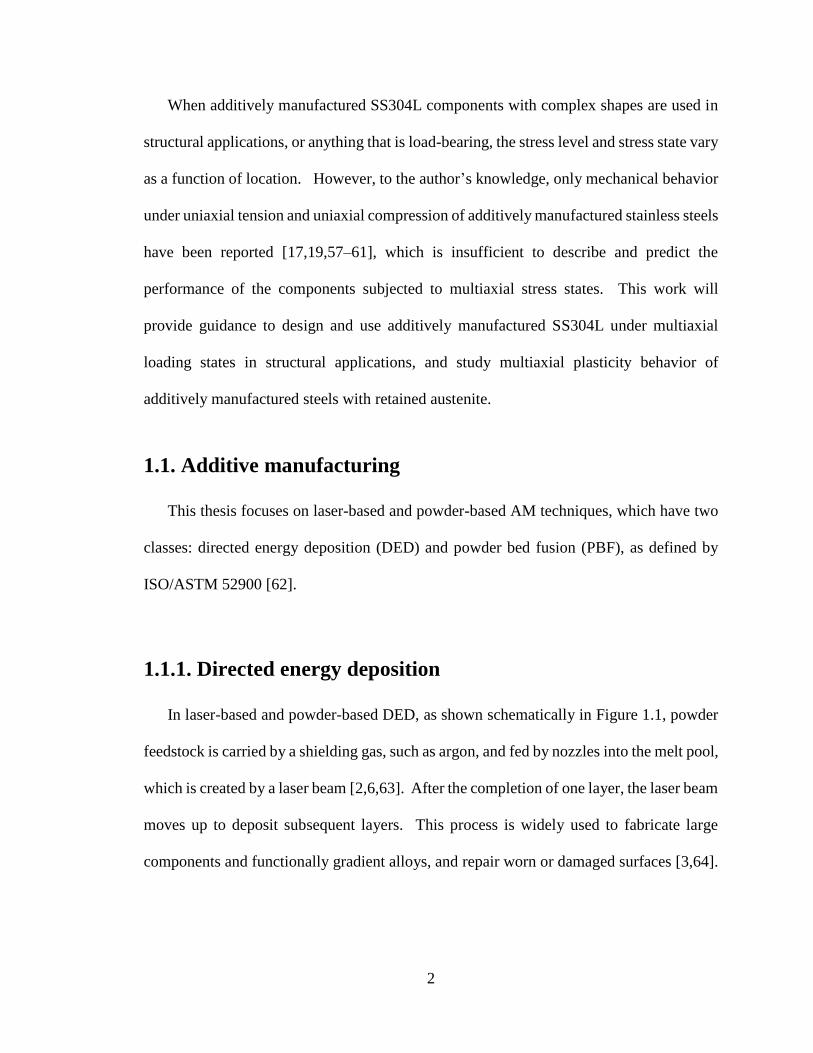
In laser-based and powder-based DED, as shown schematically in Figure 1.1, powder
feedstock is carried by a shielding gas, such as argon, and fed by nozzles into the melt pool,
which is created by a laser beam [2,6,63]. After the completion of one layer, the laser beam
moves up to deposit subsequent layers. This process is widely used to fabricate large
components and functionally gradient alloys, and repair worn or damaged surfaces [3,64].
3
Figure 1.1. Schematic of the directed energy deposition process. Figure from [11].
1.1.2. Powder bed fusion
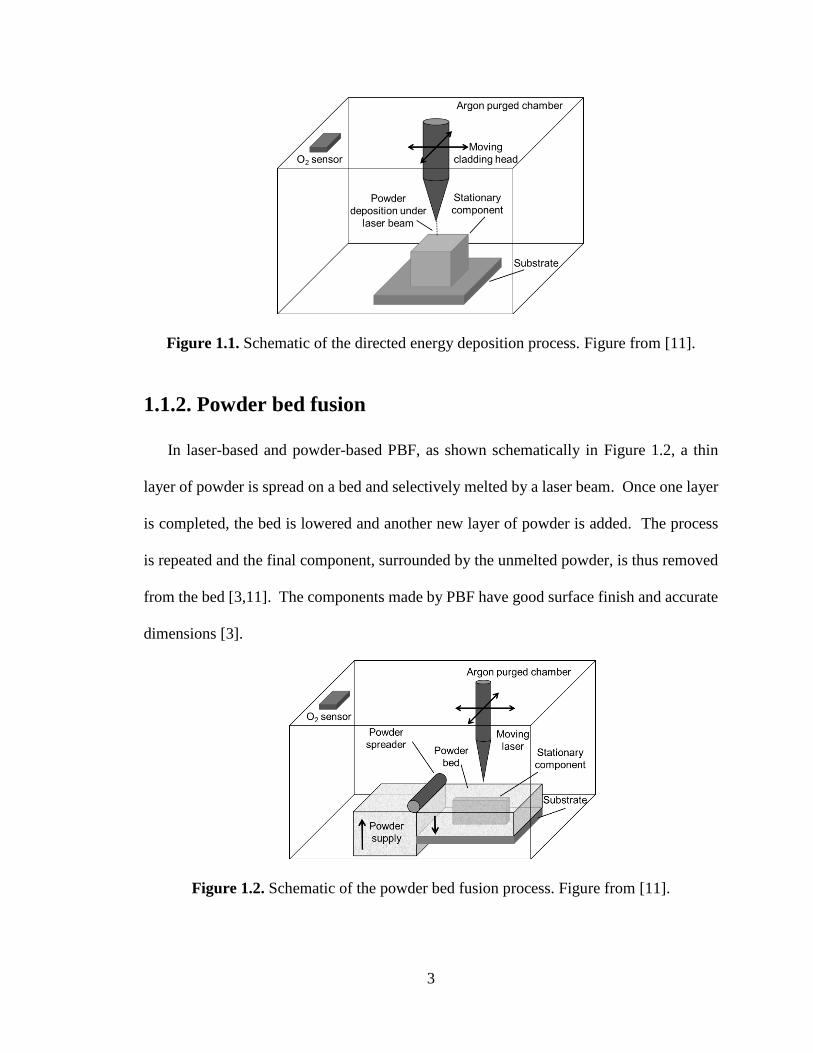
In laser-based and powder-based PBF, as shown schematically in Figure 1.2, a thin
layer of powder is spread on a bed and selectively melted by a laser beam. Once one layer
is completed, the bed is lowered and another new layer of powder is added. The process
is repeated and the final component, surrounded by the unmelted powder, is thus removed
from the bed [3,11]. The components made by PBF have good surface finish and accurate
dimensions [3].
Figure 1.2. Schematic of the powder bed fusion process. Figure from [11].
4
1.2. Martensitic phase transformation
In additively manufactured SS304L, not all δ-ferrite transforms to austenite during
rapid solidification, which leads to residual columnar δ-ferrite dendrites in the austenite
matrix [65].
The propensity for strain-induced martensitic transformation is influenced by the
stacking fault energy (SFE) of austenite [66]. In face-centered cubic (fcc) austenite, the
stacking sequence of {111} planes are changed from ABCABC to ABABAB by a stacking
fault, resulting in the formation of a thin layer of hexagonal close-packed (hcp) phase. The
hcp ε martensite nucleates at the overlapped stacking faults and serves as nucleation sites
for body-centered cubic (bcc) strain-induced α’ martensite [47,49,66,67]. Austenite-to-
martensite phase transformation also occurs when the applied stress is below the yield
strength, which is referred to as stress-assisted martensitic phase transformation. This
phase transformation is reversible and responsible for the shape memory effect [47,68].
At a given plastic strain, martensitic transformation rate is affected by several factors,
including chemical composition, temperature, strain, strain rate, stress state, texture, and
austenite grain size [46,48,49,66]. As the extent of martensitic transformation influences
the mechanical properties of the materials, it is important to understand the effect of each
factor on martensitic transformation.
1.2.1. Effect of chemical composition
The chemical composition affects the SFE of austenite, which in turn influences the
tendency for martensitic transformation. Due to the low SFE of austenitic stainless steels,
wide stacking faults are often observed [66]. By adding alloying elements, the SFE of
5
austenite increases and the width of stacking faults decreases, which results in a decrease
in the number of nucleation sites for martensite and an increase in austenite stability. A
review on the effect of chemistry on martensitic transformation in conventionally
processed and additively manufactured stainless steels is given in Chapter 4.
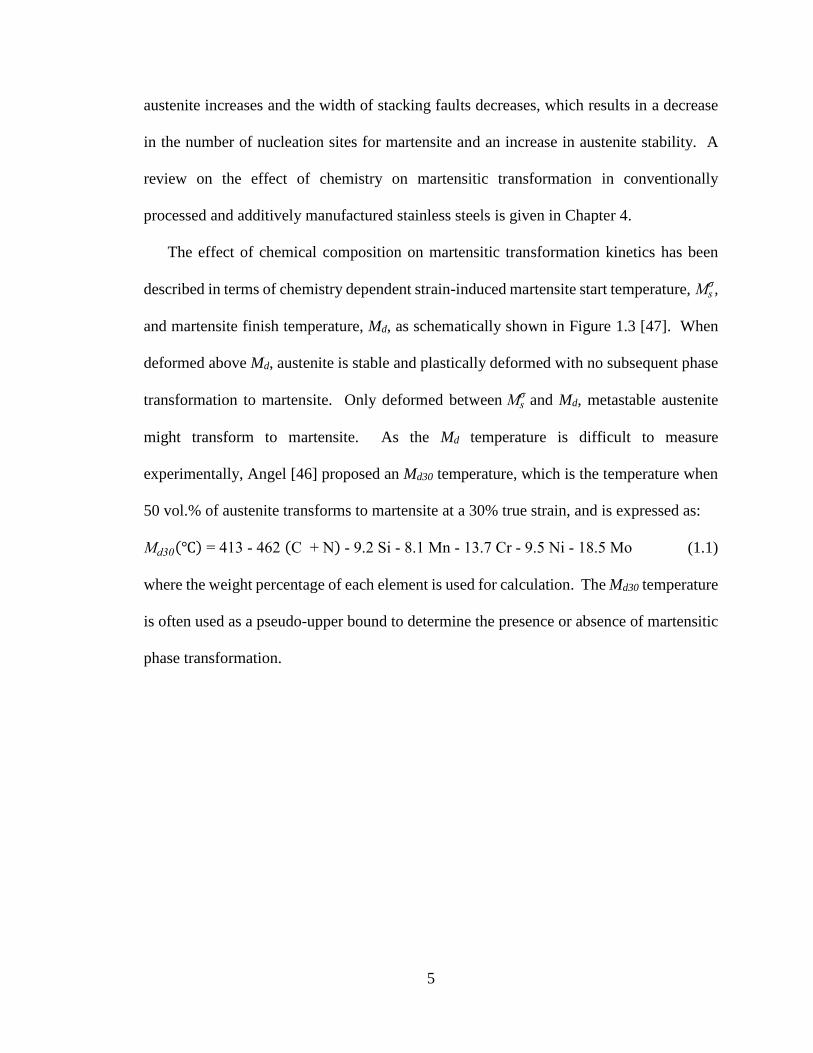
The effect of chemical composition on martensitic transformation kinetics has been
described in terms of chemistry dependent strain-induced martensite start temperature, Msσ,
and martensite finish temperature, Md, as schematically shown in Figure 1.3 [47]. When
deformed above Md, austenite is stable and plastically deformed with no subsequent phase
transformation to martensite. Only deformed between Msσ and Md, metastable austenite
might transform to martensite. As the Md temperature is difficult to measure
experimentally, Angel [46] proposed an Md30 temperature, which is the temperature when
50 vol.% of austenite transforms to martensite at a 30% true strain, and is expressed as:
Md30(℃) = 413 - 462 (C + N) - 9.2 Si - 8.1 Mn - 13.7 Cr - 9.5 Ni - 18.5 Mo (1.1)
where the weight percentage of each element is used for calculation. The Md30 temperature
is often used as a pseudo-upper bound to determine the presence or absence of martensitic
phase transformation.
6
Figure 1.3. Stress as a function of temperature in Fe-Ni-C alloys, schematically showing
strain-induced martensitic phase transformation occurs within the range of Msσ and Md
temperatures. Figure from [47].
1.2.2. Effect of temperature
Strain-induced martensitic transformation only occurs between 𝑀𝑠𝜎 and Md
temperatures. As the deformation temperature increases, the chemical driving force for
martensitic transformation decreases, and the propensity for phase transformation
decreases [46,69,70]. Angel [46] studied martensitic transformation kinetics in 18/8 type
austenitic stainless steel under uniaxial tension at various deformation temperatures from -
188 oC to 80 oC, and found the rate of martensitic transformation with respect to plastic
strain and the saturation value of martensite volume fraction increased as the temperature
decreased. Powell et al. [69] investigated the effect of temperature ranging from 10 K to
293 K on martensitic transformation in 301 and 304 stainless steels, and found the phase
transformation was suppressed as the temperature increased. Iwamoto et al. [70] carried
7
out uniaxial tension and compression tests on 304 stainless steel from 128 K to 353 K, and
their results showed that the rate of martensitic transformation with respect to plastic strain
and saturation value of martensite content increased as the temperature decreased under
both stress states.
1.2.3. Effect of strain rate
The strain rate affects martensitic phase transformation by affecting the temperature.
Most studies have shown that at a high strain rate, adiabatic heating from plastic
deformation increases the temperature and austenite stability, and suppresses the phase
transformation [71–77].
Staudhammer et al. [75], Hecker et al. [72], and Murr et al. [73] investigated the effect
of strain rate on martensitic phase transformation at strain rates from 10-3 s-1 to 103 s-1 in
304 stainless steel subjected to uniaxial tension. They observed that when the true strain
was below 0.25, strain-induced α’ martensite content was larger in specimens loaded at a
higher strain rate than that at a lower strain rate. When the applied strain was above 0.25,
α’ martensite content was lower at a higher strain rate due to the adiabatic heating.
Talonen et al. [74] performed uniaxial tension tests on 301LN and 304 stainless steels
at strain rates between 3 x 10⁻⁴ s-1 and 200 s-1, and found the martensitic transformation
rate and the saturation value of martensitic content decreased as the strain rate increased.
8
1.2.4. Effect of stress state
The effect of stress state on martensitic transformation kinetics has been studied
extensively in conventionally processed steels, but the experimental results are
contradictory [50]. In addition, there is a lack of study on investigating martensitic
transformation kinetics under multiaxial stress states in additively manufactured steels. A
review of current literature on the effect of stress state on martensitic transformation
kinetics in conventionally processed steels, and our results in additively manufactured
SS304L are described in Chapter 5.
1.2.5. Effect of texture
Additively manufactured components are textured, as columnar austenite grains are
preferably oriented along the build direction [44,78]. Texture has a large impact on strain-
induced martensitic transformation, as the austenite orientation with respect applied stress
state influences the driving force for phase transformation [79–82]. A review of current
literature on the effect of texture on martensitic transformation kinetics in conventionally
processed steels are discussed in Chapter 5.
1.2.6. Effect of austenite grain size
Many investigations have indicated that as austenite grain size increases, the austenite
stability decreases, which promote martensitic phase transformation [83–85]. Nohara et al.
[83] investigated the effect of grain size on martensitic transformation in Fe-Ni-Cr stainless
steels. Their results showed with a decrease in austenite grain size, the martensite content
9
decreased, and they modified Eqn. (1.1) by incorporating the effect of grain size, as shown
in Eqn. (1.2):
Md30 (oC) = 551 – 462 (C + N) – 9.2 Si – 8.1 Mn – 13.7 Cr – 29 (Ni + Cu) – 18.5 Mo – 68
Nb – 1.42 (GS – 8) (1.2)
where GS is the ASTM grain size number [86]. Varma et al. [84] also found the amount
of martensite was higher in 304 and 316 stainless steels with larger grains than that in the
same materials with smaller grains when subjected to uniaxial tension and cold rolling.
However, Shrinivas et al. [87] found martensite content increased as the grain size
decreased in 304 stainless steel, and martensitic transformation was not affected by the
grain size in 316 stainless steel.
In this thesis, all the mechanical tests were performed at room temperature at quasi-
static strain rates. In addition, the grain size in the materials studied varied from 5.5 to 6.5
in ASTM grain size number [2,86], which had little influence on the Md30 temperature and
austenite stability. Therefore, the effects of strain rate, temperature, and grain size on
martensitic phase transformation are not discussed in this thesis.
1.3. Thesis outline
The objective of this thesis is to quantify process-microstructure-multiaxial mechanical
property relationships in 304L stainless steel fabricated by laser-based and powder-based
directed energy deposition additive manufacturing. A physically-based plasticity model
coupled with martensitic transformation kinetics equation is developed to link
microstructural phase evolution to multiaxial plasticity behavior of the material on the
macroscale.
10
The thesis is arranged as the following chapters:
In Chapter 2, the SS304L components made by DED AM is discussed. The processing
parameters used during fabrication, and the chemical compositions of the materials are
introduced.
In Chapter 3, the effect of processing parameters, described as linear heat input, on
microstructure and uniaxial tensile mechanical properties of additively manufactured
SS304L is discussed. A grain growth model was applied to describe austenite grain size
as a function of linear heat input and location. A Hall-Petch relation was used to
quantitatively link austenite grain size and morphology to yield strength. The high nitrogen
content in additively manufactured SS304L stabilized austenite and impeded strain-
induced martensitic phase transformation
In Chapter 4, the effect of chemistry on strain-induced martensitic transformation in
additively manufactured SS304L is investigated. Using a mixture of pre-alloyed SS304L
powder with iron powder, austenite stability decreased and martensitic transformation
increased, which promoted ultimate tensile strength and ductility. The elements that
increase the SFE of austenite were preferentially evaporated from the melt pool, resulting
in location-dependent martensitic transformation. A chemistry-dependent transformation
kinetics equation was proposed for additively manufactured steels experiencing martensitic
transformation.
In Chapter 5, the effect of stress state on strain-induced martensitic transformation
kinetics in additively manufactured SS304L with texture is studied. The martensitic phase
transformation rate in textured SS304L was higher under uniaxial compression than
uniaxial tension, contradictory to the trend in texture-free conventionally processed
11
stainless steels, as the initial texture in additively manufactured SS304L facilitated phase
transformation under uniaxial compression. A stress state- and texture-dependent
transformation kinetics equation was presented for additively manufactured SS304L.
In Chapter 6, a physically-based plasticity model is proposed for additively
manufactured SS304L, in which microscopic martensitic transformation is linked to
macroscopic mechanical behavior. The stress state-, texture-, and chemistry-dependent
martensitic transformation kinetics equation was incorporated into the isotropic hardening
law to describe the effect of phase evolution on mechanical properties. The predicted
stress-strain curves from the model agreed well with the experimental results for all the
stress states studied.
In Chapter 7, a summary and conclusions of the thesis are presented, as well as
suggestions for the direction of future research.
12
Chapter 2
Material description
Four SS304L components were fabricated using a custom-designed DED system at the
Applied Research Lab at Penn State University, as shown schematically in Figure 1.1. In
order to isolate the effect of chemistry on martensitic phase transformation and resulting
mechanical properties, three walls were fabricated using similar processing parameters but
different initial powder compositions by varying the volume fractions of pre-alloyed
SS304L powder and iron power. The pre-alloyed SS304L powder was made using
nitrogen gas atomization (Carpenter Powder Products, Corp.) with elemental composition
shown in Table 2.1. The iron powder was made using hydrogen reduction (Atlantic
Equipment Engineers) with a purity of 99.8%. The SS304L powder and iron powder had
a sieve size of +325/-100, corresponding to a powder size distribution in the range of 45
µm to 145 µm. The first wall was deposited from 100 vol.% SS304L powder, the second
wall from 90 vol.% SS304L powder and 10 vol.% iron powder, and the third wall from 80%
vol.% SS304L powder and 20 vol.% iron powder. The final components are referred to as
100%, 90%, and 80% SS304L walls, respectively. The 100% SS304L wall was 110 mm
long x 70 mm tall x 11 mm thick, while the 90% and 80% SS304L walls were 140 mm
long x 104 mm tall x 14 mm thick.
In order to isolate the effect of processing parameters, a fourth wall was fabricated from
100 vol.% SS304L powder with the same dimension, but different processing parameters,
compared to the first wall. The processing parameters and powder compositions of each
wall are given in Table 2.2. The energy input is described by the linear heat input, which
is the ratio of laser power to scanning speed. All the walls were deposited on
13
conventionally processed annealed 304L stainless steel substrates (ASTM A479 standard
[88]).
During deposition, the chamber was purged using ultra-high purity argon gas to
eliminate oxygen contamination. The oxygen level was kept between 60 ppm to 110 ppm,
measured by an oxygen analyzer (General Electric CGA 351 Zirconium Oxide Oxygen
Analyzer). An ytterbium fiber laser (IPG Photonics® YLR-12000-L) working at a
wavelength from 1070 nm to 1080 nm was delivered by a fiber with 600 µm in diameter
from an optics system, which consisted of a 125 mm focal length collimator and a 600 mm
focal length focusing optics. The powder was delivered through a feeder (Mark XV
Precision Powder Feeder) to a custom-designed system equipped with four nozzles. The
nozzles were about 10 mm above the substrates and deposited layers, which was the
defocused position of the laser beam with a 4 mm spot diameter. The beam was
characterized by a beam monitor (PRIMES® Focus Monitor) and followed a Gaussian
energy distribution.
The elemental compositions of deposited components and the substrate were
characterized (Element Materials Technology, Newtown, PA) with results given in Table
2.1. Inert gas fusion was used to measure nitrogen content, and combustion testing was
used to measure carbon and sulfur contents, adhering to ASTM E1019 [89]. Optical
emission spectrometry was used to measure the weight fractions of the remaining elements,
adhering to ASTM E1086 [90].
14
Table 2.1. Elemental composition (wt.%) of different locations from the 100%, 90%, and
80% SS304L walls and the conventionally processed SS304L substrate, as well as the
computed Md30 temperatures, adopted from [126].
Distance
from the
substrate
(mm)
C N Si Mn Cr Ni Mo Md30
(oC)
SS304L
powder - 0.01 0.08 0.5 1.5 19.0 10.3 0.01 -5.3
100% SS304L 70 0.01 0.09 0.56 1.42 18.94 9.90 0.01 -3.6
90% SS304L 50 0.01 0.09 0.63 1.25 16.89 8.75 0.05 35.4
15 0.01 0.09 0.7 1.31 17.05 9.47 0.05 25.3
80% SS304L
62 0.01 0.09 0.64 1.27 16.73 9.08 0.05 34.2
40 0.01 0.09 0.63 1.27 16.62 8.92 0.05 36.4
13 0.01 0.09 0.61 1.23 16.72 8.64 0.05 39.2
SS304L
substrate - 0.02 0.04 0.46 1.26 18.25 8.02 0.07 43.3
Table 2.2. Processing parameters for 100%, 90%, and 80% SS304L walls, adopted from
[126].
Number Wall 1 Wall 2 Wall 3 Wall 4
Name
100% SS304L
wall (low
power)
90% SS304L
wall
80% SS304L
wall
100% SS304L
wall (high
power)
Powder
composition
100 vol.%
SS304L
90% vol.%
SS304L + 10
vol.% iron
80% vol.%
SS304L + 20
vol.% iron
100 vol.%
SS304L
Laser power
(W) 2300 2000 2000 4000
Scanning
speed (mm/s) 8.5 10.6 10.6 10.6
Linear heat
input (J/mm) 277 189 189 377
Powder flow
rate (g/min) 18 15.5 15.5 23
Hatch spacing
(mm) 2.5 2.5 2.5 2.5
Layer height
(mm) 1.2 1.1 1.1 1.1
15
Chapter 3
Effect of processing parameters on microstructure and
mechanical properties
3.1. Introduction
Previous research on AISI type 316, 316L, and 304 stainless steel components made
by DED shows that the uniaxial tensile strength is lower but elongation higher in samples
loaded along the transverse direction, or parallel to the vertical build direction, as compared
with longitudinal samples, or those whose tensile axis is aligned with subsequent layers
[4,17,19,60]. Zhang et al. [19] studied the effect of laser power and scanning speed on
microstructure and mechanical properties by building 316 stainless steel components by
DED with laser powers ranging from 600 W to 1400 W and scanning speeds ranging from
2 mm/s to 10 mm/s. They showed that yield and tensile strengths decreased with increasing
laser power and decreasing scanning speed, as this combination results in slower cooling
rates and therefore larger grains.
A summary of mechanical properties of austenitic stainless steel components made by
AM, compared with wrought and annealed plate, is given in Table 3.1. The mechanical
properties of components made by AM vary in the literature as the process parameters vary
component, we compute the linear heat input when available for the studies in Table 3.1 as
Reproduced from: Z. Wang, T. A. Palmer, and A. M. Beese, “Effect of processing parameters on
microstructure and tensile properties of austenitic stainless steel 304L made by directed energy
deposition additive manufacturing,” Acta Mater., vol. 110, pp. 226–235, 2016 [2].
16
a metric for comparison of the thermal history variation between studies. This table shows
that in general, components made by AM have higher yield and tensile strengths, than
wrought materials of the same stainless steel alloy, with the measured elongations in AM
having a wide variation between studies.
In the present work, the effect of processing parameters on the microstructure and
tensile mechanical properties of 304L stainless steel fabricated by laser-based DED was
investigated through both experimental characterization and the application of grain
growth and grain size strengthening models. In particular, as the need arises for large
structures to be fabricated by DED, higher deposition rates, corresponding to higher heat
inputs and laser powers, will be required. However, little is known about what impact high
linear heat inputs have on the microstructure and mechanical properties of these large
builds as prior work has focused on small builds of 304, 316, or 316L stainless steel. By
examining relatively high heat inputs compared to what has been previously reported, and
the influence of varying linear heat input on microstructure and mechanical properties, the
role of less severe solidification and cooling rates in AM on the mechanical properties of
components was examined. By interpreting the experimental data through the application
of existing processing-structure and structure-property models, a quantitative connection
among processing, structure, and mechanical properties in AM is demonstrated.
3.2. Experimental procedures
Two walls deposited from 100 vol.% pre-alloyed SS304L powder, as described in
Chapter 2, were investigated in this study. The processing parameters of the two walls are
given in Table 2.2. Uniaxial tensile test specimens in accordance with ASTM E8 [91],
17
with a gauge length of 21.5 mm, gauge width of 4 mm, and thickness of 2 mm, were
extracted from the two walls and the substrate by wire electrical discharge machining
(EDM), as shown in Figure 3.1. From each wall, specimens were cut in two orientations:
one set such that the tensile axis of each specimen was perpendicular to the build direction,
denoted as longitudinal specimens, and the second set such that the tensile axis of each
specimen was parallel to the build direction, denoted as transverse specimens. For
comparison, specimens were also extracted from the annealed 304L substrate.
Figure 3.1. Photograph showing the positions from which tensile specimens were extracted
in each wall. X is the thickness direction, y is the longitudinal direction, and z is the build,
or transverse, direction.
18
Table 3.1. Summary of mechanical properties of AISI 304, 316 and 316L stainless steel fabricated by additive manufacturing compared
with wrought properties reported in the literature.
Stainless
steel
alloy
Laser
power (W)
Scanning
speed (mm/s)
Linear heat
input (J/mm) Density Orientation
Yield strength
(MPa)
Tensile
strength
(MPa)
Elongation
(%)
Directed energy deposition
Griffith et al., 2000
[60] 304 - - - 100%
Longitudinal 448 710 59
Transverse 324 655 70
Griffith et al., 1996,
2000 [17,60] 316 - - - 100%
Longitudinal 593 807 30
Transverse 448 793 66
Xue et al., 2010 [18] 316 - - - 93.2-97.4% Longitudinal 363-487 648-970 20-44
Zhang et al., 2013
[19] 316 600-1400 2-10 75-500 -
Longitudinal 558 639 21
Transverse 352 536 46
Milto et al., 2013
[92] 316 200-350 3-8 24-60 91% Transverse 207-261 414-539 38-45
Yu et al, 2012 [4] 316L 570/750 13/17 45 99.6% Longitudinal 490 685 51
Transverse 280 580 62
Ma et al., 2013 [61] 316L 600-1650 7-23 69-90 96.5-97.5% - 400-440 430-510 14-20
Wrought
Guan et al., 2013
[22] 304 ≥ 205 ≥ 520 ≥ 40
Tolosa et al., 2010
[59] 316 220-270 520-680 40-45
- Unspecified
19
The internal structure, including pores or defects, of the samples was visualized using
X-ray computed tomography (CT), which is a nondestructive technique to examine the
interior structure of bulk materials. Here, X-ray CT (General Electric phoenix v|tome|x m)
was used to quantify the porosity of the samples made by AM and to visualize and quantify
internal inclusions in two representative tensile specimens. Scans were performed using a
300 kV microfocus X-ray source with a GE DXR250 flat panel detector with a 200 µm
pitch. Two sets of scanning parameters were used in the inspection of the specimens,
depending on the desired level of resolution. For higher resolution scans with a voxel size
of 25 µm, an accelerating voltage of 250 kV and a tube current of 100 µA were used with
800 projections per scan and a total scan time of 26 minutes. Lower resolution scans with
a voxel size of 35 µm allowed for higher powers to be used with the x-ray tube, and
accelerating voltages between 250 kV and 270 kV with corresponding tube currents of 150
µA and 130 µA, respectively, were used. For these two cases, 600 projections per scan
and a total scan time of 14 minutes were used. These voxel sizes should allow for the
identification of pores 50-70 µm in diameter or larger [93,94]. The scans were analyzed
using VGStudio Max 2.2 visualization and analysis software.
To study the potential phase transformation from austenite to martensite,
nondestructive magnetic permeability measurements were made using a feritescope
(Fischer Feritescope FMP 30). The microstructure of as-deposited 304L contains
paramagnetic austenite, ferromagnetic ferrite, and potentially ferromagnetic martensite.
Thus, the magnetic permeability of the sample will indicate the presence of ferrite and
martensite together [95–98]. While austenite has the potential to transform to martensite
with plastic deformation [25,48,99], but there is no phase transformation of ferrite [100];
20
therefore, any increase in magnetic permeability can be attributed to a phase transformation
from austenite to martensite.
Uniaxial tension tests were performed on an electromechanical testing frame (Instron
4202, 10 kN load cell) at a strain rate of 1.2x10⁻³/s. Digital image correlation (DIC), a non-
contact method for measuring surface deformations, was used to compute surface strains
using correlation software (Vic2D, Correlated Solutions). In this technique, the surface of
each sample was painted white with a black speckle pattern. A digital camera (Point Grey
GRAS-50S5M-C) was used to image the gauge region of the sample at 1 Hz during each
test, with a pixel size of 90 µm. The surface deformations in the gauge region of each
sample were computed based on digital images using a cubic B-spline interpolation
algorithm with a subset size of 21 pixels and a step size of 5 pixels, resulting in a virtual
strain gauge size of 56 pixels or 1.5 mm in the Vic2D software [101]. The axial strain in
the gauge section of each sample was measured using a 21 mm long vertical virtual
extensometer in the Vic2D software.
To examine the microstructure of the samples, samples were polished using 0.05 μm
colloidal silica and electrolytically etched using 20 wt. % NaOH in DI water at 5 V for 4-
10 s. The samples were observed using an optical microscope (Keyence VHX-2000) in
which ferrite could be detected, as the NaOH solution preferentially attacks delta-ferrite
rendering it dark in micrographs [102]; however, it was not possible to clearly distinguish
grains with this method. Therefore, grains were observed using electron backscatter
diffraction (EBSD; Oxford Nordlys Max2). For EBSD imaging, the samples were polished
using 0.05 μm colloidal silica, and were not etched.
21
3.3. Results and discussion
3.3.1. Overview
The measured mechanical properties under uniaxial tension for all samples are given
in Table 3.2, while representative engineering stress-strain curves of samples extracted
from the two walls and annealed substrate are shown in Figure 3.2. As seen by the
significant standard deviations in Table 3.2, strength and ductility vary between samples
extracted from a single wall made by AM. The samples made by AM have reduced tensile
strength and elongation as compared to the annealed substrate. With respect to processing
conditions, in the same material direction, samples extracted from the low power wall
exhibited higher yield and tensile strengths than samples extracted from the high power
wall, while a similar, but weaker trend is seen in elongation.
For additively manufactured samples made using a single set of processing conditions,
longitudinal specimens have lower elongation than transverse specimens, but there is no
consistent trend in strength versus direction, which we explain in Section 3.3.3. Within the
same wall, the yield and tensile strengths increase in longitudinal samples as the distance
between the sample and the substrate, which was water cooled to room temperature,
decreases (see Figure 3.3).
X-ray CT analysis was performed to visualize and quantify the volume fraction of pores
and inclusions in selected samples prior to testing. No lack of fusion defects were found,
but at the resolution of the X-ray CT scanning parameters used, a distribution of small
spherical pores and inclusions with high contrast were detected, and classified as internal
defects. The volume fractions of defects were found to be in the range of 0.048% to 0.191%
22
across both power levels. These rather low values verify that the mechanical responses
measured here are not impacted by defects in the mechanical testing specimens.
Figure 3.2. Representative engineering stress-strain curves of uniaxial tension samples
extracted from the low power (2.3 kW) wall and high power (4 kW) wall in two directions,
as well as a sample from the annealed substrate.
23
Figure 3.3. Yield (a) and ultimate tensile strength (b) in longitudinal samples as a function
of the distance of the sample gauge region from the substrate.
Table 3.2. Summary of mechanical properties and increase in ferrite number after tensile
tests. Values in the table are average ± standard deviation, where n indicates the number of
samples tested in each condition.
Low power wall High power wall Annealed
Substrate
n = 4
Longitudinal
n = 11
Transverse
n = 7
Longitudinal
n = 10
Transverse
n = 8
Yield
strength
(MPa)
337 ± 29 314 ± 6 277 ± 27 274 ± 7 265 ± 9
Ultimate
tensile
strength
(MPa)
609 ± 18 606 ± 13 581 ± 20 560 ± 12 722 ± 14
Elongation
(%) 48.2 ± 2.5 56.4 ± 5.8 41.8 ± 3.5 50.5 ± 6.7 62.3 ± 2.6
Δ Ferrite
number
(FN)
0.9 ± 0.3 1.3 ± 0.4 0.9 ± 0.3 1.0 ± 0.3 41.7 ± 4.1
24
3.3.2 Effect of processing parameters on grain size and
morphology
The microstructures of longitudinal samples extracted from the low and high power
walls are shown in Figure 3.4, where the relative sizes of grains and layer bands within
each wall is seen in Figure 3.4a and Figure 3.4b. In the low power wall (Figure 3.4a), no
grains span the approximately 0.8 mm tall layer height. In the high power wall (Figure
3.4b), some grains span the 1.2 mm layer height. Figure 3.4c and Figure 3.4d show the
presence of columnar δ-ferrite dendrites inside the austenite matrix, but as shown in Figure
3.4c, upon magnification of the layer boundary in Figure 3.4b, there is no visible sharp
transition in microstructural features across the layer boundary. During rapid solidification
of austenitic stainless steels, the transformation from δ-ferrite to austenite is seldom fully
complete, resulting in residual ferrite dendrites in the austenite matrix upon solidification
[65].
25
Figure 3.4. Optical micrographs of broken longitudinal samples in which the build
direction is vertical and subsequent build layers are horizontal in the images. Dashed lines
indicate the transition between subsequent build layers. (a) Image of a sample extracted
from the low power wall showing short grains within single layers. (b) Image of a sample
extracted from the high power wall showing slightly elongated grains extending the full
layers. (c) Zoom in of inset in (b) showing the lack of a sharp transition in microstructural
features between subsequent build layers in which the bright phase is austenite and the dark
features are skeletal δ-ferrite dendrites. (d) Zoom in of inset in (c) showing δ-ferrite
dendrites in the austenite matrix.
EBSD was used to quantitatively describe the size and morphology of the grains in the
two additively manufactured walls as a function of position and linear heat input. Figure
3.5 shows representative inverse pole figures of samples extracted 15 mm from the top and
7 mm from the bottom of each of the two walls. Comparison of these images qualitatively
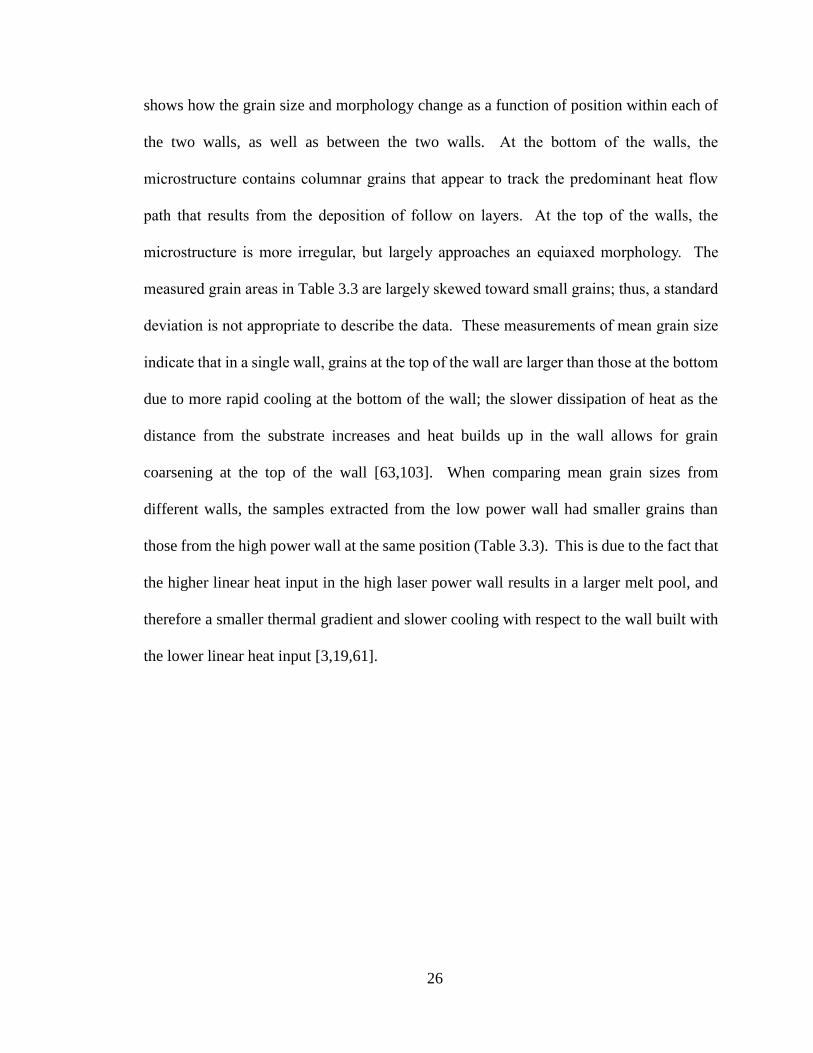
26
shows how the grain size and morphology change as a function of position within each of
the two walls, as well as between the two walls. At the bottom of the walls, the
microstructure contains columnar grains that appear to track the predominant heat flow
path that results from the deposition of follow on layers. At the top of the walls, the
microstructure is more irregular, but largely approaches an equiaxed morphology. The
measured grain areas in Table 3.3 are largely skewed toward small grains; thus, a standard
deviation is not appropriate to describe the data. These measurements of mean grain size
indicate that in a single wall, grains at the top of the wall are larger than those at the bottom
due to more rapid cooling at the bottom of the wall; the slower dissipation of heat as the
distance from the substrate increases and heat builds up in the wall allows for grain
coarsening at the top of the wall [63,103]. When comparing mean grain sizes from
different walls, the samples extracted from the low power wall had smaller grains than
those from the high power wall at the same position (Table 3.3). This is due to the fact that
the higher linear heat input in the high laser power wall results in a larger melt pool, and
therefore a smaller thermal gradient and slower cooling with respect to the wall built with
the lower linear heat input [3,19,61].
27
Figure 3.5. EBSD inverse pole maps of the y-z plane in longitudinal samples. Images of
samples (a) 7 mm from the bottom of the low power wall, (b) 15 mm from the top of the
low power wall, (c) 7 mm from the bottom of the high power wall and (d) 15 mm from the
top of the high power wall.
To quantify the effect of processing conditions on grain size, literature on the effect of
processing conditions on the solidification cooling rate in welds [104] as well as
microstructures in the heat affected zone (HAZ) in welds is examined [105–109]. Relevant
to the present study, researchers have developed models to describe the grain growth in the
HAZ of a weld as a function of preheat temperature and linear heat input [108,109]. These
models assume that grain growth is controlled by diffusion, and that no nucleation is
needed, giving the growth rate of grains in the HAZ at a given temperature, T, as:
dg
dt=
k1
2gexp (-
Q
RT) (3.1)
where g is the grain size, t is time, k1 is a kinetic constant, and Q is the activation energy
for grain growth. After integration, the grain size is given as:
28
g2 = k1ατ exp (-Q
RTP) + g
02 (3.2)
where g0 is the initial grain size, TP is the peak temperature, and α and τ are defined as:
α =√2πRTP
Q, and (3.3)
τ = q/v
2πτλe
1
(TP-T0) (3.4)
where q/v is the linear heat input, λ is the thermal conductivity, T0 is the preheat temperature,
and τ is the time to heat from T0 to TP. The material properties for austenitic steels are
given in Table 3.4.
Table 3.3. Statistical information on grain size and grain morphology, as well as values
used to determine the Hall-Petch relationship in stainless steel 304L produced by AM, in
which a and b are the average lengths of major and minor axes, and d is the relevant grain
dimension.
Longitudinal Transverse
Low power wall High power wall Low power
wall
High
power wall
Top Bottom Top Bottom - -
Grain size and morphology measurements
Median of
grain area
(μm2)
1532 1149 1394 1329 - -
Mean of
grain area
(μm2)
5942 3247 7610 6278 - -
Average
aspect ratio 2.0±0.9 2.3±1.0 2.8±1.5 3.2±1.7 - -
a (μm) 62 49 82 80 - -
b (μm) 31 21 29 25 - -
Values used in Hall-Petch relationship
d (μm) 31 21 29 25 55 81
Average yield
strength
(MPa)
325±10 395±5 241±1 328±3 314±6 274±7
29
Table 3.4. Material properties for austenitic stainless steels used for calibration of kinetic
grain growth model.
Property Value Reference
Peak temperature of SS316 (K), Tp 2035 [110]
Activation energy of SS316 (kJ/mol), Q 197 [111]
Thermal conductivity of SS304L (W/m/K), λ 29 [104]
In general, these models show that at the same starting temperature, the time to heat
increases with linear heat input, resulting in the growth of larger grains, and at the same
linear heat input, the time to heat increases with preheat temperature, also resulting in the
growth of larger grains.
In order to apply these models to additive manufacturing, one must determine if the
deposited material may be considered as a HAZ in a weld, with a given initial grain size.
Work on keyhole welding of stainless steel 304L has shown that as the linear energy input
increases from 40 J/mm to 100 J/mm, the temperature gradient, G, cooling rate GR, which
determines the scale of the solidification structure (where R is the solidification rate), and
G/R, which determines the solidification morphology, all approach steady state values by
100 J/mm [104]. Therefore, as linear heat inputs of 271 J/mm and 377 J/mm were used in
the present study, the scale and morphology of the solidified microstructure is not expected
to differ significant between the conditions studied. Thus, we may assume that the initial
solidified grain size is approximately constant as a function of position within these
stainless steel 304L walls, as well as between the low and high linear heat input walls. We
can therefore approximate the deposited material as a HAZ, and assume that the grain
growth in additive manufacturing occurs due to the reheating cycles that the material is
30
exposed to as additional layers are deposited, analogous to those seen in a HAZ of a multi-
pass weld.
We thus extrapolate the welding models to model the grain growth during thermal
cycles between a preheat temperature and a peak temperature during deposition. As
additional layers are deposited during AM, the temperature of the component increases,
leading to an increase in weld pool size and a reduced thermal gradient [112,113]. This
temperature increase with additional layers can be considered as a preheat temperature of
the base material, or HAZ. Thermocouple measurements indicated that as the walls in the
present study were built, the substrate temperature increased to a steady state value of
387oC (660K) throughout the deposition. Therefore, we can assume that during deposition,
the preheat temperature of the HAZ is approximately room temperature (298K) near the
substrate, while near the top of the build, a lower bound for the preheat temperature is taken
to be 660K.
To apply the kinetic grain growth model shown in Eqns. (3.2) - (3.4), we calibrated the
model using data from the high linear heat input wall, which results in larger grain growth
than the low linear heat input wall. Assuming a preheat temperature of 298K at the bottom
of the wall, and 660K at the top of the wall, Figure 3.6 shows the average grain area, g2,
versus τ, which gives calibrated constants of g02 = 1219 µm2 and k1 = 1.9 x109 µm2/s. These
values are deemed reasonable, as the starting grain size is approximately 40 µm in diameter,
and the k1 value is the same order of magnitude as that found in [108].
31
Figure 3.6. Average grain area versus time to heat for samples extracted 7 mm from the
bottom and 15 mm from the top of both the low power wall and the high power wall, where
average grain size was extracted from EBSD data shown in Figure 3.5 and detailed in Table
3.3. Data from the high power wall (black symbols) were used to fit the kinetic grain
growth model, while data from the low power wall are shown in gray. The fitted line was
used to calibrate the kinetic grain growth model to find the initial grain size, g0, and the
kinetic constant, k1. This calibrated model was used to predict grain growth as a function
of processing parameters for the low power wall.
With this calibrated grain growth model, the grain areas in the lower linear heat input
wall were predicted to be 4856 µm2 and 5813 µm2, as shown in Figure 3.6, which are close
to the experimentally measured mean grain areas shown in Table 3.3. We note that the
prediction of grain growth at the top of the low power wall is more accurate than that at the
bottom. Limitations of this model are that it considers the impact of the most severe
thermal cycle on grain growth, but not subsequent cycles, nor the effect of the substrate
32
acting as a heat sink. However, this approach demonstrates that classical welding models
of grain growth within the HAZ of a weld can be calibrated and extended to additive
manufacturing in order to predict the grain size within a component as a function of
processing history. The quantitative connection between processing and structure is
critical for AM as the local grain size within components in turn dictates the mechanical
properties as described in next section.
3.3.3 Effect of grain size and morphology on mechanical
properties
3.3.3.1 Hall-Petch relationship
The Hall-Petch equation describes the relationship between grain size and yield
strength in equiaxed metals as [114,115]:
σy = σ0 + k
√d (3.5)
where 𝜎𝑦 is the yield strength, d is the average grain diameter, and 𝜎0 and k are material
constants.
In order to define the grain morphology in terms of a quantifiable metric, we
approximate the grains in Figure 3.5 as elliptical and define the grain aspect ratio as the
ratio of the major axis, a, to the minor axis, b, of each grain such that an aspect ratio of 1
indicates an equiaxed grain. Figure 3.7 is a histogram of the aspect ratios of the grains
from the top and bottom of each of the two walls based on EBSD data shown in Figure 3.5.
The average aspect ratios for the top and bottom of each wall are shown in Table 3.3.
Comparing data for each wall independently, grains at the top of the wall were found to
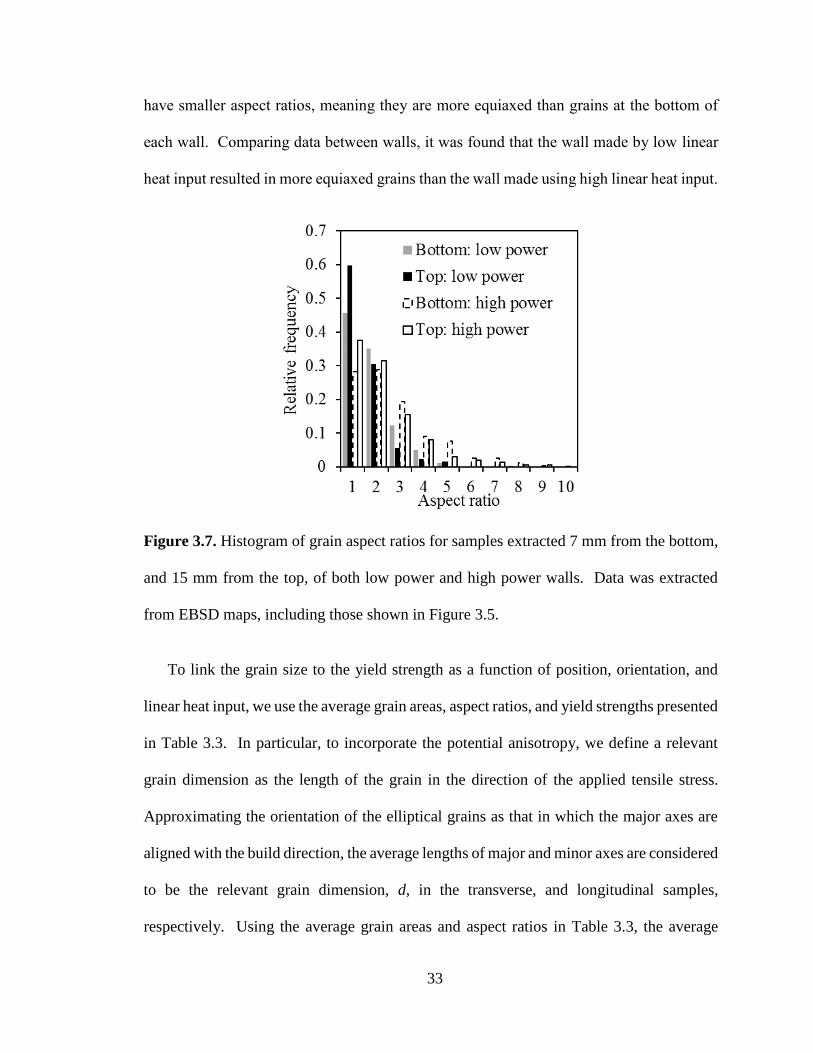
33
have smaller aspect ratios, meaning they are more equiaxed than grains at the bottom of
each wall. Comparing data between walls, it was found that the wall made by low linear
heat input resulted in more equiaxed grains than the wall made using high linear heat input.
Figure 3.7. Histogram of grain aspect ratios for samples extracted 7 mm from the bottom,
and 15 mm from the top, of both low power and high power walls. Data was extracted
from EBSD maps, including those shown in Figure 3.5.
To link the grain size to the yield strength as a function of position, orientation, and
linear heat input, we use the average grain areas, aspect ratios, and yield strengths presented
in Table 3.3. In particular, to incorporate the potential anisotropy, we define a relevant
grain dimension as the length of the grain in the direction of the applied tensile stress.
Approximating the orientation of the elliptical grains as that in which the major axes are
aligned with the build direction, the average lengths of major and minor axes are considered
to be the relevant grain dimension, d, in the transverse, and longitudinal samples,
respectively. Using the average grain areas and aspect ratios in Table 3.3, the average
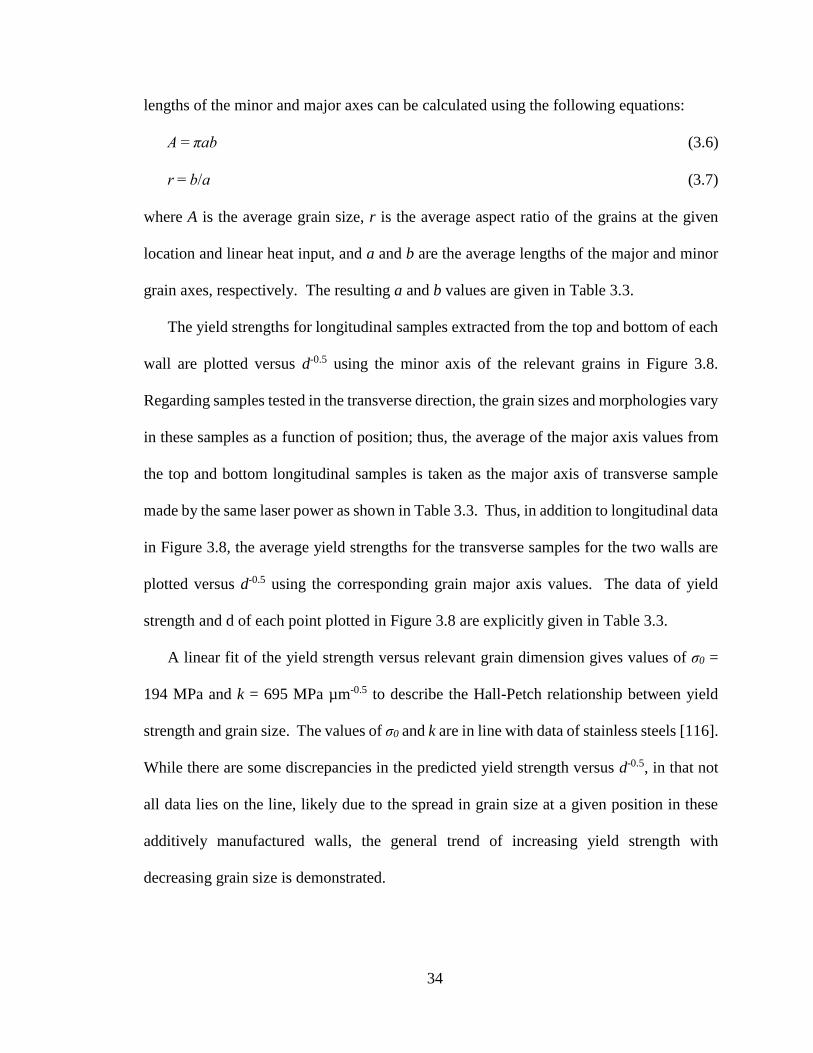
34
lengths of the minor and major axes can be calculated using the following equations:
A = πab (3.6)
r = b/a (3.7)
where A is the average grain size, r is the average aspect ratio of the grains at the given
location and linear heat input, and a and b are the average lengths of the major and minor
grain axes, respectively. The resulting a and b values are given in Table 3.3.
The yield strengths for longitudinal samples extracted from the top and bottom of each
wall are plotted versus d-0.5 using the minor axis of the relevant grains in Figure 3.8.
Regarding samples tested in the transverse direction, the grain sizes and morphologies vary
in these samples as a function of position; thus, the average of the major axis values from
the top and bottom longitudinal samples is taken as the major axis of transverse sample
made by the same laser power as shown in Table 3.3. Thus, in addition to longitudinal data
in Figure 3.8, the average yield strengths for the transverse samples for the two walls are
plotted versus d-0.5 using the corresponding grain major axis values. The data of yield
strength and d of each point plotted in Figure 3.8 are explicitly given in Table 3.3.
A linear fit of the yield strength versus relevant grain dimension gives values of σ0 =
194 MPa and k = 695 MPa µm-0.5 to describe the Hall-Petch relationship between yield
strength and grain size. The values of σ0 and k are in line with data of stainless steels [116].
While there are some discrepancies in the predicted yield strength versus d-0.5, in that not
all data lies on the line, likely due to the spread in grain size at a given position in these
additively manufactured walls, the general trend of increasing yield strength with
decreasing grain size is demonstrated.
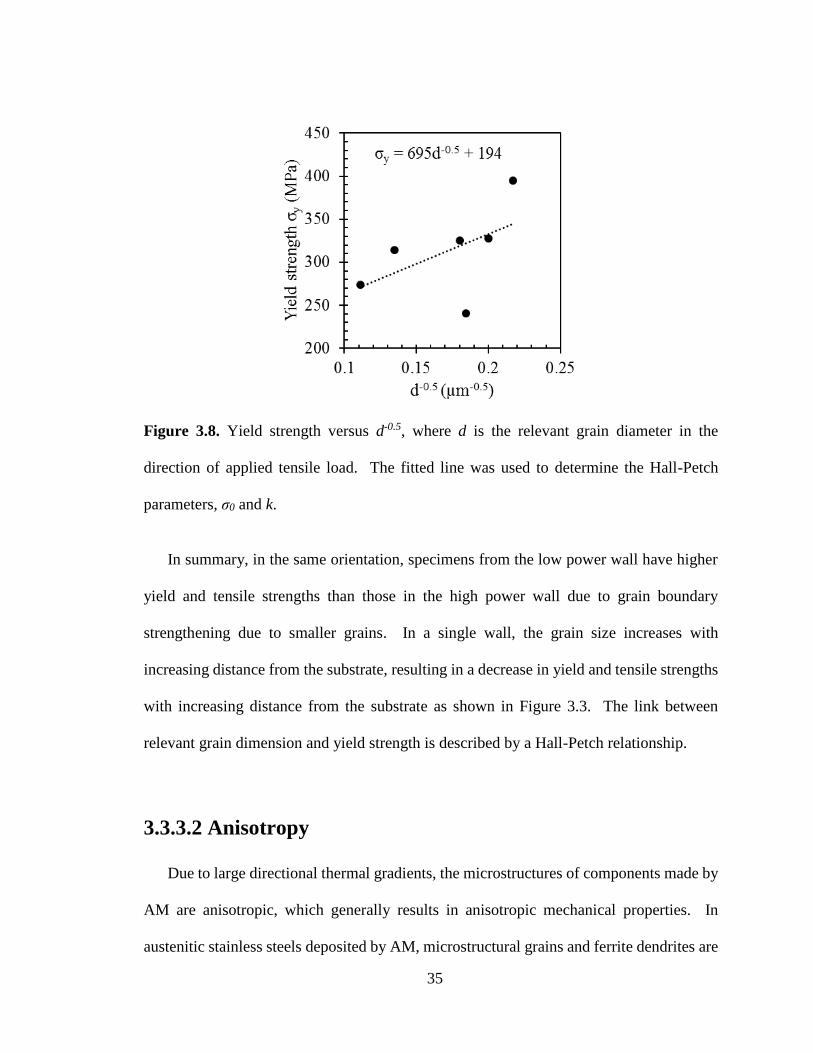
35
Figure 3.8. Yield strength versus d-0.5, where d is the relevant grain diameter in the
direction of applied tensile load. The fitted line was used to determine the Hall-Petch
parameters, σ0 and k.
In summary, in the same orientation, specimens from the low power wall have higher
yield and tensile strengths than those in the high power wall due to grain boundary
strengthening due to smaller grains. In a single wall, the grain size increases with
increasing distance from the substrate, resulting in a decrease in yield and tensile strengths
with increasing distance from the substrate as shown in Figure 3.3. The link between
relevant grain dimension and yield strength is described by a Hall-Petch relationship.
3.3.3.2 Anisotropy
Due to large directional thermal gradients, the microstructures of components made by
AM are anisotropic, which generally results in anisotropic mechanical properties. In
austenitic stainless steels deposited by AM, microstructural grains and ferrite dendrites are
36
preferentially orientated along the highest thermal gradient [19]; however, due to the rapid
solidification and subsequent remelting of material with the additional material layers,
these dendrites are oriented chaotically within the components made by AM (see Figure
3.4c).
When a sample with long and narrow columnar grains orientated along the build
direction is plastically deformed under uniaxial tension in the same direction, dislocations
are required to cross fewer grain boundaries to elongate the sample, which results in lower
yield and tensile strengths than in samples deformed along the longitudinal direction. This
anisotropy in microstructure and mechanical properties is evident in other material systems
produced by DED or PBF, such as Ti-6Al-4V, in which large columnar grains extend
across numerous build layers [8,11,117]; however, the grains in the present study are
confined to individual build layers, as shown in Figure 3.4a and Figure 3.4b.
In the low power wall, grains have small aspect ratios and grow within single layers.
In the high power wall, grains are elongated with slightly higher aspect ratios, but virtually
no grains extend across multiple layers. However, the presence or absence of anisotropy
cannot be addressed directly in the present study due to the convolution of both direction
and location in the tested samples. As shown in Figure 3.3, the yield and ultimate tensile
strengths in longitudinal samples vary with position, while the average yield and ultimate
tensile strengths in the transverse samples fall within the ranges of the corresponding
longitudinal data. Since the gauge regions of the transverse samples span the gauge regions
of approximately the three central longitudinal samples as shown in Figure 3.1, the effects
of direction and location cannot be separated in the transverse samples. Thus, due to this
37
convolution of data from different directions and locations, the possible macroscopic
anisotropy of mechanical properties in the walls made by AM cannot be determined.
3.3.4 Phase Transformation
The superior mechanical properties of the substrate compared to the material made by
AM are attributed to the deformation-induced martensitic transformation that occurs in the
annealed 304L, which results in significant strain hardening and high ductility [48,53,118].
The transformation from austenite to martensite in the annealed substrate material, and
absence of this phase transformation in the additively manufactured material, was
confirmed with magnetic permeability measurements and optical microscopy, and
explained by elemental analysis.
The magnetic permeability of the tensile samples was measured in the gauge region
before testing and after plastic deformation of the gauge regions of each sample. An
increase in magnetic permeability with plastic strain in the substrate material confirms the
phase transformation, while no significant change in magnetic permeability with plastic
strain in the additively manufactured material indicates a lack of phase transformation in
this material. Here, we report the ferrite number (FN), which is a measure of magnetic
permeability of the sample, and which is the standard unit of measurement for reporting
ferromagnetic content in welded austenitic stainless steels [119,120]. The feritescope
measures the magnetic permeability of a finite volume of material, roughly equivalent to a
cylinder of 2 mm in depth and 4 mm in diameter [121]. If the sample thins below 2 mm or
the sample’s width decreases below 4 mm, the output signal needs to be corrected for the
reduced volume being measured. Thus, the corrected FN (SFN, c) of a sample is given by:
38
SFN,c = SFN,mab (3.8)
where a is a thickness correction factor, b is a width correction factor [96,121], and SFN, m
is the measured FN.
The magnetic permeability of the gauge region in each tensile specimen was measured
before loading and after plastic deformation for some samples, and in situ during
mechanical tests for others. Table 3.2 shows the increase in corrected FN in deformed
specimens compared to their undeformed FN values:
ΔFN = FNt - FN0 (3.9)
where FNt is the FN at a given deformation, and FN0 is the initial FN in the undeformed
sample.
The initial magnetic permeability readings in substrate samples and those made by
additive manufacturing were found to be 1-3 FN in all cases. The resolution of FN
measurements with the feritescope is on the order of 1-2 FN. Therefore, in samples
extracted from the walls made by AM, the change in FN after plastic deformation, on the
order of 1 FN (Table 3.2), is not significant, indicating little to no phase transformation
with plastic deformation in these samples. However, the change in magnetic permeability
measurement of 41.7 FN is significant in samples extracted from the annealed substrate,
which is indicative of significant phase transformation from austenite to martensite in the
annealed material.
The absence or occurrence of martensitic phase transformation can be verified by
computing Md30, as shown in Eqn. (1.1) proposed by Angel [46]. If the Md30 temperature
of the annealed substrate or material made by AM is below room temperature, at which all
the tests in this study were performed, it is unlikely that phase transformation will occur in
39
the specimens with plastic deformation. Based on the chemical analysis results in Table
2.1 and Eqn. (1.1), Md30 in the builds made by AM and the annealed substrate were
calculated to be -3.6°C and 43.3°C, respectively. The low Md30 temperature in the
deposited wall is due to the fact that the SS304L powder was manufactured by gas
atomization in nitrogen, which is an austenite stabilizer. Gas atomization of the powder in
nitrogen resulted in a higher nitrogen content in the powder and walls compared to the
substrate. This explains the experimental observation of phase transformation in the
substrate, in which the austenite phase was metastable, and the absence of transformation
in the additively manufactured material, in which the austenite phase was stable.
The absence of a phase transformation in the 304L deposited by AM is significant as it
resulted in a lower ultimate tensile strength than the annealed 304L plate, in which the
microstructural phase transformation provided a high rate of macroscopic strain hardening.
3.4. Summary and conclusions
Two 304L stainless steel walls were fabricated using laser-based directed energy
deposition additive manufacturing in order to elucidate the effect of processing parameters,
namely linear heat input, on the anisotropic and heterogeneous tensile mechanical
properties within a component. The primary conclusions from this study are:
• Slightly elongated grains grew along the build direction in the material made by AM,
resulting in anisotropic elongation in which longitudinal specimens had lower
elongations than transverse specimens. However, no clear anisotropy in macroscopic
yield or tensile strength was identified in the present study.
40
• A kinetic grain growth model, originally formulated to describe the grain growth in the
HAZ of welds, was calibrated and used to describe and predict the effect of linear heat
input and location within an additively manufactured component on grain size. This
provides a quantitative connection between processing parameters and microstructure
for AM components.
• The location-dependent yield strength was found to follow a Hall-Petch dependence on
location- and direction-dependent grain size, demonstrating a quantitative connection
between heterogeneous, anisotropic microstructure and mechanical properties in AM.
• The wall fabricated using lower linear heat input had a finer microstructure, and
therefore, higher yield and tensile strengths, than the wall fabricated with the higher
linear heat input. The coarser microstructure at the top of the walls compared to the
bottom of the walls was predicted to be due to a decreased cooling rate with increased
distance from the substrate, which results in a lower yield and tensile strengths. The
trend in grain size as a function of linear heat input and position corresponded to the
predictions of the kinetic grain growth model. In addition, the yield strength as a
function of grain size and morphology followed a Hall-Petch relationship.
• The ultimate tensile strength and elongation of samples extracted from the 304L
stainless steel walls made by DED AM were found to be lower than those in the
annealed substrate. This is due to the fact that strain-induced martensitic transformation,
which provides high strain hardening and facilitates significant ductility, occurred in
the annealed 304L plate, but not the 304L made by AM as the higher nitrogen content
in the pre-alloyed powder stabilized the austenite phase in the deposited walls.
41
Acknowledgements
The financial support provided by the National Science Foundation through award
number CMMI-1402978 is gratefully acknowledged. Any opinions, findings, and
conclusions or recommendations expressed in this material are those of the authors and
do not necessarily reflect the views of the National Science Foundation. We
acknowledge Mr. Jay Tressler for the fabrication of the walls and Mr. Griffin Jones for
performing the X-ray CT scans.
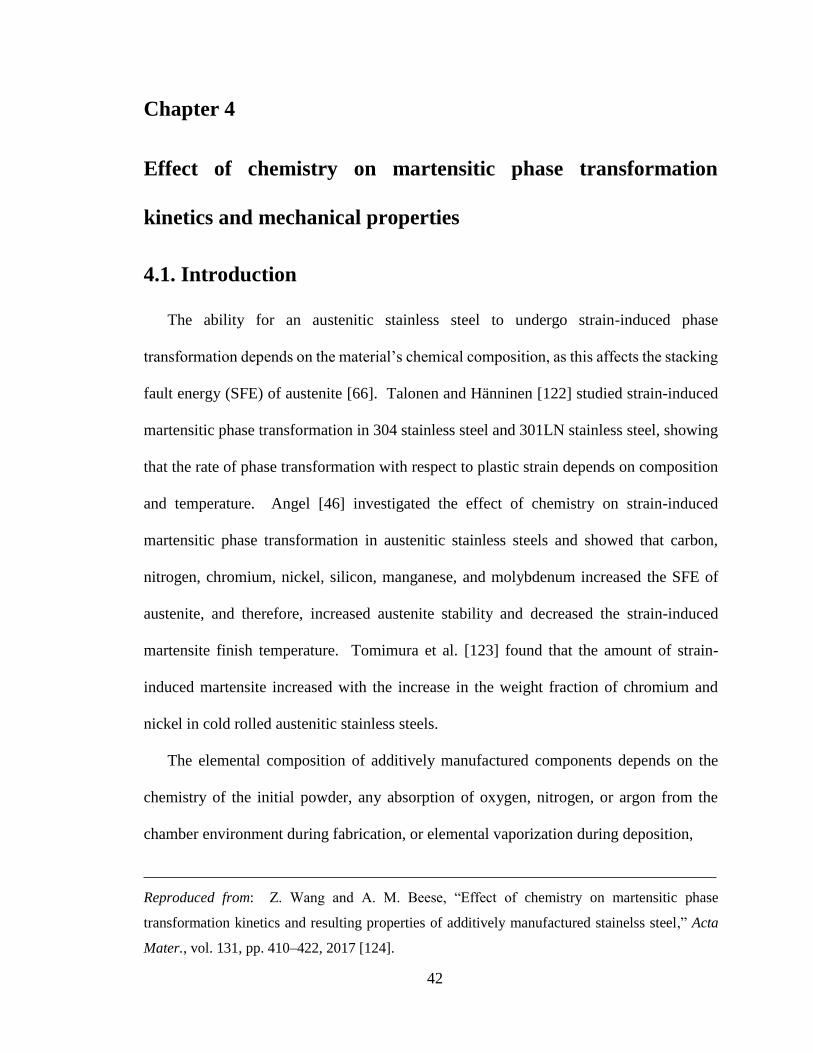
42
Chapter 4
Effect of chemistry on martensitic phase transformation
kinetics and mechanical properties
4.1. Introduction
The ability for an austenitic stainless steel to undergo strain-induced phase
transformation depends on the material’s chemical composition, as this affects the stacking
fault energy (SFE) of austenite [66]. Talonen and Hänninen [122] studied strain-induced
martensitic phase transformation in 304 stainless steel and 301LN stainless steel, showing
that the rate of phase transformation with respect to plastic strain depends on composition
and temperature. Angel [46] investigated the effect of chemistry on strain-induced
martensitic phase transformation in austenitic stainless steels and showed that carbon,
nitrogen, chromium, nickel, silicon, manganese, and molybdenum increased the SFE of
austenite, and therefore, increased austenite stability and decreased the strain-induced
martensite finish temperature. Tomimura et al. [123] found that the amount of strain-
induced martensite increased with the increase in the weight fraction of chromium and
nickel in cold rolled austenitic stainless steels.
The elemental composition of additively manufactured components depends on the
chemistry of the initial powder, any absorption of oxygen, nitrogen, or argon from the
chamber environment during fabrication, or elemental vaporization during deposition,
Reproduced from: Z. Wang and A. M. Beese, “Effect of chemistry on martensitic phase
transformation kinetics and resulting properties of additively manufactured stainelss steel,” Acta
Mater., vol. 131, pp. 410–422, 2017 [124].
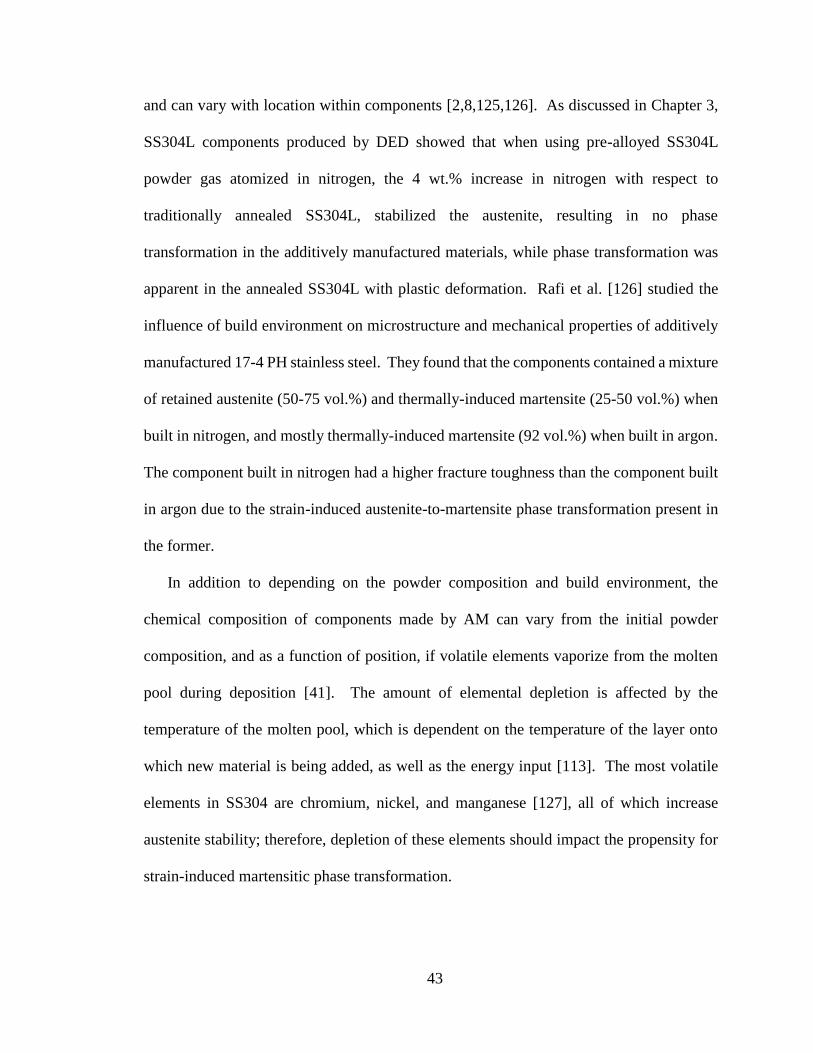
43
and can vary with location within components [2,8,125,126]. As discussed in Chapter 3,
SS304L components produced by DED showed that when using pre-alloyed SS304L
powder gas atomized in nitrogen, the 4 wt.% increase in nitrogen with respect to
traditionally annealed SS304L, stabilized the austenite, resulting in no phase
transformation in the additively manufactured materials, while phase transformation was
apparent in the annealed SS304L with plastic deformation. Rafi et al. [126] studied the
influence of build environment on microstructure and mechanical properties of additively
manufactured 17-4 PH stainless steel. They found that the components contained a mixture
of retained austenite (50-75 vol.%) and thermally-induced martensite (25-50 vol.%) when
built in nitrogen, and mostly thermally-induced martensite (92 vol.%) when built in argon.
The component built in nitrogen had a higher fracture toughness than the component built
in argon due to the strain-induced austenite-to-martensite phase transformation present in
the former.
In addition to depending on the powder composition and build environment, the
chemical composition of components made by AM can vary from the initial powder
composition, and as a function of position, if volatile elements vaporize from the molten
pool during deposition [41]. The amount of elemental depletion is affected by the
temperature of the molten pool, which is dependent on the temperature of the layer onto
which new material is being added, as well as the energy input [113]. The most volatile
elements in SS304 are chromium, nickel, and manganese [127], all of which increase
austenite stability; therefore, depletion of these elements should impact the propensity for
strain-induced martensitic phase transformation.
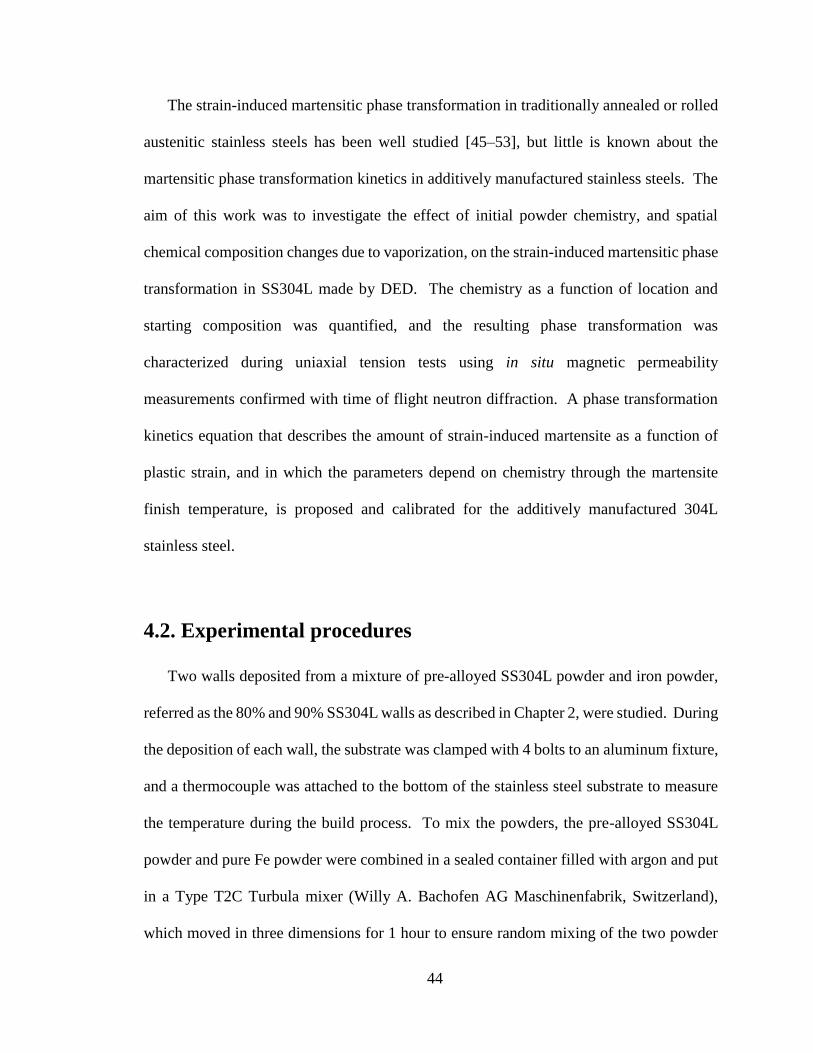
44
The strain-induced martensitic phase transformation in traditionally annealed or rolled
austenitic stainless steels has been well studied [45–53], but little is known about the
martensitic phase transformation kinetics in additively manufactured stainless steels. The
aim of this work was to investigate the effect of initial powder chemistry, and spatial
chemical composition changes due to vaporization, on the strain-induced martensitic phase
transformation in SS304L made by DED. The chemistry as a function of location and
starting composition was quantified, and the resulting phase transformation was
characterized during uniaxial tension tests using in situ magnetic permeability
measurements confirmed with time of flight neutron diffraction. A phase transformation
kinetics equation that describes the amount of strain-induced martensite as a function of
plastic strain, and in which the parameters depend on chemistry through the martensite
finish temperature, is proposed and calibrated for the additively manufactured 304L
stainless steel.
4.2. Experimental procedures
Two walls deposited from a mixture of pre-alloyed SS304L powder and iron powder,
referred as the 80% and 90% SS304L walls as described in Chapter 2, were studied. During
the deposition of each wall, the substrate was clamped with 4 bolts to an aluminum fixture,
and a thermocouple was attached to the bottom of the stainless steel substrate to measure
the temperature during the build process. To mix the powders, the pre-alloyed SS304L
powder and pure Fe powder were combined in a sealed container filled with argon and put
in a Type T2C Turbula mixer (Willy A. Bachofen AG Maschinenfabrik, Switzerland),
which moved in three dimensions for 1 hour to ensure random mixing of the two powder
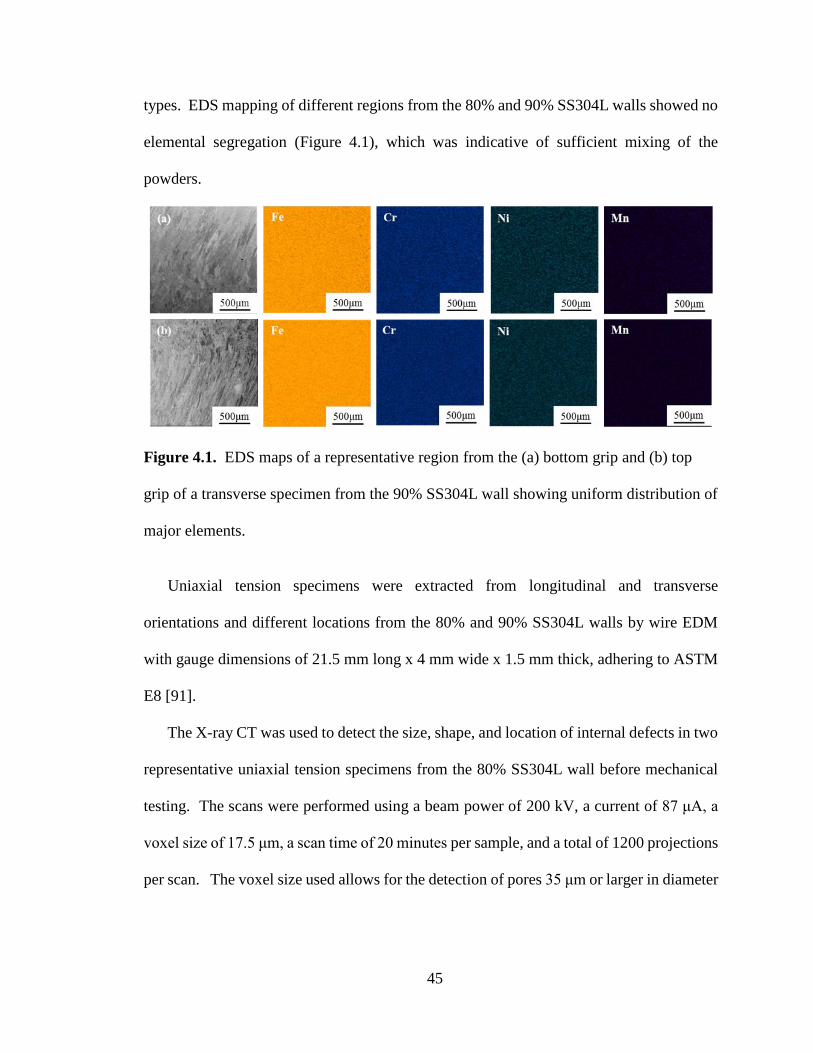
45
types. EDS mapping of different regions from the 80% and 90% SS304L walls showed no
elemental segregation (Figure 4.1), which was indicative of sufficient mixing of the
powders.
Figure 4.1. EDS maps of a representative region from the (a) bottom grip and (b) top
grip of a transverse specimen from the 90% SS304L wall showing uniform distribution of
major elements.
Uniaxial tension specimens were extracted from longitudinal and transverse
orientations and different locations from the 80% and 90% SS304L walls by wire EDM
with gauge dimensions of 21.5 mm long x 4 mm wide x 1.5 mm thick, adhering to ASTM
E8 [91].
The X-ray CT was used to detect the size, shape, and location of internal defects in two
representative uniaxial tension specimens from the 80% SS304L wall before mechanical
testing. The scans were performed using a beam power of 200 kV, a current of 87 μA, a
voxel size of 17.5 μm, a scan time of 20 minutes per sample, and a total of 1200 projections
per scan. The voxel size used allows for the detection of pores 35 μm or larger in diameter
46
[2,93]. The acquired scans were analyzed using VGStudio Max 2.2 visualization and
analysis software.
The amount of strain-induced austenite-to-martensite phase transformation in the
SS304L samples was determined through magnetic permeability measurements using a
feritescope (Fisher Feritescope FMP 30). Due to negative magnetostriction, or the Villari
effect, the magnetic permeability of ferromagnetic materials decreases when subjected to
tension as a result of rotation and re-orientation of magnetic domains in ferromagnetic
materials with applied force [96,128]. In order to reduce the impact of the Villari effect on
magnetic permeability measurements, specimens must be unloaded during the
measurements so that they are macroscopically stress-free. In this study, the specimens
were loaded to 7% engineering strain, unloaded to measure the magnetic permeability in
macroscopically stress-free samples, and then loaded to another increment of 7%
engineering strain before unloading and taking the next set of measurements.
Both monotonic and periodic loading/unloading uniaxial tensile tests were conducted
using an electromechanical testing frame (Instron 4202, 10 kN load cell) at a strain rate of
1.2x10⁻³ s-1. A subset size of 21 pixels with a step size of 5 pixels was used in DIC analysis,
resulting in a virtual strain gauge size of 56 pixels or 1.5 mm [101]. A 21 mm-long virtual
extensometer was used to calculate axial strain in the gauge region of each specimen. For
periodic loading/unloading tensile tests, a feritescope probe was placed perpendicular to
the gauge of each specimen, and kept in direct contact with the specimen throughout the
tensile test to record the evolution of martensite content. The martensite volume fraction,
c, can be estimated from the feritescope output, SFe, using the following equation:
47
c = k SFe (4.1)
where k is the conversion factor from vol.% ferrite to vol.% martensite.
The conversion factor, k, was determined by measuring the martensite content in
deformed regions of annealed 304L stainless steel after plastic deformation. Time of flight
neutron diffraction was performed at three points with different amounts of plastic
deformation using the VULCAN instrument at the Spallation Neutron Source at Oak Ridge
National Laboratory [129]. A detailed description of VULCAN can be found in [130,131].
The martensite volume fractions at the three points with different plastic strain levels were
determined from the diffraction patterns and compared with the feritescope readings to
compute the conversion factor, k. A schematic of the neutron diffraction experimental
setup is given in Figure 4.2. The two detector banks recorded diffraction patterns from
grains that had hkl-specific lattice planes normal to the length and thickness directions.
The peak positions and integrated peak intensities of the diffraction peaks from austenite
(γ, fcc) and martensite (α’, bcc) were computed using VDRIVE software in order to
calculate the phase fractions of austenite and martensite [132].
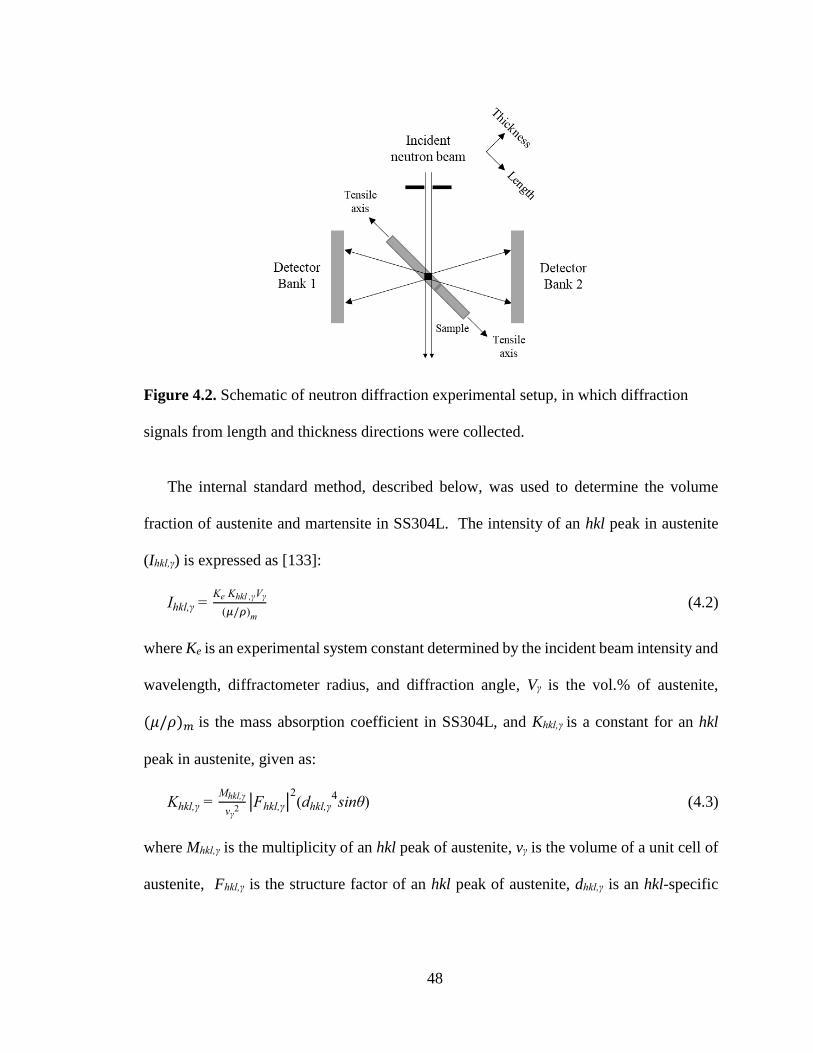
48
Figure 4.2. Schematic of neutron diffraction experimental setup, in which diffraction
signals from length and thickness directions were collected.
The internal standard method, described below, was used to determine the volume
fraction of austenite and martensite in SS304L. The intensity of an hkl peak in austenite
(Ihkl,γ) is expressed as [133]:
Ihkl,γ = Ke Khkl ,γVγ
(𝜇/𝜌)m
(4.2)
where Ke is an experimental system constant determined by the incident beam intensity and
wavelength, diffractometer radius, and diffraction angle, Vγ is the vol.% of austenite,
(𝜇/𝜌)𝑚 is the mass absorption coefficient in SS304L, and Khkl,γ is a constant for an hkl
peak in austenite, given as:
Khkl,γ = Mhkl,γ
vγ2
|Fhkl,γ|2(dhkl,γ
4sinθ) (4.3)
where Mhkl,γ is the multiplicity of an hkl peak of austenite, vγ is the volume of a unit cell of
austenite, Fhkl,γ is the structure factor of an hkl peak of austenite, dhkl,γ is an hkl-specific
49
lattice spacing in austenite, θ is the diffraction angle (45o here), and dhkl,γ4sinθ is the
Lorentz factor in neutron diffraction.
Therefore, we have:
Vγ
Vα' =
Ihkl,γKhkl,α'
Ihkl,α'Khkl,γ (4.4)
where Vα’ is the vol.% of martensite, Khkl,α’ is a constant for an hkl peak in martensite, Ihkl,α’
is an hkl peak intensity in martensite. The peak intensity and d-spacing are determined
from neutron diffraction data.
The uncertainty in martensite content measured by neutron diffraction (uVα’) is due to
the uncertainty in the peak intensity measurement. Using a propagation of uncertainty
approach, this uncertainty is given by:
uVα' = [(100Khkl,γδI
hkl,α')2 + (Khkl,γδI
hkl,α')2 + (Khkl,α'δIhkl,γ)
2]
12
Ihkl,α'Khkl,γ + Ihkl,γKhkl,α' (4.5)
where δIhkl, α’ is the uncertainty in the Ihkl,α’ measurement, and δIhkl,γ is the uncertainty in the
Ihkl,γ measurement.
The Vickers microhardness was measured along the height of the 80% and 90%
SS304L walls using a load of 200 g and a dwell time of 15 s (Leco MHT Series 200). In
each wall, the indentations were conducted at 10 heights, which started at 10 mm from the
top of the wall, and were spaced 7 mm apart down the wall. A minimum of five
measurements were taken at each height.
The microstructures of specimens were characterized using an optical microscope (OM;
Keyence VHX-2000) and electron backscatter diffraction (EBSD; Oxford Nordlys Max2).
The specimens were polished using 0.05 μm colloidal silica for observation of lack-of-
fusion pores in OM and identification of phases by EBSD.
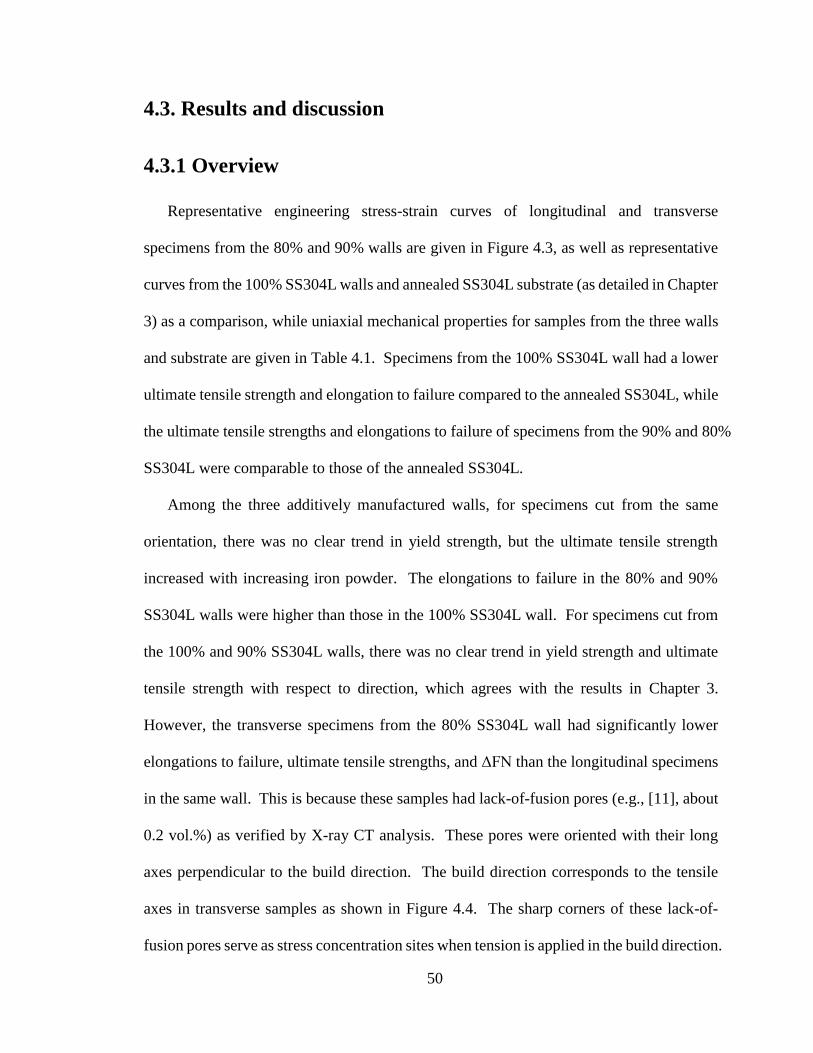
50
4.3. Results and discussion
4.3.1 Overview
Representative engineering stress-strain curves of longitudinal and transverse
specimens from the 80% and 90% walls are given in Figure 4.3, as well as representative
curves from the 100% SS304L walls and annealed SS304L substrate (as detailed in Chapter
3) as a comparison, while uniaxial mechanical properties for samples from the three walls
and substrate are given in Table 4.1. Specimens from the 100% SS304L wall had a lower
ultimate tensile strength and elongation to failure compared to the annealed SS304L, while
the ultimate tensile strengths and elongations to failure of specimens from the 90% and 80%
SS304L were comparable to those of the annealed SS304L.
Among the three additively manufactured walls, for specimens cut from the same
orientation, there was no clear trend in yield strength, but the ultimate tensile strength
increased with increasing iron powder. The elongations to failure in the 80% and 90%
SS304L walls were higher than those in the 100% SS304L wall. For specimens cut from
the 100% and 90% SS304L walls, there was no clear trend in yield strength and ultimate
tensile strength with respect to direction, which agrees with the results in Chapter 3.
However, the transverse specimens from the 80% SS304L wall had significantly lower
elongations to failure, ultimate tensile strengths, and ΔFN than the longitudinal specimens
in the same wall. This is because these samples had lack-of-fusion pores (e.g., [11], about
0.2 vol.%) as verified by X-ray CT analysis. These pores were oriented with their long
axes perpendicular to the build direction. The build direction corresponds to the tensile
axes in transverse samples as shown in Figure 4.4. The sharp corners of these lack-of-
fusion pores serve as stress concentration sites when tension is applied in the build direction.
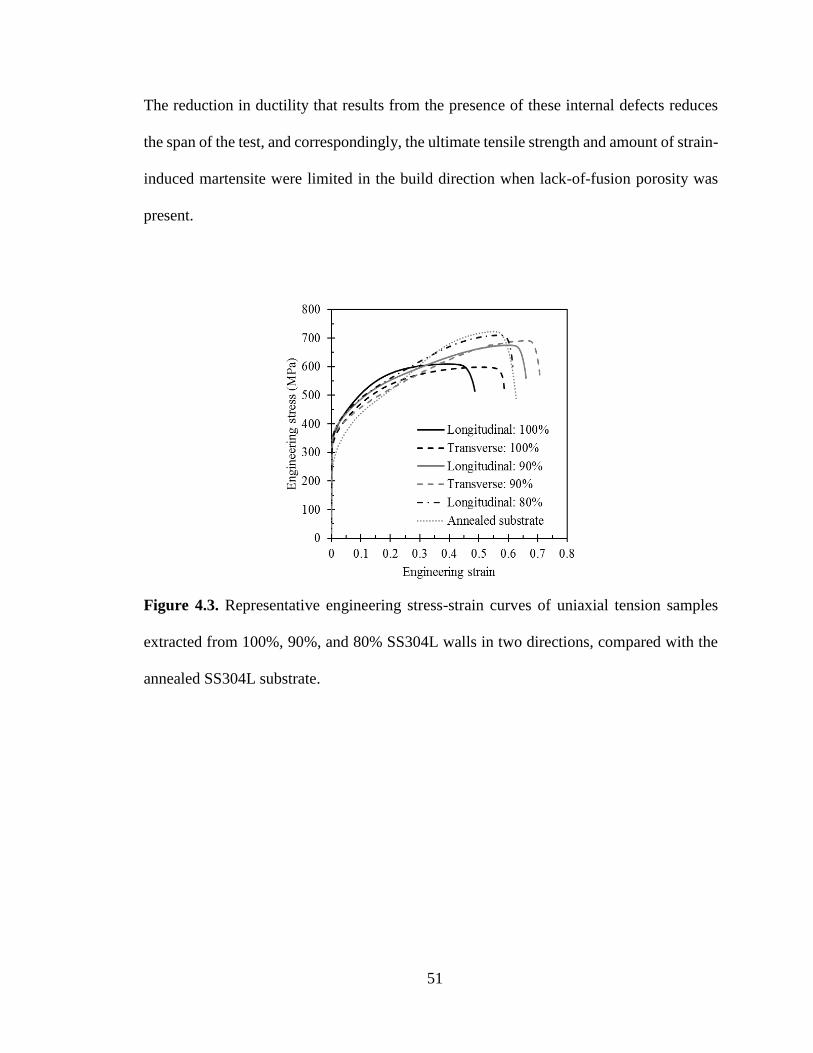
51
The reduction in ductility that results from the presence of these internal defects reduces
the span of the test, and correspondingly, the ultimate tensile strength and amount of strain-
induced martensite were limited in the build direction when lack-of-fusion porosity was
present.
Figure 4.3. Representative engineering stress-strain curves of uniaxial tension samples
extracted from 100%, 90%, and 80% SS304L walls in two directions, compared with the
annealed SS304L substrate.
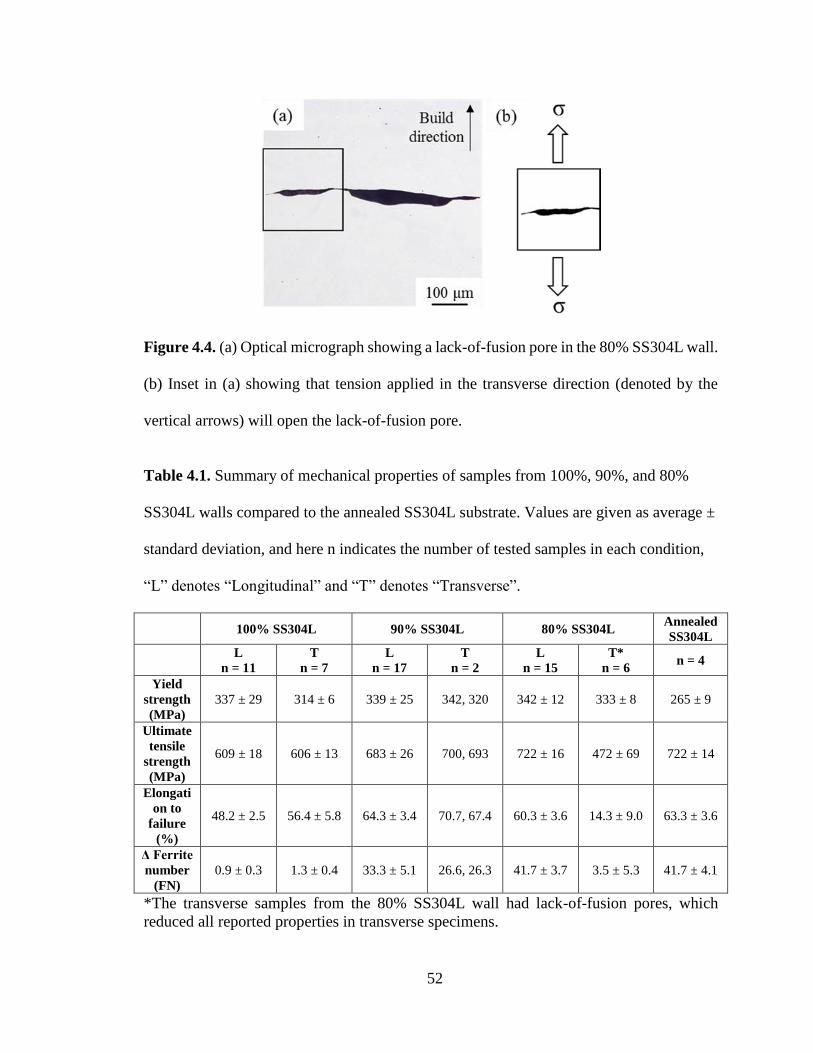
52
Figure 4.4. (a) Optical micrograph showing a lack-of-fusion pore in the 80% SS304L wall.
(b) Inset in (a) showing that tension applied in the transverse direction (denoted by the
vertical arrows) will open the lack-of-fusion pore.
Table 4.1. Summary of mechanical properties of samples from 100%, 90%, and 80%
SS304L walls compared to the annealed SS304L substrate. Values are given as average ±
standard deviation, and here n indicates the number of tested samples in each condition,
“L” denotes “Longitudinal” and “T” denotes “Transverse”.
100% SS304L 90% SS304L 80% SS304L Annealed
SS304L
L
n = 11
T
n = 7
L
n = 17
T
n = 2
L
n = 15
T*
n = 6 n = 4
Yield
strength
(MPa)
337 ± 29 314 ± 6 339 ± 25 342, 320 342 ± 12 333 ± 8 265 ± 9
Ultimate
tensile
strength
(MPa)
609 ± 18 606 ± 13 683 ± 26 700, 693 722 ± 16 472 ± 69 722 ± 14
Elongati
on to
failure
(%)
48.2 ± 2.5 56.4 ± 5.8 64.3 ± 3.4 70.7, 67.4 60.3 ± 3.6 14.3 ± 9.0 63.3 ± 3.6
Δ Ferrite
number
(FN)
0.9 ± 0.3 1.3 ± 0.4 33.3 ± 5.1 26.6, 26.3 41.7 ± 3.7 3.5 ± 5.3 41.7 ± 4.1
*The transverse samples from the 80% SS304L wall had lack-of-fusion pores, which
reduced all reported properties in transverse specimens.
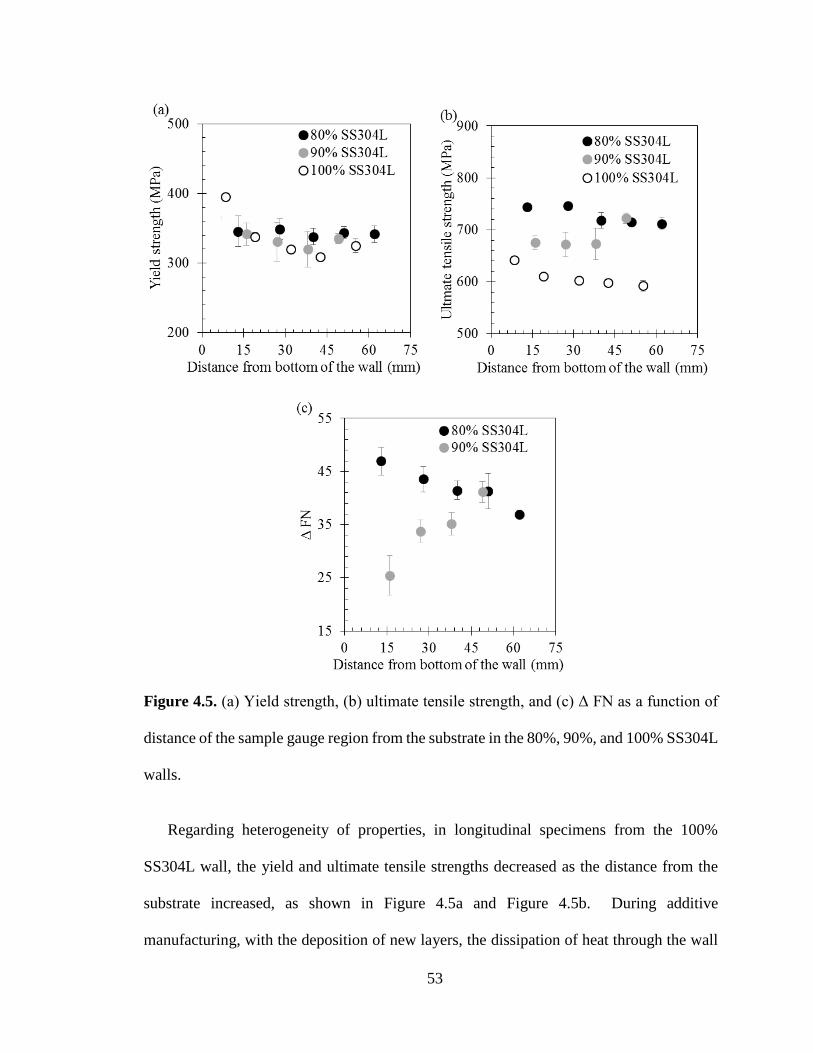
53
Figure 4.5. (a) Yield strength, (b) ultimate tensile strength, and (c) Δ FN as a function of
distance of the sample gauge region from the substrate in the 80%, 90%, and 100% SS304L
walls.
Regarding heterogeneity of properties, in longitudinal specimens from the 100%
SS304L wall, the yield and ultimate tensile strengths decreased as the distance from the
substrate increased, as shown in Figure 4.5a and Figure 4.5b. During additive
manufacturing, with the deposition of new layers, the dissipation of heat through the wall
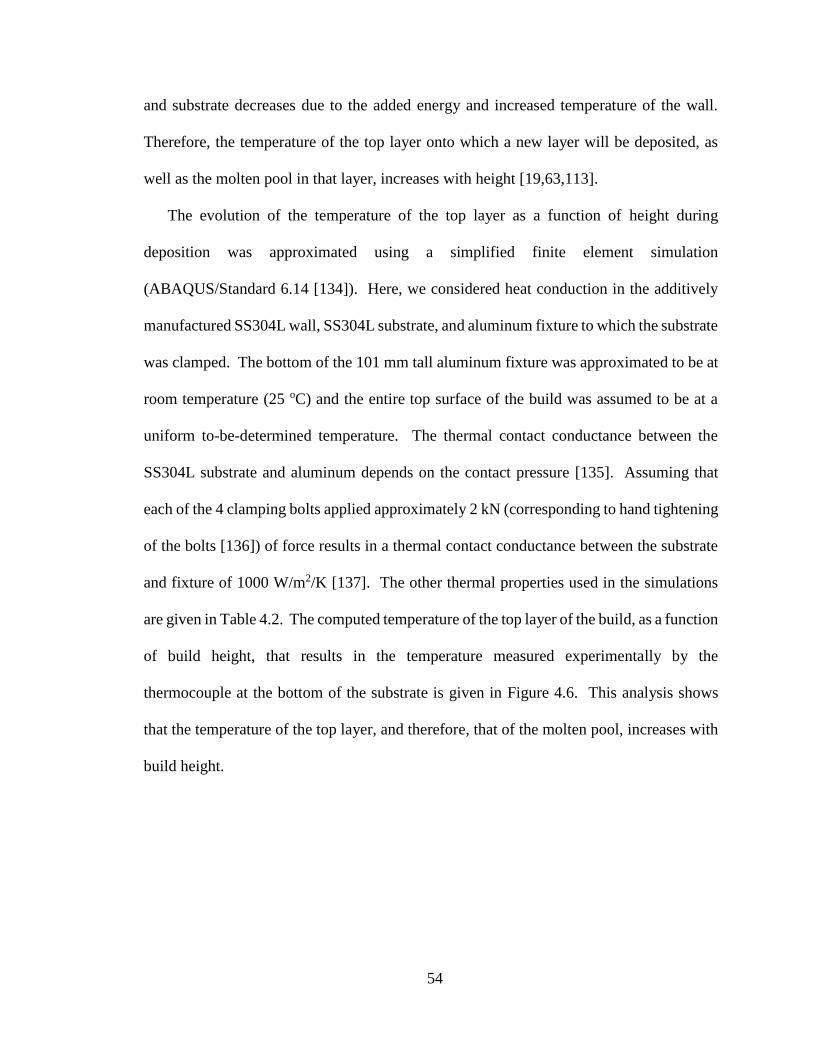
54
and substrate decreases due to the added energy and increased temperature of the wall.
Therefore, the temperature of the top layer onto which a new layer will be deposited, as
well as the molten pool in that layer, increases with height [19,63,113].
The evolution of the temperature of the top layer as a function of height during
deposition was approximated using a simplified finite element simulation
(ABAQUS/Standard 6.14 [134]). Here, we considered heat conduction in the additively
manufactured SS304L wall, SS304L substrate, and aluminum fixture to which the substrate
was clamped. The bottom of the 101 mm tall aluminum fixture was approximated to be at
room temperature (25 oC) and the entire top surface of the build was assumed to be at a
uniform to-be-determined temperature. The thermal contact conductance between the
SS304L substrate and aluminum depends on the contact pressure [135]. Assuming that
each of the 4 clamping bolts applied approximately 2 kN (corresponding to hand tightening
of the bolts [136]) of force results in a thermal contact conductance between the substrate
and fixture of 1000 W/m2/K [137]. The other thermal properties used in the simulations
are given in Table 4.2. The computed temperature of the top layer of the build, as a function
of build height, that results in the temperature measured experimentally by the
thermocouple at the bottom of the substrate is given in Figure 4.6. This analysis shows
that the temperature of the top layer, and therefore, that of the molten pool, increases with
build height.
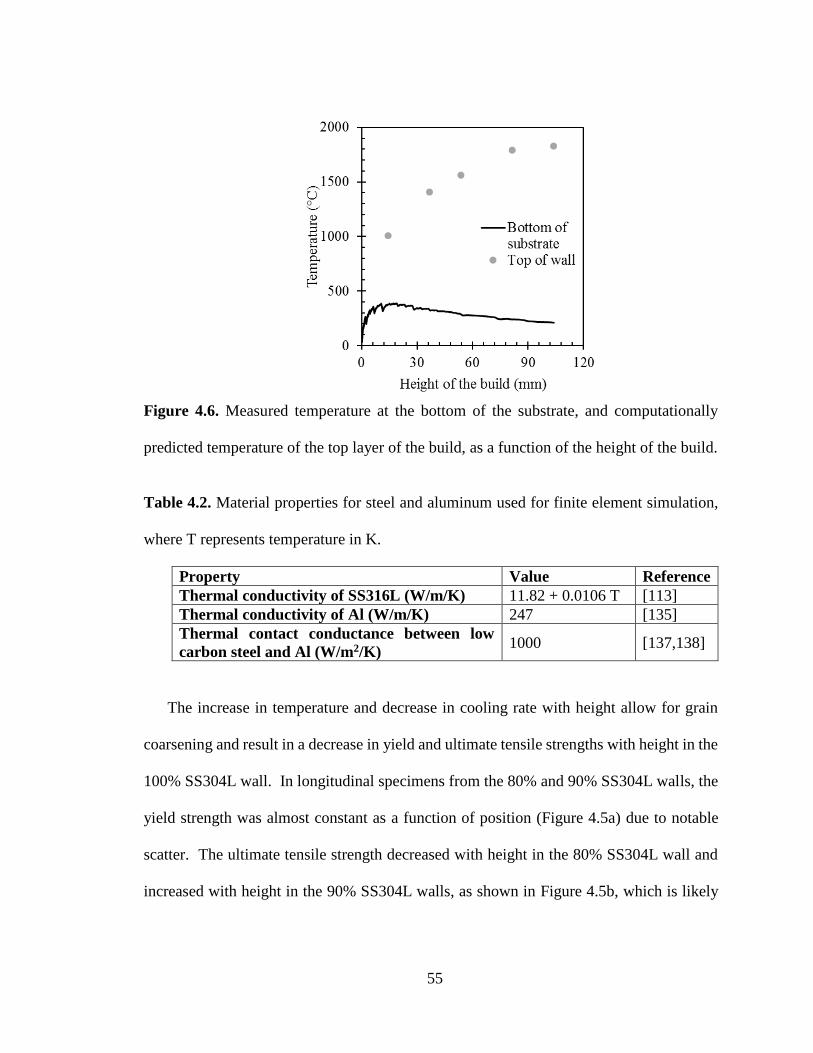
55
Figure 4.6. Measured temperature at the bottom of the substrate, and computationally
predicted temperature of the top layer of the build, as a function of the height of the build.
Table 4.2. Material properties for steel and aluminum used for finite element simulation,
where T represents temperature in K.
Property Value Reference
Thermal conductivity of SS316L (W/m/K) 11.82 + 0.0106 T [113]
Thermal conductivity of Al (W/m/K) 247 [135]
Thermal contact conductance between low
carbon steel and Al (W/m2/K) 1000 [137,138]
The increase in temperature and decrease in cooling rate with height allow for grain
coarsening and result in a decrease in yield and ultimate tensile strengths with height in the
100% SS304L wall. In longitudinal specimens from the 80% and 90% SS304L walls, the
yield strength was almost constant as a function of position (Figure 4.5a) due to notable
scatter. The ultimate tensile strength decreased with height in the 80% SS304L wall and
increased with height in the 90% SS304L walls, as shown in Figure 4.5b, which is likely
56
due to the effect of local chemistry on martensitic transformation as will be discussed in
Sections 4.3.2 and 4.3.3.
The microhardness was measured as a function of height in the 80% and 90% SS304L
walls. In both walls, there was no clear trend in hardness with respect to location. The
average hardness in the 80% SS304L wall was 198 ± 14 HV, which is comparable to the
average hardness in the 90% SS304L wall of 203 ± 13 HV.
4.3.2. Effect of powder chemistry on microstructure and
mechanical properties
The higher ultimate tensile strength and ductility of specimens from the 80% and 90%
SS304L walls compared to the 100% wall resulted from the microstructural phase
transformation from austenite to martensite during deformation, which was verified by
magnetic permeability measurements. The increase in FN from the initial measurements
to the final measurement of FN in the plastically deformed gauge section of each sample
is given in Table 4.1. There was a significant increase in FN in specimens from the 80%
and 90% SS304L walls and the annealed SS304L substrate, indicating the presence of
strain-induced martensitic phase transformation. The increase in FN after deforming
specimens from the 100% SS304L wall was on the same order of the feritescope resolution
(about 1-2 FN), indicating that there was no detectable phase transformation in specimens
from this wall.
The martensitic phase transformation in the 80% and 90% SS304L walls was also
confirmed by EBSD analysis. Both ferrite and strain-induced martensite have body-
centered cubic crystal structures, while austenite is face-centered cubic. Therefore, during
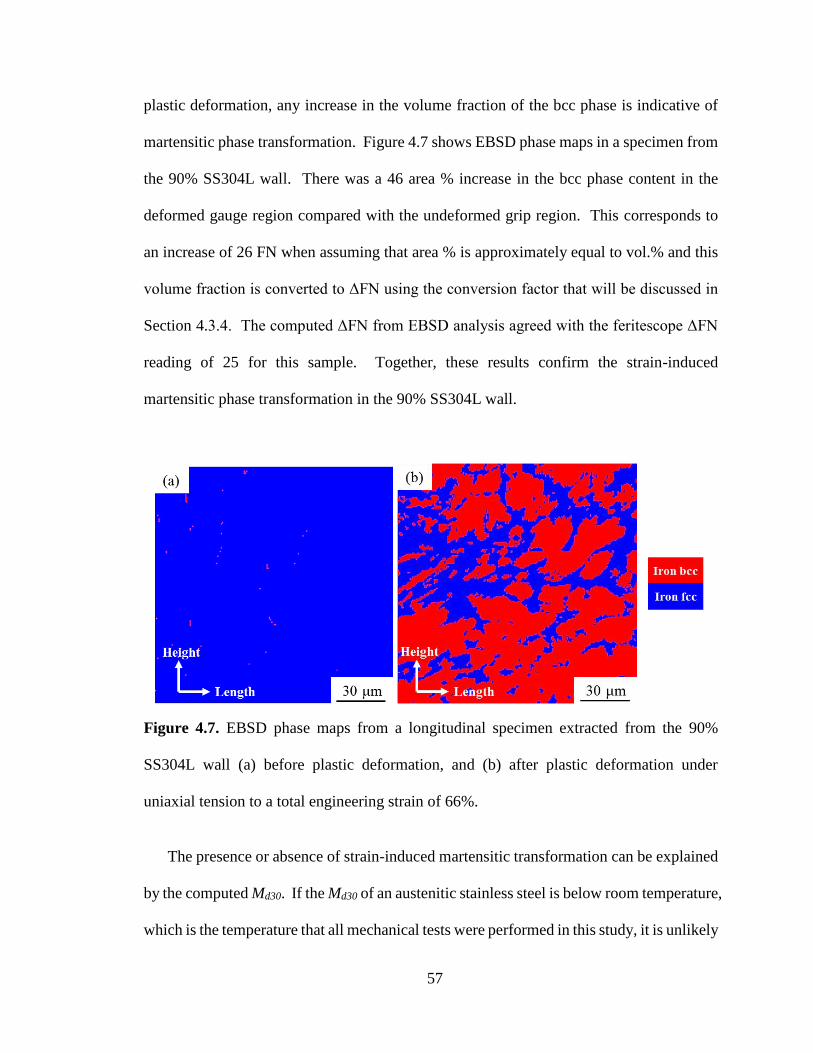
57
plastic deformation, any increase in the volume fraction of the bcc phase is indicative of
martensitic phase transformation. Figure 4.7 shows EBSD phase maps in a specimen from
the 90% SS304L wall. There was a 46 area % increase in the bcc phase content in the
deformed gauge region compared with the undeformed grip region. This corresponds to
an increase of 26 FN when assuming that area % is approximately equal to vol.% and this
volume fraction is converted to ΔFN using the conversion factor that will be discussed in
Section 4.3.4. The computed ΔFN from EBSD analysis agreed with the feritescope ΔFN
reading of 25 for this sample. Together, these results confirm the strain-induced
martensitic phase transformation in the 90% SS304L wall.
Figure 4.7. EBSD phase maps from a longitudinal specimen extracted from the 90%
SS304L wall (a) before plastic deformation, and (b) after plastic deformation under
uniaxial tension to a total engineering strain of 66%.
The presence or absence of strain-induced martensitic transformation can be explained
by the computed Md30. If the Md30 of an austenitic stainless steel is below room temperature,
which is the temperature that all mechanical tests were performed in this study, it is unlikely
58
that strain-induced phase transformation will occur. However, if the Md30 is above room
temperature, it is possible that the strain-induced phase transformation will occur. Based
on the chemical analysis results in Table 2.1 and Eqn. (1.1), the Md30 temperatures
computed of specimens from different locations from the 80% and 90% SS304L walls were
above 25 oC. Thus, strain-induced martensitic phase transformation was anticipated in
those walls at room temperature. The Md30 temperature computed for the 100% SS304L
wall was -3.6 oC, indicating that strain-induced phase transformation was unlikely to occur
in the 100% SS304L material. Mixing the pre-alloyed SS304L powder with iron powder
reduced the relative weight fraction of elements that increase the SFE of austenite (silicon,
manganese, chromium, and nickel), which resulted in higher Md30 temperatures in the 80%
and 90% SS304L walls compared to the 100% SS304L wall. Therefore, the austenite was
metastable and transformed to martensite with plastic deformation in the 80% and 90%
SS304L walls. Since martensite has a higher flow stress than austenite [139], this evolution
of microstructure, with increasing martensite and decreasing austenite with plastic strain
in the 80% and 90% SS304L walls increased the strain hardening rate, therefore stabilizing
the neck and increasing elongation to failure, and also increasing the ultimate tensile
strength over the 100% SS304L wall as shown in Table 4.1.
The propensity for strain-induced martensitic transformation can also be estimated by
computing the stacking fault energy (SFE) of the material. Decreasing SFE in austenitic
stainless steels results in wider stacking faults, which are nucleation sites for hcp ε
martensite, and which transform to α’ martensite with plastic deformation. It is reported
that austenite has the potential to transform to strain-induced martensite when the SFE is
59
less than approximately 20 mJ/m2 [140,141]. Olson and Cohen proposed a thermodynamic
model to calculate the SFE for austenitic stainless steels, which is given as [142]:
γSFE
= 2ρ∆Gγ→ε + 2𝜎 (4.6)
where γSFE
is the stacking fault energy, σ is the surface energy, ∆Gγ→ε is the Gibbs energy
difference between γ austenite and ε martensite, and ρ is the molar surface density of {111}
planes of austenite, defined as:
ρ = 4
√3a2NA (4.7)
where a is the lattice parameter of austenite, and NA is Avogadro’s constant. The values
of the constants used in the SFE calculation here are given in Table 4.3.
The change in Gibbs energy for the phase transformation from γ-austenite to ε-
martensite, ∆Gγ→ε, is expressed as [141,143,144]:
∆Gγ→ε = ∑ xi∆Gi
γ→ε + ∑ xixjΩij
γ→εij + ∆Gmg
γ→εi + ∆Gint
γ→ε (4.8)
where xi, j is the molar fraction of pure elements, Ωijγ→ε
is the excess free energy, ∆Giγ→ε
is
the chemical contributions of each element to the change in Gibbs energy, ∆Gmgγ→ε
is the
magnetic contribution, and ∆Gintγ→ε
is the contribution of nitrogen segregation
The parameters ∆Giγ→ε
, Ωijγ→ε
, ∆Gmgγ→ε
, and ∆Gintγ→ε
in Eqn. (4.8) are given in
[141,143,144] and the molar fraction of each element is calculated based on Table 2.1. The
SFE of the 100%, 90%, and 80% SS304L walls at room temperature can be calculated
using Eqns. (4.6) - (4.8), with the resulting values given in Table 4.3. A decrease in SFE
results in a decrease in austenite stability and an increase in the potential for strain-induced
martensitic phase transformation. As shown in Table 4.3, the SFE from high to low, or the
potential for strain-induced martensitic phase transformation from low to high in the
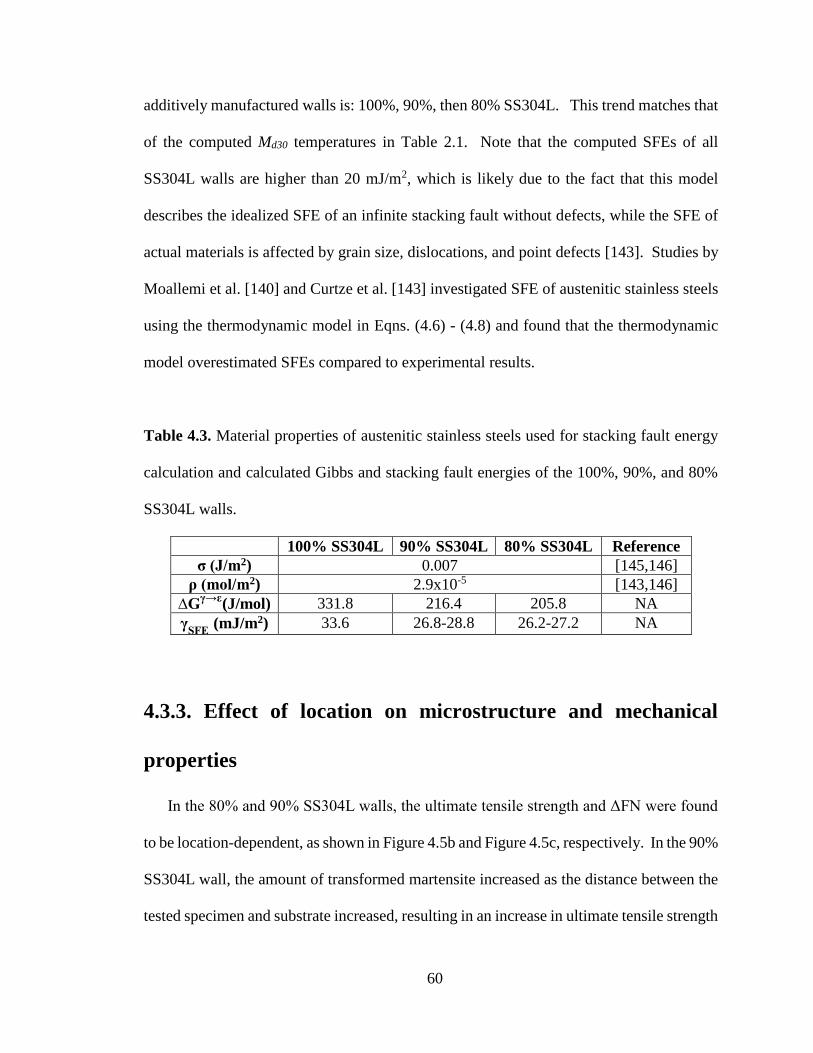
60
additively manufactured walls is: 100%, 90%, then 80% SS304L. This trend matches that
of the computed Md30 temperatures in Table 2.1. Note that the computed SFEs of all
SS304L walls are higher than 20 mJ/m2, which is likely due to the fact that this model
describes the idealized SFE of an infinite stacking fault without defects, while the SFE of
actual materials is affected by grain size, dislocations, and point defects [143]. Studies by
Moallemi et al. [140] and Curtze et al. [143] investigated SFE of austenitic stainless steels
using the thermodynamic model in Eqns. (4.6) - (4.8) and found that the thermodynamic
model overestimated SFEs compared to experimental results.
Table 4.3. Material properties of austenitic stainless steels used for stacking fault energy
calculation and calculated Gibbs and stacking fault energies of the 100%, 90%, and 80%
SS304L walls.
100% SS304L 90% SS304L 80% SS304L Reference
σ (J/m2) 0.007 [145,146]
ρ (mol/m2) 2.9x10⁻⁵ [143,146]
∆Gγ→ε
(J/mol) 331.8 216.4 205.8 NA
γSFE
(mJ/m2) 33.6 26.8-28.8 26.2-27.2 NA
4.3.3. Effect of location on microstructure and mechanical
properties
In the 80% and 90% SS304L walls, the ultimate tensile strength and ΔFN were found
to be location-dependent, as shown in Figure 4.5b and Figure 4.5c, respectively. In the 90%
SS304L wall, the amount of transformed martensite increased as the distance between the
tested specimen and substrate increased, resulting in an increase in ultimate tensile strength
61
with height. The location-dependent martensitic phase transformation and mechanical
properties are due to elemental composition heterogeneities during DED component
fabrication. Table 2.1 shows the elemental composition of specimens from top and bottom
of the 90% SS304L wall, in which the weight fraction of silicon, manganese, chromium,
and nickel decreased as the sample height increased. In AM, the temperature of the molten
pool increases with the distance from the substrate as heat accumulates with the addition
of new layers [19,41,63,113]. Since volatile elements vaporize with increased temperature,
these elements are depleted with increasing height. In SS304, the most volatile elements
are manganese, chromium, and nickel [127]; thus, these elements were found to be depleted
at the top compared to the bottom of the 90% SS304L wall, as shown in Table 2.1. As
manganese, chromium, and nickel increase the SFE of austenite, the decrease in weight
fraction of these elements reduces austenite stability and results in an increase in the
volume fraction of transformed martensite and ultimate tensile strength with height.
In the 80% SS304L wall, the elemental composition also varied with height. There
was a slight increase in weight fraction of silicon, manganese, chromium, and nickel from
the bottom to the top of the wall, leading to a small decrease in transformed martensite
content and ultimate tensile strength as the height increases (Figure 4.5c and Figure 4.5b).
This trend, which is opposite of that seen in the 90% SS304L wall, is possibly due to
insufficient melting of iron and SS304L powder during deposition. The trend of chemistry
with height due to insufficient melting is beyond the scope of the present study, which aims
to connect the chemistry to phase transformation kinetics and mechanical properties.
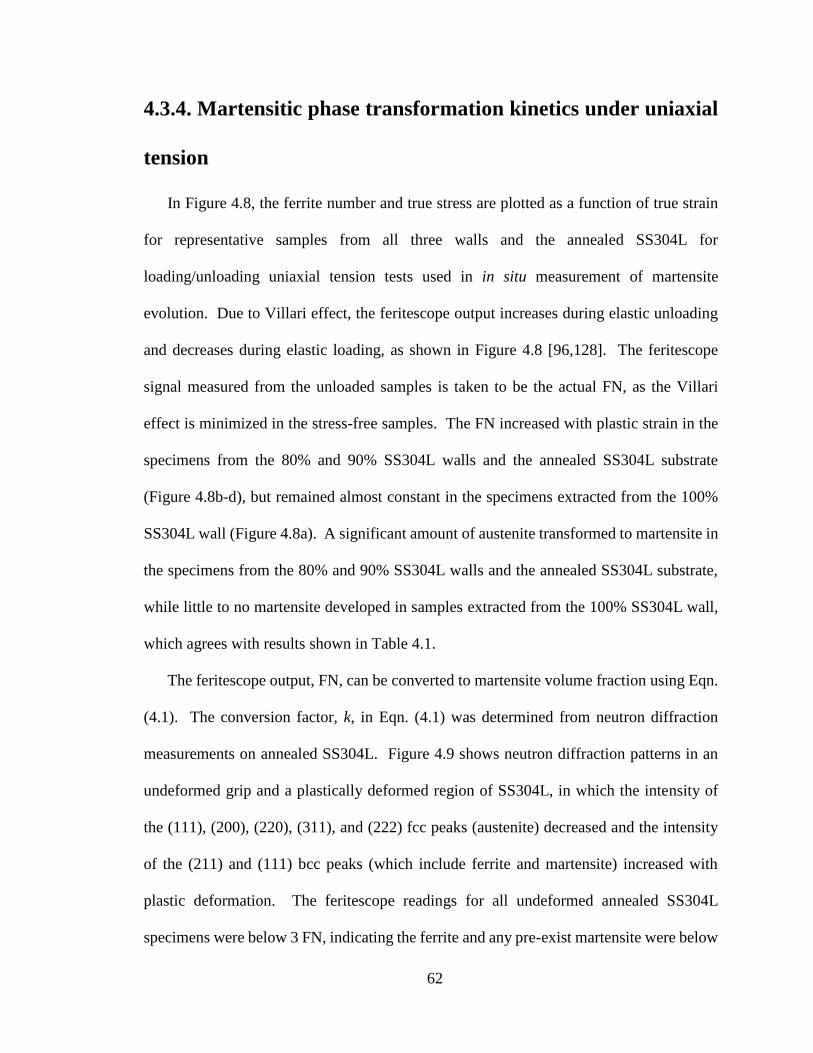
62
4.3.4. Martensitic phase transformation kinetics under uniaxial
tension
In Figure 4.8, the ferrite number and true stress are plotted as a function of true strain
for representative samples from all three walls and the annealed SS304L for
loading/unloading uniaxial tension tests used in in situ measurement of martensite
evolution. Due to Villari effect, the feritescope output increases during elastic unloading
and decreases during elastic loading, as shown in Figure 4.8 [96,128]. The feritescope
signal measured from the unloaded samples is taken to be the actual FN, as the Villari
effect is minimized in the stress-free samples. The FN increased with plastic strain in the
specimens from the 80% and 90% SS304L walls and the annealed SS304L substrate
(Figure 4.8b-d), but remained almost constant in the specimens extracted from the 100%
SS304L wall (Figure 4.8a). A significant amount of austenite transformed to martensite in
the specimens from the 80% and 90% SS304L walls and the annealed SS304L substrate,
while little to no martensite developed in samples extracted from the 100% SS304L wall,
which agrees with results shown in Table 4.1.
The feritescope output, FN, can be converted to martensite volume fraction using Eqn.
(4.1). The conversion factor, k, in Eqn. (4.1) was determined from neutron diffraction
measurements on annealed SS304L. Figure 4.9 shows neutron diffraction patterns in an
undeformed grip and a plastically deformed region of SS304L, in which the intensity of
the (111), (200), (220), (311), and (222) fcc peaks (austenite) decreased and the intensity
of the (211) and (111) bcc peaks (which include ferrite and martensite) increased with
plastic deformation. The feritescope readings for all undeformed annealed SS304L
specimens were below 3 FN, indicating the ferrite and any pre-exist martensite were below
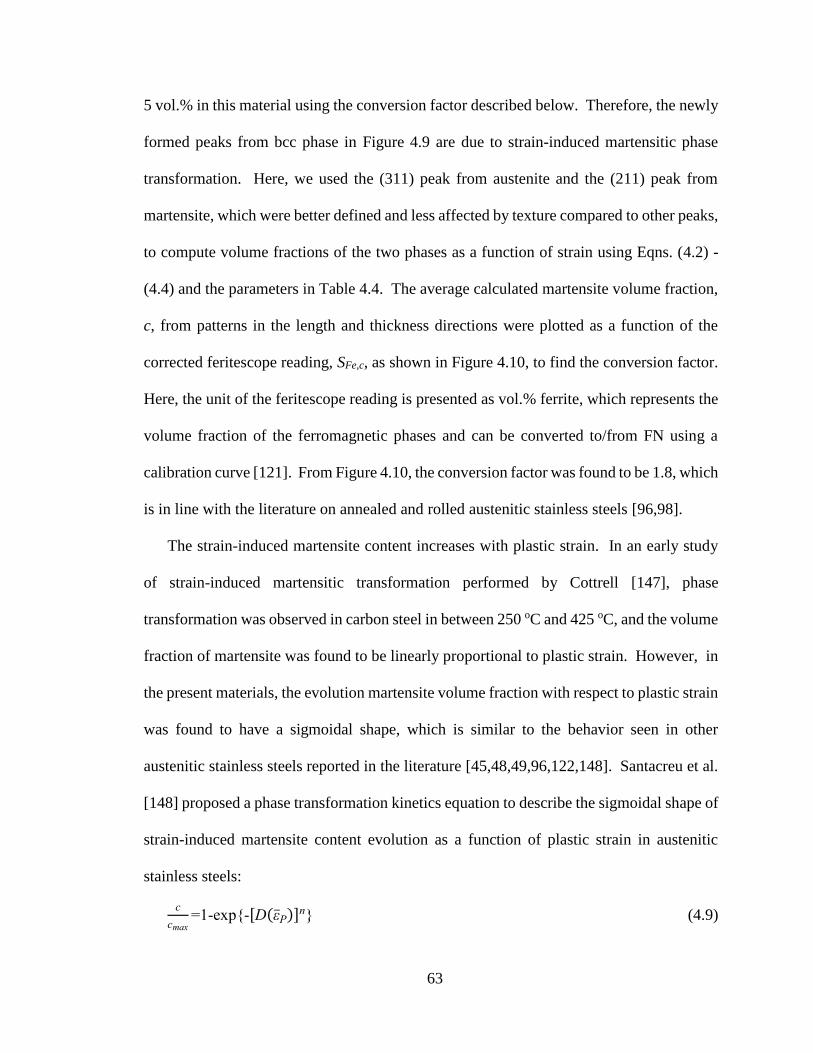
63
5 vol.% in this material using the conversion factor described below. Therefore, the newly
formed peaks from bcc phase in Figure 4.9 are due to strain-induced martensitic phase
transformation. Here, we used the (311) peak from austenite and the (211) peak from
martensite, which were better defined and less affected by texture compared to other peaks,
to compute volume fractions of the two phases as a function of strain using Eqns. (4.2) -
(4.4) and the parameters in Table 4.4. The average calculated martensite volume fraction,
c, from patterns in the length and thickness directions were plotted as a function of the
corrected feritescope reading, SFe,c, as shown in Figure 4.10, to find the conversion factor.
Here, the unit of the feritescope reading is presented as vol.% ferrite, which represents the
volume fraction of the ferromagnetic phases and can be converted to/from FN using a
calibration curve [121]. From Figure 4.10, the conversion factor was found to be 1.8, which
is in line with the literature on annealed and rolled austenitic stainless steels [96,98].
The strain-induced martensite content increases with plastic strain. In an early study
of strain-induced martensitic transformation performed by Cottrell [147], phase
transformation was observed in carbon steel in between 250 oC and 425 oC, and the volume
fraction of martensite was found to be linearly proportional to plastic strain. However, in
the present materials, the evolution martensite volume fraction with respect to plastic strain
was found to have a sigmoidal shape, which is similar to the behavior seen in other
austenitic stainless steels reported in the literature [45,48,49,96,122,148]. Santacreu et al.
[148] proposed a phase transformation kinetics equation to describe the sigmoidal shape of
strain-induced martensite content evolution as a function of plastic strain in austenitic
stainless steels:
c
cmax=1-exp{-[D(εP)]n} (4.9)
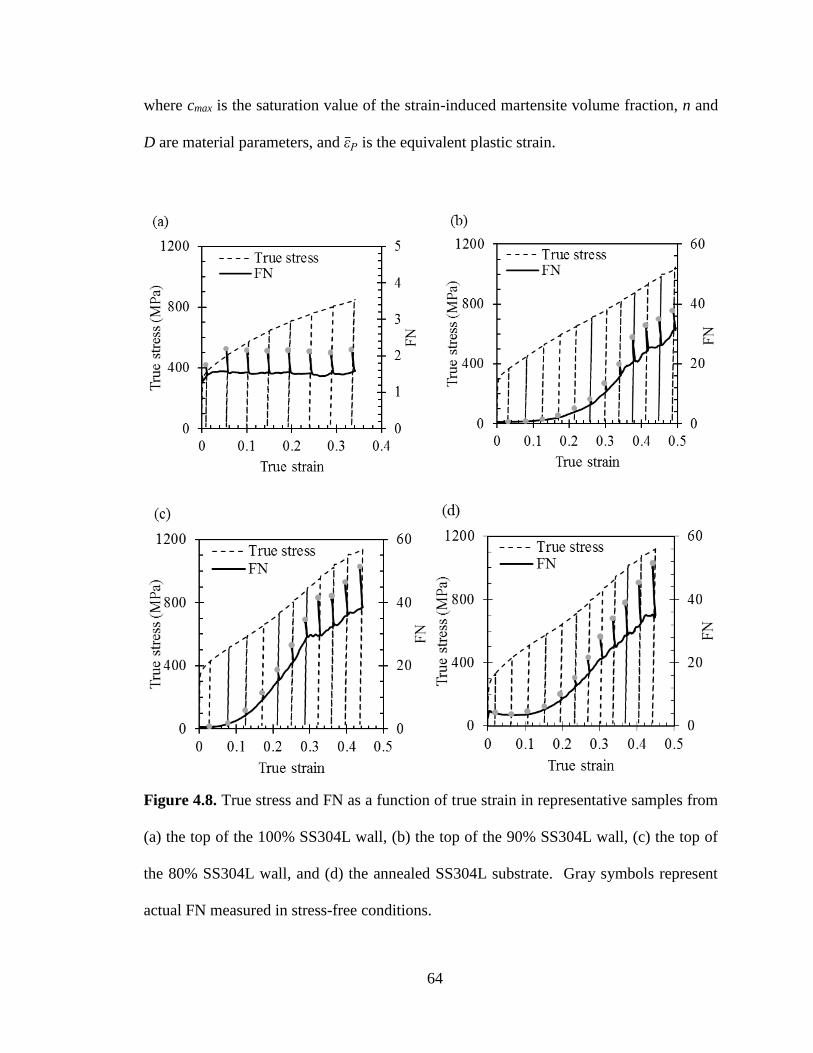
64
where cmax is the saturation value of the strain-induced martensite volume fraction, n and
D are material parameters, and εP is the equivalent plastic strain.
Figure 4.8. True stress and FN as a function of true strain in representative samples from
(a) the top of the 100% SS304L wall, (b) the top of the 90% SS304L wall, (c) the top of
the 80% SS304L wall, and (d) the annealed SS304L substrate. Gray symbols represent
actual FN measured in stress-free conditions.
65
Figure 4.9. Neutron diffraction patterns for a specimen from the annealed SS304L
substrate in the (a) length direction (Bank 1), and (b) thickness direction (Bank 2), showing
the contrast between signals in undeformed and deformed (66% engineering strain under
uniaxial tension) regions.
Figure 4.10. Martensite content, c, measured by neutron diffraction as a function of the
corrected feritescope reading, SFe,c, showing a conversion factor, k, from volume fraction
of ferrite to volume fraction of martensite of 1.8.
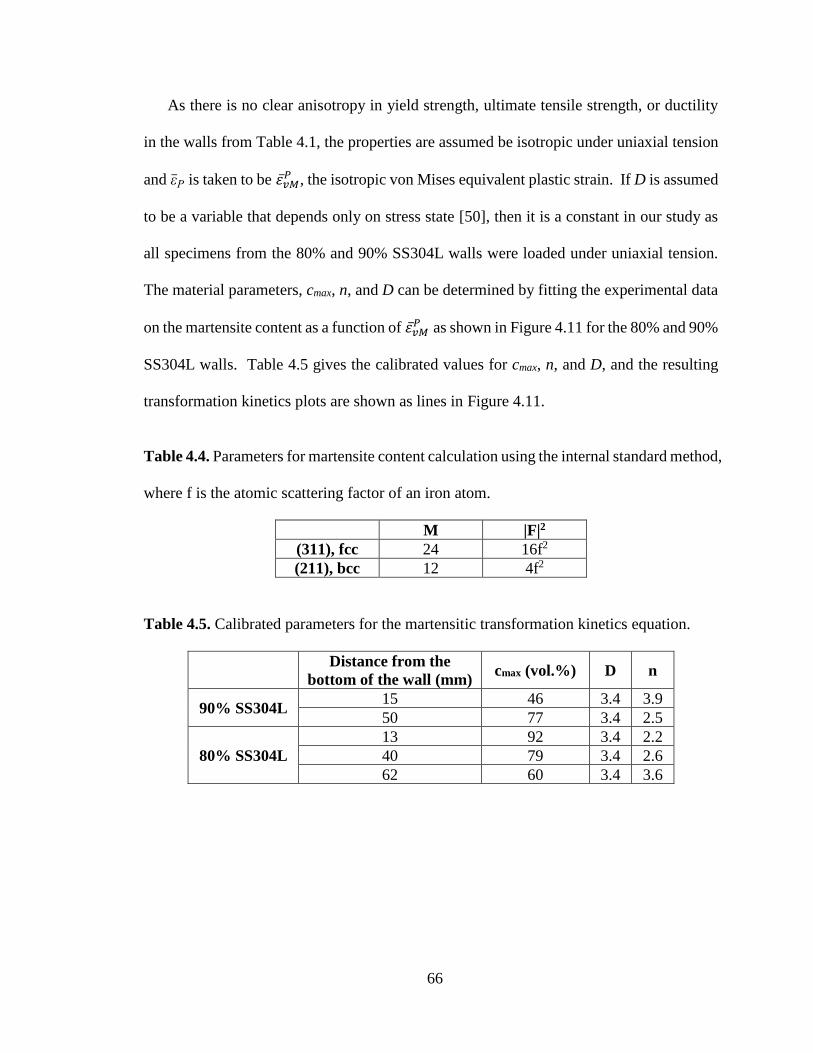
66
As there is no clear anisotropy in yield strength, ultimate tensile strength, or ductility
in the walls from Table 4.1, the properties are assumed be isotropic under uniaxial tension
and εP is taken to be 𝜀��𝑀𝑃 , the isotropic von Mises equivalent plastic strain. If D is assumed
to be a variable that depends only on stress state [50], then it is a constant in our study as
all specimens from the 80% and 90% SS304L walls were loaded under uniaxial tension.
The material parameters, cmax, n, and D can be determined by fitting the experimental data
on the martensite content as a function of 𝜀��𝑀𝑃 as shown in Figure 4.11 for the 80% and 90%
SS304L walls. Table 4.5 gives the calibrated values for cmax, n, and D, and the resulting
transformation kinetics plots are shown as lines in Figure 4.11.
Table 4.4. Parameters for martensite content calculation using the internal standard method,
where f is the atomic scattering factor of an iron atom.
M |F|2
(311), fcc 24 16f2
(211), bcc 12 4f2
Table 4.5. Calibrated parameters for the martensitic transformation kinetics equation.
Distance from the
bottom of the wall (mm) cmax (vol.%) D n
90% SS304L 15 46 3.4 3.9
50 77 3.4 2.5
80% SS304L
13 92 3.4 2.2
40 79 3.4 2.6
62 60 3.4 3.6
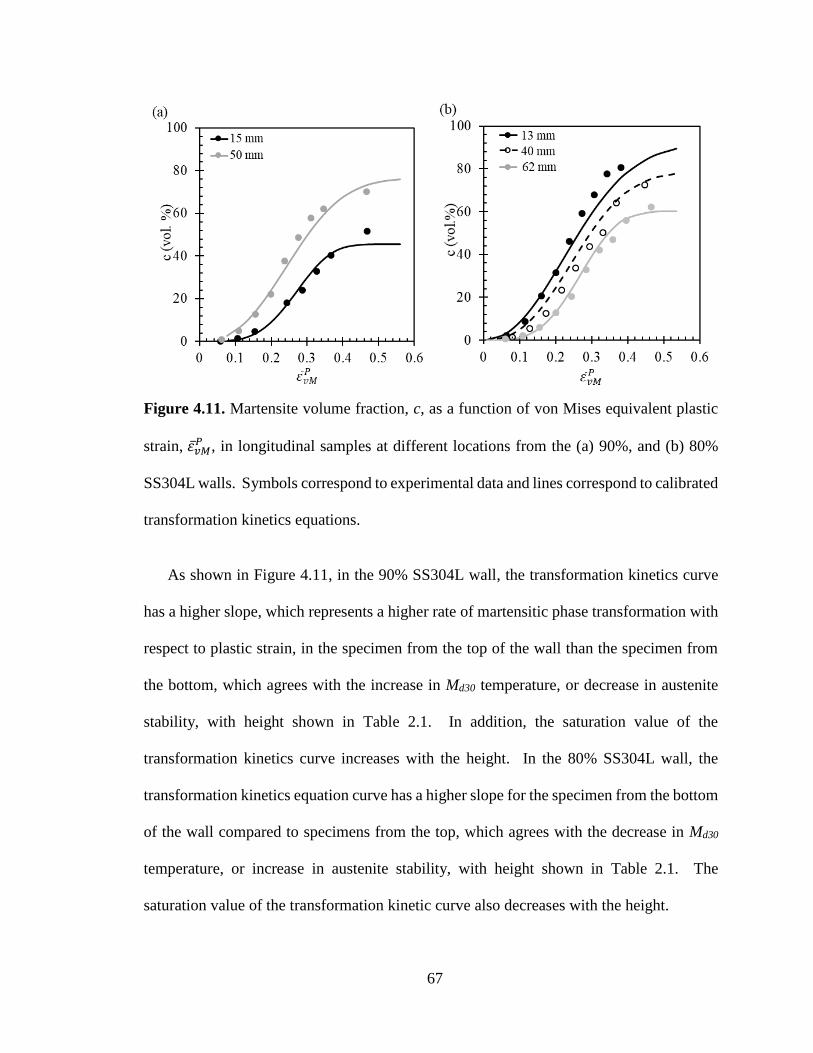
67
Figure 4.11. Martensite volume fraction, c, as a function of von Mises equivalent plastic
strain, 𝜀��𝑀𝑃 , in longitudinal samples at different locations from the (a) 90%, and (b) 80%
SS304L walls. Symbols correspond to experimental data and lines correspond to calibrated
transformation kinetics equations.
As shown in Figure 4.11, in the 90% SS304L wall, the transformation kinetics curve
has a higher slope, which represents a higher rate of martensitic phase transformation with
respect to plastic strain, in the specimen from the top of the wall than the specimen from
the bottom, which agrees with the increase in Md30 temperature, or decrease in austenite
stability, with height shown in Table 2.1. In addition, the saturation value of the
transformation kinetics curve increases with the height. In the 80% SS304L wall, the
transformation kinetics equation curve has a higher slope for the specimen from the bottom
of the wall compared to specimens from the top, which agrees with the decrease in Md30
temperature, or increase in austenite stability, with height shown in Table 2.1. The
saturation value of the transformation kinetic curve also decreases with the height.
68
The data were further analyzed to link the chemistry, in terms of the Md30 temperature,
to the transformation kinetics equation. The parameter n is related to the rate of increase
in martensite for a given increment in plastic strain; namely, a small n is indicative of a
high rate of phase transformation with plastic strain (Eqn. 4.9). The parameter cmax
describes the saturation value of martensite in the given material, or how much martensite
can be formed with an unlimited amount of plastic strain. Figure 4.12 shows n and cmax
versus Md30, using data in Table 2.1 and Table 4.5 from longitudinal samples at different
locations in the 80% and 90% SS304L walls. There appears to be linear relationships
between n and Md30 temperature, and cmax and Md30 temperature. Therefore, we can
describe the parameters for the austenite-to-martensite phase transformation kinetics in
additively manufactured stainless steel as a function of chemistry using the below two
empirical equations:
n = - 0.12Md30 + 7.2 (4.10)
cmax = 3.2Md30 - 38.8 (4.11)
where Md30 is given in oC.
These relationships show that n decreases and cmax increases with increasing Md30
temperature, or decreasing austenite stability. The decrease in n with increasing Md30 is
indicative of a higher rate of phase transformation with decreasing austenite stability,
meaning for the same plastic strain, more austenite will transform to martensite for a
material with a lower austenite stability. The increase in cmax with increase in Md30 indicates
that the lower the austenite stability, the higher the potential for phase transformation. Both
of these trends are physically consistent with the fact that more austenite transforms to
martensite when the austenite is metastable versus stable.
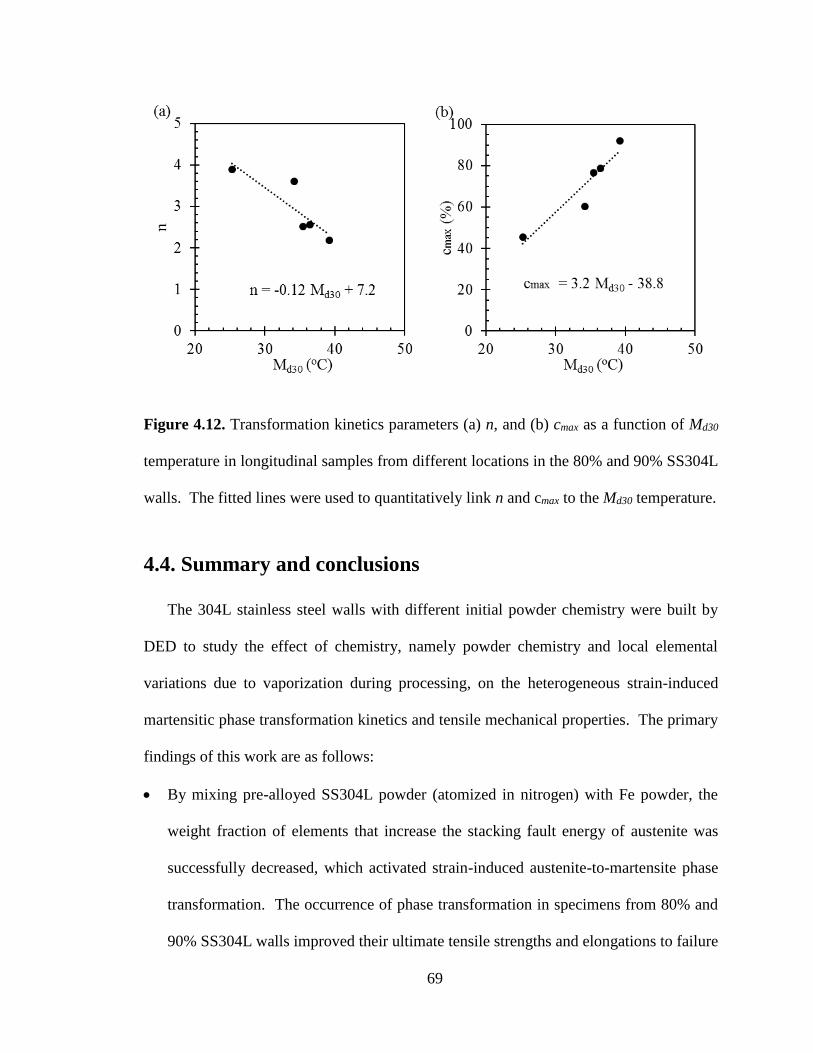
69
Figure 4.12. Transformation kinetics parameters (a) n, and (b) cmax as a function of Md30
temperature in longitudinal samples from different locations in the 80% and 90% SS304L
walls. The fitted lines were used to quantitatively link n and cmax to the Md30 temperature.
4.4. Summary and conclusions
The 304L stainless steel walls with different initial powder chemistry were built by
DED to study the effect of chemistry, namely powder chemistry and local elemental
variations due to vaporization during processing, on the heterogeneous strain-induced
martensitic phase transformation kinetics and tensile mechanical properties. The primary
findings of this work are as follows:
• By mixing pre-alloyed SS304L powder (atomized in nitrogen) with Fe powder, the
weight fraction of elements that increase the stacking fault energy of austenite was
successfully decreased, which activated strain-induced austenite-to-martensite phase
transformation. The occurrence of phase transformation in specimens from 80% and
90% SS304L walls improved their ultimate tensile strengths and elongations to failure
70
over those in the 100% SS304L wall. The microstructural phase transformation results
in an increased strain-hardening rate and stabilization of the neck, resulting in increased
ductility over samples with no phase transformation.
• The chemical composition in components made by AM depends on thermal history,
and therefore, location. During AM, as the distance from the substrate increases, and
heat builds up in the build as layers are added, the temperature of the molten pool
increases; thus, the concentration of volatile elements in the molten pool decreases as
those elements are preferentially vaporized. In SS304L, the concentrations of elements
that increase the stacking fault energy of austenite, chromium, manganese, and nickel
decreased with height in the 90% SS304L wall. This resulted in a decrease in austenite
stability and an increase in martensitic phase transformation with height, which resulted
in an increase in ultimate tensile strength with height.
• The martensitic phase transformation kinetics depend strongly on chemical
composition. As the weight fraction of elements that increase the stacking fault energy
of austenite decreased, the stability of austenite decreased and the rate of martensite
formation with respect to plastic strain increased. The saturation value of the strain-
induced martensite volume fraction also increased as the weight fraction of elements
that increase the stacking fault energy of austenite, decreased. We present a chemistry-
dependent phase transformation kinetics equation that describe the rate, with respect to
plastic strain, and saturation value of phase transformation in austenitic stainless steels
fabricated via AM.
• In additive manufacturing, it is necessary to understand the initial powder chemistry as
well as spatial chemical composition variations due to preferential vaporization during
71
deposition. While chemical variation is well-known in welding, it is particularly
important to recognize chemical heterogeneity in additive manufacturing as the number
of passes in AM is orders of magnitude higher than that encountered in welding;
therefore, chemistry may change significantly within a single build, impacting the
microstructure and properties of deposited materials. As shown here, in austenitic
stainless steels, the elemental composition influences the stability of austenite, which
affects the deformation mechanics, namely the strain-induced martensitic phase
transformation, which in turn dictates the macroscopic mechanical properties of the
material.
Acknowledgments
The authors gratefully acknowledge the financial support provided by the National
Science Foundation through award number CMMI-1402978. Any opinions, findings,
and conclusions or recommendations in the materials are those of the authors and do not
necessarily reflect the views of the Nation Science Foundation. We acknowledge Dr.
Todd Palmer and Mr. Jay Tressler for component fabrication and Mr. Griffin Jones for
the X-ray CT scans at the Center for Innovation Materials Processing through Direct
Digital Deposition (CIMP-3D). We acknowledge Dr. Dong Ma and Mr. Matthew Frost
of ORNL for neutron diffraction data collection and technical support at the VULCAN
beamline. In addition, AMB acknowledges funding from the Oak Ridge Associated
Universities Ralph E. Powe Junior Faculty Enhancement Award.
72
Chapter 5
Effect of stress state and texture on martensitic phase
transformation kinetics
5.1. Introduction
The volume fraction of strain-induced martensite as a function of plastic strain depends
on temperature, chemical composition, strain, strain rate, and stress state [46,48,49]. The
chemical composition dictates the stacking fault energy (SFE) of austenite, which in turn
influences the propensity for strain-induced martensitic transformation kinetics [66]. As
discussed in Chapters 3 and 4, the austenite in walls made from 100 vol.% SS304L powder
that was gas atomized in nitrogen was stabilized; thus, the nitrogen introduced during
powder processing precluded strain-induced martensitic transformation in these builds. By
mixing pre-alloyed SS304L powder with iron powder, the weight fraction of elements that
increase the stacking fault energy of austenite, decreased, resulting in the activation of
strain-induced martensitic transformation.
During additive manufacturing of stainless steel, columnar austenite grains grow
along the maximum thermal gradient during deposition, or the build direction, resulting
in texture in the additively manufactured components [44,78]. Texture in austenitic
stainless steels may impact strain-induced martensitic transformation by influencing the
Reproduced from: Z. Wang and A. M. Beese, “Effect of stress state and texture on martensitic
phase transformation kinetics of additively manufactured stainelss steel,” Submitted for publication
[149].
73
mechanical driving force for phase transformation [79–82]. Creuziger et al. [79] predicted
the driving force for textured TRIP steels under a number of loading conditions, concluding
that steels with brass and copper textures had lower driving forces and therefore required
higher applied stresses for phase transformation, than steels with cube texture, under all the
stress states studied. Similarly, Knijf et al. [82] predicted the driving force for martensitic
transformation in a low carbon steel subjected to uniaxial tension, and showed that
materials with cube and rotated Goss textures had higher driving forces for phase
transformation than those with brass and copper textures. Hilkhuijsen et al.[80,81]
investigated martensitic transformation in untextured and highly textured stainless steels
loaded under uniaxial tension. Their results showed the evolution of martensite content
with respect to plastic strain was independent of orientation in untextured specimens, but
varied significantly between textured specimens with loading axes along the rolling
direction versus the transverse direction.
Stress state also impacts strain-induced martensitic transformation in steels with
retained austenite, but the experimental results reported in the literature are inconsistent.
Cina [150] found that more martensite was formed under uniaxial tension than uniaxial
compression at the same plastic strain in steels containing 18-25% chromium and 8-12%
nickel. Powell et al. [69] found that for the same equivalent plastic strain, more martensite
was formed under tension than torsion or compression in 301 and 304 stainless steels.
Hecker et al. [72] and Murr et al. [73] observed that more than twice as much martensite
was formed under equi-biaxial tension than uniaxial tension at the same maximum
principal strain in annealed 304 stainless steel. Conversely, Kosarchuk et al. [151] found
that a higher amount of martensite was formed under uniaxial tension than equi-biaxial
74
tension at the same equivalent plastic strain in steels containing 16% chromium and 10%
nickel. Okutani et al. [152] reported that the amount of martensite was higher under
uniaxial compression than that under uniaxial tension at the same plastic strain in 304
stainless steel. Conversely, Iwamoto et al. [70] found that more martensite was formed
under uniaxial compression than uniaxial tension at low plastic strains, but that this trend
was reversed at higher plastic strains (i.e., above 20-40%) in annealed 304 stainless steel.
Yu et al. [153] observed that the rate of martensitic transformation with respect to
equivalent plastic strain was highest under plane strain tension, followed by equi-biaxial
tension, and lowest under uniaxial tension in cold rolled TRIP 600 steel. Beese and Mohr
[50] reported that in temper-rolled 301LN stainless steel, the rate of martensitic
transformation with respect to equivalent plastic strain from high to low was: uniaxial
tension, plane strain tension, equi-biaxial tension, and uniaxial compression.
As experimental investigations on the effect of stress state on martensitic
transformation are contradictory, the proposed equations to describe the transformation
kinetics are also diverse. Olson and Cohen [49] proposed a transformation kinetics
equation that captured the effect of plastic strain and temperature on annealed 304 stainless
steel under uniaxial tension [46]. Stringfellow et al. [48] expanded this equation by adding
the effect of stress triaxiality, proposing that the rate of martensitic transformation increases
with stress triaxiality. Their equation was based on the experimental uniaxial tension and
compression data measured by Young [154]. Kosarchuk and Lebedev [151,155] studied
martensitic transformation kinetics in austenitic stainless steel 18-10 subjected to uniaxial
tension, uniaxial compression, torsion, and equi-biaxial tension. They concluded from the
experimental results that martensitic transformation was not only affected by stress
75
triaxiality, and suggested the phase transformation also depended on the Lode angle
parameter. Their results qualitatively showed that martensite content at a fixed equivalent
plastic strain increased with stress triaxiality and decreased with Lode angle parameter.
Beese and Mohr [50] proposed a martensitic transformation equation for austenitic
stainless steel that fully incorporated the effect of stress state, by including the dependence
on stress triaxiality and Lode angle parameter. Their calibrated equation showed that the
rate of transformation with respect to plastic strain increased with stress triaxiality and
Lode angle parameter.
The strain-induced martensitic phase transformation kinetics in conventionally
processed austenitic stainless steels with nearly equiaxed grains under various stress states
have been investigated extensively [50,69,70,72,73,150–156]. However, only one paper
has reported the transformation kinetics in additively manufactured austenitic stainless
steels, with the study limited to uniaxial tension [124]. The aim of the present study was
to investigate the effect of stress state on strain-induced martensitic phase transformation
in SS304L, with two different chemistries, deposited by DED AM. The evolution of
martensite volume fraction with plastic deformation was quantified using in situ magnetic
permeability and neutron diffraction measurements during mechanical tests under uniaxial
tension, pure shear, and uniaxial compression. A chemistry-, stress state-, and texture-
dependent martensitic phase transformation kinetics equation describing martensite
volume fraction as a function of equivalent plastic strain, is proposed and calibrated for
SS304L made by AM. This transformation kinetics equation can be used to describe the
stress state-dependent martensitic transformation in textured austenitic stainless steels.
76
5.2. Experimental procedures
5.2.1. Uniaxial tension
Longitudinal and transverse uniaxial tension specimens, as described in Chapter 4,
were extracted from the 80% and 90% SS304L walls using EDM. As the spatial chemical
variation, due to preferential elemental vaporization, resulted in location-dependent
martensitic transformation and mechanical properties. Therefore, to eliminate the impact
of spatial chemical variation in this study, samples were extracted such that the gauge
centers of all specimens were at the same height, about 40 mm away from the bottom of
each wall.
Monotonic and periodic loading/unloading uniaxial tension tests with in situ
feritescope measurements were performed and analyzed, as described in Chapter 4. The
feritescope reading was converted to the volume fraction of martensite using Eqn. (4.1).
The conversion factor, k, which was found to be 1.8 in Chapter 4, was validated in Section
5.3.
5.2.2. Plane strain tension and pure shear
Plasticity specimens with a reduced thickness gauge section as shown in Figure 5.1
[157] were used to measure the mechanical behavior under plane strain tension and pure
shear. The gauge length along the transverse (T) direction in the specimen was 10 times
larger than that in the longitudinal (L) direction, resulting in a nearly zero strain along the
longitudinal direction, or a plane strain condition. Longitudinal and transverse plasticity
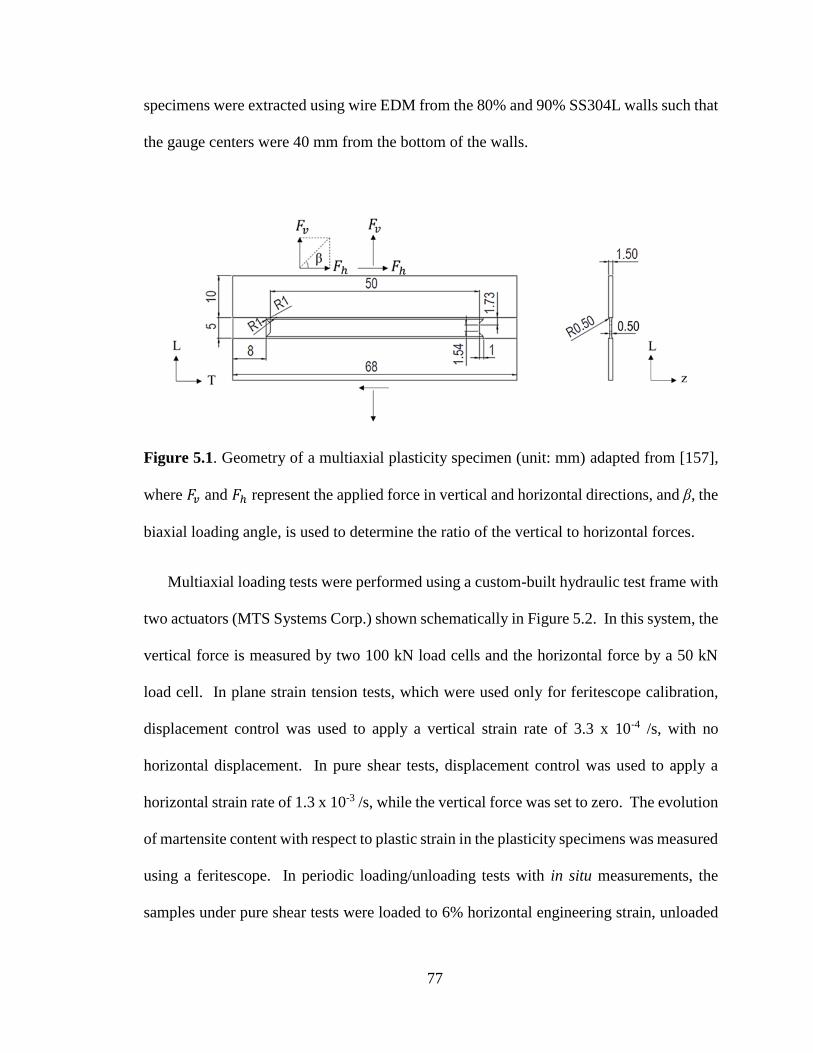
77
specimens were extracted using wire EDM from the 80% and 90% SS304L walls such that
the gauge centers were 40 mm from the bottom of the walls.
Figure 5.1. Geometry of a multiaxial plasticity specimen (unit: mm) adapted from [157],
where 𝐹𝑣 and 𝐹ℎ represent the applied force in vertical and horizontal directions, and β, the
biaxial loading angle, is used to determine the ratio of the vertical to horizontal forces.
Multiaxial loading tests were performed using a custom-built hydraulic test frame with
two actuators (MTS Systems Corp.) shown schematically in Figure 5.2. In this system, the
vertical force is measured by two 100 kN load cells and the horizontal force by a 50 kN
load cell. In plane strain tension tests, which were used only for feritescope calibration,
displacement control was used to apply a vertical strain rate of 3.3 x 10⁻⁴ /s, with no
horizontal displacement. In pure shear tests, displacement control was used to apply a
horizontal strain rate of 1.3 x 10⁻³ /s, while the vertical force was set to zero. The evolution
of martensite content with respect to plastic strain in the plasticity specimens was measured
using a feritescope. In periodic loading/unloading tests with in situ measurements, the
samples under pure shear tests were loaded to 6% horizontal engineering strain, unloaded
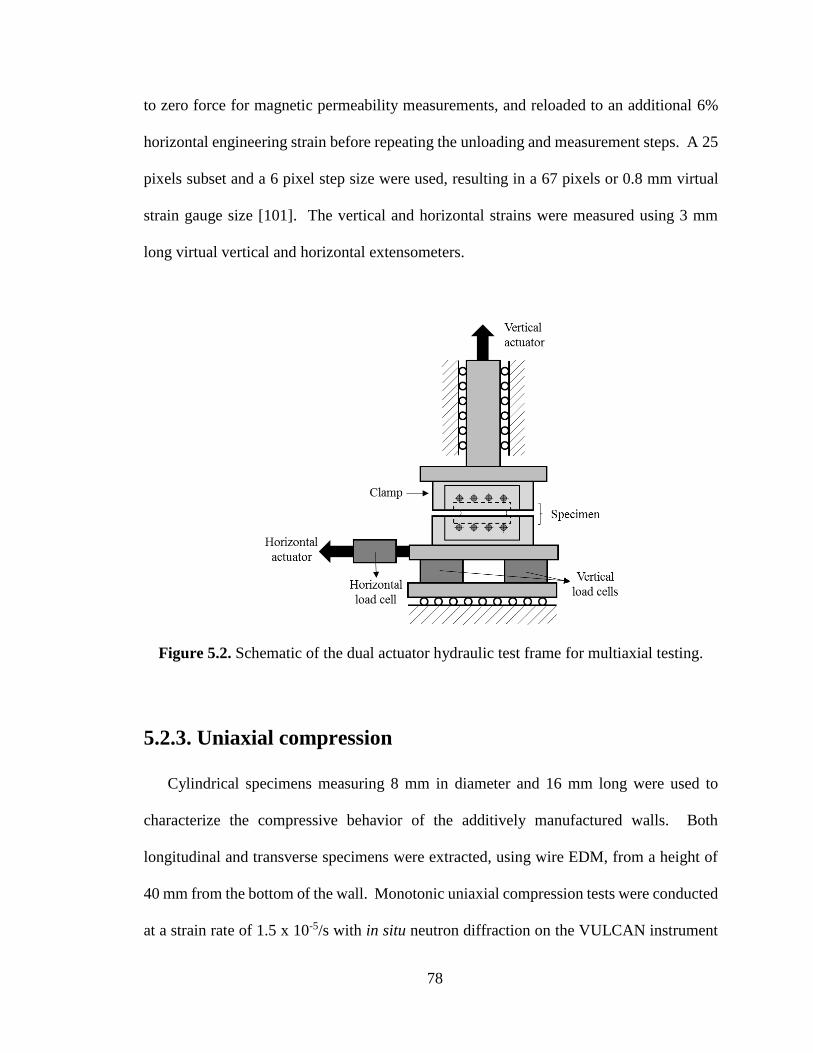
78
to zero force for magnetic permeability measurements, and reloaded to an additional 6%
horizontal engineering strain before repeating the unloading and measurement steps. A 25
pixels subset and a 6 pixel step size were used, resulting in a 67 pixels or 0.8 mm virtual
strain gauge size [101]. The vertical and horizontal strains were measured using 3 mm
long virtual vertical and horizontal extensometers.
Figure 5.2. Schematic of the dual actuator hydraulic test frame for multiaxial testing.
5.2.3. Uniaxial compression
Cylindrical specimens measuring 8 mm in diameter and 16 mm long were used to
characterize the compressive behavior of the additively manufactured walls. Both
longitudinal and transverse specimens were extracted, using wire EDM, from a height of
40 mm from the bottom of the wall. Monotonic uniaxial compression tests were conducted
at a strain rate of 1.5 x 10⁻⁵/s with in situ neutron diffraction on the VULCAN instrument
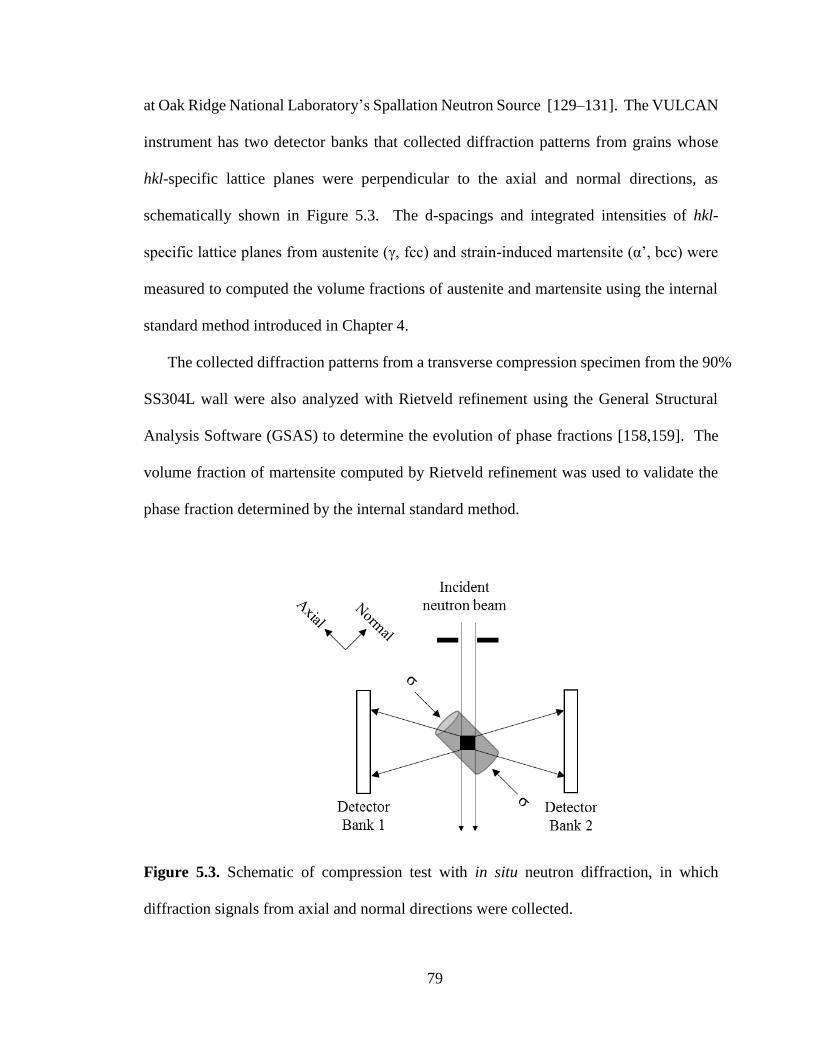
79
at Oak Ridge National Laboratory’s Spallation Neutron Source [129–131]. The VULCAN
instrument has two detector banks that collected diffraction patterns from grains whose
hkl-specific lattice planes were perpendicular to the axial and normal directions, as
schematically shown in Figure 5.3. The d-spacings and integrated intensities of hkl-
specific lattice planes from austenite (γ, fcc) and strain-induced martensite (α’, bcc) were
measured to computed the volume fractions of austenite and martensite using the internal
standard method introduced in Chapter 4.
The collected diffraction patterns from a transverse compression specimen from the 90%
SS304L wall were also analyzed with Rietveld refinement using the General Structural
Analysis Software (GSAS) to determine the evolution of phase fractions [158,159]. The
volume fraction of martensite computed by Rietveld refinement was used to validate the
phase fraction determined by the internal standard method.
Figure 5.3. Schematic of compression test with in situ neutron diffraction, in which
diffraction signals from axial and normal directions were collected.
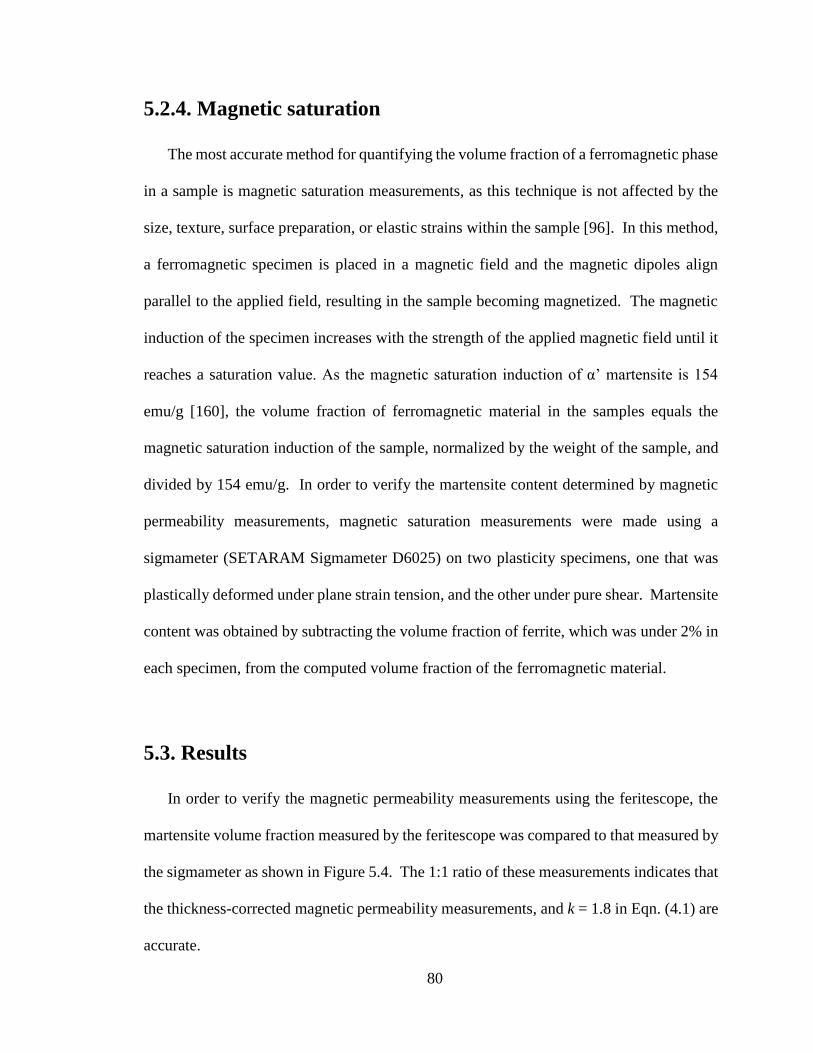
80
5.2.4. Magnetic saturation
The most accurate method for quantifying the volume fraction of a ferromagnetic phase
in a sample is magnetic saturation measurements, as this technique is not affected by the
size, texture, surface preparation, or elastic strains within the sample [96]. In this method,
a ferromagnetic specimen is placed in a magnetic field and the magnetic dipoles align
parallel to the applied field, resulting in the sample becoming magnetized. The magnetic
induction of the specimen increases with the strength of the applied magnetic field until it
reaches a saturation value. As the magnetic saturation induction of α’ martensite is 154
emu/g [160], the volume fraction of ferromagnetic material in the samples equals the
magnetic saturation induction of the sample, normalized by the weight of the sample, and
divided by 154 emu/g. In order to verify the martensite content determined by magnetic
permeability measurements, magnetic saturation measurements were made using a
sigmameter (SETARAM Sigmameter D6025) on two plasticity specimens, one that was
plastically deformed under plane strain tension, and the other under pure shear. Martensite
content was obtained by subtracting the volume fraction of ferrite, which was under 2% in
each specimen, from the computed volume fraction of the ferromagnetic material.
5.3. Results
In order to verify the magnetic permeability measurements using the feritescope, the
martensite volume fraction measured by the feritescope was compared to that measured by
the sigmameter as shown in Figure 5.4. The 1:1 ratio of these measurements indicates that
the thickness-corrected magnetic permeability measurements, and k = 1.8 in Eqn. (4.1) are
accurate.
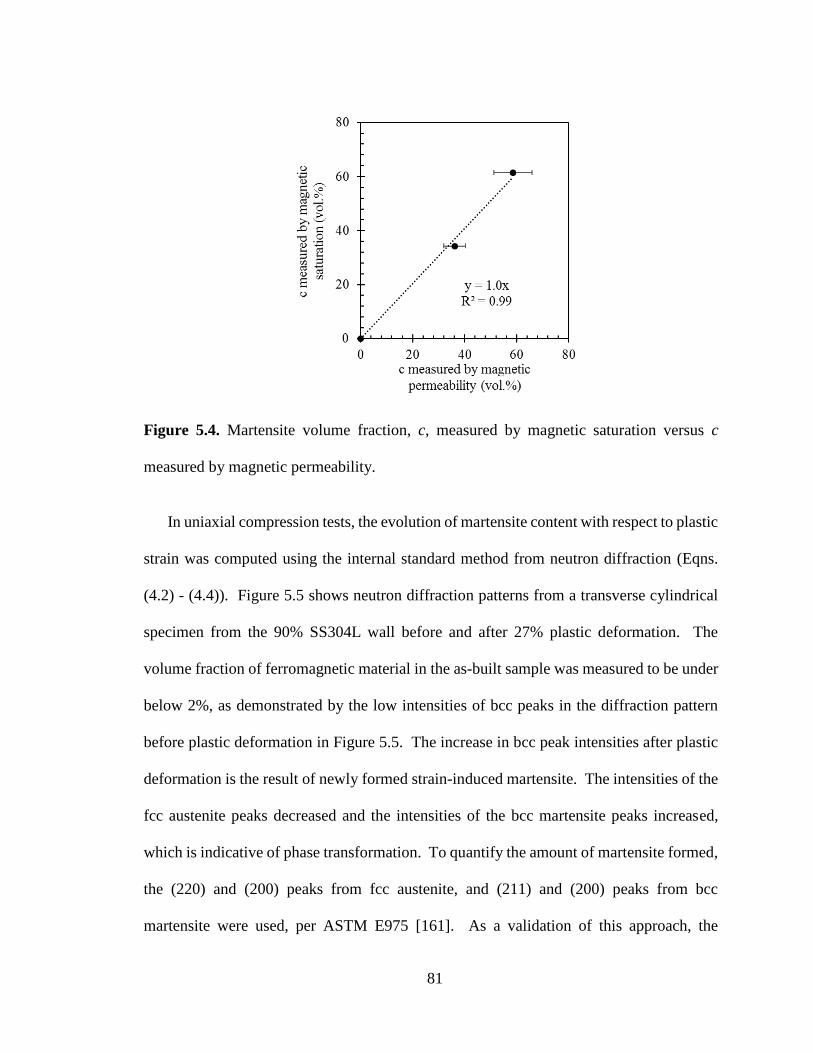
81
Figure 5.4. Martensite volume fraction, c, measured by magnetic saturation versus c
measured by magnetic permeability.
In uniaxial compression tests, the evolution of martensite content with respect to plastic
strain was computed using the internal standard method from neutron diffraction (Eqns.
(4.2) - (4.4)). Figure 5.5 shows neutron diffraction patterns from a transverse cylindrical
specimen from the 90% SS304L wall before and after 27% plastic deformation. The
volume fraction of ferromagnetic material in the as-built sample was measured to be under
below 2%, as demonstrated by the low intensities of bcc peaks in the diffraction pattern
before plastic deformation in Figure 5.5. The increase in bcc peak intensities after plastic
deformation is the result of newly formed strain-induced martensite. The intensities of the
fcc austenite peaks decreased and the intensities of the bcc martensite peaks increased,
which is indicative of phase transformation. To quantify the amount of martensite formed,
the (220) and (200) peaks from fcc austenite, and (211) and (200) peaks from bcc
martensite were used, per ASTM E975 [161]. As a validation of this approach, the
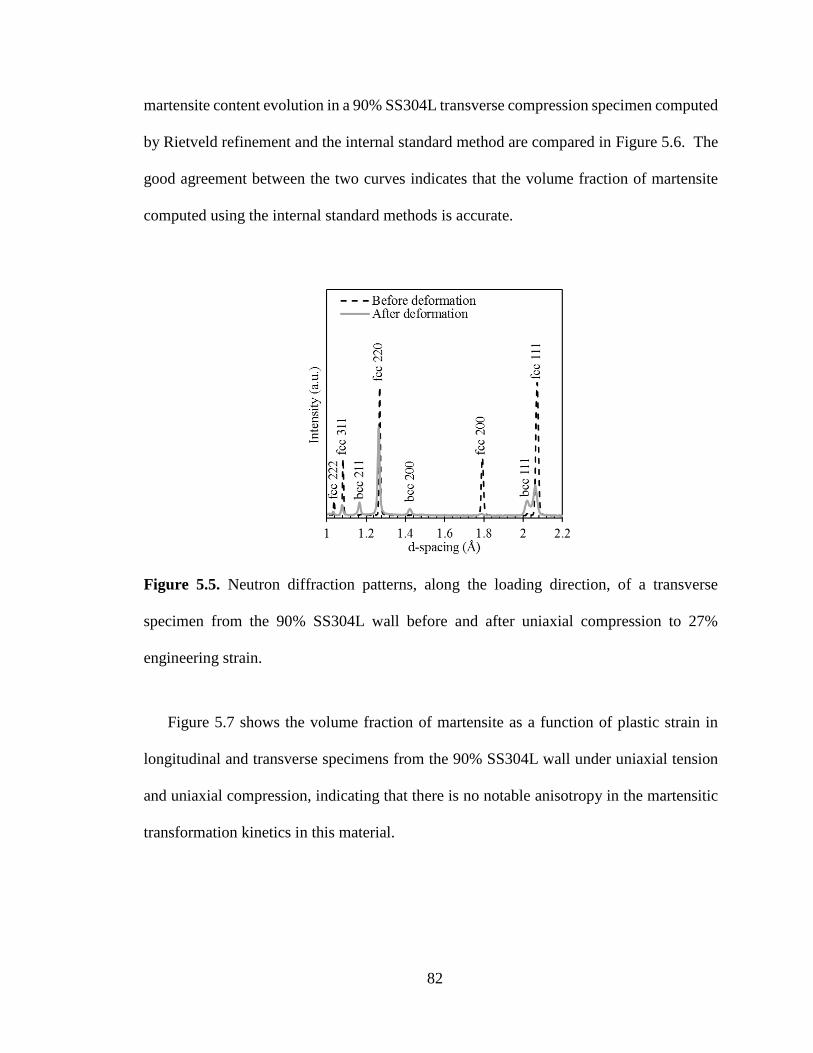
82
martensite content evolution in a 90% SS304L transverse compression specimen computed
by Rietveld refinement and the internal standard method are compared in Figure 5.6. The
good agreement between the two curves indicates that the volume fraction of martensite
computed using the internal standard methods is accurate.
Figure 5.5. Neutron diffraction patterns, along the loading direction, of a transverse
specimen from the 90% SS304L wall before and after uniaxial compression to 27%
engineering strain.
Figure 5.7 shows the volume fraction of martensite as a function of plastic strain in
longitudinal and transverse specimens from the 90% SS304L wall under uniaxial tension
and uniaxial compression, indicating that there is no notable anisotropy in the martensitic
transformation kinetics in this material.
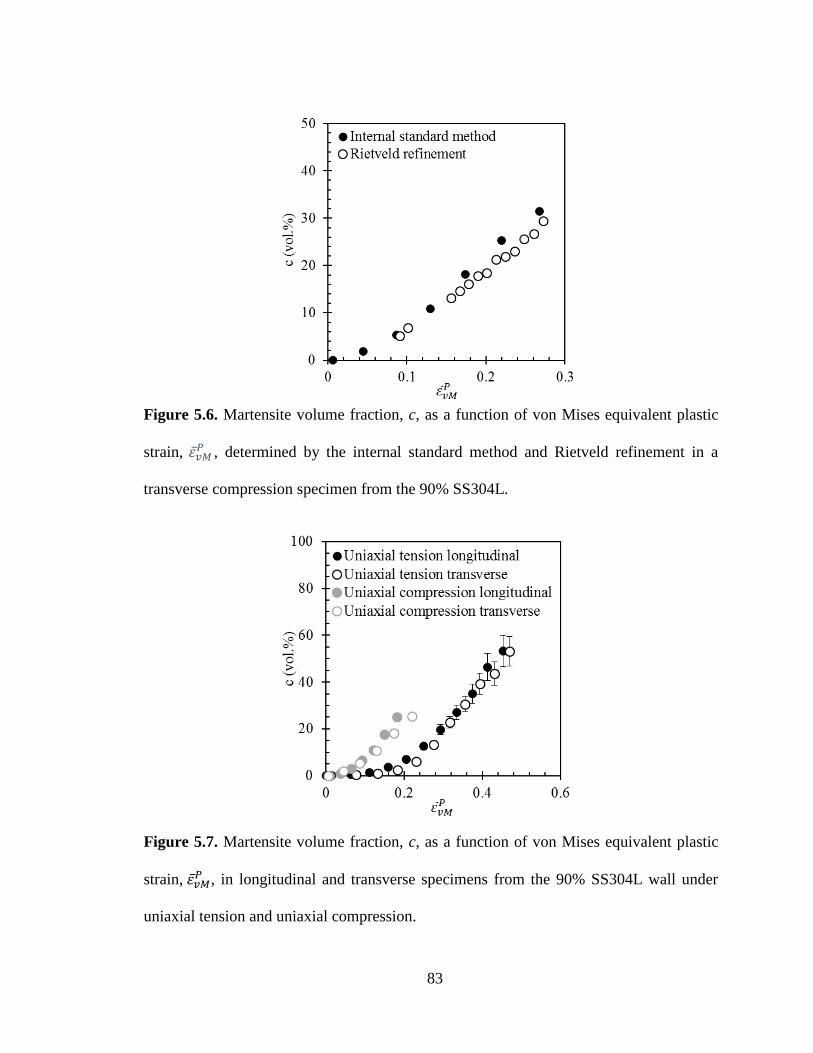
83
Figure 5.6. Martensite volume fraction, c, as a function of von Mises equivalent plastic
strain, 𝜀��𝑀𝑃 , determined by the internal standard method and Rietveld refinement in a
transverse compression specimen from the 90% SS304L.
Figure 5.7. Martensite volume fraction, c, as a function of von Mises equivalent plastic
strain, 𝜀��𝑀𝑃 , in longitudinal and transverse specimens from the 90% SS304L wall under
uniaxial tension and uniaxial compression.
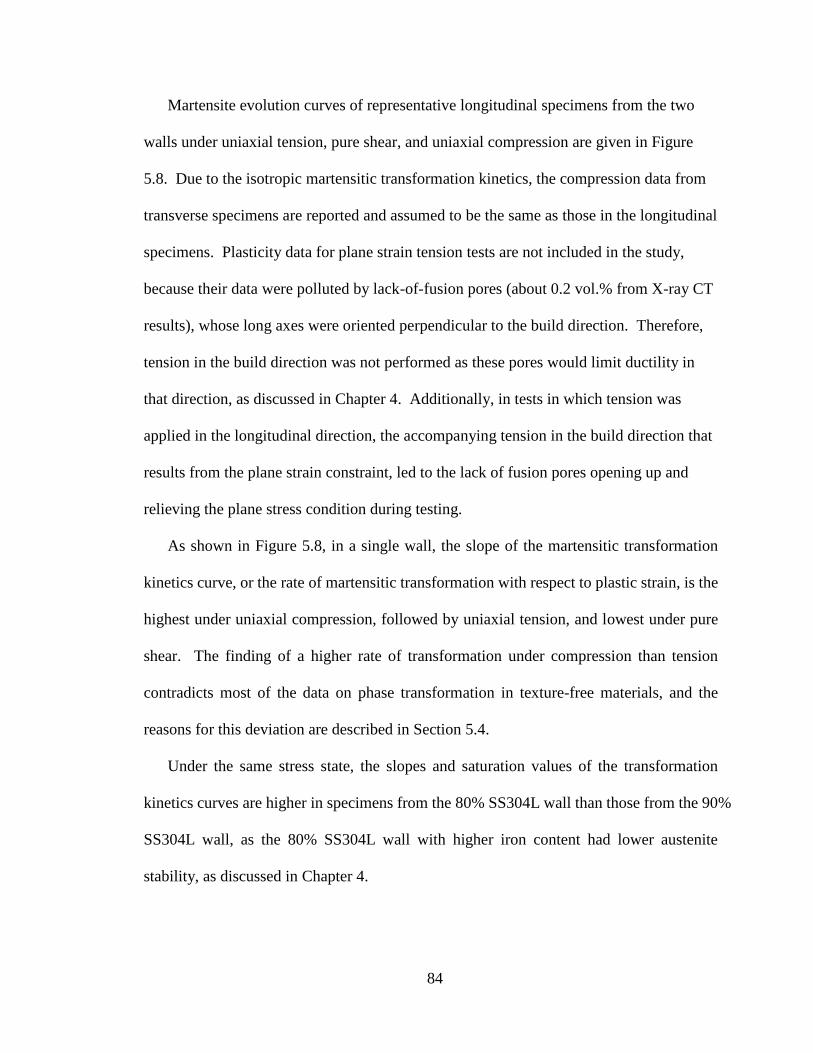
84
Martensite evolution curves of representative longitudinal specimens from the two
walls under uniaxial tension, pure shear, and uniaxial compression are given in Figure
5.8. Due to the isotropic martensitic transformation kinetics, the compression data from
transverse specimens are reported and assumed to be the same as those in the longitudinal
specimens. Plasticity data for plane strain tension tests are not included in the study,
because their data were polluted by lack-of-fusion pores (about 0.2 vol.% from X-ray CT
results), whose long axes were oriented perpendicular to the build direction. Therefore,
tension in the build direction was not performed as these pores would limit ductility in
that direction, as discussed in Chapter 4. Additionally, in tests in which tension was
applied in the longitudinal direction, the accompanying tension in the build direction that
results from the plane strain constraint, led to the lack of fusion pores opening up and
relieving the plane stress condition during testing.
As shown in Figure 5.8, in a single wall, the slope of the martensitic transformation
kinetics curve, or the rate of martensitic transformation with respect to plastic strain, is the
highest under uniaxial compression, followed by uniaxial tension, and lowest under pure
shear. The finding of a higher rate of transformation under compression than tension
contradicts most of the data on phase transformation in texture-free materials, and the
reasons for this deviation are described in Section 5.4.
Under the same stress state, the slopes and saturation values of the transformation
kinetics curves are higher in specimens from the 80% SS304L wall than those from the 90%
SS304L wall, as the 80% SS304L wall with higher iron content had lower austenite
stability, as discussed in Chapter 4.
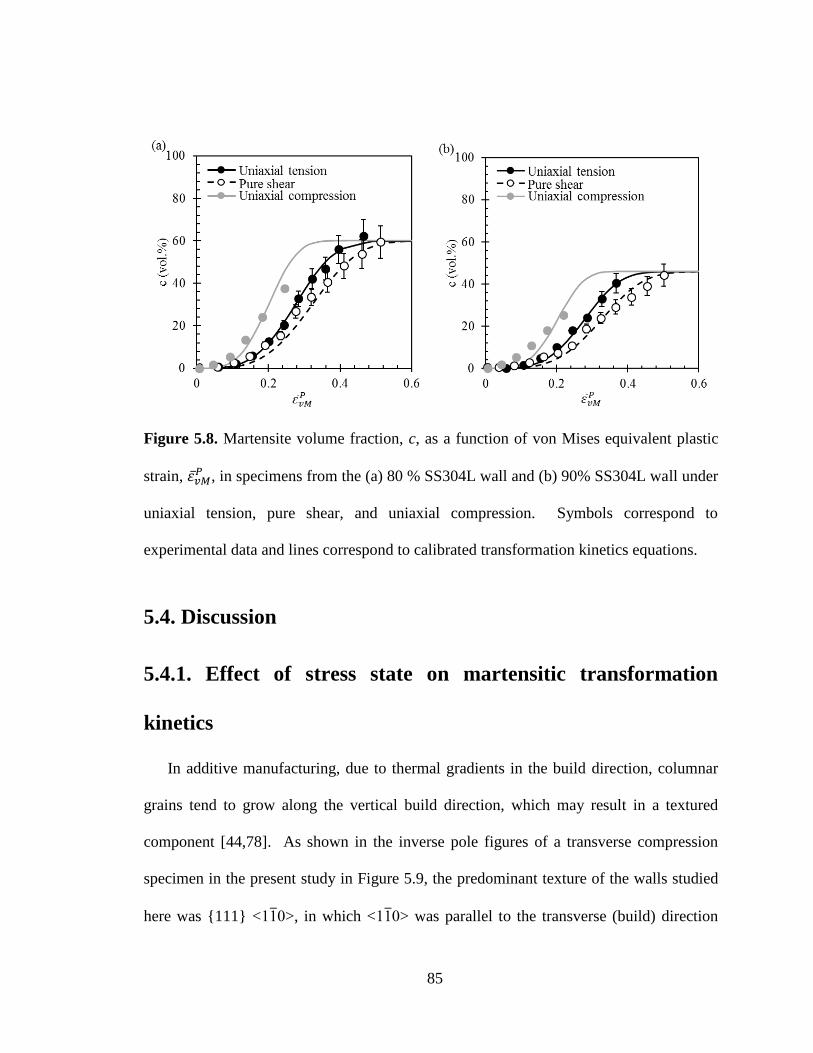
85
Figure 5.8. Martensite volume fraction, c, as a function of von Mises equivalent plastic
strain, 𝜀��𝑀𝑃 , in specimens from the (a) 80 % SS304L wall and (b) 90% SS304L wall under
uniaxial tension, pure shear, and uniaxial compression. Symbols correspond to
experimental data and lines correspond to calibrated transformation kinetics equations.
5.4. Discussion
5.4.1. Effect of stress state on martensitic transformation
kinetics
In additive manufacturing, due to thermal gradients in the build direction, columnar
grains tend to grow along the vertical build direction, which may result in a textured
component [44,78]. As shown in the inverse pole figures of a transverse compression
specimen in the present study in Figure 5.9, the predominant texture of the walls studied
here was {111} <110>, in which <110> was parallel to the transverse (build) direction
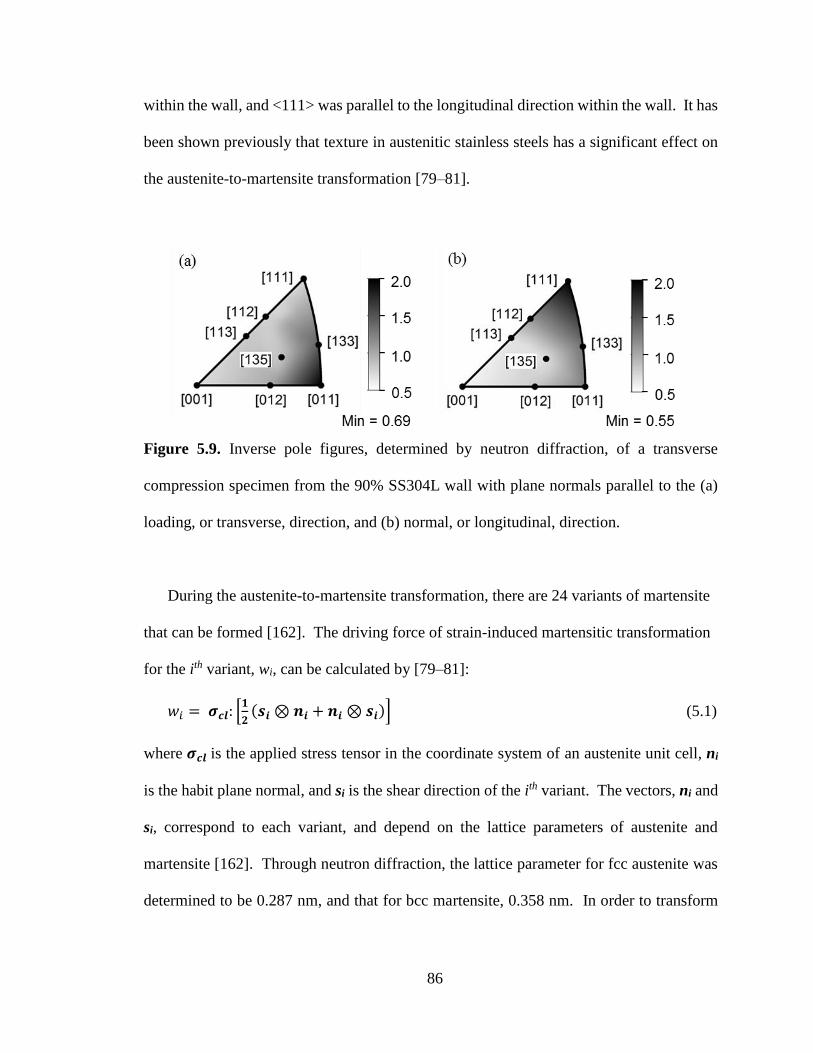
86
within the wall, and <111> was parallel to the longitudinal direction within the wall. It has
been shown previously that texture in austenitic stainless steels has a significant effect on
the austenite-to-martensite transformation [79–81].
Figure 5.9. Inverse pole figures, determined by neutron diffraction, of a transverse
compression specimen from the 90% SS304L wall with plane normals parallel to the (a)
loading, or transverse, direction, and (b) normal, or longitudinal, direction.
During the austenite-to-martensite transformation, there are 24 variants of martensite
that can be formed [162]. The driving force of strain-induced martensitic transformation
for the ith variant, wi, can be calculated by [79–81]:
𝑤𝑖 = 𝝈𝒄𝒍: [𝟏
𝟐(𝒔𝒊 ⊗ 𝒏𝒊 + 𝒏𝒊 ⊗ 𝒔𝒊)] (5.1)
where 𝝈𝒄𝒍 is the applied stress tensor in the coordinate system of an austenite unit cell, ni
is the habit plane normal, and si is the shear direction of the ith variant. The vectors, ni and
si, correspond to each variant, and depend on the lattice parameters of austenite and
martensite [162]. Through neutron diffraction, the lattice parameter for fcc austenite was
determined to be 0.287 nm, and that for bcc martensite, 0.358 nm. In order to transform
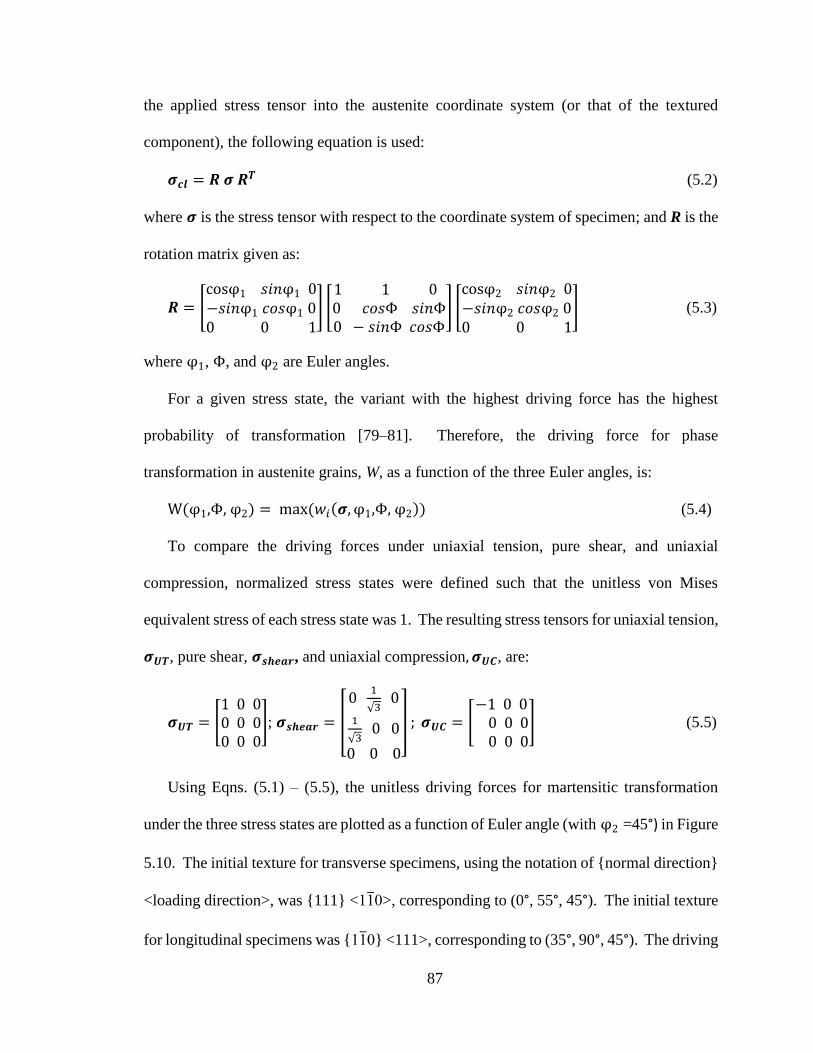
87
the applied stress tensor into the austenite coordinate system (or that of the textured
component), the following equation is used:
𝝈𝒄𝒍 = 𝑹 𝝈 𝑹𝑻 (5.2)
where 𝝈 is the stress tensor with respect to the coordinate system of specimen; and R is the
rotation matrix given as:
𝑹 = [cosφ1 𝑠𝑖𝑛φ1 0−𝑠𝑖𝑛φ1 𝑐𝑜𝑠φ1 00 0 1
] [1 1 0 0 𝑐𝑜𝑠Φ 𝑠𝑖𝑛Φ0 − 𝑠𝑖𝑛Φ 𝑐𝑜𝑠Φ
] [cosφ2 𝑠𝑖𝑛φ2 0−𝑠𝑖𝑛φ2 𝑐𝑜𝑠φ2 00 0 1
] (5.3)
where φ1, Φ, and φ2 are Euler angles.
For a given stress state, the variant with the highest driving force has the highest
probability of transformation [79–81]. Therefore, the driving force for phase
transformation in austenite grains, W, as a function of the three Euler angles, is:
W(φ1,Φ, φ2) = max (𝑤𝑖(𝝈, φ1,Φ, φ2)) (5.4)
To compare the driving forces under uniaxial tension, pure shear, and uniaxial
compression, normalized stress states were defined such that the unitless von Mises
equivalent stress of each stress state was 1. The resulting stress tensors for uniaxial tension,
𝝈𝑼𝑻, pure shear, 𝝈𝒔𝒉𝒆𝒂𝒓, and uniaxial compression, 𝝈𝑼𝑪, are:
𝝈𝑼𝑻 = [1 0 00 0 00 0 0
]; 𝝈𝒔𝒉𝒆𝒂𝒓 = [
0 1
√3 0
1
√3 0 0
0 0 0
] ; 𝝈𝑼𝑪 = [−1 0 0 0 0 0 0 0 0
] (5.5)
Using Eqns. (5.1) – (5.5), the unitless driving forces for martensitic transformation
under the three stress states are plotted as a function of Euler angle (with φ2 =45°) in Figure
5.10. The initial texture for transverse specimens, using the notation of {normal direction}
<loading direction>, was {111} <110>, corresponding to (0°, 55°, 45°). The initial texture
for longitudinal specimens was {110} <111>, corresponding to (35°, 90°, 45°). The driving
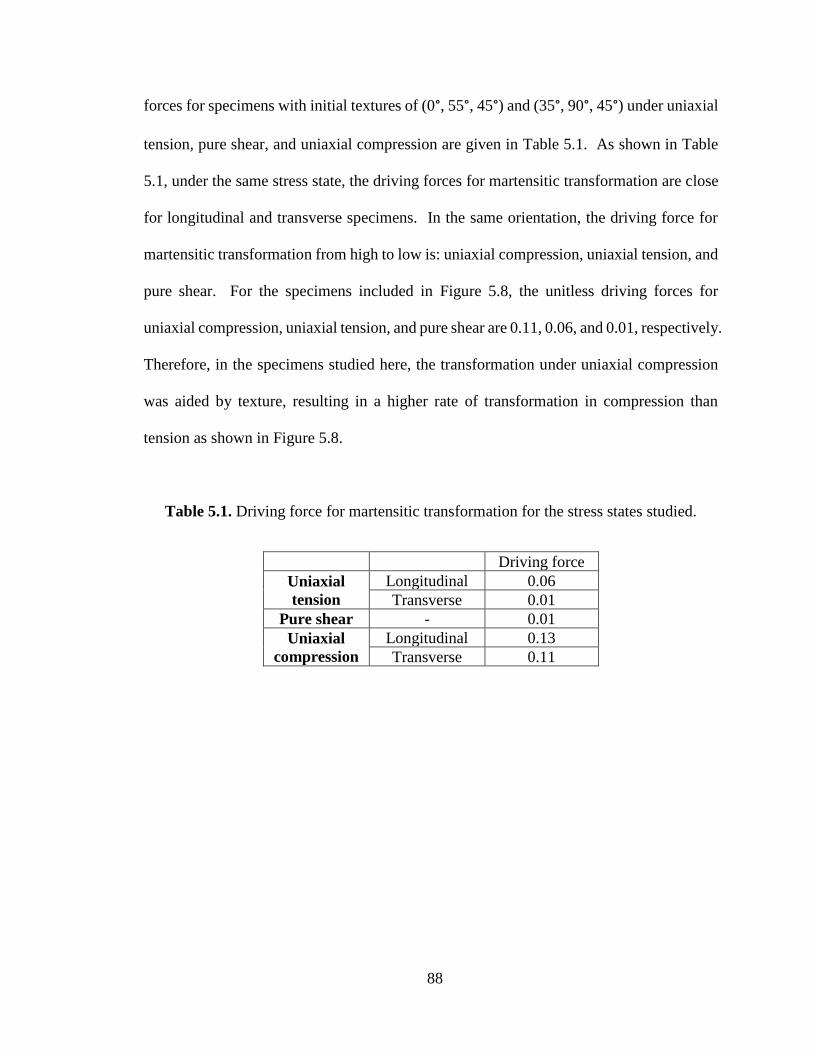
88
forces for specimens with initial textures of (0°, 55°, 45°) and (35°, 90°, 45°) under uniaxial
tension, pure shear, and uniaxial compression are given in Table 5.1. As shown in Table
5.1, under the same stress state, the driving forces for martensitic transformation are close
for longitudinal and transverse specimens. In the same orientation, the driving force for
martensitic transformation from high to low is: uniaxial compression, uniaxial tension, and
pure shear. For the specimens included in Figure 5.8, the unitless driving forces for
uniaxial compression, uniaxial tension, and pure shear are 0.11, 0.06, and 0.01, respectively.
Therefore, in the specimens studied here, the transformation under uniaxial compression
was aided by texture, resulting in a higher rate of transformation in compression than
tension as shown in Figure 5.8.
Table 5.1. Driving force for martensitic transformation for the stress states studied.
Driving force
Uniaxial
tension
Longitudinal 0.06
Transverse 0.01
Pure shear - 0.01
Uniaxial
compression
Longitudinal 0.13
Transverse 0.11
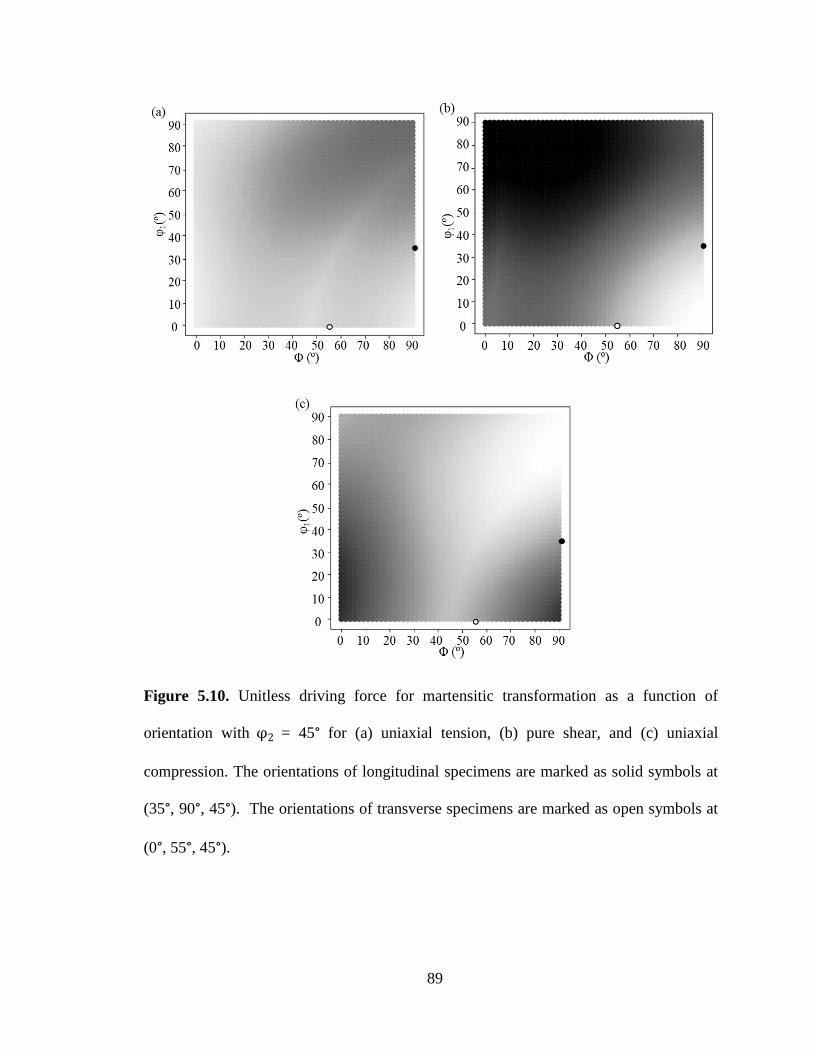
89
Figure 5.10. Unitless driving force for martensitic transformation as a function of
orientation with φ2 = 45° for (a) uniaxial tension, (b) pure shear, and (c) uniaxial
compression. The orientations of longitudinal specimens are marked as solid symbols at
(35°, 90°, 45°). The orientations of transverse specimens are marked as open symbols at
(0°, 55°, 45°).
90
5.4.2. Effect of chemistry on martensitic phase transformation
kinetics
The elemental compositions of the two SS304L walls, given in Table 2.1, affect the
rate, with respect to plastic strain, and saturation values of martensitic transformation
kinetics in the materials, as shown in Figure 5.8. With an increase in the volume fraction
of iron powder, the relative content of elements that increase the SFE of austenite (silicon,
manganese, chromium, and nickel) decreases. Therefore, compared to the 90% SS304L
wall, austenite is less stable, resulting in a higher rate of transformation to, and a higher
saturation value of, martensite in the 80% SS304L wall (Figure 5.8).
5.4.3. Stress state-dependent martensitic phase transformation
kinetics
Santacreu et al. [148] proposed a stress state independent phase transformation kinetics
equation to describe the evolution of martensite content as a function of plastic strain in
conventionally processed austenitic 301LN stainless steel, as given in Eqn. (4.9).
The martensitic transformation kinetics curves in the 80% and 90% SS304L walls are
stress state dependent, as shown in Figure 5.8. Therefore, a stress state dependent
martensitic transformation kinetics equation is required. Beese and Mohr [50] expanded
the transformation kinetics equation in Eqn. (4.9) by incorporating the effect of stress rate,
where the stress state can be described by the stress triaxiality, η, and Lode angle parameter,
��. Stress triaxiality, η, is defined as:
η = σm
σvM (5.6)
91
where σm is the hydrostatic stress, which is proportional to the first invariant, I1, of stress
tensor, σ; and σvM is the von Mises equivalent stress, which is a function of the second
invariant, J2, of the deviatoric stress tensor, s, given as:
σm = 1
3I1 =
1
3tr(σ) and σvM = √3J2 = √
3
2s∙s (5.7)
The Lode angle parameter is expressed as:
θ =1 - 2
πarccos(
3√3
2
J3
√J23) (5.8)
where J3 is the third invariant of s, as J3 = det (s).
The material parameter D in Eqn. (4.9) may be expressed as a function of stress
triaxiality and Lode angle parameter as [50]:
D = D0 + aηη + aθθ (5.9)
where D0, aη, and aθ are material parameters; and aη, and aθ describe the contributions of
stress triaxiality and Lode angle parameter.
The stress state dependent transformation kinetics equation proposed by Beese and
Mohr [50] is chosen as a starting point for additively manufactured SS304L. The effect
of chemistry on transformation kinetics may be taken into account through cmax and n [124].
The equation proposed by Beese and Mohr [50] describes the transformation rate in terms
of stress triaxiality and Lode angle parameter. The calibrated equation captured the fact
that material loaded under uniaxial tension had the highest transformation rate, followed
by that loaded under pure shear and uniaxial compression in untextured austenitic stainless
steel. These data and calibrated equation were explained by the fact that the tensile normal
stress acting on the maximum shear plane, which aids martensitic transformation [55],
increases with stress triaxiality and Lode angle parameter in an untextured material [50].
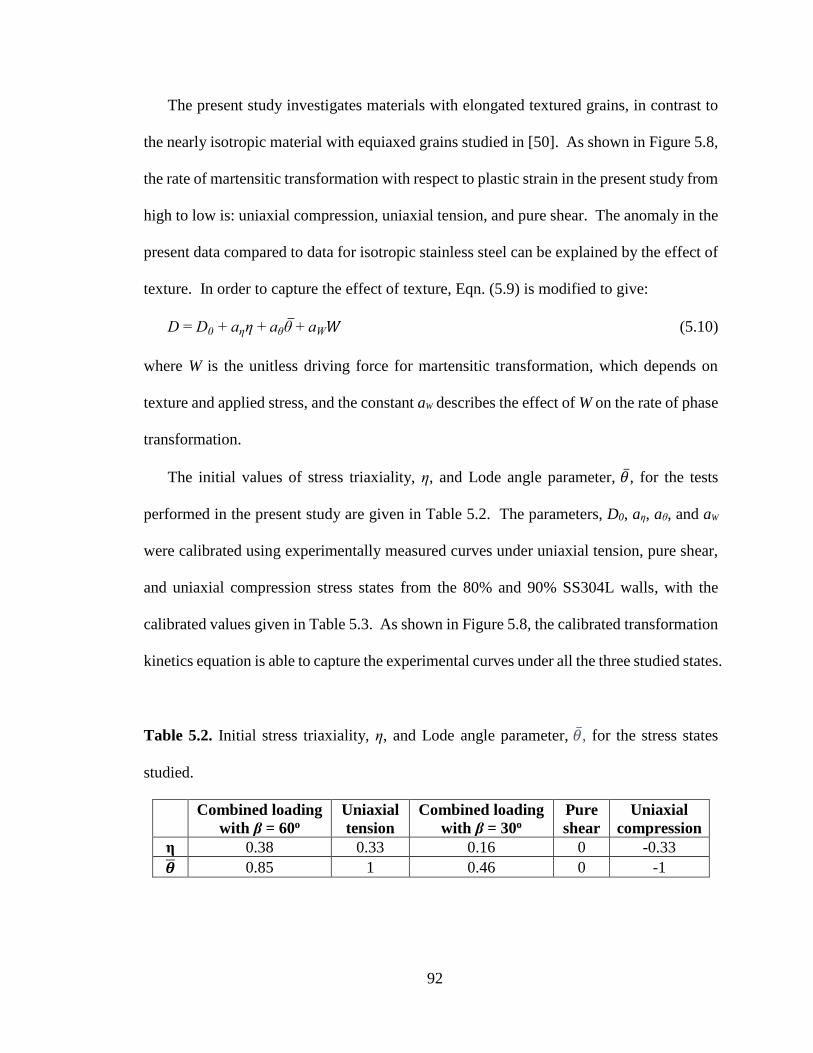
92
The present study investigates materials with elongated textured grains, in contrast to
the nearly isotropic material with equiaxed grains studied in [50]. As shown in Figure 5.8,
the rate of martensitic transformation with respect to plastic strain in the present study from
high to low is: uniaxial compression, uniaxial tension, and pure shear. The anomaly in the
present data compared to data for isotropic stainless steel can be explained by the effect of
texture. In order to capture the effect of texture, Eqn. (5.9) is modified to give:
D = D0 + aηη + aθθ + aW𝑊 (5.10)
where W is the unitless driving force for martensitic transformation, which depends on
texture and applied stress, and the constant aW describes the effect of W on the rate of phase
transformation.
The initial values of stress triaxiality, η, and Lode angle parameter, ��, for the tests
performed in the present study are given in Table 5.2. The parameters, D0, aη, aθ, and aW
were calibrated using experimentally measured curves under uniaxial tension, pure shear,
and uniaxial compression stress states from the 80% and 90% SS304L walls, with the
calibrated values given in Table 5.3. As shown in Figure 5.8, the calibrated transformation
kinetics equation is able to capture the experimental curves under all the three studied states.
Table 5.2. Initial stress triaxiality, η, and Lode angle parameter, ��, for the stress states
studied.
Combined loading
with β = 60o
Uniaxial
tension
Combined loading
with β = 30o
Pure
shear
Uniaxial
compression
η 0.38 0.33 0.16 0 -0.33
�� 0.85 1 0.46 0 -1
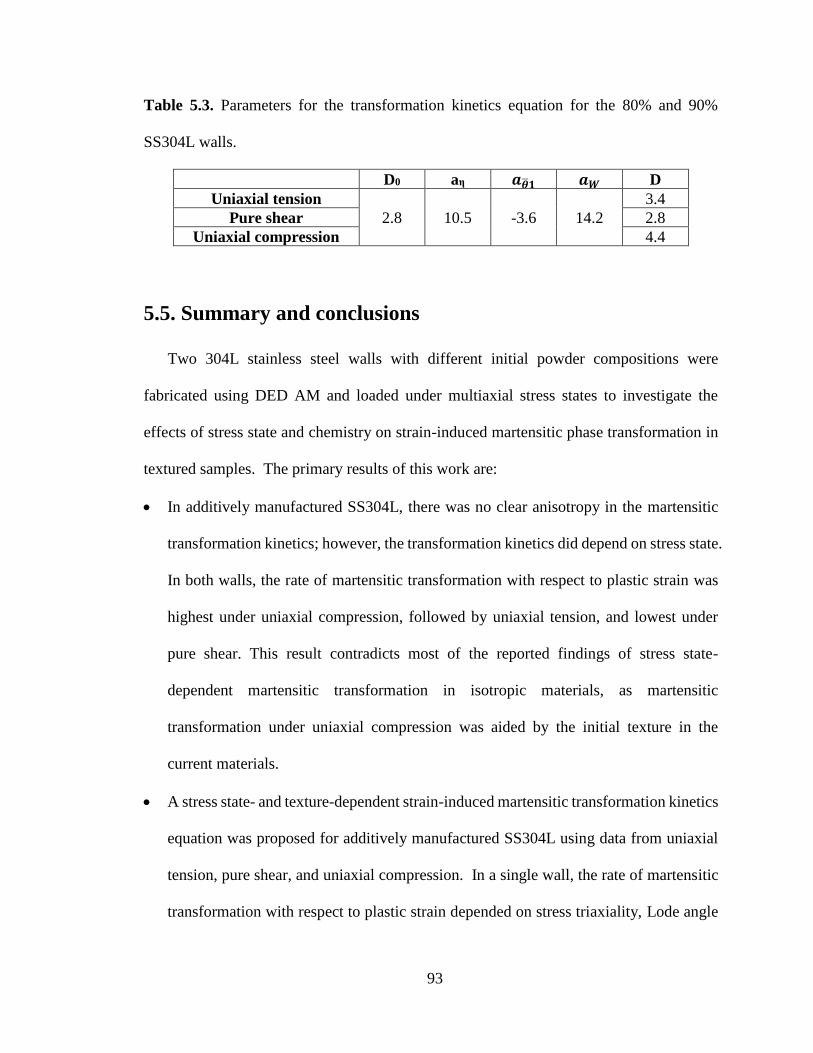
93
Table 5.3. Parameters for the transformation kinetics equation for the 80% and 90%
SS304L walls.
D0 aη 𝒂��𝟏 𝒂𝑾 D
Uniaxial tension
2.8 10.5 -3.6 14.2
3.4
Pure shear 2.8
Uniaxial compression 4.4
5.5. Summary and conclusions
Two 304L stainless steel walls with different initial powder compositions were
fabricated using DED AM and loaded under multiaxial stress states to investigate the
effects of stress state and chemistry on strain-induced martensitic phase transformation in
textured samples. The primary results of this work are:
• In additively manufactured SS304L, there was no clear anisotropy in the martensitic
transformation kinetics; however, the transformation kinetics did depend on stress state.
In both walls, the rate of martensitic transformation with respect to plastic strain was
highest under uniaxial compression, followed by uniaxial tension, and lowest under
pure shear. This result contradicts most of the reported findings of stress state-
dependent martensitic transformation in isotropic materials, as martensitic
transformation under uniaxial compression was aided by the initial texture in the
current materials.
• A stress state- and texture-dependent strain-induced martensitic transformation kinetics
equation was proposed for additively manufactured SS304L using data from uniaxial
tension, pure shear, and uniaxial compression. In a single wall, the rate of martensitic
transformation with respect to plastic strain depended on stress triaxiality, Lode angle
94
parameter, and driving force for martensitic transformation, which is dependent on
texture and applied stress state.
• The martensitic transformation kinetics also depend strongly on chemistry. Under the
same stress state, the wall with a lower austenite stability (higher volume fraction of
iron) had a higher rate of martensite transformation (with respect to plastic strain), and
a higher saturation value of strain-induced martensite volume fraction.
Acknowledgments
The authors gratefully acknowledge the financial support provided by the National
Science Foundation through award number CMMI-1402978 and CMMI-1652575. Any
opinions, findings, and conclusions or recommendations in the materials are those of the
authors and do not necessarily reflect the views of the Nation Science Foundation. We
acknowledge Mr. Jay Tressler for component fabrication and Mr. Griffin Jones for the X-
ray CT scans at the Center for Innovation Materials Processing through Direct Digital
Deposition (CIMP-3D). We thank Dr. Dong Ma and Mr. Matthew Frost of ORNL for
neutron diffraction data collection and technical support at the VULCAN beamline, Dr.
Alexandru D. Stoica of ORNL for Rietveld refinement analysis, and Dr. Pierre-Olivier
Santacreu for magnetic saturation measurements.
95
Chapter 6
Plasticity model coupled with strain-induced martensitic
transformation kinetics
6.1. Introduction
Constitutive plasticity models have been developed extensively for conventionally
processed steels undergoing strain-induced martensitic phase transformation, and they can
be grouped as micromechanical and phenomenological models [52,53,163–175].
Micromechanical models involve the modeling of the phase evolution due to martensitic
transformation, and the prediction of the macroscopic constitutive behavior using
homogenization methods varying from a simple rule of mixtures [163,164,168,173] to
more advanced methods [52,165,174,175]. Hallberg et al. [163] proposed a
micromechanical constitutive model for austenitic stainless steels, consisting of a von
Mises yield surface and a stress state-dependent phase transformation potential function.
In their model, the yield surface is determined by using a nonlinear mixture rule to combine
the yield stresses of austenite and martensite, and the transformation potential depends on
the second and third invariants of the deviatoric stress tensor. Post et al. [164] proposed a
model to describe the constitutive behavior of stainless steel with stress-assisted martensitic
transformation, in which austenite-to-martensite phase transformation occurs under elastic
Reproduced from: Z. Wang and A. M. Beese, “Plasticity model coupled with strain-induced
martensitic transformation kinetics for austenitic stainelss steel deposited by additive
manufactutring,” Submitted for publication [176].
96
deformation [47], and strain-induced martensitic transformation. In their model, the flow
stresses of austenite and martensite are determined by dislocation density, phase fraction,
and plastic strain. The macroscopic flow stress is computed by incorporating the flow
stresses of the two phases using a nonlinear rule of mixtures.
Stringfellow and Parks [48,52] proposed a self-consistent homogenization model to
predict the plasticity behavior of alloys with strain-induced martensitic transformation.
The model assumes an isotropic distribution of spherical martensite inclusions in
homogeneous austenite matrix. The macroscopic stress is described by the volume fraction,
plastic strain, and time-dependent mechanical properties of austenite and martensite.
Bhattacharyya and Weng [165] predicted the stress-strain behavior of metals with an
austenite-to-martensite phase transformation using an energy approach. In their model, the
effective stress is estimated based on the potential energy and change in the Gibbs free
energy due to phase transformation while the effective strain is computed using the lattice
parameters of austenite and martensite. Zaera et al. [175] developed a temperature-
dependent constitutive model for TRIP steels. The effect of temperature on phase
transformation kinetics and yield strength of each phase is incorporated and the
macroscopic mechanical behavior is determined through a homogenization method for an
isotropic composite. Msolli et al. [174] modeled the mechanical behavior of 304L stainless
steel by assuming spherical martensite inclusions were isotropically embedded in the
austenite matrix. In their model, a mean field homogenization approach is applied to
compute macroscopic constitutive behavior from the constitutive behavior of austenite and
martensite.
97
Unlike micromechanics-based models, phenomenological models directly define the
macroscopic constitutive equations. Miller and McDowell [171] proposed a
phenomenological constitutive model for face-centered cubic metals with strain-induced
martensitic transformation, in which the yield and hardening functions are stress state-
dependent. The effect of martensitic transformation on mechanical behavior was
incorporated in the hardening function. H ansel et al. [166] proposed a temperature-
dependent plasticity model for TRIP steels, which includes a von Mises yield surface and
an isotropic hardening law, in which the flow stress is a function of martensite content,
temperature, and plastic strain. Mohr and Jacquemin [167] developed a macroscopic
constitutive model for anisotropic austenitic stainless steels. The plasticity behavior was
described by a Hill’48 yield surface [177], an associated flow rule, and a non-associated
anisotropic hardening law. Beese and Mohr [53] proposed a stress state-dependent
plasticity model for austenitic stainless steels, which is composed of a Hill’48 yield surface
[177] with a nonlinear kinematic hardening law, an associated flow rule, and an isotropic
hardening law coupled with a stress state-dependent martensitic transformation kinetics
equation to account for strain hardening due to phase transformation. Yu et al. [170]
described the constitutive behavior of TRIP steels using a von Mises yield surface, an
associated flow rule, and a mixed isotropic and kinematic hardening law, which is a
function of plastic strain and volume fraction of martensite. Hazar et al. [169] developed
a macroscopic constitutive model for martensitic steels, which is described by a Drucker
Prager yield surface coupled with nonlinear kinematic hardening law, a non-associated
flow rule, and isotropic hardening law coupled with stress-assisted and strain-induced
martensitic phase transformation kinetics equations.
98
While models for conventionally processed austenitic stainless steels experiencing
strain-induced martensitic transformation have been developed [52,53,163–175], thus far,
no work has examined the multiaxial behavior of additively manufactured stainless steels.
The objectives of this work were to investigate the multiaxial plasticity behavior of, and
propose a macroscopic plasticity model for, additively manufactured SS304L. The
proposed model consists of a von Mises yield surface, an associated flow rule, and an
isotropic hardening law coupled with a stress state-, texture-, and chemistry-dependent,
martensitic transformation kinetics equation. The plasticity model was implemented into
a finite element software, and calibrated and validated using experimental data under
uniaxial tension, uniaxial compression, pure shear, and combined tension and shear.
6.2. Experimental procedures
6.2.1. Uniaxial tension and uniaxial compression
Longitudinal and transverse uniaxial tension specimens and cylindrical compression
were extracted from the 80% and 90% SS304L walls. They were used to perform uniaxial
tension and uniaxial compression tests, as described in Chapter 5.
6.2.2. Multiaxial loading
Longitudinal plasticity specimens, as described in Chapter 5, were also extracted from
the 80% and 90% SS304L walls for multiaxial loading tests. A biaxial loading angle, β, is
defined as:
tanβ = Fv
Fh (6.1)
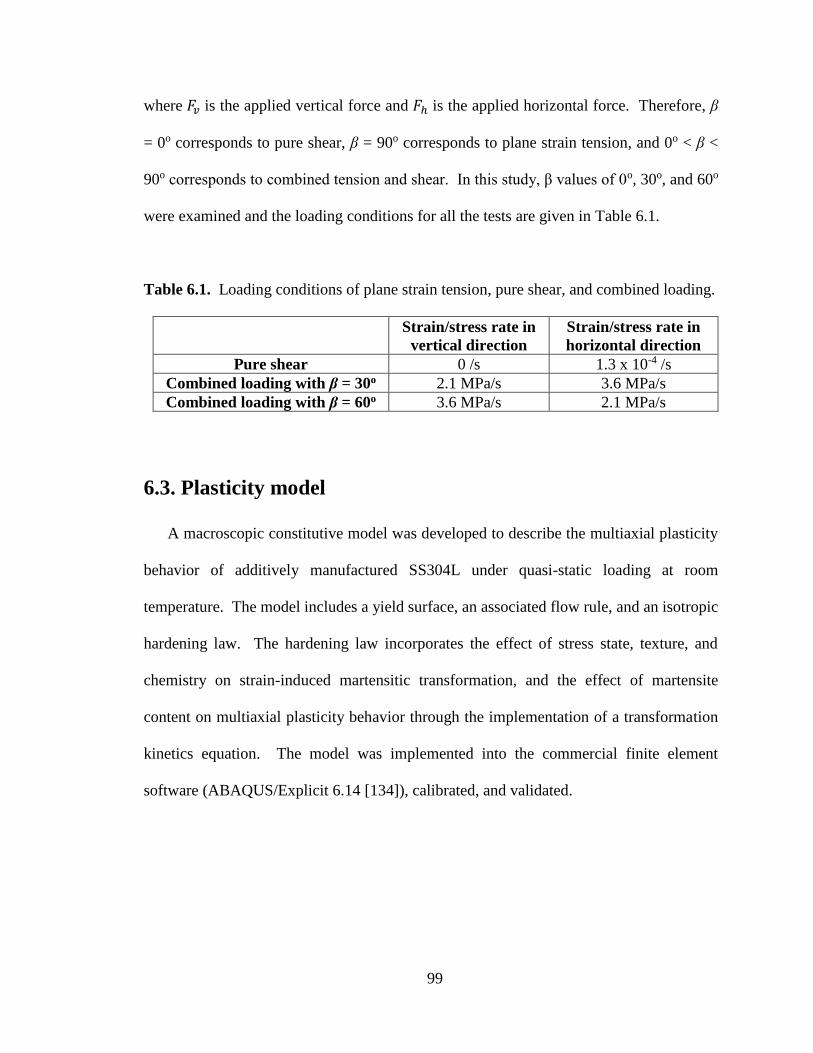
99
where 𝐹𝑣 is the applied vertical force and 𝐹ℎ is the applied horizontal force. Therefore, β
= 0o corresponds to pure shear, β = 90o corresponds to plane strain tension, and 0o < β <
90o corresponds to combined tension and shear. In this study, β values of 0o, 30o, and 60o
were examined and the loading conditions for all the tests are given in Table 6.1.
Table 6.1. Loading conditions of plane strain tension, pure shear, and combined loading.
Strain/stress rate in
vertical direction
Strain/stress rate in
horizontal direction
Pure shear 0 /s 1.3 x 10⁻⁴ /s
Combined loading with β = 30o 2.1 MPa/s 3.6 MPa/s
Combined loading with β = 60o 3.6 MPa/s 2.1 MPa/s
6.3. Plasticity model
A macroscopic constitutive model was developed to describe the multiaxial plasticity
behavior of additively manufactured SS304L under quasi-static loading at room
temperature. The model includes a yield surface, an associated flow rule, and an isotropic
hardening law. The hardening law incorporates the effect of stress state, texture, and
chemistry on strain-induced martensitic transformation, and the effect of martensite
content on multiaxial plasticity behavior through the implementation of a transformation
kinetics equation. The model was implemented into the commercial finite element
software (ABAQUS/Explicit 6.14 [134]), calibrated, and validated.
100
6.3.1. Yield surface
The yield surface of a material is described as:
f = σ - k = 0 (6.2)
where σ is the equivalent stress and k is the flow stress.
As there was no clear anisotropy in yield strength in the additively manufactured
SS304L, as discussed in Chapters 3 and 4, the isotropic von Mises yield criterion was
adopted, and Eqn. (6.2) becomes:
σvM - k = 0 (6.3)
where σvM is the von Mises equivalent stress.
In the plane stress condition, there are no non-zero stresses in the z direction. The stress
tensor, σ, can be expressed by a stress vector, σ, as:
σ = {σL, σT, τ}T (6.4)
where σL and σT are normal stresses along the longitudinal (L) and transverse (T) directions,
as shown in Figure 5.1; 𝜏 is the in-plane shear stress.
Then the von Mises yield equivalent stress, 𝜎𝑣𝑀, as described in Eqn. (5.7) is simplified
as:
σvM = √σL2 - σLσT + σT
2 + 3τ (6.5)
6.3.2. Associated flow rule
An associated flow rule is used to describe the direction of plastic strain increment with
respect to the von Mises yield surface, which is given as:
d𝜺𝑃 = 𝑑𝜆𝜕��𝑣𝑀
𝜕𝝈 (6.6)
101
where dεP is the increment of plastic strain and dλ is the plastic multiplier.
6.3.3. Isotropic hardening law
An isotropic hardening law is selected to describe the increase in flow stress, k, as a
function of plastic strain during deformation. In SS304L, the strain hardening is due to
both dislocation interactions and strain-induced martensitic phase transformation. To
account for both of these effects, an isotropic hardening law is adopted from [53], and given
as:
𝑑𝑘 = 𝐻𝜀𝑑𝜀��𝑀𝑃 + 𝐻𝑐𝑑𝑐 (6.7)
where Hε and Hc are hardening moduli, dεvM P is the increment of von Mises equivalent
plastic strain, and dc is the increment of martensite volume fraction.
The first term in Eqn. (6.7) describes the strain hardening from dislocation pile up
during plastic deformation and is assumed to follow a Swift hardening law [178], as:
𝑘 = 𝐴(𝜀0 + 𝜀��𝑀𝑃 )𝑛 + 𝑘0 (6.8)
where A, ε0, m, and k0 are material parameters. As Eqn. (6.8) describes the strain hardening
only due to dislocation interactions, A, 𝜀0, n, and 𝑘0 are assumed to be the same for the two
walls with different chemistries.
The second term in Eqn. (6.7) describes the strain hardening due to the increase of
martensite content. As the amount of martensite transformed as a function of plastic strain
is influenced by chemistry, the hardening modulus, Hc, is assumed to be chemistry
dependent, and therefore, varies between the 80% and 90% SS304L walls.
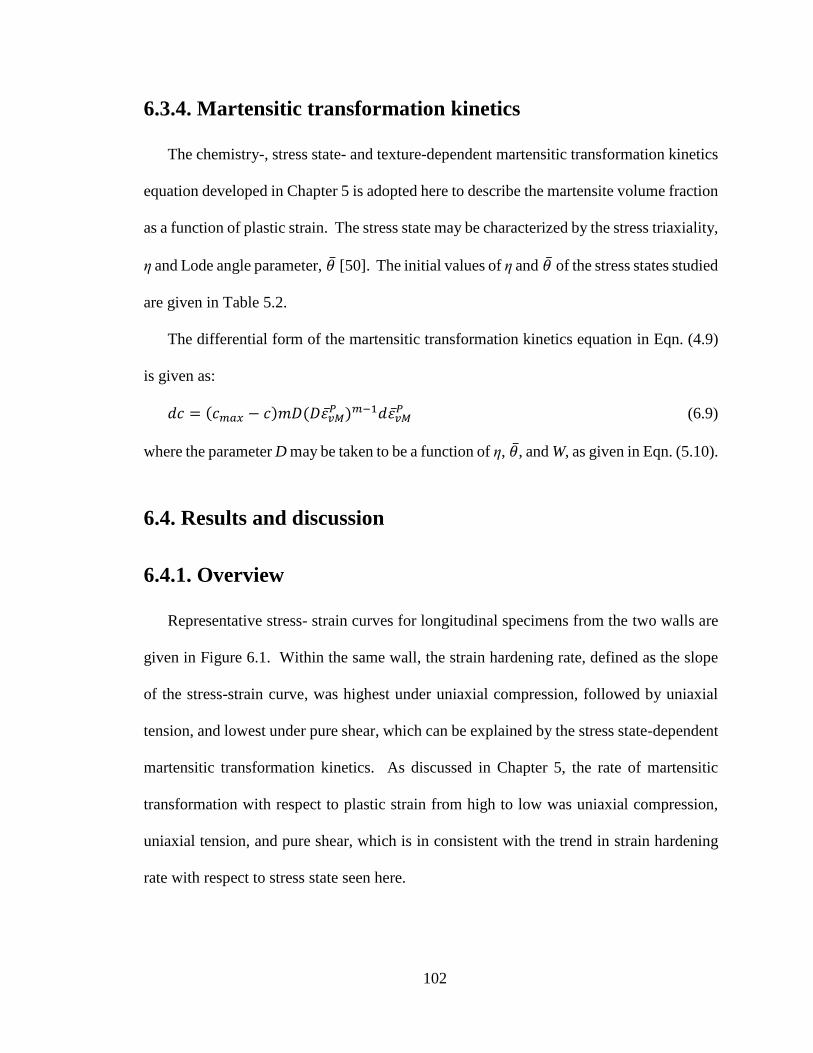
102
6.3.4. Martensitic transformation kinetics
The chemistry-, stress state- and texture-dependent martensitic transformation kinetics
equation developed in Chapter 5 is adopted here to describe the martensite volume fraction
as a function of plastic strain. The stress state may be characterized by the stress triaxiality,
η and Lode angle parameter, �� [50]. The initial values of η and �� of the stress states studied
are given in Table 5.2.
The differential form of the martensitic transformation kinetics equation in Eqn. (4.9)
is given as:
𝑑𝑐 = (𝑐𝑚𝑎𝑥 − 𝑐)𝑚𝐷(𝐷𝜀��𝑀𝑃 )𝑚−1𝑑𝜀��𝑀
𝑃 (6.9)
where the parameter D may be taken to be a function of η, ��, and W, as given in Eqn. (5.10).
6.4. Results and discussion
6.4.1. Overview
Representative stress- strain curves for longitudinal specimens from the two walls are
given in Figure 6.1. Within the same wall, the strain hardening rate, defined as the slope
of the stress-strain curve, was highest under uniaxial compression, followed by uniaxial
tension, and lowest under pure shear, which can be explained by the stress state-dependent
martensitic transformation kinetics. As discussed in Chapter 5, the rate of martensitic
transformation with respect to plastic strain from high to low was uniaxial compression,
uniaxial tension, and pure shear, which is in consistent with the trend in strain hardening
rate with respect to stress state seen here.
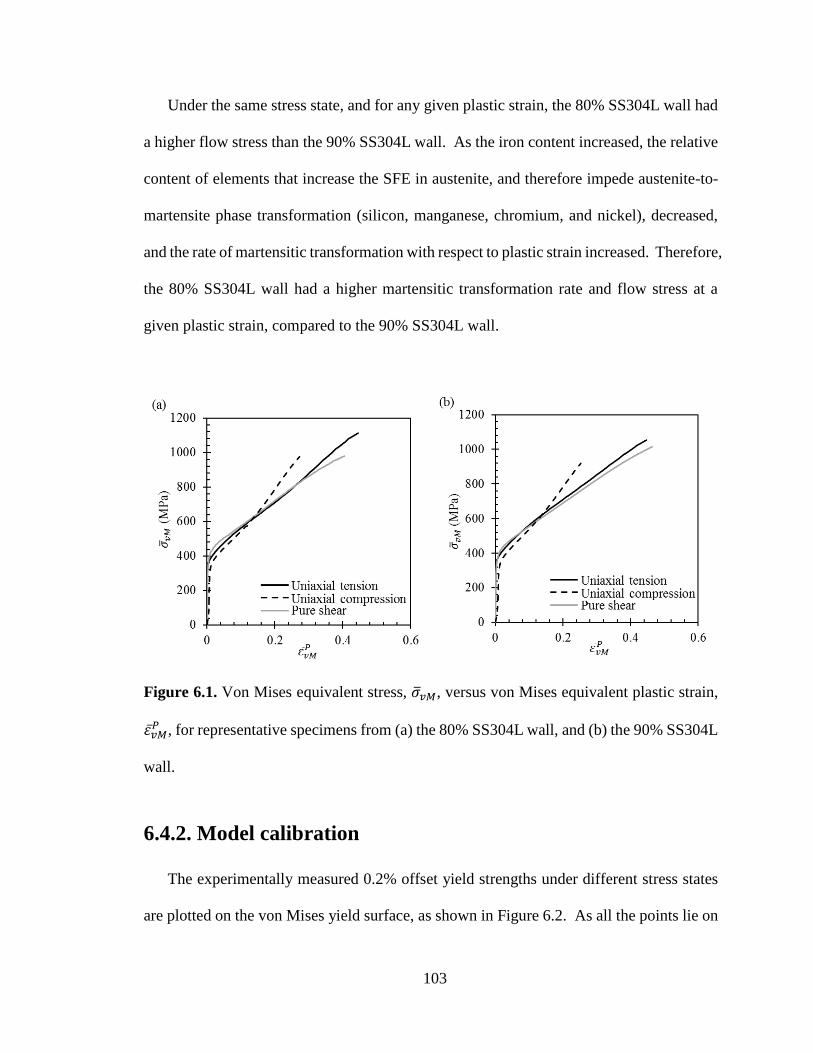
103
Under the same stress state, and for any given plastic strain, the 80% SS304L wall had
a higher flow stress than the 90% SS304L wall. As the iron content increased, the relative
content of elements that increase the SFE in austenite, and therefore impede austenite-to-
martensite phase transformation (silicon, manganese, chromium, and nickel), decreased,
and the rate of martensitic transformation with respect to plastic strain increased. Therefore,
the 80% SS304L wall had a higher martensitic transformation rate and flow stress at a
given plastic strain, compared to the 90% SS304L wall.
Figure 6.1. Von Mises equivalent stress, 𝜎𝑣𝑀, versus von Mises equivalent plastic strain,
𝜀��𝑀𝑃 , for representative specimens from (a) the 80% SS304L wall, and (b) the 90% SS304L
wall.
6.4.2. Model calibration
The experimentally measured 0.2% offset yield strengths under different stress states
are plotted on the von Mises yield surface, as shown in Figure 6.2. As all the points lie on
104
or close to the yield surface, the von Mises yield criterion is sufficient to describe the
yielding of the walls studied.
The plasticity model was implemented into a commercial finite element code
(ABAQUS/Explicit 6.14 [134]). A shell element (type S4R) with a side length of 1 mm
and a thickness of 1.5 mm was used to represent the gauge center of each specimen. The
martensitic transformation kinetics equation parameters (𝑐𝑚𝑎𝑥 , m, 𝐷0 , 𝑎𝜂 , 𝑎𝜃 , and 𝑎𝑊)
were calibrated for the 80% and 90% SS304L walls in Chapter 5. The remaining model
parameters that required identification were the strain hardening parameters
( 𝐴, 𝜀0, 𝑛, 𝑘0, and 𝐻𝑐 ). These parameters were first estimated using experimentally
measured true stress-plastic strain curves from uniaxial tension, and a range defined as 0.5
x estimated value to 1.5 x estimated value was assigned to each parameter. For calibration,
over 1000 simulations were performed with varying model inputs. For each simulation, a
set of parameters si = {A, 𝜀0, 𝑛, 𝑘0, and 𝐻𝑐 }, each within their prescribed range, was
randomly selected based on the assumption of a uniform value distribution within each
range. Using these parameters, the stress, 𝜎𝑠𝑖𝑚,𝑗(𝑠𝑖) , was computed for a given
experimentally studied strain history, where j is the number of stress states used for model
calibration. A cost function was evaluated for each set of parameters, defined as:
𝜒(𝑠𝑖) = ∑ |𝜎𝑠𝑖𝑚,𝑗(𝑠𝑖)−𝜎𝑒𝑥𝑝,𝑗
𝜎𝑒𝑥𝑝,𝑗|𝐽
𝑗=1 (6.10)
where 𝜎𝑒𝑥𝑝,𝑗 is the experimentally measured engineering stress. The optimized set of
model parameters was chosen to minimize 𝜒.
In the present study, experimental data from uniaxial tension, uniaxial compression,
and pure shear from the two walls were used for model calibration, giving J = 6. The
calibrated model parameters are given in Table 6.2.
105
Figure 6.2. Engineering yield stress in the transverse direction, σT, versus engineering
yield stress in the longitudinal direction, σL in the (a) 80% SS304L wall, and (b) 90%
SS304L wall. The von Mises yield surface, based on uniaxial tension in the longitudinal
direction, is also drawn. The symbols represent experimentally measured yield points
under the stress states studied.
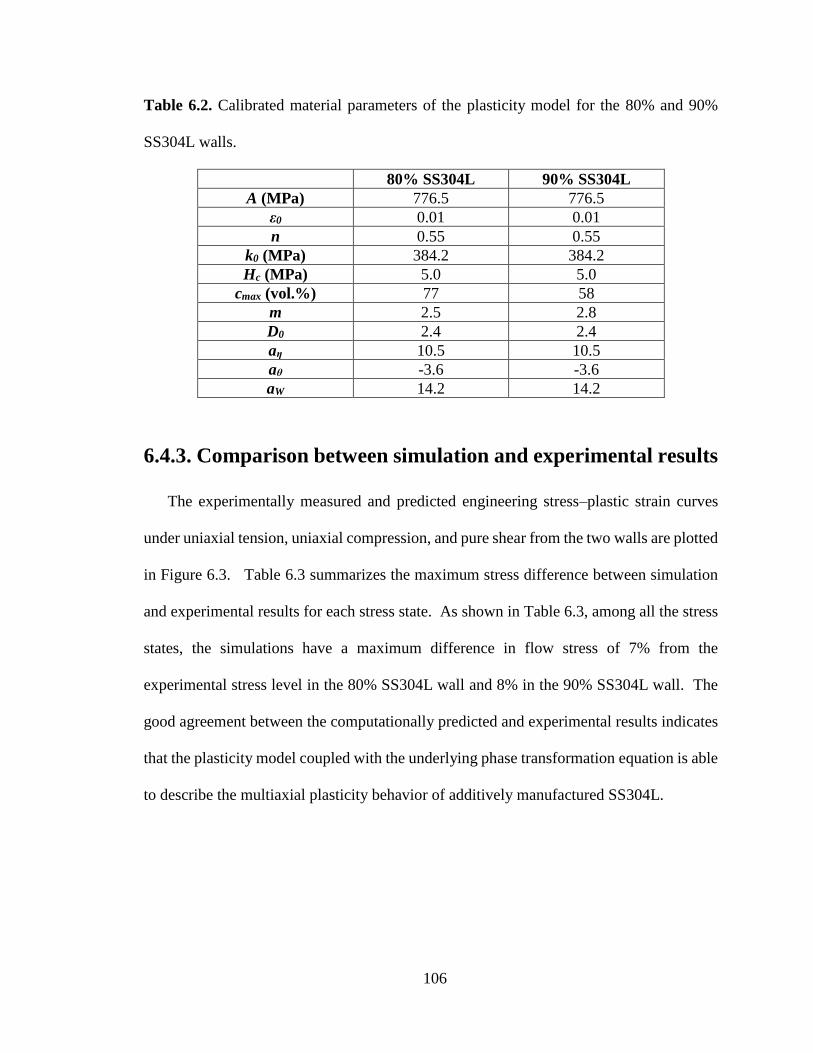
106
Table 6.2. Calibrated material parameters of the plasticity model for the 80% and 90%
SS304L walls.
80% SS304L 90% SS304L
A (MPa) 776.5 776.5
ε0 0.01 0.01
n 0.55 0.55
k0 (MPa) 384.2 384.2
Hc (MPa) 5.0 5.0
cmax (vol.%) 77 58
m 2.5 2.8
D0 2.4 2.4
aη 10.5 10.5
aθ -3.6 -3.6
aW 14.2 14.2
6.4.3. Comparison between simulation and experimental results
The experimentally measured and predicted engineering stress–plastic strain curves
under uniaxial tension, uniaxial compression, and pure shear from the two walls are plotted
in Figure 6.3. Table 6.3 summarizes the maximum stress difference between simulation
and experimental results for each stress state. As shown in Table 6.3, among all the stress
states, the simulations have a maximum difference in flow stress of 7% from the
experimental stress level in the 80% SS304L wall and 8% in the 90% SS304L wall. The
good agreement between the computationally predicted and experimental results indicates
that the plasticity model coupled with the underlying phase transformation equation is able
to describe the multiaxial plasticity behavior of additively manufactured SS304L.
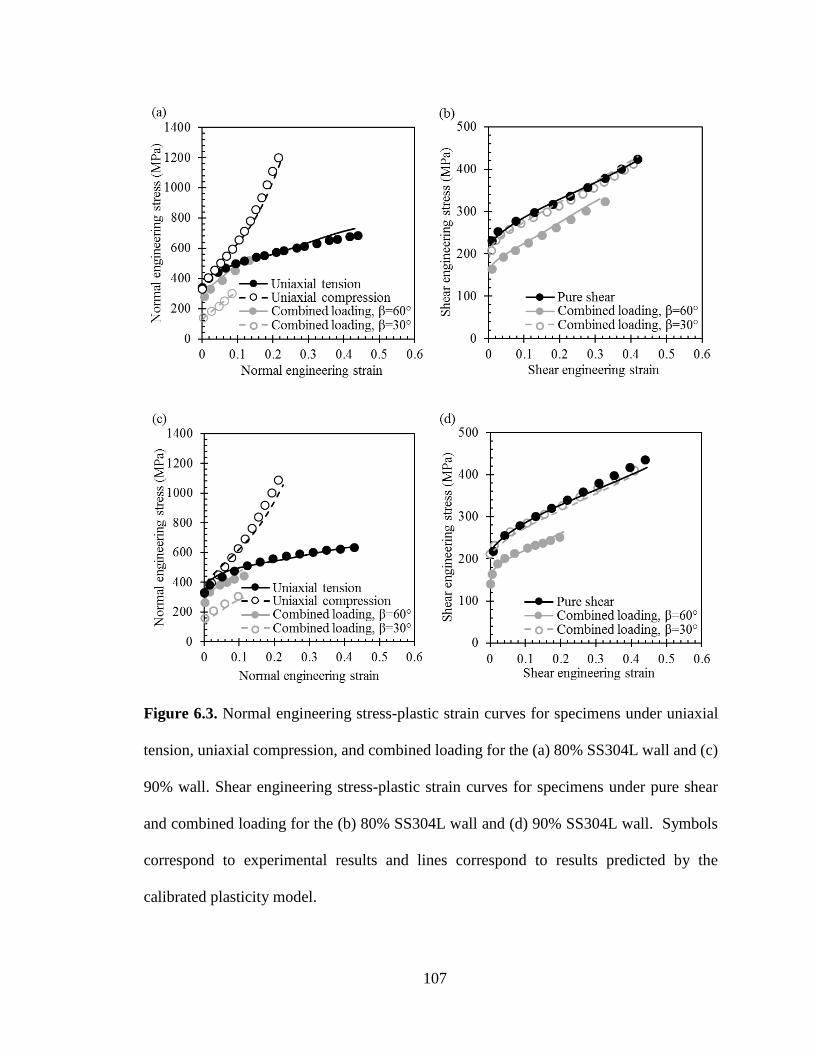
107
Figure 6.3. Normal engineering stress-plastic strain curves for specimens under uniaxial
tension, uniaxial compression, and combined loading for the (a) 80% SS304L wall and (c)
90% wall. Shear engineering stress-plastic strain curves for specimens under pure shear
and combined loading for the (b) 80% SS304L wall and (d) 90% SS304L wall. Symbols
correspond to experimental results and lines correspond to results predicted by the
calibrated plasticity model.
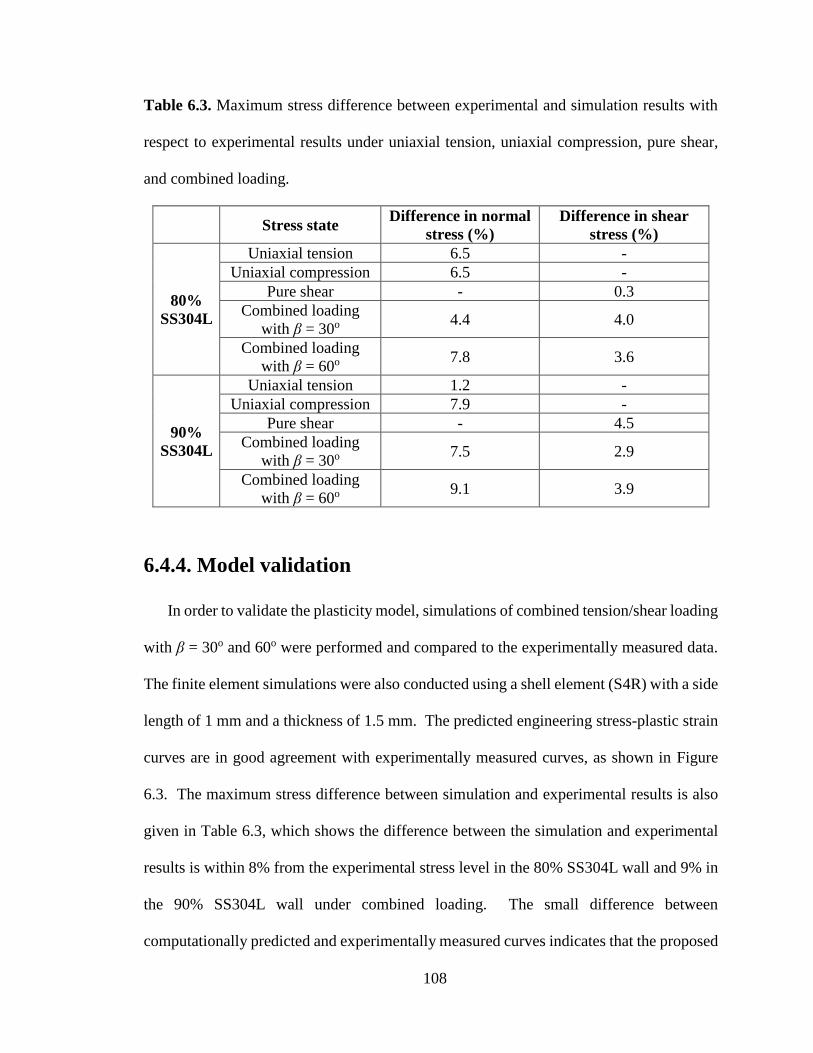
108
Table 6.3. Maximum stress difference between experimental and simulation results with
respect to experimental results under uniaxial tension, uniaxial compression, pure shear,
and combined loading.
Stress state Difference in normal
stress (%)
Difference in shear
stress (%)
80%
SS304L
Uniaxial tension 6.5 -
Uniaxial compression 6.5 -
Pure shear - 0.3
Combined loading
with β = 30o 4.4 4.0
Combined loading
with β = 60o 7.8 3.6
90%
SS304L
Uniaxial tension 1.2 -
Uniaxial compression 7.9 -
Pure shear - 4.5
Combined loading
with β = 30o 7.5 2.9
Combined loading
with β = 60o 9.1 3.9
6.4.4. Model validation
In order to validate the plasticity model, simulations of combined tension/shear loading
with β = 30o and 60o were performed and compared to the experimentally measured data.
The finite element simulations were also conducted using a shell element (S4R) with a side
length of 1 mm and a thickness of 1.5 mm. The predicted engineering stress-plastic strain
curves are in good agreement with experimentally measured curves, as shown in Figure
6.3. The maximum stress difference between simulation and experimental results is also
given in Table 6.3, which shows the difference between the simulation and experimental
results is within 8% from the experimental stress level in the 80% SS304L wall and 9% in
the 90% SS304L wall under combined loading. The small difference between
computationally predicted and experimentally measured curves indicates that the proposed
109
plasticity model is able to predict the mechanical behavior of additively manufactured
SS304L under multiaxial stress states.
6.5. Summary and conclusions
Two SS304L walls with different chemical compositions were fabricated by DED AM
and subjected to a range of stress states to investigate the multiaxial plasticity behavior of
these materials. Based on the experimental observations, a macroscopic plasticity model
is proposed for the materials. The primary findings of this study are as follows:
• The plasticity behavior of additively manufactured SS304L walls depends on stress
state and chemistry. In a single wall subjected to multiaxial stress states, the strain
hardening rate (at a given plastic strain) was highest in uniaxial compression, lowest in
pure shear, and intermediate in uniaxial tension. In the two walls under the same stress
state, the wall with lower stacking fault energy, and therefore, austenite stability, due
to higher iron content, had a higher rate of martensitic transformation and flow stress
at a given plastic strain.
• A plasticity model consisting of a von Mises yield surface, an associated flow rule, and
an isotropic hardening law coupled with a stress state-, texture-, and chemistry-
dependent martensitic transformation kinetics equation is able to describe and predict
the constitutive behavior of additively manufactured SS304L under multiaxial stress
states.
110
Acknowledgments
The authors gratefully acknowledge the financial support provided by the National
Science Foundation through award number CMMI-1402978 and CMMI-1652575. Any
opinions, findings, and conclusions or recommendations in the materials are those of the
authors and do not necessarily reflect the views of the Nation Science Foundation. Samples
were fabricated at Penn State’s Center for Innovation Materials Processing through Direct
Digital Deposition (CIMP-3D). We acknowledge Dr. Dong Ma of ORNL for performing
uniaxial compression tests.
111
Chapter 7
Summary and future work
7.1. Summary and conclusions
The objectives of this thesis were to:
• Investigate process-microstructure-multiaxial mechanical property
relationships in 304L austenitic stainless steel made by directed energy
deposition additive manufacturing, and
• Develop a physically-based macroscopic plasticity model that relates
microstructural phase transformation to macroscopic multiaxial properties.
The effect of processing parameters on microstructure and mechanical properties was
elucidated using two pure SS304L walls that were built using different linear heat inputs.
Due to the high nitrogen content in the pre-alloyed SS304L powder, austenite-to-martensite
phase transformation did not occur in the pure SS304L walls. In each wall, as heat was
retained in the wall during AM, it was postulated that the cooling rate decreased as the
distance from the substrate increased, resulting in an increase in the average austenite grain
size, and therefore, decreases in the yield and ultimate tensile strengths. At the same
location, the wall fabricated using lower heat input would have had a smaller melt pool,
and therefore, higher thermal gradient and higher cooling rate. This presumed difference
in thermal history resulted in a smaller average grain size, and therefore higher yield and
ultimate tensile strengths, in the wall with made using the lower linear heat input compared
to the wall using higher heat input. A grain growth model adopted from welding was used
to quantitatively describe austenite grain size as a function of linear heat input and location.
112
A Hall-Petch relation, and a consideration of grain morphology and orientation, was used
to quantitatively link austenite grain size with location-dependent yield strength.
The effect of chemistry, namely initial powder chemistry and spatial chemical
variations due to elemental vaporization, on martensitic transformation and mechanical
properties was investigated using two walls deposited from a mixture of SS304L powder
and iron powder. The iron-SS304L walls had higher ultimate tensile strengths and ductility
than the pure SS304L walls due to the presence of martensitic phase transformation. In
each iron-SS304L wall, the concentration of elements that increase the stacking fault
energy of austenite decreased as the distance from the substrate increased due to
vaporization. Therefore, austenite stability decreased and martensitic transformation
increased as the distance from the substrate increased, resulting in an increase in ultimate
tensile strength. A chemistry-dependent martensitic transformation kinetics equation that
describes martensite content with respect to plastic strain was proposed and calibrated. The
rate of martensitic transformation with respect to plastic strain, and the saturation value of
martensite content increased, as the concentration of elements that increase the stacking
fault energy of austenite decreased.
The effect of stress state and texture on strain-induced martensitic phase transformation
was also investigated using additively manufactured SS304L with different chemistries
loaded under uniaxial tension, uniaxial compression, and pure shear. The rate of phase
transformation with respect to plastic strain from high to low was: uniaxial compression,
uniaxial tension, and pure shear, which contradicts the findings in texture-free austenitic
stainless steels. The trend in the additively manufactured material is the initial texture in
the material facilitated martensitic transformation under uniaxial compression, or
113
conversely, texture impeded transformation under uniaxial tension. A stress state- and
texture-dependent transformation kinetics equation was developed and calibrated for
additively manufactured SS304L.
Based on the understanding of process-microstructure-multiaxial mechanical property
relationships, a physically-based macroscopic plasticity model is developed for additively
manufactured SS304L with different chemistries under multiaxial stress states. The
plasticity model makes use of a von Mises yield surface, an associated flow rule, and an
isotropic hardening law. The effect of chemistry, stress state, and texture on martensitic
transformation, and the effect of martensitic transformation on mechanical behavior were
incorporated in the hardening law through the martensitic transformation kinetics equation.
The plasticity model was implemented into a finite element code for calibration and
validation. The simulated stress-strain curves were in good agreement with experimentally
measured curves, indicating the plasticity model can be used to describe and predict the
multiaxial mechanical behavior for additively manufactured SS304L.
7.2. Future work
The multiaxial mechanical behavior of additively manufactured SS304L is
systematically investigated through experimental and computational approaches in the
thesis. The proposed plasticity model is the foundation for a multiaxial fracture model, as
plastic deformation is followed by fracture. In order to understand the fracture behavior of
additively manufactured SS304L, further research includes performing multiaxial fracture
experiments to characterize the fracture properties under multiaxial stress states,

114
determining strain to failure under each stress state through finite element analysis, and
developing a multiaxial fracture model.
115
Appendix
Published papers during Ph.D. study
Z. Wang, T. A. Palmer, and A. M. Beese, “Effect of processing parameters on
microstructure and tensile properties of austenitic stainless steel 304L made by directed
energy deposition additive manufacturing,” Acta Mater., vol. 110, pp. 226–235, 2016.
Z. Wang, A. D. Stoica, D. Ma, and A. M. Beese, “Diffraction and single-crystal elastic
constants of Inconel 625 at room and elevated temperatures determined by neutron
diffraction,” Mater. Sci. Eng. A, vol. 674, pp. 406–412, 2016.
Z. Wang and A. M. Beese, “Effect of chemistry on martensitic phase transformation
kinetics and resulting properties of additively manufactured stainless steel,” Acta Mater.,
vol. 131, pp. 410–422, 2017.
Z. Wang, E. Denlinger, P. Michaleris, A. D. Stoica, D. Ma, and A. M. Beese, “Residual
stress mapping in Inconel 625 fabricated through additive manufacturing: Method for
neutron diffraction measurements to validate thermomechanical model predictions,”
Mater. Des., vol. 113, pp. 169–177, 2017.
D. Ma, A. D. Stoica, Z. Wang, and A. M. Beese, “Crystallographic texture in an additively
manufactured nickel-base superalloy,” Mater. Sci. Eng. A, vol. 684, pp. 47–53, 2017.
A. E. Wilson-Heid, Z. Wang, B. McCornac, and A. M. Beese, “Quantitative relationship
between anisotropic strain to failure and grain morphology in additively manufactured
Ti-6Al-4V,” Mater. Sci. Eng. A, vol. 706, pp. 287–294, 2017.
Z. Wang, A. D. Stoica, D. Ma, and A. M. Beese, “Stress relaxation behavior and
mechanisms in Ti-6Al-4V determined via in situ neutron diffraction: Application to
additive manufacturing,” Mater. Sci. Eng. A, vol. 707, pp. 585–592, 2017.
116
Z. Wang, A. D. Stoica, D. Ma, and A. M. Beese, “Stress relaxation in a nickel-base
superalloy at elevated temperatures via in situ neutron diffraction characterization:
application to additive manufacturing,” Mater. Sci. Eng. A, vol. 714, pp. 75–83, 2018.
Z. Wang and A. M. Beese, “Effect of stress state and texture on martensitic phase
transformation kinetics of additively manufactured austenitic stainless steel,” Submitted
for publication.
Z. Wang and A. M. Beese, “Plasticity model coupled with strain-induced martensitic
transformation kinetics for austenitic stainless steel deposited by additive
manufacturing,” Submitted for publication.
A. M. Beese, Z. Wang, A. D. Stoica, and D. Ma, “Absence of dynamic strain aging in an
additively manufactured nickel-base superalloy,” Submitted for publication.
117
Bibliography
[1] W. J. Sames, F. A. List, S. Pannala, R. R. Dehoff, and S. S. Babu, “The metallurgy
and processing science of metal additive manufacturing,” Int. Mater. Rev., pp. 1–46,
2016.
[2] Z. Wang, T. A. Palmer, and A. M. Beese, “Effect of processing parameters on
microstructure and tensile properties of austenitic stainless steel 304L made by
directed energy deposition additive manufacturing,” Acta Mater., vol. 110, pp. 226–
235, 2016.
[3] D. D. Gu, W. Meiners, K. Wissenbach, and R. Poprawe, “Laser additive
manufacturing of metallic components: materials, processes and mechanisms,” Int.
Mater. Rev., vol. 57, no. 3, pp. 133–164, 2012.
[4] J. Yu, M. Rombouts, and G. Maes, “Cracking behavior and mechanical properties
of austenitic stainless steel parts produced by laser metal deposition,” Mater. Des.,
vol. 45, pp. 228–235, 2013.
[5] S. Das, J. J. Beama, M. Wohlert, and D. L. Bourell, “Direct laser freeform
fabrication of high performance metal components,” Rapid Prototyp. J., vol. 4, no.
3, pp. 112–117, 1998.
[6] D. D. Gu, W. Meiners, K. Wissenbach, and R. Poprawe, “Laser additive
manufacturing of metallic components: materials, processes and mechanisms,” Int.
Mater. Rev., vol. 57, no. 3, pp. 133–164, 2012.
[7] W. Gao, Y. Zhang, D. Ramanujan, K. Ramani, Y. Chen, C. B. Williams, C. C. L.
Wang, Y. C. Shin, S. Zhang, and P. D. Zavattieri, “The status, challenges, and future
of additive manufacturing in engineering,” Comput. Des., vol. 69, pp. 65–89, 2015.
118
[8] B. E. Carroll, T. A. Palmer, and A. M. Beese, “Anisotropic tensile behavior of Ti–
6Al–4V components fabricated with directed energy deposition additive
manufacturing,” Acta Mater., vol. 87, pp. 309–320, 2015.
[9] P. Edwards and M. Ramulu, “Fatigue performance evaluation of selective laser
melted Ti-6Al-4V,” Mater. Sci. Eng. A, vol. 598, pp. 327–337, 2014.
[10] L. Thijs, F. Verhaeghe, T. Craeghs, J. Van Humbeeck, and J.-P. Kruth, “A study of
the microstructural evolution during selective laser melting of Ti–6Al–4V,” Acta
Mater., vol. 58, no. 9, pp. 3303–3312, 2010.
[11] A. M. Beese and B. E. Carroll, “Review of Mechanical Properties of Ti-6Al-4V
Made by Laser- Based Additive Manufacturing Using Powder Feedstock,” JOM,
vol. 68, no. 3, pp. 724–734, 2016.
[12] A. Mertens, S. Reginster, H. Paydas, Q. Contrepois, T. Dormal, O. Lemaire, and J.
Lecomte-Beckers, “Mechanical properties of alloy Ti–6Al–4V and of stainless steel
316L processed by selective laser melting: influence of out-of-equilibrium
microstructures,” Powder Metall., vol. 57, no. 3, pp. 184–189, Jul. 2014.
[13] P. a. Kobryn and S. L. Semiatin, “Mechanical Properties of Laser-Deposited Ti-6Al-
4V,” Solid Free. Fabr. Proc., pp. 6–8, 2001.
[14] H. Gong, K. Rafi, H. Gu, T. Starr, and B. Stucker, “Analysis of defect generation in
Ti–6Al–4V parts made using powder bed fusion additive manufacturing processes,”
Addit. Manuf., vol. 1–4, pp. 87–98, Oct. 2014.
[15] Z. Wang, A. D. Stoica, D. Ma, and A. M. Beese, “Stress relaxation behavior and
mechanisms in Ti-6Al-4V determined via in situ neutron diffraction: Application to
additive manufacturing,” Mater. Sci. Eng. A, vol. 707, pp. 585–592, 2017.
119
[16] A. E. Wilson-Heid, Z. Wang, B. McCornac, and A. M. Beese, “Quantitative
relationship between anisotropic strain to failure and grain morphology in additively
manufactured Ti-6Al-4V,” Mater. Sci. Eng. A, vol. 706, pp. 287–294, 2017.
[17] M. L. Griffith, D. M. Keicher, C. L. Atwood, J. A. Romero, E. Smugeresky, L. D.
Harwell, and D. L. Greene, “Free Form Fabrication of Metallic Components Using
Laser Engineered Net Shaping (LENS),” Proc. Solid Free. Fabr. Symp., pp. 125–
132, 1996.
[18] Y. Xue, A. Pascu, M. F. Horstemeyer, L. Wang, and P. T. Wang, “Microporosity
effects on cyclic plasticity and fatigue of LENSTM-processed steel,” Acta Mater.,
vol. 58, pp. 4029–4038, 2010.
[19] K. Zhang, S. Wang, W. Liu, and X. Shang, “Characterization of stainless steel parts
by Laser Metal Deposition Shaping,” Mater. Des., vol. 55, pp. 104–119, 2014.
[20] J. Li, D. Deng, X. Hou, X. Wang, and G. Ma, “Microstructure and performance
optimisation of stainless steel formed by laser additive manufacturing,” Mater. Sci.
Technol., pp. 1–8, 2016.
[21] M. Ziętala, T. Durejko, M. Polański, I. Kunce, T. Płociński, W. Zieliński, M.
Łazińska, W. Stępniowski, T. Czujko, K. J. Kurzydłowski, and Z. Bojar, “The
microstructure, mechanical properties and corrosion resistance of 316L stainless
steel fabricated using laser engineered net shaping,” Mater. Sci. Eng. A, vol. 677,
pp. 1–10, 2016.
[22] K. Guan, Z. Wang, M. Gao, X. Li, and X. Zeng, “Effects of processing parameters
on tensile properties of selective laser melted 304 stainless steel,” Mater. Des., vol.
50, pp. 581–586, 2013.
120
[23] B. Zhang, L. Dembinski, and C. Coddet, “The study of the laser parameters and
environment variables effect on mechanical properties of high compact parts
elaborated by selective laser melting 316L powder,” Mater. Sci. Eng. A, vol. 584,
pp. 21–31, 2013.
[24] F. Ning and W. Cong, “Microstructures and mechanical properties of Fe-Cr stainless
steel parts fabricated by ultrasonic vibration-assisted laser engineered net shaping
process,” Mater. Lett., vol. 179, pp. 61–64, 2016.
[25] T. LeBrun, T. Nakamoto, K. Horikawa, and H. Kobayashi, “Effect of Retained
Austenite on Subsequent Thermal Processing and Resultant Mechanical Properties
of Selective Laser Melted 17-4 PH Stainless Steel,” Mater. Des., vol. 81, pp. 44–53,
2015.
[26] A. Yadollahi, N. Shamsaei, S. M. Thompson, A. Elwany, and L. Bian, “Mechanical
and Microstructural Properties of Selective Laser Melted 17-4 PH Stainless Steel,”
Proc. ASME 2015 Int. Mech. Eng. Congr. Expo., pp. 1–7, 2015.
[27] E. Brandl, U. Heckenberger, V. Holzinger, and D. Buchbinder, “Additive
manufactured AlSi10Mg samples using Selective Laser Melting (SLM):
Microstructure, high cycle fatigue, and fracture behavior,” Mater. Des., vol. 34, pp.
159–169, 2012.
[28] K. Kempen, L. Thijs, J. Van Humbeeck, and J.-P. Kruth, “Processing AlSi10Mg by
selective laser melting: parameter optimisation and material characterisation,”
Mater. Sci. Technol., vol. 31, no. 8, pp. 917–923, 2015.
[29] K. Kempen, L. Thijs, J. Van Humbeeck, and J. P. Kruth, “Mechanical Properties of
AlSi10Mg Produced by Selective Laser Melting,” Phys. Procedia, vol. 39, pp. 439–
121
446, 2012.
[30] M. Javidani, J. Arreguin-Zavala, J. Danovitch, Y. Tian, and M. Brochu, “Additive
Manufacturing of AlSi10Mg Alloy Using Direct Energy Deposition: Microstructure
and Hardness Characterization,” J. Therm. Spray Technol., vol. 26, no. 4, pp. 587–
597, 2017.
[31] N. T. Aboulkhair, N. M. Everitt, I. Ashcroft, and C. Tuck, “Reducing porosity in
AlSi10Mg parts processed by selective laser melting,” Addit. Manuf., vol. 1, pp. 77–
86, 2014.
[32] B. Vandenbroucke and J.-P. Kruth, “Selective laser melting of biocompatible metals
for rapid manufacturing of medical parts,” Rapid Prototyp. J., vol. 13, no. 4, pp.
196–203, 2007.
[33] X.-Z. Xin, N. Xiang, J. Chen, D. Xu, and B. Wei, “Corrosion Characteristics of a
Selective Laser Melted Co–Cr Dental Alloy under Physiological Conditions,” J.
Mater. Sci., vol. 47, pp. 4813–4820, 2012.
[34] F. Xu, Y. Lv, Y. Liu, B. Xu, and P. He, “Effect of heat treatment on microstructure
and mechanical properties of inconel 625 alloy fabricated by pulsed plasma arc
deposition,” Phys. Procedia, vol. 50, pp. 48–54, 2013.
[35] K. N. Amato, S. M. Gaytan, L. E. Murr, E. Martinez, P. W. Shindo, J. Hernandez,
S. Collins, and F. Medina, “Microstructures and mechanical behavior of Inconel 718
fabricated by selective laser melting,” Acta Mater., vol. 60, no. 5, pp. 2229–2239,
2012.
[36] Z. Wang, K. Guan, M. Gao, X. Li, X. Chen, and X. Zeng, “The microstructure and
mechanical properties of deposited-IN718 by selective laser melting,” J. Alloys
122
Compd., vol. 513, pp. 518–523, 2012.
[37] L. L. Parimi, G. Ravi, D. Clark, and M. M. Attallah, “Microstructural and texture
development in direct laser fabricated IN718,” Mater. Charact., vol. 89, pp. 102–
111, 2014.
[38] N. A. Kistler, A. R. Nassar, E. W. Reutzel, D. J. Corbin, and A. M. Beese, “Effect
of directed energy deposition processing parameters on laser deposited Inconel®
718: Microstructure, fusion zone morphology, and hardness,” J. Laser Appl., vol.
29, no. 2, p. 22005, 2017.
[39] J. F. Wang, Q. J. Sun, H. Wang, J. P. Liu, and J. C. Feng, “Effect of location on
microstructure and mechanical properties of additive layer manufactured Inconel
625 using gas tungsten arc welding,” Mater. Sci. Eng. A, vol. 676, pp. 395–405,
2016.
[40] X. Gong, X. Wang, V. Cole, Z. Jones, K. Cooper, and K. Chou, “Characterization
of microstructure and mechanical property of Inconel 718 from selective laser
melting,” in ASME 2015 International Manufacturing Science and Engineering
Conference, 2015, p. V001T02A061-V001T02A061.
[41] Z. Wang, E. Denlinger, P. Michaleris, A. D. Stoica, D. Ma, and A. M. Beese,
“Residual stress mapping in Inconel 625 fabricated through additive manufacturing:
Method for neutron diffraction measurements to validate thermomechanical model
predictions,” Mater. Des., vol. 113, pp. 169–177, 2017.
[42] Z. Wang, A. D. Stoica, D. Ma, and A. M. Beese, “Diffraction and single-crystal
elastic constants of Inconel 625 at room and elevated temperatures determined by
neutron diffraction,” Mater. Sci. Eng. A, vol. 674, pp. 406–412, 2016.
123
[43] Z. Wang, A. D. Stoica, D. Ma, and A. M. Beese, “Stress relaxation in a nickel-base
superalloy at elevated temperatures via in situ neutron diffraction characterization:
application to additive manufacturing,” Mater. Sci. Eng. A, vol. 714, pp. 75–83,
2018.
[44] D. Ma, A. D. Stoica, Z. Wang, and A. M. Beese, “Crystallographic texture in an
additively manufactured nickel-base superalloy,” Mater. Sci. Eng. A, vol. 684, pp.
47–53, 2017.
[45] F. Lecroise and A. Pineau, “Martensitic Transformations Induced By Plastic-
Deformation in Fe-Ni-Cr-C System,” Metall. Trans., vol. 3, pp. 387–396, 1972.
[46] T. Angel, “Formation of Martensite in Austenitic Stainless Steels, effect of
deformation, temperature and composition,” J. Iron Steel Inst., pp. 165–174, 1954.
[47] G. B. Olson and M. Cohen, “A mechanism for the strain-induced nucleation of
martensitic transformations,” J. Less- Common Met., vol. 28, pp. 107–118, 1972.
[48] R. G. Stringfellow, D. M. Parks, and G. B. Olson, “A constitutive model for
transformation plasticity accompanying strain-induced martensitic transformations
in metastable austenitic steels,” Acta Metall. Mater., vol. 40, no. 7, pp. 1703–1716,
1992.
[49] G. B. Olson and M. Cohen, “Kinetics of strain-induced martensitic nucleation,”
Metall. Trans. A, vol. 6, no. 3, pp. 791–795, 1975.
[50] A. M. Beese and D. Mohr, “Effect of stress triaxiality and Lode angle on the kinetics
of strain-induced austenite-to-martensite transformation,” Acta Mater., vol. 59, pp.
2589–2600, 2011.
[51] J. B. Leblond, “Mathematical modelling of transformation plasticity in steels II:
124
Coupling with strain hardening phenomena,” International Journal of Plasticity, vol.
5, no. 6. pp. 573–591, 1989.
[52] R. G. Stringfellow and D. M. Parks, “A self-consistent model of isotropic
viscoplastic behavior in multiphase materials,” Int. J. Plast., vol. 7, pp. 529–547,
1991.
[53] A. M. Beese and D. Mohr, “Anisotropic plasticity model coupled with Lode angle
dependent strain-induced transformation kinetics law,” J. Mech. Phys. Solids, vol.
60, pp. 1922–1940, 2012.
[54] G. W. Greenwood and R. H. John, “The deformation of metals under small stresses
during phase transformations,” Proc. R. Soc. Lond. A. Math. Phys. Sci., vol. 283, pp.
403–422, 1965.
[55] J. R. Patel and M. Cohen, “Criterion for the action of applied stress in the martensitic
transformation,” Acta Metall., vol. 1, pp. 531–538, 1953.
[56] M. F. McGuire, Stainless Steels for Design Engineers. Materials Park: ASM
International, 2008.
[57] T. DebRoy, H. L. Wei, J. S. Zuback, T. Mukherjee, J. W. Elmer, J. O. Milewski, A.
M. Beese, A. Wilson-Heid, A. De, and W. Zhang, “Additive manufacturing of
metallic components – Process, structure and properties,” Prog. Mater. Sci., vol. 92,
pp. 112–224, 2018.
[58] B. AlMangour and J. M. Yang, “Understanding the deformation behavior of 17-4
precipitate hardenable stainless steel produced by direct metal laser sintering using
micropillar compression and TEM,” Int. J. Adv. Manuf. Technol., vol. 90, pp. 119–
126, 2017.
125
[59] I. Tolosa, F. Garciandía, F. Zubiri, F. Zapirain, and A. Esnaola, “Study of
mechanical properties of AISI 316 stainless steel processed by ‘selective laser
melting’, following different manufacturing strategies,” Int. J. Adv. Manuf. Technol.,
vol. 51, pp. 639–647, Apr. 2010.
[60] M. L. Griffith, M. T. Ensz, J. D. Puskar, C. V. Robino, J. A. Brooks, J. A. Philliber,
E. Smugeresky, J. E. Smugeresky, and W. H. Hofmeister, “Understanding the
Microstructure and Properties of Components Fabricated by Laser Engineered Net
Shaping (LENS),” in Materials Research Society Symposium, 2000, vol. 625, pp. 9–
20.
[61] M. Ma, Z. Wang, D. Wang, and X. Zeng, “Control of shape and performance for
direct laser fabrication of precision large-scale metal parts with 316L Stainless Steel,”
Opt. Laser Technol., vol. 45, pp. 209–216, 2013.
[62] “ISO/ASTM 52900: Standard Terminology for Additive Manufacturing – General
Principles – Part 1: Terminology,” in ASTM International, West Conshohocken, PA,
2015, pp. 1–9.
[63] X. Wu, “A review of laser fabrication of metallic engineering components and of
materials,” Mater. Sci. Technol., vol. 23, no. 6, pp. 631–640, 2007.
[64] D. Bourell, J. P. Kruth, M. Leu, G. Levy, D. Rosen, A. M. Beese, and A. Clare,
“Materials for additive manufacturing,” CIRP Ann. - Manuf. Technol., vol. 66, pp.
659–681, 2017.
[65] J. W. Elmer, S. M. Allen, and T. W. Eagar, “Microstructural Development during
Solidification of Stainless Steel Alloys,” Metall. Trans. A, vol. 20A, no. 2117–2131,
1989.
126
[66] J. Talonen, “Effect of strain-induced α’-martensite transformation on mechanical
properties of metastable austenitic stainless steels,” Helsinki University of
Technology, 2007.
[67] L. Facchini, N. Vicente, I. Lonardelli, E. Magalini, P. Robotti, and M. Alberto,
“Metastable austenite in 17-4 precipitation-hardening stainless steel produced by
selective laser melting,” Adv. Eng. Mater., vol. 12, no. 3, pp. 184–188, 2010.
[68] K. Otsuka and C. M. Wayman, “Mechanism of shape memory effect and
superelasticity,” in Shape memory materials, 1st editio., K. Otsuka and C. M.
Wayman, Eds. 1999, pp. 36–44.
[69] G. W. Powell, E. R. Marshall, and W. A. Backofen, “Strain Hardening of Austenitic
Stainless Steel,” Trans. ASM, vol. 50, no. 1, pp. 478–497, 1958.
[70] T. Iwamoto, T. Tsuta, and Y. Tomita, “Investigation on deformation mode
dependence of strain-induced martensitic transformation in trip steels and modelling
of transformation kinetics,” Int. J. Mech. Sci., vol. 40, pp. 173–182, 1998.
[71] C. P. Livitsanos and P. F. Thomson, “The effect of temperature and deformation rate
on transformation-dependent ductility of a metastable austenitic stainless steel,”
Mater. Sci. Eng., vol. 30, pp. 93–98, 1977.
[72] S. S. Hecker, M. G. Stout, K. P. Staudhammer, and J. L. Smith, “Effects of Strain
State and Strain Rate on Deformation- Induced Transformation in 304 Stainless
Steel Part I . Magnetic Measurements and Mechanical Behavior,” Metall. Trans.,
vol. 13A, pp. 619–626, 1982.
[73] L. E. Murr, K. P. Staudhammer, and S. S. Hecker, “Effects of Strain State and Strain
Rate on Deformation-Induced Transformation in 304 Stainless Steel: Part I1.
127
Microstructural Study,” Metall. Trans. A, vol. 13A, pp. 627–635, 1982.
[74] J. Talonen, P. Nenonen, G. Pape, and H. Hänninen, “Effect of Strain Rate on the
Strain-Induced Austenite-Martensite Transformation and Mechanical Properties of
Austenitic Stainless Steels,” Metall. Mater. Trans. A, vol. 36, no. February, pp. 421–
432, 2005.
[75] K. P. Staudhammer, C. E. Frantz, S. S. Hecker, and L. E. Murr, “Effects of strain
rate on deformation-induced martensite in 304 stainless steel,” in Shock Waves and
high-strain-rate phenomena in metals, M. A. Meyers and L. E. Murr, Eds. Boston,
MA: Springer, 1981, pp. 91–112.
[76] W.-S. Lee and C.-F. Lin, “Comparative study of the impact response and
microstructure of 304L stainless steel with and without prestrain,” Metall. Mater.
Transations A, vol. 33, no. 9, pp. 2801–2810, 2002.
[77] W.-S. Lee and C.-F. Lin, “Impact properties and microstructure evolution of 304L
stainless steel,” Mater. Sci. Eng. A, vol. 308, no. 1–2, pp. 124–135, 2001.
[78] H. L. Wei, J. Mazumder, and T. DebRoy, “Evolution of solidification texture during
additive manufacturing,” Sci. Rep., vol. 5, pp. 1–7, 2015.
[79] A. Creuziger and T. Foecke, “Transformation potential predictions for the stress-
induced austenite to martensite transformation in steel,” Acta Mater., vol. 58, pp.
85–91, 2010.
[80] P. Hilkhuijsen, H. J. M. Geijselaers, T. C. Bor, E. S. Perdahcioǧlu, A. H. vd
Boogaard, and R. Akkerman, “Strain direction dependency of martensitic
transformation in austenitic stainless steels: The effect of γ-texture,” Mater. Sci. Eng.
A, vol. 573, pp. 100–105, 2013.
128
[81] P. Hilkhuijsen, H. J. M. Geijselaers, and T. C. Bor, “The influence of austenite
texture on the martensitic transformation of an austenitic stainless steel,” J. Alloys
Compd., vol. 577, pp. 609–613, 2013.
[82] D. De Knijf, T. Nguyen-Minh, R. H. Petrov, L. A. I. Kestens, and J. J. Jonas,
“Orientation dependence of the martensite transformation in a quenched and
partitioned steel subjected to uniaxial tension,” J. Appl. Crystallogr., vol. 47, pp.
1261–1266, 2014.
[83] K. Nohara, Y. Ono, and N. Ohashi, “Composition and Grain Size Dependencies of
Strain-induced Martensitic Transformation in Metastable Austenitic Stainless
Steels,” J. Iron Steel Inst. Japan, vol. 63, no. 5, pp. 212–222, 1977.
[84] S. K. Varma, J. Kalyanam, L. Murr, and V. Srinivas, “Effect of Grain Size on
Deformation-Induced Martensite Formation in 304 and 316 Stainless Steels During
Room Temperature Tensile Testing,” J. Mater. Sci. Lett., vol. 13, no. 2, pp. 107–
111, 1994.
[85] J. L. Gonzales, R. Aranda, and M. Jonapa, “The influence of grain size on the
kinetics of strain induced martensite in type 304 stainless steel,” in Applications of
Stainless Steel ’92, H. Nordberg and J. Bjorklund, Eds. Stockholm, Sweden, 1992,
pp. 1009–1016.
[86] “ASTM E112-13: Standard Test Methods for Determining Average Grain Size,” in
ASTM Standard, West Conshohocken, PA, 2013.
[87] V. Shrinivas, S. K. Varma, and L. E. Murr, “Deformation-induced martensitic
characteristics in 304 and 316 stainless steels during room-temperature rolling,”
Metall. Mater. Trans. A, vol. 26, no. 3, pp. 661–671, 1995.
129
[88] ASTM, “ASTM A479/A479M: Standard Specification for Stainless Steel Bars and
Shapes for Use in Boilers and Other Pressure Vessels,” in ASTM International, West
Conshohocken, PA, 2018.
[89] “ASTM E1019: Standard Test Methods for Determination of Carbon , Sulfur ,
Nitrogen , and Oxygen in Steel and in Iron , Nickel , and Cobalt Alloys by Various
Combusition and Fusion Techniques,” in ASTM International, West Conshohocken,
PA, 2015, pp. 1–28.
[90] “ASTM E1086: Standard Test Method for Analysis of austenitic Stainless Steel by
Spark Atomic Emission Spectrometry,” in ASTM International, West
Conshohocken, PA, 2015, pp. 1–5.
[91] ASTM, “ASTM Standard E8/E8M-16a: Standard Test Methods for Tension Test of
Metallic Materials,” in ASTM International, West Conshohocken, PA, 2016.
[92] M. S. F. de Lima and S. Sankaré, “Microstructure and mechanical behavior of laser
additive manufactured AISI 316 stainless steel stringers,” Mater. Des., vol. 55, pp.
526–532, 2014.
[93] G. Ziółkowski, E. Chlebus, P. Szymczyk, and J. Kurzac, “Application of X-ray CT
method for discontinuity and porosity detection in 316L stainless steel parts
produced with SLM technology,” Arch. Civ. Mech. Eng., pp. 1–7, 2014.
[94] J. A. Slotwinski, E. J. Garboczi, and K. M. Hebenstreit, “Porosity Measurements
and Analysis for Metal Additive Manufacturing Process Control,” J. Res. Natl. Inst.
Stand. Technol., vol. 119, p. 494, 2014.
[95] W. Staib and D. I. H. Kunzel, “In-situ Ferrite Content Measurement of Duplex Steel
Structures in the Chemical Industry. Practical Applications of the Alternating Field,
130
Magnetoinductive Method,” Nondestruct. Charact. Mater., pp. 614–621, 1989.
[96] A. M. Beese and D. Mohr, “Identification of the Direction-Dependency of the
Martensitic Transformation in Stainless Steel Using In Situ Magnetic Permeability
Measurements,” Exp. Mech., vol. 51, pp. 667–676, 2011.
[97] M. Shimotomai, K. Maruta, K. Mine, and M. Matsui, “Formation of aligned two-
phase microstructures by applying a magnetic field during the austenite to ferrite
transformation in steels,” Acta Mater., vol. 51, no. 10, pp. 2921–2932, 2003.
[98] J. Talonen, P. Aspegren, and H. Hänninen, “Comparison of different methods for
measuring strain induced α-martensite content in austenitic steels,” Mater. Sci.
Technol., vol. 20, no. 12, pp. 1506–1512, 2004.
[99] S. S. M. Tavares, D. Gunderov, V. Stolyarov, and J. M. Neto, “Phase transformation
induced by severe plastic deformation in the AISI 304L stainless steel,” Mater. Sci.
Eng. A, vol. 358, no. 1–2, pp. 32–36, 2003.
[100] R. D. K. Misra, B. R. Kumar, M. Somani, and P. Karjalainen, “Deformation
processes during tensile straining of ultrafine/nanograined structures formed by
reversion in metastable austenitic steels,” Scr. Mater., vol. 59, no. 1, pp. 79–82, 2008.
[101] P. Reu, “Virtual Strain Gage Size Study,” Exp. Tech., vol. 39, pp. 1–3, 2015.
[102] J. R. Davis, ASM Specialty Handbook-Stainless Steels. 1994.
[103] W. J. Sames, K. A. Unocic, R. R. Dehoff, T. Lolla, and S. S. Babu, “Thermal effects
on microstructural heterogeneity of Inconel 718 materials fabricated by electron
beam melting,” J. Mater. Res., vol. 29, no. 17, pp. 1920–1930, 2014.
[104] R. Rai, J. W. Elmer, T. a Palmer, and T. DebRoy, “Heat transfer and fluid flow
during keyhole mode laser welding of tantalum, Ti–6Al–4V, 304L stainless steel
131
and vanadium,” J. Phys. D. Appl. Phys., vol. 40, pp. 5753–5766, 2007.
[105] M. F. Ashby and K. E. Easterling, “The transformation hardening of steel surfaces
by laser beams—I. Hypo-eutectoid steels,” Acta Metall., vol. 32, no. Il, pp. 1935–
1948, 1984.
[106] L. W.B., K. E. Easterling, and M. F. Ashby, “Laser Transformation Hardening of
Steel - II. Hypereutectoid Steels,” Acta Metall., vol. 34, no. 8, pp. 1533–1543, 1986.
[107] J. C. Ion, H. R. Shercliff, and M. F. Ashby, “Diagrams for laser materials processing,”
Acta Metall., vol. 40, no. 7, pp. 1539–1551, 1992.
[108] M. F. Ashby and K. E. Easterling, “A first report on diagrams for grain growth in
welds,” Acta Metall., vol. 30, pp. 1969–1978, 1982.
[109] J. C. Ion, K. E. Easterling, and M. F. Ashby, “A second report on diagrams of
microstructure and hardness for heat-affected zones in welds,” Acta Metall., vol. 32,
no. 11, pp. 1949–1962, 1984.
[110] V. Manvatkar, A. De, and T. Debroy, “Heat transfer and material flow during laser
assisted multi-layer additive manufacturing,” J. Appl. Phys., vol. 116, no. 12, 2014.
[111] S. A. David, T. DebRoy, J. C. Lippold, H. B. Smartt, and J. M. Vitek, Eds., “Trends
in Welding Research: Proceedings of the 7th International Conference,” 2005, p.
996.
[112] E. R. Denlinger, J. C. Heigel, P. Michaleris, and T. A. Palmer, “Effect of Inter-Layer
Dwell Time on Distortion and Residual Stress in Additive Manufacturing of
Titanium and Nickel Alloys,” J. Mater. Process. Technol., vol. 215, pp. 123–131,
2015.
[113] V. Manvatkar, A. De, and T. DebRoy, “Spatial variation of melt pool geometry,
132
peak temperature and solidification parameters during laser assisted additive
manufacturing process,” Mater. Sci. Technol., vol. 31, no. 8, pp. 924–930, 2015.
[114] E. O. Hall, “The Deformation and Ageing of Mild Steel: III Discussion of Results,”
Proc. Phys. Soc. Sect. B, vol. 64, pp. 747–753, 1951.
[115] N. J. Petch, “The cleavage strength of polycrystals,” J. Iron Steel Inst., vol. 173, pp.
25–27, 1953.
[116] K. K. Singh, S. Sangal, and G. S. Murty, “Hall–Petch behaviour of 316L austenitic
stainless steel at room temperature,” Mater. Sci. Technol., vol. 18, pp. 165–172,
2002.
[117] H. Khalid Rafi, N. V Karthik, T. L. Starr, and B. E. Stucker, “Mechanical property
evaluation of Ti-6Al-4V parts made using Electron Beam Melting,” Solid Free.
Fabr. Proc., pp. 526–535, 2012.
[118] J. B. Leblond, G. Mottet, and J. C. Devaux, “A theoretical and numerical approach
to the plastic behaviour of steels during phase transformations—I. Derivation of
general relations,” J. Mech. Phys. Solids, vol. 34, no. 4, pp. 395–409, 1986.
[119] ISO 8249:2000 (en): Welding — Determination of Ferrite Number (FN) in
austenitic and duplex ferritic-austenitic Cr-Ni stainless steel weld metals. 2000.
[120] P. K. Palani and N. Murugan, “Prediction of Delta Ferrite Content and Effect of
Welding Process Parameters in Claddings by FCAW,” Mater. Manuf. Process., vol.
21, no. 5, pp. 431–438, 2006.
[121] Fischer, “Operator’s Manual for Feritescope FMP30 Manual,” 2008.
[122] J. Talonen and H. Hänninen, “Formation of shear bands and strain-induced
martensite during plastic deformation of metastable austenitic stainless steels,” Acta
133
Mater., vol. 55, pp. 6108–6118, 2007.
[123] K. Tomimura, S. Takaki, S. Tanimoto, and Y. Tokunaga, “Optimal Refining
Chemical Composition in Fe-Cr-Ni Alloys for Ultra Grain by Reversion from
Deformation Induced Martensite,” ISIJ Int., vol. 31, pp. 721–727, 1991.
[124] Z. Wang and A. M. Beese, “Effect of chemistry on martensitic phase transformation
kinetics and resulting properties of additively manufactured stainless steel,” Acta
Mater., vol. 131, pp. 410–422, 2017.
[125] T. Mukherjee, J. S. Zuback, A. De, and T. DebRoy, “Printability of alloys for
additive manufacturing,” Sci. Rep., vol. 6, pp. 1–8, 2016.
[126] H. K. Rafi, D. Pal, N. Patil, T. L. Starr, and B. E. Stucker, “Microstructure and
Mechanical Behavior of 17-4 Precipitation Hardenable Steel Processed by Selective
Laser Melting,” J. Mater. Eng. Perform., vol. 23, no. 12, pp. 4421–4428, 2014.
[127] X. He, T. DebRoy, and P. W. Fuerschbach, “Composition change of stainless steel
during microjoining with short laser pulse,” J. Appl. Phys., vol. 96, pp. 4547–4555,
2004.
[128] A. Bienkowski, “The magneto-elastic villari effect in ferrites,” J. Magn. Magn.
Mater., vol. 19, pp. 120–122, 1980.
[129] K. An, H. D. Skorpenske, A. D. Stoica, D. Ma, X. L. Wang, and E. Cakmak, “First
in situ lattice strains measurements under load at VULCAN,” Metall. Mater. Trans.
A Phys. Metall. Mater. Sci., vol. 42, no. 1, pp. 95–99, 2011.
[130] T. Ungar, A. D. Stoica, G. Tichy, and X.-L. Wang, “Orientation-dependent
evolution of the dislocation density in grain populations with different
crystallographic orientations relative to the tensile axis in a polycrystalline aggregate
134
of stainless steel,” Acta Mater., vol. 66, pp. 251–261, 2014.
[131] G. M. Stoica, A. D. Stoica, M. K. Miller, and D. Ma, “Temperature-dependent
elastic anisotropy and mesoscale deformation in a nanostructured ferritic alloy.,”
Nat. Commun., vol. 5, pp. 1–8, 2014.
[132] K. An, “VDRIVE-Data Reduction and Interactive Visulaization Softwarew for
Event Mode Neutron Diffraction,” ORNL Report, Oak Ridge National Laboratory,
ORNL-TM-2012-621, 2012.
[133] R. L. Snyder, “The Use of Reference Intensity Ratios in X-Ray Quantitative
Analysis,” Powder Diffr., vol. 7, no. 4, pp. 186–193, 1992.
[134] ABAQUS, Version 6.14 User’s Manual. 2014.
[135] D. Chung, “Materials for thermal conduction,” Appl. Therm. Eng., vol. 21, pp.
1593–1605, 2001.
[136] “Man-systems Integration Standards,” National Aeronautics and Space
Administration, 1995. [Online]. Available:
https://msis.jsc.nasa.gov/sections/section04.htm. [Accessed: 01-Jan-2017].
[137] H. Yüncü, “Thermal contact conductance of nominaly flat surfaces,” Heat Mass
Transf., vol. 43, pp. 1–5, 2006.
[138] S. Murugan, S. K. Rai, P. V. Kumar, T. Jayakumar, B. Raj, and M. S. C. Bose,
“Temperature distribution and residual stresses due to multipass welding in type 304
stainless steel and low carbon steel weld pads,” Int. J. Press. Vessel. Pip., vol. 78,
no. 4, pp. 307–317, 2001.
[139] K. Spencer, J. D. Embury, K. T. Conlon, M. Véron, and Y. Bréchet, “Strengthening
via the formation of strain-induced martensite in stainless steels,” Mater. Sci. Eng.
135
A, vol. 387–389, pp. 873–881, 2004.
[140] M. Moallemi, A. Kermanpur, A. Najafizadeh, A. Rezaee, H. S. Baghbadorani, and
P. D. Nezhadfar, “Deformation-induced martensitic transformation in a 201
austenitic steel: The synergy of stacking fault energy and chemical driving force,”
Mater. Sci. Eng. A, vol. 653, pp. 147–152, 2016.
[141] S. Curtze and V. T. Kuokkala, “Dependence of tensile deformation behavior of
TWIP steels on stacking fault energy, temperature and strain rate,” Acta Mater., vol.
58, pp. 5129–5141, 2010.
[142] G. B. Olson and M. Cohen, “A General Mechanism of Martensitic Nucleation: Part
I. General Concepts and the FCC - HCP Transformation,” Metall. Trans. A, vol. 7A,
pp. 1897–1904, 1976.
[143] S. Curtze, V. T. Kuokkala, A. Oikari, J. Talonen, and H. Hänninen,
“Thermodynamic modeling of the stacking fault energy of austenitic steels,” Acta
Mater., vol. 59, pp. 1068–1076, 2011.
[144] I. A. Yakubtsov, A. Ariapour, and D. D. Perovic, “Effect of nitrogen on stacking
fault energy of f.c.c. iron-based alloys,” Acta Mater., vol. 47, no. 4, pp. 1271–1279,
1999.
[145] P. J. Ferreira and P. Müllner, “A thermodynamic model for the stacking-fault
energy,” Acta Mater., vol. 46, no. 13, pp. 4479–4484, 1998.
[146] M. Olsson, “Thermodynamic Modeling of the Stacking Fault Energy in Austenitic
Stainless Steels,” KTH Royal Institute of Technology, 2014.
[147] A. H. Cottrell, “Tensile Properties of Unstable Austenite and Its Low-Teperature
Decomposition Products,” J. Iron Steel Inst., vol. 151, no. 1, pp. 93–104, 1945.
136
[148] P. O. Santacreu, J. C. Glez, G. Chinouilh, and T. Frohlich, “Behaviour model of
austenitic stainless steels for automotive structural parts,” Steel Res. Int., vol. 77, pp.
686–691, 2006.
[149] Z. Wang and A. M. Beese, “Effect of stress state and texture on martensitic phase
transformation kinetics of additively manufactured austenitic stainless steel,”
Submitted for publication.
[150] B. Cina, “Effect of cold work on the γ → α transformation in some Fe-Ni-Cr alloys,”
J. Iron Steel Inst., vol. 177, no. 4, p. 406, 1954.
[151] V. V. Kosarchuk, L. V. Zaitseva, A. A. Lebedev, and B. I. Koval’chuk, “Effect of
stressed state parameters on phase transformation kinetics in austenitic steels with
plastic deformation,” Strength of Matlerials, vol. 21, pp. 60–64, 1989.
[152] T. Okutani, N. Yukawa, K. Ishikawa, and T. Jinma, “The strain-induced martensitic
transformation of SU304 under various stress states,” Proc. Japanese Soc. Tech.
Plast. ’95 Spring, pp. 331–332, 1995.
[153] H. Y. Yu, Y. K. Gao, and D. J. Meng, “Transformation behavior of retained austenite
under different deformation modes for low alloyed TRIP-assisted steels,” Mater. Sci.
Eng. A, vol. 441, pp. 331–335, 2006.
[154] C.-C. Young, “Transformation toughening of phosphocarbide-strengthened
austenitic steels,” Massachusetts Institute of Technology, 1988.
[155] A. A. Lebedev and V. V. Kosarchuk, “Influence of phase transformations on the
mechanical properties of austenitic stainless steels,” Int. J. Plast., vol. 16, pp. 749–
767, 2000.
[156] Y. Tomita and T. Iwamoto, “Constitutive modeling of trip steel and its application
137
to the improvement of mechanical properties,” Int. J. Mech. Sci., vol. 37, no. 12, pp.
1295–1305, 1995.
[157] D. Mohr and M. Oswald, “A new experimental technique for the multi-axial testing
of advanced high strength steel sheets,” Exp. Mech., vol. 48, pp. 65–77, 2008.
[158] H. M. Rietveld, “A profile refinement method for nuclear and magnetic structures,”
J. Appl. Crystallogr., vol. 2, pp. 65–71, 1969.
[159] A. C. Larson and R. B. Von Dreele, “General Structure Analysis System (GSAS),”
2004.
[160] K. Mumtaz, S. Takahashi, J. Echigoya, Y. Kamada, L. F. Zhang, H. Kikuchi, K. Ara,
and M. Sato, “Magnetic measurements of martensitic transformation in austenitic
stainless steel after room temperature rolling,” J. Mater. Sci., vol. 39, pp. 85–97,
2004.
[161] “ASTM Standard E975-13: Standard Practice for X-Ray Determination of Retained
Austenite in Steel with Near Random Crystallographic Orientation,” in ASTM
International, 2013, pp. 1–7.
[162] M. S. Wechsler, D. S. Lieberman, and T. A. Read, “On the Theory of the Formation
of Martensite,” Trans. AIME, pp. 1503–1515, 1953.
[163] H. Hallberg, P. Håkansson, and M. Ristinmaa, “A constitutive model for the
formation of martensite in austenitic steels under large strain plasticity,” Int. J. Plast.,
vol. 23, pp. 1213–1239, 2007.
[164] J. Post, K. Datta, and J. Beyer, “A macroscopic constitutive model for a metastable
austenitic stainless steel,” Mater. Sci. Eng. A, vol. 485, pp. 290–298, 2008.
[165] A. Bhattacharyya and G. J. Weng, “An energy criterion for the stress-induced
138
martensitic transformation in a ductile system,” J. Mech. Phys. Solids, vol. 42, no.
11, pp. 1699–1724, 1994.
[166] A. H. C. Hänsel, P. Hora, and J. Reissner, “Model for the kinetics of strain-induced
martensitic phase transformation at non-isothermal conditions for the simulation of
sheet metal forming processes with metastable austenitic steels,” in Simulation of
Materials Processing: Theory, Methods, and Applications, J. Huétink and F. P. T.
Baaijens, Eds. Balkema, Rotterdam, 1998, pp. 373–378.
[167] D. Mohr and J. Jacquemin, “Large deformation of anisotropic austenitic stainless
steel sheets at room temperature: Multi-axial experiments and phenomenological
modeling,” J. Mech. Phys. Solids, vol. 56, no. 10, pp. 2935–2956, 2008.
[168] C. P. Kohar, M. Cherkaoui, H. El Kadiri, and K. Inal, “Numerical modeling of TRIP
steel in axial crashworthiness,” Int. J. Plast., vol. 84, pp. 224–254, 2016.
[169] S. Hazar, B. Alfredsson, and J. Lai, “Mechanical modeling of coupled plasticity and
phase transformation effects in a martensitic high strength bearing steel,” Mech.
Mater., vol. 117, pp. 41–57, 2018.
[170] H. Y. Yu and S. J. Chen, “A mixed hardening model combined with the
transformation-induced plasticity effect,” J. Manuf. Process., vol. 28, pp. 390–398,
2017.
[171] M. P. Miller and D. L. McDowell, “Modeling large strain multiaxial effects in FCC
polycrystals,” Int. J. Plast., vol. 12, no. 7, pp. 875–902, 1996.
[172] J. Y. Lee, F. Barlat, and M. G. Lee, “Constitutive and friction modeling for accurate
springback analysis of advanced high strength steel sheets,” Int. J. Plast., vol. 71,
pp. 113–135, 2015.
139
[173] M. I. Latypov, S. Shin, B. C. De Cooman, and H. S. Kim, “Micromechanical finite
element analysis of strain partitioning in multiphase medium manganese
TWIP+TRIP steel,” Acta Mater., vol. 108, pp. 219–228, 2016.
[174] S. Msolli, M. Martiny, M. C. Cardoso, L. P. Moreira, S. Mercier, and A. Molinari,
“Numerical modeling of the deformation of AISI 304L using a tangent additive
Mori-Tanaka homogenization scheme: Application to sheet metal forming,” J.
Mater. Process. Technol., vol. 235, pp. 187–205, 2016.
[175] R. Zaera, J. A. Rodríguez-Martínez, A. Casado, J. Fernández-Sáez, A. Rusinek, and
R. Pesci, “A constitutive model for analyzing martensite formation in austenitic
steels deforming at high strain rates,” Int. J. Plast., vol. 29, pp. 77–101, 2012.
[176] Z. Wang and A. M. Beese, “Plasticity model coupled with strain-induced martensitic
transformation kinetics for austenitic stainless steel deposited by additive
manufacturing,” Submitted for publication.
[177] R. Hill, “A theory of the yielding and plastic flow of anisotropic metals,” Proc. R.
Soc. Lond. A. Math. Phys. Sci., vol. 193, no. 1033, pp. 281–297, 1948.
[178] H. W. Swift, “Plastic instability under plane stress,” J. Mech. Phys. Solids, vol. 1,
pp. 1–18, 1952.
VITA
Zhuqing Wang was born in Daqing, China, in 1990. She graduated with a B.S. degree
in Materials Science and Engineering from University of Science and Technology Beijing
in June 2012. She graduated with a M.S. degree in Materials Science and Engineering
from University of Pennsylvania in May 2014. She continued her Ph.D. study in Materials
Science and Engineering at Pennsylvania State University from August 2014. Her research
interests including metallurgy, mechanics, and additive manufacturing process.
Recommended