Examining Connecticut’s Disciplinary Offense Data
Suspension/Expulsion Data
Suspension from school is defined in Connecticut Education Statute (Sec. 10-233a(b)) as:
“exclusion from regular classroom activities beyond 90 minutes.”
Suspension/Expulsion Data
Some of the ways we examine the data: ““UNIQUE Students”UNIQUE Students” District & SchoolDistrict & School General Ed, Special Ed, All StudentsGeneral Ed, Special Ed, All Students Incident TypeIncident Type Days Served (In-School and Out-of-School suspensions)Days Served (In-School and Out-of-School suspensions) RaceRace GenderGender 10+ Days Out-of-School (Expulsion)10+ Days Out-of-School (Expulsion) Serious vs. School Policy OffensesSerious vs. School Policy Offenses
Suspension/Expulsion Data
Interesting Data Facts CT Prek-12 Enrollment is approximately 584,000.CT Prek-12 Enrollment is approximately 584,000. 372,726 Total Days of Suspension (ISS/OSS) were 372,726 Total Days of Suspension (ISS/OSS) were
served by CT Students during 2004-05.served by CT Students during 2004-05. 372,726 equates to 2,070 students being suspended 372,726 equates to 2,070 students being suspended
for an entire 180 day school year!for an entire 180 day school year! 39% of students suspended (either ISS or OSS) were 39% of students suspended (either ISS or OSS) were
multiple offenders.multiple offenders. 31.4% of incidents were classified as Serious 31.4% of incidents were classified as Serious
(fighting, weapons, drugs, threat/intimidation).(fighting, weapons, drugs, threat/intimidation).
Suspension/Expulsion Data (All)
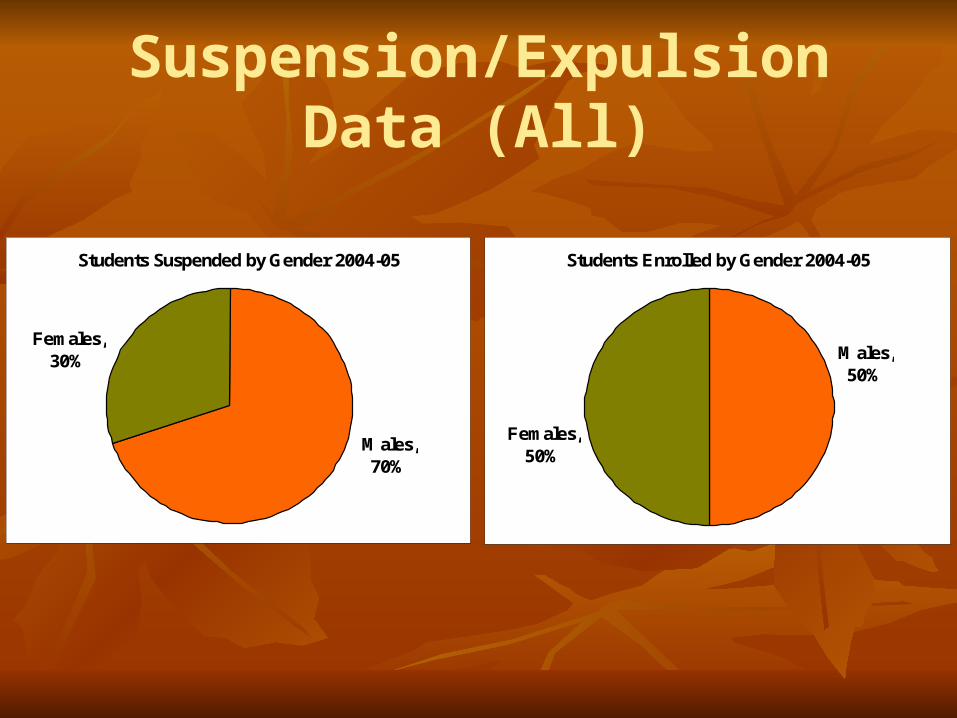
Students Suspended by Gender 2004-05
Females, 30%
Males, 70%
Students Enrolled by Gender 2004-05
Males, 50%
Females, 50%
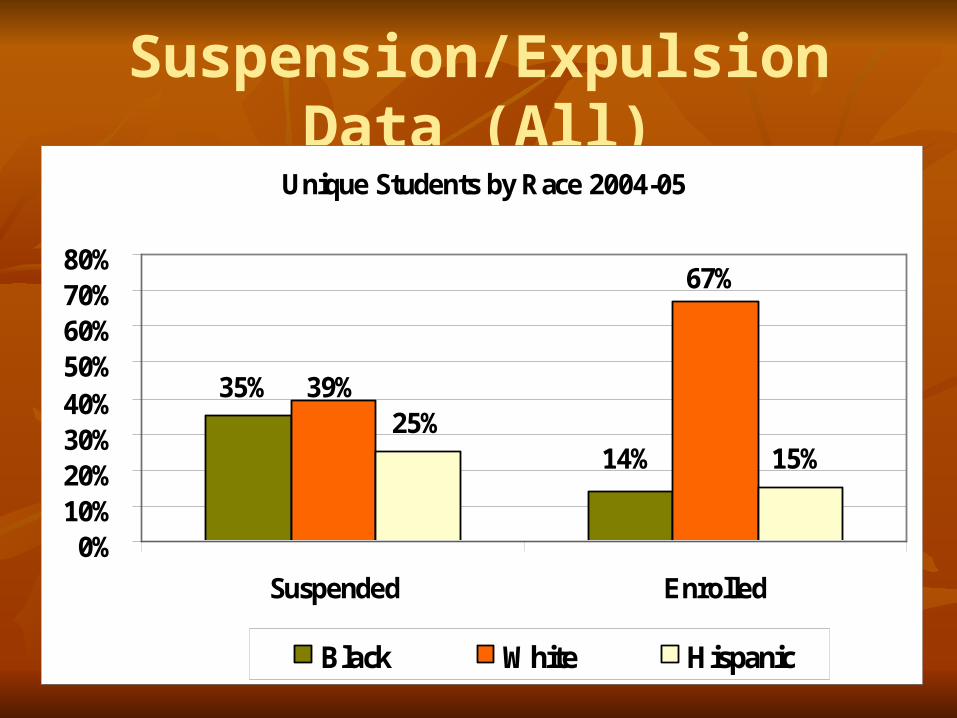
Suspension/Expulsion Data (All)Unique Students by Race 2004-05
14%
35% 39%
67%
15%25%
0%10%20%30%40%50%60%70%80%
Suspended Enrolled
Black White Hispanic
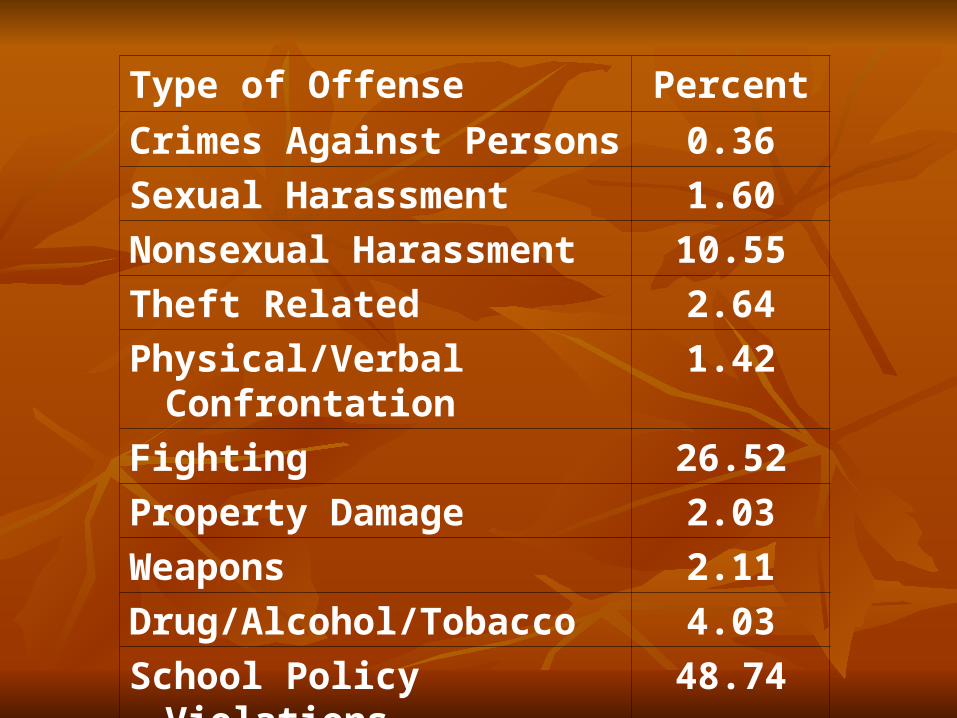
Type of Offense Percent
Crimes Against Persons 0.36
Sexual Harassment 1.60
Nonsexual Harassment 10.55
Theft Related 2.64
Physical/Verbal Confrontation 1.42
Fighting 26.52
Property Damage 2.03
Weapons 2.11
Drug/Alcohol/Tobacco 4.03
School Policy Violations 48.74
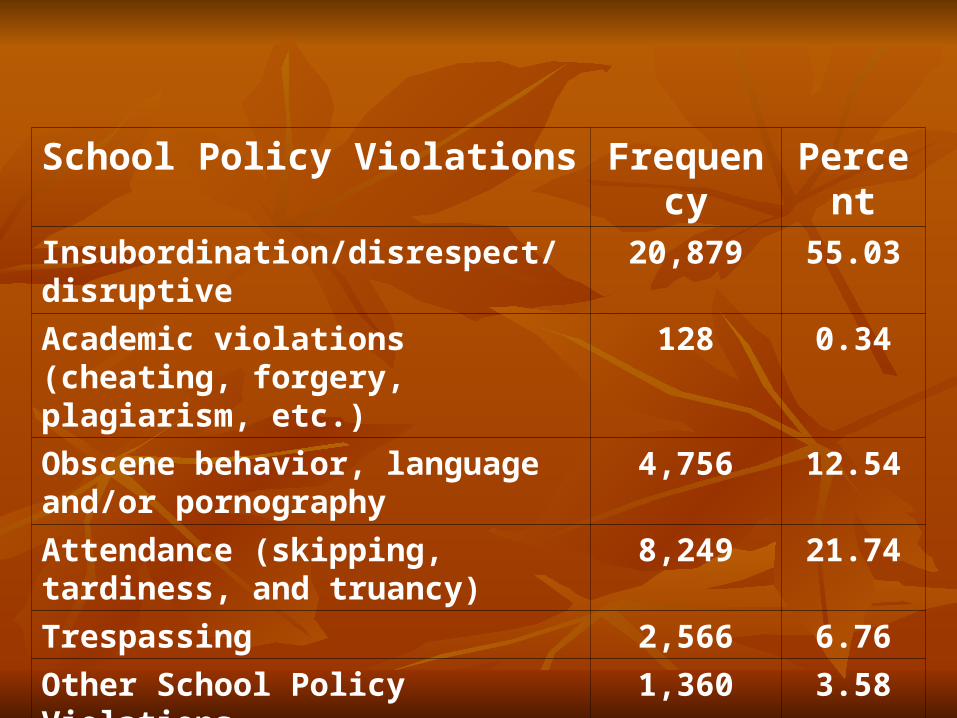
School Policy Violations Frequency PercentInsubordination/disrespect/disruptive 20,879 55.03
Academic violations (cheating, forgery, plagiarism, etc.)
128 0.34
Obscene behavior, language and/or pornography
4,756 12.54
Attendance (skipping, tardiness, and truancy)
8,249 21.74
Trespassing 2,566 6.76
Other School Policy Violations 1,360 3.58
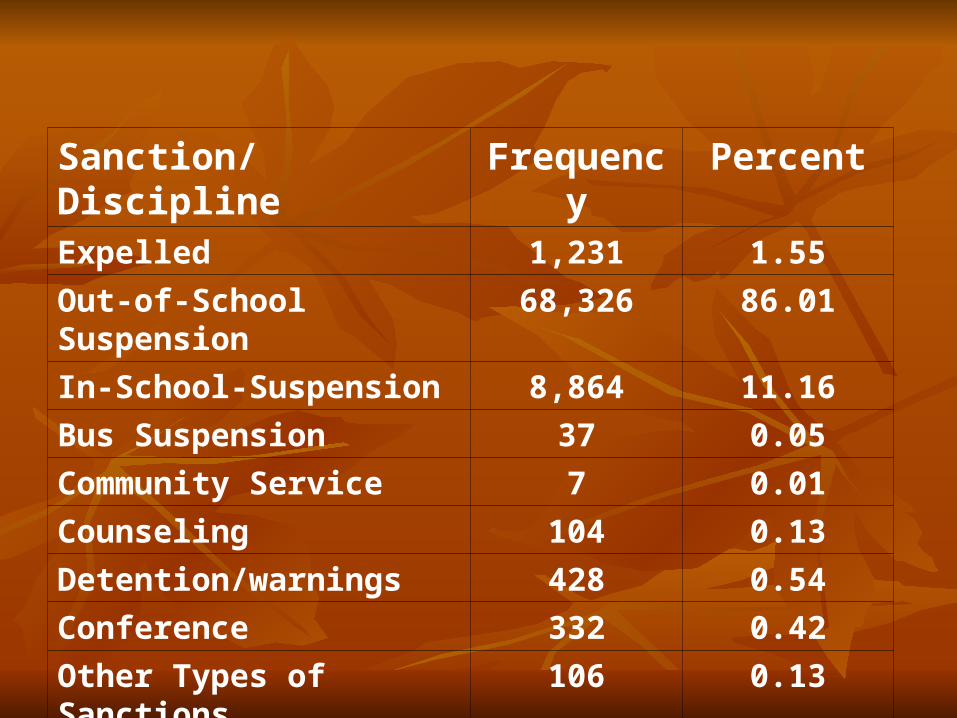
Sanction/Discipline Frequency PercentExpelled 1,231 1.55
Out-of-School Suspension 68,326 86.01
In-School-Suspension 8,864 11.16
Bus Suspension 37 0.05
Community Service 7 0.01
Counseling 104 0.13
Detention/warnings 428 0.54
Conference 332 0.42
Other Types of Sanctions 106 0.13
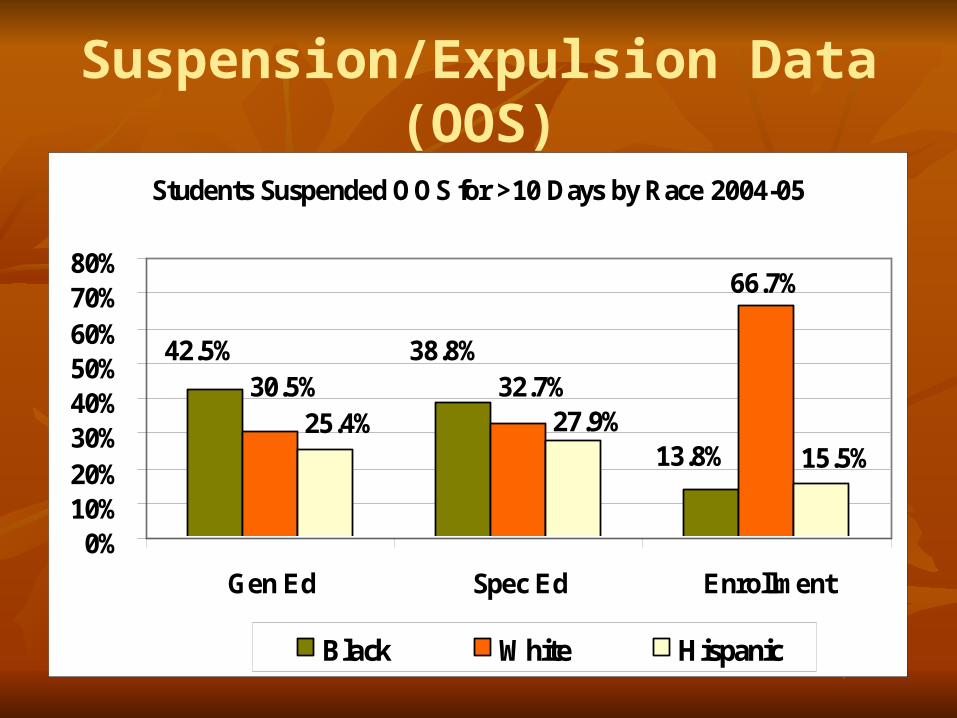
Suspension/Expulsion Data (OOS)
Students Suspended OOS for >10 Days by Race 2004-05
42.5% 38.8%
13.8%
66.7%
32.7%30.5%25.4% 27.9%
15.5%
0%10%20%30%40%50%60%70%80%
Gen Ed Spec Ed Enrollment
Black White Hispanic
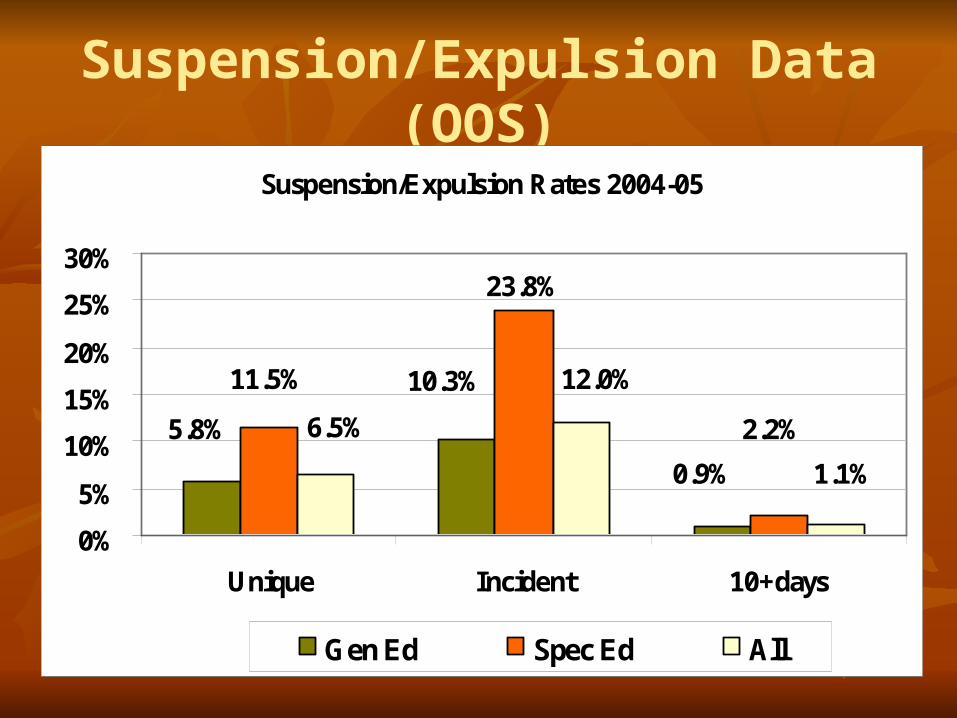
Suspension/Expulsion Data (OOS)
Suspension/Expulsion Rates 2004-05
0.9%
10.3%
5.8%
11.5%
23.8%
2.2%
1.1%
12.0%
6.5%
0%
5%
10%
15%
20%
25%
30%
Unique Incident 10+days
Gen Ed Spec Ed All
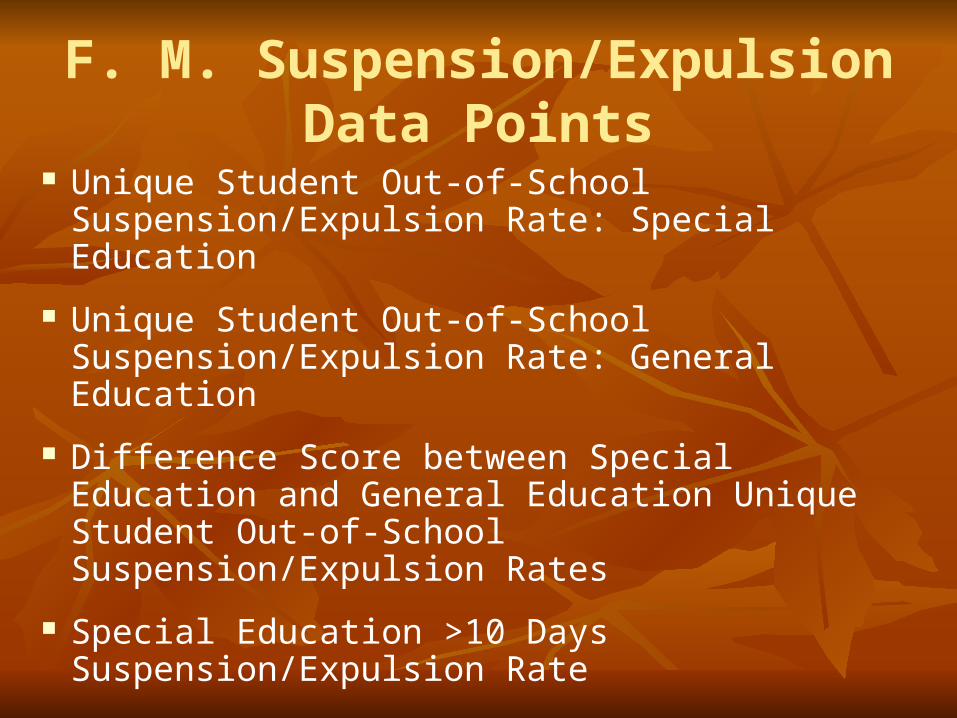
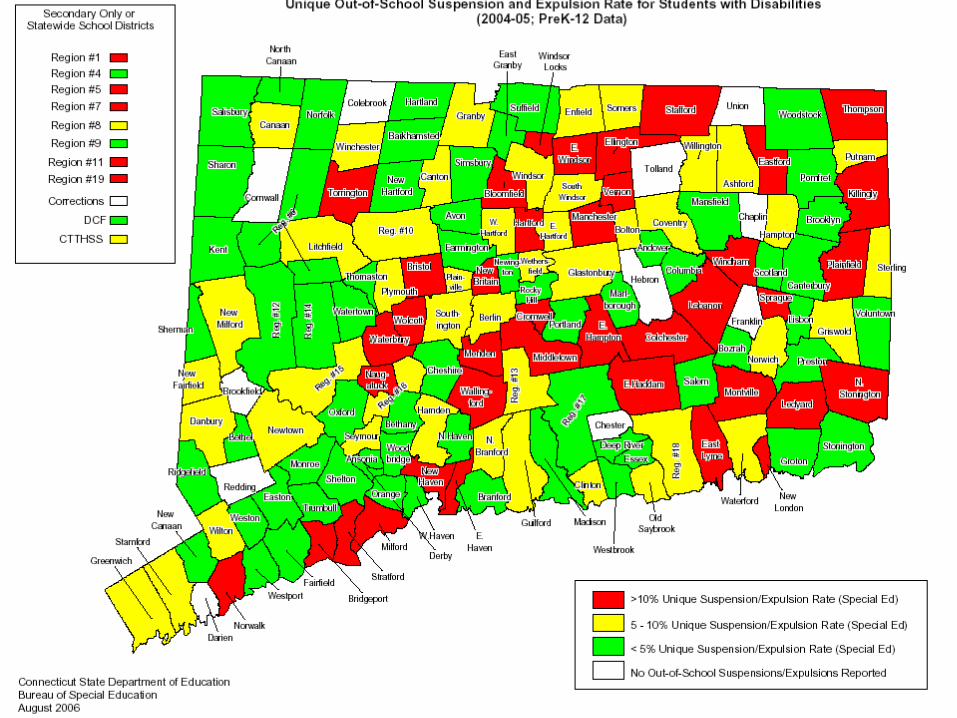
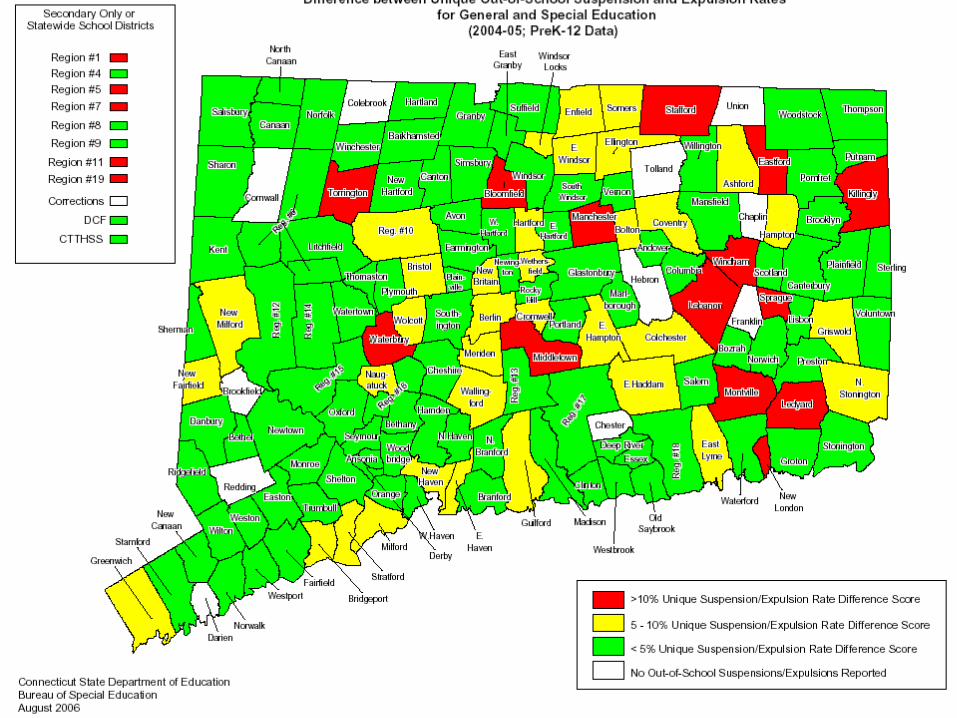
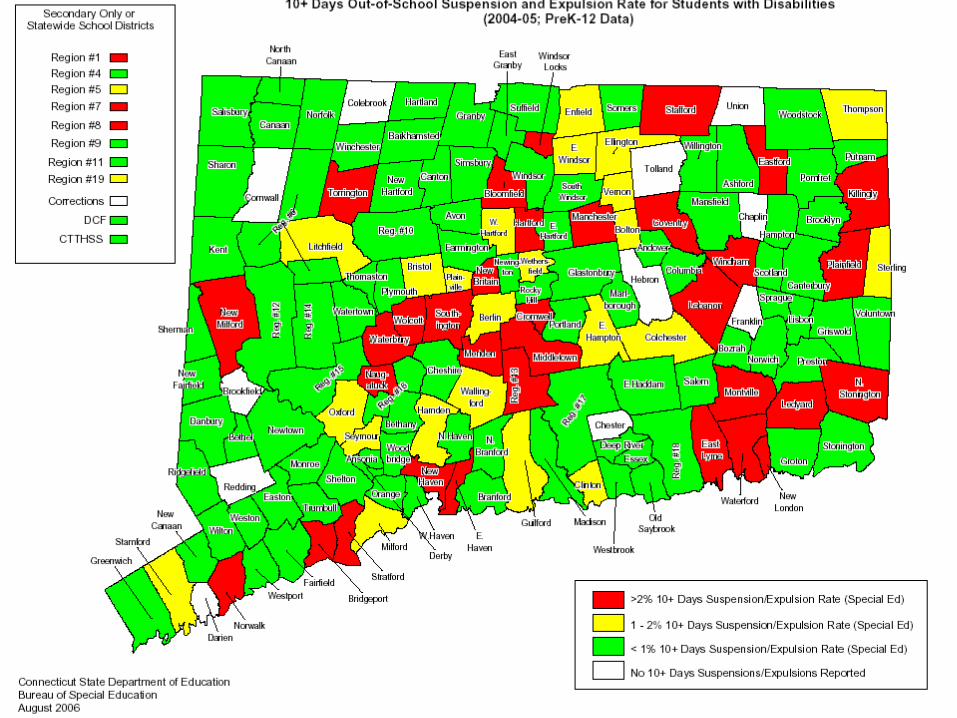
F. M. Suspension/Expulsion Data Points
Unique Student Out-of-School Suspension/Expulsion Rate: Special Education
Unique Student Out-of-School Suspension/Expulsion Rate: General Education
Difference Score between Special Education and General Education Unique Student Out-of-School Suspension/Expulsion Rates
Special Education >10 Days Suspension/Expulsion Rate
Suspension/Expulsion Contacts
For questions related to ED166 Disciplinary Offenses, contact:
•Amarildo Monsalve (860) 713-6877•John B. Rogers (860) 713-6833
For Questions regarding reporting of suspension/expulsion data, contact:
•Diane M. Murphy (860) 713-6891
Recommended