Evotec AG, Company Presentation, BioCapital Europe 2019, Amsterdam, 14 March 2019
Partnered Drug Discoveryand Development
Evotec
PAGE
Forward-looking statement
1
Information set forth in this presentation contains forward-looking statements, which involve a
number of risks and uncertainties. The forward-looking statements contained herein represent
the judgement of Evotec as of the date of this presentation. Such forward-looking statements are
neither promises nor guarantees, but are subject to a variety of risks and uncertainties, many of
which are beyond our control, and which could cause actual results to differ materially from those
contemplated in these forward-looking statements. We expressly disclaim any obligation or
undertaking to release publicly any updates or revisions to any such statements to reflect any
change in our expectations or any change in events, conditions or circumstances on which any
such statement is based.
PAGE
Agenda
2
Overview
Partnered drug discovery & development
Financials & Outlook
PAGE
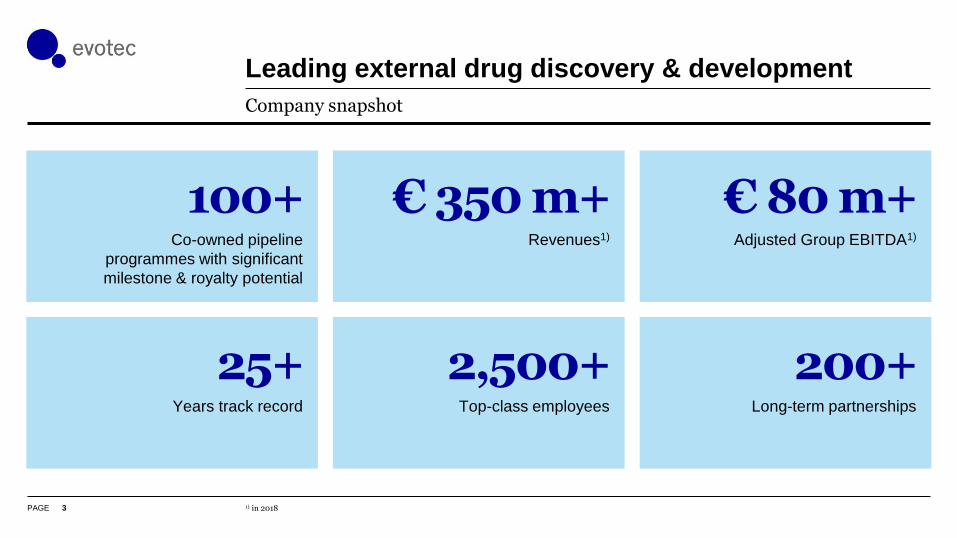
Leading external drug discovery & development
3
Company snapshot
1) in 2018
Co-owned pipeline
programmes with significant
milestone & royalty potential
Revenues1) Adjusted Group EBITDA1)
Years track record Top-class employees Long-term partnerships
€ 350 m+ € 80 m+
25+ 2,500+ 200+
100+
PAGE
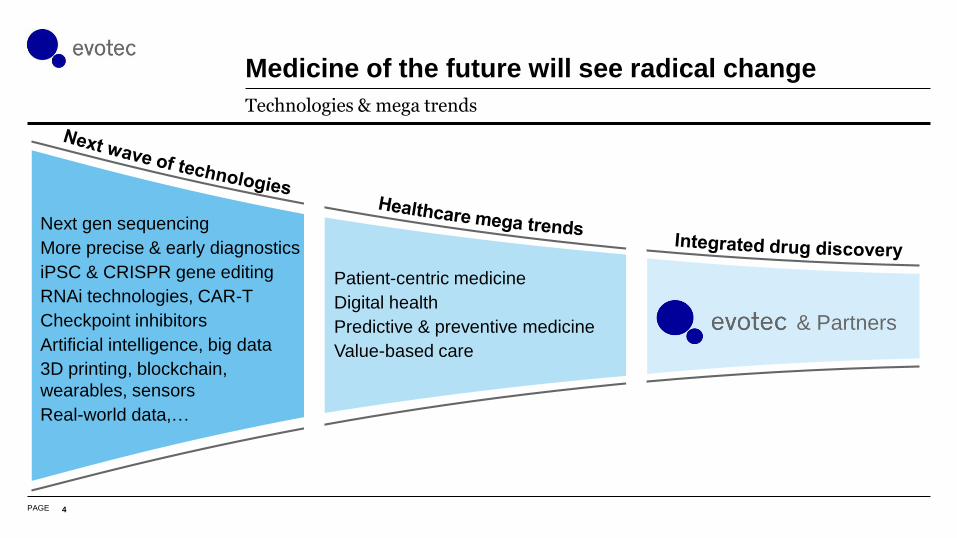
Medicine of the future will see radical change
4
Technologies & mega trends
Next gen sequencing
More precise & early diagnostics
iPSC & CRISPR gene editing
RNAi technologies, CAR-T
Checkpoint inhibitors
Artificial intelligence, big data
3D printing, blockchain,
wearables, sensors
Real-world data,…
Patient-centric medicine
Digital health
Predictive & preventive medicine
Value-based care
& Partners
PAGE
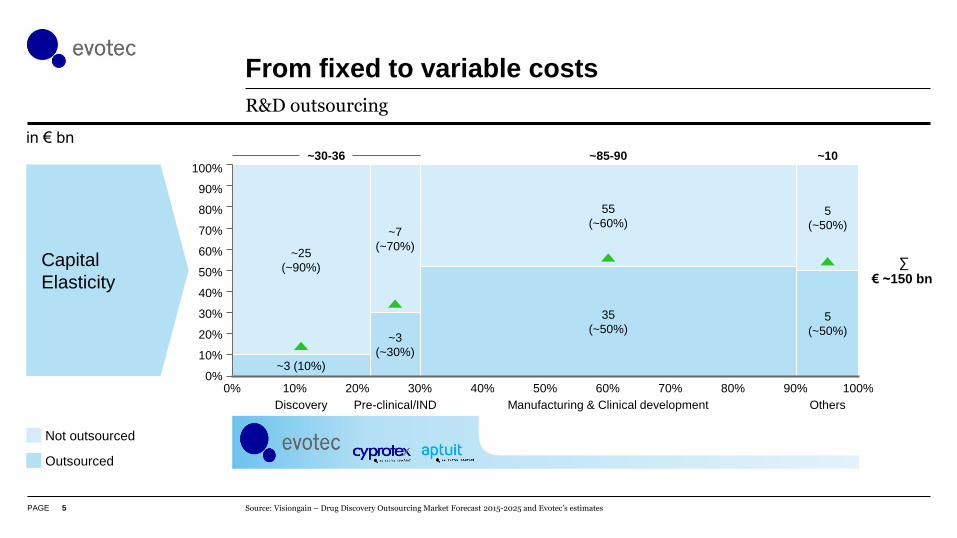
From fixed to variable costs
5
R&D outsourcing
Source: Visiongain – Drug Discovery Outsourcing Market Forecast 2015-2025 and Evotec’s estimates
in € bn
Capital
Elasticity
Not outsourced
Outsourced
90%80% 100%0%
100%
30%
40%
10%
50%
60%
70%
10%
80%
20%
0%
90%
30% 60%50%20% 40% 70%
Discovery
~85-90 ~10
Manufacturing & Clinical developmentPre-clinical/IND Others
~30-36
∑
€ ~150 bn
5
(~50%)
35
(~50%)
~25
(~90%)
~3
(~30%)
5
(~50%)
~3 (10%)
~7
(~70%)
55
(~60%)
PAGE
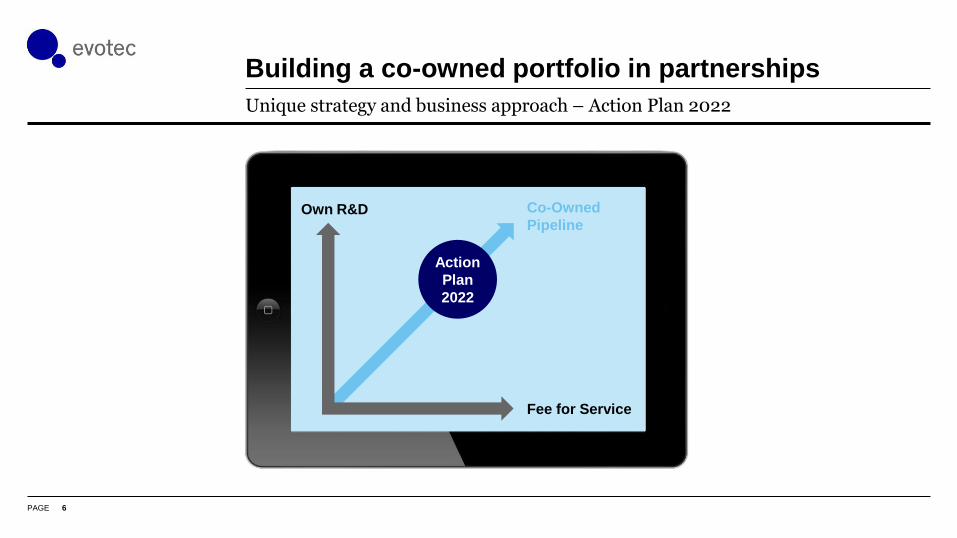
Building a co-owned portfolio in partnerships
6
Unique strategy and business approach – Action Plan 2022
Fee for Service
Own R&D Co-Owned
Pipeline
Action
Plan
2022
PAGE
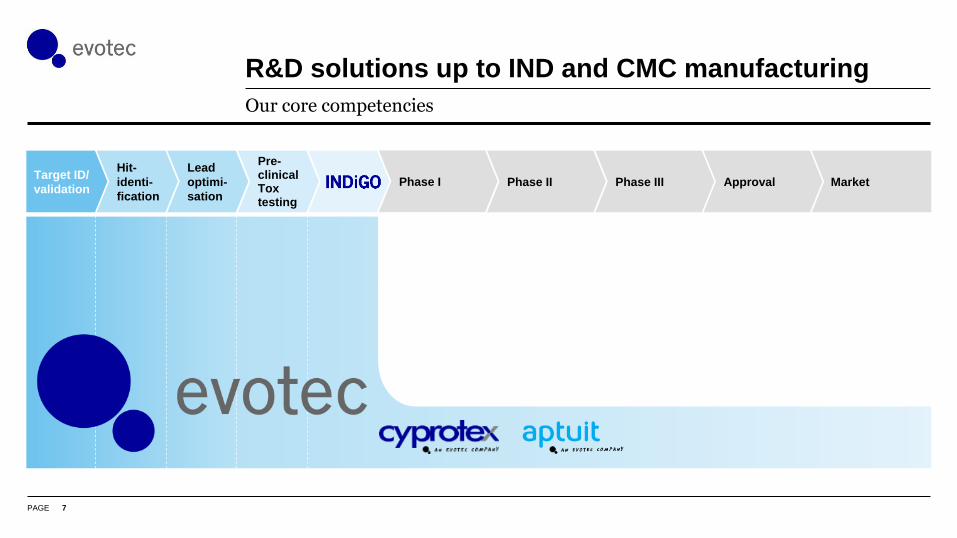
R&D solutions up to IND and CMC manufacturing
7
Our core competencies
Phase I Phase III Approval
Lead
optimi-
sation
Pre-clinicalToxtesting
Hit-
identi-
fication
Target ID/
validationPhase II Market
PAGE
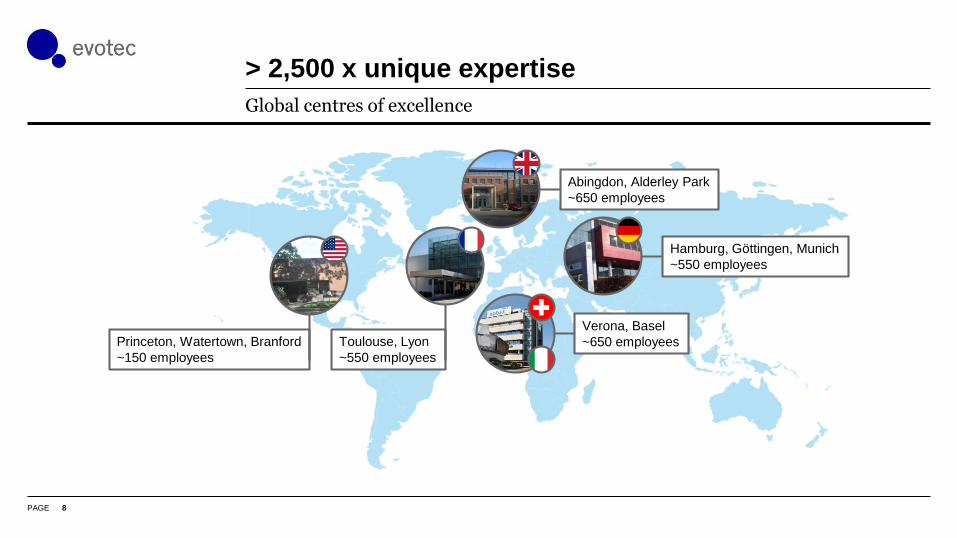
> 2,500 x unique expertise
8
Global centres of excellence
Verona, Basel
~650 employees
Abingdon, Alderley Park
~650 employees
Toulouse, Lyon
~550 employees
Hamburg, Göttingen, Munich
~550 employees
Princeton, Watertown, Branford
~150 employees
PAGE
Agenda
9
Overview
Partnered drug discovery & development
Financials & Outlook
PAGE
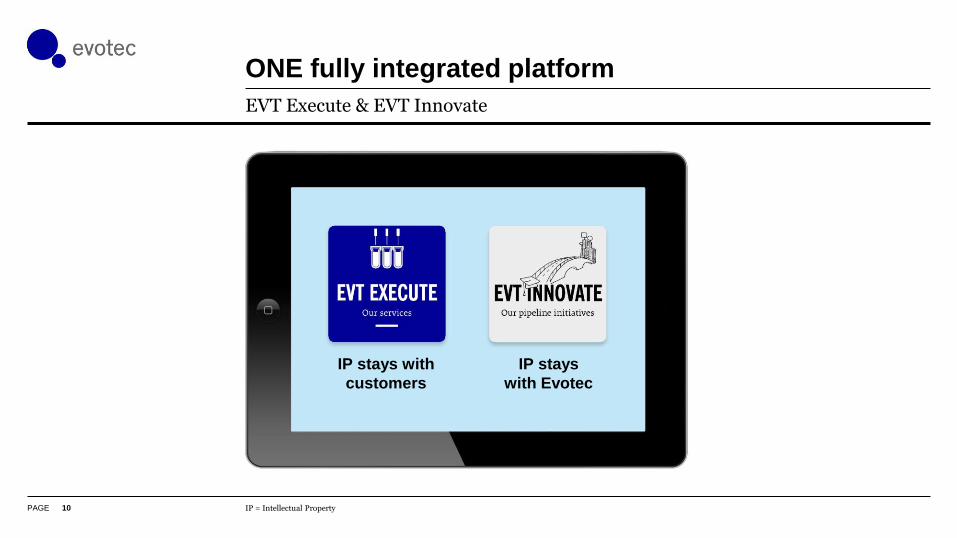
ONE fully integrated platform
10
EVT Execute & EVT Innovate
IP = Intellectual Property
IP stays with
customers
IP stays
with Evotec
PAGE
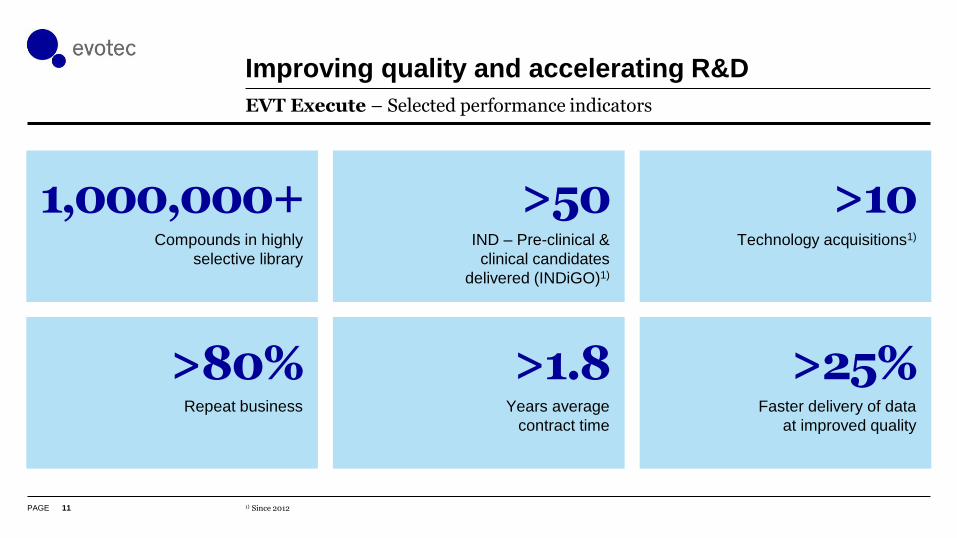
Improving quality and accelerating R&D
11
EVT Execute – Selected performance indicators
1) Since 2012
Compounds in highly
selective library
IND – Pre-clinical &
clinical candidates
delivered (INDiGO)1)
Technology acquisitions1)
Repeat business Years average
contract time
Faster delivery of data
at improved quality
>50 >10
>80% >1.8 >25%
1,000,000+
PAGE
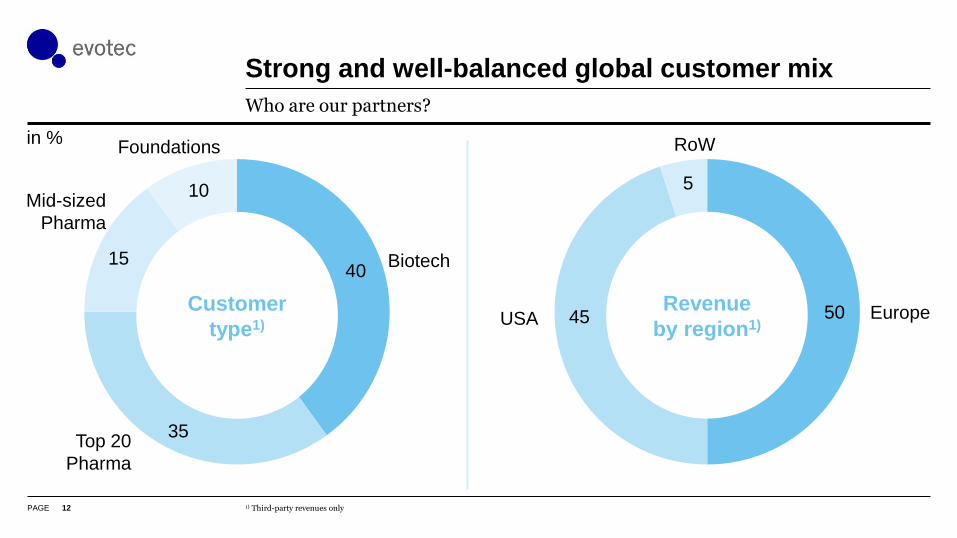
Strong and well-balanced global customer mix
12
Who are our partners?
1) Third-party revenues only
in %
40
35
15
10
5045
5
USA
RoW
EuropeCustomer
type1)
Revenue
by region1)
Mid-sized
Pharma
Foundations
Biotech
Top 20
Pharma
PAGE
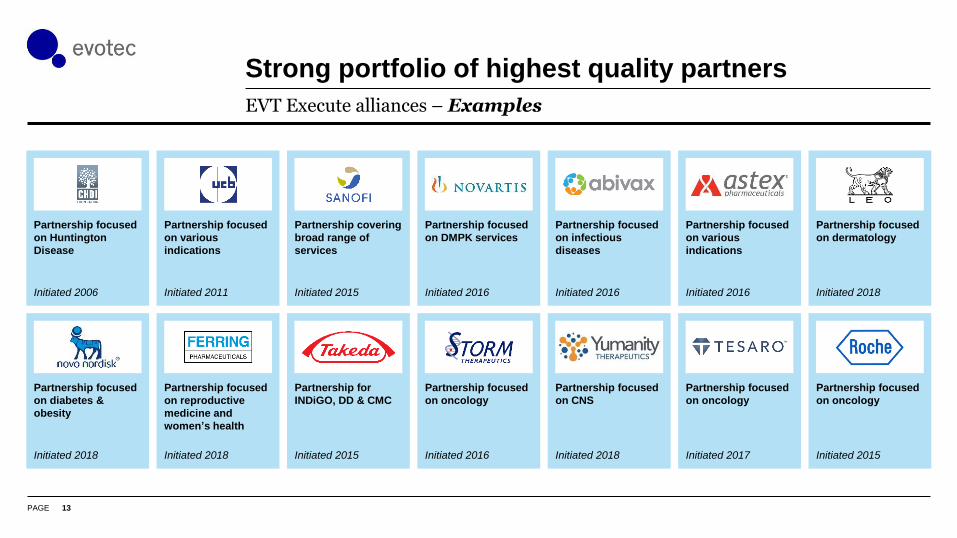
Strong portfolio of highest quality partners
13
EVT Execute alliances – Examples
Partnership focused
on Huntington
Disease
Initiated 2006
Partnership focused
on diabetes &
obesity
Initiated 2018
Partnership focused
on various
indications
Initiated 2011
Partnership focused
on reproductive
medicine and
women’s health
Initiated 2018
Partnership covering
broad range of
services
Initiated 2015
Partnership for
INDiGO, DD & CMC
Initiated 2015
Partnership focused
on DMPK services
Initiated 2016
Partnership focused
on oncology
Initiated 2016
Partnership focused
on infectious
diseases
Initiated 2016
Partnership focused
on CNS
Initiated 2018
Partnership focused
on various
indications
Initiated 2016
Partnership focused
on oncology
Initiated 2017
Partnership focused
on dermatology
Initiated 2018
Partnership focused
on oncology
Initiated 2015
PAGE
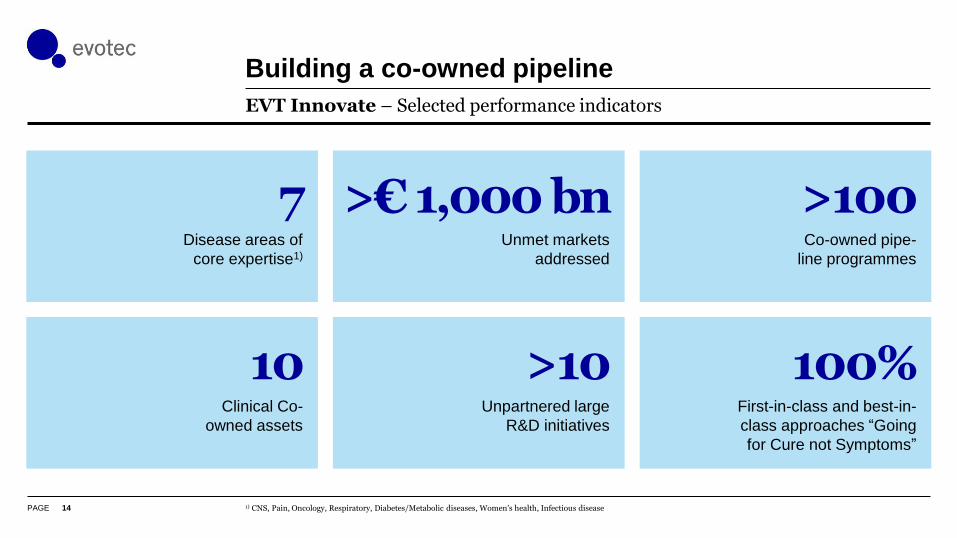
Building a co-owned pipeline
14
EVT Innovate – Selected performance indicators
1) CNS, Pain, Oncology, Respiratory, Diabetes/Metabolic diseases, Women’s health, Infectious disease
Disease areas of
core expertise1)
Unmet markets
addressed
Co-owned pipe-
line programmes
Clinical Co-
owned assets
Unpartnered large
R&D initiatives
First-in-class and best-in-
class approaches “Going
for Cure not Symptoms”
>€ 1,000 bn >100
10 >10 100%
7
PAGE
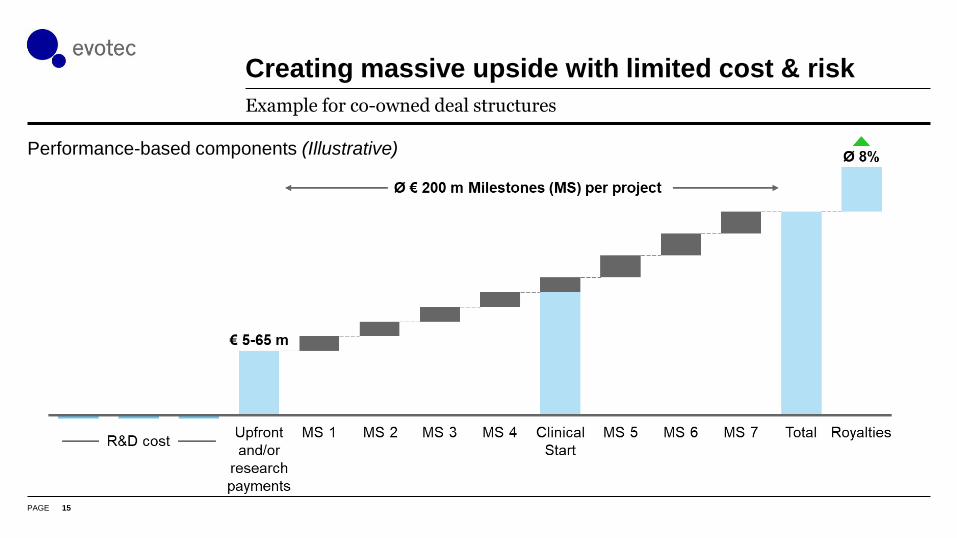
Creating massive upside with limited cost & risk
15
Example for co-owned deal structures
Performance-based components (Illustrative)
PAGE
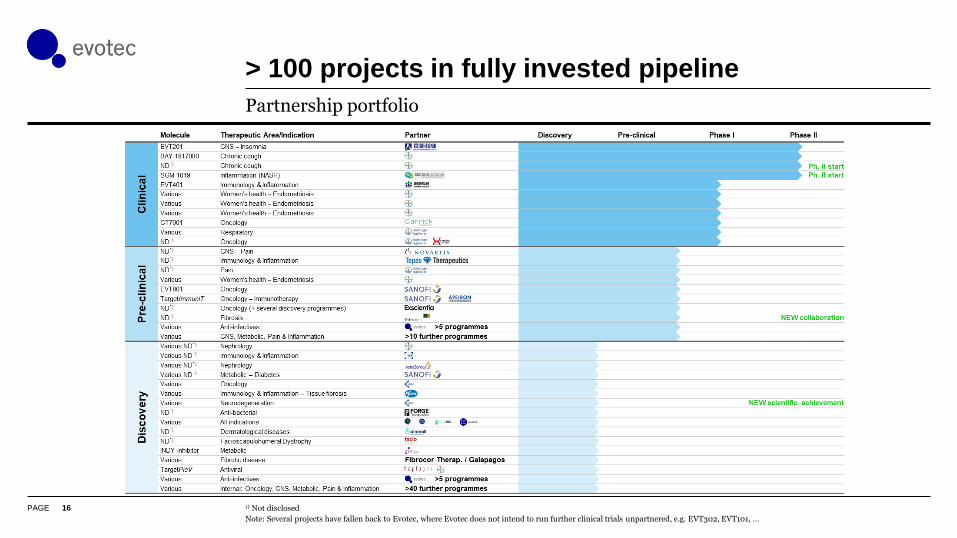
> 100 projects in fully invested pipeline
16
Partnership portfolio
1) Not disclosed
Note: Several projects have fallen back to Evotec, where Evotec does not intend to run further clinical trials unpartnered, e.g. EVT302, EVT101, …
PAGE
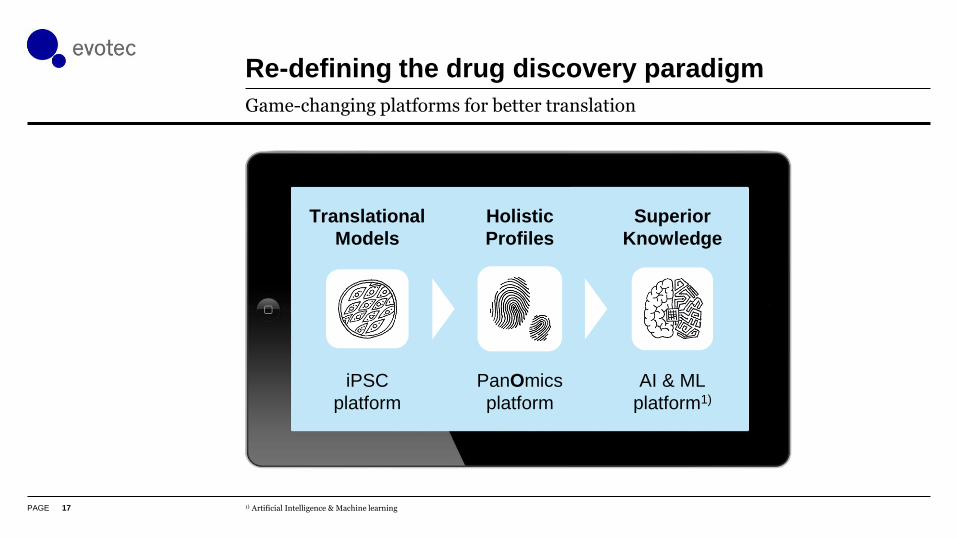
Translational
Models
Holistic
Profiles
Superior
Knowledge
iPSC
platform
PanOmics
platform
AI & ML
platform1)
Re-defining the drug discovery paradigm
17
Game-changing platforms for better translation
1) Artificial Intelligence & Machine learning
PAGE
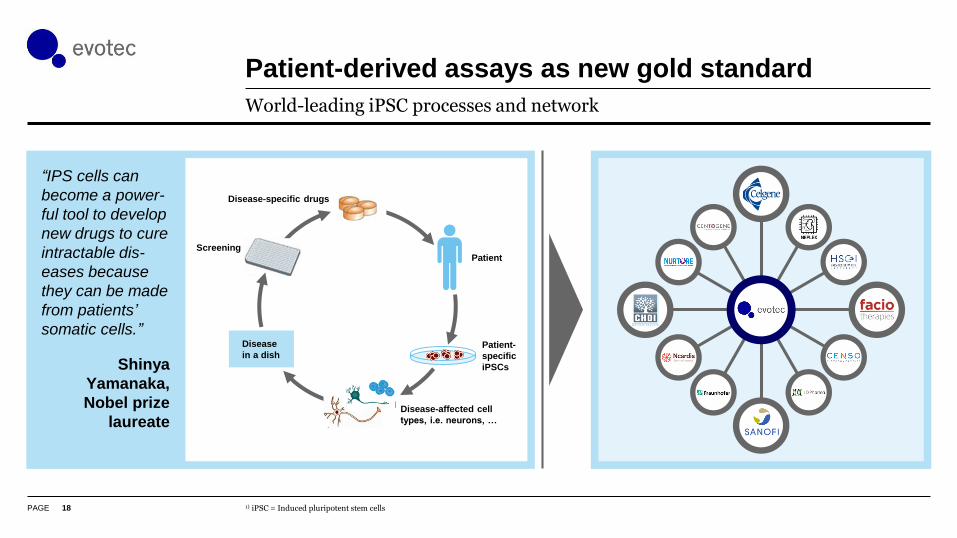
Patient-derived assays as new gold standard
18
World-leading iPSC processes and network
1) iPSC = Induced pluripotent stem cells
Patient
Patient-
specific
iPSCs
Disease-affected cell
types, i.e. neurons, …
Screening
Disease-specific drugs
Disease
in a dish
“IPS cells can
become a power-
ful tool to develop
new drugs to cure
intractable dis-
eases because
they can be made
from patients’
somatic cells.”
Shinya
Yamanaka,
Nobel prize
laureate
PAGE
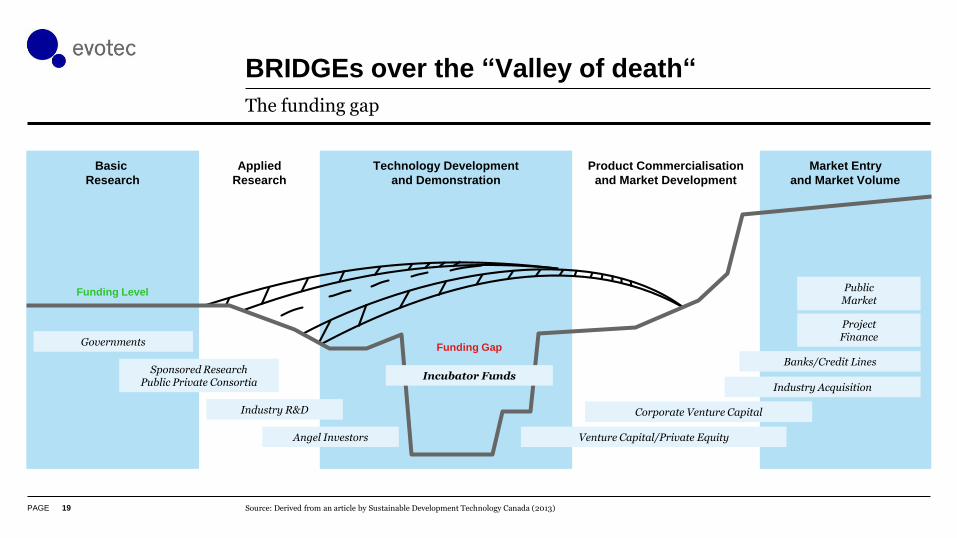
BRIDGEs over the “Valley of death“
19
The funding gap
Source: Derived from an article by Sustainable Development Technology Canada (2013)
Funding Level
Industry R&D
Angel Investors Venture Capital/Private Equity
Corporate Venture Capital
Industry Acquisition
Banks/Credit Lines
ProjectFinance
PublicMarket
Governments
Sponsored ResearchPublic Private Consortia
Funding Gap
Incubator Funds
Basic
Research
Applied
Research
Technology Development
and Demonstration
Product Commercialisation
and Market Development
Market Entry
and Market Volume
PAGE
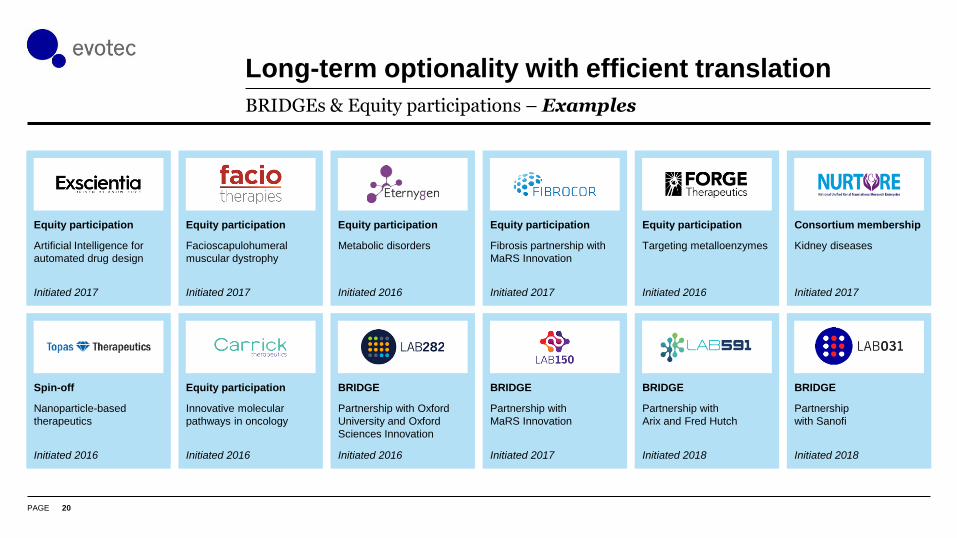
Long-term optionality with efficient translation
20
BRIDGEs & Equity participations – Examples
Equity participation
Artificial Intelligence for
automated drug design
Initiated 2017
Spin-off
Nanoparticle-based
therapeutics
Initiated 2016
Equity participation
Facioscapulohumeral
muscular dystrophy
Initiated 2017
Equity participation
Innovative molecular
pathways in oncology
Initiated 2016
Equity participation
Metabolic disorders
Initiated 2016
BRIDGE
Partnership with Oxford
University and Oxford
Sciences Innovation
Initiated 2016
Equity participation
Fibrosis partnership with
MaRS Innovation
Initiated 2017
BRIDGE
Partnership with
MaRS Innovation
Initiated 2017
Equity participation
Targeting metalloenzymes
Initiated 2016
BRIDGE
Partnership with
Arix and Fred Hutch
Initiated 2018
Consortium membership
Kidney diseases
Initiated 2017
BRIDGE
Partnership
with Sanofi
Initiated 2018
PAGE
Agenda
21
Overview
Partnered drug discovery & development
Financials & Outlook
PAGE
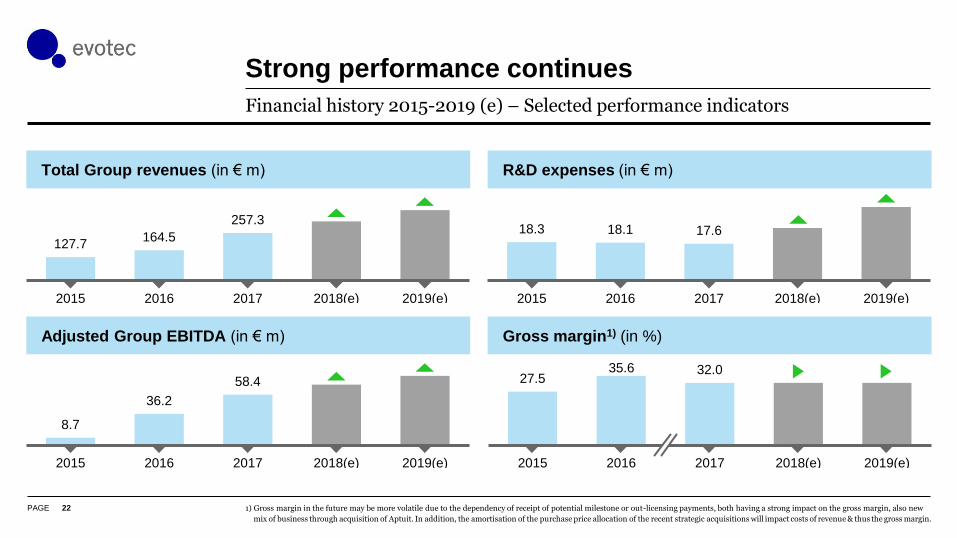
18.3 18.1 17.6
2015 2016 2017 2018(e) 2019(e)
R&D expenses (in € m)
Gross margin1) (in %)
27.535.6 32.0
2015 2016 2017 2018(e) 2019(e)
Total Group revenues (in € m)
Adjusted Group EBITDA (in € m)
127.7164.5
257.3
2015 2016 2017 2018(e) 2019(e)
8.7
36.2
58.4
2015 2016 2017 2018(e) 2019(e)
Strong performance continues
22
Financial history 2015-2019 (e) – Selected performance indicators
1) Gross margin in the future may be more volatile due to the dependency of receipt of potential milestone or out-licensing payments, both having a strong impact on the gross margin, also new
mix of business through acquisition of Aptuit. In addition, the amortisation of the purchase price allocation of the recent strategic acquisitions will impact costs of revenue & thus the gross margin.
PAGE
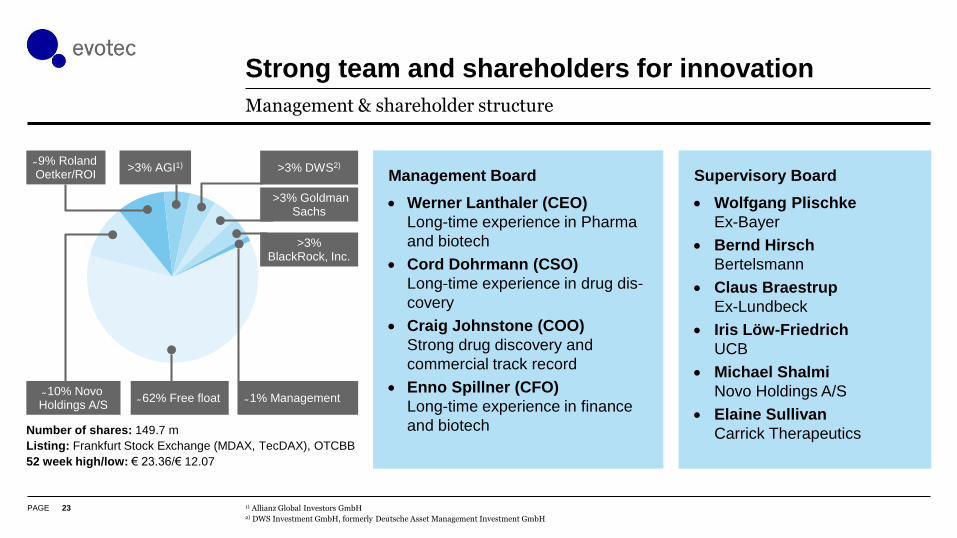
Management Board
Werner Lanthaler (CEO)
Long-time experience in Pharma
and biotech
Cord Dohrmann (CSO)
Long-time experience in drug dis-
covery
Craig Johnstone (COO)
Strong drug discovery and
commercial track record
Enno Spillner (CFO)
Long-time experience in finance
and biotech
Supervisory Board
Wolfgang Plischke
Ex-Bayer
Bernd Hirsch
Bertelsmann
Claus Braestrup
Ex-Lundbeck
Iris Löw-Friedrich
UCB
Michael Shalmi
Novo Holdings A/S
Elaine Sullivan
Carrick Therapeutics
Strong team and shareholders for innovation
23
Management & shareholder structure
1) Allianz Global Investors GmbH2) DWS Investment GmbH, formerly Deutsche Asset Management Investment GmbH
Number of shares: 149.7 m
Listing: Frankfurt Stock Exchange (MDAX, TecDAX), OTCBB
52 week high/low: € 23.36/€ 12.07
9% Roland Oetker/ROI
>3% AGI1) >3% DWS2)
>3% Goldman Sachs
>3% BlackRock, Inc.
62% Free float 1% Management 10% Novo
Holdings A/S
PAGE
Continued strong growth and new integrated service alliances
New co-owned partnerships from own R&D
New clinical initiations and important progress of co-owned pipeline
Important milestones from existing alliances
Strong outlook for 2019
24
Expected key milestones 2019
PAGE
Your contact:
Enno SpillnerChief Financial Officer
+49.(0).40.560 81-238+49.(0).40.560 81-333 [email protected]
Recommended