Mauro Mecagni, Daniela Marchettini, and Rodolfo Maino
Evolving Banking Trends in Sub-Saharan Africa
African Deparment
Key Features and Challenges
I N T E R N A T I O N A L M O N E T A R Y F U N D

A f r i c a n D e p a r t m e n t
Evolving Banking Trends in Sub-Saharan Africa
KEY FEATURES AND CHALLENGES
MAURO MECAGNI, DANIELA MARCHETTINI, AND RODOLFO MAINO
September 2015
I N T E R N A T I O N A L M O N E T A R Y F U N D

Cataloging-in-Publication Data
Cataloging-in-Publication Data Joint Bank-Fund Library
Evolving banking trends in Sub-Saharan Africa: key features and challenges / Mauro Mecagni … [et al.]. –Washington, D.C. : International Monetary Fund, 2015.pages ; cm.
At head of title: African Department.
1. Banking – Africa, Sub-Saharan. 2. Africa, Sub-Saharan – Economic policy. I. Mecagni,Mauro. II. International Monetary Fund. III. International Monetary Fund. African Department.
HG1325.D64 2015
ISBN: 978-1-51359-824-6 (print) ISBN: 978-1-51350-858-0 (web PDF)
The Departmental Paper Series covers research conducted by IMF staff, particularly on issues of broad regional or cross-country interest. The views expressed in this paper are
those of the author(s) and do not necessarily represent the views of the IMF, its Executive Board, or IMF management.
Publication orders may be placed online, by fax, or through the mail: International Monetary Fund, Publication Services P.O. Box 92780, Washington, DC 20090, U.S.A.
Tel. (202) 623-7430 Fax: (202) 623-7201 E-mail: [email protected]
www.imfbookstore.org www.elibrary.imf.org
Acknowledgment
This paper has been prepared for the European Investment Bank Africa Day Conference held in Luxemburg on July 9, 2015. The findings, interpretations, and conclusions in this paper are those of the authors and do not necessarily represent the views of the International Monetary Fund, its Executive Board, or its management.
The authors thank Anne-Marie Gulde-Wolf for valuable comments and suggestions and assume responsibility for any remaining errors. Ejona Fuli provided valuable research assistance and helped with the compilation of the data set.

Table of Contents
I. Introduction ...........................................................................................................................5
II. Stylized Facts ........................................................................................................................7A. Financial Depth .........................................................................................................7 B. Access........................................................................................................................8 C. Soundness and Efficiency .........................................................................................9 D. Dollarization ............................................................................................................13 E. Ownership................................................................................................................15 F. New Opportunities and Risks ..................................................................................15
III. Cross-Border Credit Flows and Integration with International Banks .......................17
IV. The Expansion of Pan-African Banks .............................................................................22A. A Changing Landscape ...........................................................................................22 B. Regulatory Oversight Challenges............................................................................27
V. Bank Financing for SSA Infrastructure: From Global to Regional ...............................30
VI. The Way Forward .............................................................................................................34
VII. References ........................................................................................................................37

5 INTERNATIONAL MONETARY FUND
I. Introduction Since the 1990s, sub-Saharan Africa (SSA) has been among the world’s fastest-growing regions. For the first time since the 1970s, a large number of countries in SSA have been enjoying an extended period of strong economic growth. The recent pace of growth represents a sharp break with the falling living standards and macroeconomic instability of the 1970s and 1980s—a period when the region fell behind developing countries in other parts of the world. The acceleration in growth has been accompanied, and facilitated, by a sharp reduction in inflation, which in most SSA economies is now typically in the single-digit range, despite persistent vulnerabilities to food and fuel price shocks (Figure 1.1).
Among the key factors contributing to this turnaround in economic fortunes were the improved macroeconomic policies in many countries. These include the strengthening of fiscal positions, the enhanced emphasis given to containing inflation, the liberalization of exchange controls and unification of exchange rates, and the building of foreign reserves to help contain the impact of adverse external shocks. These shifts in domestic policies were facilitated by international debt relief initiatives, which freed up fiscal space and mitigated against external payment pressures in several SSA countries.
The acceleration in economic growth has been accompanied by an expansion of access to financial services—particularly commercial banks, which have been traditionally, and remain, the backbone of financial systems in SSA. Indeed, as noted by Beck and Cull (2013), banking in SSA has undergone dramatic changes over the past 20 years. Financial liberalization and related reforms, upgrades in institutional and regulatory capacity, and more recently the expansion of cross-border banking activities with the rapid development of pan-African banking group networks have significantly changed the African banking and financial
Figure 1.1. Sub-Saharan Africa: Growth and Inflation, 1990–2016
Sources: IMF, World Economic Outlook; IMF staff calculations.
-0.08
-0.03
0.02
0.07
0.12
-8
-6
-4
-2
0
2
4
6
8
10
12
14
1990 1995 2000 2005 2010 2015
Real GrowthPercent
Projections Sub-Saharan Africa
Latin America & Caribbean Middle East & North Africa
Europe & Central Asia East Asia & Pacific
-0.08
-0.03
0.02
0.07
0.12
0
20
40
60
80
100
120
140
160
1990 1995 2000 2005 2010 2015
InflationPercent
Projections Sub-Saharan Africa
Latin America & Caribbean Middle East & North Africa
Europe & Central Asia East Asia & Pacific
6 INTERNATIONAL MONETARY FUND
landscape. Once dominated by state-owned institutions and distorted in their operations by restrictive regulations, banking systems in SSA are now deeper and more stable, and the incidence of systemic banking crises have declined dramatically in the past two decades. In fact, banking systems in SSA survived relatively unscathed the turmoil of the global financial crisis, despite indirect pressures through international trade linkages.1
Yet, despite these remarkable achievements, concerns persist that this progress may not have been significant enough to sustain future growth, that several countries still display shallow banking systems with insufficient depth and instruments, that financial inclusion—that is, the extent of access to financial services and products by the majority of the population—is still limited, and that high costs, short bank lending maturities, and limited competition remain a drag on the development of a competitive and diversified economic structure in many countries of the region.
Against this background, the purpose of this paper is to take stock of banking-sector developments in the region, outline the challenges, and discuss policies that could deal with them. In discussing trends for SSA as a whole, it is important to keep in mind the striking diversity within the region, whose 45 countries vary markedly in terms of population size, income levels, resource endowments, access to international transportation corridors, and the extent of sociopolitical stability. These diverse conditions have had significant effects on the pace of growth and on the development of financial systems, which show considerable variation in depth, size, reach, and complexity within the region.
The rest of the paper is organized as follows. Section II discusses the key stylized facts and trends of banking development in SSA, looking at a variety of dimensions such as size, depth, soundness, and efficiency. Section III takes stock of the integration of SSA banks with the international banking system. Section IV discusses the rapid expansion of pan-African banking groups and the challenges they pose for cross-border oversight. Section V looks at the role of SSA banks in financing infrastructural development. Finally, Section VI concludes by discussing financial sector policy issues linked to the need to further develop banking and financial markets and forge a stronger financial infrastructure.
1 IMF (2012).
7 INTERNATIONAL MONETARY FUND
II. Stylized FactsAgainst the macro-financial environment outlined in the previous section, this section takes stock of the current state of banking systems across sub-Saharan Africa through broad measures of financial development, covering depth, size, soundness, efficiency, and ownership.
A. Financial Depth
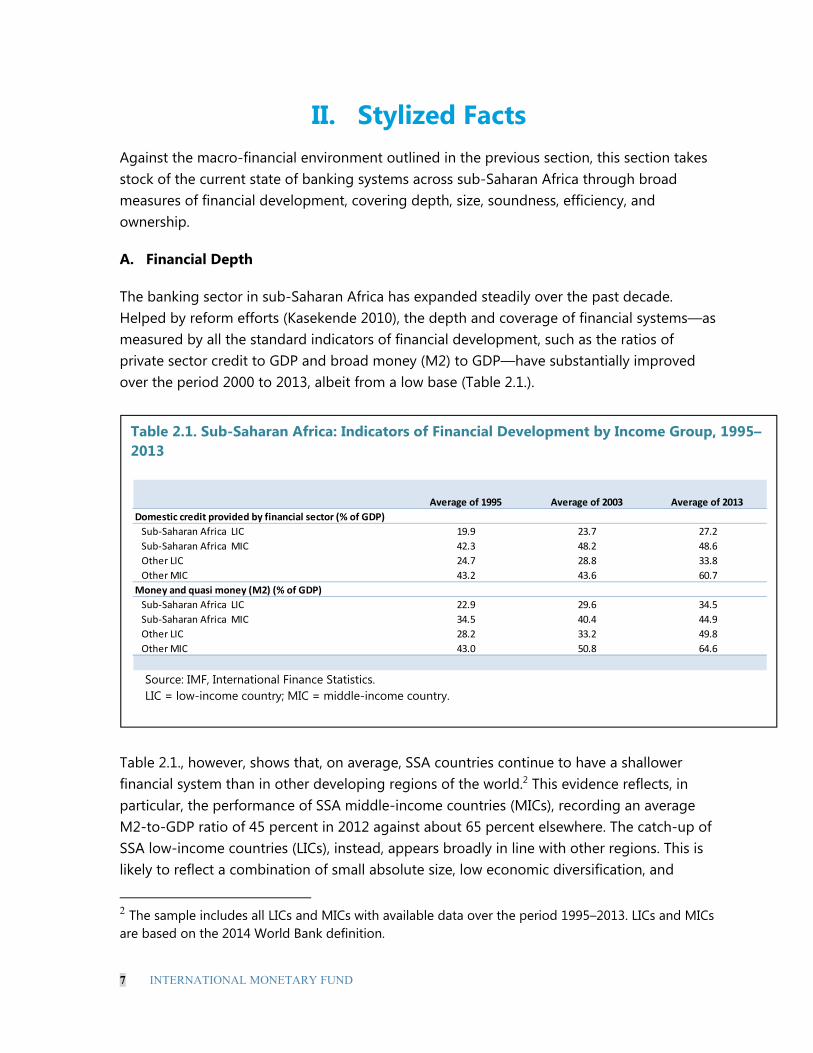
The banking sector in sub-Saharan Africa has expanded steadily over the past decade. Helped by reform efforts (Kasekende 2010), the depth and coverage of financial systems—as measured by all the standard indicators of financial development, such as the ratios of private sector credit to GDP and broad money (M2) to GDP—have substantially improved over the period 2000 to 2013, albeit from a low base (Table 2.1.).
Table 2.1., however, shows that, on average, SSA countries continue to have a shallower financial system than in other developing regions of the world.2 This evidence reflects, in particular, the performance of SSA middle-income countries (MICs), recording an average M2-to-GDP ratio of 45 percent in 2012 against about 65 percent elsewhere. The catch-up of SSA low-income countries (LICs), instead, appears broadly in line with other regions. This is likely to reflect a combination of small absolute size, low economic diversification, and
2 The sample includes all LICs and MICs with available data over the period 1995–2013. LICs and MICs are based on the 2014 World Bank definition.
Table 2.1. Sub-Saharan Africa: Indicators of Financial Development by Income Group, 1995–2013
Source: IMF, International Finance Statistics. LIC = low-income country; MIC = middle-income country.
Average of 1995 Average of 2003 Average of 2013
Domestic credit provided by financial sector (% of GDP)
Sub-Saharan Africa LIC 19.9 23.7 27.2
Sub-Saharan Africa MIC 42.3 48.2 48.6
Other LIC 24.7 28.8 33.8
Other MIC 43.2 43.6 60.7
Money and quasi money (M2) (% of GDP)
Sub-Saharan Africa LIC 22.9 29.6 34.5
Sub-Saharan Africa MIC 34.5 40.4 44.9
Other LIC 28.2 33.2 49.8
Other MIC 43.0 50.8 64.6

8 INTERNATIONAL MONETARY FUND
infrastructure weaknesses, which represent critical bottlenecks to the development of African financial markets above a certain size. Confirming these observations, the ratio of M1/M2 in SSA has gradually declined over the past decade but remains significantly higher than in Latin America and the Caribbean (Figure 2.1).3 Ongoing innovation in SSA payment methods is likely, however, to address some of the difficulties that these countries still face in moving to noncash means of payment (see “Access” section below).
B. Access
Access has also improved in recent years. Account penetration in SSA countries has recorded a remarkable increase of almost 20 percent between 2011 and 2014, although from a low base (20.5 percent of adult population). Account penetration has particularly improved in East and southern Africa (Figure 2.2). As mentioned before, these favorable developments have been facilitated by ongoing financial innovation. In particular, the rapid penetration of mobile phones has contributed to the fast rise of mobile banking in SSA, providing an opportunity to reach consumers in remote areas where efficient transport infrastructure is lacking. In SSA, almost one-third of account holders—or 12 percent of all adults—reported having a mobile money account (either a mobile money account or an account at a financial institution). Mobile money accounts are especially widespread in East Africa, where 20 percent of adults reported having a mobile money account and 10 percent a mobile money
3 M1 refers to monetary aggregate including cash in circulation and current account deposits in banks while M2 consists of M1 plus time deposits.
Figure 2.1. Sub-Saharan Africa and Latin America: Ratios of M1 to M2, 2001–14
Source: IMF, International Financial Statistics.
0
10
20
30
40
50
60
70
2001
2002
2003
2004
2005
2006
2007
2008
2009
2010
2011
2012
2013
2014
Sub-Saharan Africa
Latin America and Caribbean

9 INTERNATIONAL MONETARY FUND
account only (Figure 2.3).4 Despite these improvements, financial access in SSA remains low on an absolute level, and lags behind other regions (Figure 2.4).
C. Soundness and Efficiency
Financial soundness has improved over the years, but some persistent weaknesses remain. In 2012–13, average non-performing loans (NPLs) for all SSA LICs stood at close to 7 percent, compared with 9.4 percent in 1996–99 and 9.1 percent in 2000–03 (Table 2.2). NPLs for SSA MICs remain slightly higher—although figures ranged from as high as 13 percent for Ghana to very small numbers for Namibia (Figure 2.5). Provision rates (as a percentage of problem loans) declined between the late 1990s and 2000–03 for all SSA countries, but they had rebounded by 2012. Despite these improvements, asset quality and provisioning remain low compared with developing countries in other regions (Table 2.2).
4 Kenya has the highest share of adults with a mobile money account, at 58 percent, followed by Somalia, Tanzania, and Uganda with about 35 percent. In southern Africa, penetration of mobile money accounts is also relatively high at 14 percent, but just 2 percent of adults reported having a mobile money account only.
Figure 2.2. Account Penetration in Sub-Saharan Africa Countries (% of Adult Population)—Comparison 2011–14
Source: World Bank, Global Findex database.
0
10
20
30
40
50
60
70
80
90
Ang
ola
Beni
n
Bots
wan
a
Burk
ina
Faso
Buru
ndi
Cam
eroo
n
Chad
Cong
o, D
em. R
ep.
Cong
o, R
ep.
Gab
on
Gha
na
Gui
nea
Keny
a
Mad
agas
car
Mal
awi
Mal
i
Mau
rita
nia
Mau
ritiu
s
Nig
er
Nig
eria
Rwan
da
Sene
gal
Sier
ra L
eone
Sout
h A
fric
a
Suda
n
Tanz
ania
Togo
Uga
nda
Zam
bia
Zim
babw
e
2011
2014
Average 2011
Average 2014

10 INTERNATIONAL MONETARY FUND
Most countries have implemented an 8 percent minimum risk-weighted capital adequacy ratio (CAR), and actual ratios in most countries comfortably exceed this minimum. In 2012–13, the banks’ capital-to-total-assets ratio stood at about 11 percent for MICs and 14
Figure 2.3. Account Penetration in Countries with Mobile Money Account Penetration of 10 Percent or More
Source: World Bank, Global Findex database.
Figure 2.4. Account Penetration around the World, 2014
Source: World Bank, Global Findex database.

11 INTERNATIONAL MONETARY FUND
percent for LICs, comparing well with developing countries from other regions. For the same period, the SSA ratio of liquid assets to total assets exceeded 25 percent. Persistent excess liquidity is mainly due to the difficulty in identifying sufficient lending opportunities, a problem shared with other developing countries (Table 2.2). Improvements in asset quality, progress in reducing the role of state-owned banks in bank lending, and enhanced supervision all contributed to the strengthening of banking systems’ financial health. As a result, the incidence of systemic banking crises—a relatively common event in SSA in the 1980s and early 1990s—has declined markedly, with only one major crisis recorded in the past decade (Figure 2.6).
0 5 10 15 20 25 30 35
UgandaSwaziland
South Africa
Sierra LeoneRwanda
Nigeria
NamibiaMozambique
Lesotho
KenyaGhanaGabon
Average2004 2013
Source: IMF staff calculations based on the African Department survey on financial sector
development. Latest data available based on survey conducted in 2013.
Figure 2.5. Sub-Saharan Africa: Nonperforming Loans in 2004 and 2013 (Percent of Total Loans)

12 INTERNATIONAL MONETARY FUND
Figure 2.6. Sub-Saharan Africa: Systemic Banking Crises, 1975–2011
Sources: Reinhart and Rogoff (2010); Laeven and Valencia (2013).
Profitability indicators, as measured by net interest income and return on assets, have declined between 2004 and 2011 but remain very high, pointing to a lack of competition (Table 2.3). Operational efficiency remains relatively low, as shown by a high ratio of overhead costs to total assets, with banking systems in SSA LICs less efficient than in MICs.
Banking systems in most SSA countries are characterized by high concentration, as measured by the share of banking assets held by the five largest banks. Bank restructuring, privatization, and new entries reduced concentration ratios slightly from the late 1990s to 2005–11, but these remain high when compared with other developing countries (Figures 2.7 and 2.8). As stressed by Gulde and others (2006), the small market size is seen as a major
1975 1980 1985 1990 1995 2000 2005 20100
1
2
3
4
5
6
7
Table 2.2. Sub-Saharan Africa: Financial Soundness Indicators, 1996–2013 Table 2.2. SSA: Financial soundness indicators, 1996–2013
1996–99 2000–03 2012–13 1996–99 2000–03 2012–13 1996–99 2000–03 2012–13 1996–99 2000–03 201
MICs in SSA 9.2 8.3 7.8 14.5 18.9 10.6 26.3 28.8 27.5 44.4 43.9
LICs in SSA 9.4 9.1 6.9 15.6 21.4 13.8 30.5 28.8 28.9 74.8 41.3
MICs in other regions 8.5 15.6 1.9 14.1 17.1 9.4 20.0 21.2 26.6 65.5 39.9
LICs in other regions 9.1 9.4 8 13.8 15.7 13.9 21.2 21.9 25.8 40.4 29.6
MIC: Middle-income countriesLIC: Low-income countriesSources: Financial Soundness Indicators, IMF; Gulde et al (2006).
Nonperforming loans Total capital Liquid assets Provisioning
(percent of problem loa
(percent of assets)

13 INTERNATIONAL MONETARY FUND
factor contributing to concentration, given the need for financial institutions to achieve economies of scale and scope.
D. Dollarization
Dollarization—the use of foreign currencies as a medium of exchange, store of value, or unit of account—is a notable feature of financial development under macroeconomically fragile conditions and has been a persistent characteristic of SSA countries.
Table 2.3. Sub-Saharan Africa: Efficiency Indicators, 2004–11*
Sources: World Bank, Global Financial Development Database; IMF staff calculations. * Latest data available are from 2011. 1 Percent of risk-weighted assets. 2 Percent of total loans.
2004 2011 2004 2011 2004 2011
Low-income countries 8.5 7.5 8.4 6.4 3.2 3.1
Middle-income countries 6.7 5.7 6.2 4.4 2.3 2.6
Interest margin
(% of assets)1
Overhead
(% of assets) 2
Return on assets
(before tax)
0.0
10.0
20.0
30.0
40.0
50.0
60.0
70.0
80.0
90.0
100.0
SSA MICs SSA LICs Other MICs Other LICs
Figure 2.7. Sub-Saharan Africa: Share of Banking Assets Held by the Five Largest Banks 1998–11
1998–-2004
2005–2011
Sources: IMF staff calculations are based on the African Department survey on financial sector development. Latest data available are based on a survey conducted in 2013.

14 INTERNATIONAL MONETARY FUND
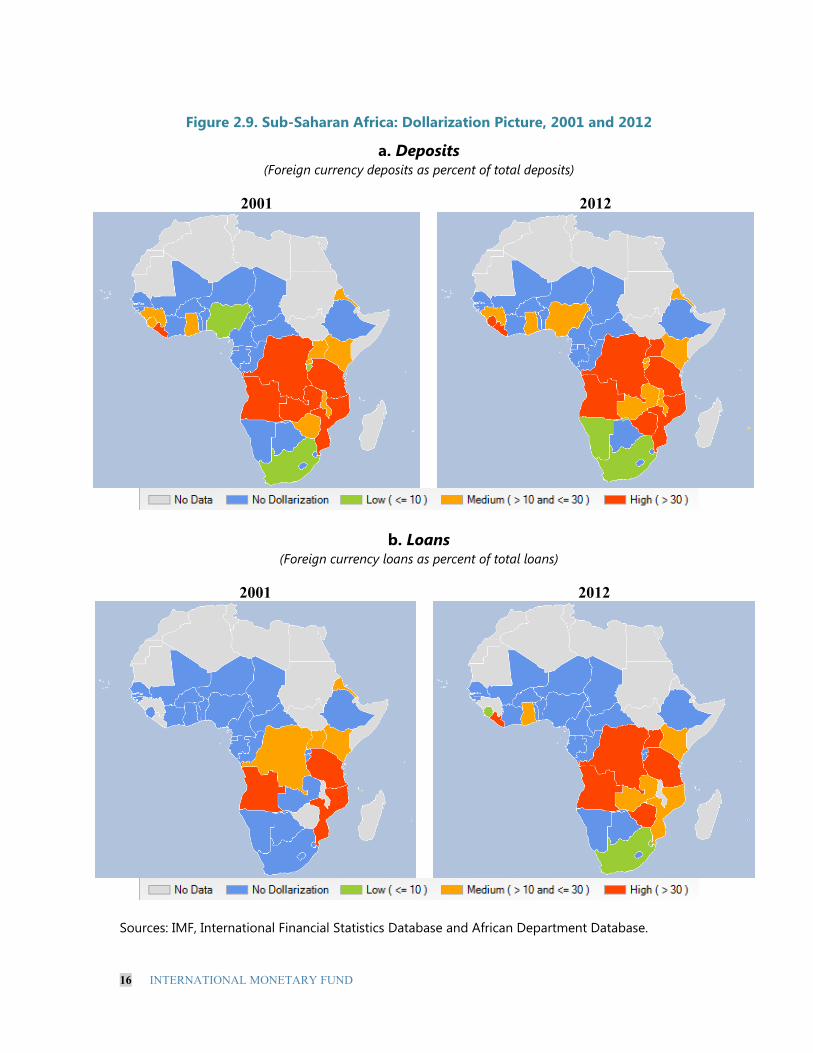
From the five most dollarized economies (Angola, Democratic Republic of the Congo, Liberia, São Tomé and Príncipe, and Zambia) only Angola has recorded a downward trend in both the share of bank deposits and loans denominated in foreign currency in the period considered. The Democratic Republic of the Congo, Liberia, and São Tomé and Príncipe, by contrast, recorded an upward trend during the recent decade.5
Figure 2.9 maps dollarization in SSA in 2001 and 2012. All of the most highly dollarized countries in the region (Angola, Democratic Republic of the Congo, Liberia, Mozambique, São Tomé and Príncipe, and Zambia) are natural resource–dependent economies. The number of countries with high deposit dollarization (above 30 percent) remained the same over the period, but the composition of this group changed. While Tanzania and Mozambique managed to reduce their respective dollarization level to below 30 percent, Sierra Leone did the opposite and, as noted, Zimbabwe became fully dollarized. On the other hand, the number of countries with a high level of loan dollarization increased from four (Angola, Mozambique, São Tomé and Príncipe, and Tanzania) to six (Angola, the Democratic Republic of the Congo, Liberia, São Tomé and Príncipe, Tanzania, and Uganda).
5 Mecagni, maino, and others (2015)
AGO
BENBWA
BFA
BDI
CMR
CPV
COM
GNQ
ETH
GAB
GHA
GNB
KEN
LSO
LBR
MDG
MWI MLI
MUSMOZ
NAM
NER
NGA
COG
COD
RWA
STP
SEN
SYC
SLE
ZAF
SSD
SWZ
GMB TGO
UGA
TZA
ZMB
ZWE
0.0
0.5
1.0
1.5
2.0
2.5
3.0
3.5
4.0
-2 -1 0 1 2 3 4 5 6 7
Log
ban
k n
um
be
r
Log GDP (US$)
Figure 2.8. Sub-Saharan Africa: Size of Economy and Number of Banks, 2012
Sources: IMF estimates and World Economic Outlook.

15 INTERNATIONAL MONETARY FUND
E. Ownership
Since 1990, banking systems in SSA have steadily shifted from majority state-owned banking to private-owned banking and toward higher levels of foreign ownership (Table 2.4). In fact, the restructuring of state-owned banks and financial liberalization allowed the entry of foreign banking institutions and contributed to higher competition.
Increasingly, foreign ownership includes banks headquartered in other African countries (pan-African banks or PABs), which are playing a key role in driving financial innovation and development in Africa. The PABs are contributing to financial integration and inclusion, and spurring innovation and competition.
F. New Opportunities and Risks
Based on the evidence presented in this section, SSA countries have gone a long way in the process of financial development. Despite the fact that SSA banking systems remain small when contrasted with developing countries in other regions, progress has been steady over the past decade and has even accelerated in recent years.6
A combination of factors has contributed to these recent developments. The analysis in this section has already mentioned the role of financial innovation. Increasing global and regional integration may also provide new opportunities for finance in Africa, as will be illustrated in the next two sections. These developments have the potential to bridge SSA’s large financing gap and unlock its potential but also bring new risks that need to be carefully monitored.
6 IMF (2015).
Table 2.4. Sub-Saharan Africa: Ownership in the Banking Sector, 1990–2011*
Sources: Gulde and others (2006); IMF staff calculations based on the African Department survey on financial sector development. *Latest data available are based on a survey conducted in 2013.
(Banks' assets divided by total system's assets)
1990–99 2000–03 2010–11 1990–99 2000–03 2010–11
MICs 0.2 0.1 0.1 0.4 0.6 0.7
LICs 0.3 0.2 0.1 0.4 0.4 0.6
State Ownership Foreign Ownership
16 INTERNATIONAL MONETARY FUND
Figure 2.9. Sub-Saharan Africa: Dollarization Picture, 2001 and 2012
a. Deposits (Foreign currency deposits as percent of total deposits)
2001 2012
b. Loans (Foreign currency loans as percent of total loans)
2001 2012
Sources: IMF, International Financial Statistics Database and African Department Database.
17 INTERNATIONAL MONETARY FUND
III. Cross-Border Credit Flows and Integrationwith International Banks
International banks have traditionally been an important source of financing in emerging markets and developing economies (EMDEs). Within their overall portfolio, however, the exposure of bank lenders to SSA countries has remained relatively small, both in absolute terms and when compared with other regions (Figures 3.1 and 3.2). In terms of recipient countries’ GDP, however, this exposure is significant, and in some cases very large (Figure 3.8).
Cross-border claims from international banks that report to the Bank for International Settlements (BIS) can provide a useful first approximation of the extent of integration between the SSA region and the international banking system.7 Nonetheless, cross-border exposure, by itself, does not provide a complete picture of the involvement of international banks in SSA. Some of these institutions, in particular European banks, have had a historical presence in the region, and manage subsidiaries, branches, and representative offices in many SSA countries. The importance of these subsidiaries is particularly large in some countries, with affiliates of British, French, and Portuguese financial institutions playing a systemic role.
That said, in absolute terms, cross-border exposure to SSA countries has remained broadly stable since 2007, at a magnitude of about US$180 billion.8 Relative to other regions, the share of claims on SSA countries is small (less than 11 of total consolidated cross-border claims of BIS-reporting banks to non-European emerging markets) and has declined over the years, mainly reflecting the orientation toward countries in Asia (Figure 3.1). The declining share for the SSA region reflects the reduction in weight of cross-border claims to South Africa, where domestic lenders have expanded considerably at the expense of foreign banks (see also “The Expansion of Pan-African Banks” section below)—in part reflecting the incorporation in South Africa in 2013 of Barclays‘s cross-border operations in Africa. Cross-border exposure to other SSA countries has instead increased in recent years, and the share of international bank lending flows directed to these countries remained broadly stable over the past decade (Figure 3.2).
International bank exposure to SSA (excluding South Africa) rose considerably in the run-up to the global financial crisis, but declined in the years after (Mlachila et al 2013). Cross-border bank flows started to recover in the second half of 2010. Some important changes in the structure of international bank flows are noteworthy. Most important, the weight of most
7 BIS (2012)
8 The analysis in this section excludes cross-border claims to Liberia (international shipping center).

18 INTERNATIONAL MONETARY FUND
traditional lenders (mainly from France, United Kingdom, Germany, and United States) declined in favor of a greater role of banks originating from other countries (Figures 3.3 and 3.4). The increased role of non-traditional lenders reflects a number of factors, including the process of deleveraging and balance sheet adjustment undertaken by a number of European banks, as well as the introduction of stricter international standards and regulatory requirements. All preceding factors have induced bank lenders to change their business strategy toward assets treated more favorably than cross-border activities under enhanced prudential standards.
Figure 3.1. Cross-Border Bank Claims on Sub-Saharan Africa —International Comparison (2006–14)
Source: Bank for International Settlements.
SS
A S
ha
re o
f To
tal
Bill
ion
s o
f US
$
10%
11%
12%
13%
14%
15%
16%
17%
18%
19%
20%
0
200
400
600
800
1,000
1,200
1,400
1,600
1,800
2,000
2006
-Q1
2006
-Q3
2007
-Q1
2007
-Q3
2008
-Q1
2008
-Q3
2009
-Q1
2009
-Q3
2010
-Q1
2010
-Q3
2011
-Q1
2011
-Q3
2012
-Q1
2012
-Q3
2013
-Q1
2013
-Q3
2014
-Q1
2014
-Q3
Consolidated Claims of BIS-Reporting Banks
Sub-Saharan Africa
Latin America and Caribbean
Middle East and North Africa
Asia (excluding Japan)
SSA Share of Total (RHS)

19 INTERNATIONAL MONETARY FUND
Figure 3.2. Cross-Border Bank Claims on Sub-Saharan Africa (Excluding South Africa)—International Comparison (2006–14)
Source: Bank for International Settlements.
Figure 3.3. Consolidated Foreign Claims on European Banks on Sub-Saharan Africa (excluding South Africa) (2002Q1–14Q4)
Source: Bank for International Settlements. * Sum of claims from France, Germany, and United Kingdom.
SS
A S
hare of T
ota
l
Bill
ion
s o
f US
$
0%
2%
4%
6%
8%
10%
12%
0
200
400
600
800
1,000
1,200
1,400
1,600
1,800
2,000
2006
-Q1
2006
-Q3
2007
-Q1
2007
-Q3
2008
-Q1
2008
-Q3
2009
-Q1
2009
-Q3
2010
-Q1
2010
-Q3
2011
-Q1
2011
-Q3
2012
-Q1
2012
-Q3
2013
-Q1
2013
-Q3
2014
-Q1
2014
-Q3
Consolidated Claims of BIS-Reporting Banks
Sub-Saharan Africa (excluding South Africa)
Latin America and Caribbean
Middle East and North Africa
Asia (excluding Japan)
SSA Share of Total (excluding South Africa) (RHS)
Bill
ions
of
US
$
Percent of T
otal
45
50
55
60
65
70
75
80
85
90
0
10
20
30
40
50
60
70
20
02
-Q1
20
03
-Q1
20
04
-Q1
20
05
-Q1
20
06
-Q1
20
07
-Q1
20
08
-Q1
20
09
-Q1
20
10
-Q1
20
11
-Q1
20
12
-Q1
20
13
-Q1
20
14
-Q1
FR:FranceGB:United KingdomDE:GermanyOther European LendersShare of Traditional European Lenders* on Total - smoothed (RHS)

20 INTERNATIONAL MONETARY FUND
Figure 3.4. Total Consolidated Foreign Claims of European Banks to Sub-Saharan Africa (Excluding South Africa) (2002Q1–14Q4)
Source: Bank for International Settlements. * Sum of claims from Australia, Brazil, Canada, Chinese Taipei, and Korea.
The retrenchment of most traditional European bank lenders raises some concerns in regard to development financing, since before the crisis European banks were the principal providers of infrastructure project financing to emerging markets and developing countries, mainly in the form of international syndicated loans (Feyen and Del Mazo 2012; BIS 2012, and Mecagni 2012). While new European banks have entered the market, most of the new bank financing flows in most recent years were directed to resource-rich countries prima facie, suggesting that the extractive industry may have been the primary beneficiary of these new cross-border bank lending flows.
Indeed, the share of longer-term cross-border claims from BIS-reporting banks to SSA oil- and/or gas-rich countries has been on an increasing trend for more than a decade, despite some volatility (Figure 3.5). By comparison, the share of cross-border claims to other SSA countries (without proven oil and gas reserves) has fluctuated around a stable, low level (Figure 3.6).
The analysis of cross-border bank exposure to individual recipient countries confirms the important role of two mainly country-specific factors—resource endowment and the business environment. Taking 2013 as an illustration, the highest exposure of international banks was, outside of South Africa, to resource-rich countries such as Angola, Gabon, Ghana, Mozambique, and Nigeria (Figure 3.7).
Bill
ions
of
US
$
Percent of T
otal
75
80
85
90
95
100
105
110
0
2
4
6
8
10
12
14
20
02
-Q1
20
03
-Q1
20
04
-Q1
20
05
-Q1
20
06
-Q1
20
07
-Q1
20
08
-Q1
20
09
-Q1
20
10
-Q1
20
11
-Q1
20
12
-Q1
20
13
-Q1
20
14
-Q1
United States
Japan
Other non-European BIS-Reporting Countries*
US Banks' Share on Total - moving average (RHS)

21 INTERNATIONAL MONETARY FUND
Figure 3.5. Distribution of Claims (Two Years and above) by Country Destination (Excluding South Africa), Breakdown by Oil/Gas Endowment (1999Q4–14Q4)
Source: Bank for International Settlements. * Sum of claims from Angola, Cameroon, Chad, Republic of Congo, Equatorial Guinea, Gabon, Ghana,Mozambique, Nigeria, Sudan, and Uganda.
Figure 3.6. Distribution of Claims (Two Years and above) by Country Destination (Excluding South Africa), Breakdown by Income Level (1999Q4–14Q4)
Source: Bank for International Settlements.
* Sum of claims from Benin, Burkina Faso, Burundi, Central African Republic, Comoros, Eritrea,Ethiopia, Guinea, Guinea Bissau, Kenya, Malawi, Mali, Niger, Rwanda, Sierra Leone, Tanzania, The Gambia, Togo, and Zimbabwe.
Bill
ions
of
US
$
Percent of T
otal
y = 0.0019x + 0.5247
0.45
0.5
0.55
0.6
0.65
0.7
0.75
0
5
10
15
20
25
30
35
40
19
99
-Q4
20
00
-Q3
20
01
-Q2
20
02
-Q1
20
02
-Q4
20
03
-Q3
20
04
-Q2
20
05
-Q1
20
05
-Q4
20
06
-Q3
20
07
-Q2
20
08
-Q1
20
08
-Q4
20
09
-Q3
20
10
-Q2
20
11
-Q1
20
11
-Q4
20
12
-Q3
20
13
-Q2
20
14
-Q1
20
14
-Q4
Oil/Gas Rich Countries*
Other SSA Countries
Loans to Oil/Gas-Rich Countries on Total (RHS)
Bill
ions
of
US
$
Percent of T
otal
y = -0.0001x + 0.1572
0.1
0.12
0.14
0.16
0.18
0.2
0.22
0.24
0
5
10
15
20
25
30
35
40
19
99
-Q4
20
00
-Q3
20
01
-Q2
20
02
-Q1
20
02
-Q4
20
03
-Q3
20
04
-Q2
20
05
-Q1
20
05
-Q4
20
06
-Q3
20
07
-Q2
20
08
-Q1
20
08
-Q4
20
09
-Q3
20
10
-Q2
20
11
-Q1
20
11
-Q4
20
12
-Q3
20
13
-Q2
20
14
-Q1
20
14
-Q4
LICs with No Proven Hydrocarbon Reserves*
Other SSA Countries
Share of Loans to LICs with No Hydrocarbon Reserves on Total (RHS)

22 INTERNATIONAL MONETARY FUND
Among non-resource-rich countries, frontier markets with a favorable business environment and/or a relatively diversified economy (such as Kenya, Mauritius, and Senegal, in addition to the already noted Ghana, Mozambique, and Nigeria) were able to attract large bank flows. Relative to the size of their economy, small island economies are the largest outliers (Figure 3.8), in part reflecting the fact that some have established themselves as offshore financial centers. On the opposite side of the spectrum, a number of countries with weak institutional frameworks have not been able to leverage foreign private bank funding even in the presence of significant resource endowments (Democratic Republic of the Congo, Niger, and Sudan). This confirms that access to private finance for fragile low-income countries remains a challenge.
IV. The Expansion of Pan-African Banks
A. A Changing Landscape
Another major change in the African banking landscape in recent years has been the emergence and rapid expansion of pan-African banking groups. These banks have created significant cross-border networks and are, in some respects, overtaking the role of the European and U.S. banks, which had traditionally dominated banking activities in SSA.
This new phenomenon reflects a number of converging push and pull factors.9 The most important include the improved political and macroeconomic stability in many countries; increasing trade linkages and economic integration, with incentives for banks to follow their customers in their expansion abroad; and the diversification opportunities in markets with large unbanked populations, relative to more saturated home markets.
Seven major PABs dominate the landscape in terms of their geographic footprint, each with a presence in at least 10 African countries (Figures 4.1. and 4.2). Three of these groups are headquartered in Morocco, two in Togo, and one each in Nigeria and South Africa. Additional banks, primarily from Kenya, Nigeria, and South Africa, have more of a regional presence, with operations in at least five countries. PABs have expanded mainly through subsidiaries, with quite different strategies and resulting structures, in particular in regard to the weight of cross-border operations and networks relative to total consolidated assets (Figure 4.3).
9 Enoch et al (2015).

23
23 INTERNATIONAL MONETARY FUND
Figure 3.7. Major Sub-Saharan Africa Recipients of Cross-Border Claims (Percent of Total, 2013)
Source: Bank for International Settlements.
Figure 3.8. Major Sub-Saharan Africa Recipients* of Cross-Border Claims, 2013Q4 (Percent of GDP)
* Excludes offshore centers: Seychelles (228% of GDP) and Mauritius (103% of GDP).Source: Bank for International Settlements.
58.4
8.5
6.1
5.0
3.3
2.7
2.1
1.9
1.8
1.7
1.51.0 0.8 0.8 0.5
0.5
3.5
South AfricaAngolaMauritiusNigeriaMozambiqueGhanaCôte d'IvoireSeychellesSenegalCameroonKenyaMadagascarGabonCabo VerdeBurkina FasoTanzaniaOther Countries
0%
10%
20%
30%
40%
50%
60%
70%
80%
90%
Cap
e V
erd
eM
oza
mb
iqu
eSo
uth
Afr
ica
Sen
ega
lSã
o T
om
é a
nd
Pri
nci
pe
Mad
agas
car
An
gola
Cô
te d
'Ivo
ire
Togo
Cam
ero
on
Mau
rita
nia
Gh
ana
Gab
on
Bu
rkin
a Fa
soK
en
yaZi
mb
abw
eB
en
inC
had
Co
mo
ros
Co
ngo
, Re
p.
Zam
bia
Bo
tsw
ana
Uga
nd
aM
ali
Ce
ntr
al A
fric
an R
ep
ub
licC
on
go, D
em
. R
ep
.Ta
nza
nia
Swaz
ilan
dN
ige
ria
Nam
ibia
Bu
run
di
Sie
rra
Leo
ne
Nig
er
Mal
awi
Gam
bia
, Th
eSu
dan
Erit
rea
Equ
ato
rial
Gu
ine
aG
uin
ea
Gu
ine
a-B
issa
uEt
hio
pia
Rw
and
a
24 INTERNATIONAL MONETARY FUND
These groups currently have a systemic presence in around 36 SSA countries and are now more important in the continent than the long-established European and U.S. banks (Figure 4.4).
The expansion of PABs offers a number of opportunities and benefits, as these institutions are playing an important role in driving financial innovation and development. The expansion of these banks is improving competition and supporting financial inclusion, giving rise to greater economies of scale. In addition, these institutions have also become the lead arrangers of syndicated loans for SSA infrastructure financing, filling the gap left during the recent crisis by European banks (see the next section for greater detail). Moreover, reflecting more advanced regulatory practices in Morocco, South Africa, and, to a degree, in Kenya and Nigeria, the PABs based there and their home regulators are also inducing host authorities to upgrade supervisory and accounting norms.
At the same time, the rapid expansion of PABs and their systemic importance to a large number of SSA countries pose new oversight challenges, which, if left unaddressed, could raise systemic risks. Greater integration has benefits, but interconnectedness means that countries are more exposed to spillovers from cross-border shocks. The spread of PABs could act as a channel of contagion across African countries, if a parent bank or important subsidiaries were to encounter financial distress.10 For host authorities where PABs are systemic, risks may also arise when home authorities or parent institutions take unilateral or uncoordinated actions with implications for financial stability in the host jurisdiction.11 These risks are heightened by the fact that supervisory capacity is limited and under-resourced in most of Africa, particularly in the area of cross-border oversight.
10 The subsidiary model may reflect the regulators’ wish to minimize contagion risks. But while requiring separately capitalized subsidiaries reduces the extent of possible contagion, it does not eliminate it—subsidiaries may well have exposures to their parents or to other bank or nonbank entities within the same group. 11 The experience of several central and eastern European countries with large foreign banks during the global financial crisis is instructive. The greater the asymmetry in economic size between home and host, other things equal, the greater the likelihood that an overall strategy for a bank will not take account of the host country, and the more likely that financial stability will be jeopardized in the host country if problems emerge in the home country.

25 INTERNATIONAL MONETARY FUND
Figure 4.1. Major Pan African Banks: Cross-Border Expansion, 2002–14
(Number of subsidiaries in SSA)1
Sources: Bank websites and annual reports. 1 BMCE is a majority owner of Bank of Africa Group since 2010.
Figure 4.2. Pan African Banks: Size and Share of Cross-Border Subsidiaries, 2013
Sources: Annual bank reports; Bankscope; IMF staff calculations.
0
5
10
15
20
25
30
35
40
Attijariwafa Bank of Africa
GBCP UBA Standard Bank
Ecobank Oragroup
2002 2006 2010 2014
0
10
20
30
40
50
60
70
80
90
100
0
20
40
60
80
100
120
140
160
180
Attijariwafa BMCE GBCP UBA Standard Bank
Ecobank Oragroup
Ass
et
Shar
e o
f SSA
Su
bsi
dia
ries
(Pe
rcen
t)
Cons
olid
ated
Ass
ets (
Billi
ons o
f U.S
. dol
lars
)
Consolidated Assets Asset share of SSA Subsidiaries (RHS)

26 INTERNATIONAL MONETARY FUND
Figure 4.3. Contrasting Pan-African Bank Structure: Dominant Home Versus Dominant Network
Standard Bank Ecobank
Sources: Annual bank reports; Bankscope; and IMF staff calculations. Note: The size of the ball indicates the asset share in consolidated assets of that subsidiary. A red ball represents a systemically important presence with a deposit share exceeding 10 percent of banking system deposits.
Figure 4.4. Selected Pan African Banks and Foreign Banks: Systemic Importance by Country, 2013
Major PABS Selected Foreign Banks
Sources: Annual bank reports; Bankscope; and IMF staff calculations. Note: Systemically important presence includes parents in their home countries and subsidiaries with a deposit share of more than 10 percent of banking system deposits.
South Africa HQ
Nigeria
Mauritius Kenya
Namibia
Mozambique
Ghana
Uganda
Botswana
Zambia
Lesotho
Angola
Tanzania
Swaziland
Zimbabwe
Malawi
DR Congo
Nigeria
Côte d'IvoireBurkina Faso
Senegal
Benin
Cameroon
Mali
EcobankTransnational Incorporated
(ETI)
Keny
R Congo
Chad
Niger
Gabon
Guinea
Liberia
CAR
Ghana
Rwanda
DR Congo
ZambiaZimbabwe
Tanzania
UgandaGuinea Bissau
Sierra Leone
MalawiBurundi
GambiaEquatorial Guinea
Cape Verde
Sao Tome and Principe
Togo

27 INTERNATIONAL MONETARY FUND
B. Regulatory Oversight Challenges
A number of challenges need to be addressed if PABs are to achieve continued growth with financial stability in Africa.
Among the most urgent issues are the lack of formal regulatory oversight of bank holding companies in the West African Economic and Monetary Union (WAEMU) and their supervision on a consolidated basis. In fact, at least two large PABs operate in the region as unregulated holding companies. Moreover, fitness and propriety of owners and shareholders of PABs are not always fully assessed and ownership structures, in some cases, are opaque.
The availability of financial data is also limited in many countries, and the exchange of data among supervisors is constrained by national secrecy laws. In particular, limited information on cross-border exposures within a PAB makes it hard for supervisors to get a firm understanding of potential spillover risks. The lack of a single accounting standard and different levels of implementation of Basel accords across the continent further complicate the assessment of the banks’ overall situation (Box 4.1 and Figure 4.5).
Cooperation on cross-border supervision has started, but efforts to strengthen consolidated oversight need to be intensified. The Central Bank of Nigeria requires a memorandum of understanding with home regulators before allowing a bank to be established in its jurisdiction. Quarterly meetings of the West African Monetary Institute include discussions of PAB issues. In Kenya and the East African Community (EAC), several joint inspections have taken place and supervisory colleges have been established for a few PABs, and others are planned.
Nonetheless, home authorities should establish supervisory colleges for all systemic PABs. These supervisory colleges are regarded as the best vehicle for supervisors to exchange information, despite the emergence of some problems during the recent crisis.
Regional currency unions, such as the West African Monetary Union (WAEMU), face particular challenges on the interface of responsibilities between regional and national authorities. The WAEMU operates as a single regional monetary and supervisory authority, but with a licensing and resolution role for national authorities. While supervision is conducted at the regional level, national responsibility for bank resolution can seriously complicate the handling of bank problems. Given that the WAEMU is home to two major PABs and host to many others, developing appropriate arrangements to reconcile regional and national interests is of paramount importance.

28 INTERNATIONAL MONETARY FUND
Box 4.1. Financial Sector Supervisory Standards in Sub-Saharan Africa and Morocco
Countries in SSA are at different development levels with regard to their financial sector regulation and
supervision standards and operate at varying stages of international standards implementation. Whereas a
number of countries have moved to International Financial Reporting Standards, implementation of Basel II
standards has been completed in only a handful of countries. An important part of depositor protection,
namely depositor insurance, is missing in the majority of countries.
Summary of Supervisory Standards by Country
Acc
ount
ing
Stan
dard
Capi
tal
Ade
quac
y
Stan
dard
1
Base
l Cor
e
Prin
cipl
es 2
Dep
osit
Insu
ranc
e
Ass
et
Clas
sific
atio
n 3
Angola National No Basel II yet <50% No Dep. Ins. < 90 daysBotswana IFRS Basel II in progress >80% No Dep. Ins. 90 daysBurundi IFRS Plan Basel II in progress <50% No Dep. Ins. > 90 daysCape Verde IFRS Basel II in progress 50–80% No Dep. Ins. < 90 daysCEMAC IFRS Plan No Basel II yet N/A Implemented > 90 daysComoros National Basel II in progress N/A No Dep. Ins. N/ADem. Rep. of the Congo National No Basel II yet N/A No Dep. Ins. 90 daysEritrea N/A N/A N/A No Dep. Ins. N/AEthiopia IFRS Plan No Basel II yet N/A No Dep. Ins. 90 daysGambia IFRS Plan No Basel II yet N/A No Dep. Ins. 90 daysGhana IFRS No Basel II yet <50% No Dep. Ins. 90 daysGuinea National No Basel II yet N/A No Dep. Ins. N/AKenya IFRS Parts of Basel II/III 50–80% Implemented 90 daysLesotho IFRS No Basel II yet N/A No Dep. Ins. 90 daysLiberia IFRS Basel II in progress N/A No Dep. Ins. 90 daysMadagascar National No Basel II yet N/A No Dep. Ins. 90 daysMalawi IFRS Basel II 50–80% No Dep. Ins. 90 daysMauritius IFRS Basel II 50–80% No Dep. Ins. 90 daysMorocco IFRS Parts of Basel III >80% Implemented 90 daysMozambique IFRS Basel II 50–80% No Dep. Ins. > 90 daysNamibia IFRS Parts of Basel II N/A No Dep. Ins. 90 daysNigeria IFRS Basel II in progress 50–80% Implemented 90 daysRwanda IFRS Basel II in progress >80% No Dep. Ins. 90 daysSão Tomé and Principe IFRS Plan Basel II in progress N/A No Dep. Ins. N/ASeychelles IFRS Plan No Basel II yet N/A No Dep. Ins. 90 daysSierra Leone IFRS No Basel II yet N/A No Dep. Ins. 90 daysSouth Africa IFRS Basel III >80% No Dep. Ins. 90 daysSouth Sudan National No Basel II yet N/A No Dep. Ins. N/ASwaziland IFRS No Basel II yet N/A No Dep. Ins. 90 daysUganda IFRS No Basel II yet 50–80% Implemented 90 daysTanzania IFRS No Basel II yet >80% Implemented 90 daysWAEMU IFRS Plan No Basel II yet 50–80% No Dep. Ins. > 90 daysZambia IFRS No Basel II yet >80% No Dep. Ins. 90 daysZimbabwe IFRS Basel II in progress N/A Implemented 91 days
Note: IFRS = International Financial Reporting Standards; CEMAC = Central African Economic and Monetary Community; WAEMU = West African Economic and Monetary Union.
3 This category indicates the threshold of "number of days in arrears" after which loans are classified as nonperforming loans.
Sources: IFRS.org (Jurisdiction Profiles, April 2014) and Pricewaterhouse Coopers report "IFRS adoption by country" (April 2013); FSI Survey on Basel II, 2.5, and III implementation (Financial Stability Institute, July 2014); Standards and Codes Database; Demirgüç-Kunt et al (2015); IMF Financial Sector Assessment Program and Technical Assistance reports.
2 This category shows percentage of compliant or largely compliant Basel Core Principles and is based on assessments against the 2006 Basel Core Principles methodology undertaken as part of Financial Sector Assessment Programs during 2007–12.
1 The Financial Stability Institute conductes a survey on the current status report on implementation of Basel II, 2.5, III for non-BCBS/non-European Union jurisdictions and publishes unedited responses. The column is based for Basel II on answers to Pillar 1 (standardized approach for credit risk, basic indicator approach, and standardized approach for operational risk), Pillar 2, and Pillar 3.

29 INTERNATIONAL MONETARY FUND
Figure 4.5. Sub-Saharan Africa and Morocco: Basel II Implementation by Country
Sources: Financial Stability Institute Survey on Basel II, 2.5, and III implementation (Financial Stability Institute, July 2014); and IMF country team information.
Note: The Financial Stability Institute conducts a survey on the current status report on implementation of Basel II, 2.5, and III for non–Basel Committee on Banking Supervision/non–European Union jurisdictions and publishes unedited responses. The figure is based on answers to Pillar 1 (standardized approach for credit risk, basic indicator approach, and standardized approach for operational risk), Pillar 2, and Pillar 3.
No information available
No Basel II implementation yet
Basel II implementation in progress
Basel II implemented
Basel II Implementation

30 INTERNATIONAL MONETARY FUND
V. Bank Financing for SSA Infrastructure: From
Global to Regional
Despite some improvement to its infrastructure, SSA continues to lag behind other regions, and infrastructure gaps continue to be a major impediment to growth and competitiveness for the region. Against this background, how has the banking sector contributed to infrastructure financing recently?
Over the past 15 years, privately funded infrastructure investment in SSA has been on the rise, with a variety of modalities ranging from concessions and private-public partnerships (PPPs) to equity investment, syndicated loans, and infrastructure bonds. In this context, bank lending has been the major source of private financing for SSA infrastructure projects. This partly reflects the limited development of other sources of private funding, but also a number of features that make bank lending particularly suitable for project finance. Bank lending ensures a more direct relationship between borrower and lender than other debt funding sources, such as the bond market. This may minimize negotiation time and avoid the costs involved in securing a formal credit rating. In addition, banks may be more willing to finance greenfield infrastructure projects because they have a more direct overview of the project and a higher ability to manage construction risk.
Bank credit is, however, very sensitive to changes in funding conditions, global risk aversion, and prudential regulation, more so than non-private sources of financing. These (push) factors are important in explaining the decline recorded in cross-border bank credit in the aftermath of the crisis (Frazscher 2011). They also account for a changing structure of bank flows from traditional to new bank lenders.
The impact of these global factors on bank financing of SSA infrastructure has been substantial. Traditional European bank lenders (from France, Germany, and United Kingdom,) were, in the past, the major contributors to SSA infrastructure financing, but in the aftermath of the crisis have scaled back their participation in new syndicates and large bilateral loans. Their contribution reached a historical minimum in 2014 (Figure 5.1). The gap in development financing left by the retrenchment of traditional European banks has not been offset by the new foreign bank lenders that have entered the market (see Section III). The contribution of these new lenders to SSA infrastructure financing has remained very limited indeed.

31 INTERNATIONAL MONETARY FUND
Figure 5.1. New Syndicated and Large Bilateral Loans for Sub-Saharan Africa Infrastructure by Lender Nationality* (2006–14)
Sources: Dealogic Loan Analytics; IMF staff calculations. * Where allocations were not disclosed, these were assumed to be distributed evenly amongnationalities participants in the syndicate. The contribution of multilateral institutions and development banks to syndicated loans is excluded.
Local pan-African banks have stepped in to fill the gap, becoming the largest participants in new syndicates and large bilateral loans to finance infrastructure. The increased role of African financial institutions in SSA infrastructure financing is also reflected in the growing number, and volume, of syndicated deals without foreign participation or where African banks are the lead arrangers of the syndicate.
Pan-African and domestic bank lenders, however, are not immune from global conditions. Volatility in international commodity prices, changes in global risk aversion, and liquidity conditions can also affect the ability and willingness of SSA banks to provide infrastructure credit. The decline in 2014 may indeed reflect the impact of lower international commodity prices and of the depreciation of local currencies against the dollar, which affect both the demand and the supply sides of infrastructure credit.
While global factors influence the overall dynamics of credit flows through the financial cycle, the large heterogeneity in lending flows observed across SSA countries point to
Total Bank Lending
0
1
2
3
4
5
6
7
8
9
10
2006 2007 2008 2009 2010 2011 2012 2013 2014
Billio
ns o
f U.S
. dol
lars
Other nationalities
African lenders
U.S. lenders
Other European lenders
Traditional European lenders (France, U.K., Germany)

32 INTERNATIONAL MONETARY FUND
country-specific (pull) factors in the availability of private financing for infrastructure. The size and diversification of the economy, macroeconomic conditions, and natural resource endowment and prospects are among the key drivers. Oil- and gas-rich countries are a primary destination of bank credit flows (Figure 5.2), which helps explain the drop in infrastructure bank financing in 2014. The decline in oil prices has affected the volume of infrastructure financing deals in major oil producers. In Angola and Nigeria, the total value of loans that originated in 2014 was, respectively, 47 and 64 percent lower than in 2013. In addition to commodity exporters, however, small middle-income countries with an attractive business environment (for instance, Botswana and Mauritius) have also been able to attract high bank lending flows for infrastructure financing.
Figure 5.2. Top Recipients of Bank Lending for Infrastructure Financing*
Sources: Dealogic Loan Analytics; IMF staff calculations * The role of the public sector is likely underestimated in this graph, as Dealogic classifiesas private borrower any state-owned enterprise, such as Eskom in South Africa. ** Ownership is not disclosed.
The sectoral distribution of syndicated bank loans has shifted in favor of projects in the energy/water sectors, which are critical for growth and development, with a smaller weight for telecommunication projects (Figure 5.3). This shift was associated with an increase in the tenor of bank loans, as these projects usually involve longer implementation and economic lifespans (Figure 5.4). In addition, projects in energy/water infrastructure are usually co-financed by development institutions, a stark contrast from projects in the telecommunications sector. The presence of these institutions in the syndicate provides valuable comfort to private bank lenders, allowing them to provide the longer-tenor loans that are essential for these large-scale projects.
US
Bill
ion
s $
0
5
10
15
20
25
Sou
th A
fric
a
Nig
eri
a
An
gola
Gh
ana
Mau
riti
us
Bo
tsw
ana
Tan
zan
ia
Ke
nya
Mo
zam
biq
ue
Gab
on
Cam
ero
on
Eth
iop
ia
Uga
nd
a
Zam
bia
Cô
te D
'Ivo
ire
Co
ngo
, De
m.
Re
p.
Bu
run
di
Sen
ega
l
Special Purpose Vehicle**
Public Borrower
Private Borrower

33 INTERNATIONAL MONETARY FUND
Figure 5.3. New Syndicated and Large Bilateral Loans for Sub-Saharan Africa Infrastructure*—Sector Breakdown (2006–14)—Billions of U.S. Dollars
Sources: Dealogic Loan Analytics; IMF staff calculations. * Telecommunications includes loans for project finance, capital, and mergers and acquisitionspurposes and excludes loans for general corporate purposes. Social Infrastructure includes loans for construction/refurbishing of schools, universities, hospitals, prisons, and community housing. Other includes loans for agriculture development projects.
Figure 5.4. Tenor of New Syndicated and Large Bilateral Loans over Time (Left Panel) and by Sector (Right Panel)—Percentage of Total Deal Count
Sources: Dealogic Loan Analytics; IMF staff calculations.
Bill
ion
s o
f U
S$
0.0
2.0
4.0
6.0
8.0
10.0
12.0
2006 2007 2008 2009 2010 2011 2012 2013 2014
Not SpecifiedOtherTelecommunicationsTransportationSocial InfrastructureEnergy/Water
0
10
20
30
40
50
60
70
80
90
100
Energy/Water Other Social infrastructure Telecommunications Transportation
Pe
rcen
t of
tota
l de
al c
ou
nt
20 years 15–19 years 10–14 years 5–9 years less than 5 years
0
10
20
30
40
50
60
70
80
90
100
2006 2007 2008 2009 2010 2011 2012 2013 2014
Pe
rce
nt
of
tota
l d
ea
l co
un
t
20 years 15–19 years 10–14 years 5–9 years less than 5 years
34 INTERNATIONAL MONETARY FUND
VI. The Way ForwardThe history of SSA countries over the past two decades or so clearly shows the importance of the financial sector in fostering economic development. Financial liberalization, a reduced role of governments in setting the price and allocation of credit, and other reforms contributed to a significant expansion of banking activities and financial products, the use of modern instruments for monetary policy, and improvements in the institutional environment. These reforms helped set the stage for sub-Saharan Africa to become the second-fastest-growing region in the world.
The gains in financial development in the past two decades have, nonetheless, been uneven across the region, with some countries achieving decisive progress in financial deepening and increased access to international financial markets, while others have lagged behind. For many SSA countries, financial inclusion remains too narrow, limiting prospects for sustained growth, employment, and poverty reduction.12
Against this background, a careful consideration of reforms needed to boost banking and financial development in the coming years is warranted, especially with regard to access to credit by firms and the population at large. In addition, a key lesson from the 2008–09 global financial crisis is that excessive complacency among market participants or regulators regarding risk and deficiencies in banking and the financial system could compromise financial stability. While many SSA countries have avoided these problems during the crisis because they were not exposed to the complex instruments that were at the center of the financial turmoil, they would do well to use these lessons as their banking systems continue to expand in depth and sophistication, and become increasingly interconnected across national and regional borders.
In light of the above, reform efforts should target priorities and bottlenecks, to support financial development and strengthen financial systems. While financial sector reforms should be tailored to country-specific challenges, the following priority areas need to be addressed:
Foster financial inclusion. Technological advances in mobile banking have opened up new possibilities to boost financial access, promote financial depth, and remove financing obstacles to entrepreneurial activity, while enabling lower intermediation costs. The regulatory framework should be enhanced to allow telecommunication operators to collaborate with financial institutions, taking stock of the experience in SSA countries that
12 Demirguc-Kunt et al (2015).

35 INTERNATIONAL MONETARY FUND
have succeeded in fostering these financial innovations in payment systems, savings, and credit flows.
Remove structural impediments to credit and improve the market structure. In most countries, limited credit typically arises because of poor creditor rights or lack of information on borrowers’ creditworthiness. In many SSA countries, the problem calls for focused reforms to legal and judicial systems (including to enhance recovery of collateral) and, in some cases, for establishing or improving the functioning of credit registries. In addition, considering alternatives to collateralization (for example, group guarantees) could be important going forward. Complementary efforts such as building appropriate accounting and financial sector skills are also critical in many SSA countries.
Enhance governance and regulations. Enhancements in governance are critical in many SSA countries, and reforms in this area must be supported by a clear and even-handed application of the legal and regulatory frameworks for the financial sector. This, in particular, requires commercial courts and specialized judges. In addition, differences in commercial law, accounting and auditing standards, and related practices should be reviewed and, if necessary, amended with a view to reach harmonization, especially in countries where cross-border banking has grown sharply.
Improve the environment for nonbank financial institutions. Legal and regulatory frameworks that cover the important role of nonbank financial institutions such as insurance companies, credit unions, and other hybrid financial service providers—including leasing companies—are important for some countries to further their financial development. Microfinance institutions also play an increasingly important role in providing credit to low-income households and micro and small enterprises.
Strengthen bank supervision. In a number of SSA countries, there is scope for further improvements in supervisory practices, approaches, and techniques, including on- and off-site work to identify emerging risks at the firm level and system-wide. Although the region has successfully removed interest rate controls and costly monetary instruments,13 there is still room for increased operational independence and adequate resources for supervisors and an end to supervisory forbearance that will allow better pricing of risk and facilitate interbank relations. Banks need to hold high-quality capital, keep adequate liquidity, and implement robust internal risk management procedures and strong corporate governance;
Enhance cross-border cooperation and consolidated supervision. Given the rapid expansion of pan-African banking groups, enhancing cross-border cooperation and implementing consolidated supervision for all groups is critical. It is of mutual interest for PABs’ homes and
13 Like the constant use of high reserve requirements.

36 INTERNATIONAL MONETARY FUND
hosts that oversight capacity is strengthened as quickly as possible. In this regard, strategic collaboration between the home regulators and central banks of the major PABs could drive the cooperation and harmonization agenda, for instance by including host-country supervisors in the training they conduct for their own supervisors (for example, Kenya, Nigeria); using joint inspections and meetings of colleges to share their knowledge with their host-country colleagues; and taking the lead in promoting staff exchanges and other peer-learning initiatives with supervisors from jurisdictions that have been facing similar challenges.
The agenda is formidable and many of the priority areas suggested here require efforts to strengthen capacity. Pursuing the reform agenda expeditiously will require extensive technical assistance. The IMF has been providing assistance in its areas of responsibility and is liaising with other multilaterals and national providers to prioritize a comprehensive program to enhance capacity to supervise banking activities, and, in particular, the PABs’ cross-border operations. Such a program is urgent, in view of the many institutional development challenges posed by the PABs. It could have a substantial payoff for the financial stability of individual African nations, regional groups, and the continent as a whole.

37 INTERNATIONAL MONETARY FUND
VII. ReferencesBeck, T., and R. Cull. 2013. “Banking in Africa.” WPS/2013–16, Center for the Study of African
Economies, Department of Economics. University of Oxford . August.
BIS. 2012. “European Bank Funding and Deleveraging.” BIS Quarterly Review, March.
Demirgüç-Kunt A., L. Klapper, D. Singer, and P. Van Oudheusden. 2015. “The Global Findex Database 2014 Measuring Financial Inclusion around the World.” Policy Research Working Paper 7255, World Bank, Washington.
Enoch C., P. Mathieu, and M. Mecagni. 2015. “Pan-African Banking: Opportunities and Challenges for Cross-Border Oversight.” African Departmental Paper No. 15/3, International Monetary Fund, Washington.
Feyen E., and I. Gonzales Del Mazo. 2012. “European Deleveraging and Global Credit Conditions.” World Bank Note. Washington DC.
Frazscher M. 2011. “Capital Flows, Push versus Pull Factors and the Global Financial Crisis.” Working Paper Series 1364, European Central Bank. Frankfurt am Main, Germany.
Gulde, A. M., C. Pattillo, J. Christensen, K. Carey, and S. Wagh. 2006. “Financial Sectors: Issues, Challenges and Reform Strategies.” Technical Chapter in Regional Economic Outlook: Sub-Saharan Africa. Washington: International Monetary Fund, May.
Gulde A. M., E. Gelbard, and R. Maino. 2015. “Financial Development in Sub-Saharan Africa: Challenges for Sustained Growth.” forthcoming Working Paper, International Monetary Fund, Washington.
International Monetary Fund (IMF). 2012. “The Impact of Global Financial Stress on Sub-Saharan African Banking Financial Systems.” In Regional Economic Outlook: Sub-Saharan Africa—Sustaining Growth amid Global Uncertainty. Washington, April.
———. 2015. “Navigating Headwinds.” In Regional Economic Outlook: Sub-Saharan Africa—Navigating Headwinds. Washington, April.
Kasekende, L. 2010. “Developing a Sound Banking System in Sub-Saharan African Countries.” In African Finance in the 21st Century, edited by Quintyn and Verdier. Washington: International Monetary Fund.

38 INTERNATIONAL MONETARY FUND
Laeven, L., and F. Valencia. 2013. “Systemic Banking Crises Database.” IMF Economic Review, 61 (2).
Mecagni, M., and others. 2014. “Addressing the Infrastructure Deficit in Sub-Saharan Africa.” Technical Chapter in Regional Economic Outlook: Sub-Saharan Africa—Staying the Course. Washington: International Monetary Fund, October.
Mecagni, M., R. Maino, and others. 2015. “Dollarization in Sub-Saharan Africa: Experiences and Lessons.” African Departmental Paper 15/4, International Monetary Fund, Washington.
Mlachila, M., S. Gil Park, and M. Yabara. 2013. “Banking in Sub-Saharan Africa: The Macroeconomic Context.” African Departmental Paper 13/3, International Monetary Fund, Washington.
Reinhart, C. M., and K. Rogoff. 2010. “From Financial Crash to Debt Crisis.” Working Paper 15795, National Bureau of Economic Research.
Recommended