Evidence on the Responsiveness of Export-Related VAT Evasion to VAT Rates in the EU
November 2014
Ivan Badinski The Analysis Group
Boston, MA [email protected]
Jon Bakija
Economics Department Williams College
Williamstown, MA [email protected]
Abstract In almost all countries that operate a value-added tax (VAT), the VAT “zero-rates” exports, meaning that exporting firms can claim credit for VAT on their inputs, but pay no VAT on sales of exports. This is necessary when the goal is to make the base of the tax domestic consumption. A consequence is that firms can reduce their tax burdens by misreporting some of their sales to domestic consumers as exports. In principle, reported exports from country i to country j should match up with reported imports into country j from country i, except for measurement errors, and costs of insurance and freight that are included in import value but not export value. VAT evasion can be another source of discrepancy which would tend to cause reported exports to exceed reported imports for trade flows in the same direction. We use data on such discrepancies in trade flows between pairs of European Union member countries during 1984 through 2011 to infer whether higher VAT rates are associated with greater over-reporting of exports. A difference-in-differences identification strategy, exploiting the fact that VAT rates changed in different ways over time in different countries, suggests that each percentage point increase in the exporting country’s standard VAT rate increases the discrepancy of exports over imports by about 1.1 percent of exports. For the typical EU-15 country, this implies that at the margin, about 15 percent of the static revenue gain from a VAT rate increase would be lost due to this particular channel for VAT evasion. This paper builds on work that was part of Ivan Badinski’s undergraduate economics honors thesis at Williams College, which was completed in May of 2014. We thank Steve Nafziger, Sara LaLumia, Bill Gentry, and other seminar participants at Williams College for helpful comments.

Introduction
The value-added tax has grown to become one of the most important sources of government revenue in
almost every country in the world, the United States excepted. 160 countries now operate a VAT, and
among these countries it accounts for one-third of central government tax revenue and 6.1 percent of
GDP on average. 43 percent of countries with a VAT, and 52 percent of countries with a VAT that have
GDP per capita below $10,000 U.S. dollars (adjusted for purchasing power parity), raise more central
government revenue through the VAT than through personal and corporate income taxation combined.1
Among the 27 member nations of the European Union (EU) in 2012, VAT collections were on average
21.9 percent of tax revenues received by all levels of government, and 7.7 percent of GDP.2
A major reason for the widespread adoption of the VAT and its growing importance is that
elements of its design help deter tax evasion.3 One factor is that a VAT is usually implemented on
destination basis, meaning that the tax depends on where goods and services are consumed, and not
where the value-added is produced. This avoids the tax base erosion that can occur through
manipulation of transfer prices on cross-border trades between related firms, a large and growing
problem with corporate income taxes.4 Another advantage arises because almost every country’s VAT
operates on the credit-invoice principle, where each firm collects and remits VAT on its sales, but
receives credit for VAT paid to suppliers on inputs, and must document that the VAT was paid on those
inputs with an invoice if audited. This creates a “paper trail” facilitating the tax authority’s ability to
1 Statistics in the previous three sentences are authors’ calculations based on data from the 2012/2013 edition of the Collecting Taxes database (US AID 2014). The one-third of central government revenue and 6.1 percent of GDP figures are un-weighted averages across each of the 160 countries with a VAT. 2 Eurostat (2014, Annex A, Tables 6 and 7). These are un-weighted averages across the 27 countries in the EU in 2012. Croatia became the 28th member state of the EU in 2013. 3 More detailed discussion of the design of the VAT, its enforcement advantages, and opportunities for evasion, can be found in Keen (2006), Bird and Gendron (2007), and Ebril, Keen, and Bodin (2001). 4 Dharmapala (2014) and Clausing (2009) discuss theory and evidence on transfer pricing manipulation in the corporate income tax.
1

detect evasion. For every transaction between firms, the buyer and seller have conflicting incentives
that work in favor of the tax authority – buyers can evade VAT by overstating costs to increase credits,
while sellers can evade VAT by understating sales, but either action will create a discrepancy between
the records of buyers and sellers that can help the tax authority identify the evasion. In many (mostly
high-income) countries, transaction-level electronic information reports facilitate the tax authority’s
ability to check for such discrepancies. Moreover, the credit-invoice design also means that tax evasion
in the middle of the production and distribution chain can actually cause tax revenue collections to
increase, as firms later in the chain will not be able to legally claim credit for VAT that had been paid at
earlier stages in the chain before the break, which in turn creates an incentive for firms to deal with
compliant suppliers. These enforcement advantages of the credit-invoice method and the paper trail
break down, however, in two key places: retail sales to final consumers; and sales across borders.
Final consumers do not get credit for VAT paid on purchases, and do not file information reports
on VAT paid on purchases to the tax authority, so retail sales lack the conflicting incentives between
buyer and seller and information on discrepancies that help tax authorities police VAT on trade between
firms. Both final consumers and retailers have an interest in having retail sales underreported to the tax
authority. This same problem applies in retail sales tax (RST), but the problem is worse there, because in
an RST evasion by retailers costs the government revenue on the full value of the product, whereas in a
VAT the government only loses the revenue on the final slice of value added contributed by the retailer.
Sales across borders present opportunities for VAT evasion for two reasons. First, in almost
every country that has a VAT, the base of the tax is intended to be domestic consumption. For this
reason, exports by firms registered for the VAT are “zero-rated” by the VAT, meaning that the exporting
country does not impose VAT on sales of exports, yet allows credit for VAT paid on inputs. This removes
all of the exporting country’s VAT burden from the exported product. VAT is then imposed on imports at
the importing country’s VAT rate. Zero-rating of exports creates important opportunities for evading
2

VAT in the exporting country. For example, a firm can reduce its VAT liability by misreporting sales to
domestic consumers as exports. Or, a firm might fraudulently report exports and claim credits for VAT
paid on inputs for products that may not exist, receive a large refund, and then disappear before the tax
authority can detect the fraud. The second challenge posed to VAT administration by cross-border sales
is that the ability of the tax authority to detect evasion through discrepancies between the records of
buyer and seller breaks down at the border, since doing so now requires cooperation and information
sharing between tax authorities of different countries. From the tax authority’s perspective, this
disadvantage of cross-border sales is often counteracted by the fact that exports and imports usually
must pass through customs, which is an administratively convenient place to monitor transactions for
compliance with taxes.5 But starting in 1992, in an effort to reduce frictions impeding within-EU
international trade, the EU disallowed its member countries from implementing any procedures related
to collection or enforcement of taxation at the borders between its member countries (Keen and Smith,
2006, p. 870). Since then, VAT on imports into one EU member state from another is no longer collected
at the border, but rather is usually deferred until the importer sells the product or until the importer's
next periodic return. In addition, EU tax authorities lose the potential information reporting benefits of
fiscal controls at the border, and the administrative convenience of collecting the VAT on imports at the
border, as is the practice in most other countries. This has opened up a host of VAT evasion
opportunities exploiting cross-border trade within the EU. A prominent example is “missing trader
fraud,” where a firm registers for the VAT, imports products free of VAT (since all exporting country VAT
has been removed by zero-rating), resells the products to another firm in the importing country at a
price inclusive of the importing country’s VAT, and then never remits the VAT to the government,
disappearing and absconding with the difference between the border price and the VAT-inclusive price
5 The very large share of VAT revenue in developing countries that comes from taxing imports at the border is evidence that when VAT is collected at the border, it is administratively easier to collect the tax at the border than it is to do so for within-country transactions. See Ebril, Keen, and Bodin (2001, p. 50).
3

before the fraud is detected. The products may then pass through intermediary firms and be re-
exported, at which point the exporting firm claims credit for VAT paid on inputs, despite the fact that a
large portion of that VAT (on the value-added produced in the original exporting country) was never
actually remitted to the government. The same products might subsequently be re-imported into the
same country that was just victimized by the missing trader fraud, in order to perpetrate the fraud a
second time, in which case it is called “carousel fraud,” reflecting the fact the fraud can continue to
produce additional illicit gains for the participants for as long as they can keep the cycle revolving (Keen
and Smith, 2006).
Numerous studies have attempted to estimate the “compliance gap” for the VAT, that is, the
percentage of VAT that should be paid but is not. The most common approach is the “top down”
method, which compares actual VAT collections with estimates of what VAT payments would be if the
nation’s VAT (taking into account standard rates, special reduced rates, exemptions, etc.) were applied
comprehensively to and perfectly collected from all consumption in the national accounts. The most
recent such estimate for the EU as a whole, by Barbone et al. (2013, table 3.1.1), suggests that in 2011,
18 percent of total potential VAT receipts in the EU were lost to evasion and fraud.6 This is even larger
than the estimated 14.5 percent net compliance gap for the U.S. income tax in 2006, which is inferred
largely based on information gleaned from intensive randomized audits (Internal Revenue Service 2012,
p. 1).7
In this paper, we contribute to understanding on these issues by using data on discrepancies in
international trade statistics on within-EU trade to investigate how cross-border VAT evasion responds
6 VAT tax gap studies also suggest a great deal of heterogeneity across EU countries. For example, the range of VAT tax gap estimates for 2011 in the Barbone et al. study goes from 2 percent in Sweden to 48 percent in Romania. 7 This estimate includes evasion of both personal and corporate income taxes. The “net” tax gap represents the portion of tax that should have been paid but was not, less the portion that was recovered through enforcement actions.
4

to VAT rates. In principle, reported exports from country i to country j should match up with reported
imports into country j from country i, except for measurement errors, and costs of insurance and freight
that are included in import value but not export value. VAT evasion, such as misreporting of sales to
domestic consumers as exports, can be another source of discrepancy which would tend to cause
reported exports to exceed reported imports for trade flows in the same direction. A high VAT rate in
the exporting country creates an incentive to over-report exports, and a high VAT rate in the importing
country creates an incentive to underreport imports. We use data on such discrepancies in trade flows
between pairs of EU member countries during 1984 through 2011 to infer whether higher VAT rates are
associated with greater over-reporting of exports. The EU is a particularly good setting in which to study
this question, both because of the considerable degree of concern policymakers there have about trade-
related VAT evasion, and because there are no tariffs imposed on intra-EU trade, which avoids an
important potential confounding source of variation in incentives for misreporting. A difference-in-
differences identification strategy, exploiting the fact that VAT rates changed in different ways over time
in different countries, which controls for importer VAT, importer and exporter income per capita and
quality of governance, year fixed effects, and separate country-pair fixed effects for each direction of
trade flow, suggests that each percentage point increase in the exporting country’s standard VAT rate
increases the discrepancy of exports over imports by about 1.1 percent of exports. For the typical EU-15
country, this implies that at the margin, about 15 percent of the static revenue gain from a VAT rate
increase would be lost due to this particular channel for VAT evasion. We do not find evidence of
underreporting of imports in response to higher importing country VAT rates, although as we explain
further below, this may reflect the efforts of countries’ statistical offices to adjust trade statistics on
imports for the estimated effects of missing trader fraud.
Evidence on the responsiveness of export over-reporting to VAT rates can be useful to policy
makers because it contributes to knowledge about the benefits and costs of tax rate changes and
5

reforms that would affect tax authorities’ ability to detect and punish cross-border VAT evasion, and it
may help tax authorities make better decisions about where to target their efforts and resources. This
may in turn improve the efficiency and equity of the tax system, by reducing the real resources that
people expend to evade taxes, and by making taxation of different activities and people more uniform.8
Our evidence also has implications for how a VAT in the U.S. might be designed, should one ever be
adopted. For example, the kind of VAT evasion that we provide evidence for here would not apply to
inter-state trade in the U.S., if the U.S. were to adopt a uniform national VAT with no zero-rating of
exports from one state to another (Keen and Smith, 2006, p. 885).
Related Literature
Allingham and Sandmo’s (1972) seminal contribution to the economic theory of tax evasion was a utility
maximization model in which each taxpayer chooses to evade up to the point where the marginal
benefit from hiding an additional dollar of tax base from the tax authority, which is the marginal tax
rate, is just equal to the marginal cost, which is the marginal penalty for hiding that dollar, times the
probability that marginal dollar of underreported tax base will be detected by the authorities. Because
the marginal tax rate is the marginal benefit of underreporting the tax base, an increase in the marginal
tax rate may cause the taxpayer to increase underreporting of the tax base. However, they also show
that the effect could also go the other way, depending on the nature of risk aversion. Yitzhaki (1974)
pointed out that if the penalty for tax evasion is a function of the amount of tax evaded, as it is in many
countries, then a higher marginal tax rate also raises the expected marginal cost to the taxpayer of
underreporting the tax base, in which case an increase in tax rates would actually lead to a reduction
underreporting of the tax base under a broader class of assumptions about risk aversion. Slemrod and
8 See Slemrod and Yitzhaki (2002) for a detailed discussion of the efficiency and equity consequences of tax evasion, enforcement, and administration.
6

Yitzhaki (2002) and Slemrod (2007) review subsequent literature on the topic, which considers many
other factors that influence tax evasion, and conclude that the direction and magnitude of the effect of
higher tax rates on the amount of tax base underreporting are theoretically ambiguous and thus
ultimately are empirical questions.
The idea of using discrepancies in trade statistics to uncover evidence of tax evasion, and its
responsiveness to tax rates, was pioneered by Fisman and Wei (2004). They investigated how
differences in the sum of Chinese VAT and tariff rates on different imported products correlated with
discrepancies between reported exports from Hong Kong to China and reported imports into China from
Hong Kong for those products. A cross-sectional analysis finds that one percentage point increase in the
combined VAT and tariff rate on an imported product was associated with an increase in underreporting
of imports equal to about 3 percent of imports. That implied that the combined VAT and tariff rates on
many Chinese products were actually on the wrong side of the Laffer curve, so that reducing those tax
rates would increase tax revenue collections. A difference-in-differences analysis using two years of data
implies that a one percentage point increase in combined VAT and tariff rate increases underreporting
of imports by about 2 percent of imports. An important difference from our study is that there was no
incentive for exporting firms to over-report exports, because Hong Kong did not have a VAT.
Mishra et al. (2008) perform a similar exercise for imports into India from 40 different trading
partners, exploiting a long panel of product level data and significant difference-in-differences variation
in Indian tariff rates across products. This allows them to add country and product fixed effects to their
specification to account for the unobserved time-invariant characteristics of products and trade partners
that might be affecting estimation. They find that a one percentage point increase in the tariff rate
increases underreporting of imports by about 0.1 percent of imports, which is much smaller than what
Fisman and Wei found. Mishra et al. present suggestive evidence that the difference is partly driven by
better methods of controlling for omitted variable bias, and partly by differences in the composition of
7

imports into India compared to China, with China importing the sorts of goods where underreporting is
relatively more elastic with respect to tax rates. No effort was made to control for exporters’ incentives
to overstate exports in order to reduce VAT liability, although they do find that their estimates are
robust to controlling for exporting country * year fixed effects, which effectively controls for exporter
VAT rates to the extent they are uniform across products.
Levin and Widell (2007) employ a method similar to that of Fisman and Wei (2004) to examine
tax evasion in trade flows between Tanzania and Kenya. Relying solely on cross-sectional identification,
they find estimates of similar magnitude to those in Fisman and Wei for imports into Tanzania from
Kenya, but much smaller estimates for imports into Kenya from Tanzania. Javorcik and Narciso (2008)
use panel data on imports into 10 Eastern European countries from Germany estimate the effects of
importer tariffs on underreporting of imports. Similar to Mishra et al., they find that a one percentage
point increase in importer tariff rate is associated with an increase in underreporting of imports of 0.1
percent of imports. Neither Levin and Widell nor Javorcik and Narciso consider the incentive to over-
report exports in response to exporter VAT, but since both their estimates should be robust to this
omission to the extent that German VAT rates are uniform across exported products.
Ferrantino et al. (2011) is the one study investigating misreporting of exports in response to
exporter VAT that we are aware of. They focus on discrepancies between reported imports into the U.S.
from China and reported exports from China into the U.S., using panel data on product-level trade flows
from 2002 through 2008. China operates a highly unconventional VAT, which makes it unlikely that their
findings can tell us much on VAT-motivated export misreporting in trade between other countries. Like
almost all other countries, the Chinese government does not impose VAT on sales of exports. But unlike
most other countries operating a VAT, China follows the unusual practice of providing only partial credit
to exporters for VAT paid on inputs that went into the production of exports, with the credit rate varying
8

by product type.9 As a result, unlike in almost all other countries that operate a VAT, the Chinese VAT
actually creates an incentive to under-report exports for many types of products – the failure to offer full
credit for VAT on inputs makes the effective Chinese VAT rate on exported products positive and
sometimes large, as opposed to zero in most other countries that run a VAT. Additionally, the authors
note that under-reporting exports relative to their real value is one way of by-passing the strict capital
controls that China imposed during the sample period, because the difference between the real and
reported value of exports can be deposited in a bank abroad. Controlling for product and year fixed
effects, they estimate that a one percentage point increase in the effective Chinese VAT rate charged on
exports of a product increases underreporting of exports by almost 4 percent of exports, and also find
some evidence of underreporting of imports by U.S. firms in response to higher U.S. product-level
tariffs. A related study by Liu (2012) finds evidence that Chinese firms respond to an incentive to export
and then re-import products in cases where the rate at which VAT on inputs is credited is lower for sales
to domestic consumers than for exports.
A new working paper by Gradeva (2014) investigates underreporting of imports in response to
importer VAT rates in intra-EU trade.10 She focuses on how product-level variation in importing country
VAT rates affect discrepancies between reported imports into 7 new Eastern European members of the
9 With that said, there is evidence that in some developing and transition economies with particularly dysfunctional tax administrations, refunds in cases where firms have credits in excess of VAT liability on their sales often face long waits for refunds. This is a common position for exporters, and the delays reduce the present value of the credit, which ends up imposing a positive effective VAT rate on exports. See Bird and Gendron (2006) writing about developing countries, and Kononova and Whalley (2010) writing about Russia. By contrast, discussion of administrative and enforcement problems with the VAT in European Union countries (e.g., Keen 2006 and Borselli 2011) do not identify delays of refunds as a major problem in these countries. Indeed, Keen (p. 870) says “it may be that the difficulties [with VAT fraud] currently experienced in the U.K., for example, in part reflect the authorities’ strong commitment to prompt payment of refunds”. 10 Gradeva’s working paper was first posted in August of 2014, and we learned about it well after Ivan had completed and submitted his honors thesis, which included an early version of the empirical analysis in this paper, in May 2013.
9

EU from EU-15 countries,11 and formerly communist Eastern European nations that recently joined the
EU from each of the 15 relatively more prosperous European nations that were already members of the
EU prior to 2004 (the “EU-15”), and reported exports from the EU-15 countries into the 7 Eastern
European countries, during the years 2004-2009. She finds evidence that higher importer VAT rates on
particular products are associated with greater underreporting of imports in 3 of the 7 Eastern European
countries, and in those 3 countries the increase in import underreporting in response to a one
percentage point increase in VAT rate ranges from 0.6 percent to 3 percent of imports. The results are
fairly robust to inclusion of separate fixed effects for year, exporting country, and product. While both of
our studies do investigate the effects of VAT rate variation on trade reporting discrepancies, Gradeva
does not investigate the possibility of over-reporting of exports in response to exporter VAT rates. Our
study is the first to test the hypothesis that export over-reporting is associated with higher exporter VAT
rates in intra-EU trade, and as it turns out we find stronger much evidence for this dimension of cross-
border VAT evasion than we do for underreporting of imports in response to importer VAT rates.
Another strand of the VAT evasion literature estimates how variation in standard VAT rates,
across countries and over time, correlates with “top down” estimates of the VAT “compliance gap” –
that is, the percentage of VAT that should be paid but is not, inferred from the difference between
actual VAT collections and an estimate of the revenue that would be collected if we could perfectly
apply the country’s VAT law to national accounts consumption data. For example, Barbone et al. (2013)
estimate the VAT compliance gap for 26 EU states in the period 2000-2011.12 They then estimate a
regression where VAT compliance gap is the dependent variable, and explanatory variables include the
11 The EU-15 is the set of countries that joined the EU prior to 2004, and tend to be relatively high-income compared to newer members. A list of EU-15 countries can be found in table 5. 12This means that even though all countries in the sample were part of the EU at some point, not all of them are members of the EU for all years in the sample (e.g. Bulgaria and Romania entered the Union in 2007, but their compliance gaps are estimated for all years between 2000 and 2011).
10

standard VAT rate, and control for country- and year- fixed effects, a business cycle indicator, a
corruption perceptions index, log real GDP per capita, and an indicator variable for years following a
country’s accession to the EU. They find that a one percentage point increase in the standard VAT rate is
associated with an increase of the VAT compliance gap of 0.7 percent of potential VAT revenue. They
also find that the effect is larger for more corrupt countries.13
Some recent innovative studies of micro-data have contributed to our understanding of other
particular dimensions of VAT evasion behavior, besides that related to cross-border trade. Pomeranz
(2013) exploits two randomized experiments in Chile to demonstrate that the “paper trail” and
conflicting incentives created by a credit-invoice VAT do indeed facilitate enforcement of the tax. In one
experiment, firms were randomly selected to receive a letter threatening an increased probability of
audit. Relative to the control group, in the treatment group VAT payments on sales to consumers
increased significantly more than did VAT payments on intra-firm transactions. This is consistent with
the prediction noted earlier that the design of the VAT would lead to better compliance on intra-firm
trade than on sales to consumers. Presumably the increase in the perceived probability of audit had a
larger effect on reported sales to consumers because intra-firm trades were already reported fairly
accurately, given that the Chilean tax authority has an effective information reporting regime that
enables it to electronically check for discrepancies in reported intra-firm trades. A second experiment
selected a sample of small firms to be audited, and randomly selected a sub-set to be warned in
advance. Pomeranz finds that the reported sales of suppliers to firms in the treatment group increased
relative to reported sales of suppliers to firms in the control group, which suggests that suppliers to
firms in the treatment group learned of the audits and reduced underreporting of sales in order to avoid
discrepancies that might otherwise lead to audits of the suppliers. This suggests that the design features
13 Earlier studies in the vein include Agha and Haughton (1996) and Christie and Holzner (2006). These involved less convincing identification strategies, relying on cross-sectional variation in standard VAT rates across countries, and tended to find larger responsiveness of VAT compliance gaps to VAT rates.
11

of the VAT that are intended to foster compliance do indeed complement and multiply the evasion-
deterrence effects of audits. Naritomi (2013) analyzes a Brazilian program where retailers were required
to give VAT receipts to consumers for their purchases, and consumers were incentivized to collect
receipts because they made them eligible for a lottery. She finds that the program increased retail sales
significantly relative to intra-firm sales, suggesting that adding a paper trail and conflicting incentives to
transactions where none previously applied is effective at increasing compliance. De Paula and
Scheinkman (2010) analyze survey data on a sample of small firms in Brazil, and they find that firms that
are in the VAT net tend to do business with other firms that are also compliant with the VAT, whereas
firms that are exempt from or evading the VAT tend to be parts of chains where all of the other firms are
also exempt or evading. This is consistent with the notion that compliant firms respond to the incentive
the VAT creates to deal only with other compliant firms, in order to get credit for VAT remitted at earlier
stages in the chain. These studies all reinforce the conclusion that VAT evasion is most prevalent
wherever there are breaks in the VAT chain and paper trail, such as retail sales to consumers and sales
across national borders. Our study provides the first credible evidence, to our knowledge, of an example
of VAT evasion related to the latter – over-reporting of exports.
Our Contributions Relative to the Previous Literature
As noted above, with the exception of the Ferrantino et al. study of the highly unrepresentative Chinese
VAT, the few studies that have investigated the relationship between VAT rates and discrepancies in
reported trade data have focused on the effects of importer VAT rates on underreporting of imports,
ignoring the possibility of over-reporting of exports. However, there are good reasons to predict a priori
that discrepancies between reported exports and reported imports will be more informative about
export over-reporting in response to exporter VAT than under-reporting of imports. Apparently, many
12

European countries’ statistical offices routinely make adjustments to import data to add back in an
estimate of imports that went unreported due to “missing trader” VAT fraud, but they do not make
similar adjustments to reported export data. Countries’ statistical offices intentionally keep the
adjustments they make to trade statistics rather non-transparent, to avoid tipping off tax evaders to the
strategies tax authorities use to combat evasion. But studies such as Ruffles, Tily, Caplan, and Tudor
(2003) and OECD (2008, p. 84) do confirm that statistical offices make upward adjustments to reported
import data to account for missing trader fraud. If missing trader fraud were the only form of cross-
border VAT evasion, it would indeed make sense for statistical offices to make adjustments to import
data but not export data. Import statistics come partly from VAT returns, and firms that import and then
disappear before remitting VAT on the imports will not be reflected in those statistics. By contrast, for
missing trader fraud to work, the exporting firm will want to file a VAT return that reports the export,
since the sale of exports is not taxed, and the exporting firm needs to file a return so that it will be
eligible to claim credit for VAT on the inputs. Missing trader fraud does not require over-reporting of
exports to work. However, other channels of VAT fraud, such as fictional exports designed to help a firm
claim fraudulent refunds, or misreporting of sales to domestic consumers as exports, will cause over-
reporting of exports, and we are not aware of any narratives suggesting that statistical offices adjust
reported export data for these factors.
The empirical studies on trade flow reporting discrepancies discussed above all used product-
level data to estimate the response of trade reporting discrepancies to variation in VAT and/or tariff
rates across products. By contrast, each observation in our study is an aggregate trade flow across all
products going in a particular direction between a pair of countries in a particular year. While our
approach sacrifices some of the richness of finely-detailed product level variation in incentives for
misreporting, it has the benefit of enabling us to shed light on a different policy question than these
other studies. Because their identification strategies rely on cross-product within-country variation in
13

VAT and/or tariff rates, they are mainly pertinent to questions about the costs of having rate
differentiation across products within a VAT or tariff regime. But they lack convincing evidence on the
evasion response to uniform increase in rates across all products. With the VAT in particular, the
extreme difficulty of obtaining highly detailed information on variation in VAT policy at the product level
makes it impractical to do a product-level analysis that covers a long time span and a large number
country pairs – for example, this is why the Gradeva study very reasonably focuses on a small set of
country pairs in the EU over just 6 years. By contrast, our focus on country-level aggregate trade flows
enables us to construct a long and wide panel of aggregate trade flows in each direction between all
pairs of EU countries over long spans of time -- up to 28 years (1984 through 2011) for trade between
long-standing members. This enables us to exploit enough large-magnitude difference-in-differences
variation in standard VAT rates across countries over time to be able to credibly estimate the effect of a
uniform country-wide increase in the standard VAT rate on export over-reporting, while controlling in a
rich way for potential sources of omitted variable bias.
While the strategy of Barbone et al. provides useful information on the responsiveness of the
aggregate VAT base to many different dimensions of VAT evasion at once, our strategy is a useful
complement to it. In the “top down” approach, it is very difficult to disentangle the actual compliance
gap from reductions in VAT revenue that arise from intentional design of policy such as special reduced
VAT rates and exemptions for particular products, firms, or consumers, and the estimates can be quite
sensitive to different ways of doing this. The reliability of the VAT compliance gap estimates also
depends on the national accounts accurately capturing true domestic consumption. While national
accounts statisticians do make adjustments to their statistics in an effort to capture aspects of the
“informal” or “underground” economy, absence of compelling data on intentionally hidden economic
activity makes it difficult to make such adjustments accurately, and procedures for doing so are not
uniform across countries. Such an approach seems unlikely to pick up some of the apparent VAT evasion
14

we can identify with our study. For instance, since national income accounts rely on information
reported on tax returns, if a firm misreports a sale to a domestic consumer as an export, it is likely to
reduce both VAT revenue and an estimate of potential VAT revenue that is based on the national
accounts, in which case the evasion is left out of the compliance gap estimate. Our strategy makes a
useful complementary contribution because it has the advantage of exploiting a different indicator of
evasion, discrepancy in reported trade statistics, where the measurement error is likely to be fairly
independent of that in the compliance gap studies. We shed light on a particular form of VAT evasion,
export over-reporting, which may not be picked up in the existing compliance gap measures, and which
our estimates suggest is large relative to the estimated responsiveness of the overall compliance gap to
the VAT rate. We also provide information on a particular dimension of evasion in a way that could help
tax authorities target their resources.
Empirical Methodology and Data
To investigate the responsiveness of misreporting of exports and imports to variation in VAT rates, we
construct a panel of direction of trade / country pair combinations for EU countries between 1984 and
2011. The unit of observation in our analysis is a combination of a “directional dyad” and a year. A
“directional dyad” is a particular direction of trade flow between a particular pair of countries. For each
pair of countries in each year, there are two observations, one for each direction of trade flow. During
our sample period, membership in the EU gradually expanded from 10 countries to 27 countries, and we
only include countries in our sample during years when they are members of the EU, to avoid the
potentially confounding effects of tariffs on misreporting of trade data (trade between EU member
15

states was always tariff-free during the sample period).14 In addition, some direction of trade / country
pair combinations are only included for a subset of the years when both countries are members of the
EU, because of unavailability of data for some of our variables, or because there was no reported trade
flow between them in that year. Appendix table A.1 reports the year each country joined the EU and the
earliest year the country is included in our data in at least one directional dyad. After losing some of the
directional dyad permutations implied by table A.1 due to data limitations, we are left with a sample of
7,414 observations. Table 1 describes the variables used in our analysis, their sources, and some
descriptive statistics.
Our preferred regression specification takes the following form:
(1) log(𝐸𝐸𝐸𝐸𝐸𝐸𝐸𝐸𝐸𝐸𝐸𝐸 𝑉𝑉𝑉𝑉𝑉𝑉𝑉𝑉𝑉𝑉)ijt − log(𝐼𝐼𝐼𝐼𝐸𝐸𝐸𝐸𝐸𝐸𝐸𝐸 𝑉𝑉𝑉𝑉𝑉𝑉𝑉𝑉𝑉𝑉)jit =
𝛽𝛽0 + 𝛽𝛽1(𝐸𝐸𝐸𝐸𝐸𝐸𝐸𝐸𝐸𝐸𝐸𝐸𝑉𝑉𝐸𝐸 𝑉𝑉𝑉𝑉𝑉𝑉 𝑅𝑅𝑉𝑉𝐸𝐸𝑉𝑉)𝑖𝑖𝑖𝑖 + 𝛽𝛽2(𝐼𝐼𝐼𝐼𝐸𝐸𝐸𝐸𝐸𝐸𝐸𝐸𝑉𝑉𝐸𝐸 𝑉𝑉𝑉𝑉𝑉𝑉 𝑅𝑅𝑉𝑉𝐸𝐸𝑉𝑉)𝑗𝑗𝑖𝑖 + 𝜸𝜸𝑪𝑪𝑪𝑪𝑪𝑪𝑪𝑪𝑪𝑪𝑪𝑪𝑪𝑪𝑪𝑪𝒊𝒊𝒊𝒊𝑪𝑪 + 𝛼𝛼𝑖𝑖𝑖𝑖 + 𝛼𝛼𝐸𝐸 + 𝜀𝜀𝑖𝑖𝑗𝑗𝑖𝑖
Following Fisman and Wei and the long line of literature that followed, the dependent variable is log
exports minus log imports going in the same direction, a measure of the discrepancy in reported trade
flows. Export Valueijt is the total value of exports from country i to country j at time t, as recorded by
exporting country i. Import Valuejit is the total value of imports into country j from country i at time t, as
recorded by importing country j. Our data on trade flows comes from the UN's COMTRADE database,
accessed through the World Bank’s WITS software (World Bank, 2014). The mean value of our
dependent variable is -0.005, meaning that on average reported exports are smaller than reported
imports by about 0.5 percent. This average effect makes sense given that import values include cost of
freight and insurance, whereas export values do not. The small mean of the discrepancy masks large
variability, as indicated by a standard deviation of 0.487.
14 Croatia, which became the 28th EU member country in 2013, is not included in our sample.
16

The main explanatory variables of interest are the VAT rates, which are derived from European
Commission (2014). Exporter VAT Rateit is the standard VAT rate of exporting country i at time t, and
Importer VAT Ratejt is the standard VAT rate of importing country j, both measured in percentage points.
The coefficient on exporter VAT rate, β1, will be positive to the extent that a higher standard VAT rate in
the exporting country increases the incentive for exporters to evade the VAT, and to the extent that
exporting firms respond to that incentive by misclassifying sales to domestic consumers as exports, or by
reporting fictional exports to facilitate the claiming of fraudulent refunds. The coefficient on importer
VAT rate, β2 will be positive to the extent that a higher VAT rate in the importing country increases the
incentive for importers to evade the VAT, and to the extent that importing firms respond to that
incentive by underreporting imports – because log imports are subtracted in the calculation of the
dependent variable, underreporting of imports causes the dependent variable to go up. A higher
importer VAT rate might induce importers to smuggle imports across the border without reporting them
to the tax authorities in the importing country, or to bribe tax officials to look the other way, and then
sell the imports to consumers off the books at a VAT inclusive price or slightly below. Missing trader
fraud would also tend to increase underreporting of exports the gains from which go up when the
importing country’s VAT rate is higher, as higher VAT rate in the importing country allows the importing
firm to charge a higher VAT-inclusive price when it sells to another firm or consumer in the importing
country (because the higher VAT rate means competing compliant firms are charging a higher VAT
inclusive price), so it can now abscond with a larger difference between that VAT-inclusive price and the
export price. However, for reasons noted above, statistical offices make upward adjustments to import
data to account for missing trader fraud, so depending on the degree of measurement error in those
adjustments, we might find a β2 that is close to zero or even negative.
The mean VAT rate in the sample is 19.6 percent, with a standard deviation of 2.8 percent.
Figures 1 and 2 depict the time series of VAT rates in each country in the sample during the years it is
17

included in the sample, and Appendix table A.1 lists the difference between the maximum and minimum
VAT rate for each country during the years it is in the sample. While the magnitude of cross-sectional
variation in VAT rates is larger than the magnitude of the difference-in-differences variation that will be
the source of identification in the specifications with directional dyad fixed effects, the difference-in-
differences variation is still substantial. Figure 1 shows the countries that had an above median change
in VAT rates in the sample, with the difference between maximum and minimum VAT rate during the
sample ranging from 3 percent for Denmark, Italy, and Lithuania all the way up to 10 percent for Ireland,
7 percent for Portugal and Greece, and 6 percent for Spain. Other countries with relatively large changes
in VAT rates include the United Kingdom, Hungary, Germany, and Romania, each of which had a 5
percentage point difference between their maximum and minimum VAT rates during their sample
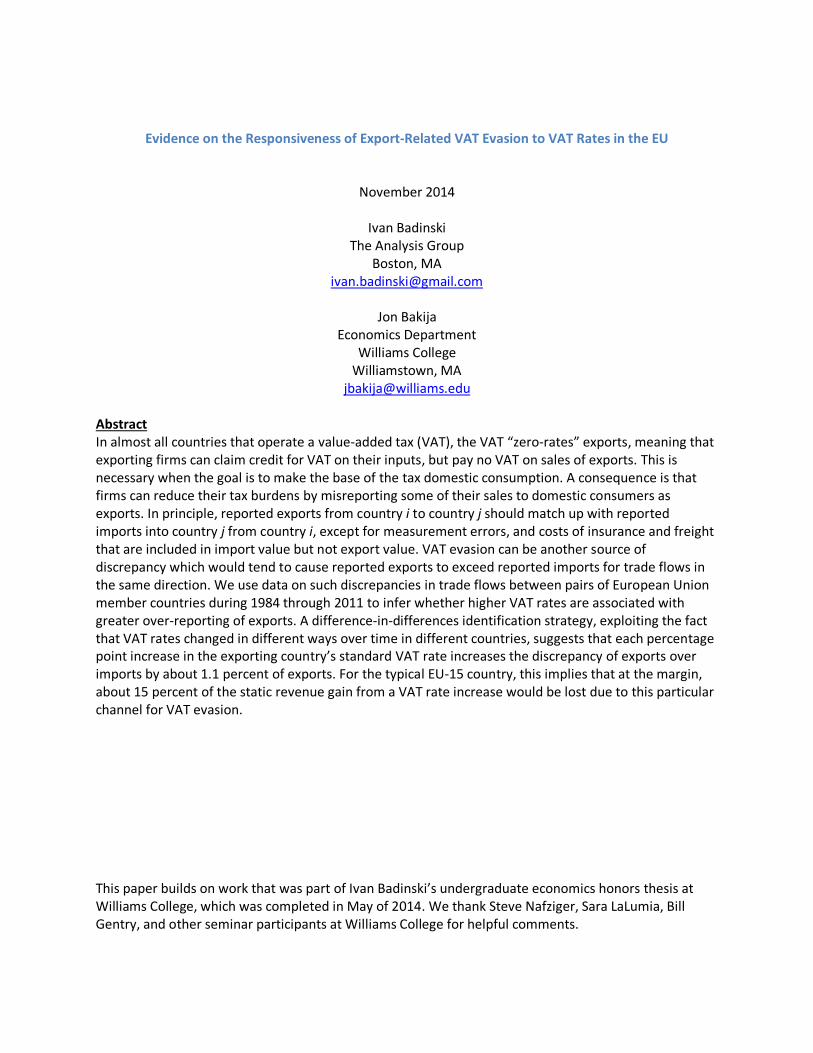
periods. Figure 2 depicts the countries with below median changes in VAT rates, of 2 percentage points
or less. These are effectively the control group in the difference-in-differences specifications.
The 𝛼𝛼𝑖𝑖 in equation (1) are time fixed effects controlling for any omitted factors affecting
misreporting of exports or imports that are changing in the same way over time across all directional
dyads. The 𝛼𝛼𝑖𝑖𝑗𝑗 in equation (1) is a directional dyad fixed effect, which controls for any omitted factors
that differ across directional dyads and that affect the misreporting gap. So for example, trade flows
between different pairs of countries in a particular direction have different compositions in terms of
products, and evidence from the aforementioned studies by Mishra et al. and Javorcik and Narciso
suggests that is easier to misreport the values of some types of products compared to others. Their
evidence implies, for instance, that it is easier to misrepresent one product among a class of highly
differentiated products as some other similar product with a different value, than it is to misrepresent a
very homogeneous commodity, and that it is less easy to misclassify large bulky goods compared to
smaller goods. Country pairs may also differ from other country pairs in terms of the quality of tax
administration and enforcement on each side of the border. Both types variation could be systematically
18

correlated with the VAT rate. For example, a country with poor tax administration might need to
increase the VAT rate to make up for revenue lost to evasion. Or, countries that disproportionately trade
in highly differentiated goods or that have poor tax administration will tend to have more elastic tax
bases, and might rationally choose to set their VAT rates lower for efficiency reasons. We will control for
perception indices of governance quality can help here, but these are at best imperfect proxies for
quality of tax administration. To the extent that omitted factors like those mentioned above are
correlated with variation in VAT rates, they may be a source of bias in a cross-sectional comparison, but
to the extent they are fairly persistent over time, our directional dyad fixed effects will control for them.
We report estimates both with and without the directional dyad fixed effects, as estimates exploiting
the cross-sectional variation in VAT rates are not unambiguously worse – they do involve significantly
more variation in the key explanatory variable of interest. There is some measurement error in the VAT
rate, as we only have data on standard statutory VAT rates and not effective rates, so the greater signal
to noise ratio in the cross section may help reduce attenuation bias. And misreporting of exports and
imports might respond more to large cross-sectional variation in VAT rates than to more subtle
difference-in-differences variation, as the more dramatic cross-sectional variation may be more salient.
The first pair of variables in the vector of controls is the value of a governance quality index for
the exporting country and for the importing country. We would expect the ease with which a firm can
over-report exports or under-report imports will be systematically correlated with the quality and
effectiveness of the relevant country’s tax administration, which affects the probability of detection and
punishment for export over-reporting or import under-reporting. A motivation for including it as a
control variable is that might also be systematically correlated with statutory tax rates for reasons
described in the previous paragraph. As a proxy for the quality and effectiveness of tax administration,
we take the arithmetic mean of the “bureaucracy quality,” “law and order,” and “corruption” perception
indices compiled for the International Country Risk Guide by the PRS Group (2014). Each of these indices
19

takes a higher value when quality of governance is better (i.e., a higher “corruption” index corresponds
to less corruption). To ease interpretation, we rescale the governance quality index so that it has a mean
of zero and a standard deviation of one. We would predict a priori that the coefficients on both
governance quality indices would be negative, as better quality governance should be associated with
less evasion, and less evasion on both the export and import sides should be associated with a smaller
excess of reported exports over reported imports. We control for log real per capita GDP, measured in
constant year 2005 U.S. PPP dollars (from version 8.0 of the Penn World Tables, Feenstra et al. 2013), in
both exporting and importing countries, for a similar reason – these are likely highly correlated with the
quality and effectiveness of tax administration and help serve as proxies for them.
In a sensitivity analysis, we include an interaction of exporter governance quality with exporter
VAT rate, and an interaction of importer governance quality with importer VAT rate, to allow the
sensitivity of misreporting of trade statistics to VAT rates to vary with quality of governance. We would
expect an increase in exporter VAT rate to have a smaller effect on export over-reporting in a better-
governed country, in which case the coefficient on the interaction of exporter VAT and governance
quality to be negative. We might also expect under-reporting of imports to be less sensitive to importer
VAT rates when the importer country is better governed, in which case the coefficient on that
interaction would be negative too (since higher imports reduce the dependent variable).
The next pair of controls is the top combined central and sub-national government corporate
income tax (CIT) rate in each of the exporting and importing countries, measured in percentage points.
We used CIT rates reported by OECD (2014) and KPMG (2006 and 2014) for different subsets of EU
countries.15 Both series are conceptually consistent with each other and over time for each country,
reflecting the top statutory central government CIT rate plus a representative sub-national government
statutory CIT rate, adjusted downward where appropriate to reflect deductibility of one from the other.
15 Although the original source of the OECD CIT data is OECD (2014), we accessed the same data from The Tax Foundation (2014) because it is provided in a more user-friendly format there.
20
When both series are available they do sometimes differ, apparently due to judgment calls, for example
regarding what constitutes a representative sub-national CIT rate. To maximize consistency of
measurement of the CIT rate over time for each country, we use a single source of data for all years for
any given country. The KPMG data are used for 7 countries and OECD data are used for the remaining 20
(see Appendix table A.1 for details). The mean CIT rate is 28.9 percentage points, with a standard
deviation of 9.9 percentage points (see table 1). As with the VAT, there is substantial difference-in-
differences variation in the CIT – most EU countries reduced CIT rates over time, but some countries
reduced them a lot more than others.
Like almost all CITs these days, European CITs are purely source based taxes, meaning that
corporate profits are supposed to be subject to tax in the country where they are produced. Thus, when
a firm exports, the reported value of the export is sales revenue that increases the firm’s CIT base in the
same way as a sale to a domestic consumer would. So unlike a high exporting country VAT, a high
exporting country CIT does not create an incentive to over-report exports by pretending sales to
domestic consumers are actually exports. If a firm in the exporting country misreports sales to domestic
consumers as exports in order to reduce exporting country VAT liability, there is no penalty or benefit to
the firm in terms of exporting country CIT liability, so the CIT does not deter the kind of VAT-motivated
over-reporting of exports that is the main focus of our paper. A high exporting country CIT rate does
create an incentive for an exporting country firm to pretend export sales do not exist at all, since that
will reduce the exporting firm’s taxable profits that are subject to exporting country CIT. Pretending the
export does not exist has no direct impact on exporting country VAT liability, but is risky. If the firm
reports the export for VAT purposes, it could expose the firm to audit risk if the tax authority cross-
checks CIT and VAT records for the firm, and if the firm does not report the export for VAT purposes, it
might expose the firm to audit risk because claimed credit for VAT on inputs may look high relative to
reported sales (including exports).
21
When a firm imports an input, the reported value of the input is a deductible cost against the CIT
in the country where the firm is located, which reduces the CIT base. So unlike a high importing country
VAT, a high importing country CIT does not create an incentive to understate imports, but quite the
opposite, creates an incentive to over-report them in order to increase deductible costs. Responding to
the incentive that high importing country CIT creates to overstate imports could have a cost in terms of
increased VAT liability (since as we saw above, strategies to reduce importing country VAT liability
involve underreporting imports). The flip side of this is that if an importing firm responds to a high
importing country VAT rate by underreporting the value of imported inputs, it can have a cost in terms
of increasing importing country CIT liability. This might reduce the willingness of importing firms to
misreport imports in either direction in response to high importing country VAT rates or CIT rates.
In sum, a high exporting country CIT rate creates an incentive to understate exports (not by
reclassifying them as domestic consumption, but rather by simply pretending they don’t exist), and a
high importing country CIT rate creates an incentive to overstate imports (to increase deductible costs
for purposes of CIT). Both reduce the value of our dependent variable (the excess of reported exports
over reported imports), so we should expect to see negative coefficients on both CIT rates. However,
there are good reasons to think the effect of CIT rates on misreporting might be quite small. First, as
noted above, in some circumstances CIT-motivated misreporting can have a cost in terms of increased
VAT liability. Second, garden variety transfer pricing manipulation on cross-border transactions between
related firms offers an opportunity to reduce CIT burden at much lower risk than the kind of more easily
detectable and provable fraudulent misreporting discussed above. Such transfer pricing manipulation
can reduce CIT without creating any discrepancy in trade statistics. For example, consider an Irish
subsidiary of a Spanish parent firm in 2011, in the case where Ireland is the exporting country and Spain
is the importing country. The Irish CIT rate was 12.5 percent and the Spanish CIT rate was 30 percent.
Suppose the Irish subsidiary exports an input that is really worth 100 Euros to the Spanish parent. A
22

standard transfer pricing manipulation would be to claim the input is really worth 200 Euros, both when
it leaves Ireland as an export (which increases the Irish sub’s profit by 100 Euros) and when it arrives in
Spain as an import (which increases the Spanish parent’s costs, reducing its profit by 100 Euros). That
saves the multinational corporation (MNC) as a whole 17.5 Euros, the difference between the Spanish
CIT and the Irish CIT on the 100 Euros of overstated value of the input, and causes no discrepancy
between export and import statistics. Given this less risky alternative for avoiding the CIT, firms may be
reluctant to respond to high CIT rates by engaging in the kind of misreporting that leads to discrepancies
in trade statistics.
Estimates
Table 2 reports estimates from a version of equation (1) which excludes directional dyad fixed effects, to
highlight the cross-sectional correlation between VAT rates and misreporting of exports and imports.
Column (1) includes the VAT rates and year fixed effects but no control variables, while column (2) adds
the control variables. Here and throughout, all tables report robust standard errors with clustering at
the directional dyad level.
As we can see, both columns show a large positive effect of the exporter VAT rate on the
reported trade flows. In column (1), a one percentage point increase in exporter VAT rate is associated
with an increase in over-reporting of exports of 2.9 percent of exports, and when we add the full set of
controls in column 2 the estimated effect increases to 3.8 percent of exports, and both estimates are
highly statistically significant in their differences from zero.
By contrast, the coefficient on importer VAT rate has a counter-intuitive sign in both pooled
cross sectional specifications. In column (1) a one percentage point increase in importer VAT rate is
associated with a reduction in the dependent variable equal to about 1.2 percent of exports, and when
23

we add controls in column (2) the reduction is equal to 1.7 percent of exports, with both being
statistically significant. As noted above, theory and prior literature suggested we should expect a
positive coefficient here, which would correspond to higher importer VAT rates causing larger
underreporting of imports. As will become clear below, the counter-intuitive signed coefficients on
importer VAT disappear once we control for directional dyad-fixed effects, which means that importer
VAT may be positively correlated with some time-invariant unobservable characteristics of the countries
examined that increases reported imports or reduces reported exports. Moreover, the counter-intuitive
cross-sectional relationship could reflect the aforementioned adjustments to the import data that are
designed to adjust for missing trader fraud – the patter of coefficients in the cross-section would suggest
a the adjustments made by statistical offices are an over-correction.
Column (2) of table 2 shows that a one standard deviation improvement in exporter country
governance quality is associated with a 10.7 percent reduction in export over-reporting in the pooled
cross sectional analysis, which is the expected sign and highly statistically significant. This would suggest
that exporters are less able or willing to over-report exports in the presence of higher quality
governance and the higher quality tax administration that presumably goes along with it. On the other
hand, the coefficient on importer governance quality has a counterintuitive positive sign in the pooled
cross sectional analysis, and it is also statistically significant. Taken at face value, this would suggest
either that under-reporting of imports is more common on average in better governed importing
countries, or that exporters over-report exports more when exporting to better-governed countries. A
higher exporter CIT rate is also associated with greater over-reporting of exports in the pooled cross-
section, with a one percentage point increase in exporter CIT rate increasing export over-reporting by
about 0.9 percent of exports. Importer CIT rate has the expected negative sign and is smaller in
magnitude at -0.4. Both are statistically significant. Point estimates on exporter and importer log per
capita real GDP are small in the pooled cross-sectional analysis, with wide confidence intervals around
24
them. We should not make too much of the few counter-intuitive findings here, as we’ll see that they go
away when we control for directional dyad fixed effects.
Table 3 displays our preferred specification, which does more to control for omitted variable
bias by adding directional dyad fixed effects. Once again both columns include time fixed effects, and
column (1) excludes the governance quality, CIT, and log per capita real GDP controls while column (2)
includes them. As the table illustrates, exporter VAT rate is estimated to have the expected positive and
significant impact on over-reporting exports in both cases. In column (1) a one percentage point
increase in exporter VAT rate is associated with an increase in over-reporting of exports of 1.4 percent
of exports, and when we add the full set of controls the effect shrinks a bit to 1.1 percent of exports, but
remains statistically significant with a standard error of 0.4 percent. In both specifications, the
coefficient on importer VAT rate is now much smaller and statistically insignificant, as are the
coefficients on the governance quality indices and CIT rates. A notable change relative to table 2 is that
when we add the directional dyad fixed effects, the coefficients on the log per capita real GDP variables
are now large and highly statistically significant. A doubling of per capita real GDP is associated with a
reduction in export over-reporting of 33.3 percent of exports. This could make sense if per capita real
GDP is serving as a proxy for quality of tax administration, and if the relative changes over time in the
ICRG governance quality indices that are left to identify the coefficients on governance quality are
extremely noisy proxies for changes in the quality of tax administration, which seems plausible.
However, if the relative change over time in importer log per capita real GDP is serving as a proxy for
relative change over time in quality of tax administration, its positive sign and large magnitude seem
counter-intuitive, as they would suggest that under-reporting of imports goes up more over time in
importing countries that have faster economic growth (and presumably faster improvements in tax
administration). Nonetheless, the main lesson to take away from table 3 is that higher exporter VAT
rates do seem to be robustly positively related to over-reporting of exports, which is exactly what we
25

would expect if discrepancies in trade statistics reflect the incentive a high VAT rate creates to over-
report exports.
In table 4, we report versions of the pooled cross section and difference-in-differences
specifications with full set of controls, which add an interaction between exporter VAT rate and exporter
governance quality, and an interaction between importer VAT rate and importer governance quality.
The pooled cross section estimates reported in column (1) are consistent with the expectation that the
responsiveness of export over-reporting to exporter VAT rate would be smaller when the exporting
country is better governed. For a country with the mean level of governance quality in the sample, a one
percentage point increase in exporter VAT rate is associated with an increase in export over-reporting of
4.3 percent of exports. Each one standard deviation increase in governance quality reduces that effect
by about 1.2 percent of exports. The coefficient on importer VAT rate once again has a counter-intuitive
negative sign in the pooled cross-section estimate shown in column (1), but there is no significant
relationship between importer governance quality and the effect of the importer VAT rate on import
under-reporting. One interesting finding is that when we allow the interactions between VAT rates and
governance quality, the coefficients on both governance quality indices by themselves now have the
expected positive sign and are statistically significant. So it seems that the counter-intuitive sign on
importer governance quality in the pooled cross-sectional estimates in table 2 were driven by omitting
the interactions between governance quality and the VAT rates.
In column (2) of table 4, we add directional dyad fixed effects to the specification that includes
interactions between governance quality indices and the VAT rates. In this specification, the estimated
effect of exporter VAT rate on export over-reporting at the mean of the governance quality index is very
similar to what it was without the interactions – a one percentage point increase in exporter VAT rate is
associated with an increase in export over-reporting of 1.03 percent of exports. The coefficient on the
interaction between exporter VAT rate and governance quality in this difference-in-differences
26

specification is very small and statistically insignificant. So with this more demanding identification
strategy, there is no systematic evidence that the effect of exporter VAT rate on export over-reporting
varies depending on governance quality, but there is still strong evidence that on average higher
exporter VAT rates are associated with more over-reporting of exports. The coefficients in column (2) of
table 4 on log per capita real GDP are similar to what they were in column (2) of table 3, and all other
coefficients remain small and statistically insignificant.
Revenue implications
The takeaway message from the results presented in tables 2 through 4 is reasonably clear. Our most
credible specification suggests that increasing the standard VAT rate by 1 percentage point increases the
value of exports recorded by the exporting country relative to the value of imports recorded by the
importing country by about 1.1 percent of exports. In table 5 we present calculations of what this
implies for the percentage change in the VAT base that will be associated with a one percent increase in
the VAT rate, for each country in the EU-15 and for the typical country in the EU-15 in 2006. This figure
can be interpreted as the percentage of the potential static revenue gain from a one percent increase in
the standard VAT rate that is lost due increased evasion associated with over-reporting of exports.
Technical details of how we did this are described in the appendix, but the basic idea is that for each
country in 2006, we translate our preferred estimate of β1 into the estimated increase in reported
exports for that country that caused by a one percent increase in its VAT rate. We then divide that by an
estimate of that country’s VAT base in 2006, which represents its actual year 2006 VAT collections,
divided by an effective VAT rate derived from Keen (2013) that is a weighted average of VAT rates on
different categories of consumption taking into account whether they are subject to the standard VAT
rate or special reduced VAT rates, exemptions, etc., where the weights are proportional to that category
27

of consumption’s share of overall consumption. We limit the analysis of revenue implications to the EU-
15 countries because those are the only countries for which Keen (2013) provides the data necessary for
us to do our calculations.
As we can see, for the representative EU-15 member in 2006, a one percent increase in the VAT
rate is estimated to be associated with a 0.15 decrease in the VAT base. This means that the VAT rate
increase would, at the margin, lose about 15 percent of the potential static revenue gain from the tax
increase to evasion in the form of export over-reporting. The estimated revenue leakage varies
substantially across EU-15 countries, with larger effects generally applying in countries where exports
are large relative to domestic consumption.
Conclusion
This project identifies export over-reporting as a potentially important channel for VAT evasion, and
presents evidence that this evasion is responsive to variation in VAT rates. In our most credible
specification, we find that each percentage point increase in the VAT rate is associated with an increase
in export over-reporting equal to about 1.1 percent of exports, which implies that about 15 percent of
potential static revenue gain from a VAT rate increase would leak out due to export-related evasion in
the typical EU-15 country. Estimates of the elasticity of VAT base to the VAT rate that are due to this
particular channel for evasion are useful inputs for informing policy makers’ decisions about what VAT
rate they might want to set given existing policy, administrative capabilities, and evasion opportunities.
They also help point to where policy reform efforts and tax administration resources might best be
allocated.
28
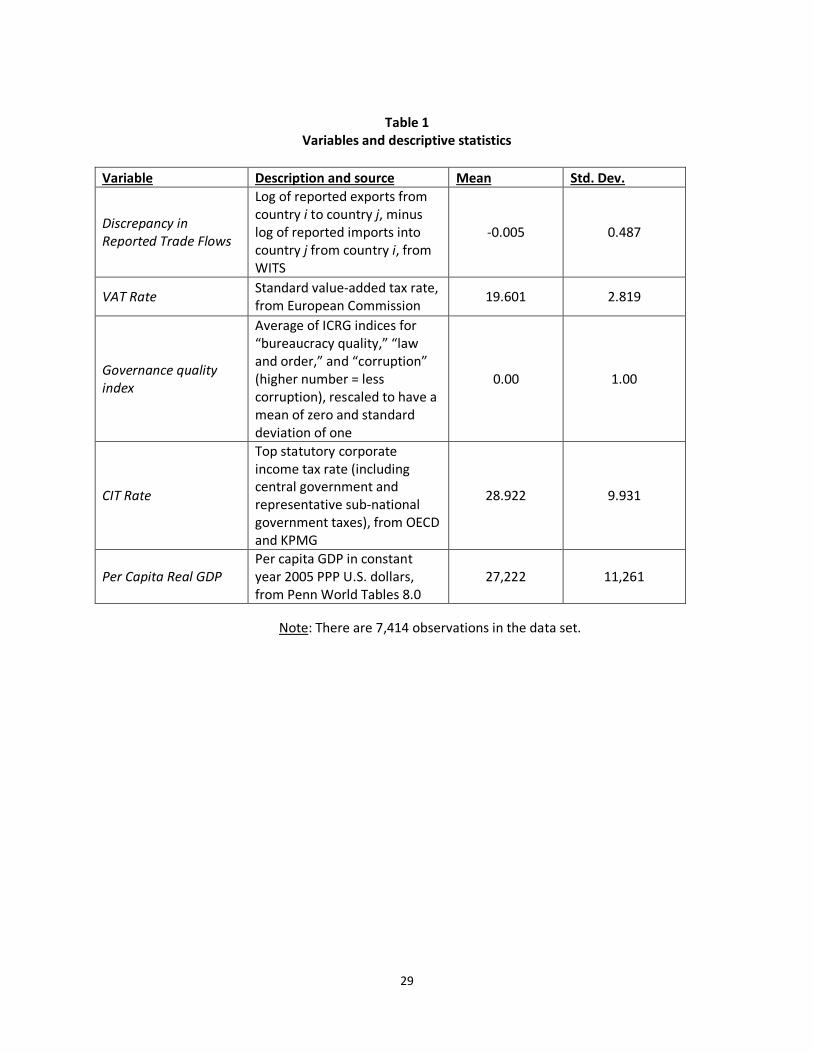
Table 1
Variables and descriptive statistics
Variable Description and source Mean Std. Dev.
Discrepancy in Reported Trade Flows
Log of reported exports from country i to country j, minus log of reported imports into country j from country i, from WITS
-0.005 0.487
VAT Rate Standard value-added tax rate, from European Commission 19.601 2.819
Governance quality index
Average of ICRG indices for “bureaucracy quality,” “law and order,” and “corruption” (higher number = less corruption), rescaled to have a mean of zero and standard deviation of one
0.00 1.00
CIT Rate
Top statutory corporate income tax rate (including central government and representative sub-national government taxes), from OECD and KPMG
28.922 9.931
Per Capita Real GDP Per capita GDP in constant year 2005 PPP U.S. dollars, from Penn World Tables 8.0
27,222 11,261
Note: There are 7,414 observations in the data set.
29

Table 2
Countries with higher VAT rates have greater over-reporting of exports: Pooled cross section analysis without dyad fixed effects
Dependent variable: ln(exportij)-ln(importji) (1) (2) Exporter VAT rate 0.029*** 0.038*** (0.006) (0.006) Importer VAT rate -0.012*** -0.017*** (0.005) (0.005) Exporter governance quality index -0.107*** (0.021) Importer governance quality index 0.051** (0.021) Exporter corporate income tax rate 0.009*** (0.003) Importer corporate income tax rate -0.004* (0.002) Exporter log per capita real GDP -0.010 (0.069) Importer log per capita real GDP -0.002 (0.079) Year fixed effects? Yes Yes Directional dyad fixed effects? No No Observations 7,414 7,414 R-squared 0.036 0.092
Robust standard errors with clustering by directional dyad in parentheses *** p<0.01, ** p<0.05, * p<0.1
Tax rates are measured in percentage points (0-100). The governance quality index has a mean of zero and standard deviation of one.
30
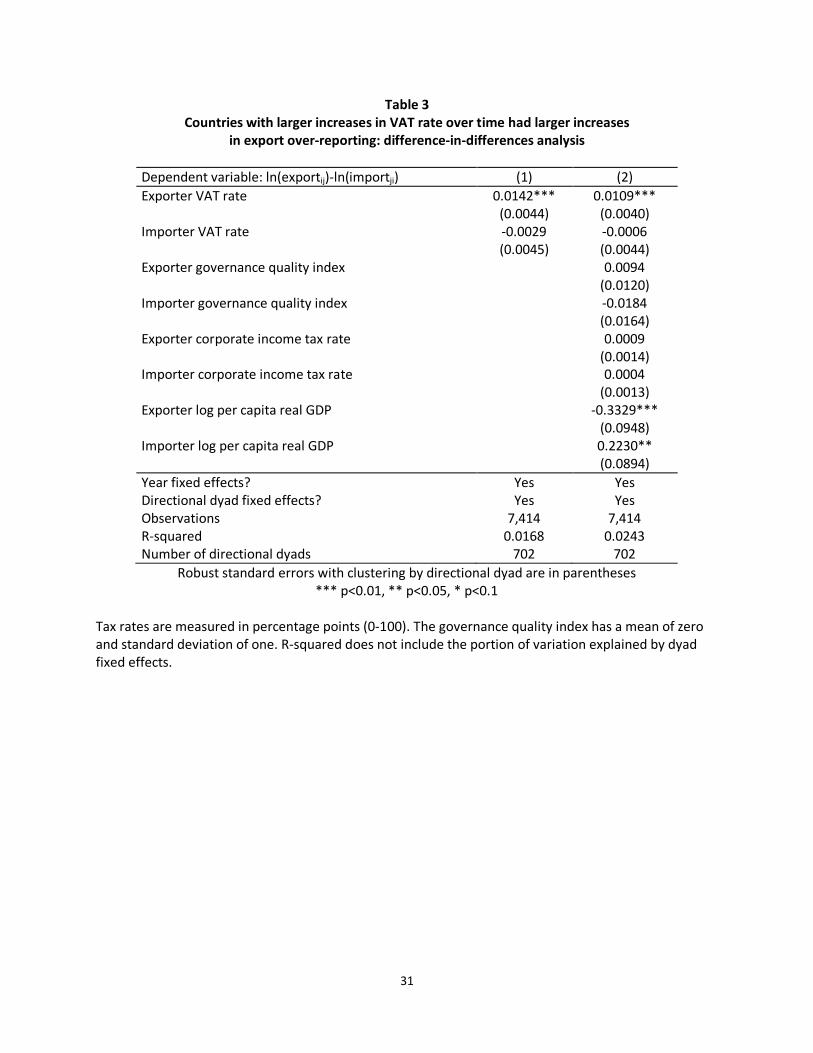
Table 3 Countries with larger increases in VAT rate over time had larger increases
in export over-reporting: difference-in-differences analysis
Dependent variable: ln(exportij)-ln(importji) (1) (2) Exporter VAT rate 0.0142*** 0.0109*** (0.0044) (0.0040) Importer VAT rate -0.0029 -0.0006 (0.0045) (0.0044) Exporter governance quality index 0.0094 (0.0120) Importer governance quality index -0.0184 (0.0164) Exporter corporate income tax rate 0.0009 (0.0014) Importer corporate income tax rate 0.0004 (0.0013) Exporter log per capita real GDP -0.3329*** (0.0948) Importer log per capita real GDP 0.2230** (0.0894) Year fixed effects? Yes Yes Directional dyad fixed effects? Yes Yes Observations 7,414 7,414 R-squared 0.0168 0.0243 Number of directional dyads 702 702
Robust standard errors with clustering by directional dyad are in parentheses *** p<0.01, ** p<0.05, * p<0.1
Tax rates are measured in percentage points (0-100). The governance quality index has a mean of zero and standard deviation of one. R-squared does not include the portion of variation explained by dyad fixed effects.
31

Table 4 The effect of VAT rate on export over-reporting,
allowing for interaction between VAT rate and corruption
Dependent variable: ln(exportij)-ln(importji) (1) (2) Exporter VAT rate 0.0427*** 0.0103*** (0.0069) (0.0036) Exporter VAT rate*governance quality index -0.0118*** -0.0010 (0.0036) (0.0028) Importer VAT rate -0.0151*** -0.0019 (0.0053) (0.0042) Importer VAT rate*governance quality index -0.0044 -0.0024 (0.0039) (0.0034) Exporter governance quality index 0.1381* 0.0287 (0.0730) (0.0543) Importer governance quality index 0.1424* 0.0275 (0.0804) (0.0617) Exporter corporate income tax rate 0.0090*** 0.0009 (0.0028) (0.0014) Importer corporate income tax rate -0.0041* 0.0003 (0.0022) (0.0012) Exporter log per capita real GDP -0.0317 -0.3377*** (0.0664) (0.0936) Importer log per capita real GDP -0.0108 0.2118** (0.0765) (0.0874) Year fixed effects? Yes Yes Directional dyad fixed effects? No Yes Observations 7,414 7,414 R-squared 0.0952 0.0244 Number of directional dyads 702 702
Robust standard errors with clustering by directional dyad in parentheses *** p<0.01, ** p<0.05, * p<0.1
Tax rates are measured in percentage points (0-100). The governance quality index has a mean of zero and standard deviation of one. R-squared does not include the portion of variation explained by dyad fixed effects.
32

Table 5
Elasticity of VAT tax base with respect to tax rate implied by difference-in-differences estimate from Table 3, column (2),
using 2006 data for EU-15 countries
Country %ΔTax Base/ %Δ Tax Rate
Austria -0.19
Belgium -0.27
Denmark -0.21
Finland -0.16
France -0.08
Germany -0.12
Greece -0.08
Ireland -0.31
Italy -0.10
Luxembourg -0.57
Netherlands -0.22
Portugal -0.09
Spain -0.07
Sweden -0.21
United Kingdom -0.08 Representative EU-15 Member -0.15 See text for details of calculation.
33

Table A.1 Year membership in EU starts, first year included in sample, difference between minimum
and maximum VAT rate during years included in sample, and source of CIT data
Country Year
joined EU
First year included
in our sample
Difference between minimum and maximum VAT
rates during sampled years (in
percentage points)
Source of corporate
income tax rate data
Ireland 1973 1984 10.0 OECD Greece 1981 1987 7.0 OECD Portugal 1986 1986 7.0 OECD Spain 1986 1986 6.0 OECD Germany 1952 1984 5.0 OECD Hungary 2004 2005 5.0 OECD Romania 2007 2007 5.0 KPMG United Kingdom 1973 1984 5.0 OECD Estonia 2004 2005 4.0 OECD Latvia 2004 2005 4.0 KPMG Netherlands 1952 1984 3.5 OECD Denmark 1973 1984 3.0 OECD Italy 1952 1984 3.0 OECD Lithuania 2004 2005 3.0 KPMG France 1952 1984 2.0 OECD Cyprus 2004 2005 2.0 KPMG Czech Republic 2004 2005 1.0 OECD Finland 1995 1995 1.0 OECD Poland 2004 2005 1.0 OECD Slovakia 2004 2005 1.0 OECD Austria 1995 1995 0.0 OECD Belgium 1952 1999 0.0 OECD Bulgaria 2007 2007 0.0 KPMG Luxembourg 1952 1999 0.0 KPMG Malta 2004 2005 0.0 KPMG Slovenia 2004 2005 0.0 OECD Sweden 1995 1995 0.0 OECD Final year of inclusion in sample is 2011 for all countries. Source VAT rate change is author’s calculations based on European Commission (2014).
34

Figure 1 EU countries with VAT rate changes between 3 and 10 percentage points during sample period
1218
2430
1218
2430
1218
2430
1218
2430
1984 1993 2002 2011 1984 1993 2002 2011
1984 1993 2002 2011 1984 1993 2002 2011
Denmark Estonia Germany Greece
Hungary Ireland Italy Latvia
Lithuania Netherlands Portugal Romania
Spain United Kingdom
VA
T R
ate
(%)
YearGraphs by EU Member
35

Figure 2 EU countries with VAT rate changes of 2 percentage points or less during sample period
1218
2430
1218
2430
1218
2430
1218
2430
1984 1993 2002 2011 1984 1993 2002 2011 1984 1993 2002 2011
1984 1993 2002 2011
Austria Belgium Bulgaria Cyprus
Czech Republic Finland France Luxembourg
Malta Poland Slovakia Slovenia
Sweden
VA
T R
ate
(%)
YearGraphs by EU Member
36

Appendix: technical details of VAT base elasticity calculations
We are interested in calculating the percentage change in the VAT base in response to a 1 percent
increase in the VAT rate, that is, ( %Δ𝑉𝑉𝑉𝑉𝑉𝑉 𝑏𝑏𝑏𝑏𝑏𝑏𝑏𝑏%Δ𝑆𝑆𝑖𝑖𝑏𝑏𝑖𝑖𝑆𝑆𝑖𝑖𝑆𝑆𝑆𝑆𝑆𝑆 𝑉𝑉𝑉𝑉𝑉𝑉 𝑆𝑆𝑏𝑏𝑖𝑖𝑏𝑏
). Our formula to calculate this is:
(A.1) %∆(𝑉𝑉𝑉𝑉𝑉𝑉 𝑏𝑏𝑏𝑏𝑏𝑏𝑏𝑏)𝑖𝑖%∆𝜏𝜏𝑠𝑠𝑖𝑖
= −𝜏𝜏𝑠𝑠𝑖𝑖𝑋𝑋𝑖𝑖𝛽𝛽1(𝑉𝑉𝑉𝑉𝑉𝑉 𝑆𝑆𝑏𝑏𝑟𝑟𝑏𝑏𝑟𝑟𝑆𝑆𝑏𝑏)𝑖𝑖 [𝜏𝜏𝑠𝑠𝑖𝑖(1−𝑃𝑃𝑖𝑖)]⁄
In equation (A.1), i indexes countries,τsi is the standard statutory VAT rate in country i expressed in
decimal terms (i.e., a 20% tax rate is 0.2), Xi is exports by country i, and β1 is the coefficient on exporter
VAT rate from our preferred regression specification (approximately 0.011). The numerator of the right-
hand-side represents the change in country i’s VAT base that the estimated value of β1 from our
preferred regression specification implies would be caused by a one percent increase in country i’s
standard VAT rate. It is equal to the implied change in over-reported exports, multiplied by negative
one. The denominator of the right-hand side represents actual VAT revenue collections for country i,
divided by an estimate of what we call the “effective VAT policy rate,” 𝜏𝜏𝑏𝑏𝑖𝑖(1− 𝑃𝑃𝑖𝑖), which as we will see
below is a weighted average of VAT rates on different categories of consumption that vary from the
standard statutory VAT rate only due to intentional policy decisions in the design of the VAT such as
exemptions, special reduced rates, etc., and not due to VAT evasion. Pi is the VAT “policy gap” defined
by Keen (2013) and explained further below. Multiplying the standard statutory VAT rate τsi by (1-Pi)
yields the effective VAT policy rate.
As noted above, our concept of an effective VAT rate for country i is a weighted average of
effective VAT policy rates that the country’s VAT law applies to the various categories of consumption.
Following the notation of Keen (2013), we define the effective VAT policy rate as:
37
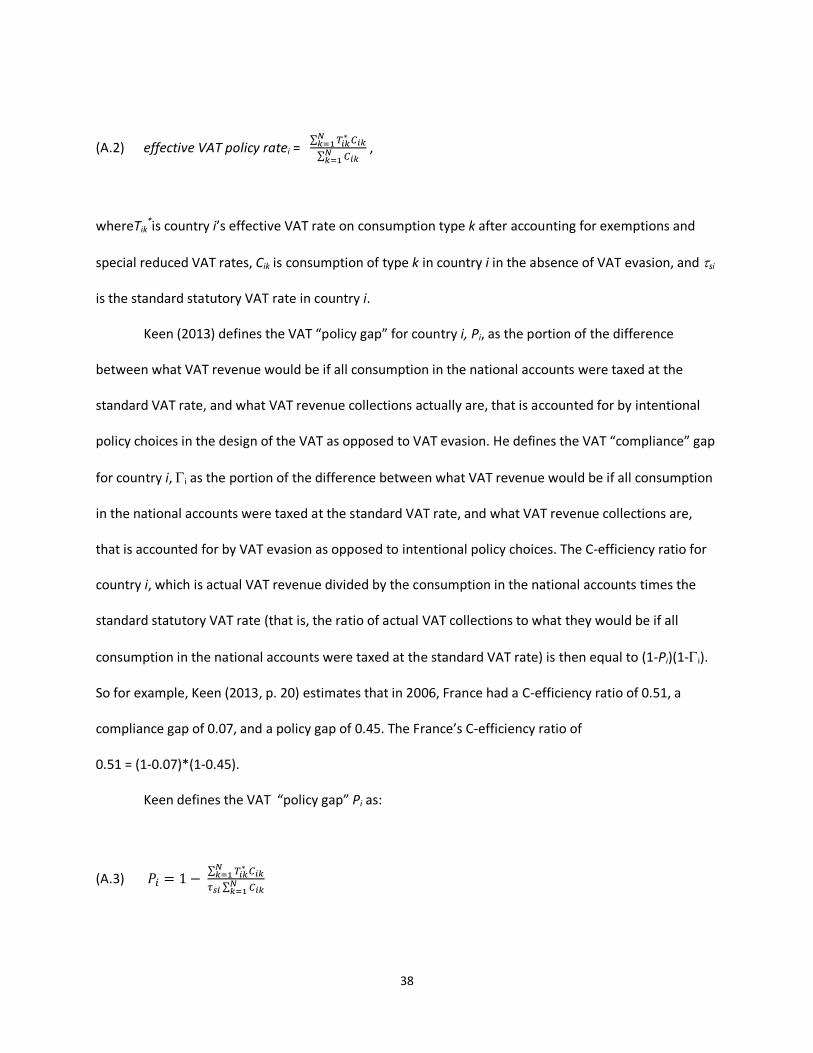
(A.2) effective VAT policy ratei = ∑ 𝑉𝑉𝑖𝑖𝑖𝑖
∗ 𝐶𝐶𝑖𝑖𝑖𝑖𝑁𝑁𝑖𝑖=1∑ 𝐶𝐶𝑖𝑖𝑖𝑖𝑁𝑁𝑖𝑖=1
,
whereTik*is country i’s effective VAT rate on consumption type k after accounting for exemptions and
special reduced VAT rates, Cik is consumption of type k in country i in the absence of VAT evasion, and τsi
is the standard statutory VAT rate in country i.
Keen (2013) defines the VAT “policy gap” for country i, Pi, as the portion of the difference
between what VAT revenue would be if all consumption in the national accounts were taxed at the
standard VAT rate, and what VAT revenue collections actually are, that is accounted for by intentional
policy choices in the design of the VAT as opposed to VAT evasion. He defines the VAT “compliance” gap
for country i, Γi as the portion of the difference between what VAT revenue would be if all consumption
in the national accounts were taxed at the standard VAT rate, and what VAT revenue collections are,
that is accounted for by VAT evasion as opposed to intentional policy choices. The C-efficiency ratio for
country i, which is actual VAT revenue divided by the consumption in the national accounts times the
standard statutory VAT rate (that is, the ratio of actual VAT collections to what they would be if all
consumption in the national accounts were taxed at the standard VAT rate) is then equal to (1-Pi)(1-Γi).
So for example, Keen (2013, p. 20) estimates that in 2006, France had a C-efficiency ratio of 0.51, a
compliance gap of 0.07, and a policy gap of 0.45. The France’s C-efficiency ratio of
0.51 = (1-0.07)*(1-0.45).
Keen defines the VAT “policy gap” Pi as:
(A.3) 𝑃𝑃𝑖𝑖 = 1− ∑ 𝑉𝑉𝑖𝑖𝑖𝑖∗ 𝐶𝐶𝑖𝑖𝑖𝑖𝑁𝑁
𝑖𝑖=1𝜏𝜏𝑠𝑠𝑖𝑖 ∑ 𝐶𝐶𝑖𝑖𝑖𝑖𝑁𝑁
𝑖𝑖=1
38

Algebraically re-arranging expression A.3 to solve for the effective VAT rate defined in expression (A.2)
gives us:
(A.4) ∑ 𝑉𝑉𝑖𝑖𝑖𝑖
∗ 𝐶𝐶𝑖𝑖𝑖𝑖𝑁𝑁𝑖𝑖=1∑ 𝐶𝐶𝑖𝑖𝑖𝑖𝑁𝑁𝑖𝑖=1
= 𝜏𝜏𝑏𝑏𝑖𝑖(1 − 𝑃𝑃𝑖𝑖)
Hence, using the policy gap reported in Keen (2013, p. 20), we can calculate the implicit tax rate we
need to back out the VAT base.
For purposes of the calculations shown in table 5, all variables in expression (A.1) are measured
in 2006. We obtain 2006 values of exports and actual VAT receipts for EU-15 members from OECD
(2014). We also perform the calculations for a representative country of the union that has the un-
weighted average values of all the relevant variables among the EU-15 nations in 2006.
39
References
Agha, Ali, and Jonathan Haughton. 1996. "Designing VAT Systems: Some Efficiency Considerations." Review of Economics and Statistics 78, no. 2: 303-308. Allingham, Michael G. and Sandmo, Agnar. 1972. "Income Tax Evasion: a Theoretical Analysis." Journal of Public Economics 1(3-4): 323-338. Amjadi, Azita, Philip Schuler, Senior Hiroaki Kuwahara, Susanne Quadros. 2011. "WITS User's Manual." http://wits.worldbank.org/data/public/WITS_User_Manual.pdf Barbone, Luca, Misha V. Belkindas, Leon Bettendorff, Richard Bird, Mikhail Bonch-Osmoloskiy, and Michael Smart. 2013. "Study to Quantify and Analyze the VAT Gap in the EU-27 Member States."Center for Social and Economic Research Project Report. July. <http://ec.europa.eu/taxation_customs/resources/documents/common/publications/studies/vat-gap.pdf> (accessed Nov. 4, 2014). Bird, Richard and Pierre-Pascal Gendron. 2007. The VAT in Developing and Transitional Countries.Cambridge: Cambridge University Press. Borselli, Fabrizio. 2011."Organised VAT Fraud: Features, Magnitude, Policy Perspectives." Bank of Italy Occasional paper No. 106. October. <http://www.bancaditalia.it/pubblicazioni/econo/quest_ecofin_2/QF_106/QEF_106.pdf> (accessed November 4, 2014). Christie, Edward and Mario Holzner. 2006. “What Explains Tax Evasion? An Empirical Assessment Based on European Data."Vienna Institute for InternationalEconomic Studies Working Paper No. 40.<http://www.wiiw.ac.at/pdf/wp40.pdf> (accessed November 4, 2014). Clausing, Kimberly A. 2009. "Multinational Firm Tax Avoidance and Tax Policy." National Tax Journal 62, no. 4: 703-725. de Paula, Aureo and Jose Scheinkman. 2010. "Value-added taxes, Chain Effects and Informality." American Economic Journal: Macroeconomics 2: 195-221. Dharmapala, Dhammika. 2014. "What Do We Know About Base Erosion and Profit Shifting? A Review of the Empirical Literature." CESifo Working Paper No. 4612. <http://www.econstor.eu/bitstream/10419/93481/1/cesifo_wp4612.pdf> (accessed November 8, 2014). Ebril, Liam, Michael Keen, and Jean-Paul Bodin. 2001. The Modern VAT. Washington: International Monetary Fund. European Commission. 2014. VAT Rates Applied in the Member States of the European Union: Situation at 1st July,2014. <http://ec.europa.eu/taxation_customs/resources/documents/taxation/vat/how_vat_works/rates/vat_rates_en.pdf> (accessed November 4, 2014).
40

Eurostat. 2014. Taxation Trends in the European Union, 2014 Edition. Luxembourg: Publications Office of the European Union. <http://ec.europa.eu/taxation_customs/resources/documents/taxation/gen_info/economic_analysis/tax_structures/2014/report.pdf> (accessed Nov. 8, 2014). Feenstra, Robert C., Robert Inklaar and Marcel P. Timmer. 2013. "The Next Generation of the Penn World Table." <http://www.rug.nl/research/ggdc/data/penn-world-table> (accessed Nov. 4, 2014). Ferrantino, Michael J., Xuepeng Liu, and Zhi Wang. 2012. "Evasion Behaviors of Exporters and Importers: Evidence from the U.S.-China Trade Data Discrepancy." Journal of International Economics 86, no. 1: 141-157. Fisman, Raymond, and Shang-Jin Wei. 2004. "Tax Rates and Tax Evasion: Evidence from 'Missing Imports' in China." Journal of Political Economy 112, no. 2: 471-496. Gradeva, Katerina. 2014. “VAT Fraud in Intra-EU Trade.” Working paper, Goethe University Frankfurt. August 7, 2014. <http://www.etsg.org/ETSG2014/Papers/378.pdf> (accessed November 8, 2014). Internal Revenue Service. 2012. “Overview Tax Gap for Tax Year 2006.” January 6. <http://www.irs.gov/file_source/pub/newsroom/overview_tax_gap_2006.pdf> (accessed Nov. 9, 2014). Javorcik, Beata Smarzynska, and Gaia Narciso. 2008. “Differentiated Products and Evasion of Import Tariffs.” Journal of International Economics 76 (2), 208–222. Keen, Michael. 2013. “The Anatomy of the VAT.” IMF Working Paper. May.<http://www.imf.org/external/pubs/ft/wp/2013/wp13111.pdf> (accessed November 7, 2014) Keen, Michael and Stephen Smith. 2006. "VAT Fraud and Evasion: What Do We Know and What Can Be Done?" National Tax Journal 59(4): 861-887. Whalley, John, and Vera Kononova. 2010. "Recent Russian Debate on Moving from VAT to Sales Taxes and Its Global Implications." Journal of Globalization and Development Vol. 1, no. 2. KPMG. 2006. KPMG’s Corporate Tax Rate Survey: An International Analysis of Corporate Tax Rates from 1993 to 2006. <http://www.lib.uwo.ca/files/business/KPMGCorporateTaxRateSurvey.pdf> (accessed Nov. 8, 2014). KPMG. 2014. “Corporate Tax Rates Table.” <http://www.kpmg.com/Global/en/services/Tax/tax- tools-and-resources/Pages/corporate-tax-rates-table.aspx> (accessed November 4, 2014). OECD. 2014. OECD iLibrary: Statistics. <http://www.oecd-ilibrary.org/statistics> (accessed November 4, 2014). Levin, Jorgen, and Lars M. Widell. 2014. "Tax Evasion in Kenya and Tanzania: Evidence from Missing Imports." Economic Modelling 39, 151-162.
41

Liu, Xuepeng. 2013. “Tax Avoidance Through Re-Imports: The Case of Redundant Trade.” Journal of Development Economics104: 152-164. Mishra, Prachi, Arvind Subramanian, and PetiaTopalova. 2008. "Tariffs, Enforcement, and Customs Evasion: Evidence from India." Journal of Public Economics 92, no. 10-11: 1907-1925. Naritomi, Joana. 2014. "Consumers as Tax Auditors."Working Paper, London School of Economics.June. <https://www.dropbox.com/s/xqi3mle26n4qm49/JMP_jnaritomi_518.pdf> (accessed November 4, 2014. Nie, Huihua, Mingyue Fang, and Tao Li. 2010."China's Value-added Tax Reform, Firm Behavior and Performance." Frontiers of Economics in China 5, no. 3: 445-463. OECD. 2002. Measuring the Non-Observed Economy: A Handbook. OECD. 2008. OECD Information Technology Outlook 2008. OECD. 2014. OECD iLibrary <http://www.oecd-ilibrary.org/statistics> (accessed November 4, 2014). Pomeranz, Dina. 2013. “No Taxation Without Information: Deterrence and Self-Enforcement in the Value-added Tax." NBER Working Paper No. 19199. July.<http://www.nber.org/papers/w19199> The PRS Group. 2014. "International Country Risk Guide.” <https://www.prsgroup.com/about- us/our-two-methodologies/icrg>. Ruffles, David, Geoff Tily, David Caplan, and Sandra Tudor. 2003. "VAT Missing Trader Intracommunity Fraud: The Effect on Balance of Payments Statistics and U.K. National Accounts."Economic Trends 597: 58-70. Slemrod, Joel. 2007. "Cheating Ourselves: The Economics of Tax Evasion." Journal Of Economic Perspectives 21, no. 1: 25-48. Slemrod, Joel and Shlomo Yitzhaki. 2002. “Tax Evasion, Avoidance, and Administration.” In Alan J. Auerbach and Martin Feldstein, eds., Handbook of Public Economics, Volume 3. Amsterdam: Elsevier. The Tax Foundation. 2014. “OECD Corporate Income Tax Rates, 1981-2013.” <http://taxfoundation.org/article/oecd-corporate-income-tax-rates-1981-2013> (accessed November 9, 2014). US AID. 2014. Collecting Taxes 2012/2013. <http://egateg.usaidallnet.gov/collecting-taxes> (accessed November 8, 2014). World Bank. 2014. World Integrated Trade Solutions. <http://wits.worldbank.org/>. Yitzhaki, Shlomo. 1974. "A Note on Income Tax Evasion: A Theoretical Analysis." Journal of Public Economics 3, no. 2: 201-202.
42
Recommended