
Evidence Base to Support Portsmouth LEA Portsmouth City Council
DTZ
Marchmount House
Dumfries Place
Cardiff
CF10 3RJ
4th April 2011
110WTZ00
Final Report v2.0
Contents
Glossary 1
Executive Summary 2
1. Introduction 5
2. Headline Economic Performance 7
3. Economic Geography 8
4. Sectoral Employment Structure 12
5. Enterprise and Business Base 21
6. Population and Demographics 25
7. Labour Market and Skills 29
8. Quality of Life and Place 41
9. Summary & Conclusions 48
Page 1
Glossary
ABI Annual Business Inquiry
APS Annual Population Survey
ASHE Annual Survey of Hours and Earnings
BRES Business Register and Employment Survey
GB Great Britain
GVA Gross Value Added
IMD Index of Multiple Deprivation
IDBR Inter Departmental Business Register
LEA Local Economic Assessment
LEP Local Enterprise Partnership
NHS National Health Service
NVQ National Vocational Qualification
PUSH Partnership for Urban South Hampshire
PWC Price Waterhouse Coopers
SE South East
TTWA Travel to Work Area
UK United Kingdom
Page 2
Executive Summary
DTZ was appointed by Portsmouth City Council to prepare a report to contribute to the preparation of
a Portsmouth Local Economic Assessment. The main report sets out a range of data and analysis
that provides some insight into the structure and dynamics of the Portsmouth socio economic context.
This summary seeks to encapsulate the key points from the main report, to give the reader an
overview of the most salient issues for Portsmouth.
Economic Geography
Portsmouth is a highly urbanised city on the south coast of England within the county of Hampshire. It
is well connected with strategic road and rail routes as well as domestic and international ferry routes
to a range of destinations. The city performs a key role as an employment hub for its suburban
hinterland, most notably the boroughs of Fareham, Gosport and Havant which supply 24% of the city’s
workforce. Combined, the South East Hampshire area is home to more than 500,000 residents and
200,000 jobs.
Portsmouth is also a significant feature of the wider South Hampshire functional economic area that
combines the two cities of Portsmouth and Southampton with their combined hinterlands. The
administrations of this sub-region have been working together to deliver sustainable economic growth
under the name Partnership for Urban South Hampshire (PUSH) since 2003 and PUSH recently
received approval to form the Solent Local Enterprise Partnership (LEP).
Headline Performance
Gross Value Added (GVA) is the primary indicator used to measure the size of local economies. In
2007 (latest available data) the Portsmouth economy generated £4.1bn GVA. This represented a rise
of 53% from 1999, a figure comparable to both the South East region of England and UK averages.
GVA per head (a measure which allows relative comparison between areas) in Portsmouth stood at
£21,800, higher than the UK national average and benchmark south coast cities of Brighton & Hove,
Southampton and Bournemouth.
However, employment performance has been weaker than GVA. At 2009 there were 101,000
employee jobs in Portsmouth, representing only a modest increase of less than 2% since the late
1990s at a time when the UK economy as a whole has experienced rapid employment growth. Whilst
there have been fluctuations over time and across sectors, the employment role of Portsmouth has
weakened slightly as employers have been attracted towards the M27 corridor which has experienced
very high employment growth.
Economic Structure
The sectoral structure of the Portsmouth economy is influenced by its heritage, as the home to the
Royal Navy and the supporting industry that has grown around this, as well as its role as a public
service centre to its hinterland. A high proportion of Portsmouth employment is in the health and
social work sector, reflecting the presence of the Portsmouth NHS Trust and Queen Alexandria
Hospital. Other large sectors which show a high concentration of employment relative to other
locations include: administrative and support services, public administration and defence, and
information and communication. Sectors where Portsmouth shows a low concentration of
employment include: wholesale and retail trade, professional, scientific and technical, and finance and
insurance.
Page 3
Looking at finer grain data it is possible to narrow down some of the areas of greatest strength in the
Portsmouth economy as:
Building of ships and floating structures
Manufacture of air and spacecraft
Information technology and computer service
Call centres
General public administration
Defence
Hospitals
Of potential concern for Portsmouth is the high degree of reliance on the public sector for its
employment base. Not only in terms of direct employment, but also related supply chains, particularly
in the defence marine and aerospace sectors. With the cuts to public expenditure which are currently
being made there are risks to Portsmouth.
Portsmouth has a relatively small financial and business services sector. The exception being the
information technology and computer service sub-sector which includes key employers such as IBM
and the call centres sub-sector.
Business & Enterprise
In 2009 there were 5,730 active businesses in Portsmouth. The ratio of businesses to population in
Portsmouth is much lower than its surrounding area and levels of new firm formation are low,
however, in many ways this reflects its urban nature and the availability of employment opportunity in
the city. Portsmouth has a much greater reliance on large employers than comparator areas, with
23% of employment within businesses of more than 1,000 workers, compared to 11% at the UK level.
Population & Demographics
The population of Portsmouth stands at a little over 200,000 persons and this has grown at a slightly
faster rate than the UK average since 2000. The age structure of the population is relatively young,
with a high proportion of working age. The age sector exhibiting fastest growth is 15-29 years, in part
reflecting the expansion of the University of Portsmouth.
Labour Market
Labour market indicators combine with data on housing and deprivation to paint a consistent picture of
labour market performance in Portsmouth.
Levels of labour market participation, as measured by economic activity and employment rates, are
lower than the South Hampshire and South East regional averages, however, broadly comparable
with national averages. The corollary of this is slightly higher unemployment and inactivity rates,
which have recently increased as a result of the recession in line with other areas.
Data on the qualification levels of the workforce show a low proportion with the highest level
qualifications which is reflected in the occupational mix of residents, skewed towards middle and lower
order occupational groupings. Again this is reflected in earnings data, with resident wages lower than
many benchmark areas and lower than workplace wages, implying that many of the better paid jobs in
the city are not taken by residents of the city.
Page 4
Quality of Life and Place
Data on educational attainment, quality of schools and housing stock align with labour market data.
The city has a very high proportion of terraced housing compared to benchmark areas, and as a
result, average house prices are lower than many other areas in the immediate hinterland. The
relative lack of larger semi detached and detached homes provide a potential driver for those with
higher skills, earning higher salaries to move further afield to find more spacious housing. This
therefore influences the social structure of the population. Educational attainment is lower than
national averages across all age groups which clearly links through to the overall qualifications of the
resident workforce. There is also evidence of poorer health, lower life expectancy and lower levels of
community safety than national averages, however, compared to other more urban areas, many of the
data are broadly comparable.
Deprivation data shows a concentration of areas within Portsmouth within the fourth, fifth and sixth
deciles with low concentrations of areas with low deprivation. The levels of high deprivation are
broadly in line with national averages. The pockets of greatest deprivation are around the fringes of
the city centre and in the north of the city.
Conclusion
In combination, the data tell a story of Portsmouth as a city that faces similar issues to many other
cities. It performs well compared to the UK against many indicators, but often appears to do less well
when compared to some of its immediate hinterlands which do not have the same highly urbanised
typology.
The data indicate a lack of higher level skills among the resident workforce, which is in part driven by
the housing stock of the city. However, this aligns with the occupational mix of the city and in turn can
in part explain the sectoral structure of employment, with a lack of high end private sector business
and financial services. This is also a product of the complementary roles the cities of Portsmouth and
Southampton have developed over time.
Looking forward the risks for Portsmouth relate to the reliance on the public sector, either directly or
indirectly, at a time of public sector spending cuts. Over the last 10 years, with rapidly rising
employment in many areas, Portsmouth has failed to attract substantial numbers of new jobs and this
trend will need to be reversed for the city to retain its role as an employment hub for a wider
hinterland.
The PUSH Economic Development Strategy identifies the cities in South Hampshire as being key
drivers to deliver the aims of the PUSH area. The strategy has key actions dealing with issues in
relation to labour market and skills and enterprise levels. Many of the key sectors identified by PUSH
align well to Portsmouth’s economy, aside from the specialism in ‘information and communication’,
which is more specific to Portsmouth.
Page 5
1. Introduction
The purpose of this report is to inform the development of a Portsmouth focused Local
Economic Assessment (LEA). It is intended to be a tool that can be used to shape and
underpin the actions of Portsmouth City Council and other partners and stakeholders. The
development of an evidence base to inform policy, strategy and action is good practice and
can contribute significantly to alignment of activity around a common understanding and can
help prioritise effort in the areas of greatest need.
This report does not look to duplicate existing evidence, such as the recent economic
evidence base prepared for PUSH or the Hampshire LEA but to complement it. In particular,
it seeks to identify issues which may be of greater importance to Portsmouth than the rest of
the sub-region and hence require a more local response. Neither does this document replace
the Solent Waterfront Strategy, the Portsmouth Regeneration Strategy or any other strategy
document; this is an evidence base to help inform future strategy and action setting.
1.1 Document Structure
The remainder of this document is structured as follows:
Chapter 2 provides a short overview of Portsmouth’s economic performance, setting out
some of the key headlines of the city economy.
Chapter 3 provides a short discussion of the economic geography of Portsmouth
highlighting Portsmouth’s importance as an economic hub to a wider catchment than the city’s
own boundary.
Chapter 4 considers the structure of the Portsmouth economy in terms of the sectoral
distribution of employment.
Chapter 5 assesses key data on the Portsmouth business base and levels of enterprise.
Chapter 6 sets out key statistics on the population and demographics of Portsmouth.
Chapter 7 then looks in more detail at the labour market and skills situation in Portsmouth
and its key labour catchment.
Chapter 8 sets out a range of information in respect of quality of life and place in
Portsmouth.
Chapter 9 draws the findings of the preceding chapters into a combined conclusion.
1.1.1 Benchmarking
In order to understand Portsmouth’s relative economic performance it is necessary to
compare against key comparators. We have divided the comparators into two groups;
– The first of those groups are the scalable comparators. These are geographies of different
sizes that provide contextual positioning of the performance of Portsmouth. These are:
○ SE Hampshire
○ PUSH Area
○ South East Region
○ GB/UK
Page 6
– The second group of comparators is similarly positioned cities, with a similar geographic
location and which are of roughly the same size. These are:
○ Bournemouth
○ Brighton and Hove
○ Southampton
By choosing these comparators we are able to highlight similarities and differences with
Portsmouth and in some cases, identify opportunities for development. Due to the number of
comparators not all datasets are benchmarked against all comparators.
1.1.2 Data
When presenting economic data, we have, wherever possible, presented the most recent data
available. However, the nature of economic statistics, surveying and reporting means that the
final publishing of data may significantly lag the time period which they relate to.
Page 7
2. Headline Economic Performance
Over the period 1999 to 2007 the Portsmouth economy (measure in nominal GVA terms) has
grown by 52%, increasing from £2.7bn to £4.1bn annually. This is a similar rate of growth as
the South East region and the UK, both of which have grown by 51% over the same period.
GVA per head growth in Portsmouth has also followed a trend which is very similar to the
national rate, increasing by 45% over the period 1999 to 2007. When comparing to other
south coast cities GVA per head in Portsmouth has grown at a faster rate than Southampton,
a similar rate to Brighton but slightly slower than Bournemouth. This growth has meant that
GVA per head in Portsmouth is currently £21,800, higher than the national average of
£21,100. It is also higher than the comparator areas of Bournemouth, Brighton and
Southampton.
Total employment in Portsmouth in 2009 was 101,000, a small increase on the level in 1998
of 99,300 (increase of 1.6%). Over this time total employment has fluctuated between 96,000
and 103,000. Over the same period Southampton has seen employment decline losing 7,000
jobs leaving them with 105,600 jobs in 2009. Brighton and Bournemouth have seen
employment growth of 16% and 5% respectively. Employment in SE Hampshire has grown by
10%, PUSH by 4%, SE by 7% and GB by 8%.
Employment and Economic Activity rates are slightly lower than PUSH and GB. The trend,
over the last 5 years, has been for these rates as a proportion of overall working age
population to fall. At a GB level the economic activity rate has remained broadly constant, with
a fall in the employment rate in 2009 due to the recent recession.
The unemployment rate in Portsmouth as measured by the APS, has risen over the last few
years as a result of the recession but lies below the GB average. The unemployment claimant
count is higher in Portsmouth than the average for PUSH and the SE but below the overall GB
average. This has been a long term trend over the last ten years.
In 2009 there were a total of 5,730 active businesses in Portsmouth, as measured by the
IDBR. The ratio of businesses per head of population is lower than the scaleable comparators
but not particularly unusual for highly urbanised areas.
Chapter Summary
– In 2007 the Portsmouth economy generated a total of £4.1bn GVA.
– Between 1999 and 2007 the Portsmouth economy grew by 52%, a similar growth rate to
the SE and the UK
– GVA per head in Portsmouth is currently £21,800, higher than the national average of
£21,100.
– The total number of employee jobs in Portsmouth in 2009 was 101,000.
– Portsmouth had a small amount of employment growth between 1998 and 2009, a
growth rate of 1.6%, lower than most benchmark areas.
– Economic activity and employment rates are slightly below average, and have been
falling in recent years.
– Unemployment rates have risen as a result of the recession, although the claimant
count unemployment measure has started to fall in recent months, as the economy
shows some initial signs of recovery.
Page 8
3. Economic Geography
Portsmouth is a city in the County of Hampshire on the south coast of England. Portsmouth is
a highly urbanised area, which is approximately 60 miles (around 1 hr by car) from the
outskirts of London. The direct train from Portsmouth to London Waterloo takes approximately
1hr 45 mins. Key road connections include the M275 which leads northwards out of the city,
the M27 westwards towards Southampton, with the A3 heading north towards London and the
A27 to West Sussex eastwards. The construction of the £370m Hindhead Tunnel at
Hindhead, Surrey will reduce congestion on the A3. The tunnel and associated road widening
works will remove the last part of single lane carriageway between Portsmouth and London,
eliminating bottlenecking at Hindhead village. This has the potential to deliver positive
benefits to the Portsmouth economy.
The city also has ferry links to Gosport, Isle of Wight, France and Spain. The Portsmouth-
Gosport ferry runs throughout the year, and carries over 3.6 million passengers per annum,
the busiest short route ferry in the country. Short route ferries also run between the
Portsmouth and the Isle of Wight several times daily. International ferries run daily from
Portsmouth to France (Cherbourg, Caen and St Malo) and several times a week to Spain
(Santander and Bilbao).
3.1 Functional Area
In 2009 the population of Portsmouth was 203,500 with a total of 101,000 people employed.
However, the tight administrative boundaries do not neatly reflect how the local and sub-
regional economy functions. Together with Portsmouth the surrounding boroughs of Fareham,
Gosport and Havant form the SE Hampshire area, which acts much like a Portsmouth City
Region. Together this has a combined population of in excess of half a million and more than
200,000 jobs.
The 2001 Census of Population remains the most exhaustive dataset on commuting and
travel to work patterns. However, ONS published a 2008 update which provides an indication
of changes in behaviour.
63% of the workforce of Portsmouth is comprised of the residents of Portsmouth (63,300
workers). The surrounding Boroughs of Havant (12,400 workers), Fareham (6,900) and
Chapter Summary
– Portsmouth is a city located on the south coast of England
– Portsmouth is a highly urbanised area which is approximately 1 hr from the outskirts of
London by car and within 2hr by train to London Waterloo.
– Portsmouth is a key gateway to Continental Europe with established ferry routes to
France and Spain as well as more local ferries to Gosport and the Isle of Wight.
– The total population of Portsmouth in 2009 was 203,500 with a total of 101,000
employee jobs.
– The surrounding boroughs of Fareham, Gosport and Havant, along with Portsmouth,
form the SE Hampshire area, and commuting flows show this is something of a city
region.
– Portsmouth is part of the Partnership for Urban South Hampshire (PUSH) sub-region.
– The PUSH sub-region was formed following work into the functional economic areas
and housing market areas in the South East of England.
Page 9
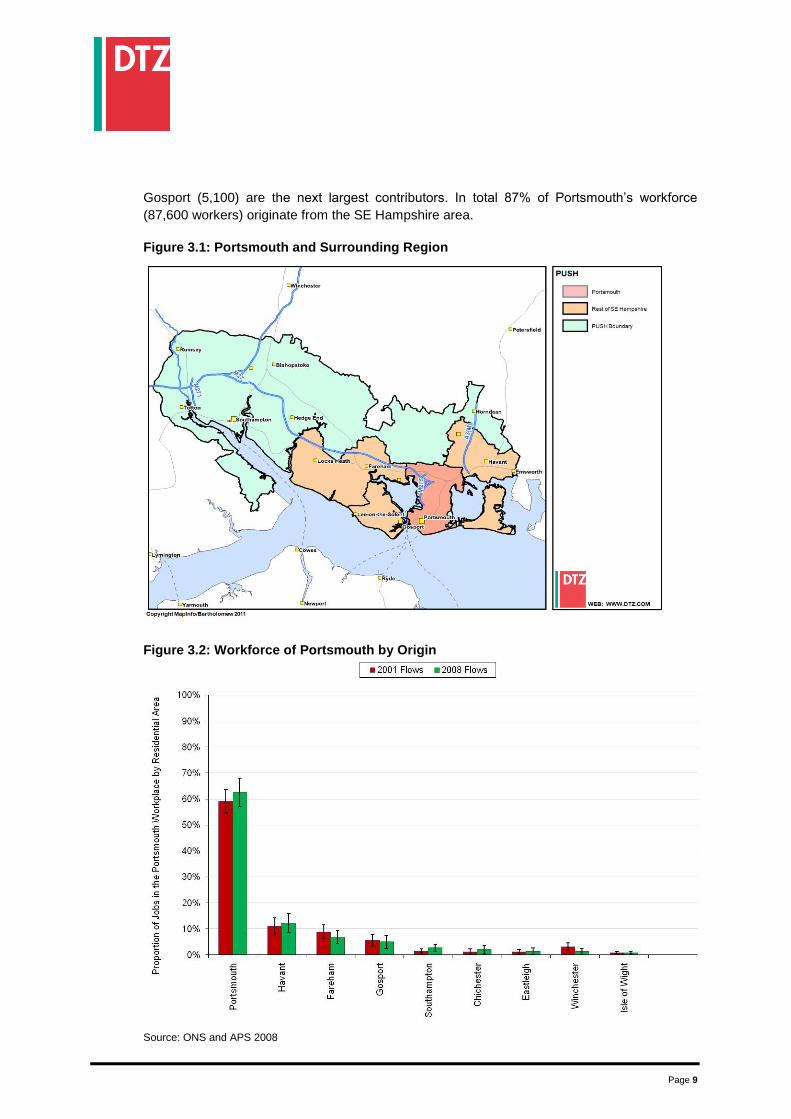
Gosport (5,100) are the next largest contributors. In total 87% of Portsmouth’s workforce
(87,600 workers) originate from the SE Hampshire area.
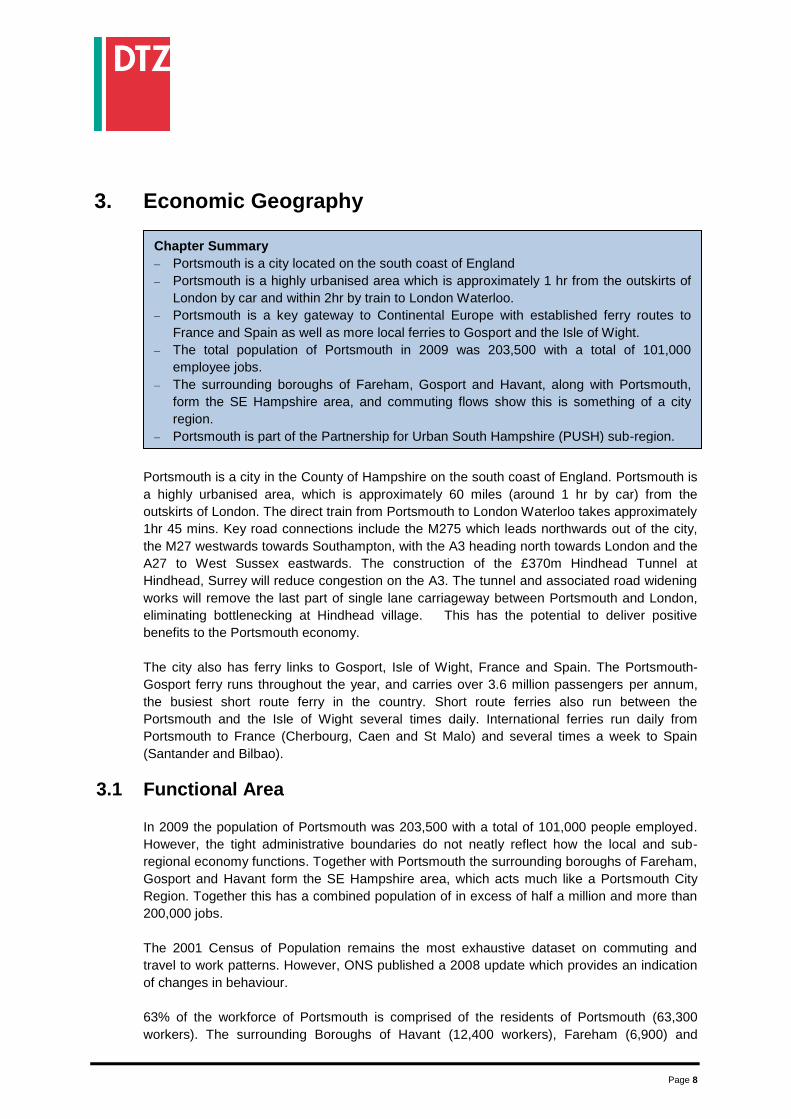
Figure 3.1: Portsmouth and Surrounding Region
Figure 3.2: Workforce of Portsmouth by Origin
Source: ONS and APS 2008
Page 10
The importance of Portsmouth in providing employment for the sub-region of SE Hampshire is
shown in Table 3.1. Portsmouth is home to around 40% of the population of the SE
Hampshire area but provides nearly 50% of its jobs. The second most significant employment
centre is Fareham, with a number of key employment locations along the M27 which have
proved very successful in recent years, including attracting key employers from Portsmouth
such as Zurich.
Table 3.1: SE Hampshire Region - 2009
Population Employment
% of SE
Hampshire
Population
% of SE
Hampshire
Employment
Portsmouth 203,500 101,000 40% 49%
Fareham 111,500 46,600 22% 25%
Gosport 80,000 19,400 16% 9%
Havant 116,600 38,100 23% 19%
Total 511,500 205,000 100% 100%
Source: BRES and Mid Year Population Estimates
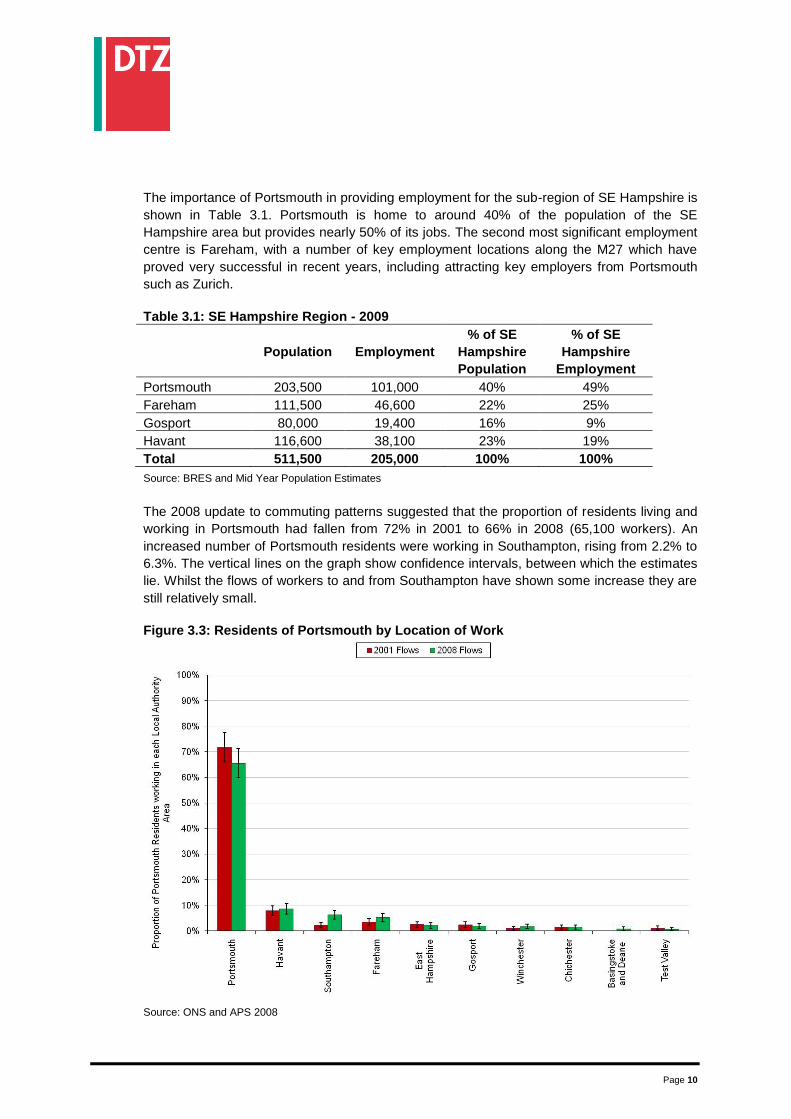
The 2008 update to commuting patterns suggested that the proportion of residents living and
working in Portsmouth had fallen from 72% in 2001 to 66% in 2008 (65,100 workers). An
increased number of Portsmouth residents were working in Southampton, rising from 2.2% to
6.3%. The vertical lines on the graph show confidence intervals, between which the estimates
lie. Whilst the flows of workers to and from Southampton have shown some increase they are
still relatively small.
Figure 3.3: Residents of Portsmouth by Location of Work
Source: ONS and APS 2008
Page 11
Portsmouth also plays a key role in the wider South Hampshire region. Following research
into the functional economic areas and housing market areas in the South East for the South
East of England Regional Assembly the Partnership for Urban South Hampshire (PUSH) was
formed. PUSH is a collective of upper and lower tier authorities, dedicated to ‘delivering
sustainable, economic led growth and regeneration to create a more prosperous, attractive
and sustainable South Hampshire’. The ten PUSH local authorities1, along with the Isle of
Wight have recently received Government approval to establish the Solent Local Enterprise
Partnership (LEP). There are a range of sub regional economic development evidence base
and strategy documents relating to PUSH and the LEP at www.push.gov.uk. In 2009 the
annual GVA generated by PUSH was estimated to be £17.8bn. The total population of PUSH
is in excess of 1 million, with a total of 440,000 employee jobs.
3.2 Self Containment
Set out below is a table comparing the level of self containment in Portsmouth with other
benchmark towns and cities. Whilst this gives some insight into the dynamics of the city the
reader should be mindful of the range of factors that can influence this data including the
‘tightness’ of the administrative boundaries for which data is collected, the proximity of other
significant employment centres and the quality of transport connectivity.
The share of Portsmouth residents who are working in Portsmouth (resident self containment)
is similar to Bournemouth, Brighton and Hove, and Southampton. The workplace self
containment in Portsmouth is broadly in the middle of the range of comparator cities, with
Southampton the most reliant on labour migrating into the city and Brighton and Hove the
least reliant. The data suggests nothing out of the ordinary for Portsmouth.
Table 3.2: Resident and Workplace Self Containment
Local / Unitary
Authority
Resident Self
Containment Workplace Self
Containment Portsmouth 66% 63%
Bournemouth 67% 68%
Brighton and Hove 72% 74%
Southampton 69% 57%
Source: A study of commuting patterns in GB based on the Annual Population Survey 2008, ONS
1 The local authorities which make up PUSH are the Unitary Authorities of Portsmouth and Southampton, the local
authorities of Eastleigh, Fareham, Gosport and Havant and parts of East Hampshire, New Forest, Test Valley and Winchester local authorities.
Page 12
4. Sectoral Employment Structure
This section provides an analysis of sectoral employment information for Portsmouth and
shows the areas in which Portsmouth has a relative employment strength.
4.1 Current Structure
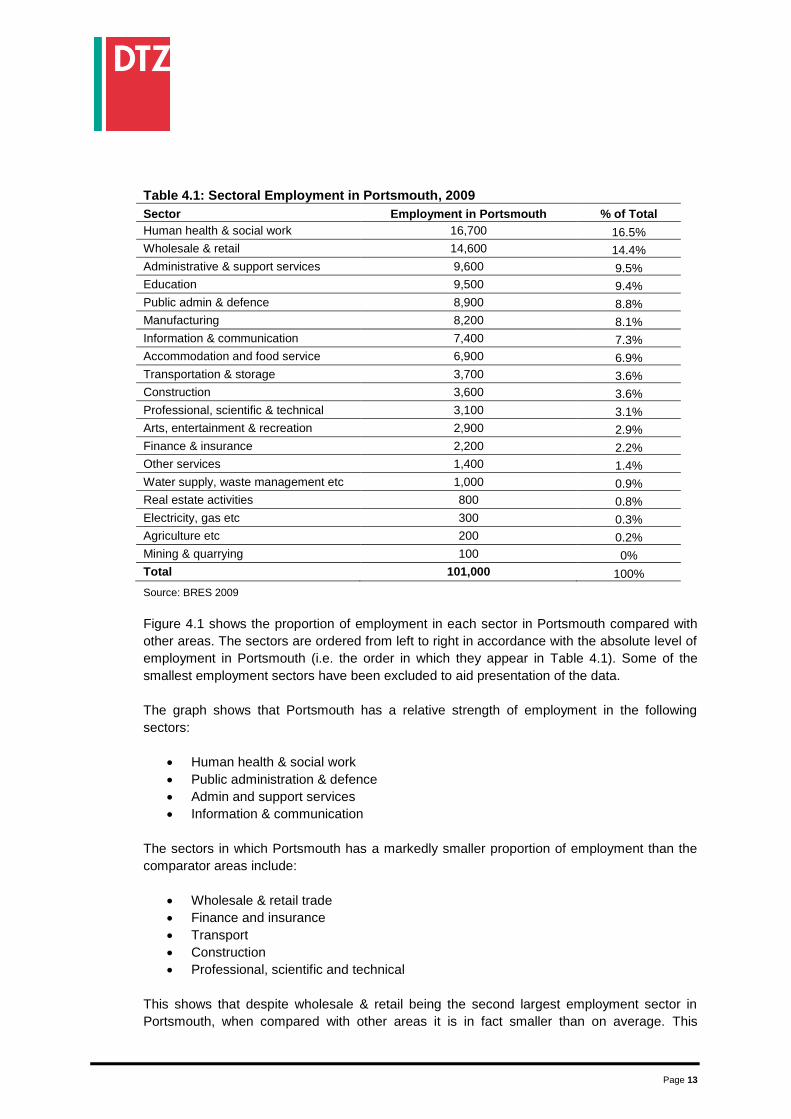
As of 2009 there were a total of 101,000 employee jobs in Portsmouth. Table 4.1 shows the
sectoral breakdown of employment in Portsmouth, ranked from highest to lowest. This shows
that the sectors which have the highest absolute level of employment are human health &
social work, wholesale & retail and administration & support services.
Chapter Summary
– When looking at broad sectors, the areas of strength, relative to the UK, are information
& communication, administration & support services, public administration & defence
and human health & social work.
– When compared to other south coast cities Portsmouth has employment strengths in
public administration & defence, manufacturing and information & communication.
– Further analysis at a more detailed level reveals that Portsmouth has a specialism in
certain elements of advanced manufacturing such as ship building and the manufacture
of air and space craft.
– Portsmouth also has a specialism relating to information technology and computer
service activities.
– Public administration and defence are two other sectors in which Portsmouth has
relative employment strength. Defence based employment is most likely to be related to
the naval dockyard.
– Recent employment growth has been most notable in real estate, renting & business
activities and hotels & restaurants.
– Estimates suggest that potential public and private sector job losses as a result of the
public spending reduction could be around 5,800 jobs.
Page 13
Table 4.1: Sectoral Employment in Portsmouth, 2009
Sector Employment in Portsmouth % of Total
Human health & social work 16,700 16.5%
Wholesale & retail 14,600 14.4%
Administrative & support services 9,600 9.5%
Education 9,500 9.4%
Public admin & defence 8,900 8.8%
Manufacturing 8,200 8.1%
Information & communication 7,400 7.3%
Accommodation and food service 6,900 6.9%
Transportation & storage 3,700 3.6%
Construction 3,600 3.6%
Professional, scientific & technical 3,100 3.1%
Arts, entertainment & recreation 2,900 2.9%
Finance & insurance 2,200 2.2%
Other services 1,400 1.4%
Water supply, waste management etc 1,000 0.9%
Real estate activities 800 0.8%
Electricity, gas etc 300 0.3%
Agriculture etc 200 0.2%
Mining & quarrying 100 0%
Total 101,000 100%
Source: BRES 2009
Figure 4.1 shows the proportion of employment in each sector in Portsmouth compared with
other areas. The sectors are ordered from left to right in accordance with the absolute level of
employment in Portsmouth (i.e. the order in which they appear in Table 4.1). Some of the
smallest employment sectors have been excluded to aid presentation of the data.
The graph shows that Portsmouth has a relative strength of employment in the following
sectors:
Human health & social work
Public administration & defence
Admin and support services
Information & communication
The sectors in which Portsmouth has a markedly smaller proportion of employment than the
comparator areas include:
Wholesale & retail trade
Finance and insurance
Transport
Construction
Professional, scientific and technical
This shows that despite wholesale & retail being the second largest employment sector in
Portsmouth, when compared with other areas it is in fact smaller than on average. This
Page 14
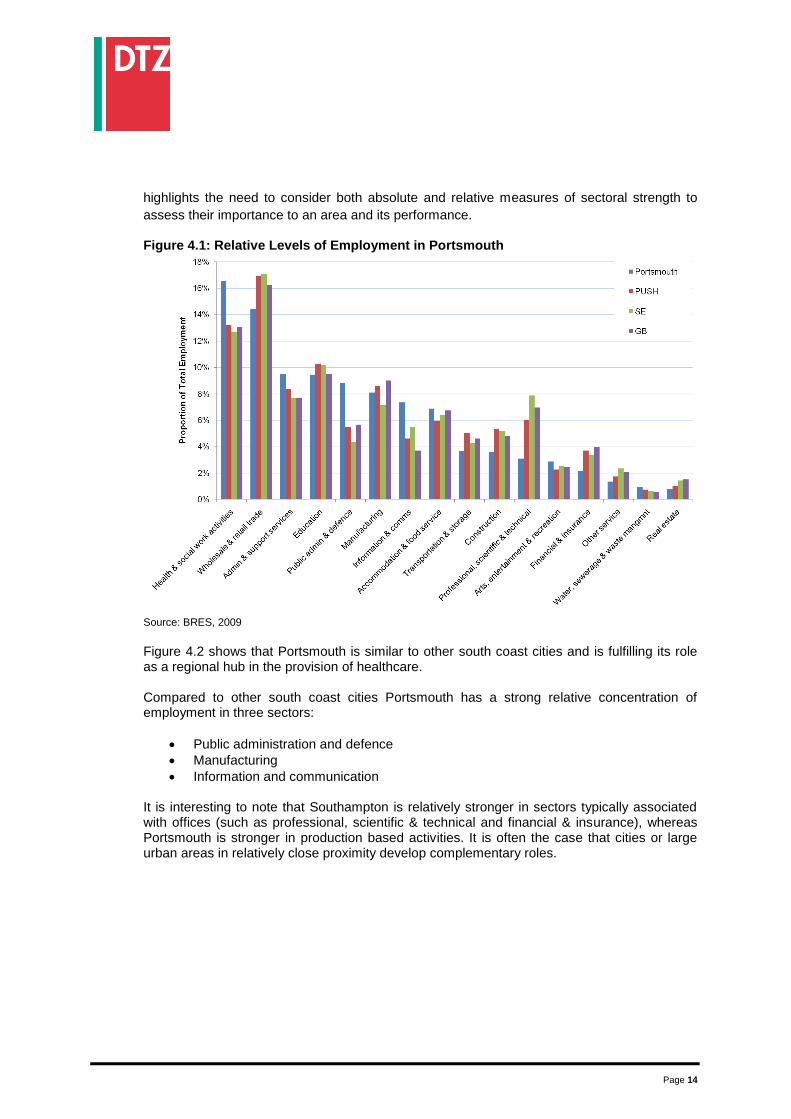
highlights the need to consider both absolute and relative measures of sectoral strength to
assess their importance to an area and its performance. Figure 4.1: Relative Levels of Employment in Portsmouth
Source: BRES, 2009
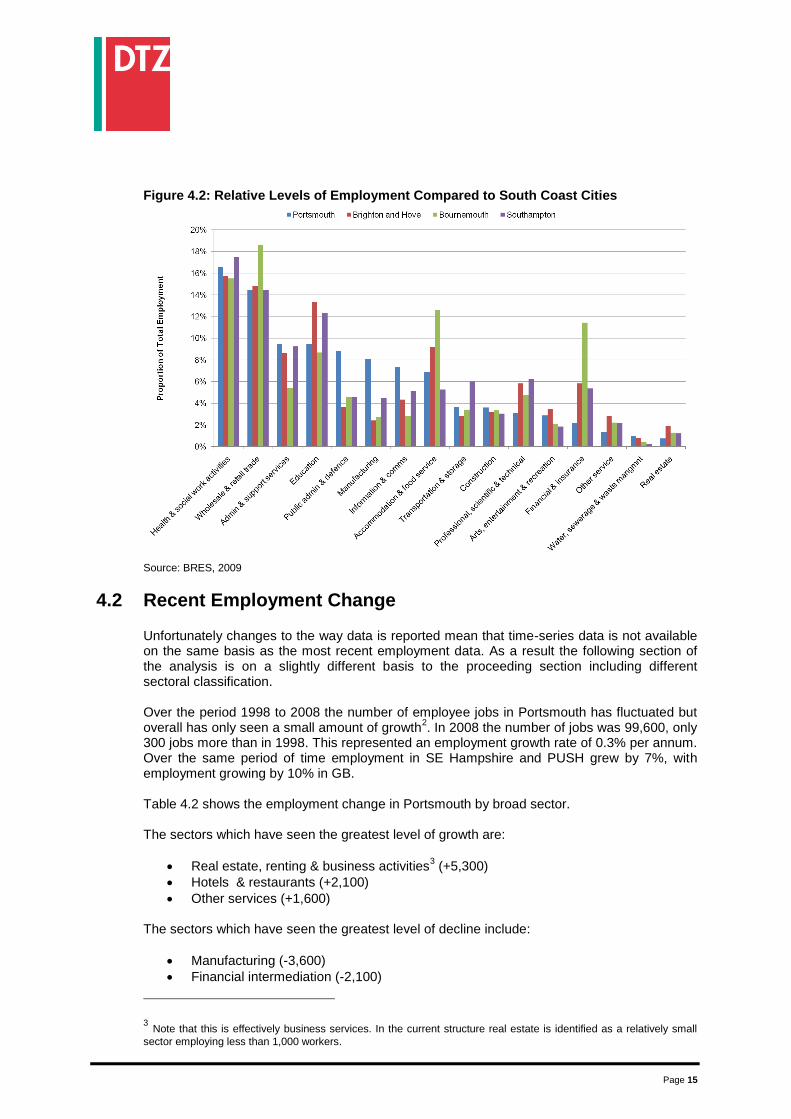
Figure 4.2 shows that Portsmouth is similar to other south coast cities and is fulfilling its role as a regional hub in the provision of healthcare. Compared to other south coast cities Portsmouth has a strong relative concentration of employment in three sectors:
Public administration and defence
Manufacturing
Information and communication It is interesting to note that Southampton is relatively stronger in sectors typically associated with offices (such as professional, scientific & technical and financial & insurance), whereas Portsmouth is stronger in production based activities. It is often the case that cities or large urban areas in relatively close proximity develop complementary roles.
Page 15
Figure 4.2: Relative Levels of Employment Compared to South Coast Cities
Source: BRES, 2009
4.2 Recent Employment Change
Unfortunately changes to the way data is reported mean that time-series data is not available on the same basis as the most recent employment data. As a result the following section of the analysis is on a slightly different basis to the proceeding section including different sectoral classification. Over the period 1998 to 2008 the number of employee jobs in Portsmouth has fluctuated but overall has only seen a small amount of growth
2. In 2008 the number of jobs was 99,600, only
300 jobs more than in 1998. This represented an employment growth rate of 0.3% per annum. Over the same period of time employment in SE Hampshire and PUSH grew by 7%, with employment growing by 10% in GB. Table 4.2 shows the employment change in Portsmouth by broad sector. The sectors which have seen the greatest level of growth are:
Real estate, renting & business activities3 (+5,300)
Hotels & restaurants (+2,100)
Other services (+1,600) The sectors which have seen the greatest level of decline include:
Manufacturing (-3,600)
Financial intermediation (-2,100)
3 Note that this is effectively business services. In the current structure real estate is identified as a relatively small
sector employing less than 1,000 workers.
Page 16
Wholesale & retail trade4 (-2,000)
Public administration & defence (-1,300)
Health & social work (-1,000) Table 4.2: Employment Change in Portsmouth
1998 2008 Change 1998 - 2008 % Change
Agriculture, fishing, mining
etc 0 300 300 962%
Manufacturing 13,700 10,100 -3,600 -26%
Electricity, gas, water 400 200 -300 -60%
Construction 2,700 3,400 700 28%
Wholesale & retail trade 17,400 15,400 -2,000 -12%
Hotels & restaurants 5,900 8,000 2,100 35%
Transport, storage &
comms 4,500 4,800 300 6%
Financial intermediation 4,500 2,400 -2,100 -48%
Real estate, renting &
business activities 10,800 16,100 5,300 49%
Public administration &
defence 11,000 9,700 -1,300 -12%
Education 8,500 9,000 500 6%
Health & social work 16,200 15,200 -1,000 -6%
Other services 3,500 5,100 1,600 45%
Total 99,300 99,600 300 0.3% Source: ABI
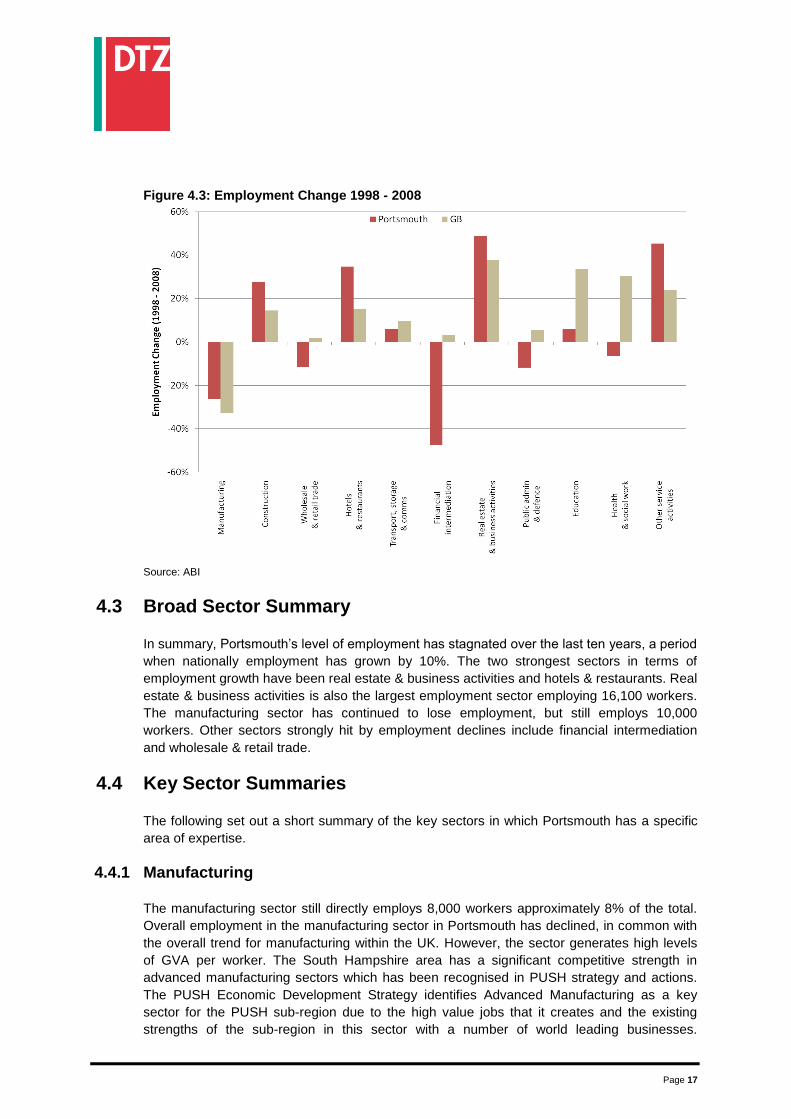
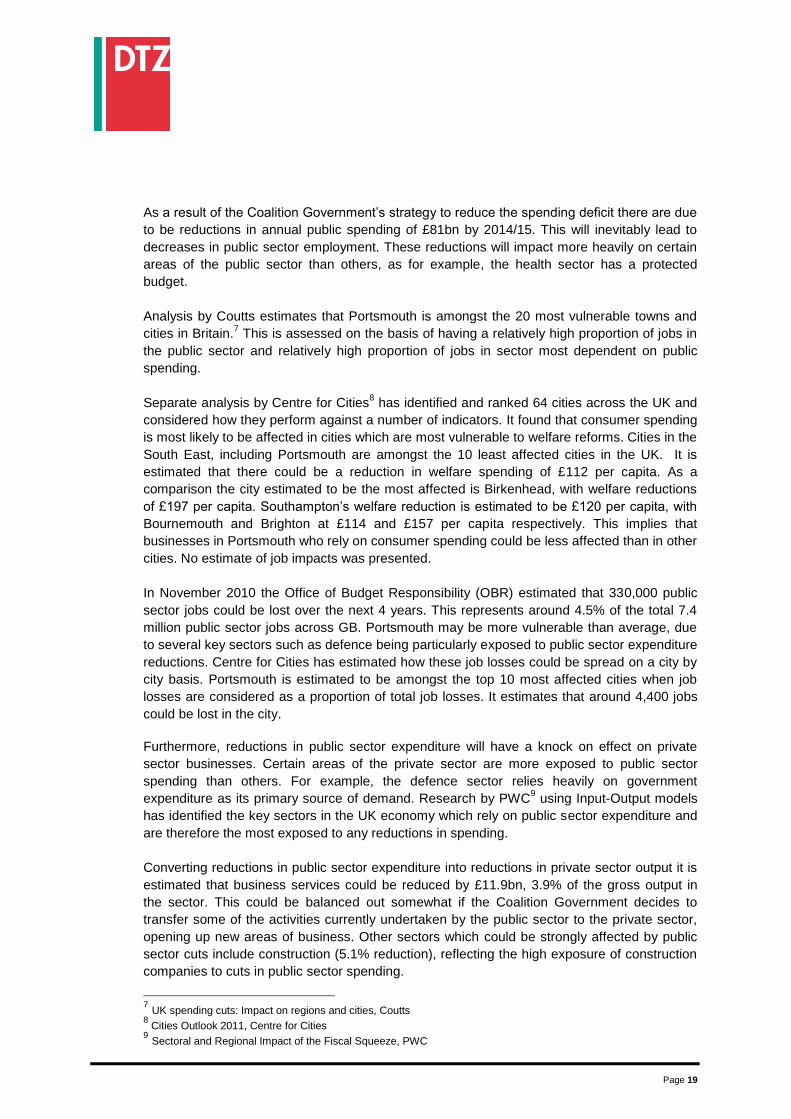
Figure 4.3 compares recent employment change in Portsmouth with recent employment change in GB. It shows that Portsmouth has seen a higher relative employment growth than GB in the following sectors:
Construction;
Hotels & restaurants;
Real estate & business services; and
Other service sectors Manufacturing employment decline in Portsmouth has been slightly lower than GB. The sectors in which Portsmouth has experienced poorer relative employment performance than GB include:
Wholesale & retail trade;
Financial intermediation;
Public administration & defence; and
Health & social work.
4 A change in the date of ABI surveying from December to September has caused the level of employment to drop in
certain sectors, most notably those with high levels of seasonal workforce. Wholesale and retail trade has recorded a decline in many area across the UK as a result.
Page 17
Figure 4.3: Employment Change 1998 - 2008
Source: ABI
4.3 Broad Sector Summary
In summary, Portsmouth’s level of employment has stagnated over the last ten years, a period
when nationally employment has grown by 10%. The two strongest sectors in terms of
employment growth have been real estate & business activities and hotels & restaurants. Real
estate & business activities is also the largest employment sector employing 16,100 workers.
The manufacturing sector has continued to lose employment, but still employs 10,000
workers. Other sectors strongly hit by employment declines include financial intermediation
and wholesale & retail trade.
4.4 Key Sector Summaries
The following set out a short summary of the key sectors in which Portsmouth has a specific
area of expertise.
4.4.1 Manufacturing
The manufacturing sector still directly employs 8,000 workers approximately 8% of the total.
Overall employment in the manufacturing sector in Portsmouth has declined, in common with
the overall trend for manufacturing within the UK. However, the sector generates high levels
of GVA per worker. The South Hampshire area has a significant competitive strength in
advanced manufacturing sectors which has been recognised in PUSH strategy and actions.
The PUSH Economic Development Strategy identifies Advanced Manufacturing as a key
sector for the PUSH sub-region due to the high value jobs that it creates and the existing
strengths of the sub-region in this sector with a number of world leading businesses.
Page 18
Portsmouth is a key area for employment in the advanced manufacturing sector. The most
important sub-sectors for Portsmouth are the building of ships and floating structures and the
manufacture of air and spacecraft. Building of ships accounts for 1.3% of total employment in
Portsmouth (1,400 workers), compared with just 0.1% across GB as a whole. Raymarine,
Rolls-Royce Marine electrical and BAE Systems are examples of leading businesses in this
sector which are based in Portsmouth.
Manufacture of aircraft and spacecraft in Portsmouth is also a much larger employer when
compared to the GB average, accounting for 1.4% of total local employment (1,400 workers),
compared with 0.3% of total employment nationally. Key companies based in Portsmouth
who work in this sector include EADS Astrium and H+S Aviation who employ around 300
workers, providing aftermarket services and systems activities. The Maintenance, Repair and
Overhaul (MRO) of aircraft and spacecraft is seen by UK Trade and Investment as a potential
area of growth for the UK.5
The marine and defence markets are the primary drivers of these areas of expertise.
4.4.2 Business Services
The business services sector6 employs around 23,000 workers, representing about 23% of
the total workforce. The business services sector is forecasted to be one of the major growth
areas for the PUSH economy over the next 15-20 years.
Portsmouth is generally relatively under-represented in the business service sector. However,
it has an above average concentration of employment in the information and communication
sector. In particular Portsmouth’s strongest sub-sector is ‘other information technology and
computer service’. This sub-sector includes activities such as computer disaster recovery,
installation of personal computers and software installation services. 5.1% of employment in
Portsmouth is in this sector (5,100 workers) in comparison with 0.4% of employment in GB.
This is likely to be, in part, the presence of IBM within the city, who employ around 2,000
workers, but also includes other employers suggesting a general strength in this field.
Within the office administration sector Portsmouth has a high level of employment in call
centres (2.7% of the total) when compared to the average for GB (0.3% of the total). These
are two areas of business services in which Portsmouth has an advantage over other PUSH
locations, including Southampton, which has a much stronger business services sector than
Portsmouth.
4.4.3 Public Sector
The public sector is important to the economy of Portsmouth as it provides not only a
significant proportion of employment directly but it also supports activity in the private sector.
Total direct public sector employment is around 35,000 workers (public administration and
defence is approximately 9,000, education is around 9,500 and human health and social work
is around 16,700). The following is a discussion of the importance of the public sector and a
headline assessment of Portsmouth’s exposure to the reduction in public sector spending.
5 UK Trade and Investment Website: UK Aerospace Capability
6 The business services sector is generally thought to consist of the following sectors; admin & support services,
information & communication, professional scientific & technical, financial & insurance and real estate.
Page 19
As a result of the Coalition Government’s strategy to reduce the spending deficit there are due
to be reductions in annual public spending of £81bn by 2014/15. This will inevitably lead to
decreases in public sector employment. These reductions will impact more heavily on certain
areas of the public sector than others, as for example, the health sector has a protected
budget.
Analysis by Coutts estimates that Portsmouth is amongst the 20 most vulnerable towns and
cities in Britain.7 This is assessed on the basis of having a relatively high proportion of jobs in
the public sector and relatively high proportion of jobs in sector most dependent on public
spending.
Separate analysis by Centre for Cities8 has identified and ranked 64 cities across the UK and
considered how they perform against a number of indicators. It found that consumer spending
is most likely to be affected in cities which are most vulnerable to welfare reforms. Cities in the
South East, including Portsmouth are amongst the 10 least affected cities in the UK. It is
estimated that there could be a reduction in welfare spending of £112 per capita. As a
comparison the city estimated to be the most affected is Birkenhead, with welfare reductions
of £197 per capita. Southampton’s welfare reduction is estimated to be £120 per capita, with
Bournemouth and Brighton at £114 and £157 per capita respectively. This implies that
businesses in Portsmouth who rely on consumer spending could be less affected than in other
cities. No estimate of job impacts was presented.
In November 2010 the Office of Budget Responsibility (OBR) estimated that 330,000 public
sector jobs could be lost over the next 4 years. This represents around 4.5% of the total 7.4
million public sector jobs across GB. Portsmouth may be more vulnerable than average, due
to several key sectors such as defence being particularly exposed to public sector expenditure
reductions. Centre for Cities has estimated how these job losses could be spread on a city by
city basis. Portsmouth is estimated to be amongst the top 10 most affected cities when job
losses are considered as a proportion of total job losses. It estimates that around 4,400 jobs
could be lost in the city.
Furthermore, reductions in public sector expenditure will have a knock on effect on private
sector businesses. Certain areas of the private sector are more exposed to public sector
spending than others. For example, the defence sector relies heavily on government
expenditure as its primary source of demand. Research by PWC9 using Input-Output models
has identified the key sectors in the UK economy which rely on public sector expenditure and
are therefore the most exposed to any reductions in spending.
Converting reductions in public sector expenditure into reductions in private sector output it is
estimated that business services could be reduced by £11.9bn, 3.9% of the gross output in
the sector. This could be balanced out somewhat if the Coalition Government decides to
transfer some of the activities currently undertaken by the public sector to the private sector,
opening up new areas of business. Other sectors which could be strongly affected by public
sector cuts include construction (5.1% reduction), reflecting the high exposure of construction
companies to cuts in public sector spending.
7 UK spending cuts: Impact on regions and cities, Coutts
8 Cities Outlook 2011, Centre for Cities
9 Sectoral and Regional Impact of the Fiscal Squeeze, PWC
Page 20
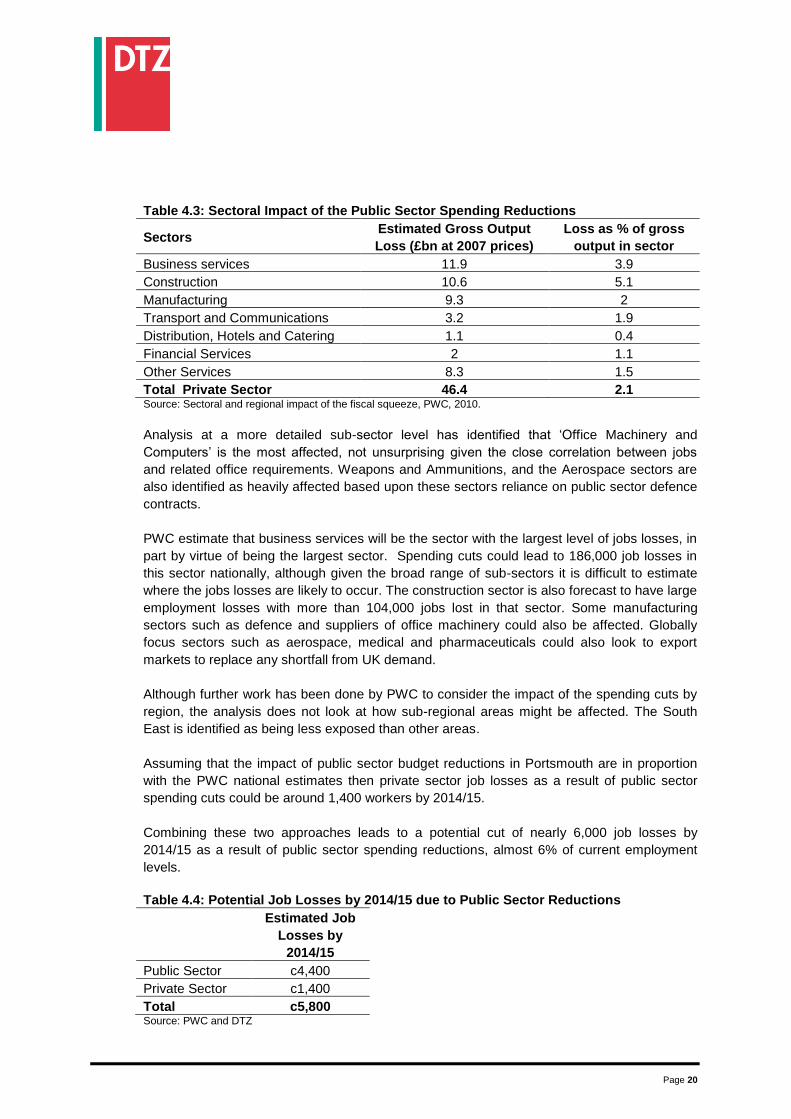
Table 4.3: Sectoral Impact of the Public Sector Spending Reductions
Sectors Estimated Gross Output
Loss (£bn at 2007 prices)
Loss as % of gross
output in sector
Business services 11.9 3.9
Construction 10.6 5.1
Manufacturing 9.3 2
Transport and Communications 3.2 1.9
Distribution, Hotels and Catering 1.1 0.4
Financial Services 2 1.1
Other Services 8.3 1.5
Total Private Sector 46.4 2.1 Source: Sectoral and regional impact of the fiscal squeeze, PWC, 2010.
Analysis at a more detailed sub-sector level has identified that ‘Office Machinery and
Computers’ is the most affected, not unsurprising given the close correlation between jobs
and related office requirements. Weapons and Ammunitions, and the Aerospace sectors are
also identified as heavily affected based upon these sectors reliance on public sector defence
contracts.
PWC estimate that business services will be the sector with the largest level of jobs losses, in
part by virtue of being the largest sector. Spending cuts could lead to 186,000 job losses in
this sector nationally, although given the broad range of sub-sectors it is difficult to estimate
where the jobs losses are likely to occur. The construction sector is also forecast to have large
employment losses with more than 104,000 jobs lost in that sector. Some manufacturing
sectors such as defence and suppliers of office machinery could also be affected. Globally
focus sectors such as aerospace, medical and pharmaceuticals could also look to export
markets to replace any shortfall from UK demand.
Although further work has been done by PWC to consider the impact of the spending cuts by
region, the analysis does not look at how sub-regional areas might be affected. The South
East is identified as being less exposed than other areas.
Assuming that the impact of public sector budget reductions in Portsmouth are in proportion
with the PWC national estimates then private sector job losses as a result of public sector
spending cuts could be around 1,400 workers by 2014/15.
Combining these two approaches leads to a potential cut of nearly 6,000 job losses by
2014/15 as a result of public sector spending reductions, almost 6% of current employment
levels.
Table 4.4: Potential Job Losses by 2014/15 due to Public Sector Reductions
Estimated Job
Losses by
2014/15
Public Sector c4,400
Private Sector c1,400
Total c5,800 Source: PWC and DTZ
Page 21
5. Enterprise and Business Base
This section sets out evidence on the enterprise and business base in Portsmouth.
5.1 Business Stock
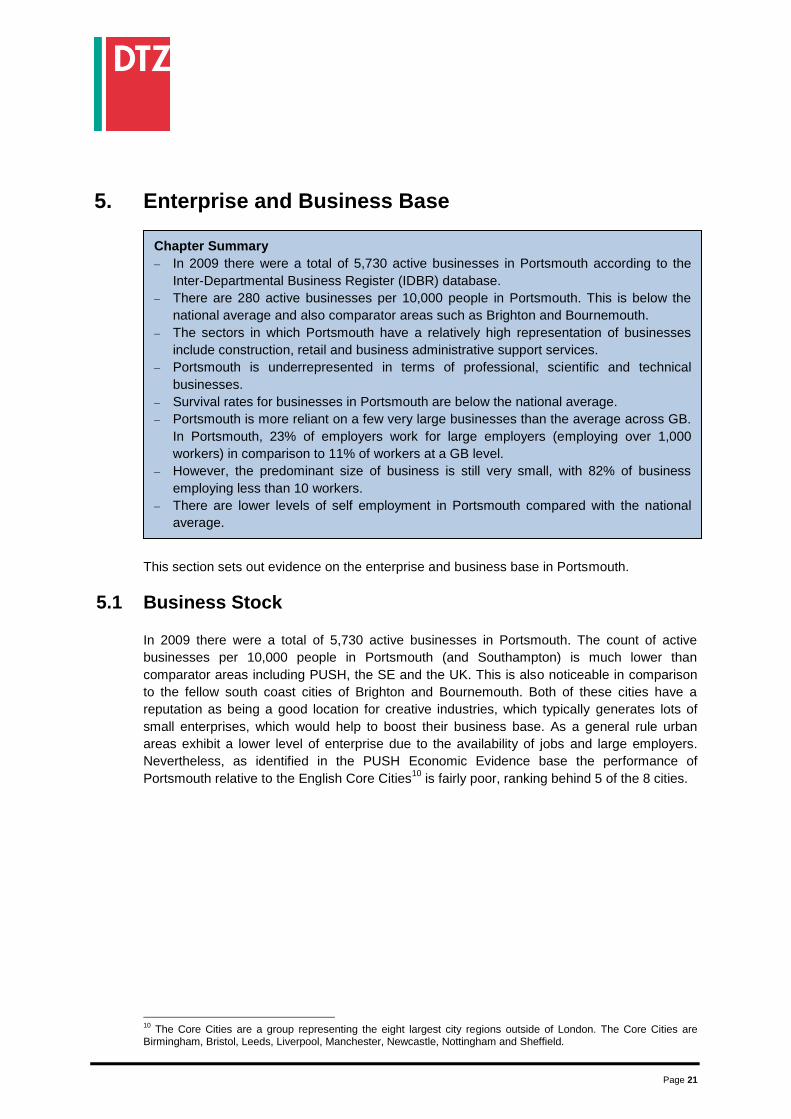
In 2009 there were a total of 5,730 active businesses in Portsmouth. The count of active
businesses per 10,000 people in Portsmouth (and Southampton) is much lower than
comparator areas including PUSH, the SE and the UK. This is also noticeable in comparison
to the fellow south coast cities of Brighton and Bournemouth. Both of these cities have a
reputation as being a good location for creative industries, which typically generates lots of
small enterprises, which would help to boost their business base. As a general rule urban
areas exhibit a lower level of enterprise due to the availability of jobs and large employers.
Nevertheless, as identified in the PUSH Economic Evidence base the performance of
Portsmouth relative to the English Core Cities10
is fairly poor, ranking behind 5 of the 8 cities.
10
The Core Cities are a group representing the eight largest city regions outside of London. The Core Cities are Birmingham, Bristol, Leeds, Liverpool, Manchester, Newcastle, Nottingham and Sheffield.
Chapter Summary
– In 2009 there were a total of 5,730 active businesses in Portsmouth according to the
Inter-Departmental Business Register (IDBR) database.
– There are 280 active businesses per 10,000 people in Portsmouth. This is below the
national average and also comparator areas such as Brighton and Bournemouth.
– The sectors in which Portsmouth have a relatively high representation of businesses
include construction, retail and business administrative support services.
– Portsmouth is underrepresented in terms of professional, scientific and technical
businesses.
– Survival rates for businesses in Portsmouth are below the national average.
– Portsmouth is more reliant on a few very large businesses than the average across GB.
In Portsmouth, 23% of employers work for large employers (employing over 1,000
workers) in comparison to 11% of workers at a GB level.
– However, the predominant size of business is still very small, with 82% of business
employing less than 10 workers.
– There are lower levels of self employment in Portsmouth compared with the national
average.
Page 22
Figure 5.1: Number of Active Businesses per 10,000 People
Source: APS
5.2 Sectoral Strengths
Interrogating the Inter-Departmental Business Registry (IDBR) dataset in more detail we can
see the sectors in which Portsmouth has the greatest number of businesses relative to the UK
and the sectors where they are underrepresented. According to data from 2009, Portsmouth
is well represented, in terms of the number of businesses in the following sectors:
Construction
Retail
Accommodation & Food Services
Business Administration & Support Services
Depending upon the size of businesses in each of these sectors it is possible that Portsmouth
can have relative large number of businesses but relatively low levels of employment.
Conversely sectors with low numbers of businesses can still employ large number of workers
if the average business size is high. This can explain some of the differences between well
represented business sectors, as shown above, and well represented employment sectors as
discussed in chapter 4. The key sector in which Portsmouth’s business population is
underrepresented is professional, scientific and technical activities.
Page 23
5.3 Business Formation and Survival
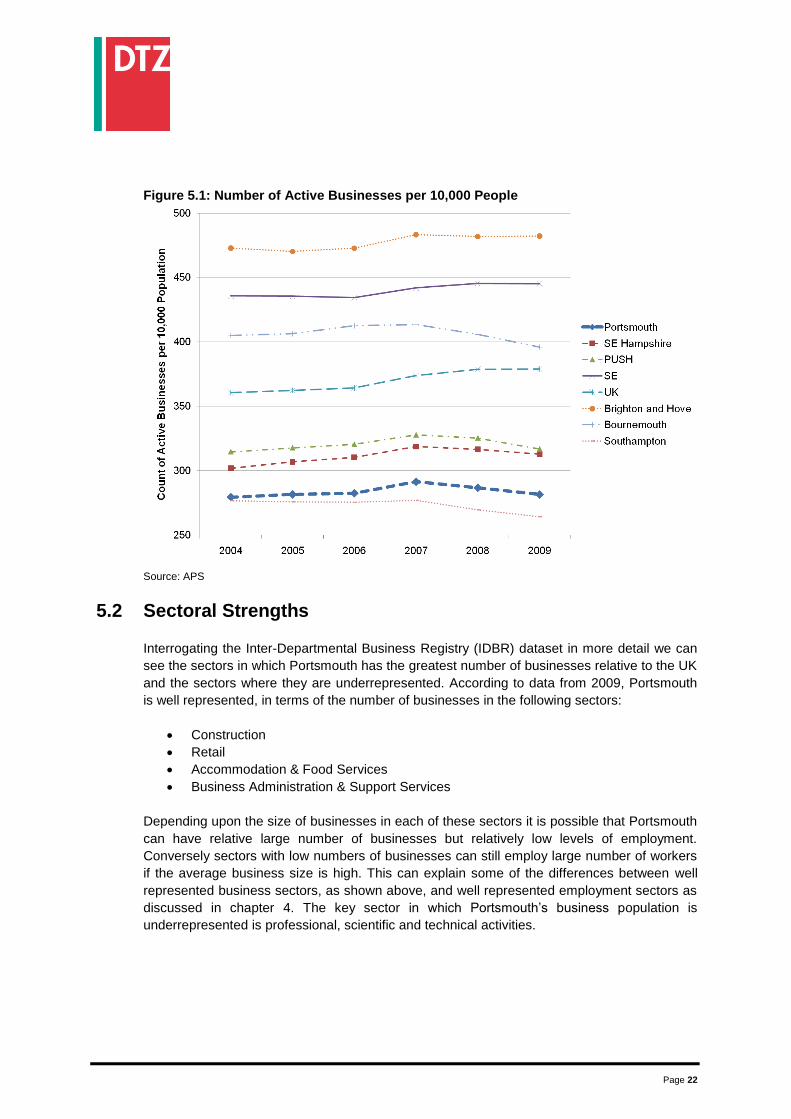
Over the last 5 years Portsmouth has consistently seen higher levels of business starts ups
than business deaths, until 2009 when impact of the recession was noticed.11
Birth and Death
rates in PUSH have been very similar to Portsmouth, when considered in per capita terms.
The UK has seen higher birth and death rates per capita in each year than Portsmouth. Figure 5.2: Portsmouth Business Birth and Death Rates
Source: APS
Analysis of survival rates for newly created businesses in Portsmouth shows that they are less
likely to survive during the first five years of business operation, when compared to the
national average. 42% of businesses created in Portsmouth during 2004 were still in operation
five years later, in comparison to 46% of businesses in South East Hampshire and 47% at a
PUSH and UK level. The failure rate of this Portsmouth business cohort is higher than the
national average in each of the five annual comparison points. However, more recent survival
rates for businesses created in 2007 and 2008 suggest that the Portsmouth business
population has higher survival rates than the UK average. This might point to a more positive
survival performance emerging.
11
Note that despite this the overall level of active businesses has remained fairly constant. This is because the
difference in the business birth and death rate does not necessarily equal the change in the number of active enterprises as it did with the VAT statistics database. This is because the count of active businesses measures businesses that were active at some point during the year. Further information is available in the ONS Paper – Introducing the new Business Demography Statistics
Page 24
5.4 Business Size
Analysing the size profile of business in Portsmouth it is clear that more employees in
Portsmouth work for large businesses than in comparator areas. In Portsmouth, businesses
employing more than 1,000 workers are responsible for employing 23% of the workforce. The
average across GB is 11%. This implies that Portsmouth relies on a relatively small number of
large businesses to employ approximately a quarter of its workforce. This means the
Portsmouth economy is particularly sensitive to should any of these companies decide to
relocate.
The presence of large businesses in Portsmouth could be one reason why the number of
businesses per head is lower than in comparator areas such as Brighton and Hove and
Bournemouth. The availability of employment opportunity is likely to reduce the necessity to
start a business which can be the case in more rural areas. The sectoral strengths of
Portsmouth also tend towards larger businesses.
Table 5.1 shows the spread of businesses by size and employment within them. The
preponderance of small businesses employing between 1-10 employees is fairly typically. In
fact, nationally 85% of businesses employment between 1-10 people.
Table 5.1: Business size
Number of Employees
1-10 11-49 50-199 200-999 1000+
% of businesses 82.3% 13.2% 3.6% 0.7% 0.2%
% of
employment 16.2% 20.7% 22.5% 17.8% 22.8%
Source: ABI Workplace Inquiry
5.5 Self Employment
In 2009 self employment rates in Portsmouth were 7.1% below the UK average of 9%. This is
typical of the longer term self employment rate. Brighton and Hove and Bournemouth both
have higher self employment rates than the national average, a fact that is consistent with the
higher number of business per person observed earlier in this chapter.
Page 25
6. Population and Demographics
Current Population
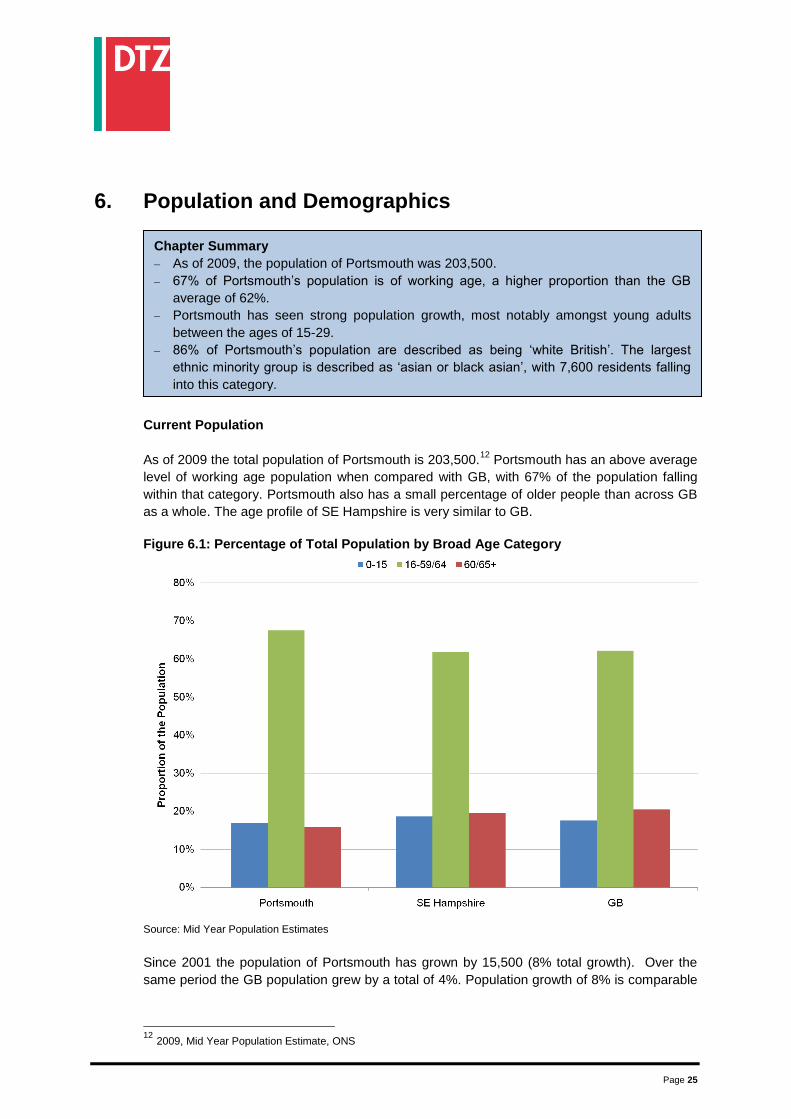
As of 2009 the total population of Portsmouth is 203,500.12
Portsmouth has an above average
level of working age population when compared with GB, with 67% of the population falling
within that category. Portsmouth also has a small percentage of older people than across GB
as a whole. The age profile of SE Hampshire is very similar to GB.
Figure 6.1: Percentage of Total Population by Broad Age Category
Source: Mid Year Population Estimates
Since 2001 the population of Portsmouth has grown by 15,500 (8% total growth). Over the
same period the GB population grew by a total of 4%. Population growth of 8% is comparable
12
2009, Mid Year Population Estimate, ONS
Chapter Summary
– As of 2009, the population of Portsmouth was 203,500.
– 67% of Portsmouth’s population is of working age, a higher proportion than the GB
average of 62%.
– Portsmouth has seen strong population growth, most notably amongst young adults
between the ages of 15-29.
– 86% of Portsmouth’s population are described as being ‘white British’. The largest
ethnic minority group is described as ‘asian or black asian’, with 7,600 residents falling
into this category.
Page 26
to Southampton but significantly greater than other comparator cities of Brighton and Hove
and Bournemouth.
Table 6.1: Population Growth 2001 - 2009
Population Change (%)
Portsmouth 8%
SE Hampshire 4%
PUSH 5%
SE 5%
GB 4%
Bournemouth 1%
Brighton and Hove 3%
Southampton 8%
Source: Mid Year Population Estimates
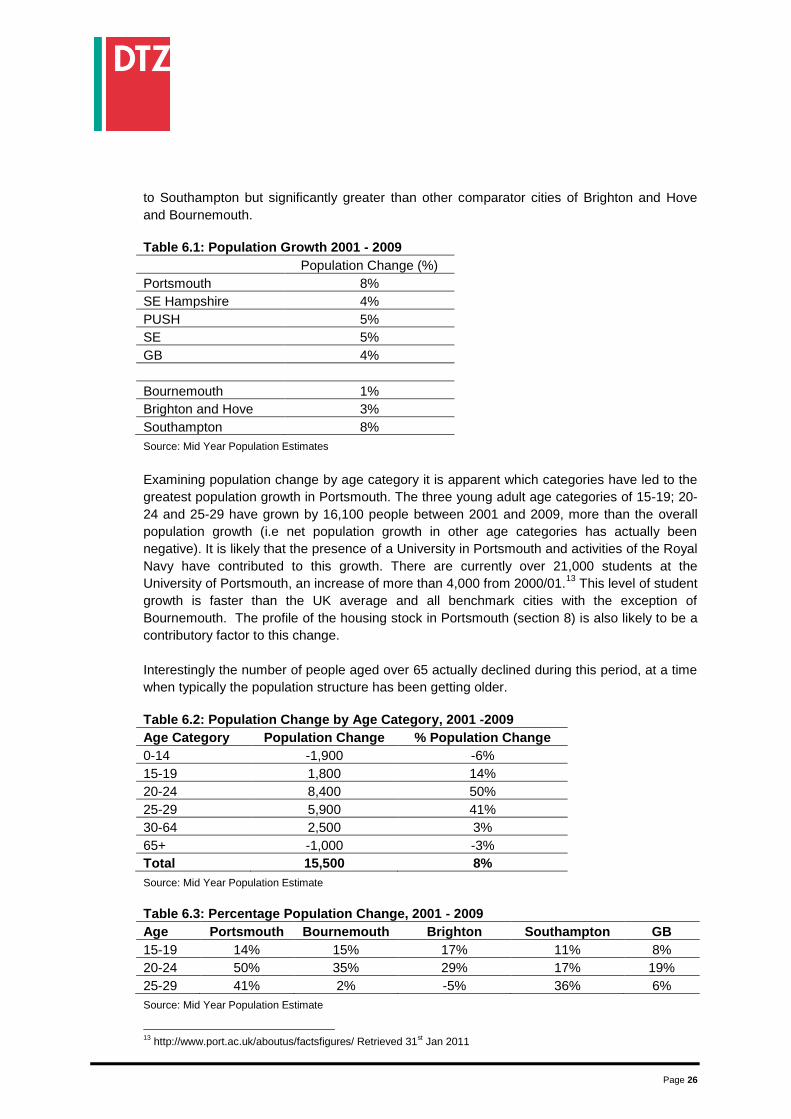
Examining population change by age category it is apparent which categories have led to the
greatest population growth in Portsmouth. The three young adult age categories of 15-19; 20-
24 and 25-29 have grown by 16,100 people between 2001 and 2009, more than the overall
population growth (i.e net population growth in other age categories has actually been
negative). It is likely that the presence of a University in Portsmouth and activities of the Royal
Navy have contributed to this growth. There are currently over 21,000 students at the
University of Portsmouth, an increase of more than 4,000 from 2000/01.13
This level of student
growth is faster than the UK average and all benchmark cities with the exception of
Bournemouth. The profile of the housing stock in Portsmouth (section 8) is also likely to be a
contributory factor to this change.
Interestingly the number of people aged over 65 actually declined during this period, at a time
when typically the population structure has been getting older.
Table 6.2: Population Change by Age Category, 2001 -2009
Age Category Population Change % Population Change
0-14 -1,900 -6%
15-19 1,800 14%
20-24 8,400 50%
25-29 5,900 41%
30-64 2,500 3%
65+ -1,000 -3%
Total 15,500 8%
Source: Mid Year Population Estimate
Table 6.3: Percentage Population Change, 2001 - 2009
Age Portsmouth Bournemouth Brighton Southampton GB
15-19 14% 15% 17% 11% 8%
20-24 50% 35% 29% 17% 19%
25-29 41% 2% -5% 36% 6%
Source: Mid Year Population Estimate
13
http://www.port.ac.uk/aboutus/factsfigures/ Retrieved 31st Jan 2011
Page 27
If this is a long term trend and these younger people continue to live and work in Portsmouth
then it could supply a good source of workers to fill jobs in the future. This is not to say that
Portsmouth’s population is not expected to age, as with the national population, but perhaps
the shift towards the older population is not as significant as for England as a whole. Sub
national population projections (SNPP) suggest that the population of Portsmouth is projected
to grow by 19% between 2008 and 2026. The population of England is projected to grow by
about 13% over this period. However, over 50% of the population growth in England is
projected to be within the 65 and over age category, compared with approximately 20% of
population growth in Portsmouth. This suggests that the projected growth of older people in
Portsmouth is lower than across England as a whole.
At a time when other areas are worrying about a significant shift towards an older population
this could be important to the economic viability and balance of Portsmouth.
Ethnicity
According to 2007 estimates over 86% of Portsmouth’s population are recorded as being
‘white British’.14
The Equality and Diversity Strategy for Portsmouth identifies a number of key
Black and Minority Ethnic (BME) communities in Portsmouth. They are:
Bangladeshi
African
Chinese
Caribbean
Kurdish
Polish
Irish
Russian
Indian
Filipino
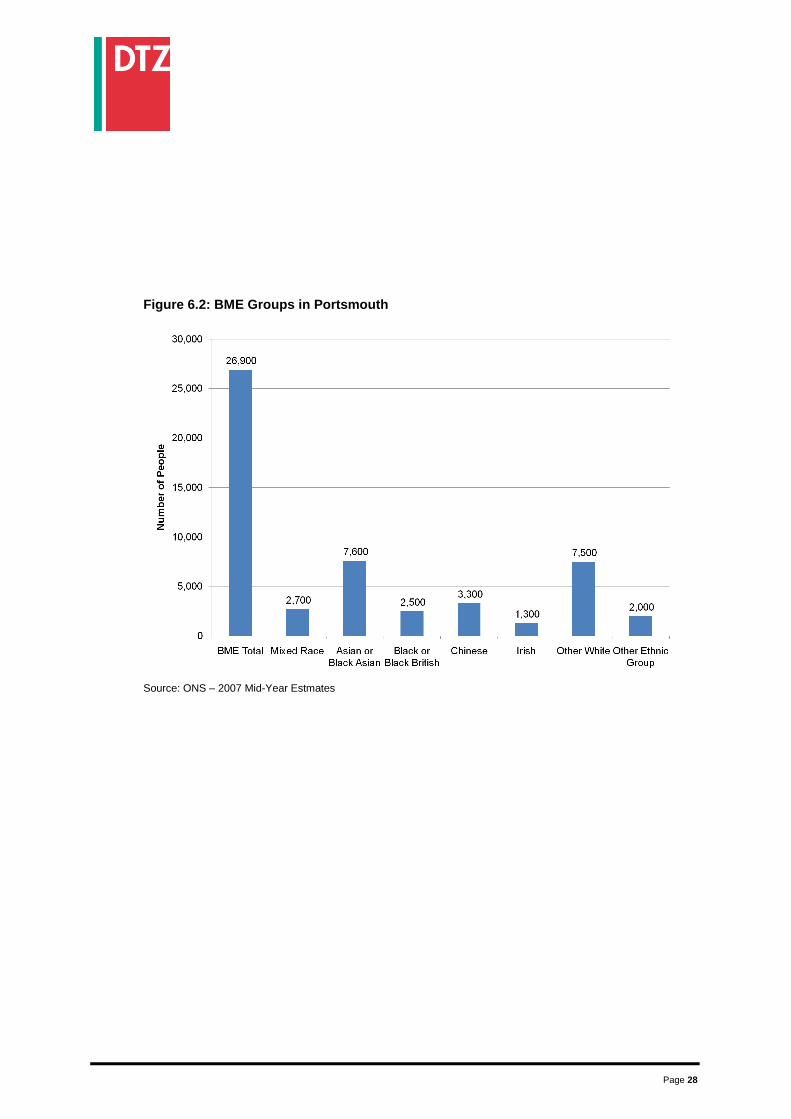
Figure 6.2 shows the population of the major BME groups in Portsmouth. The largest BME
group is Asian or Black Asian, with a total of 7,600 residents falling into this category. This
represents around 3.8% of the total Portsmouth population (in 2007 the population was
estimated to be 197,700).
The highest concentrations of BME communities are in the south and west of Portsmouth,
with significant communities in Charles Dickens, Cosham, Fratton, Nelson and St Thomas
wards. Broadly these areas correlate to the greatest areas of deprivation, as discussed in
Chapter 8.
14
Source: ONS – 2007 Mid Year Estimates
Page 28
Figure 6.2: BME Groups in Portsmouth
Source: ONS – 2007 Mid-Year Estmates
Page 29
7. Labour Market and Skills
7.1 Labour Market Participation
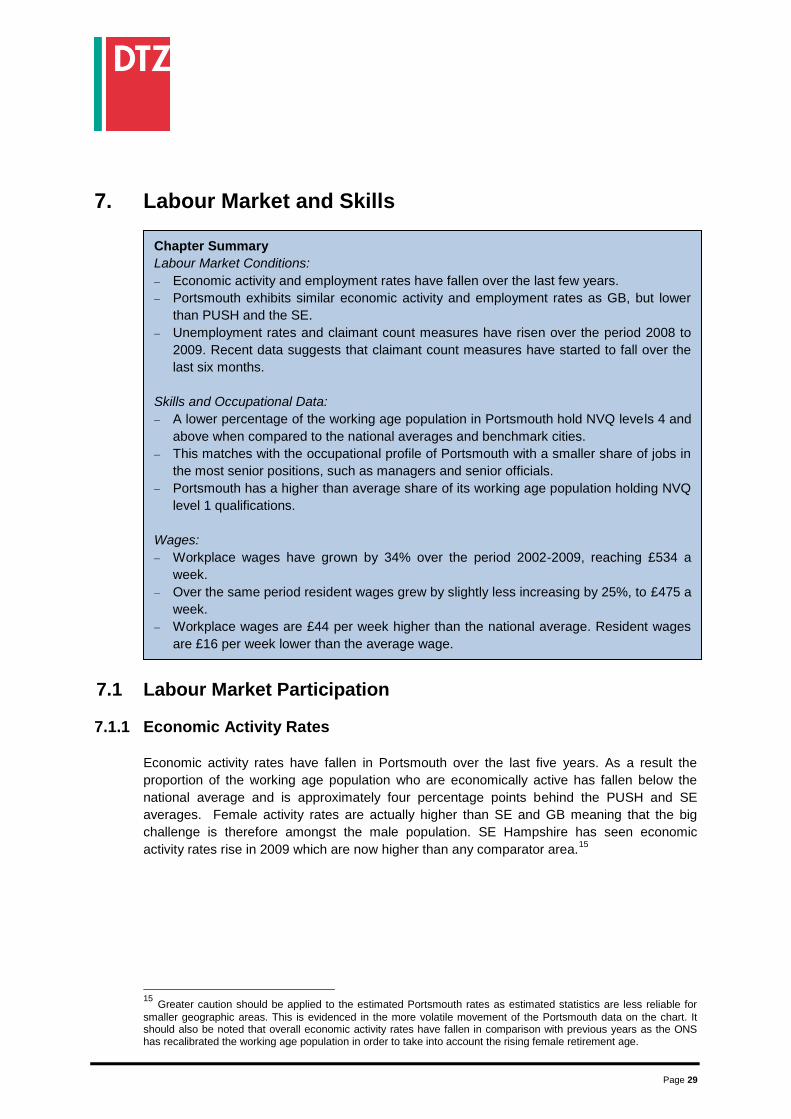
7.1.1 Economic Activity Rates
Economic activity rates have fallen in Portsmouth over the last five years. As a result the
proportion of the working age population who are economically active has fallen below the
national average and is approximately four percentage points behind the PUSH and SE
averages. Female activity rates are actually higher than SE and GB meaning that the big
challenge is therefore amongst the male population. SE Hampshire has seen economic
activity rates rise in 2009 which are now higher than any comparator area.15
15
Greater caution should be applied to the estimated Portsmouth rates as estimated statistics are less reliable for
smaller geographic areas. This is evidenced in the more volatile movement of the Portsmouth data on the chart. It should also be noted that overall economic activity rates have fallen in comparison with previous years as the ONS has recalibrated the working age population in order to take into account the rising female retirement age.
Chapter Summary
Labour Market Conditions:
– Economic activity and employment rates have fallen over the last few years.
– Portsmouth exhibits similar economic activity and employment rates as GB, but lower
than PUSH and the SE.
– Unemployment rates and claimant count measures have risen over the period 2008 to
2009. Recent data suggests that claimant count measures have started to fall over the
last six months.
Skills and Occupational Data:
– A lower percentage of the working age population in Portsmouth hold NVQ levels 4 and
above when compared to the national averages and benchmark cities.
– This matches with the occupational profile of Portsmouth with a smaller share of jobs in
the most senior positions, such as managers and senior officials.
– Portsmouth has a higher than average share of its working age population holding NVQ
level 1 qualifications.
Wages:
– Workplace wages have grown by 34% over the period 2002-2009, reaching £534 a
week.
– Over the same period resident wages grew by slightly less increasing by 25%, to £475 a
week.
– Workplace wages are £44 per week higher than the national average. Resident wages
are £16 per week lower than the average wage.
Page 30
Figure 7.1: Economic Activity Rates
Source: APS 2009
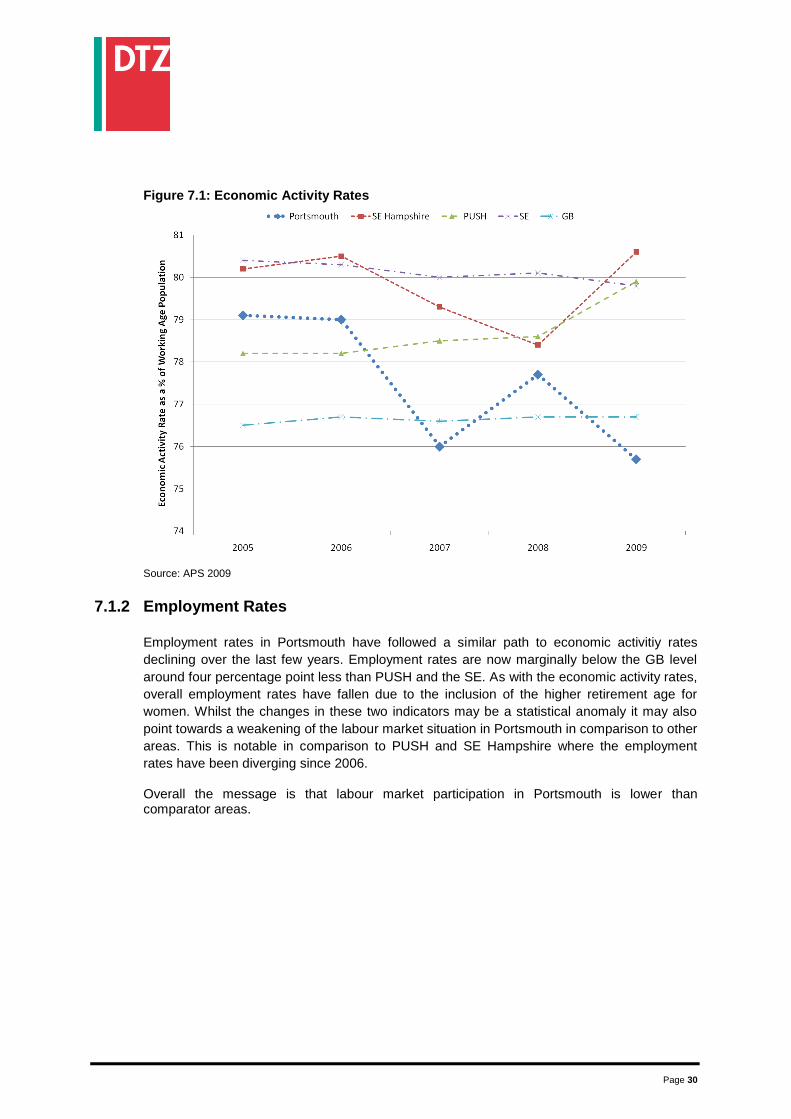
7.1.2 Employment Rates
Employment rates in Portsmouth have followed a similar path to economic activitiy rates
declining over the last few years. Employment rates are now marginally below the GB level
around four percentage point less than PUSH and the SE. As with the economic activity rates,
overall employment rates have fallen due to the inclusion of the higher retirement age for
women. Whilst the changes in these two indicators may be a statistical anomaly it may also
point towards a weakening of the labour market situation in Portsmouth in comparison to other
areas. This is notable in comparison to PUSH and SE Hampshire where the employment
rates have been diverging since 2006. Overall the message is that labour market participation in Portsmouth is lower than comparator areas.
Page 31
Figure 7.2: Employment Rates
Source: APS 2009
7.2 Unemployment Rate
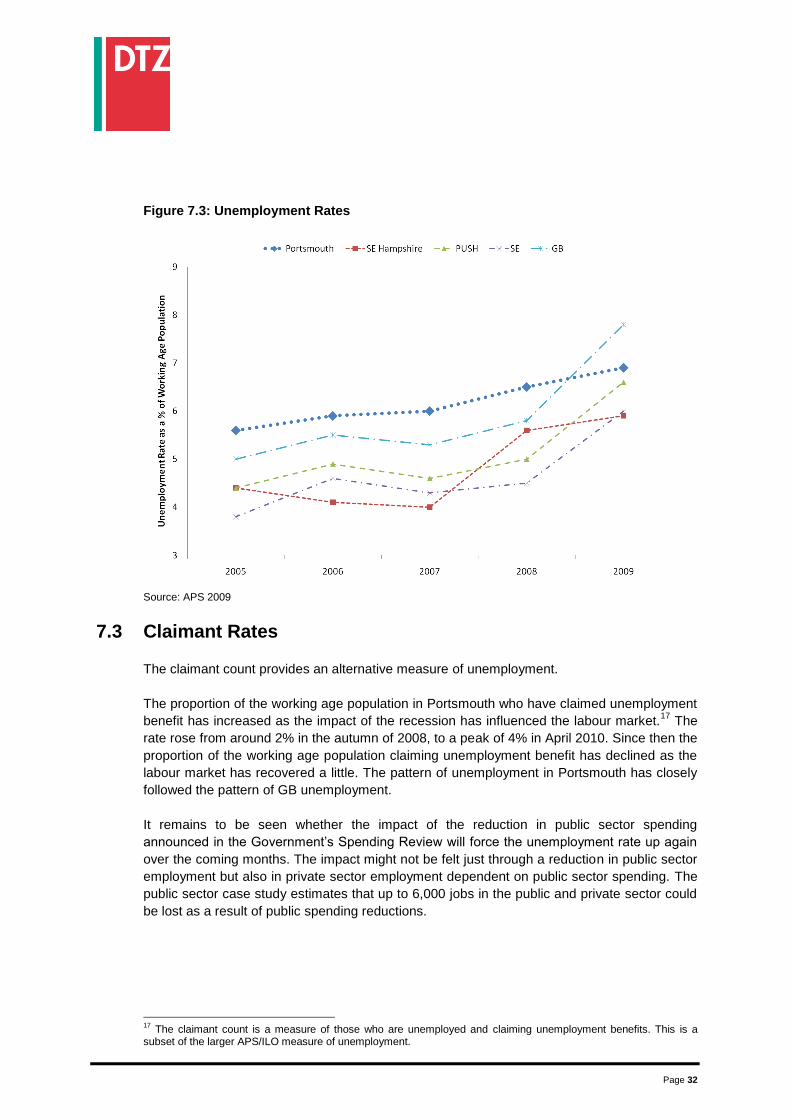
The unemployment rate in Portsmouth, as measured by the APS, has increased as a result of
the recession, reaching 6.9% by 200916
. Despite this increase the unemployment rate in
Portsmouth has increased by less than the comparator areas, although it should be
remembered that one datapoint does not make a trend. Unemployment rates in SE
Hampshire have also increased but lie around one percentage point lower than the
Portsmouth.
16
The APS uses the International Labour Organisation (ILO) definition of unemployment. This defines unemployment as the proportion of the labour force who are out of work and looking for a job.
Page 32
Figure 7.3: Unemployment Rates
Source: APS 2009
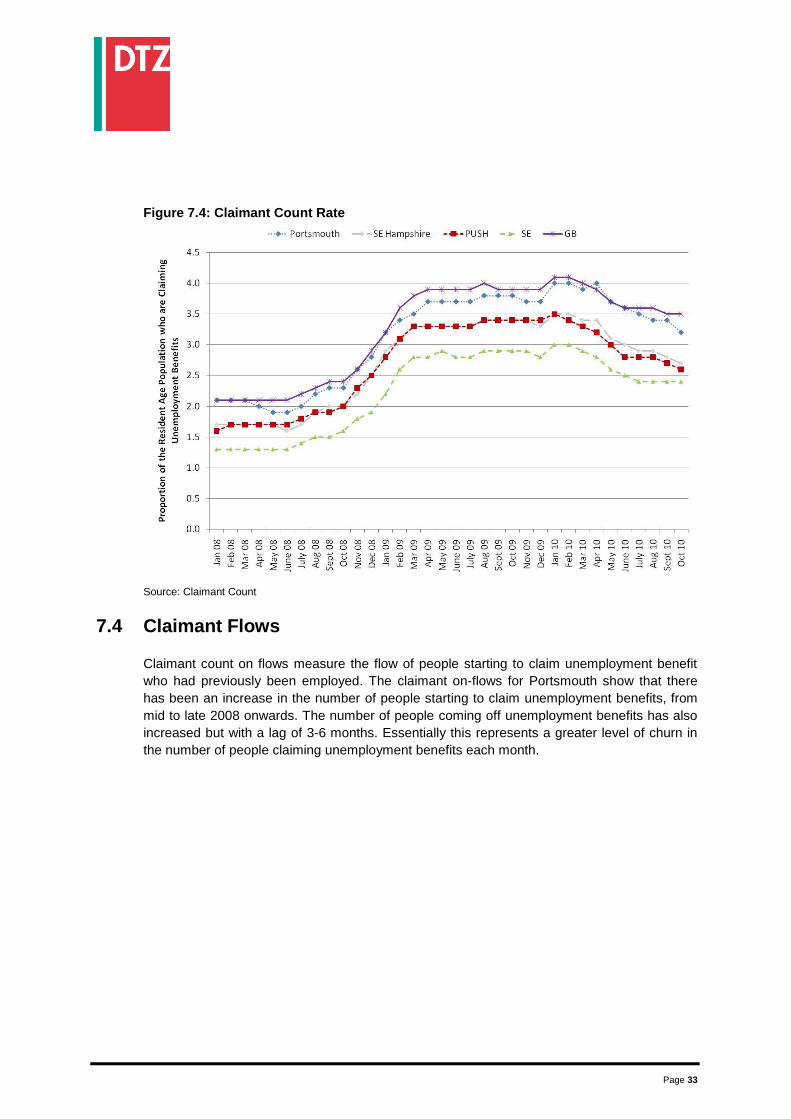
7.3 Claimant Rates
The claimant count provides an alternative measure of unemployment.
The proportion of the working age population in Portsmouth who have claimed unemployment
benefit has increased as the impact of the recession has influenced the labour market.17
The
rate rose from around 2% in the autumn of 2008, to a peak of 4% in April 2010. Since then the
proportion of the working age population claiming unemployment benefit has declined as the
labour market has recovered a little. The pattern of unemployment in Portsmouth has closely
followed the pattern of GB unemployment.
It remains to be seen whether the impact of the reduction in public sector spending
announced in the Government’s Spending Review will force the unemployment rate up again
over the coming months. The impact might not be felt just through a reduction in public sector
employment but also in private sector employment dependent on public sector spending. The
public sector case study estimates that up to 6,000 jobs in the public and private sector could
be lost as a result of public spending reductions.
17
The claimant count is a measure of those who are unemployed and claiming unemployment benefits. This is a subset of the larger APS/ILO measure of unemployment.
Page 33
Figure 7.4: Claimant Count Rate
Source: Claimant Count
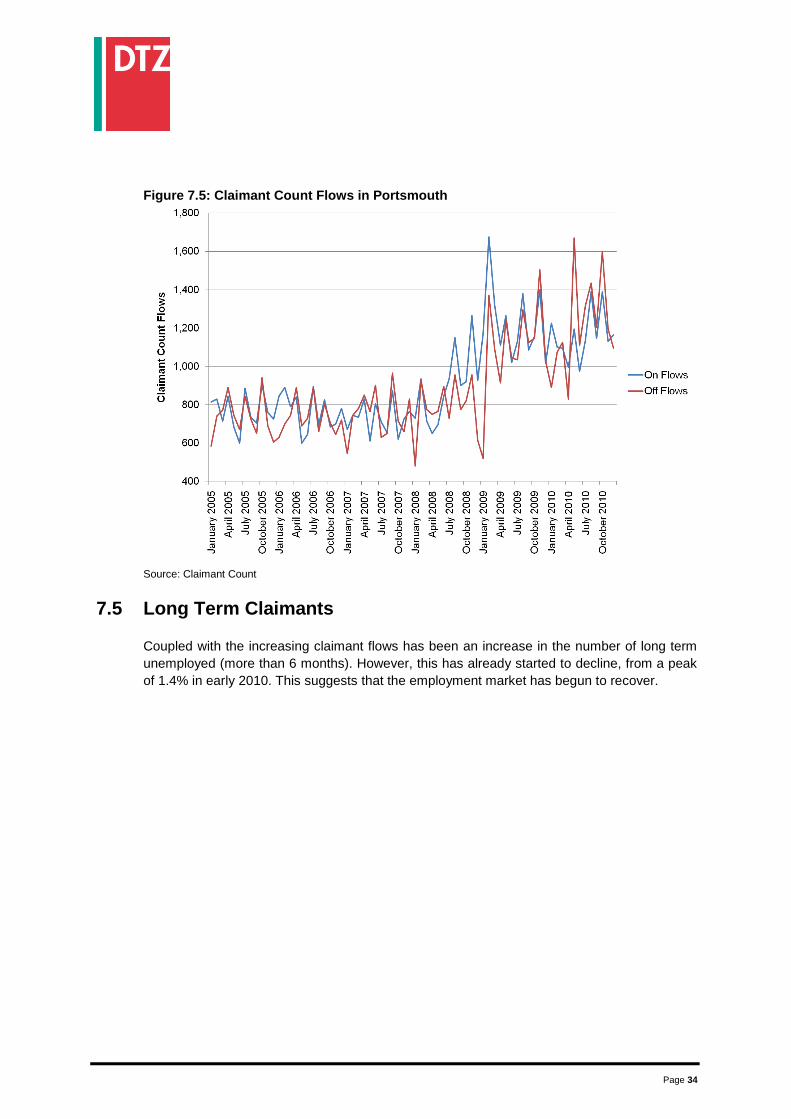
7.4 Claimant Flows
Claimant count on flows measure the flow of people starting to claim unemployment benefit
who had previously been employed. The claimant on-flows for Portsmouth show that there
has been an increase in the number of people starting to claim unemployment benefits, from
mid to late 2008 onwards. The number of people coming off unemployment benefits has also
increased but with a lag of 3-6 months. Essentially this represents a greater level of churn in
the number of people claiming unemployment benefits each month.
Page 34
Figure 7.5: Claimant Count Flows in Portsmouth
Source: Claimant Count
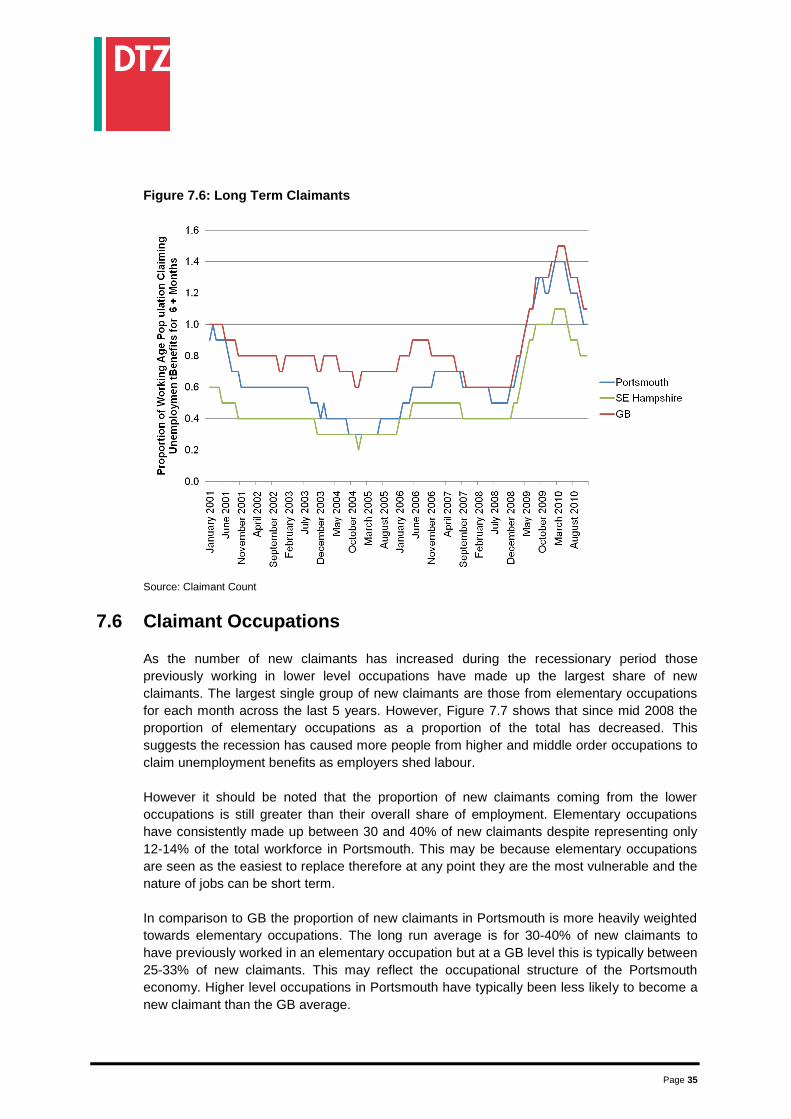
7.5 Long Term Claimants
Coupled with the increasing claimant flows has been an increase in the number of long term
unemployed (more than 6 months). However, this has already started to decline, from a peak
of 1.4% in early 2010. This suggests that the employment market has begun to recover.
Page 35
Figure 7.6: Long Term Claimants
Source: Claimant Count
7.6 Claimant Occupations
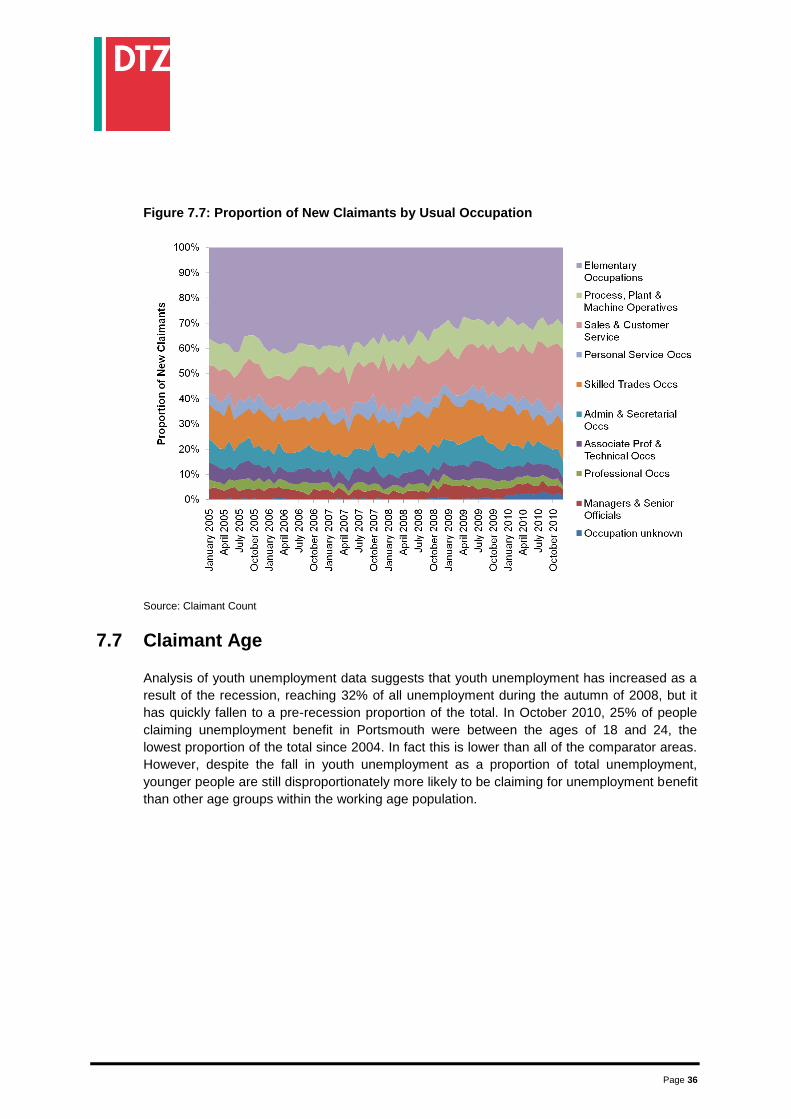
As the number of new claimants has increased during the recessionary period those
previously working in lower level occupations have made up the largest share of new
claimants. The largest single group of new claimants are those from elementary occupations
for each month across the last 5 years. However, Figure 7.7 shows that since mid 2008 the
proportion of elementary occupations as a proportion of the total has decreased. This
suggests the recession has caused more people from higher and middle order occupations to
claim unemployment benefits as employers shed labour.
However it should be noted that the proportion of new claimants coming from the lower
occupations is still greater than their overall share of employment. Elementary occupations
have consistently made up between 30 and 40% of new claimants despite representing only
12-14% of the total workforce in Portsmouth. This may be because elementary occupations
are seen as the easiest to replace therefore at any point they are the most vulnerable and the
nature of jobs can be short term.
In comparison to GB the proportion of new claimants in Portsmouth is more heavily weighted
towards elementary occupations. The long run average is for 30-40% of new claimants to
have previously worked in an elementary occupation but at a GB level this is typically between
25-33% of new claimants. This may reflect the occupational structure of the Portsmouth
economy. Higher level occupations in Portsmouth have typically been less likely to become a
new claimant than the GB average.
Page 36
Figure 7.7: Proportion of New Claimants by Usual Occupation
Source: Claimant Count
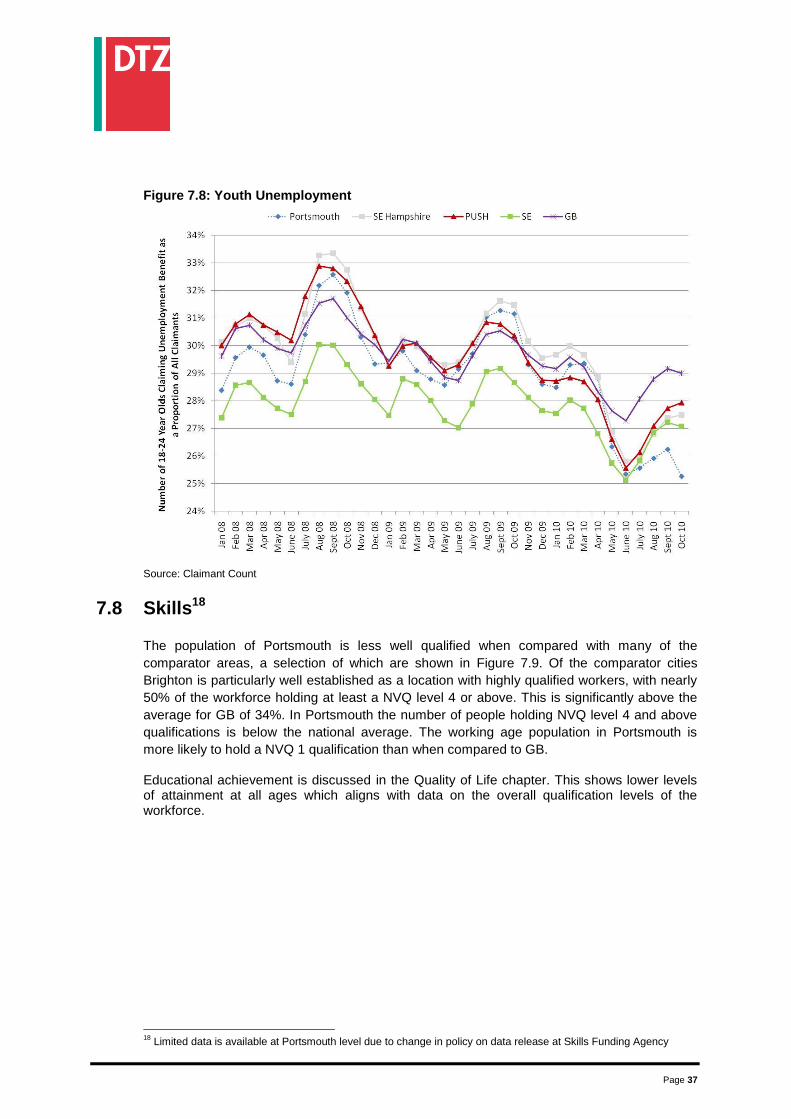
7.7 Claimant Age
Analysis of youth unemployment data suggests that youth unemployment has increased as a
result of the recession, reaching 32% of all unemployment during the autumn of 2008, but it
has quickly fallen to a pre-recession proportion of the total. In October 2010, 25% of people
claiming unemployment benefit in Portsmouth were between the ages of 18 and 24, the
lowest proportion of the total since 2004. In fact this is lower than all of the comparator areas.
However, despite the fall in youth unemployment as a proportion of total unemployment,
younger people are still disproportionately more likely to be claiming for unemployment benefit
than other age groups within the working age population.
Page 37
Figure 7.8: Youth Unemployment
Source: Claimant Count
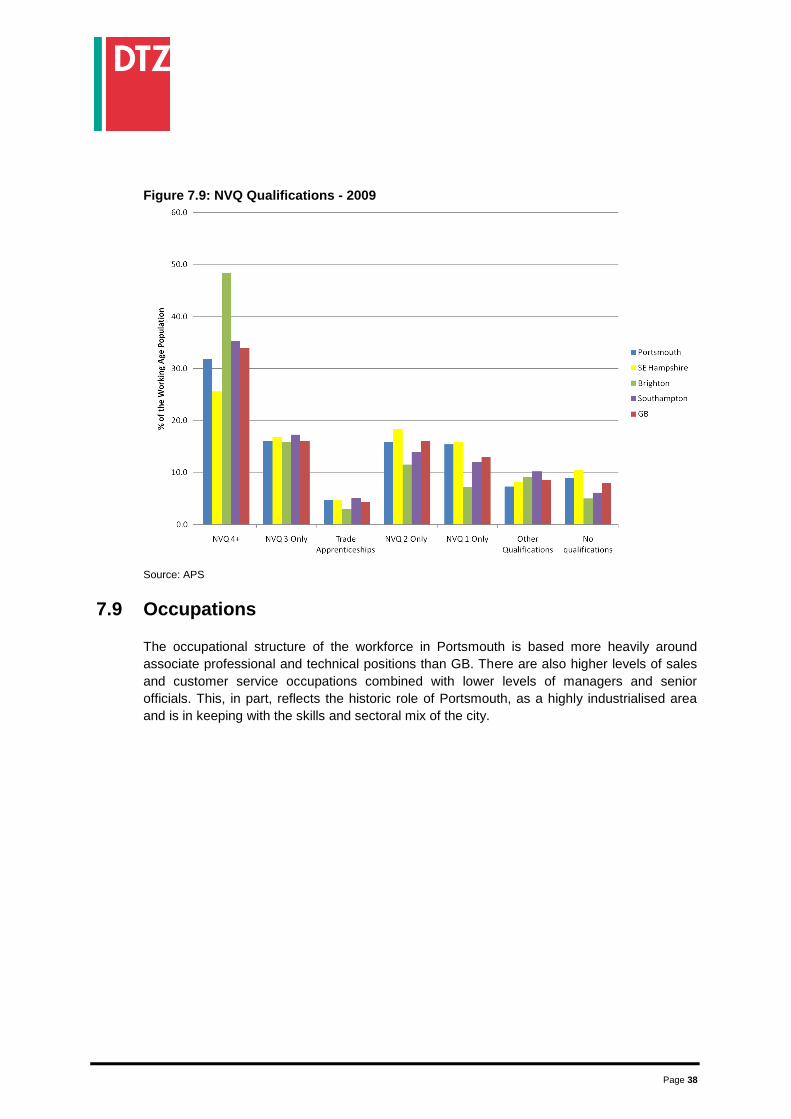
7.8 Skills18
The population of Portsmouth is less well qualified when compared with many of the
comparator areas, a selection of which are shown in Figure 7.9. Of the comparator cities
Brighton is particularly well established as a location with highly qualified workers, with nearly
50% of the workforce holding at least a NVQ level 4 or above. This is significantly above the
average for GB of 34%. In Portsmouth the number of people holding NVQ level 4 and above
qualifications is below the national average. The working age population in Portsmouth is
more likely to hold a NVQ 1 qualification than when compared to GB. Educational achievement is discussed in the Quality of Life chapter. This shows lower levels of attainment at all ages which aligns with data on the overall qualification levels of the workforce.
18
Limited data is available at Portsmouth level due to change in policy on data release at Skills Funding Agency
Page 38
Figure 7.9: NVQ Qualifications - 2009
Source: APS
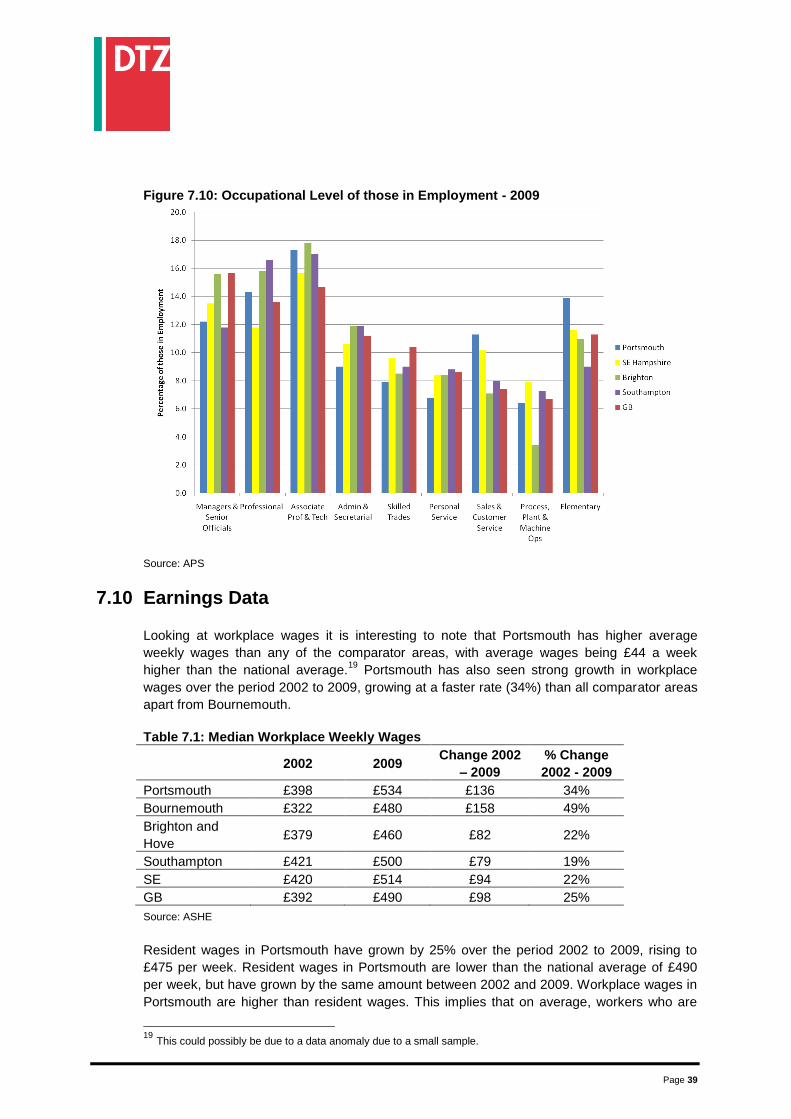
7.9 Occupations
The occupational structure of the workforce in Portsmouth is based more heavily around
associate professional and technical positions than GB. There are also higher levels of sales
and customer service occupations combined with lower levels of managers and senior
officials. This, in part, reflects the historic role of Portsmouth, as a highly industrialised area
and is in keeping with the skills and sectoral mix of the city.
Page 39
Figure 7.10: Occupational Level of those in Employment - 2009
Source: APS
7.10 Earnings Data
Looking at workplace wages it is interesting to note that Portsmouth has higher average
weekly wages than any of the comparator areas, with average wages being £44 a week
higher than the national average.19
Portsmouth has also seen strong growth in workplace
wages over the period 2002 to 2009, growing at a faster rate (34%) than all comparator areas
apart from Bournemouth.
Table 7.1: Median Workplace Weekly Wages
2002 2009 Change 2002
– 2009
% Change
2002 - 2009
Portsmouth £398 £534 £136 34%
Bournemouth £322 £480 £158 49%
Brighton and
Hove £379 £460 £82 22%
Southampton £421 £500 £79 19%
SE £420 £514 £94 22%
GB £392 £490 £98 25%
Source: ASHE
Resident wages in Portsmouth have grown by 25% over the period 2002 to 2009, rising to
£475 per week. Resident wages in Portsmouth are lower than the national average of £490
per week, but have grown by the same amount between 2002 and 2009. Workplace wages in
Portsmouth are higher than resident wages. This implies that on average, workers who are
19
This could possibly be due to a data anomaly due to a small sample.
Page 40
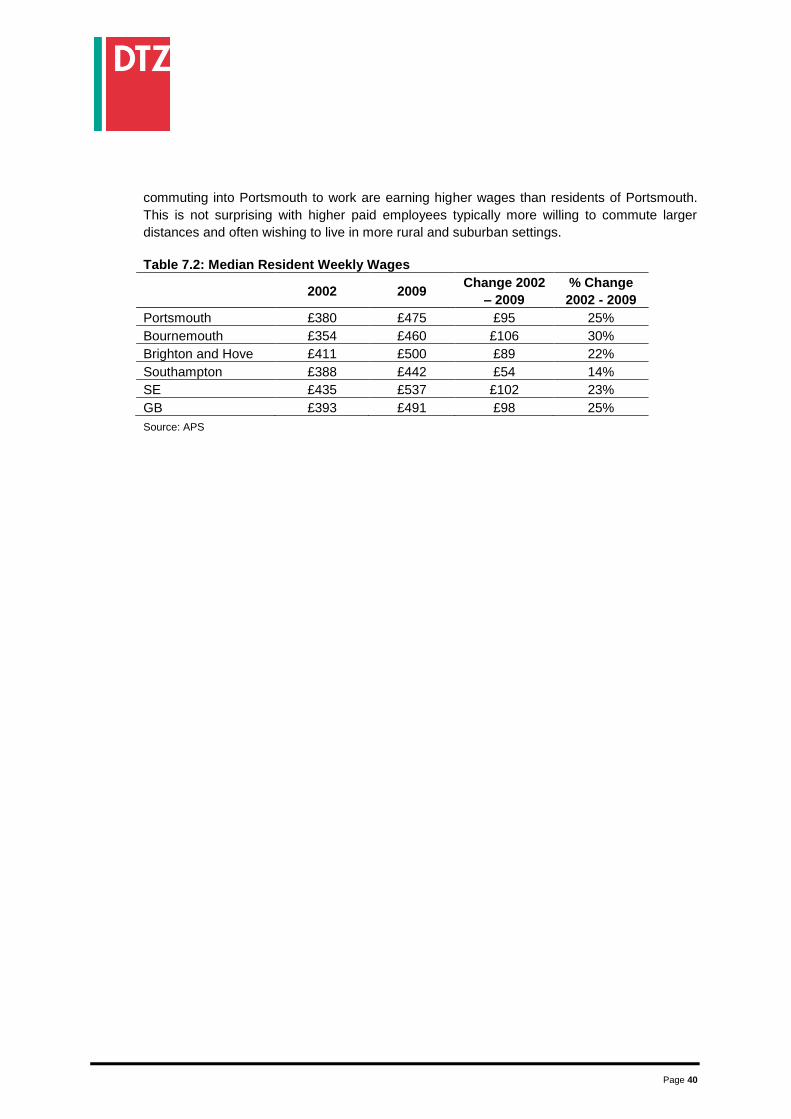
commuting into Portsmouth to work are earning higher wages than residents of Portsmouth.
This is not surprising with higher paid employees typically more willing to commute larger
distances and often wishing to live in more rural and suburban settings.
Table 7.2: Median Resident Weekly Wages
2002 2009 Change 2002
– 2009
% Change
2002 - 2009
Portsmouth £380 £475 £95 25%
Bournemouth £354 £460 £106 30%
Brighton and Hove £411 £500 £89 22%
Southampton £388 £442 £54 14%
SE £435 £537 £102 23%
GB £393 £491 £98 25%
Source: APS
Page 41
8. Quality of Life and Place
Quality of life is increasingly a driver of economic growth due to its role in attracting both
employers and employees. However, there is no single indicator that captures quality of life,
and in reality, the factors that make a place attractive to live, work and visit are highly
subjective and varied. This chapter includes analysis of a range of indicators on quality of life
and place with the intention of building a picture of the city. Many of these statistics would be
the same as those used by potential investors when profiling a location.
There is a clear link between a number of the quality of life indicators, not least the nature of
the housing stock, levels of deprivation, levels of educational attainment and health – with
deprivation being a primary driver of educational and health outcomes.
8.1 Deprivation
The Index of Multiple Deprivation (IMD 2007) measures deprivation against a number of
indicators. It ranks all of the Lower Level Super Output Areas (LSOAs) across England
against a basket of indicators grouped into seven domains. The overall index is based on a
weighted average of the seven sub domains which are:
– Income (22.5% of overall weighting)
– Employment (22.5%)
– Health Deprivation and Disability (13.5%)
– Education and Skills (13.5%)
– Barriers to Housing and Services (9.3%)
– Crime (9.3%)
– Living Environment (9.3%)
The domains cover many of the key factors that are often considered as determinants of
quality of life. The following map illustrates the relative levels of deprivation across
Chapter Summary
– Quality of life and place is becoming increasingly important as a driver of economic
growth
– There is not a significant level of deep deprivation in the city. However, there is a clear
concentration across the fourth, fifth and sixth deciles.
– The worst areas of overall deprivation in the city are in and around Fratton and
Paulsgrove.
– The housing stock is dominated by terraced housing with very few detached and semi
detached properties. Due to the highly urbanised nature of the area this is unlikely to
change significantly over time.
– Educational achievement at schools in Portsmouth is slightly below the English
average. There are two FE colleges and a University within Portsmouth.
– The health of people in Portsmouth is generally below national averages with the city
having significant health inequalities. Male life expectancy at birth is a particular
discrepancy.
– Recorded crime per head in Portsmouth is above the national average, although this
may reflect its urban characteristics.
–
Page 42
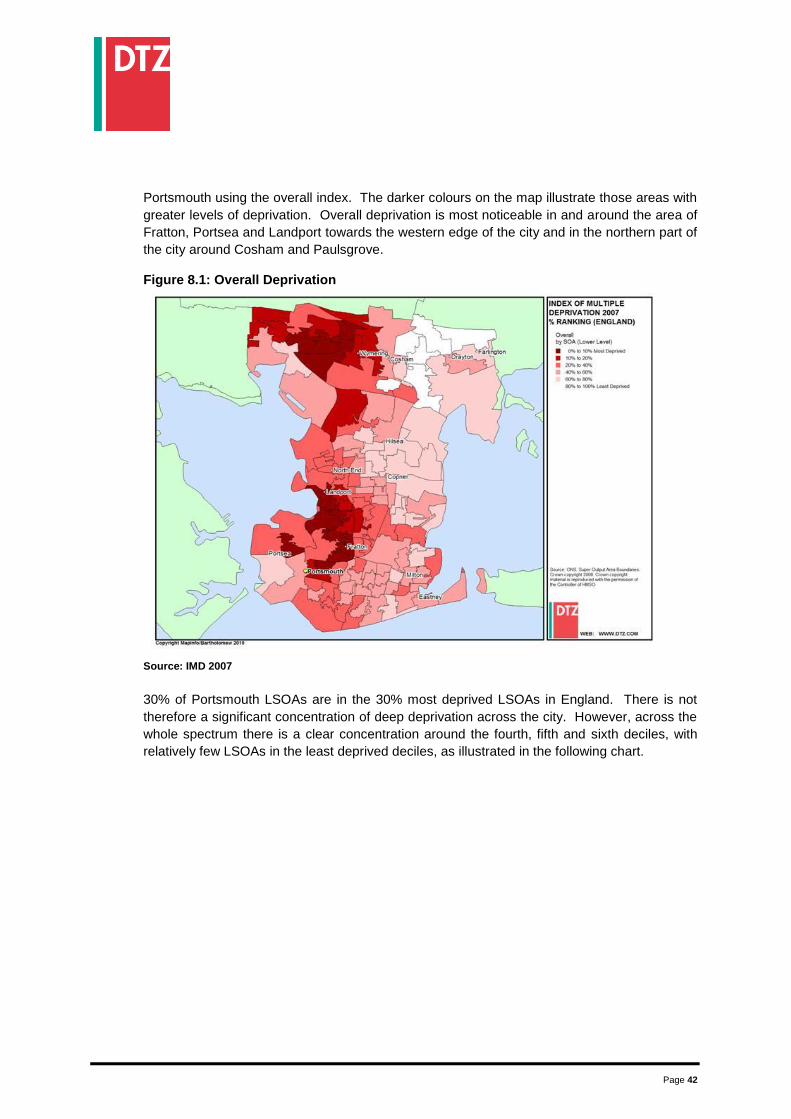
Portsmouth using the overall index. The darker colours on the map illustrate those areas with
greater levels of deprivation. Overall deprivation is most noticeable in and around the area of
Fratton, Portsea and Landport towards the western edge of the city and in the northern part of
the city around Cosham and Paulsgrove. Figure 8.1: Overall Deprivation
Source: IMD 2007
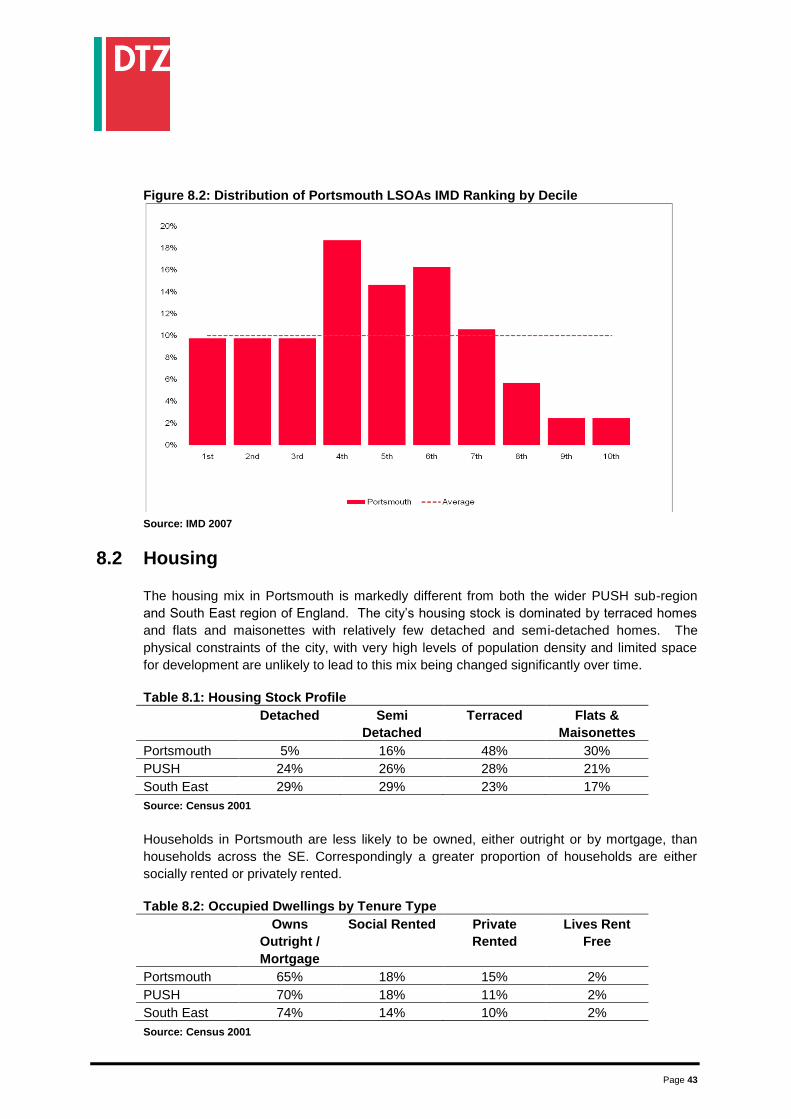
30% of Portsmouth LSOAs are in the 30% most deprived LSOAs in England. There is not
therefore a significant concentration of deep deprivation across the city. However, across the
whole spectrum there is a clear concentration around the fourth, fifth and sixth deciles, with
relatively few LSOAs in the least deprived deciles, as illustrated in the following chart.
Page 43
Figure 8.2: Distribution of Portsmouth LSOAs IMD Ranking by Decile
Source: IMD 2007
8.2 Housing
The housing mix in Portsmouth is markedly different from both the wider PUSH sub-region
and South East region of England. The city’s housing stock is dominated by terraced homes
and flats and maisonettes with relatively few detached and semi-detached homes. The
physical constraints of the city, with very high levels of population density and limited space
for development are unlikely to lead to this mix being changed significantly over time.
Table 8.1: Housing Stock Profile
Detached Semi
Detached
Terraced Flats &
Maisonettes
Portsmouth 5% 16% 48% 30%
PUSH 24% 26% 28% 21%
South East 29% 29% 23% 17%
Source: Census 2001
Households in Portsmouth are less likely to be owned, either outright or by mortgage, than
households across the SE. Correspondingly a greater proportion of households are either
socially rented or privately rented.
Table 8.2: Occupied Dwellings by Tenure Type
Owns
Outright /
Mortgage
Social Rented Private
Rented
Lives Rent
Free
Portsmouth 65% 18% 15% 2%
PUSH 70% 18% 11% 2%
South East 74% 14% 10% 2%
Source: Census 2001
Page 44
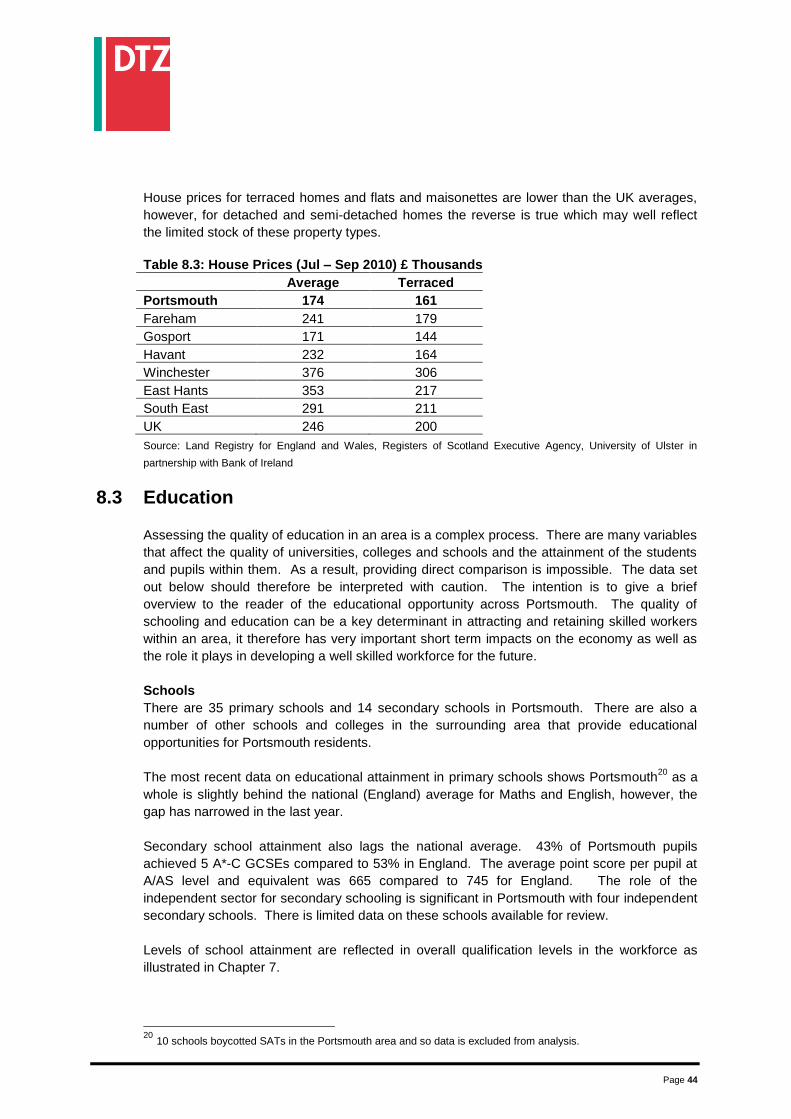
House prices for terraced homes and flats and maisonettes are lower than the UK averages,
however, for detached and semi-detached homes the reverse is true which may well reflect
the limited stock of these property types.
Table 8.3: House Prices (Jul – Sep 2010) £ Thousands
Average Terraced
Portsmouth 174 161
Fareham 241 179
Gosport 171 144
Havant 232 164
Winchester 376 306
East Hants 353 217
South East 291 211
UK 246 200
Source: Land Registry for England and Wales, Registers of Scotland Executive Agency, University of Ulster in
partnership with Bank of Ireland
8.3 Education
Assessing the quality of education in an area is a complex process. There are many variables
that affect the quality of universities, colleges and schools and the attainment of the students
and pupils within them. As a result, providing direct comparison is impossible. The data set
out below should therefore be interpreted with caution. The intention is to give a brief
overview to the reader of the educational opportunity across Portsmouth. The quality of
schooling and education can be a key determinant in attracting and retaining skilled workers
within an area, it therefore has very important short term impacts on the economy as well as
the role it plays in developing a well skilled workforce for the future.
Schools
There are 35 primary schools and 14 secondary schools in Portsmouth. There are also a
number of other schools and colleges in the surrounding area that provide educational
opportunities for Portsmouth residents.
The most recent data on educational attainment in primary schools shows Portsmouth20
as a
whole is slightly behind the national (England) average for Maths and English, however, the
gap has narrowed in the last year.
Secondary school attainment also lags the national average. 43% of Portsmouth pupils
achieved 5 A*-C GCSEs compared to 53% in England. The average point score per pupil at
A/AS level and equivalent was 665 compared to 745 for England. The role of the
independent sector for secondary schooling is significant in Portsmouth with four independent
secondary schools. There is limited data on these schools available for review.
Levels of school attainment are reflected in overall qualification levels in the workforce as
illustrated in Chapter 7.
20
10 schools boycotted SATs in the Portsmouth area and so data is excluded from analysis.
Page 45
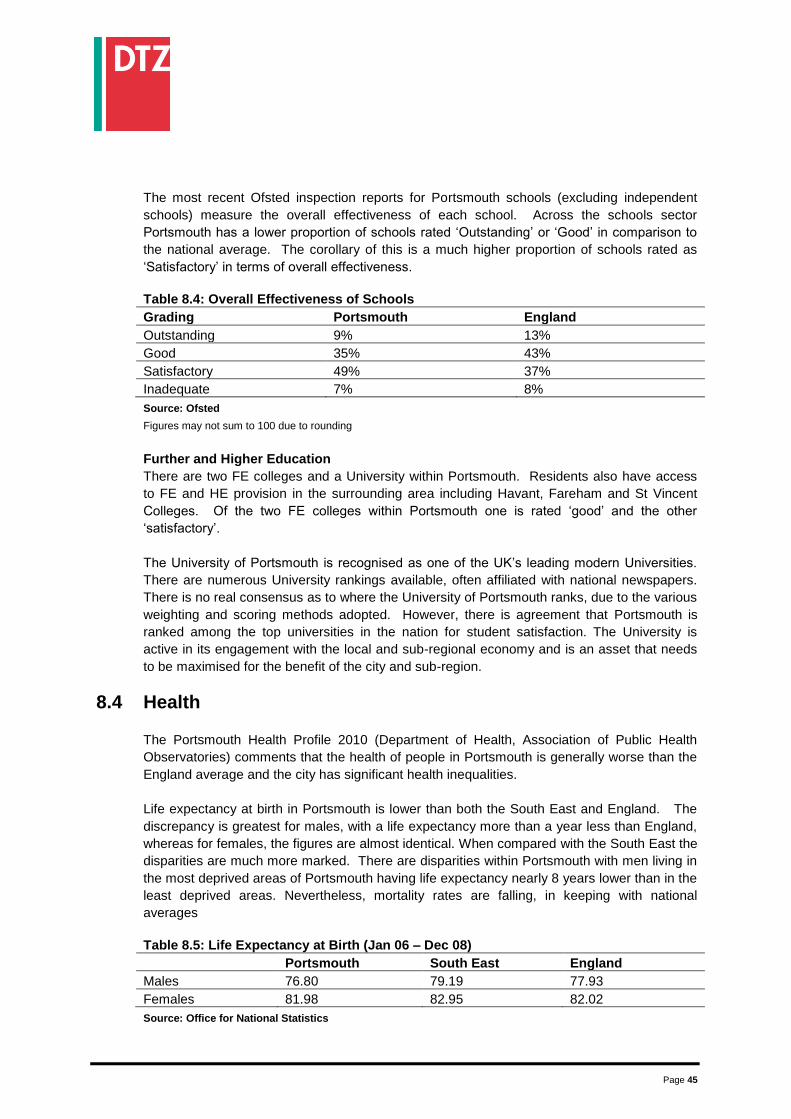
The most recent Ofsted inspection reports for Portsmouth schools (excluding independent
schools) measure the overall effectiveness of each school. Across the schools sector
Portsmouth has a lower proportion of schools rated ‘Outstanding’ or ‘Good’ in comparison to
the national average. The corollary of this is a much higher proportion of schools rated as
‘Satisfactory’ in terms of overall effectiveness.
Table 8.4: Overall Effectiveness of Schools
Grading Portsmouth England
Outstanding 9% 13%
Good 35% 43%
Satisfactory 49% 37%
Inadequate 7% 8%
Source: Ofsted
Figures may not sum to 100 due to rounding
Further and Higher Education
There are two FE colleges and a University within Portsmouth. Residents also have access
to FE and HE provision in the surrounding area including Havant, Fareham and St Vincent
Colleges. Of the two FE colleges within Portsmouth one is rated ‘good’ and the other
‘satisfactory’.
The University of Portsmouth is recognised as one of the UK’s leading modern Universities.
There are numerous University rankings available, often affiliated with national newspapers.
There is no real consensus as to where the University of Portsmouth ranks, due to the various
weighting and scoring methods adopted. However, there is agreement that Portsmouth is
ranked among the top universities in the nation for student satisfaction. The University is
active in its engagement with the local and sub-regional economy and is an asset that needs
to be maximised for the benefit of the city and sub-region.
8.4 Health
The Portsmouth Health Profile 2010 (Department of Health, Association of Public Health
Observatories) comments that the health of people in Portsmouth is generally worse than the
England average and the city has significant health inequalities.
Life expectancy at birth in Portsmouth is lower than both the South East and England. The
discrepancy is greatest for males, with a life expectancy more than a year less than England,
whereas for females, the figures are almost identical. When compared with the South East the
disparities are much more marked. There are disparities within Portsmouth with men living in
the most deprived areas of Portsmouth having life expectancy nearly 8 years lower than in the
least deprived areas. Nevertheless, mortality rates are falling, in keeping with national
averages
Table 8.5: Life Expectancy at Birth (Jan 06 – Dec 08)
Portsmouth South East England
Males 76.80 79.19 77.93
Females 81.98 82.95 82.02
Source: Office for National Statistics
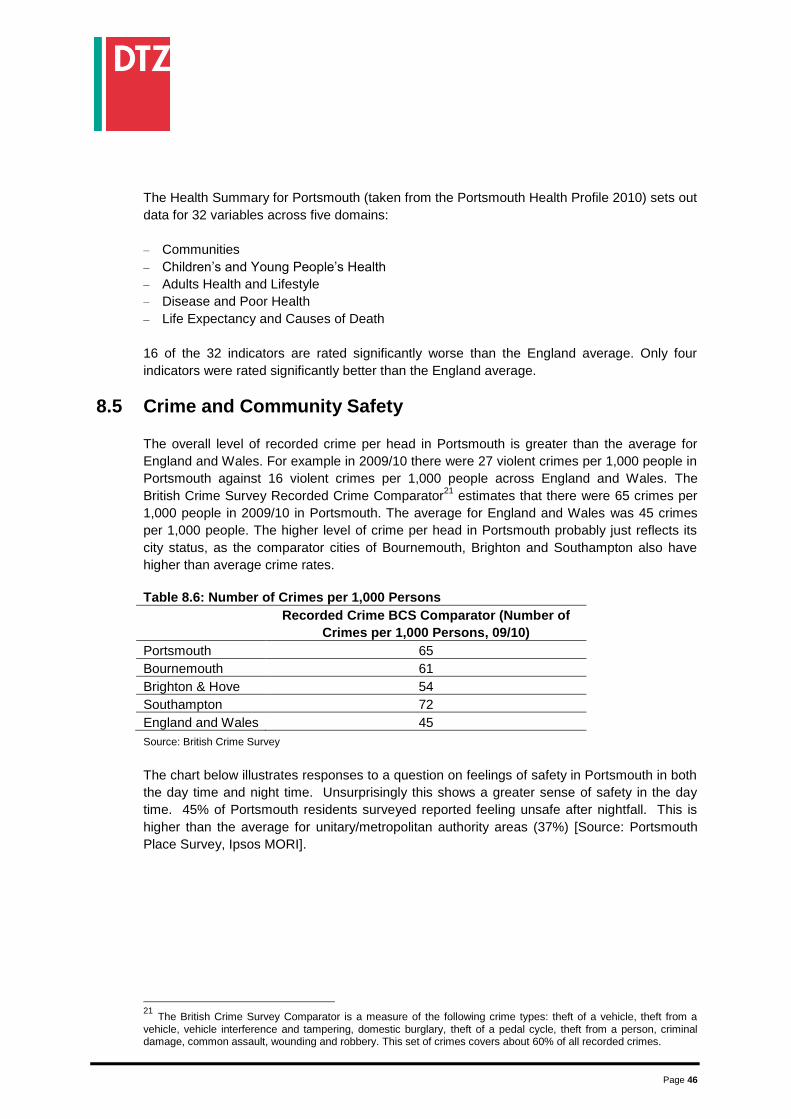
Page 46
The Health Summary for Portsmouth (taken from the Portsmouth Health Profile 2010) sets out
data for 32 variables across five domains:
– Communities
– Children’s and Young People’s Health
– Adults Health and Lifestyle
– Disease and Poor Health
– Life Expectancy and Causes of Death
16 of the 32 indicators are rated significantly worse than the England average. Only four
indicators were rated significantly better than the England average.
8.5 Crime and Community Safety
The overall level of recorded crime per head in Portsmouth is greater than the average for
England and Wales. For example in 2009/10 there were 27 violent crimes per 1,000 people in
Portsmouth against 16 violent crimes per 1,000 people across England and Wales. The
British Crime Survey Recorded Crime Comparator21
estimates that there were 65 crimes per
1,000 people in 2009/10 in Portsmouth. The average for England and Wales was 45 crimes
per 1,000 people. The higher level of crime per head in Portsmouth probably just reflects its
city status, as the comparator cities of Bournemouth, Brighton and Southampton also have
higher than average crime rates.
Table 8.6: Number of Crimes per 1,000 Persons
Recorded Crime BCS Comparator (Number of
Crimes per 1,000 Persons, 09/10)
Portsmouth 65
Bournemouth 61
Brighton & Hove 54
Southampton 72
England and Wales 45
Source: British Crime Survey
The chart below illustrates responses to a question on feelings of safety in Portsmouth in both
the day time and night time. Unsurprisingly this shows a greater sense of safety in the day
time. 45% of Portsmouth residents surveyed reported feeling unsafe after nightfall. This is
higher than the average for unitary/metropolitan authority areas (37%) [Source: Portsmouth
Place Survey, Ipsos MORI].
21
The British Crime Survey Comparator is a measure of the following crime types: theft of a vehicle, theft from a
vehicle, vehicle interference and tampering, domestic burglary, theft of a pedal cycle, theft from a person, criminal damage, common assault, wounding and robbery. This set of crimes covers about 60% of all recorded crimes.
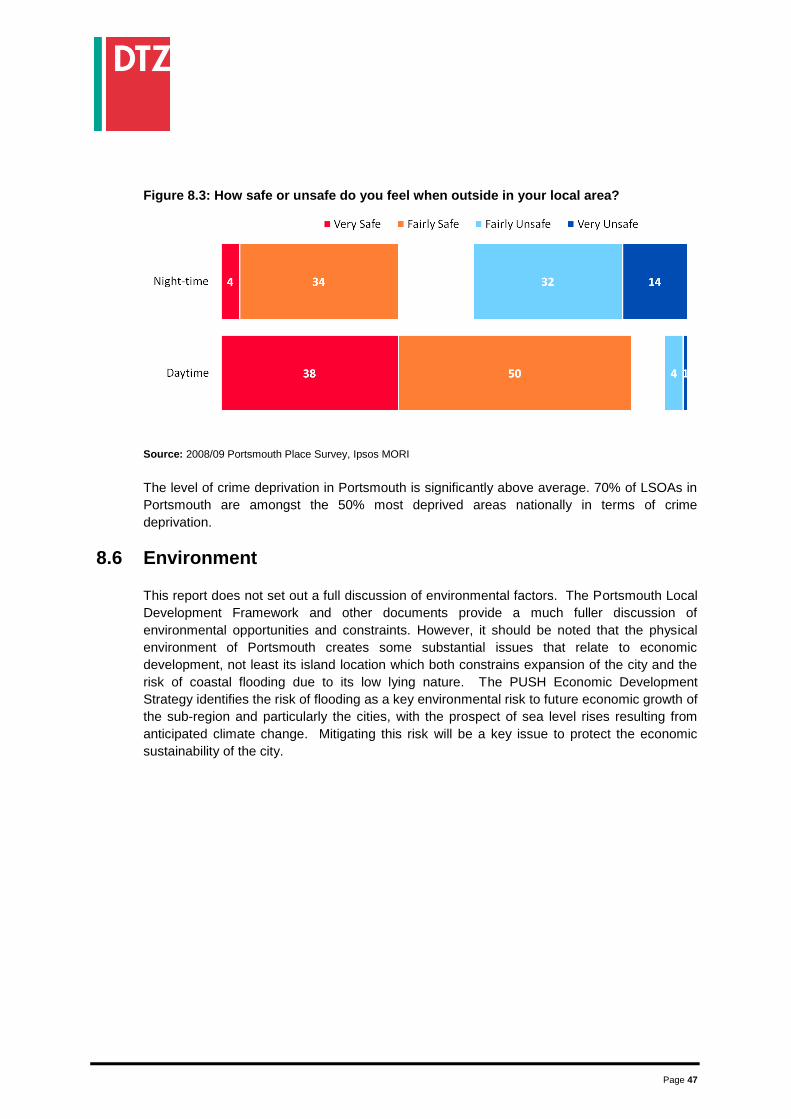
Page 47
Figure 8.3: How safe or unsafe do you feel when outside in your local area?
Source: 2008/09 Portsmouth Place Survey, Ipsos MORI
The level of crime deprivation in Portsmouth is significantly above average. 70% of LSOAs in
Portsmouth are amongst the 50% most deprived areas nationally in terms of crime
deprivation.
8.6 Environment
This report does not set out a full discussion of environmental factors. The Portsmouth Local
Development Framework and other documents provide a much fuller discussion of
environmental opportunities and constraints. However, it should be noted that the physical
environment of Portsmouth creates some substantial issues that relate to economic
development, not least its island location which both constrains expansion of the city and the
risk of coastal flooding due to its low lying nature. The PUSH Economic Development
Strategy identifies the risk of flooding as a key environmental risk to future economic growth of
the sub-region and particularly the cities, with the prospect of sea level rises resulting from
anticipated climate change. Mitigating this risk will be a key issue to protect the economic
sustainability of the city.
Page 48
9. Summary & Conclusions
The data paint a mixed picture of the Portsmouth economy and do not allow a simple
characterisation to be made. As with many areas, the city is a complex product of its
geography, history and current population which is also influenced by its near neighbours and
increasingly the influence of national and global economic trends.
Portsmouth sits within a South Hampshire and Solent economy which also includes the city of
Southampton and in some eyes extends towards the major conurbation of
Bournemouth/Poole. However, the three large urban areas in this sub-regional area have very
different characters and the data on sectoral strengths make this clear. Portsmouth stands
out for its strength as a manufacturing centre and the role of the public sector – both of these
are heavily influenced by the city’s heritage as the home of the Royal Navy.
Portsmouth is a key employment centre for a hinterland which includes the boroughs of
Fareham, Gosport and Havant. However, over recent years Portsmouth has failed to secure
the level of employment growth experienced in many other areas. With significant public
sector spending cuts currently being implemented there are challenges for Portsmouth as it
seeks to secure a sustainable economic role in the future. The city does not have an
extensive financial and business services sector, particularly not advanced business services.
Within the sub-region the towns and cities of Southampton, Winchester and
Bournemouth/Poole have tended to attract these operations, and more recently the business
parks along the M27 have proved successful business services locations.
Notwithstanding, Portsmouth continues to play a key role as a service centre to its hinterland
as evidenced by large healthcare and education sectors. It has a growing tourism and leisure
industry and has some key strengths in advanced manufacturing and information and
communications. These strengths align to sub-regional priority sectors.
The city has a low volume of businesses for its size, however, this is largely as a result of the
availability of employment opportunity in the area and its sectoral structure. A much higher
proportion of the workforce are employed within large businesses than the benchmark areas,
including both major public sector employers and world leading manufacturing and service
sector businesses. As a result of the employment opportunities there is less of an imperative
for residents to form their own businesses than can be the case in more rural areas where
opportunities for employment are much fewer.
The presence of high level skills and occupations is lower than many comparator areas, with
high concentrations of middle and lower order occupations and skills. This also creates some
circular and complex relationships with the housing stock, which is dominated by terraced
homes, which create a more affordable housing market than some of the city’s immediate
hinterland. This in turn is more accessible to those with lower wages and in many cases
these will either be younger people (as reflected in the population structure) or may have
lower qualifications and earning power. Data on deprivation further supports this analysis.
Whilst there are some areas of severe deprivation, they are no more prevalent that one may
expect based on national averages, however, there are concentrations of moderate
deprivation and relatively few areas classified as having low deprivation.

Page 49
The challenges for the city, particularly as the UK economy recovers from the recent
recession and public spending adjusts as a result of the deficit, are to:
Secure new job creation to replace potential public sector cuts and reinforce the city’s
role as a key economic centre for its hinterland.
Tackle lower levels of labour market engagement, particularly among the male
population.
Improving skills levels, particularly at the higher levels to attract high value employers.
Whilst the city’s labour catchment extends beyond the tight administrative boundaries,
the low proportion of residents with the highest level of qualifications is common
across South East Hampshire area.
Mitigating potential flood risk.
In general terms these issues are all issues reflected in the PUSH Economic Development
Strategy. Particularly with a city focus as a central element of the strategy. The need for
strong cities to drive the sub-regional economy has ensured a strong city focus within the
strategy.
Recommended