Evaluation of a Laptop Program
Deborah L. LowtherSteven M. Ross
Gary R. Morrison

Research Questions
In a laptop classroom:
• Is teaching different?
• Is student behavior different?
• Is student achievement different?
Design
Evaluation period
– September 1, 1999 through May 30, 2000.
Participants– Laptop
• 5th & 6th grade students, teachers, and parents
– Non-Laptop • 5th & 6th grade students and teachers
– Eight schools
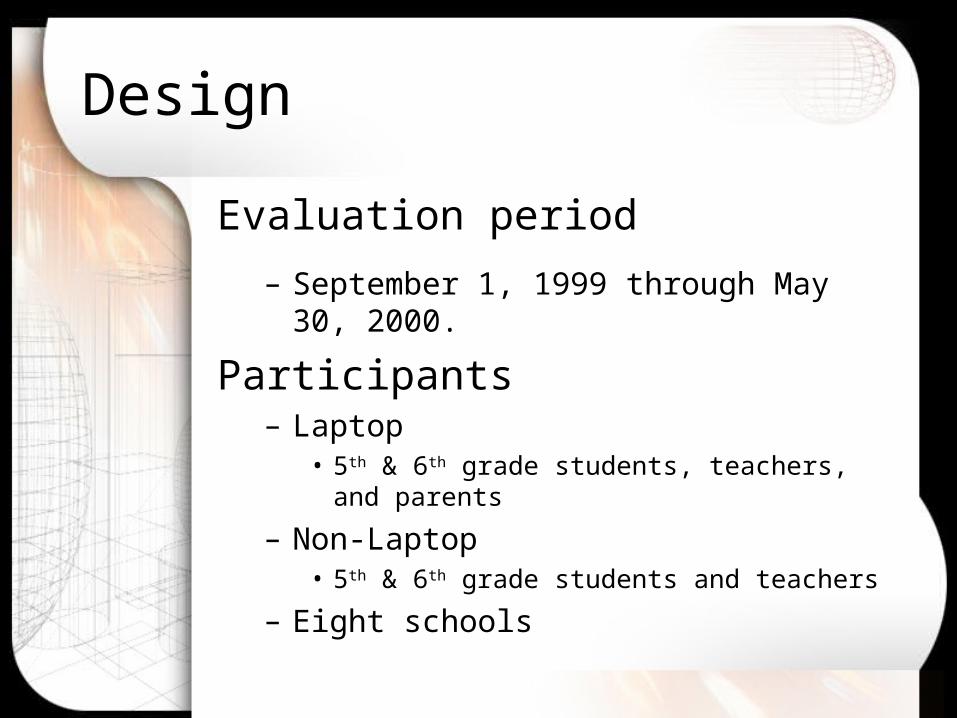
Laptop Teachers
• Ten full days of professional development prior to the 1999-2000 academic year
• Six one-half day sessions during the year.
• Training based on the NTeQ model
– Framework to develop problem-based lessons that utilize:
• Real-world resources• Student collaboration• Use of computer tools to reach solutions• Student research and writing skills.

Analysis
Comparative analyses– Teaching activities– Learning outcomes
Descriptive analyses – Reactions to Laptop Program
• Student
• Teacher
• Parent

Data Sources
Laptop and Non-Laptop
– Classroom observations
– Student writing test scores
Laptop
– Student surveys and focus groups
– Teacher surveys and focus groups
– Parent surveys and interviews
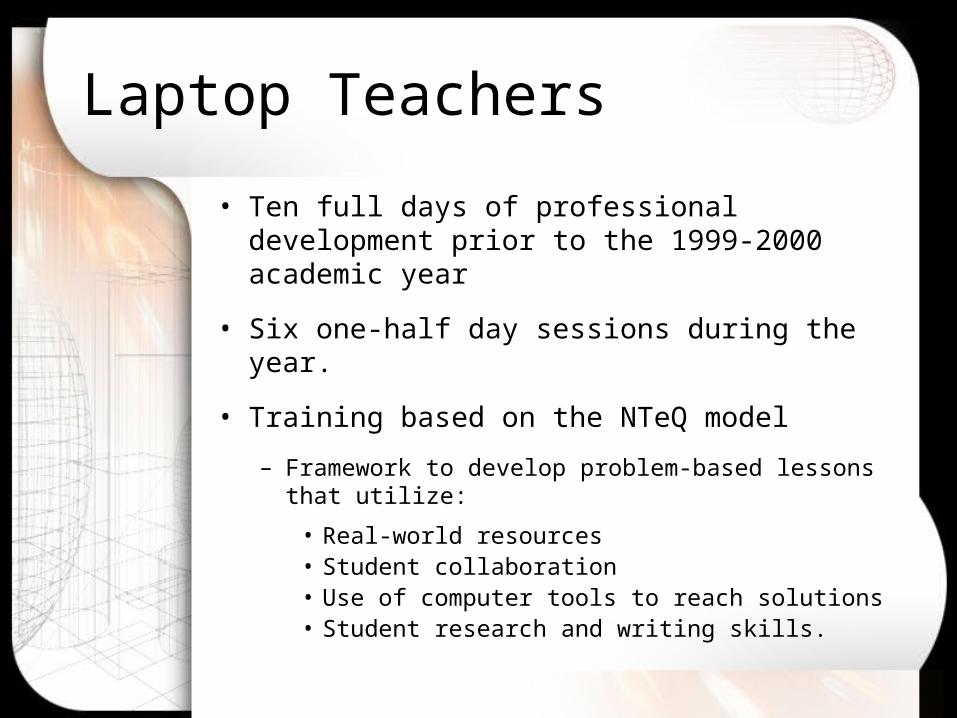
Final Data
Evaluation Measure Total Participants
Observation: SOM 50 32 Laptop/18 Non-Laptop
Observation: SCU 33 30 Laptop/3 Non-Laptop
Writing Test 64 32 Laptop/32 Non-Laptop
Student Survey 397 Laptop
Student Focus Group 58 Laptop
Teacher Survey 13 Laptop
Teacher Interview 7 Laptop
Parent Survey 187 Laptop
Parent Interview 40 Laptop

Instruments
School Observation Measure (SOM©)
– Use/non-use of 24 instructional strategies
• e.g., direct instruction, performance assessment, work centers, team-teaching
– 60 minutes of observation
• about 4, 15-minute segments
– 1 SOM Data Summary form• 4 segments summarized

Instruments
Survey of Computer Use (SCU) – Completed if students were observed using
the computer
– Data collected:• Technology
AccessCapacity Configuration
• Student computer activitiesType of activity Tool usedOverall meaningfulness
Instruments
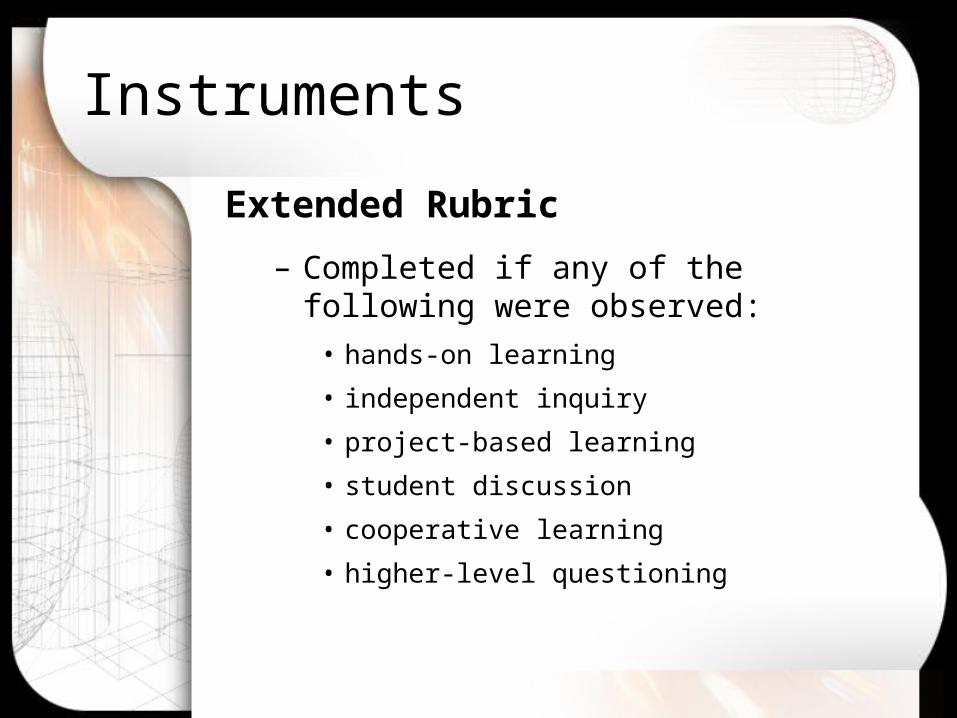
Extended Rubric
– Completed if any of the following were observed:
• hands-on learning
• independent inquiry
• project-based learning
• student discussion
• cooperative learning
• higher-level questioning

Instruments
Walled Lake Consolidated Schools (WLCS)
Writing Test– Prompted essay writing
• Write a letter of introduction to his/her “new” teacher for next year.
– Blind assessment• WLCS Writing Scoring Guide
Four-point rubric– Ideas and Content– Organization and Form– Style– Conventions

Method
Surveys, Interviews, and Focus Groups– Primary Questions:
• Have the laptop computers:– Had a personal impact (increased skills –
research, computer, learning)?
– Impacted what happens in the classroom?
• What are the – Benefits
– Difficulties
– Ways to improve the program?
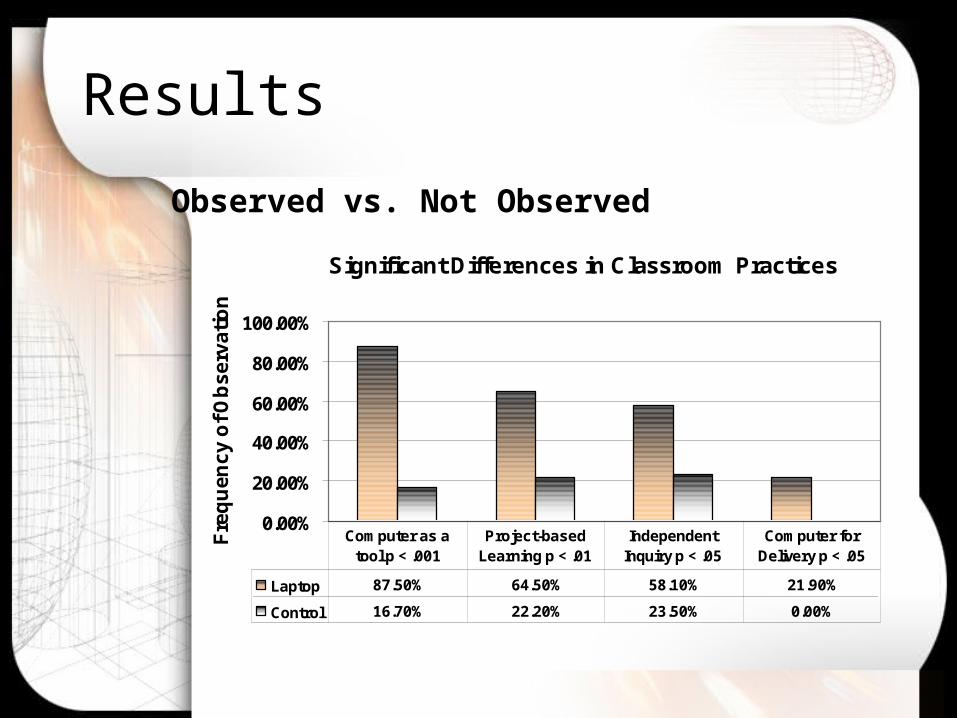
Results
Significant Differences in Classroom Practices
0.00%
20.00%
40.00%
60.00%
80.00%
100.00%
Fre
qu
en
cy
of
Ob
se
rva
tio
n
Laptop 87.50% 64.50% 58.10% 21.90%
Control 16.70% 22.20% 23.50% 0.00%
Computer as a tool p < .001
Project-based Learning p < .01
Independent Inquiry p < .05
Computer for Delivery p < .05
Observed vs. Not Observed

SOM Results
Significant Differences in Classroom Practices
0.00
0.50
1.00
1.50
2.00
2.50
3.00
Freq
uenc
y of
Obs
erva
tion
Laptop 2.84 2.25 1.90 1.64
Non-Laptop 0.16 0.66 0.52 0.77
Computer Used as a Tool p < .0001
Project-Based Learing p < .002
Independent Inquiry/ Research p < .007
Higher-Level Feedback p < .044
Frequency of Observation
0= Not Observed, 4 = Extensively Observed
ES = +2.29 ES = +0.95 ES = +0.89 ES = +0.61

SOM Results
Significant Differences in Classroom Practice
0.00
0.50
1.00
1.50
2.00
2.50
3.00
Freq
uenc
y of
Obs
erva
tion
Laptop 2.40 1.71 0.65
Non-Laptop 1.38 0.88 0.00
Teacher as Facilitator p < .035 Cooperative Learning p < .05 Computer for Delivery p < .047
Frequency of Observation
0= Not Observed, 4 = Extensively Observed
ES = +0.64 ES = +0.59 ES = +0.59
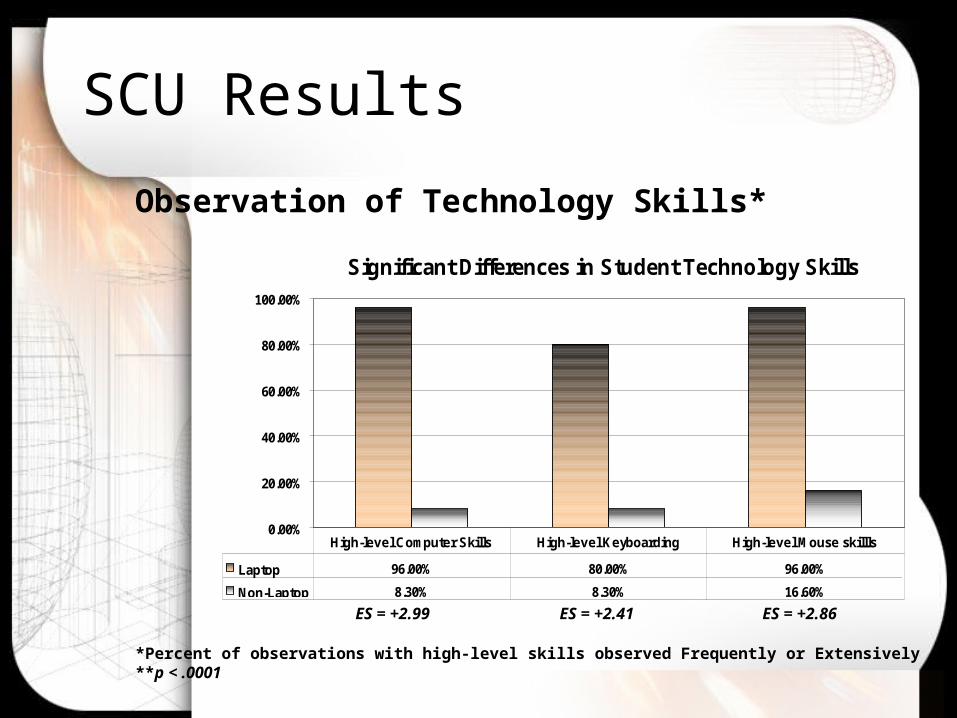
SCU Results
Significant Differences in Student Technology Skills
0.00%
20.00%
40.00%
60.00%
80.00%
100.00%
Laptop 96.00% 80.00% 96.00%
Non-Laptop 8.30% 8.30% 16.60%
High-level Computer Skills High-level Keyboarding High-level Mouse skillls
Observation of Technology Skills*
*Percent of observations with high-level skills observed Frequently or Extensively**p < .0001
ES = +2.99 ES = +2.41 ES = +2.86

SCU Results
Significant Difference** in Student Use of Word Processing for Creating Writing
0.00%
20.00%
40.00%
60.00%
Laptop 39.30%
Non Laptop 0.00%
Word Processing for Creative Writing
Observation of Computer Activities*
*Percent of observations with activity observed Frequently or Extensively**p < .003ES = +1.15

SCU Results
Significant Difference** in Student Use of Computers to Draw or Design a Layout
0.00%
20.00%
40.00%
Laptop 33.30%
Non Laptop 0.00%
Draw or Design Layout
Observation of Computer Activities*
*Percent of observations with activity observed Frequently or Extensively**p < .021ES = +0.85

SCU Results
Significant Difference in Student Use of Computers as Research Tool to Locate Resources
0.00%
20.00%
40.00%
60.00%
Laptop 49.40%
Non Laptop 9.19%
Computer as Research Tool
Observation of Computer Activities*
*Percent of observations with activity observed Frequently or Extensively**p < .017ES = +0.89

Writing Test Results
Significant Differences in Writing Scores
0.00
0.50
1.00
1.50
2.00
2.50
3.00
3.50
4.00
Fre
qu
ency
of
Ob
serv
atio
n
Laptop 3.34 3.15 3.12 3.12
Non-Laptop 2.71 2.65 2.53 2.65
Organization p < .003
Idea p < .004 Style p< .003Conventions p<
.018
Range 1 – 4; 4 = highest rating
ES = +0.78 ES = +0.75 ES = +0.76 ES = +0.61

In general~• Students felt positive that laptops:
– Increased computer skills– Increased Internet research skills
• Students were less certain that laptops: – Increased their interest in learning– Made them want to get better grades– Improved their writing– Made it easier for them to work with other students
• Use of laptop at home– Over half used laptop/Internet for completing
homework– More than half used laptop for “other things”
» most frequently cited were email/chat and games.
Laptop Student Survey Results
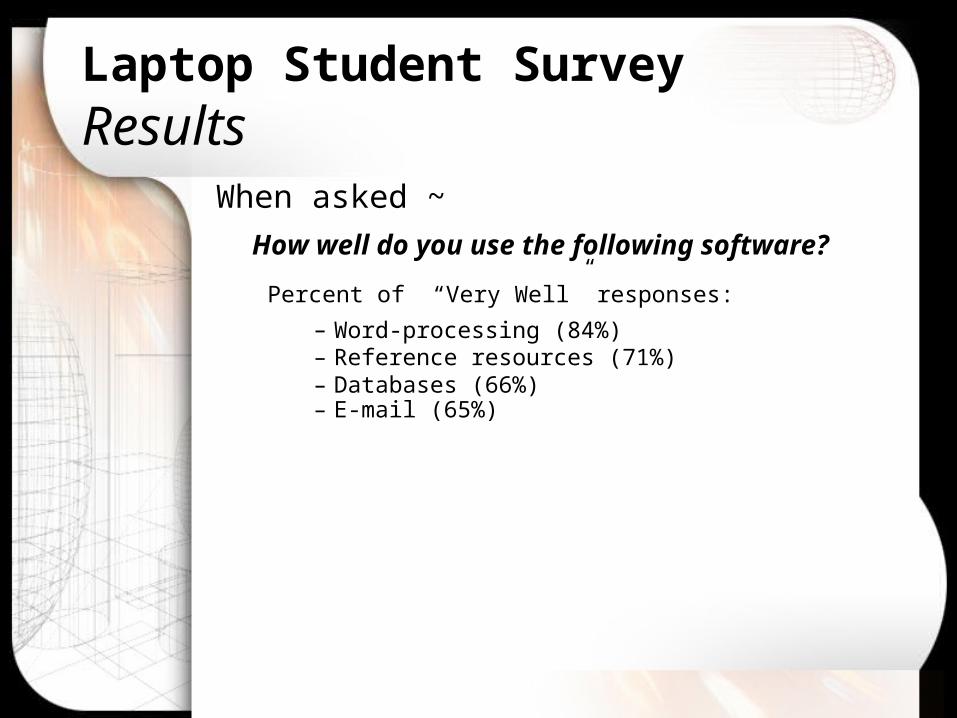
When asked ~
How well do you use the following software?
Percent of “Very Well” responses:
– Word-processing (84%)– Reference resources (71%)– Databases (66%)– E-mail (65%)
Laptop Student Survey Results

When asked ~What is the Best thing about having a laptop?
• helped them learn computer skills • helped with school assignments• provided access to the Internet• helped the students become more organized
What is the Hardest part of having the laptop?• it was difficult to keep track of • difficult to carry back and forth to school• technical problems (e.g., freezes, charging, slow)• using Microsoft Access• lacking sufficient computer skills.
Laptop Student Survey Results

Overall~ Results show that students were:
• Highly appreciative of having laptop computers
• Used laptop for a variety of learning activities both at school and at home
• Were more likely to experience benefits for the development of specific technology skills than for increasing interest in school and grades
Laptop Student Focus Group Results
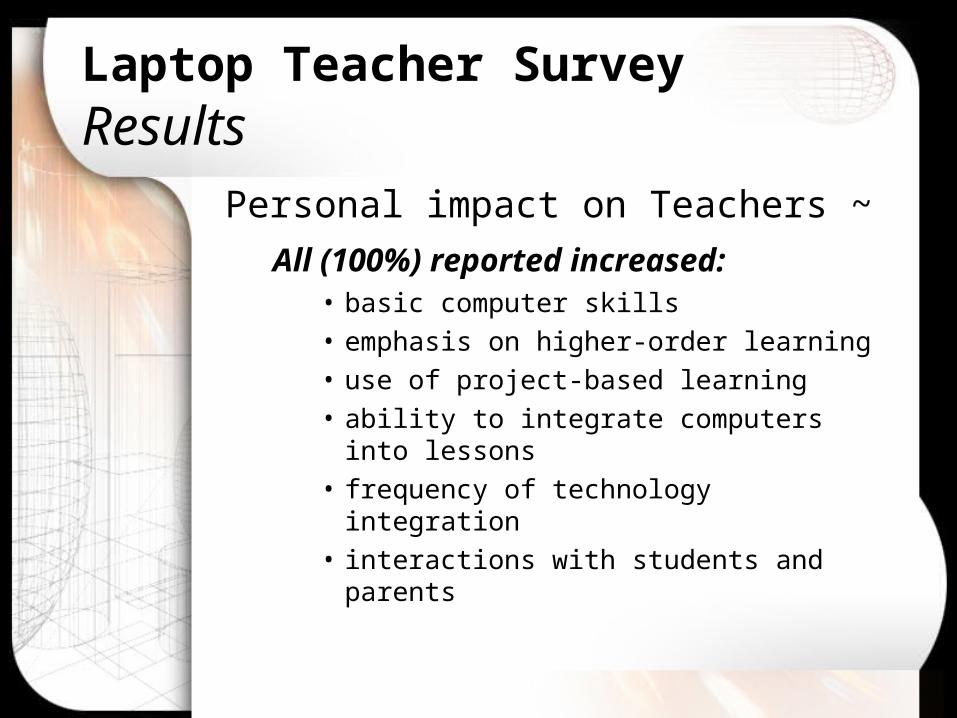
Personal impact on Teachers ~
All (100%) reported increased: • basic computer skills
• emphasis on higher-order learning
• use of project-based learning
• ability to integrate computers into lessons
• frequency of technology integration
• interactions with students and parents
Laptop Teacher Survey Results

Impact on Students ~All teachers (100%) believed
– that the program increased student interest in learning and research skills.
Over three-fourths
– indicated that students’ performance/grades and ability to work with other students increased.
About two-thirds
– also felt that student writing skills had increased.
Laptop Teacher Survey Results
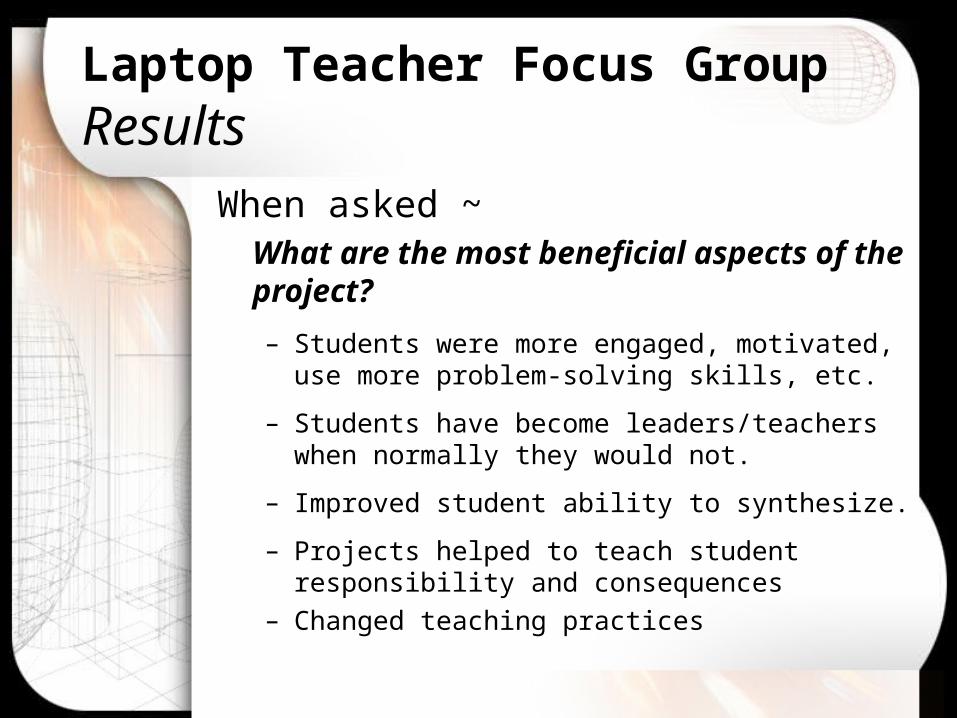
When asked ~What are the most beneficial aspects of the project?
– Students were more engaged, motivated, use more problem-solving skills, etc.
– Students have become leaders/teachers when normally they would not.
– Improved student ability to synthesize.
– Projects helped to teach student responsibility and consequences
– Changed teaching practices
Laptop Teacher Focus Group Results
Laptop Teacher Focus Group Results
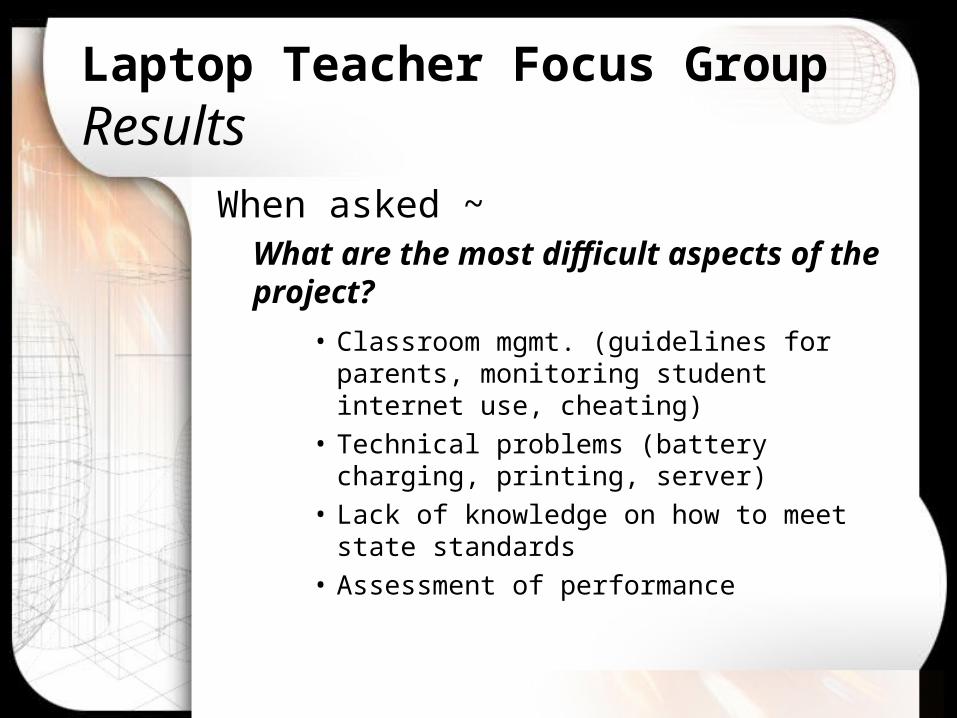
When asked ~What are the most difficult aspects of the project?
• Classroom mgmt. (guidelines for parents, monitoring student internet use, cheating)
• Technical problems (battery charging, printing, server)
• Lack of knowledge on how to meet state standards
• Assessment of performance
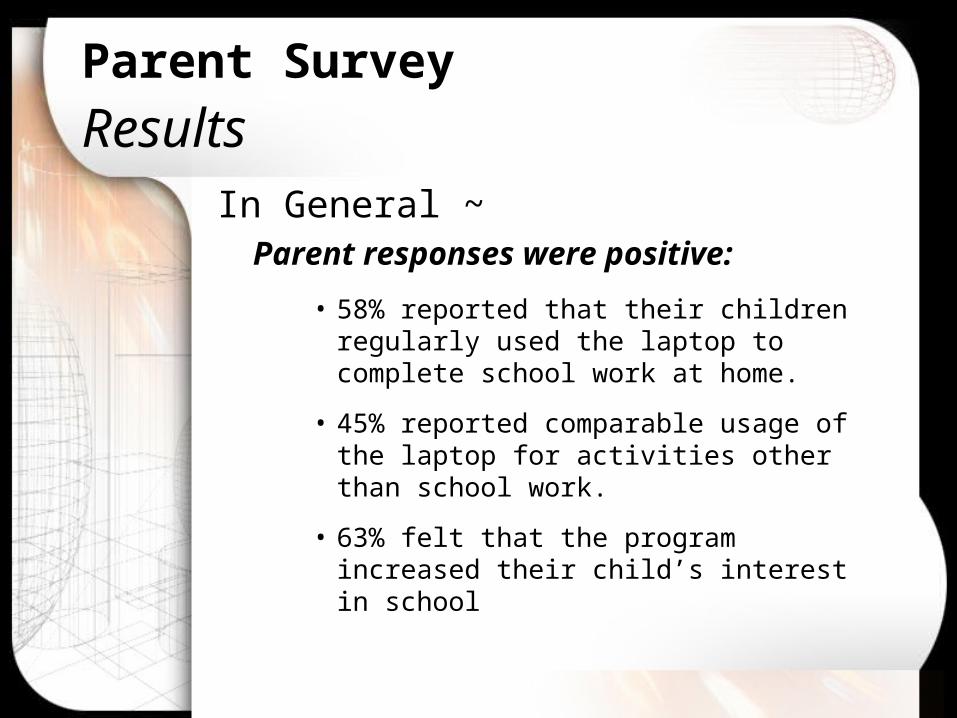
In General ~Parent responses were positive:
• 58% reported that their children regularly used the laptop to complete school work at home.
• 45% reported comparable usage of the laptop for activities other than school work.
• 63% felt that the program increased their child’s interest in school
Parent Survey Results
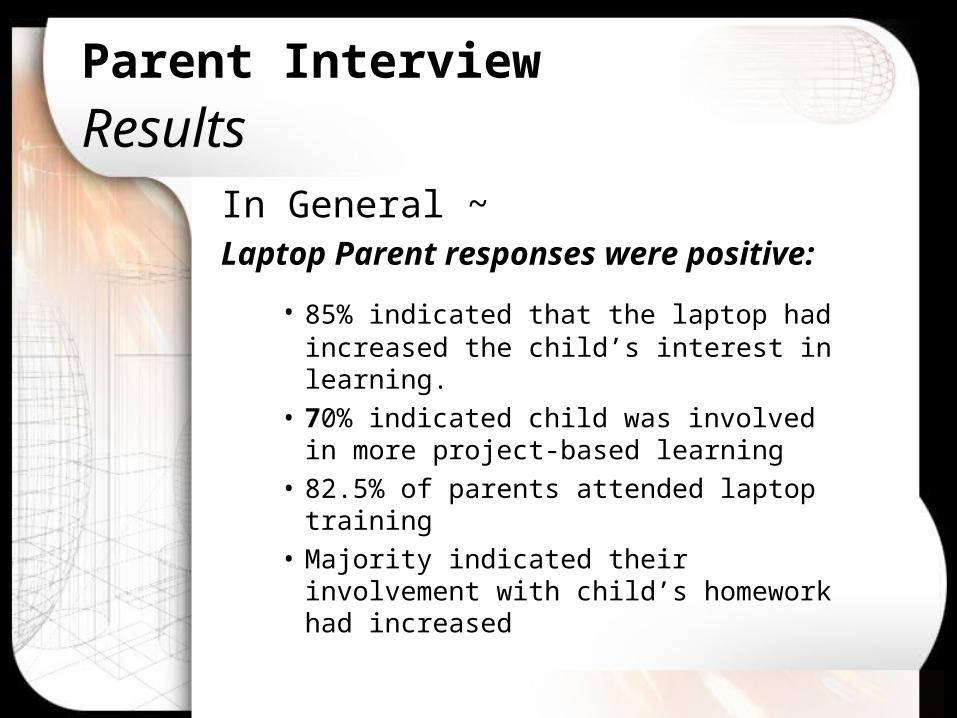
Parent Interview Results
In General ~Laptop Parent responses were positive:
• 85% indicated that the laptop had increased the child’s interest in learning.
• 70% indicated child was involved in more project-based learning
• 82.5% of parents attended laptop training
• Majority indicated their involvement with child’s homework had increased

Conclusions
Research Question 1Is teaching different in a laptop classroom?
– Laptop students were taught differently
• Teachers incorporated technology to a much greater degree
• Teachers tended to employ more student-centered strategies.
• Overall, the Laptop classes were “busier” and more active learning environments.

Conclusions
Research Question 2Do students behave differently in a laptop classroom?
– Laptop students were more active, autonomous, and collaborative in their classroom behaviors.
– Cooperative learning was observed “frequently” or “extensively” in 35% of the Laptop classes but in only 11% of the Control classes.
– Students frequently or extensively engaged in projects in 55% of the Laptop classes compared to only 17% of the Control classes.
Conclusions
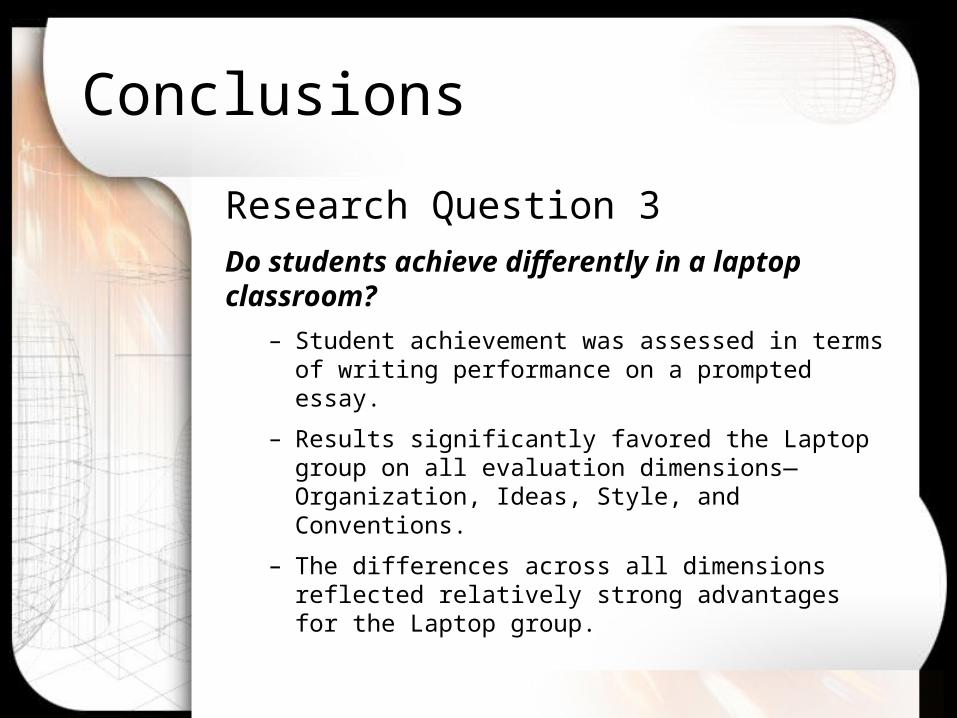
Research Question 3
Do students achieve differently in a laptop classroom?
– Student achievement was assessed in terms of writing performance on a prompted essay.
– Results significantly favored the Laptop group on all evaluation dimensions—Organization, Ideas, Style, and Conventions.
– The differences across all dimensions reflected relatively strong advantages for the Laptop group.
Summary
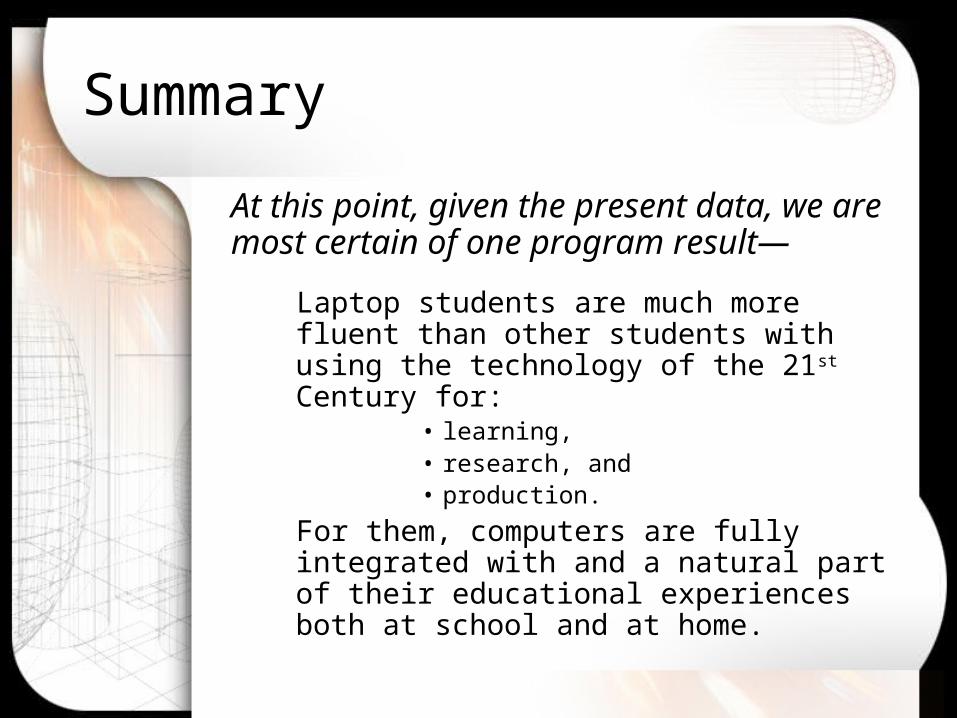
At this point, given the present data, we are most certain of one program result—
Laptop students are much more fluent than other students with using the technology of the 21st Century for:
• learning, • research, and • production.
For them, computers are fully integrated with and a natural part of their educational experiences both at school and at home.
Recommended