Evaluating the Effectiveness of EPA Voluntary Programs An
Examination of the Strategic Goals Program for Metal
Finishers
Keith Brouhle Charles Griffiths and Ann Wolverton
Working Paper Series
Working Paper 07-06 May 2007
US Environmental Protection Agency National Center for Environmental Economics 1200 Pennsylvania Avenue NW (MC 1809) Washington DC 20460 httpwwwepagoveconomics
Evaluating the Effectiveness of EPA Voluntary Programs An
Examination of the Strategic Goals Program for Metal Finishers
Keith Brouhle Charles Griffiths and Ann Wolverton
Correspondence
Keith Brouhle Department of Economics
Grinnell College 1210 Park Street
Grinnell IA 50112 brouhlekgrinnelledu
NCEE Working Paper Series
Working Paper 07-06 May 2007
DISCLAIMER
The views expressed in this paper are those of the author(s) and do not necessarily represent those of the US Environmental Protection Agency In addition although the research described in this paper may have been funded entirely or in part by the US Environmental Protection Agency it has not been subjected to the Agencys required peer and policy review No official Agency endorsement should be inferred
Evaluating the Effectiveness of EPA Voluntary Programs
An Examination of the Strategic Goals Program for Metal Finishers
Keith Brouhle (Grinnell College) Charles Griffiths (US EPA)
and Ann Wolverton (US EPA)
May 31 2007
Correspondence
Keith Brouhle Department of Economics
Grinnell College 1210 Park Street
Grinnell IA 50112 brouhlekgrinnelledu
The views in this paper are those of the authors and do not necessarily represent those of the US Environmental Protection Agency
Abstract
Voluntary approaches have become a popular in the US to enhance the efficacy and scope of existing
regulations and to reduce emissions in sectors or for pollutants where formal environmental regulation is
lacking In this paper we examine the effectiveness of a particular EPA voluntary program for the metal
finishing industry the Strategic Goals Program (SGP) The Strategic Goals Program is a good candidate
for evaluation because it had a credible regulatory threat at the time the program was implemented we
can measure both baseline emissions and progress towards explicit environmental goals and we have data
for participants and non-participants We look at the decision to participate in the SGP and also try to
determine what effect if any this program has had on the pollution profile of facilities In addition we
examine whether the voluntary program had any discernible impact on toxicity-weighted emissions
Finally we explore the possibility that we have a bimodal distribution in the sample caused by the
different motivations of facilities to join a voluntary program A number of factors influence a firmrsquos
decision to participate in SGP including trade group membership However we do not find robust
evidence that SGP participation has had a significant impact on emission reductions This result
continues to hold when we adjust emissions to account for toxicity Our measure of the threat of
regulation is correlated with emission reductions for both participants and non-participants
Key Words voluntary approaches program effectiveness air emissions
Subject Areas 52 (Environmental Policy) 18 (Pollution Control Options and Economic Incentives)
2
11 Introduction
Environmental policies in the US have always strived to provide adequate environmental protection to
individuals Increasingly regulators have sought to provide that protection at the lowest possible cost
This has led to the use of more flexible market-based and voluntary approaches to augment traditional
command-and-control regulatory approaches Voluntary approaches in particular have become
increasingly popular in the US as a way to enhance the efficacy and scope of existing regulations and to
reduce emissions in sectors or for pollutants where formal environmental regulation is lacking In this
paper we examine the effectiveness of voluntary approaches by focusing on a particular EPA program in
the metal finishing industry the Strategic Goals Program (SGP) We examine the decisions of facilities
to participate in the program and the impact of the program on facilitiesrsquo emissions reductions
Since the introduction of EPArsquos first voluntary program in 1991 the 3350 program there has been a
large increase in the number of voluntary programs used to address environmental issues in the US
There are currently over 50 voluntary programs administered by the EPA at the federal level and
countless more exist at the state and local levels (Brouhle Griffths and Wolverton 2005) The literature
posits a variety of reasons why firms may join voluntary programs Voluntary programs may allow firms
to reduce costs2 (Blackman and Boyd 2002) andor improve their environmental reputation with ldquogreenrdquo
consumers and investors (Arora and Gangopadyay 1995 Arora and Cason 1996 Khanna and Damon
1999) A more cynical view argues that firms may join voluntary agreements to provide a smokescreen
for poor environmental performance (Harrison 1999) or to forestall or influence future regulations
(Maxwell et al 2000 Lutz et al 2000) From the EPArsquos perspective voluntary programs can often
achieve environmental objectives ldquomore quickly and with lower costs than would be the case with
regulatory approachesrdquo (Sunnevag 2000) Lower costs are said to arise from the flexibility that voluntary
agreements provide to firms These policies may also be welfare enhancing if they lead to greater levels
of innovation (Wallace 1995) Alberini and Segerson (2002) demonstrate theoretically that a credible
regulatory threat and reliable monitoring of progress towards an environmental goal increases the
effectiveness of a voluntary approach Alternatively some argue that voluntary agreements allow the
1 For generously sharing their time resources and thoughts we thank Robin Kime Bob Benson and George Cushnie For offering useful comments and suggestions we thank Sarah Stafford Paul Isely Hui Li Jay Shimshack and participants of the 2005 Heartland Environmental and Resource Economics Workshop 2 Lower costs may arise directly from the program (eg the use of energy efficient lighting in Green Lights) or indirectly through other channels (eg a voluntary agreement that reduces a firms environmental risk may lower insurance premiums) Environmentally-friendly firms may also find it easier to raise capital if environmental performance results in higher stock market valuations (Hamilton 1995 Konar and Cohen 2001)
3
EPA to expand its bureaucracy and oversight to new areas of environmental protection (Maxwell and
Lyon 1999)
While there has been vigorous debate as to why voluntary agreements are used and their potential
advantages over traditional policy tools evidence on their effectiveness is limited and mixed Part of this
stems from the difficulty in evaluating voluntary programs Since voluntary agreements often target
broad environmental issues it is sometimes difficult to find a measurable environmental output to gauge
success 3 A more substantive difficulty in evaluating the environmental effectiveness of voluntary
programs is establishing a proper baseline from which to measure environmental improvements Critics
often argue that voluntary programs represent nothing more than a business-as-usual scenario4 Bizer
(1999) argues that the flexibility offered to firms as part of voluntary programs often results in failure to
achieve the environmental goals
In spite of these difficulties a number of papers have investigated the environmental effectiveness of
voluntary programs Khanna and Damon (1999) show that while the 3350 program did not reach EPAs
goal of a 33 percent reduction in toxic emissions by 1992 and a 50 percent reduction by 1995 it did
encourage participants to reduce their pollution more than non-participants GAO (1994) reports that of
the reductions EPA counts as progress towards the emissions reduction goals of the 3350 program 25
percent were from non-participants and 40 percent took place before the program was established (Davies
et al (1996) show similar findings)
GAO (1997) examines four EPA voluntary climate change programs including Green Lights but relies
on EPA reported results and interviews of select participants to reach its conclusions The GAO study
suggests that there is reason to believe that at least some of the lighting upgrades undertaken by
participants were due to non-program factors Horowitz (2004) finds that the Green Lights program
successfully promoted energy efficiency and resulted in a substantial decrease of carbon emissions
Morgenstern and Al-Jurf (1999) find that the Green Lights and 3350 programs resulted in much more
modest emission reductions than what regulators often claim Studies of other voluntary programs find
3 For example the Design for the Environment program encourages firms to incorporate environmental considerations directly into the design of their products This goal makes it difficult to identify a measurable environmental output with which to evaluate the program 4 There is evidence that this is sometimes the case For example the Joint Declaration of the German Industry on Climate Protection pledged a 20 reduction in energy consumption by 2005 This translated into an annual reduction of only 13 whereas the industry had reduced emissions by 23 annually in the years 1970-1993 (OECD 1999) The 3350 program also faced criticism when it claimed that it had achieved its goal of a 50 reduction in toxic emissions in 1995 when firms had started reducing pollution prior to the implementation of the program (Khanna and Damon 1999)
4
different outcomes King and Lenox (2000) and Welch et al (2000) report that Responsible Care and
ClimateWise did not result in firms improving their environmental performance relative to others In fact
there is evidence that participants in both programs actually performed worse than non-participants
Given the lack of consensus on the environmental effectiveness of voluntary programs it is important to
examine other programs in an attempt to identify features of a successful program We select the
Strategic Goals Program (SGP) a voluntary program in the metal finishing industry to evaluate in this
regard Several program characteristics make this program especially relevant for evaluation First
unlike broad-based voluntary programs evaluated in the past (eg 3350 or Green Lights) the Strategic
Goals Program is a sector-based program5 Second the SGP had a credible regulatory threat at the time
the program was implemented which allows us to assess the role of a traditional regulatory threat in
tandem with this voluntary approach Third the SGP allows for the measurement of both baseline
emissions and progress towards explicit environmental goals Fourth we have data for both participants
and non-participants allowing us to evaluate whether the SGP program had a noticeable impact on
participant emissions
Similar to other papers in the literature that evaluate a particular voluntary program we look at the
decision to participate in the SGP and also try to determine what effect if any this program has had on
the pollution profile of facilities While adopting a similar approach this study differs from many other
studies of voluntary programs in several important ways First we explicitly test whether the
participation decision is endogeneous to subsequent emission reduction decisions Past studies have
assumed that this is the case and have used an instrumental variable approach when including
participation in the emission equation Second in addition to quantifying the effect of the SGP on
facilitiesrsquo decisions of how many pounds to emit we also examine whether the voluntary program had
any discernible impact on toxicity-weighted emissions which are more closely linked to the effects such
emissions have on human health and the environment Finally we explore the possibility that we have a
bimodal distribution in the sample caused by the different motivations of facilities to join a voluntary
program Some facilities may join a voluntary program in good faith as a way to reduce costs or improve
their environmental reputation and hence their market share Other facilities however may find a
voluntary program appealing as a smokescreen for poor environmental performance To explore this
5 The SGP formally ended in 2002 In 2003 the EPA introduced its Sector Strategies Program in which the Agency establishes a relationship with industry stakeholders and promotes regulatory changes environmental management systems and compliance assistance based upon the specific needs of the sector (Federal Register 2003) Currently there are twelve sectors in this program including the metal finishing industry The metal finishing Sector Strategies Program is not the same as the SGP but it is based partly on the lessons learned during the SGP
5
possibility we split our sample based upon the size of a facilityrsquos emissions to see if we gain a better
understanding of the factors driving the participation decision when we examine the two groups
separately
The paper is organized as follows Section 2 describes the SGP in some detail Section 3 presents the
empirical model Our data and the variables used in the empirical analysis are explained in section 4
Summary statistics are presented in section 5 Results are presented in section 6 Section 7 concludes
2 Metal Finishing Strategic Goals Program
The origin of the EPArsquos Strategic Goals Program (SGP) can be traced to the Common Sense Initiative
Launched in 1994 the Common Sense Initiative aimed to achieve environmental improvements by giving
firms flexibility and incentives to meet regulatory goals (US EPA 1997) Rather than relying on strict
guidelines and command-and-control regulations for specific media (eg air land or water) the premise
of the initiative was that firms would find innovative ways to reduce their environmental impacts if they
were given flexibility to address pollution control in a more holistic fashion The appeal of flexible
voluntary efforts to reduce environmental pollution was further enhanced when the metal finishing
industry came under the threat of new regulation First introduced in 1995 the Effluent Limitations
Guidelines and New Source Performance Standards for the Metal Products and Machinery Point Source
Category (referred to as the MPampM regulation) sought to impose strict new effluent guidelines and
pretreatment standards for wastewater discharges from metal products and machinery facilities6 With
this and other threatened regulations in the background the SGP was launched for the metal finishing
industry in 1998 by the EPA in cooperation with a number of industry trade organizations7 Within a
year the program had over two hundred and fifty participants By the programrsquos conclusion in 2002 five
hundred and fifty facilities had joined the SGP with most new participants joining in 2000 or after
The Strategic Goals Program encouraged companies ldquoto go beyond environmental compliancerdquo (see SGP
Website) by establishing seven specific goals
6 Note that the final version of the MPampM regulation signed in 2003 exempted the metal finishing industry Although the industry is not subject to the stricter guidelines the regulatory threat did exist in the period we study An indicator of the severity of this threat is that the exclusion of the metal finishing industry in the final version of the rule was hailed as ldquothe achievement of a generationrdquo by the National Association of Metal Finishers 7 The SGP was founded in cooperation with the National Association of Metal Finishers (NAMF) American Electroplaters and Surface Finishers Society (AESF) Metal Finishing Suppliers Association (MFSA) and Surface Finishing Industry Council (SFIC)
6
bull 50 reduction in water usage
bull 25 reduction in energy use
bull 90 reduction in organic TRI releases
bull 50 reduction in metals released to water and air (as reported to TRI)
bull 50 reduction in land disposal of hazardous sludge
bull 98 metals utilization
bull Reduction in human exposure to toxic materials in the facility and surrounding community8
Facilities that joined the SGP committed to accomplishing these goals by 2002 The achievement of these
goals was measured against a 1992 baseline When facilities joined the SGP they were asked to estimate
their baseline emissions using an alternate year if 1992 data were unavailable
To encourage facilities to join and to help them meet the seven program goals the SGP offered
participants a number of resources The SGP established the National Metal Finishing Resource Center
(NMFRC) to act as a clearinghouse of technical information and a place where firms could seek
assistance in improving their environmental performance The NMFRC collected annual surveys to track
the environmental performance of SGP members determined if facilities had met any or all of the above
goals and provided online access to a feature that compares a firms performance to the performance of
other firms that belong to the SGP9 By identifying areas where facilities scored poorly the hope was that
firms would learn where to focus their efforts to improve in the future The SGP also offered free non-
regulatory environmental audits on-site technical assistance funding for environmental technologies free
workshops on energy water and waste reduction environmental management system (EMS) training and
free interns to help firms fill out paperwork associated with the program
The Strategic Goals Program is a good candidate for assessing the environmental effectiveness of
voluntary programs First the agreement was implemented when the industry faced a credible regulatory
threat (ie the MPampM regulation) which may have encouraged real efforts by firms to improve their
performance Second the program set explicit targets designed to discourage firms from simply
providing lip-service to environmental efforts Third the annual reporting and environmental
performance comparison of pollution levels allowed firms to monitor their progress relative to a baseline
and to identify areas for improvement And finally the SGP established an independent third party
8 Activities to reduce human exposure to toxic materials include pollution prevention chemical substitution employee training in environmental hazards and local emergency planning committees 9 These data are not shared with the US EPA in a way that allows for facility identification
7
organization (ie NMFRC) to provide technical assistance and information to firms We seek to answer
the following questions with regard to the SGP
bull What factors affected a facilityrsquos decision to participate in the SGP voluntary program
bull What factors affected facility TRI air emissions - explicitly targeted for reduction by the SGP ndash
and did the SGP play a role in affecting those emissions
bull Did the SGP make progress in reducing human exposure to toxic materials also an explicit goal
of the program
bull Do low and high emitters view the SGP participation decision similarly
3 Empirical Model
To the extent that firms derive some net benefit from a voluntary program they will join The extent to
which this translates into real behavioral change (ie reductions in emissions) must also be directly
associated with the derivation of positive net benefits since firms will incur additional costs to make
these changes We present a modeling framework in this section to examine factors associated with the
decision to join and with emissions changes
First we separately model the facilitys net benefit from participation Dit in the voluntary program
D = β X + ε (1) it 1 1it 1it
where X1it is a vector of exogenous variables for the ith firm at time t β1 is a vector of parameters and
ε1it is a random error term Since the net benefits of participating Dit are not observed we proxy for
this with the observed participation decision of the facility Dit
D = 1 if D gt 0it it (2)
= 0 otherwise
This allows us to estimate
D = F (β X )+ micro (3) it 1 1it it
If F(middot) is the cumulative distribution of the standard normal variate ε1it then equation (3) can be
estimated using the probit model
8
Next we characterize the pollution level of facility i at time t as
Y = αD + β X + ε (4) it it 2 2it 2it
where Yit represents the level of pollution Dit represents participation in the SGP X2it represents a vector
of exogenous facility-specific variables α is a parameter β 2 is a vector of parameters and ε 2it is a
random error term
Pollution levels at a single point in time however are not helpful in measuring the programrsquos impact on
facility behavior Other studies such as Khanna and Damon (1999) resolve this issue by using a panel
dataset Due to data constraints with respect to many of the variables we are unable to construct a panel
dataset This means that our results focus on long term program impacts that is we examine how the
program affected emissions over the entirety of its existence
To examine whether the Strategic Goals Program affected facility emission behavior we examine how
pollution levels change over the time period for which the SGP was in place controlling for other factors
ΔY = αΔD + β ΔX + Δε (5) it it 2 2it 2it
where Δ is the change in the variable between time period t and t-1 Estimation of equation (5) may lead
to biased estimates if the participation variable Dit is not exogenous Facilities that receive the most
benefits from the SGP ndash be that cover from regulatory threat or increased flexibility in reducing emissions
ndash may also be the most likely to join the program We test for this bias and consider using an
instrumental variable approach instead of letting participation directly enter equation (5) To implement
the instrument approach we first separately estimate the participation decision in equation (3) using a
probabilistic choice model to obtain consistent estimates of β1 We then estimate the predicted probability
ˆ ˆof participation Dit = F (β1 X1it ) Finally we use this predicted probability of participation as an
instrument in estimating equation (5) Note the final estimates of α and β 2 are consistent (see Hartman
1988 Khanna and Damon 1999 Welch et al 2000)
9
4 Data
To evaluate the SGP we create a unique dataset from a variety of sources including several from EPA
the Toxic Releases Inventory (TRI)10 the Enforcement and Compliance History Online (ECHO) and the
Resource Conservation and Recovery Act Information database (RCRIS) We limit our study to facilities
reporting emissions to TRI in the metal finishing industry (SIC codes 3471) in the continental United
States Because chemicals are added and deleted from the TRI reporting requirements over time we only
retain observations for chemicals required to annually report to the TRI over the entire study period
Since two of the SGPrsquos seven goals relate directly to TRI emissions (90 reduction in organic TRI
releases and 50 reduction in metals released to water and air) these data should provide a useful
measure of the relative progress of members and non-members towards the voluntary programrsquos goals
Since these databases do not have common facility identifiers we matched the data using both name-
address combinations and name-city-state combinations We then identified unsuccessful matches
checked discrepancies using EPArsquos Envirofacts11 and matched by hand those with spelling errors or other
inconsistencies To these data we have added information on the attainment status for a facilityrsquos county
information on participation in other voluntary agreements information on SGP and trade group
participation state-level dues and contributions to environmental organizations an index of regulatory
stringency based on Levinson (2001) socioeconomic characteristics of the surrounding neighborhoods12
and facility-specific economic information from InfoUSA We have dropped facilities that were late
joiners of the program in 2000 or 2001 since there may have been insufficient time to achieve significant
changes in behavior before the program ended in 2002 In total we have 201 facilities in our data set 65
of which are SGP members Our sample of SGP participants represents approximately 25 of the total
SGP population that signed up to participate prior to 2000
4A Variables
We estimate two regression equations one that examines what factors affect a facilityrsquos participation in
the SGP and one that examines what factors affect a facilityrsquos emissions behavior The dependent
10 Facilities that have fewer than 10 full-time employees manufacture less than 25000 pounds of emissions of a listed chemical or use less than 10000 pounds of a listed chemical do not have to report to the TRI While the metal finishing industry is mostly comprised of small establishments ndash 50 have less than 10 employees according to US Census - there are more than 500 facilities that report to the TRI in a given year 11 Envirofacts contains facility information such as alternate names and addresses for a given facility that can be used to successfully match discrepancies between databases 12 The socioeconomic data originally comes from the US Census of Population and Housing We take these data from EPArsquos ECHO database which has matched the data to a 3 mile radius around each TRI facility
10
variable for the participation equation is defined as SGP which equals 1 if the facility joined the SGP and
0 otherwise The dependent variable for the emissions equation compares average air emissions in two
sets of years prior to the start of the SGP and just after the end of the program13 Specifically we create a
variable called REDUCTION IN TRI EMISSIONS which is defined at the facility level as the difference
between the log of the average total TRI air emissions in 2002-2003 and the log of average total TRI air
emissions in 1995-1996 We also define the dependent variable in terms of point air emissions which
allows us to examine the robustness of our results We do not rely on the difference between single-year
emissions (eg 2003 ndash 1996) for the dependent variable because we want to limit the impact of year-toshy
year fluctuations in emissions that may result from changes in estimation techniques and reporting errors
(US EPA 2002)
As highlighted in equation (5) of the empirical model the emissions regression includes as an
independent variable a measure of SGP participation We include the predicted probability of joining the
SGP as an instrument for participation Because many factors that affect a facilitys net benefits from
joining the SGP also affect its emissions the vectors X1it and X2it may contain many of the same
explanatory variables The predicted probability of joining the SGP will help separate out the effects of
these variables on participation and emissions behavior We characterize the independent variables
affecting participation and emissions into four categories program motivation regulatory environment
community and environmental pressures and firm and facility-specific characteristics Table 1 lists all of
the variables and indicates in which equation they appear
1 Program Motivation
Firms may demonstrate a different propensity to join and to reduce emissions based on the relative
cleanliness of their facilities Facilities that are relatively clean may be more dedicated to environmental
goals and therefore more likely to join the program and to subsequently reduce emissions Alternatively
relatively dirty facilities may join the program to gain an enhanced reputation by associating themselves
with an environmental program without necessarily changing their behavior drastically To capture these
possible effects we include TOTAL TRI RELEASES defined as the log of total air emissions in 1996 in
both the participation and emission reductions equations14 Participation in the SGP may also depend on
the ease in which a facility can meet program goals Recall that the SGP allows facilities to benchmark
13 We considered broadening our use of TRI emissions to include both total air and surface water emissions However surface water emissions are non-zero in relatively few cases For instance 89 of the facilities in our dataset reported zero surface water emissions in 1995 while 95 reported 10 or fewer pounds of emissions The correlation coefficient between total air and surface water emissions is 099 14 When we use point air emissions for the dependent variable we define these variables as point air emissions
11
pollution to 1992 levels rather than to the level of pollution at the time the facility joined the program
Thus facilities that had already made reductions could join and with little change in behavior point to
progress toward SGP goals We create a variable PRIOR REDUCTIONS to measure the reductions in
releases prior to the start of the program Specifically we measure the difference between the log of 1996
air emissions and the log of 1993 total air emissions15 We include this variable only in the SGP
participation equation16
2 Regulatory Environment
Differences in the regulatory environment facilities face also may affect decisions about whether to
participate in the SGP and how much to reduce emissions The existing literature emphasizes the
importance of a regulatory threat to encourage firms to take real environmental actions (Segerson and
Micelli 1998 Khanna et al 1998 Henriques and Sadorsky 1996 Welch et al 2000) The MPampM
regulation acted as a viable potential regulation during this time period The regulation was first
proposed in 1995 and proposed again in revised form in 2001 While the MPampM rule pertains to water
effluent discharges air emissions are often generated through the same processes from the use of
solvents acids and metals used as inputs in surface preparation plating and finishing To the extent that
facilities look for ways to reduce wastewater discharges through input substitution pollution prevention
or metal recovery processes they also are likely to reduce air emissions To capture the effect of
potentially stricter levels of regulation on the propensity to join we calculate the proportion of a firmrsquos
total 1996 TRI air emissions subject to the 1995 proposed MPampM rule MPampM RELEASES TO TOTAL
RELEASES ranges from zero to one with higher values indicating facilities that were affected more by the
proposed regulation For the emissions equation we define CHANGE IN MPampM TO TOTAL RELEASES
as the difference between the proportion of total releases in 2002-03 subject to the 1995 and 2001
proposed MPampM rules and the proportion of total releases subject to these rules in 1995-96 Negative
values indicate that a greater proportion of emissions changes occurred in chemicals that were under
threat of regulation
15 We explored defining this as the difference in 1992 and 1996 emissions but we want to balance missing observations in the early years of the TRI with the ability to capture past emissions behavior and previous reductions that count as progress in the SGP (since the baseline is 1992) There are a number of possible ways to treat facilities with missing emissions data for 1993 (1) assume that emissions are 0 (this assumes that if they fall below the threshold emissions are likely to be small) (2) assume emissions in 1993 were similar to average emissions for 1994 and 1995 (this assumes no production changes that would have affected emissions) or (3) drop the observations We explore options (1) and (3) in this analysis 16 Khanna and Damon (1999) also do not include prior reductions in the emissions equation
12
Facilities may experience different levels of regulatory oversight given their past environmental
performance Facilities that have been out of compliance with environmental regulations may have an
incentive to improve environmental performance to remove themselves from EPA scrutiny From the
RCRIS database we use several measures of non-compliance For the participation equation we use two
variables to represent the five year enforcement history prior to the beginning of the SGP PENALTY
HISTORY which is the log of the total assessed penalties between 1992 and 1996 and VIOLATION
HISTORY which is total number of violations between 1992 and 1996 17 For the emissions equation we
use TOTAL PENALTIES the log of all financial penalties imposed in 1995 and 1996 and TOTAL
INSPECTIONS the total number of RCRA inspections in 1995 and 1996 as representative of a typical
amount of regulatory attention received by the facility in any two-year time period We do not use
changes in penalty amounts or inspections over time in the emissions equation since they are likely to be
endogeneous with changes in emissions
Finally firms may differ in their regulatory environment due to the location of their facility We capture
differences in the regulatory environment of a given location through the countyrsquos attainment status with
the National Ambient Air Quality Standard for SO2 and the stringency of state regulations The variable
NON-ATTAINMENT is a dummy variable that indicates whether a facility is located in a county out-ofshy
attainment with federally mandated levels for sulfur dioxide air emissions Counties in non-attainment
face greater scrutiny and are required to implement specific plans and regulations to work toward
compliance in the future For the participation equation this dummy variable is equal to 1 if the county in
which the facility is located has been in non-attainment for SO2 in the years prior (1992 ndash 1996) to the
beginning of the SGP For the emissions equation we use CHANGE IN NON-ATTAINMENT equal to 1
if a countyrsquos attainment status has changed between 1996 and 2002 Note that no county that was in
attainment in 1992 went out of attainment in later years However a noticeable number of counties have
gone from non-attainment to attainment status18 The overall regulatory pressure at the state level is
captured by the variable STATE REGULATIONS This index comes from Levinson (2001) and captures
the relative stringency of environmental regulations across states Levinson proxies for the stringency of
state regulations by comparing the actual expenditure on pollution abatement in a given state to the
predicted expenditure on pollution abatement given the industrial mix of the state He assumes that actual
costs greater than predicted costs are the result of stricter regulations in the state This index is only
17 RCRIS also has a measure of the total number of inspections and total number of enforcement actions Both of these variables are highly correlated with the total number of violations The literature is not clear about which of these might be a better measure of past enforcement behavior 18 For instance in 1996 29 facilities were located in counties out-of-attainment for sulfur dioxide In 2003 20 were in non-attainment counties
13
available at the beginning of our study period for the period from 1991-1993 It is therefore only
included in the participation equation We define a set of location dummy variables to capture other
statewide differences that may contribute to differences in participation rates or in changes in emissions
for facilities in a state with a large concentration of metal finishing facilities (IL TX CA OH and MI)
3 CommunityEnvironmental Pressure
In addition to facing regulatory pressures that vary by location firms also face different community and
environmental pressures To capture potential differences in community pressure we use two
demographic characteristics from ECHO (based on US Census of Population and Housing) PERCENT
MINORITY and POPULATION DENSITY (defined as the log of population density) in a three mile
radius around the facility We also include a third demographic variable AFFLUENT a dummy variable
from InfoUSA that indicates whether a facility is located in an affluent neighborhood The environmental
justice literature argues that hazardous waste facilities are located in communities that are poorer have
more minorities and are less dense (Boer et al 1997 Goldman and Fitton 1994) In addition to
including these variables Hamilton (1993 1995) shows that firms which handle hazardous waste
consider the potential for political action in a given community in their expansion decisions Therefore
we also measure the environmental pressure that a facility may face using the total dues and contributions
to environmental organizations by state collected annually by the National Center for Charitable Statistics
of the Urban Institute For the participation equation we use ENV GROUP CONTRIBUTIONS the log of
environmental dues and contributions in 1996 For the emissions equation we use the CHANGE IN ENV
GROUP CONTRIBUTIONS which is the difference in the log of total dues and contributions in 2001 (the
last year for which we have these data) and 1996
4 Facility and firm-specific characteristics
Firm and facility-specific characteristics make up the fourth set of variables that may influence either a
facilitys decision to join the SGP or its emissions behavior Since the SGP was launched with the support
of the National Association of Metal Finishers we expect that member firms of this trade organization are
more familiar with the program and hence more likely to join Also to the extent that poor environmental
performance by a subset of firms casts a negative image on the industry as a whole trade association
groups have a significant interest in promoting the voluntary program (King Lenox and Barnett 2001)
We therefore identify whether the firm belongs to the National Association of Metal Finishers with the
dummy variable NAMF19 We also identify firms that belong to the 3350 program Energy Star or
19 The list of firms that belong to NAMF is available on its website wwwnamforg
14
WasteWise with the dummy variable OTHER VAS Participating in one voluntary program may lead to
participation in others (Arora and Cason 1996 Alberini and Videras 2000) To the extent that exposure
to other voluntary agreements changes a facilityrsquos perception and actions with respect to the SGP it also
may be a relevant factor in explaining emissions behavior
Other facility-specific information such as size production level and technology are no doubt important
in predicting environmental behavior For instance larger facilities may be more visible and hence under
more pressure from consumers shareholders and regulators (Arora and Cason 1996 Welch et al 2000)
or they may be more environmentally responsive if economies of scale exist in implementing
environmental protection activities (Dasgupta et al 2000) Unfortunately these factors are also the most
difficult factors to measure Since most firms in the metal finishing industry are private companies
financial data are often not available From InfoUSA we include EMPLOYEE SIZE the log of the
number of employees at the facility and PUBLIC a dummy variable that indicates whether a facility is
publicly or privately held
5 Summary Statistics
According to the US Census of Manufacturers there were 3399 establishments in the metal finishing
industry (SIC code 3471) in 1997 Of these 771 facilities submitted full reports to the TRI in 1996 Our
sample consists of 201 metal finishing facilities throughout the United States or 26 percent of those that
reported to the TRI in 1996 These facilities met a number of criteria (1) they were present in other
datasets we utilized for the study and (2) the facilities reported to the TRI in all study years (ie 1995
1996 2002 and 2003) The facilities in our sample are located in 40 of 48 states However five states shy
Illinois California Michigan Ohio and Texas ndash account for 48 of the facilities in our sample Data
from the US Census of Manufacturers confirm that this distribution is representative of the industry as a
whole (Approximately 47 of the industry is located in one of these five states)
Total air emissions for metal finishers reporting to TRI have declined over the study period In 1995 and
1996 total air emissions were approximately 23 million pounds with 88 percent of emissions coming
from point sources Total air emissions from metal finishers decreased to a little over 1 million pounds by
2003 a 52 percent decrease from 1995 reported emissions SGP participants experienced a more
moderate decline in emissions over the same time period Facilities that belong to the SGP emitted
225000 pounds in 1995 By 2003 emissions had declined to 210000 pounds a mere 7 percent decline
in total air emissions The SGP goal for organic TRI releases was a 90 reduction from 1992 releases If
15
we examine the change in emissions from prior to the start of the program we find that emissions for
SGP members have actually increased overall between 1993 and 2003
The summary statistics presented in Table 2 shed light on one possible reason why SGP participants did
not see as great a decline in emissions as the industry as a whole SGP members emit far less air
pollution than the industry average This is true across the entire study period In 1995 SGP members
emitted an average of 3464 pounds into the air Non-participants had average emissions more than four
times that amount By 2003 SGP members decreased average emissions to 3214 pounds a small
decrease While non-participants saw a vastly greater decline in average emissions over the same time
period (a 57 decrease between 1995 and 2003) their 2003 emissions were still twice the average
emissions of SGP participants There also appears to be less variance in SGP participant emissions than
there is for non-participants This is confirmed when we calculate the coefficient of variation for SGP
and non-SGP facilities (see Table 3) In each year the coefficient of variation is substantially smaller for
the SGP facilities than it is for the non-SGP facilities
Table 4 presents summary statistics for the continuous independent variables in the participation and
emissions equations Note the following trends As already mentioned we see that the average amount
of pollution emitted prior to the SGP from 1993-1996 increased slightly for SGP participants and
decreased slightly for non-participants SGP participants also tend to have lower penalties but almost the
same number of violations as non-participants on average SGP participants tend to have fewer
employees than non-SGP participants They tend to be located in states where environmental groups
receive greater dues and contributions than do other facilities Finally SGP participants tend to have a
higher proportion of releases that stem from MPampM chemicals While both participants and nonshy
participants have tended to decrease the proportion of their releases subject to the MPampM rule
participants decreased this proportion by about 5 on average while non-participants decreased this
proportion by 1 on average We do not identify any sizable differences in means between SGP
participants and non-participants for the other variables
Table 5 presents summary statistics for the independent dummy variables We see that a higher percent
of SGP participants are in counties that are in non-attainment prior to joining the SGP However there is
little difference in the percent of participants and non-participants in counties that have gone back into
attainment over the study period SGP participants are also more likely to be members of the professional
organization NAMF to belong to other voluntary agreements and to be privately-held facilities Finally
more SGP participants than non-participants are located in affluent neighborhoods
16
6 Results
We present results from several sets of regressions in this section that are designed to address four
questions Section 6A seeks to answer the question of what factors affected a facilityrsquos decision to
participate in the SGP voluntary program Section 6B addresses the question what factors affected
facility TRI air emissions - explicitly targeted for reduction by the SGP ndash and did the SGP play a role in
affecting those emissions Section 6C presents results that address the question of whether or not SGP
made progress in reducing human exposure to toxic materials also an explicit goal of the program
Finally section 6D reexamines the participation decision to answer the question of whether low and high
emitters view the SGP participation decision similarly
6A What Factors Affected a Facilityrsquos Decision to Participate in the SGP
We begin by attempting to identify factors that affected a facilityrsquos voluntary decision to participate in the
Strategic Goals Program To this end we run a series of probit regressions (see equation 3) Recall that
the dependent variable SGP equals 1 if a facility participated in the SGP and 0 otherwise There are two
basic differences between the four sets of coefficient estimates presented in the Table 6 First the
regressions in columns (1) and (2) use point source air emissions to define the variables TOTAL TRI
RELEASES MPampM RELEASES TO TOTAL RELEASES and PRIOR REDUCTIONS while the
regressions in columns (3) and (4) use total air emissions for these variables Second the regressions in
columns (1) and (3) use all 201 observations while the regressions in columns (2) and (4) rely on a subset
of 168 observations based on facilities that reported to TRI in 1993 (See footnote 15) Corrections for
heteroskedasticity were made using Whitersquos estimator of variance
Notice that the results are quite robust across the four different specifications for most variables In all
cases the sign of the coefficient does not change across specifications However the significance of two
variables NON-ATTAINMENT and STATE REGULATIONS vary with the sample size NONshy
ATTAINMENT is significant only for the full sample while STATE REGULATION is significant only for
the restricted sample Also the proportion of MPampM RELEASES TO TOTAL RELEASES is significant
for three out of the four specifications Second notice that the pseudo R-squared is about 028 for the full
sample and 031 for the restricted sample regressions
To evaluate how accurately the regressors predict participation in the SGP we calculate the predicted
probability and compare it to facilitiesrsquo actual decisions We find that overall the model correctly predicts
17
the participation decision about 77 of the time However when we examine participants and nonshy
participants separately we find noticeable differences in our ability to predict the participation decision
correctly For instance for total air emissions using the full sample the model correctly predicts when a
facility will join the SGP only 57 of the time while it correctly predicts when a facility will not join the
SGP 86 of the time In other words based on the information available in our regressions the model
accurately predicts non-participation but under-predicts participation Some facilities join the SGP for
reasons other than those for which we have controlled It is possible that these reasons are particular to
the firm and therefore not easily captured in regression analyses that do not allow for facility-specific
fixed effects For instance perhaps upper management has taken a personal interest in environmental
issues or in program participation or perhaps EPA has a long-term relationship with the firms through
other programs and rulemaking processes that affect the participation decision Unfortunately we cannot
account for these idiosyncratic effects
We now turn to a discussion of the key findings First variables included to account for possible
emissions-related motivations for joining the program are generally not significant PRIOR
REDUCTIONS are included in the regressions to allow for the possibility that facilities that have already
made progress in reducing emissions prior to the SGP would want to count these reductions as progress
towards SGP goals making it less costly for them to enjoy the benefits of the program and therefore more
likely to join The regression analysis fails to find evidence of this effect confirming the indications from
the summary statistics that this effect is not present TOTAL TRI RELEASES in 1996 are included in the
regressions to allow for the possibility that cleaner or more environmentally responsible firms may be
more likely to join Despite preliminary evidence from the summary statistics to suggest this might be the
case we find no confirmation of this effect in the regression analysis
Several of the variables associated with the regulatory environment at the time facilities decided whether
to participate in the SGP are significant There is evidence that facilities respond to differences in
regulatory stringency at the federal level facilities that are located in a county out of attainment with
federal air regulations are more likely to join the SGP We note that the proportion of MPampM RELEASES
TO TOTAL RELEASES is positive and significant for three out of four of the specifications This
confirms that antidotal evidence that the MPampM regulation played a role in early history of the Strategic
Goals Program with the proportion of a firmrsquos emissions stemming from chemicals potentially subject to
the MPampM rule positively affecting the likelihood of joining SGP Larger penalties or a greater number
18
of violations do not appear to affect a facilityrsquos SGP decision20 This may be because facilities do not
view voluntary programs as having an impact on the amount of regulatory scrutiny they face from EPA
Finally facilities located in states with more stringent environmental regulations are more likely to join
the SGP but this result is only significant in the restricted sample
Two of the variables included to measure community pressure PERCENT MINORITY and
POPULATION DENSITY are significant A higher share of minorities in the neighborhood that
surrounds a facility reduces the likelihood that the facility joins the SGP However facilities in denser
neighborhoods are more likely to join the SGP To the extent that these variables proxy for the degree of
community pressure the facility faces to be a good corporate citizen they both adhere to hypotheses in the
literature (see Hamilton 1995) A facility that is trying to minimize the costs of potential compensation
to the community for environmental damages will be more likely to join a voluntary program (whether as
cover for its behavior or to reduce emissions is unknown) in areas where there are more people to
potentially compensate and where there are higher levels of collective action The variable AFFLUENT is
not significant However this variable may not suitably capture important differences in income level
since it is a dummy variable The variable associated with environmental pressure ENV GROUP
CONTRIBUTIONS is positive and significant The more dues and contributions received by
environmental groups in the state the more likely a facility in that state will join the SGP The California
and Illinois state dummy variables are generally negative and significant In other words a facility
located in a state with a large number of metal finishing facilities is less likely to join the SGP This may
indicate that there are few spillovers across facilities within the same state with regard to the voluntary
program
Of the firm and facility characteristics included in the regressions only NAMF is significant Facilities
that belong to the trade association are more likely to join the SGP This finding adheres to expectations
since NAMF was actively involved in the creation of the voluntary agreement advertised the SGP widely
to its members and encouraged them to join While we hypothesized that larger facilities facilities that
had joined other voluntary programs and facilities affiliated with public companies would be more likely
to join the SGP none of these variables are significant
To examine the economic importance of the significant variables the marginal effect of a change in a
particular variable on the probability of joining the SGP is evaluated (see Table 7) For the purpose of
20 This is also true for various permutations of this variable including number of inspections and number of enforcement actions
19
discussion we refer to the marginal effects for equation 1 The largest marginal effect is associated with
membership in the trade association NAMF Members are 37 percent more likely to join the SGP
Several other dummy variables also have large effects with facilities located in counties that are in non-
attainment 26 percent more likely to join the SGP while those in California and Illinois are 26 and 18
percent less likely to join the SGP respectively Of the continuous variables PERCENT MINORITY and
ENV GROUP CONTRIBUTIONS have the largest effects An increase of 1 percent in the proportion of
minorities surrounding a facility decreases the likelihood of joining SGP by 037 percent while a 1
percent increase in the statersquos environmental contributions increases the likelihood of joining the SGP by
024 percent With a slightly smaller impact a 1 percent increase in the proportion of MPampM releases to
total releases increases the probability of joining the SGP by 015 percent POPULATION DENSITY
produces the smallest statistically significant marginal impact a 1 percent increase in the surrounding
population density increases the likelihood of a facility joining the SGP by 009 percent The STATE
REGULATION variable is slightly harder to interpret This index ranges from 054 to 184 in our sample
with a mean value of 094 It is greater than one if the industry in that state spent more on pollution
abatement then the industries in other states Since a 1 percent increase in this variable evaluated at the
mean is slightly less than 001 we can say that a 1 percent increase in a statersquos Levinson index increases
the probably of facilities in that state joining the SGP by slightly less than 041 percent
6B What Factors Affect Facility TRI Air Emissions and Did the SGP Play a Role in Affecting
Those Emissions
We next examine the results for the raw (ie non-toxicity weighted) emission changes regression The
dependent variable in this case is the difference in logs of average air emissions from 2002-2003 to 1995shy
1996 Care should be taken in interpreting the coefficient estimates if a facility increases emissions over
time then the dependent variable is positive if a facility reduces emissions over time then the dependent
variable is negative Table 8 presents the results Similar to Table 6 the regressions in columns (1) and
(2) use point source air emissions to define the dependent variable as well as the independent variables
CHANGE IN MPampM TO TOTAL RELEASES and TOTAL TRI RELEASES The regressions in columns
(3) and (4) use total air emissions to define these variables Second columns (1) and (3) use all 201
observations while columns (2) and (4) restrict the sample to 168 observations based on facilities that
reported to TRI in 1993 (see footnote 15) Corrections for heteroskedasticity are made for all
specifications using Whitersquos estimator of variance The R-squared for the emissions equation ranges from
041 for the full sample to about 043 for the restricted sample
20
Before discussing the results recall that we include the predicted probability of joining the SGP as an
independent variable in the regression Previous literature (eg Hartmann 1988 Khanna and Damon
1999 and Welch et al 2000) take a similar approach under the assumption that facilities that are most
likely to join may also be the most likely to reduce emissions If this is the case including SGP
participation directly in the emissions regression would result in biased estimates A common solution in
the literature has been to regress the participation decision on a set of independent variables and then to
use the predicted probability of participation as an instrument for SGP participation in the emission
equation In our review of the literature we found no case where the authors explicitly tested for the
existence of such bias in the participation decision We attempt to do so here and find that we can reject
the null hypothesis that OLS without the instrumental variable approach is a consistent estimator for three
out of the four specifications21 This result suggests that it is necessary to use the predicted probability of
joining SGP when evaluating facility emissions behavior
We begin by discussing whether the probability of joining the SGP had any effect on the change in
average emissions from 1995-96 to 2002-03 The coefficient on the probability of joining the SGP is
negative in all four cases facilities with a high probability of joining the SGP reduce emissions by more
than facilities with a low probability of joining While this result appears to support the effectiveness of
the SGP it is only significant at the 10 percent level for the two point air emission specifications It is
also important to note that significance is not particularly robust to minor but alternate specifications of
the model We therefore conclude that the SGP has not been the driving force behind emission
reductions This result seems to lend itself to the hypothesis in the literature that facilities often join
voluntary programs perhaps with good intentions but make few real changes in behavior as a direct result
of joining the program We know from the summary statistics that SGP facilities on average emit far
less initially than non-SGP facilities This may mean that while relatively clean facilities derive some
21 Our test for endogeneity is complicated by the fact that the participation decision is modeled using a probit The standard approach when endogenity is suspected is to use the Durbin-Wu-Hausman test in which the variable suspected to be endogeneous is regressed on a set of instruments and then both the residuals from this regression and the suspected variable itself are included in the subsequent regression If the coefficient on the residuals is significantly different from zero then the suspected variable is endogenous and the instrumental variable approach is warranted However this test is commonly conducted when the variable in question is linearly modeled If we employ a standard OLS regression for our participation decision and conduct the standard test for endogenity we reject the null hypothesis of a zero coefficient in three of the four cases Only in the total air restricted sample regression model do we fail to reject the null hypothesis If we use a probit model for the participation decision the interpretation of errors is more difficult Davidson and MacKinnon (1993) show that including the predicted variables from a modeled instrument rather than the residuals and testing for the significance on this coefficient produces an equivalent result Using the predicted values of our probit equation to test for endogeneity we reject the null hypothesis for both point source emission models (and thus suspect endogenity) but fail to reject it for both total air emissions models
21
benefit from joining the SGP the program does not provide sufficient incentive to these facilities for
further reductions in emissions
Both variables associated with emissions-related program motivations TOTAL TRI RELEASES and the
CHANGE IN MPampM TO TOTAL RELEASES are consistently significant across all specifications
TOTAL TRI RELEASES are negatively correlated with emission changes over the study period whether
the sample is constrained or the dependent variable is defined using total or point source air emissions In
other words the dirtier the facility in 1996 the more progress it made in reducing its emissions over the
next seven years This result makes sense if we consider that dirtier facilities may be able to invest
relatively little initially to make large reductions in emissions cleaner facilities may have already
addressed the ldquolow-hanging fruitrdquo the simplest and least costly reductions and therefore incur higher
costs to reduce emissions further The change in the proportion of total releases under threat of regulation
from the 1995 and 2001 MPampM rules also is positively related to emission changes This implies that the
proposed MPampM regulation has had an effect on firm behavior facilities that have reduced emissions of
MPampM chemicals relative to total releases have made more progress in reducing air emissions over this
time period Coupled with the insignificant result on the predicted probability of joining the SGP this
result provides evidence that the voluntary program alone did not effectively replace the traditional policy
tool which here appears to be a large motivating factor for reducing emissions22
Only one of the variables associated with regulatory pressure is significant across most specifications
TOTAL INSPECTIONS The number of inspections a facility faced in 1995 and 1996 is negatively
correlated with emission changes This result is intuitive facilities that historically have been inspected
more frequently by EPA reduce their emissions by more than facilities that face less EPA oversight The
variable TOTAL PENALTIES has a small but positive effect on emission changes a counter-intuitive
result However this result is never significant The dummy variable indicating a change in NONshy
ATTAINMENT status has a negative coefficient but it is significant only for the regressions that rely on
point source air emissions Recall that no county changes from attainment to non-attainment over the
time period Thus this variable indicates that facilities in counties that went into attainment reduced point
air emissions more over the time period than facilities in counties where attainment status remained
unchanged State dummies are included to soak up any remaining differences due to changes in the stateshy
22 Alternate specifications included an interaction term between the regulatory variable CHANGES IN MPampM TO
TOTAL RELEASES and the voluntary program variable Probability of joining SGP as well as a variable capturing the level of MPampM RELEASES TO TOTAL RELEASES Neither was significant nor changed the basic results of the regressions presented here
22
level regulatory environment or other factors over the study period None of these variables are
consistently significant
None of the variables included in the regressions to capture community or environmental pressure on the
facility PERCENT MINORITY POPULATION DENSITY and CHANGE IN ENV CONTRIBUTIONS
are significant for any of the specifications While these variables may influence a facilityrsquos decision of
whether to join the SGP they do not appear to influence subsequent decisions of how much to reduce
emissions
Of the variables included to represent firm and facility characteristics EMPLOYEE SIZE is positive and
significant in all four specifications We find that larger facilities reduce emissions less than smaller
facilities More relevant than employee size at a given point in time would be the change in the number
of employees or in sales over the study period With these data we could control for growth in facility
production over time Unfortunately we do not have access to such data23 Membership in the industry
trade association NAMF which had a strong influence on a facilityrsquos decision to join the SGP is
significant for the two point air emission specifications However it is also positive meaning that NAMF
members make fewer reductions than non-members In an alternate specification not presented here we
also examined the possibility that facilities that belonged to both NAMF and the SGP would respond
differently than NAMF members that decided not to join the SGP That variable was never significant
nor did it affect the sign or significance of NAMF Finally if a facility is affiliated with a publicly listed
firm we find that it reduced emissions more than facilities owned by privately held firms This result
holds true for all four specifications but is significant only for the point air emission equations
6C Did the SGP Make Progress in Reducing Human Exposure to Toxic Materials
The results discussed in the two previous sections examine the impact of the Strategic Goals Program on
a facilityrsquos raw emissions While we do not find strong evidence that the program had an effect on raw
emissions the program could still be a success if it encouraged facilities to reduce the risks associated
with emissions In particular one of the SGPrsquos seven goals is to reduce ldquohuman exposure to toxicity
23 Since we cannot control for production changes we rely on one of the following assumptions (1) output is constant over time or (2) if output varies the change in output is independent of SGP participation While the first assumption may not be reasonable there is reason to believe that the second assumption holds In the metal finishing industry ldquoestimates in the mid-1990s placed environmental management costs at 10-14 of sales for US job shop facilitiesrdquo (Haverman 1996) While SGP has the potential to affect a firms cost at the margin it is more likely that other general market factors overwhelm any pollution-related cost expenditures Perhaps the best evidence that SGP does not systematically create competitive advantages for firms is the fact that less than 10 of the industry joined the program
23
materials in the facility and surrounding communityrdquo It is conceivable that the SGP encouraged firms to
substitute away from relatively toxic into less toxic chemicals which would result in a decrease in the
potential harmfulness of a facilityrsquos emissions To examine whether the SGP had a positive impact on
human health and the environment through a relatively greater reduction in the toxicity-weighted
emissions of its participants we continue to rely on an empirical model similar to equation (5) but we
now model ΔY it = αΔDit + β 2 ΔX 2it +Δε 2it Yit still represents the level of air emissions for facility
i at time t however we calculate the hazard level of a facilityrsquos emissions by using the EPArsquos Risk-
Screening Environmental Indicators (RSEI) tool to weight emissions of chemicals by their toxicity levels
before aggregating to the facility level The dependent variable for the emission changes equation ΔYit
is defined as the difference in the log of the toxicity-weighted air emissions in 2002-2003 and the log of
the toxicity-weighted air emissions in 1995-1996 As in equation (5) Dit continues to represent
participation in SGP X2it represents a vector of exogenous facility-specific variables but several of the
independent variables for the emission changes equation that appear in X2it CHANGES IN MPampM TO
TOTAL RELEASES and TOTAL TRI RELEASES have been weighted by toxicity For the participation
equation the dependent variable continues to be modeled as defined in equation (3) however PRIOR
REDUCTIONS MPampM RELEASES TO TOTAL RELEASES and TOTAL TRI RELEASES which are
included in the vector of independent variables for the participation equation X1it are also weighted by
toxicity
The results for the participation decision equation when PRIOR REDUCTIONS MPampM RELEASES TO
TOTAL RELEASES and TOTAL TRI RELEASES are weighted by toxicity are very similar to those
presented in Table 7 and are therefore not repeated here24 In other words the signs and significance of
factors affecting the decision of whether to participate in SGP appear to be largely unchanged when we
account for differences in toxicity across chemicals
The results for the emission changes equation when accounting for toxicity are presented in Table 9
Similar to the results based on raw emissions the effect of the predicted probability of joining the SGP on
the change in (toxicity weighted) emissions is negative facilities with a high probability of joining the
SGP reduce their toxicity weighted emissions by more than facilities with a low probability of joining
However the result is not significant for any of the four specifications Hence we are unable to find
evidence that the SGP had a consistently significant effect on either a firmrsquos raw emissions or toxicity
weighted emissions Another common result shared between the models is the effect of the MPampM rule
24 Results are available on request from the authors
24
on raw and toxicity-weighted emissions Facilities with the greatest reductions in MPampM releases
relative to total releases experience the largest reductions in overall toxicity weighted emissions Finally
we note that none of the significant and very few of the insignificant coefficients change sign when
emissions are adjusted for toxicity
There are several differences from the results for raw emissions (reported in Table 8) that are worth
noting First many of the variables that were important predictors in the change in raw emissions are no
longer significantly related to changes in emissions when adjusted for toxicity For instance CHANGE
IN NON-ATTAINMENT NAMF and TOTAL INSPECTIONS are no longer significant for any
specification reported in Table 9 Given that information most readily available to regulators as well as
the regulated community is pounds of emissions this result is not too surprising For instance EPA
enforcement may target facilities that are ldquobad actorsrdquo or those that emit large amounts of emissions but
EPA enforcement may be unlikely to track changes in the relative risk of those emissions over time A
second difference between the raw emissions and toxicity weighted emission results is the magnitude of
the coefficients for CHANGE IN MPampM TO TOTAL RELEASES The coefficient on this variable is
almost three times larger when emissions are weighted by toxicity It is this effect that has the greatest
explanatory power for changes in toxicity-weighted emissions This is not an unexpected result since
MPampM chemicals are on average four times more toxic than all other TRI chemicals emitted by metal
finishing facilities It appears that to the extent that regulations such as the MPampM rule target relatively
more harmful chemicals they have a discernible effect not only on overall emissions but also on the
toxicity of those emissions Finally the predictive power of all four regressions has increased from an
adjusted R-squared of between 041 and 044 to between 061 and 065
6D SGP Participation Small vs Large Emitters
The literature posits a variety of reasons why facilities may choose to join a voluntary program On the
one hand some firms may join a voluntary program to implement real steps to address environmental
concerns in the hope of reducing costs or improving their environmental reputation and hence their
market share On the other hand some firms may use participation in a voluntary program as a
smokescreen to provide cover for failing to implement any real step to address poor environmental
performance Because the motivating factors of these two groups of facilities are so different it is
possible that we have a bimodal distribution in our sample each group joins the SGP for fundamentally
different reasons By lumping facilities together and estimating a single regression we may have a less
reliable picture of the factors driving the participation decision than if we split the sample and estimate
two separate regressions Since the results of the participation model are used to create an instrument for
25
the emissions regression providing a better fit of the model (and hence a better instrument) may impact
the results in the emissions regression In this section we explore the possibility of a bimodal
distribution by allowing the coefficients to differ between the two groups instead of forcing them to be
identical We do this by splitting the sample roughly in half based on facility total air emissions in
199525 The relatively low emitters have average emissions of 154 pounds in 1995 while the relatively
high emitters have average emissions of 24610 pounds in 1995 It is therefore conceivable that these two
groups of facilities would view the benefits and costs of joining a voluntary program differently We run
separate probit regressions for these two sets of facilities
Before discussing the results it is worth noting that in spite of the summary statistics in Table 2 that show
SGP participants emit far less initially than non-participants we do not find that all SGP participants are
in the half of the sample with lower emissions Of 65 SGP participants 31 are considered relatively low
emitters while 34 are categorized as relatively high emitters This allows us to derive conclusions about
factors affecting the participation decisions of facilities from both samples Also while we did explore
splitting the sample in an equivalent manner for the emission reductions equation we find that an F-test
for the hypothesis that the regression results are significantly different for the two sub-samples is only
significant for one of the four model specifications Thus the split sample results for the emissions
reduction equation are not reported here
Table 10 presents results for a set of probit regressions similar to regressions (1) and (3) in Table 6 but
split between relatively low and high emitters We note that we were unable to include several variables
in the split-sample analysis TOTAL PENALTIES PUBLIC and the state dummies for Texas and
California In each case for one half of the sample no facilities meet the particular criterion (eg located
in Texas) while for the other half of the sample all the facilities meet the criterion Only the state dummy
for California was significant in the overall sample regressions In spite of this limitation the regressions
in Table 10 perform fairly well The adjusted R-squared ranges from 032 to 033 for the smaller emitters
comparable to the regressions for the overall sample For the larger emitters we see a visible
improvement in the explanatory power of the participation decision regression the adjusted R-squared
increases from approximately 03 to between 042 and 045 Our ability to correctly predict the
participation decisions of facilities also improves for both samples particularly for facilities that decide to
join the SGP For relatively low emitters we correctly predict between 59 and 68 percent of those that
25 Another way to split the sample is on the basis of emissions per unit of output or per employee prior to when the program started Given data constraints such splits were not possible The employment information from InfoUSA is for only one year collected well after the start of the SGP The output information from InfoUSA suffers from the same shortcoming and is also missing for a substantial number of observations
26
join the SGP and between 84 and 87 percent of those that do not join For relatively high emitters we
correctly predict between 65 and 71 percent of those that join the SGP and between 87 and 90 percent of
those that do not join An F-test confirms that the split sample approach is warranted for the participation
decision the regression results are significantly different across the two sub-samples at the 5 level for
all four specifications
Results are consistent across point air and total air emissions so for purposes of discussion we focus on
the point air emission results in Table 10 specifications (1a) and (1b) A number of details are worth
noting First many results continue to hold for the two sub-samples that were evident for the overall
sample For instance variables such as TOTAL TRI RELEASES and PRIOR REDUCTIONS are still not
significant predictors of SGP participation Other variables such as PERCENT MINORITY and NAMF
continue to be significant predictors of SGP participation for both sub-samples Second two variables
that are not significant in the overall sample now appear to be significant for one of the two sub-samples
Membership in OTHER VAS and STATE REGULATIONS significantly increase the likelihood that larger
emitters join the SGP Third several of the variables that are significant positive predictors of SGP
participation in the overall sample now appear to be significant for only one of the two sub-samples The
ratio of MPampM RELEASES TO TOTAL RELEASES and NON-ATTAINMENT status continue to
significantly increase the likelihood that a relatively low emitting facility joins the SGP while
POPULATION DENSITY and ENV GROUP CONTRIBUTIONS continue to significantly increase the
likelihood that a relatively large emitting facility joins the SGP
While not reported in a table here the marginal effects of a change in a particular variable on the
probability of joining the SGP in the split sample do warrant brief mention For the purpose of
discussion we again refer to specifications (1a) and (1b) As mentioned previously NAMF continues to
be important for both low and high emitters For relatively high-emitting facilities the marginal effect is
quite similar to that for the overall sample (38 percent) However if a relatively low-emitting facility is a
NAMF member it is 52 percent more likely to join the SGP As expected in cases where a variable is
significant for only one of the two sub-samples the marginal effect is typically larger for the sub-sample
driving the effect then it is for the overall sample For example a low-emitting facility located in a non-
attainment area is 70 percent more likely to join the SGP (compared to 26 percent in the overall sample)
Finally for variables that are not significant in the overall sample ndashstringency of state regulations and
membership in other voluntary programs ndash a 1 percent increase in the measure for the stringency of state
regulations increases the probability that a high-emitting facility will join the SGP by approximately 062
27
percent while membership in another VA increases the probability that a low-emitting facility will join
the SGP by 41 percent
Using our improved estimates for SGP participation based on our split sample results we re-calculate the
instrument for participation in SGP and re-run the raw emissions and toxicity-weighted emissions
regressions The results from these regressions are very similar to the previous results In particular
participation in the SPG appears to have no significant impact on emissions behavior
7 Conclusion
In this paper we examine the decision of a facility to participate in the Strategic Goals Program (SGP)
and the impact the SGP has on subsequent emissions behavior to evaluate whether participants reduce
their emissions by more than non-participants We use a probit model to examine factors that contribute
to a facilityrsquos decision of whether to participate in the SGP Finding evidence of endogeneity we use the
results of the probit equation to calculate the predicted probability of joining the SGP and include this
variable on the right-hand side of the emission reductions equation which is estimated using Ordinary
Least Squares
The probit estimation for the participation decision performs reasonably well and indicates that factors
such as community characteristics (such as percent minority and population density) environmental
pressure (proxied by environmental group dues and contributions) and membership in the professional
organization NAMF matter We find limited evidence that the proportion of emissions potentially
subject to the proposed MPampM regulation is related to a facilityrsquos participation decision One of the
largest influences on the participation decision is membership in NAMF To the extent that wide-spread
participation in voluntary agreements in an objective of the EPA this implies that EPA should work
closely with industry groups in promoting future voluntary initiatives
When we evaluate relatively low and high emitters separately we find that several of these factors
continue to be important for the participation decisions of both sub-samples (eg membership in NAMF
and percent minority) Several facility-specific factors (such as membership in other VAs) that do not
have explanatory power in the overall sample appear to be important determinants of SGP participation
for at least one of the sub-samples Also in a number of cases factors that are important in the overall
sample (such as population density) do not matter equally for low and high emitters When we use the
28
split sample approach our ability to correctly predict participation in the SGP improves for all facilities
especially those with relatively high emissions
The emissions regression performs fairly well and demonstrates a number of intriguing results First we
do not find robust evidence that the SGP had a significant impact on emission reductions This result
continues to hold when we adjust emissions to account for toxicity This result seems to lend itself to the
hypothesis in the literature that facilities often join voluntary programs perhaps with good intentions but
they make no real changes in behavior as a direct result of joining the program We know from the
summary statistics that SGP facilities on average emit far less initially than non-SGP facilities This
may mean that while relatively clean facilities derive some benefit from joining the SGP the program
does not provide sufficient incentive to these facilities for further reductions in emissions Future
research should consider other benefits that firms may receive from participation in voluntary
26 agreements
Two other emission-related variables are consistently important in explaining emission reductions of
metal finishers reporting to the TRI regardless of SGP participation The dirtier a facility is just prior to
the introduction of the SGP the larger its reductions in emissions over the study period Also the larger
the reduction in releases potentially subject to the MPampM rule as a proportion of total releases the larger
the reduction in emissions overall One may make the case that the threat of regulation induced metal
finishers regardless of their participation in the SGP to reduce emissions in a successful attempt at either
avoiding or preparing for regulation While the SGP does not appear to be directly related to emission
reductions it still may have played a subtle role in the rulemaking process introducing into the discussion
more flexible alternatives to regulation while we cannot definitely identify the reasons we know that
metal finishers were successful in exempting themselves from the MPampM rule Other variables related to
emission reductions include a change in non-attainment status employment size the number of
inspections a facility typically faces whether a facility is publicly held and membership in NAMF
26 This is not to imply that firms participating in the SGP are not making progress to their goals The NMFRC websites reports very positive progress toward SGP goals by participants There are a number of reasons why our result differs from those reported by NMFRC First and most importantly we are looking at the statistical difference between SGP participants and non-participants not measuring the progress of participants toward meeting SGP goals Second even among participants the NMFRC and our study use a different sample of firms While we use publicly available TRI data NMFRC uses self-reported program specific data This data allows them to use a different base year and may include much smaller firms than are represented in TRI data
29
Table 1 Summary of Independent Variables by Equation
Category Variable Definition Participation
Equation
Emissions
Equation
Program Motivation
TOTAL TRI RELEASES Ln(1996 air emissions) radic radic
PRIOR REDUCTIONS Ln(1996 air emissions) ndash Ln(1993 air emissions)
radic
Regulatory Environment
MPampM RELEASES TO
TOTAL RELEASES
1995-96 air emissions subject to the 1995 MPampM rule1995-96 total air emissions
radic
CHANGE IN MPampM
TO TOTAL RELEASES
(2002-03 MPampM emissions2002-03 total emissions) ndash (1995-96 MPampM emissions1995-96 total emissions)
radic
PENALTY HISTORY
Ln(proposed penalties SEPs amp final assessed monetary penalties) over five years prior to SGP (1992shy96)
radic
VIOLATION HISTORY Total number of violations over five years prior to SGP (1992-96)
radic
TOTAL PENALTIES
Ln(proposed penalties SEPS amp final assessed monetary penalties) in 1995-96
radic
TOTAL INSPECTIONS Total number of RCRA inspections in 1995-96
radic
NON-ATTAINMENT
1 if the county in which facility is located was in non-attainment for SO2 in at least 1 year from 1992-96
radic
CHANGE IN NONshy
ATTAINMENT
1 if the county attainment status has changed from 1996 to 2001
radic
STATE REGULATIONS Levinson index radic
STATE DUMMIES
Dummy variables for states with more than 20 facilities (MI IL OH TX CA)
radic radic
Community Environmental Pressure
PERCENT MINORITY Percent minority within 3 mile radius radic radic
POPULATION
DENSITY
Ln(population density within 3 mile radius)
radic radic
AFFLUENT 1 if the neighborhood is designated affluent
radic
ENV GROUP
CONTRIBUTIONS
Ln(1996 dues amp contributions to environmental groups in a state)
radic
CHANGE IN ENV
CONTRIBUTIONS
Ln(2001 dues amp contributions) ndash Ln(1996 dues amp contributions)
radic
Facility and Firm Specific Characteristics
NAMF 1 if a member of NAMF radic radic
OTHER VAS 1 if belongs to 3350 Energy Star or WasteWise
radic radic
EMPLOYEE SIZE Ln(number of employees) radic radic
PUBLIC 1 if firm is public radic radic
30
Table 2 Average Total Air Emissions in SIC 3471 and 3479
Total Sample
(201 facilities)
SGP Participants
(65 facilities)
SGP Non-Participants
(136 facilities)
Year Mean Standard
Deviation Mean
Standard
Deviation Mean
Standard
Deviation
1995 11226 55619 3464 7782 14935 67166
1996 10712 46743 4595 10827 13635 56167
2002 6867 28301 3472 7816 8470 33904
2003 5419 19699 3214 7108 6472 23398
Figures are in pounds of releases Source Toxic Release Inventory
Table 3 Coefficient of Variation for Total Air Emissions in SIC 3471 and 3479
Year SGP Participants
(65 facilities)
SGP Non-Participants
(136 facilities)
1995 225 450
1996 236 412
2000 225 399
2001 221 362
= standard deviationmean
31
Table 4 Summary Statistics for Continuous Variables
Variable Total Sample
(201 facilities) SGP Participants
(65 facilities)
Non-Participants
(136 facilities)
Mean Standard
Deviation Mean
Standard
Deviation Mean
Standard
Deviation
TRI Emissions in 1996 (pounds)ab 10712 46743 4595 10827 13635 56167
Change in TRI Emissions from 1993 to 1996 (pounds)a b -1412 31151 2497 9049 -3281 37255
MPampM Emissions in 1995-96 divided by Totol Emsissions in 1995-96b 038 046 043 047 036 046
Change in MPampM Emisssions to Total Emissions from 1995-96 to 2002-03b -003 032 -005 034 -001 031
Total Penalties from 1992 to 1996a $2024 $12775 $946 $6857 $2539 $14788
Number of Violations from 1992 to 1996 216 369 217 373 216 368
Levinson Index 094 018 094 018 094 018
Percent Minority within a 3 mile radius 037 025 035 025 037 026
Population Density within a 3 mile radiusa 4664 4778 4718 3487 4639 5296
Total Environmental Group Contributions in 1996 (millions)a $457 $606 $598 $714 $389 $536
Change in Environmental Group Contributions 1996 to 2001 (millions)a -$55 $241 -$69 $31 -$48 $198
Number of Employeesa 95 110 86 65 99 126
a Reported in natural units (eg pounds dollars) not the units used in the regressions (eg logs) b Reported using total (point and non-point) emissions A similar relationship is found for point emissions
Table 5 Summary Statistics for Dummy Variables
Variable Total Sample
(201 facilities) SGP Participants
(65 facilities)
Non-Participants
(136 facilities)
Facilities in non- attainment counties 14 18 12
Facilities in counties that changed attainment status between 1996 and 2001
3 5 3
Facilities in affluent neighborhood 18 22 16
Members of NAMF 49 80 35
Participate in other voluntary programs 8 12 7
Publicly traded firms 4 2 6
32
Table 6 Coefficient Estimates for the SGP Participation Equation
Point Air Total Air
Full Sample Restricted Sample Full Sample Restricted Sample
Variables (1) (2) (3) (4)
TOTAL TRI RELEASES 001
(004) 004
(004) -002 (004)
-001 (004)
PRIOR REDUCTIONS 005
(005) 001
(007) 005
(005) 002
(008)
MPampM RELEASES TO
TOTAL RELEASES
048 (029)
068 (032)
037 (026)
059 (031)
PENALTY HISTORY -005 (005)
-005 (006)
-006 (005)
-005 (005)
VIOLATION HISTORY 002
(003) 004
(004) 003
(003) 005
(004)
NON-ATTAINMENT 075 (039)
067 (041)
070 (037)
059 (039)
STATE REGULATIONS 135
(088) 181 (090)
118 (086)
166 (083)
PERCENT MINORITY -122 (065)
-153 (073)
-143 (068)
-180 (074)
POPULATION DENSITY 028 (014)
040 (015)
028 (013)
038 (015)
AFFLUENT -001 (030)
-018 (038)
-003 (030)
-014 (034)
ENV GROUP
CONTRIBUTIONS
078 (021)
080 (022)
081 (020)
085 (022)
NAMF 125
(026) 117
(029) 120
(026) 113
(030)
OTHER VAS 031
(035) 037
(042) 034
(035) 040
(042)
EMPLOYEE SIZE 007
(014) -009 (017)
012 (014)
004 (017)
PUBLIC -038 (047)
-031 (049)
-027 (046)
-016 (046)
IL -071 (036)
-081 (042)
-065 (036)
-074 (041)
CA -151 (068)
-097 (076)
-161 (068)
-108 (075)
MI 018
(037) 009
(041) 019
(037) 010
(042)
OH -054 (039)
-062 (041)
-046 (038)
-048 (040)
TX -050 (077)
-080 (086)
-020 (078)
-051 (085)
Constant -1808
(410) -1906
(428) -1834
(399) -1989
(433)
Observations 201 168 201 168
Log likelihood -9031 -7254 -9065 -7309
Correctly predicted
Participants 54 56 57 61
Non-participants 85 89 86 87
Pseudo R2 029 031 028 031
Dependent Variable Participation in SGP equals 1 if firm participates in SGP equal to 0 otherwise The number of stars indicates the level of significance of a coefficient means it is significant at 10 means it is significant at 5 and means it is significant at 1 Robust standard errors are listed in parentheses
33
Table 7 Marginal Effects for Variables Significantly Affecting SGP Participation
Point Air Total Air
Full
Sample
Restricted
Sample
Full
Sample
Restricted
Sample
Variables (1) (2) (3) (4)
MPampM RELEASES TO TOTAL
RELEASES
015 (009)
020 (009)
011 (008)
017 (009)
NON-ATTAINMENT 026 (015)
023 (015)
024 (014)
-020 (014)
STATE REGULATIONS 041
(027) 054 (027)
036 (026)
049 024
PERCENT MINORITY -037 (020)
-045 (021)
-043 (021)
-053 (021)
POPULATION DENSITY 009 (004)
012 (004)
008 (004)
011 (004)
ENV GROUP CONTRIBUTIONS 024
(006) 024
(006) 024
(006) 025
(006)
NAMF 037
(007) 034
(008) 035
(007) 032
(008)
IL -018 (008)
-019 (008)
-016 (008)
-018 (008)
CA -026 (005)
-019 (009)
-026 (005)
-020 (007)
34
Table 8 Coefficient Estimates for the Raw Emissions Reduction Equation
Point Air Total Air
Full Sample Restricted Sample Full Sample Restricted Sample
Variables (1) (2) (3) (4)
Probability of joining
SGP
-179 (107)
-154 (093)
-127 (092)
-050 (087)
TOTAL TRI RELEASES -019
(005) -017
(005) -029
(006) -026
(006)
CHANGE IN MPampM TO
TOTAL RELEASES 315
(045) 341
(049) 315
(051) 341
(051)
TOTAL PENALTIES 002
(004) 004
(005) 003
(004) 003
(005)
TOTAL INSPECTIONS -015 (012)
-022 (013)
-026 (014)
-032 (014)
CHANGE IN NONshy
ATTAINMENT
-135 (074)
-171 (089)
-079 (112)
-074 (140)
PERCENT MINORITY -025 (088)
-024 (081)
041 (089)
073 (076)
POPULATION DENSITY -005 (020)
-001 (016)
-010 (018)
-016 (013)
CHANGE IN ENV
CONTRIBUTIONS
018 (0239)
013 (044)
000 (044)
015 (052)
NAMF 105 (055)
097 (048)
074 (046)
057 (042)
OTHER VAS 024
(040) 047
(033) 018
(044) 027
(030)
EMPLOYEE SIZE 044 (017)
034 (017)
037 (018)
030 (016)
PUBLIC -146 (077)
-138 (076)
-072 (053)
-070 (049)
IL -039 (046)
-087 (0457)
-071 (061)
-045 (060)
CA -064
(0560) -106 (094)
-204 (078)
-154 (106)
MI -104 (066)
-020 (053)
-045 (043)
-021 (048)
OH -010 (044)
-080 (042)
-077 (050)
-036 (043)
TX -061 (050)
043 (083)
-045 (071)
-052 (091)
Constant -052 (166)
-062 (130)
118 (162)
143 (121)
R-squared 041 044 041 043
Observations 201 168 201 168
Dependent Variable Log average air emissions in 2002-2003 minus log average air emissions in 1995-1996 Note that indicates a coefficient is significant at 10 indicates it is significant at 5 and indicates it is significant at 1 Robust standard errors are listed in parentheses
35
Table 9 Coefficient Estimates for the Toxicity-Weighted Emissions Reduction Equation
Point Air Total Air
Full Sample Restricted Sample Full Sample Restricted Sample
Variables (1) (2) (3) (4)
Probability of joining
SGP
-262 (195)
-255 (200)
-201 (158)
-123 (163)
TOTAL TRI RELEASES -019
(005) -017
(006) -031
(008) -030
(009)
CHANGE IN MPampM TO
TOTAL RELEASES 942
(090) 932
(102) 899
(087) 896
(092)
TOTAL PENALTIES 000
(008) 005
(009) 002
(007) 005
(009)
TOTAL INSPECTIONS -004 (020)
-011 (020)
-028 (026)
-036 (026)
CHANGE IN NONshy
ATTAINMENT
-193 (123)
-256 (157)
-157 (167)
-182 (216)
PERCENT MINORITY -149 (137)
-171 (136)
-099 (123)
-044 (125)
POPULATION DENSITY 010
(031) 031
(032) -006 (026)
-009 (024)
CHANGE IN ENV
CONTRIBUTIONS
001 (081)
-012 (091)
-036 (079)
-041 (092)
NAMF 154
(095) 146
(094) 108
(085) 088
(084)
OTHER VAS 029
(054) 056
(056) 040
(049) 047
(049)
EMPLOYEE SIZE 056 (022)
045 (023)
022 (024)
008 (023)
PUBLIC -108 (077)
-087 (076)
-085 (046)
-069 (047)
IL -116 (094)
-184 (095)
-111 (085)
-142 (090)
CA -216 (115)
-181 (161)
-288 (127)
-233 (171)
MI 006
(065) -024 (076)
-089 (092)
-098 (110)
OH -043 (088)
-104 (078)
-115 (070)
-080 (070)
TX 139 (082)
129 (095)
050 (085)
025 (089)
Constant -098 (261)
-201 (269)
385 (256)
411 (248)
R-squared 063 061 065 064
Observations 201 168 201 168
Dependent Variable Log average toxicity-weighted air emissions in 2002-2003 minus log average toxicityshywieghted air emissions in 1995-1996 Note that indicates a coefficient is significant at 10 indicates it is significant at 5 and indicates it is significant at 1 Robust standard errors are listed in parentheses
36
Table 10 SGP Participation for the Sample Split between Low amp High Emitters
Point Air - Full Sample Total Air - Full Sample
Low Emitters High Emitters Low Emitters High Emitters
Variables (1a) (1b) (3a) (3b)
TOTAL TRI RELEASES -006 (007)
012 (007)
001 (007)
006 (015)
PRIOR REDUCTIONS 014
(009) 000
(007) 007
(008) 006
(007)
MPampM RELEASES TO
TOTAL RELEASES
074 (042)
040 (052)
083 (038)
-002 (068)
VIOLATIONS HISTORY -001 (004)
005 (006)
-001 (004)
005 (007)
NON-ATTAINMENT 206
(049) 016
(054) 214
(052) 045
(056)
STATE REGULATIONS 080
(086) 241 (124)
117 (079)
218 (119)
PERCENT MINORITY -210 (095)
-143 (111)
-253 (093)
-211 (104)
POPULATION DENSITY 026
(023) 050
(018) 028
(026) 044 (020)
AFFLUENT -039 (041)
-035 (053)
-044 (043)
-020 (055)
ENV GROUP
CONTRIBUTIONS
021 (017)
134 (046)
018 (017)
138 (045)
NAMF 193
(035) 150
(046) 195
(039) 119
(044)
OTHER VAS -098 (063)
121 (048)
-095 (062)
142 (053)
EMPLOYEE SIZE 034
(022) -025 (022)
035 (022)
-015 (021)
IL -047 (043)
-038 (056)
-054 (046)
-013 (059)
MI -036 (055)
112 (078)
-015 (054)
138 (072)
OH -213
(066) 082
(062) -200
(061) 061
(061)
Constant -857
(361) -3022
(884) -889
(395) -3017
(938)
Observations 110 91 110 91
Log likelihood -4611 -3191 -4533 -3368
Correctly predicted
Participants 59 71 68 65
Non-participants 84 90 87 87
Pseudo R2 032 045 033 042
Dependent Variable Participation in SGP equals 1 if firm participates in SGP equal to 0 otherwise The number of stars indicates the level of significance of a coefficient means it is significant at 10 means it is significant at 5 and means it is significant at 1 Robust standard errors are listed in parentheses
37
References
Alberini A and K Segerson Assessing Voluntary Programs to Improve Environmental Quality Environmental and Resource Economics 22 157-184 (2002)
Alberini A and J Videras The Appeal of Voluntary Environmental Programs Which Firms Participate and Why Contemporary Economic Policy 18(4) 449-61 (2000)
Arora S and T Cason Why Do Firms Volunteer to Exceed Environmental Regulations Understanding Participation in EPArsquos 3350 Program Land Economics 72 413-432 (1996)
Arora S and S Gangopadhyay Toward a Theoretical Model of Voluntary Overcompliance Journal of
Economic Behavior and Organization 28(3) 289-309 (1995)
Bizer K Voluntary Agreements Cost-Effective or a Smokescreen for Failure Environmental
Economics and Policy Studies 2(2) 147-65 (1999)
Blackman A and J Boyd The Economics of Tailored Regulation Will Voluntary Site-Specific Performance Standards Necessarily Improve Welfare Southern Economic Journal 169(2) 309-326 (2002)
Boer T M Pastor J Sadd and L Snyder Is There Environmental Racism The Demographics of Hazardous Waste in Los Angeles County Social Science Quarterly 78(4) 793-809 (1997)
Brouhle K C Griffiths and A Wolverton The Use of Voluntary Approaches for Environmental Policymaking in the US in ldquoThe Handbook of Environmental Voluntary Agreements Design Implementation and Evaluation Issuesrdquo (E Croci Ed) Springer The Netherlands (2005)
Dasgupta S H Hettige and D Wheeler What Improves Environmental Compliance Evidence from Mexican Industry Journal of Environmental Economics and Management 39(1) 39-66 (2000)
Davidson R and JG MacKinnon (1993) Estimation and Inference in Econometrics New York Oxford University Press
Davies J J Mazurek N Darnall and K McCarthy Industry Incentives for Environmental
Improvement Evaluation of US Federal Initiatives Washington DC Global Environmental Management Initiative (1996)
Federal Register Sector Strategies Program Announcement of Program Launch 68(84) 23303-23304 Listed on May 1 2003 (2003)
GAO Status of EPAs Efforts to Reduce Toxic Releases Washington DC GAO (1994)
GAO Information on the Results of Four of EPArsquos Voluntary Climate Change Programs Washington DC GAO (1997)
Goldman B and L Fitton Toxic Wastes and Race Revisited UCC Center for Policy Alternatives (1994)
Hamilton J Pollution as News Media and Stock Market Reactions to the Toxic Release Inventory Data Journal of Environmental Economics and Management 28 98-113 (1995)
38
Hamilton J Politics and Social Costs Estimating the Impact of Collective Action on Hazardous Waste Facilities RAND Journal of Economics 24(1) 101-125 (1993)
Harrison K Talking With the Donkey Cooperative Approaches to Environmental Protection Journal
of Industrial Ecology 2(3) 51-72 (1999)
Hartman R Self-Selection Bias in the Evolution of Voluntary Energy Conservation Programs The
Review of Economics and Statistics 70(3) 448-458 (1998)
Haverman M Competitive Implications of Environmental Regulation in the Metal Finishing Industry Washington DC The Management Institute for Environment and Business Prepared for US EPA under cooperative agreement CR824410-01 (1996)
Henriques I and P Sadorsky The Determinants of an Environmentally Responsive Firm An Empirical Approach Journal of Environmental Economics and Management 30(3) 381-95 (1996)
Horowitz M Electricity Intensity in the Commercial Sector Market and Public Program Effects Energy
Journal 25(2) 115-137 (2004)
Khanna M and L Damon EPArsquos Voluntary 3350 Program Impact on Toxic Releases and Economic Performance of Firms Journal of Environmental Economics and Management 38(1) 1-28 (1999)
Khanna M W Quimio and D Bojilova Toxics Release Information A Policy Tool for Environmental Protection Journal of Environmental Economics and Management 36(3) 243-266 (1998)
King A M Lenox and M Barnett Strategic Responses to the Reputation Commons Problem In Hoffman and Ventresca (Eds) Organizations Policy and the Natural Environment Institutional and
Strategic Perspectives Stanford University Press Standford CA (2001)
King A and M Lenox Industry Self-Regulation Without Sanction The Chemical Industriesrsquo Responsible Care Program Academy of Management Journal 36(3) 243-266 (2000)
Konar S and M Cohen (2001) Does the Market Value Environmental Performance Review of
Economics and Statistics 83(2) 281-89 (2001)
Levinson A An Industry-Adjusted Index of State Environmental Compliance Costs in ldquoBehavioral and Distributional Effects of Environmental Policyrdquo (Carraro and Metcalf Eds) University of Chicago Press Chicago (2001)
Lutz S T Lyon and J Maxwell Quality Leadership When Regulatory Standards Are Forthcoming Journal of Industrial Economics 48(3) 331-348 (2000)
Maxwell J and T Lyon An Institutional Analysis of US Voluntary Environmental Agreements Working Paper Indiana University 99-27 (1999)
Maxwell J T Lyon and S Hackett Self-Regulation and Social Welfare The Political Economy of Corporate Environmentalism Journal of Law and Economics 43(2) 583-618 (2000)
Morgenstern R and S Al-Jurf Does the Provision of Free Technical Information Really Influence Firm Behavior Technological Forecasting and Social Change 61 13-24 (1999)
39
Organization for Economic Co-operation and Development Voluntary Approaches for Environmental
Policy in OECD Countries An Assessment Paris OECD (1999)
Segerson K and T Micelli Voluntary Environmental Agreements Good or Bad News for Environmental Protection Journal of Environmental Economics and Management 36(2) 109-130 (1998)
Strategic Goals Program (SGP) Website wwwstrategicgoalsotgabout (Relevant information last checked on May 16 2006)
Sunnevag K Voluntary Agreements and Incentives for Innovation Environment and Planning C
Government and Policy 18(5) 555-73 (2000)
US EPA Strategic Goals Program National Performance Goals and Action Plan Common Sense Initiative Metal Finishing Sector December 16 (1997)
US EPA The Toxics Release Inventory and Factors to Consider When Using TRI Data Available at wwwepagovtri2002_tri_brochurepdf (2002)
Wallace D Environmental Policy and Industrial Innovation Strategies in Europe the US and Japan
London Earthscan Publications Ltd (1995)
Welch E A Mazur and S Bretschneider Voluntary Behavior by Electric Utilities Levels of Adoption and Contribution of the Climate Challenge Program to the Reduction of Carbon Dioxide Journal of
Policy Analysis and Management 19(3) 407-425 (2000)
40


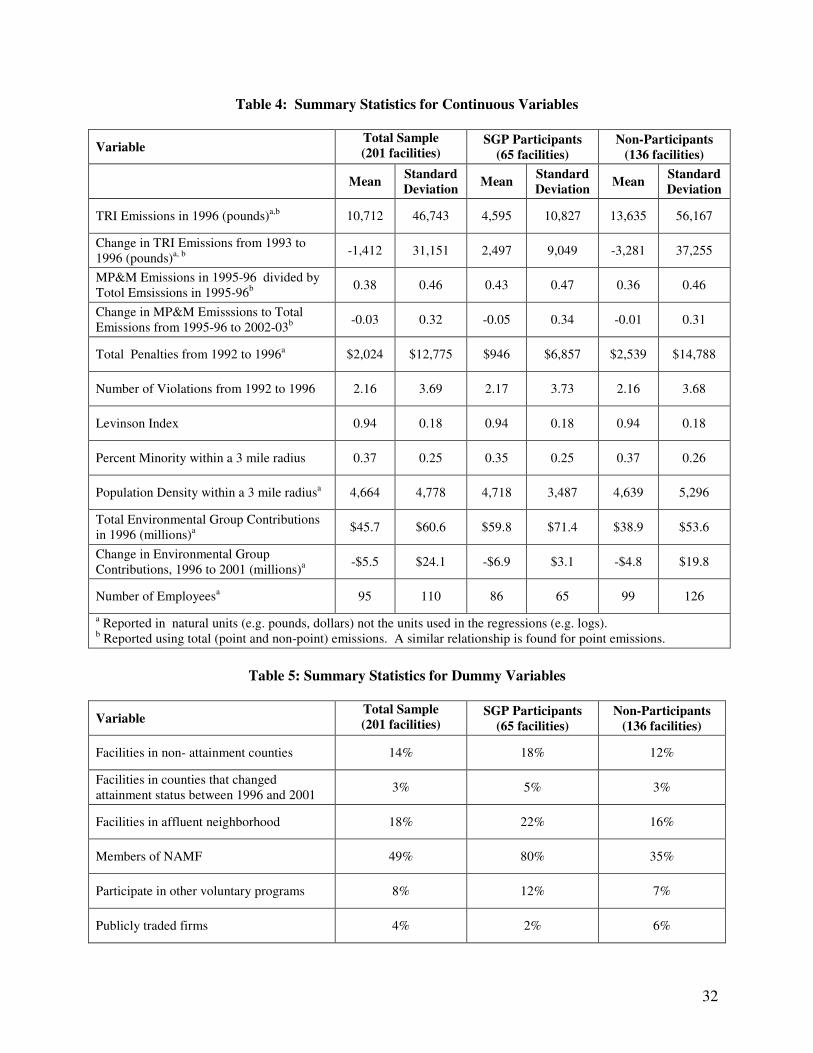


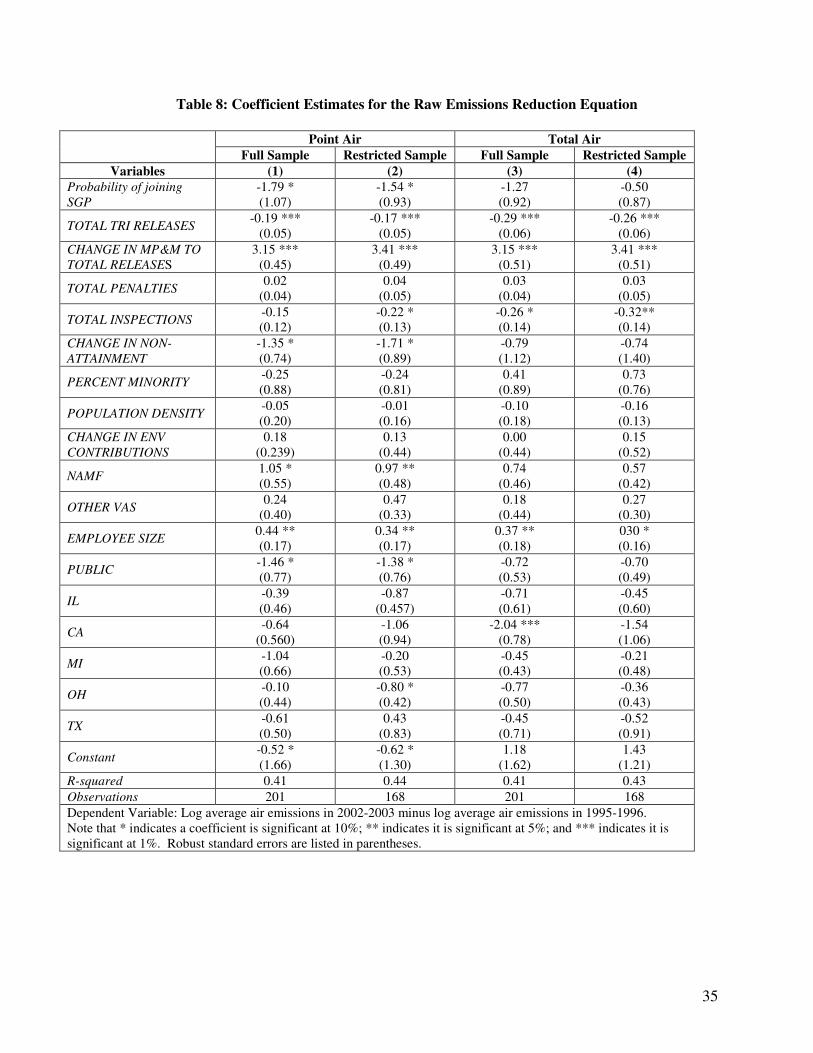
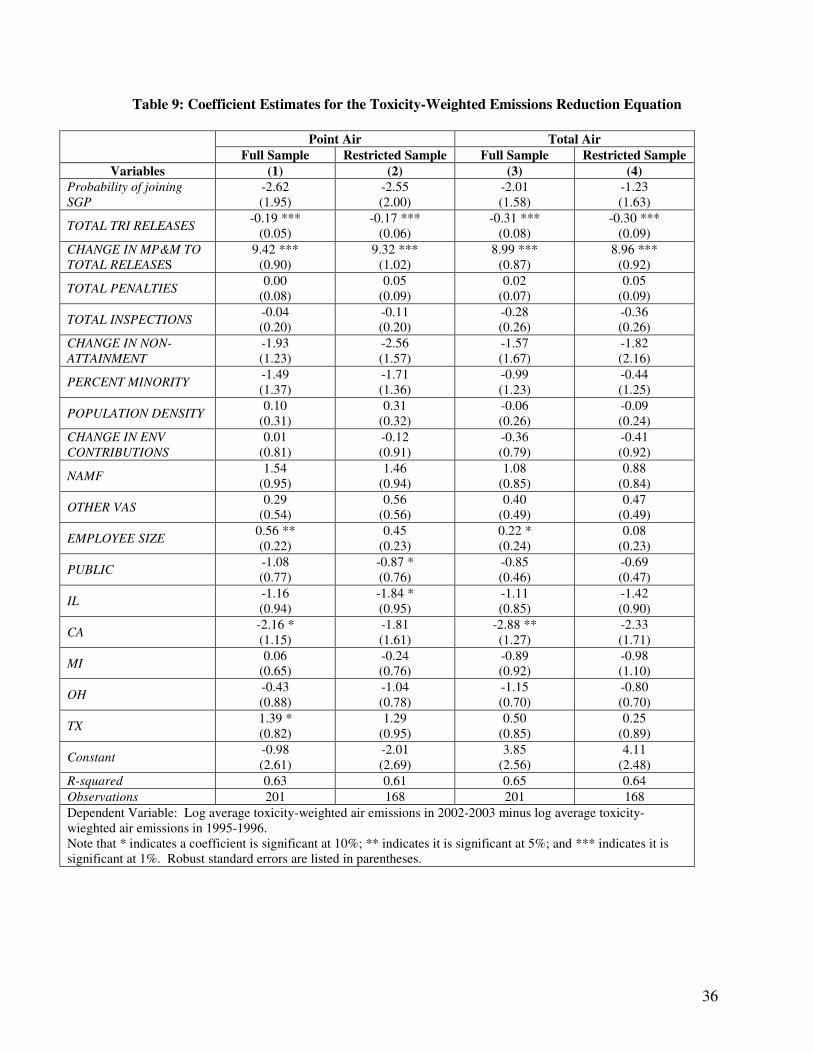


Recommended