Evaluating Hypotheses
Chapter 9

Descriptive vs. Inferential Statistics
Descriptive quantitative descriptions of
characteristics

Inferential Statistics
Making conclusions (inferences) about parameters e.g., X confidence intervals: infer lies
within interval also quantitative ~

Hypothesis Testing
Most widely used inferential statistics Hypothesis
testable assumption or inference about a parameter or distribution
should conclusion (inference) be accepted
final result a decision: YES or NO qualitative not quantitative ~

Hypothesis Testing
Example: IQ scores = 100, = 15 Take random sample of students
n = 10 Hypothesis:
sample is consistent with population with above parameters
sample is the same as population ~

Evaluating Hypotheses
Test statement about population using a statistic X for a sample:
add values & divide by n impossible or difficult for population need rules based on properties of
samples ~

Evaluating Hypotheses
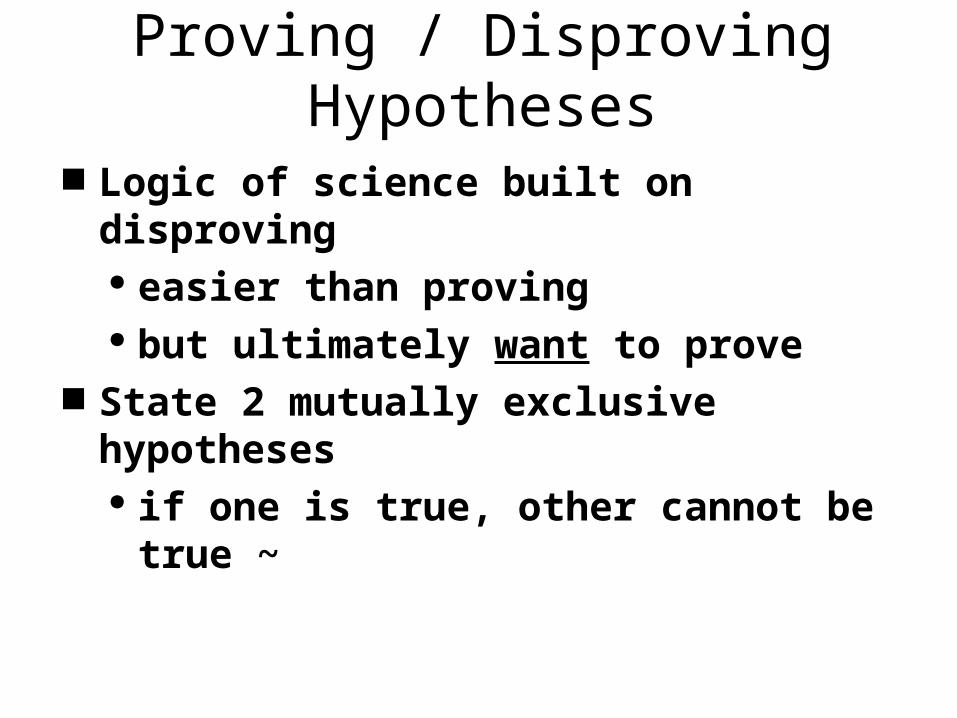
Proving / Disproving Hypotheses
Logic of science built on disproving easier than proving but ultimately want to prove
State 2 mutually exclusive hypotheses if one is true, other cannot be true ~
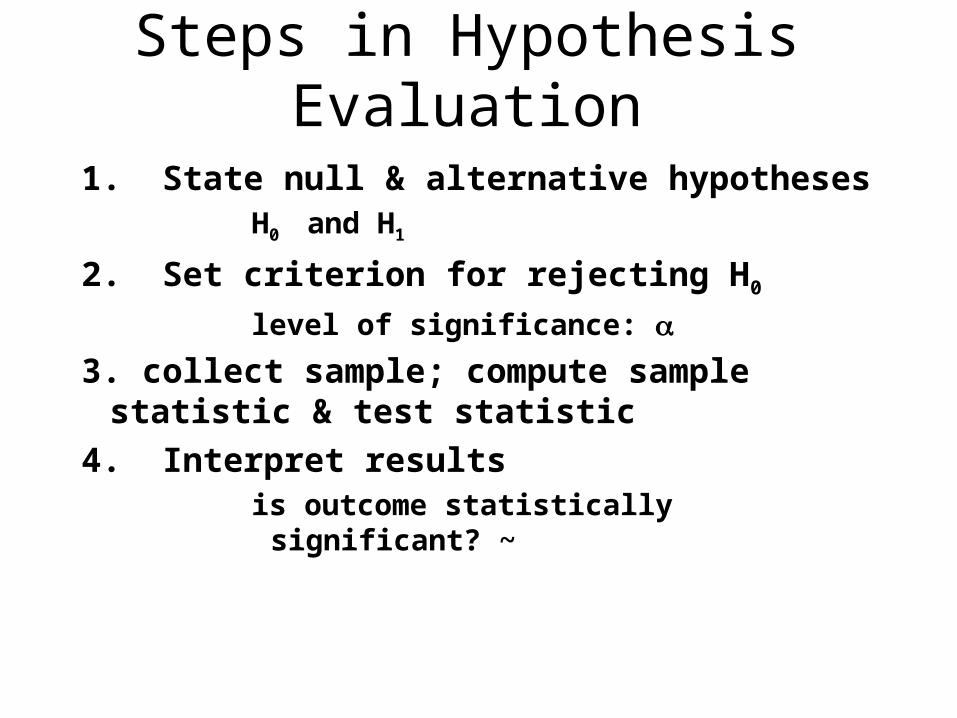
Steps in Hypothesis Evaluation
1. State null & alternative hypothesesH0 and H1
2. Set criterion for rejecting H0
level of significance:
3. collect sample; compute sample statistic & test statistic
4. Interpret resultsis outcome statistically significant? ~

Hypothesis Evaluation
1. Null Hypothesis: H0
there is no difference between groups
2. Alternative Hypothesis: H1 there is a difference between
groups ~

Hypothesis Evaluation
Example: IQ and electric fields question: Does living near power lines affect IQ
of children? H0 : there is no difference
Living near power lines does not alter IQ. = 100
H1 : Living near power lines does alter IQ. 100 ~

Hypothesis Evaluation
Outcome of study reject or “accept” null hypothesis
Reject Ho
accept as H1 true “Accepting” null hypothesis
difficult or impossible to “prove” Ho
actually: fail to reject Ho
do not have enough evidence to reject ~

Evaluating Ho and H1
Hypotheses about population parameters
Test statistic especially designed to test Ho
Procedure depends on… particular test statistic used directionality of hypotheses level of significance ~

Directionality & Hypotheses
Directionality effects critical values used Nondirectional
two-tailed test Ho : = 100; H1 : 100 change could be either direction Do not know what effect will be
may increase or decrease values ~
Directionality & Hypotheses
Directional one tailed Have prior evidence that suggests
direction of effectpredict that effect will be larger
or smaller, but only 1
Ho: < 100
H1: > 100 ~

Errors
“Accept” or reject Ho
only probability we made correct decision also probability made wrong decision
Type I error rejecting Ho when it is really true e.g., may think a new antidepressant is
effective, when it is NOT ~

Errors
Type II error “accepting” Ho when it is really false e.g., may think a new antidepressant is
not effective, when it really is Do not know if we make error
because we do not know true population parameters ~

Actual state of nature
H0 is true H0 is false
Decision
Accept H0
Reject H0
Correct
CorrectType I Error
Type II Error
Errors

Level of Significance ()
Probability of making Type I error complement of level of confidence .95 + .05 = 1
= .05 conduct experiment 100 times 5 times will make Type I error
rejected H0 when it should be accepted
Want probability of Type I error small ~

Statistical Significance
If reject H0
Outcome is “statistically significant” difference between groups is ...
greater than expected by chance alone due to sampling, etc.
Does NOT say it is meaningful ~

Statistical Power
Power probability of correctly rejecting H0
= probability of type II error complement of power ~

Practical Significance Degree to which result is important
result can be statistically significant but not important in real world no practical implications no universal method for reporting
Effect size measure of magnitude of result difference between means of 2 groups e.g., IQ: 1 point small effect, 15 large ~
Procedure for Evaluating Hypotheses
Experiment Draw random sample compute statistic determine if reasonably comes from
populationIf no reject H0
Use test statistic to make decision 3 important distributions
variable, sample statistic, test statistic~

Test Statistic distribution of test statistic
has known probabilities General form
test statistic = sample statistic - population parameter
standard error of sample statistic
difference actually obtainedX -
divided by difference by chance alone ~

Steps in Hypothesis Evaluation
1. State null & alternative hypothesesH0 and H1
2. Set criterion for rejecting H0
level of significance:
3. collect sample; compute sample statistic & test statistic
4. Interpret resultsis outcome statistically significant? ~
Recommended