1
Economic Evaluation of Health Cost of Pesticide Use:
Willingness to Pay Method
Muhammad Khan1
Abstract
This study highlights the results of contingent valuation method to measure health cost of
pesticide use from farmer’s point of view. Analysis shows that farmers have a positive
willingness to pay for avoiding pesticide related health risks. Theoretical validity tests show that
relevant indicators such as risk perception, previous experience of pesticide related poisoning,
education and income are significant predictors for the Positive WTP. From the results it is
evident that health effects of pesticide use provided motivation for farmers to pay more for
practices like IPM that reduce dependence on pesticide use which in turn a strong motivation for
policy makers to continue research on IPM and its implementation.
Key words: Health cost, WTP, pesticide use, IPM.
Correspondence: [email protected]
1. INTRODUCTION
Pesticides are the most familiar way to control pests. It helps farmers to kill pests that would
otherwise reduce the yield obtained from fields. This role of pesticides, on the other hand is
accompanied by disutility in the form of health impairment. Due to the high interdependency of
farms and farm workers, an impairment of the health status of the farm worker imposes potential
1 Author is a PhD scholar in Federal Urdu University Islamabad and this work is a part of PhD dissertation.

2
negative effect on agricultural production (AJAYI, 2000). This negative effect may manifest in a
lower level of farm production (e.g. through a reduction in the number of farm labour that are
available to work at farm). It may also lead to decrease income for the agricultural household
(e.g. through a reduction in the output level). Another negative effect is that it may lead to a
reduction in the amount of leisure time available for the household (through a reduction in the
leisure time available for sick worker or more stress of work for the healthy members of farm
household who have to work more and harder to fill in for sick members).
In addition to short term health effects, there is now growing evidence of chronic effects of
pesticide use which indeed impose potential negative effects on farm production in future.
Given that labor is the most important factor in agricultural production particularly in developing
countries, the use of pesticides therefore lower potential output not only in short run but also in
long run through negative impacts on the health of farm workers.
1.1 ECONOMIC EVALUATION of HEALTH COST
Like many other environmental goods, economic evaluation of health cost of pesticide use is
embarrassed by the practical obstacles because of different value components of human health;
market component such as the cost of illness, productivity loss, work days loss (are those on
which a person is unable to engage in ordinary gainful employment) and non market component
includes like cost of discomfort.
Since it is difficult to integrate market and non-market elements of health cost in a health cost
model, evaluations of health costs of pesticides so far have focused on the market components,
estimating the costs of illness, work days loss and productivity loss. Different researchers used
different approaches include: accounting for farmers’ private expenses for the treatment of acute
poisoning and the opportunity cost of labour days lost due to illness (AJAYI, 2000; HUANG et
3
al. 2000) which obviously a conservative measure of health cost. Others like (ROLA, 1993)
included effects on the productivity of the family labour and estimates of the cost of chronic
illnesses based on clinical studies (Hildegard Garming, 2006). Since economic perspective on
health focuses on effects that people are aware of and want to avoid, that is, health effects that
would decrease their utility. “Much clinical research focuses on effects of questionable
significance to individuals, and measures effects that are difficult to relate to individuals
perceptions and behavior” (A.M.Freeman, 2003).
Keeping in mind that individual’s preferences give better/suitable basis for making decisions
about changes in welfare, reduction in health effects should be measured according to
individual’s preferences or willingness to pay. Hence, the contingent valuation method (CV)2 has
been proposed in order to obtain a valuation of health based on the individuals’ preferences. As
pointed by Richard T. Carson (2000), CV is a useful tool for benefit-cost analysis and offers
potentially valid measure to trace out the distribution of willingness to pay3 for a population of
economic agents for a proposed change in a good. Through benefit-cost analysis, welfare
economics, attempts to explain possible change in utility resulting from a minor change in an
economic variable. Typically, welfare implications are demonstrated in terms of a change in
monetary amount which would need to be taken from or given to the agent to keep the agent's
overall level of utility constant (Richard T. Carson, 2000).Conceptually, the same measure of
2 In this approach, respondents are offered a hypothetical market, in which they are asked to express the WTP for
existing or potential environmental conditions not reflected in any real market. The monetary values obtained in this
way are thought to be contingent upon the nature of the constructed market, and the commodity described in the
survey scenario (Hildegard Garming, 2006). The answers offered a direct way to trace the demand curve for an
environmental good that could not otherwise be seen from the market data (W.M. Hanemann, 1994).
3 CV is better measure of health cost of pesticide use since; it also includes non-market value.
4
benefit applies to non-market goods, that is, the maximum amount an individual would pay to
avoid losing, or gaining, access to the good (W.Lipton Douglas, 1995).
2. THEORETICAL BACKGROUND
Microeconomic theory provides necessary elements to model the decision process of an
individual’s choice of non-market good. In Contingent Valuation Method, the change in the
supply of a non-market good is evaluated with respect to a constant utility for the individuals
following the concept of Hicks compensated demand functions. The utility of the farm
household (U0) can be expressed as the sum of health (H0) and other goods, summarized as
income (Y0). If supply with health is improved to H1, keeping income constant, farmers move to
a higher utility level (U1). The value of the change in supply is measured as that amount of
income that the farmer is willing to pay (WTP) in order to be indifferent about the change in
health i.e. to remain on his initial utility level, conceptually, using an indirect utility framework;
the economic valuation construct can then be represented as:
U0 = Y0 + H0+P0 = Y0 – C (WTP) + H1+ P0
Where, for a given individual, U0 is a base level of utility, P0 represents existing prices, Y0 is
current income, and H1 is the improved health. WTP is the amount of income a farmer would
give up in order to gain improved health, while maintaining a constant level of utility. Also the
Willingness to pay is a function of the product attributes, characteristics of the consumer, and
other factors thought to influence the choice.
3. RESEARCH METHODOLOGY
3.1 Sampling and Data Collection
5
Data from the Pakistan agriculture statistics (Agriculture Census, 2000) were collected to find
the composition of pesticide use in different crops and geographical areas. Cotton has been
identified as the major crop, which accounts more than 80% of total pesticide use in Pakistan
(pesticide use survey report, 2002). Whereas more than 80% of cotton is produced in Punjab
province and being the center of cotton crop the cotton zone of the Punjab has been recognized
as the most intensive with respect to pesticide use. Over all two districts (Lodhran & Vehari) of
the cotton belt in Punjab province are selected for the study.
A well- designed, comprehensive and pre-tested questionnaire was used to collect data from both
the districts in 2008. The method of meeting interview was used for filling in the questionnaire
and all interviews were conducted face to face. The questionnaire is based on United States
Environmental Protection Agency questions and on that used in the similar World Bank studies
in Bangladesh and Vietnam4. Sampling for this study combined purposive and probabilistic
sampling methods.
To study a small subset of a larger population in which many members of the subset could easily
be identified. Area sample/cluster sampling was used to collect data economically. Hence as a
sampling strategy, after the selection of study districts, all three tehsils were chosen for survey as
the representative area. At least three villages (clusters), from every tehsil were selected in each
district to get the pesticide-related information from a sample of pesticide applicators and
farmers. In each village, well informed men were hired to make farmer’s list in their respective
villages. Overall 915 farmers from both the districts, 412 from district Vehari and 503 from
district Lodhran were enlisted. A random sample of 400 farmers was drawn with replacement
4 See (Susmita Dasgupta, 2005)
6
using (RANDOM. ORG, 2008). Respondents were selected in order from the numbers drawn
until 318 interviews were successfully completed. The overall response rate (i.e. successful
interviews completed) was 80%, including 85% response rate for Lodhran district and 75%
response rate for Vehari district.
The Statistics of reliability analysis shows a reasonably good reliability value (.70). Hence
questionnaire appeared to have good internal consistency. All items appeared to be worthy of
retention except health effects. But the change in overall alpha if item is deleted is only.708.
Nevertheless this increase is not dramatic and both values reflect reasonable degree of reliability.
3.2 Validity and Reliability Tests of CVM
Since CVM has been criticized for relying on stated preferences instead of observable behavior
and controversy, to some extent continues to exist between researchers regarding validity and
reliability of CVM, it is important to discuss this issue in present context.
Validity refers to the correspondence between what one wished to measure and what was
actually measured. Reliability refers to the measurement's replicability (Richard T. Carson,
2000). Both terms can be operationalized in a variety of ways. The ideal way of determining
validity is by comparing the measurement made to some criterion measurement known to be
correct. Unfortunately, such a criterion to which CVM can be compared does not exist.
Furthermore, no such criterion exists to which any other consumer surplus estimate can be
compared, irrespective of the econometric technique used or whether the good is private or
public (Gunatilake, 2003). In such cases, investigators adopt different approaches to determining
validity; two common ones are construct validity and convergent validity. Construct validity
refers to how well the measurement is predicted by factors that one would expect to be predictive
7
a priori. Convergent validity can be taken only when measurements of the phenomena of interest
are available using two different techniques. Two types of reliability have interested CV
researchers. One is the chronological/temporal stability of the estimate if two different samples
of the sample population are interviewed with the same survey instrument at two different points
in time. The other is the classic test-retest reliability where an original sample of respondents is
later re-interviewed using the same survey tool.
In practice, as described by Hildegard Garming (2006) that there is consensus among researchers
that the reliability of the CV is not an issue of concern; one should stress on the validity of the
results for the assessment of the quality of the particular CV studies. For validity of the CV, there
are two main types of validity assessments. Content validity refers to the design of the survey
instrument. Is the good defined in a way that the correct value can be measured? Are respondents
provided with sufficient and plausible information? Is the proposed way of payment acceptable
and scenarios plausible? Careful survey design and pre-tests are tools to enhance content validity
(Hildegard Garming, 2006). The theoretical validity test applies the idea that the preferences for
environmental (non-market) goods follow the same rules as the preferences for conventional
market goods. The valuation should be sensitive to the quantity of the good and WTP should
vary with income and attitudes towards the good. Attitudes towards the good, e.g. concerns about
pesticide poisoning and experience of illness, as well as budget constraints and risk measures
like intensity of pesticide use are expected to have an impact on farmers’ valuation of pesticide
related health. In addition, study followed NOAA guidelines for good practices in CVM obtained
by Portney (1994).
The design of the questionnaire therefore was guided by the CV guidelines, data requirements
for the WTP analysis and the tests on the validity. Table 1 gives a snapshot of the validity criteria
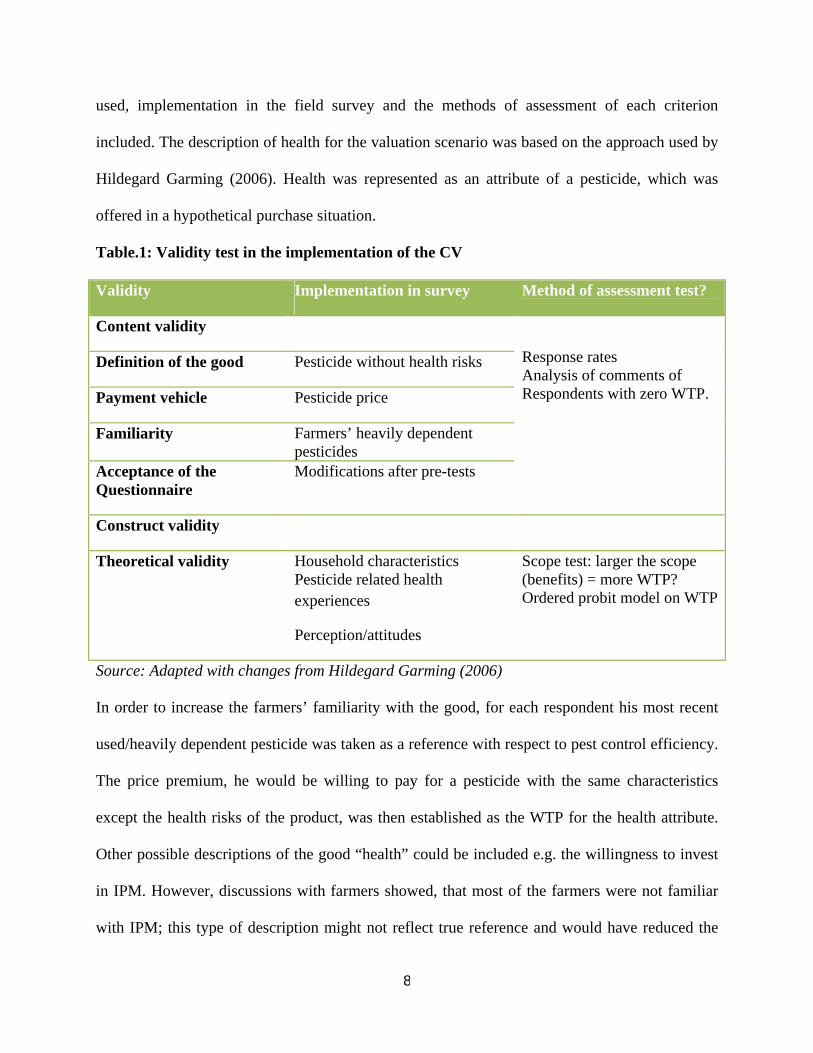
8
used, implementation in the field survey and the methods of assessment of each criterion
included. The description of health for the valuation scenario was based on the approach used by
Hildegard Garming (2006). Health was represented as an attribute of a pesticide, which was
offered in a hypothetical purchase situation.
Table.1: Validity test in the implementation of the CV
Validity Implementation in survey Method of assessment test?
Content validity
Definition of the good Pesticide without health risks
Payment vehicle Pesticide price
Familiarity Farmers’ heavily dependent pesticides
Acceptance of the Questionnaire
Modifications after pre-tests
Response rates Analysis of comments of Respondents with zero WTP.
Construct validity
Theoretical validity Household characteristics Pesticide related health experiences
Perception/attitudes
Scope test: larger the scope (benefits) = more WTP? Ordered probit model on WTP
Source: Adapted with changes from Hildegard Garming (2006)
In order to increase the farmers’ familiarity with the good, for each respondent his most recent
used/heavily dependent pesticide was taken as a reference with respect to pest control efficiency.
The price premium, he would be willing to pay for a pesticide with the same characteristics
except the health risks of the product, was then established as the WTP for the health attribute.
Other possible descriptions of the good “health” could be included e.g. the willingness to invest
in IPM. However, discussions with farmers showed, that most of the farmers were not familiar
with IPM; this type of description might not reflect true reference and would have reduced the
9
plausibility of this scenario for the farmers. Thus the most practical description remains chemical
pesticides which farmers are very familiar with, rendering the “low toxicity pesticide option” as
the most feasible option for the CV survey (Hildegard Garming, 2006)
Following standard practice in CVM analyses, the respondents were asked5, suppose that you
were able to have access to a pesticide that was just as effective as the one(s) you are using now,
but it did not have any short- or long- term health effects. Thinking about the health effects you
have experienced with your current use of pesticides, how much would you be willing to pay for
the use of the safer pesticide? Furthermore, economic theory would suggest that consumer’s
choices are influenced by their individual tastes and preferences, income, attitudes towards and
perceptions of the different types of products, as well as household and demographic
characteristics (Hildegard Garming, 2006). One could then use the relationship between WTP
and factors affecting WTP.
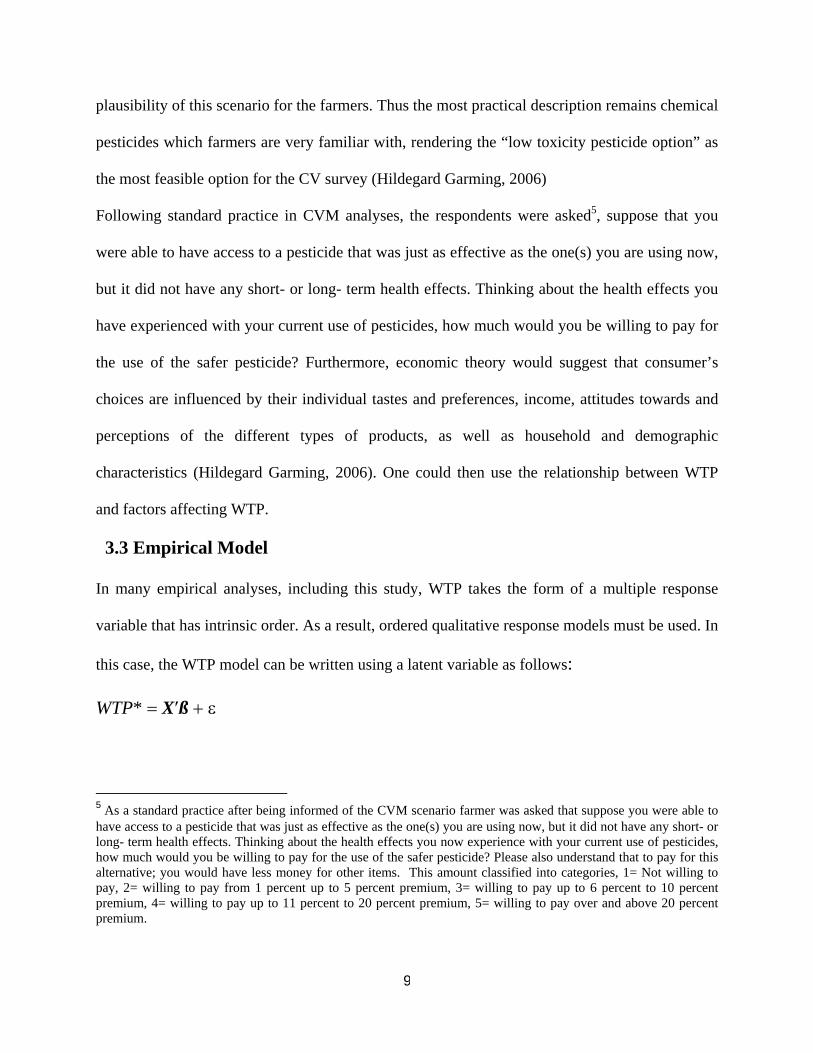
3.3 Empirical Model
In many empirical analyses, including this study, WTP takes the form of a multiple response
variable that has intrinsic order. As a result, ordered qualitative response models must be used. In
this case, the WTP model can be written using a latent variable as follows:
WTP* X ß
5 As a standard practice after being informed of the CVM scenario farmer was asked that suppose you were able to have access to a pesticide that was just as effective as the one(s) you are using now, but it did not have any short- or long- term health effects. Thinking about the health effects you now experience with your current use of pesticides, how much would you be willing to pay for the use of the safer pesticide? Please also understand that to pay for this alternative; you would have less money for other items. This amount classified into categories, 1= Not willing to pay, 2= willing to pay from 1 percent up to 5 percent premium, 3= willing to pay up to 6 percent to 10 percent premium, 4= willing to pay up to 11 percent to 20 percent premium, 5= willing to pay over and above 20 percent premium.
10
Where WTP* is the latent (or unobserved) willingness-to-pay, X is a vector of variables thought
to influence willingness-to-pay, ß is a vector of parameters reflecting the relationship between
willingness-to-pay and variables in X and is an independently and identically distributed error
term with mean zero and variance one. If a farmer’s WTP* falls within a certain range, their
WTP is assigned a numerical value that reflects the category in which their unobserved
willingness-to-pay lies (J. A. L. Cranfield, 2003).
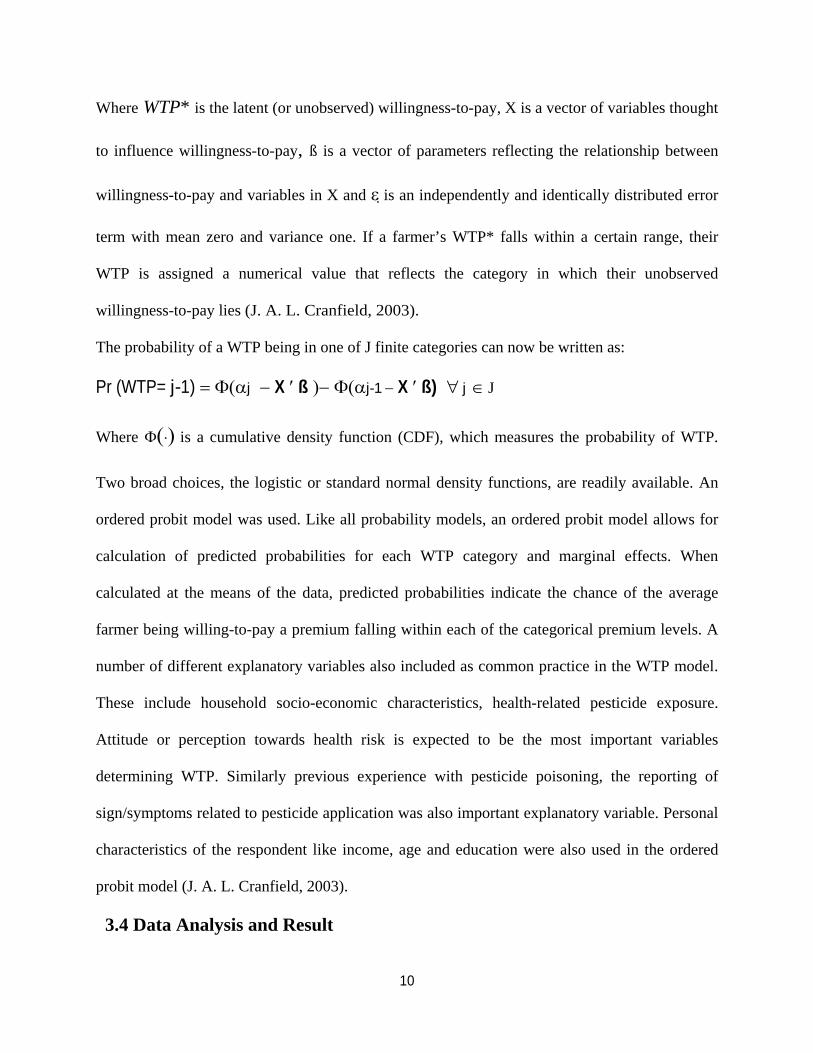
The probability of a WTP being in one of J finite categories can now be written as:
Pr (WTP= j-1) j X ß j-1
X ß)
j
J
Where is a cumulative density function (CDF), which measures the probability of WTP.
Two broad choices, the logistic or standard normal density functions, are readily available. An
ordered probit model was used. Like all probability models, an ordered probit model allows for
calculation of predicted probabilities for each WTP category and marginal effects. When
calculated at the means of the data, predicted probabilities indicate the chance of the average
farmer being willing-to-pay a premium falling within each of the categorical premium levels. A
number of different explanatory variables also included as common practice in the WTP model.
These include household socio-economic characteristics, health-related pesticide exposure.
Attitude or perception towards health risk is expected to be the most important variables
determining WTP. Similarly previous experience with pesticide poisoning, the reporting of
sign/symptoms related to pesticide application was also important explanatory variable. Personal
characteristics of the respondent like income, age and education were also used in the ordered
probit model (J. A. L. Cranfield, 2003).
3.4 Data Analysis and Result
11
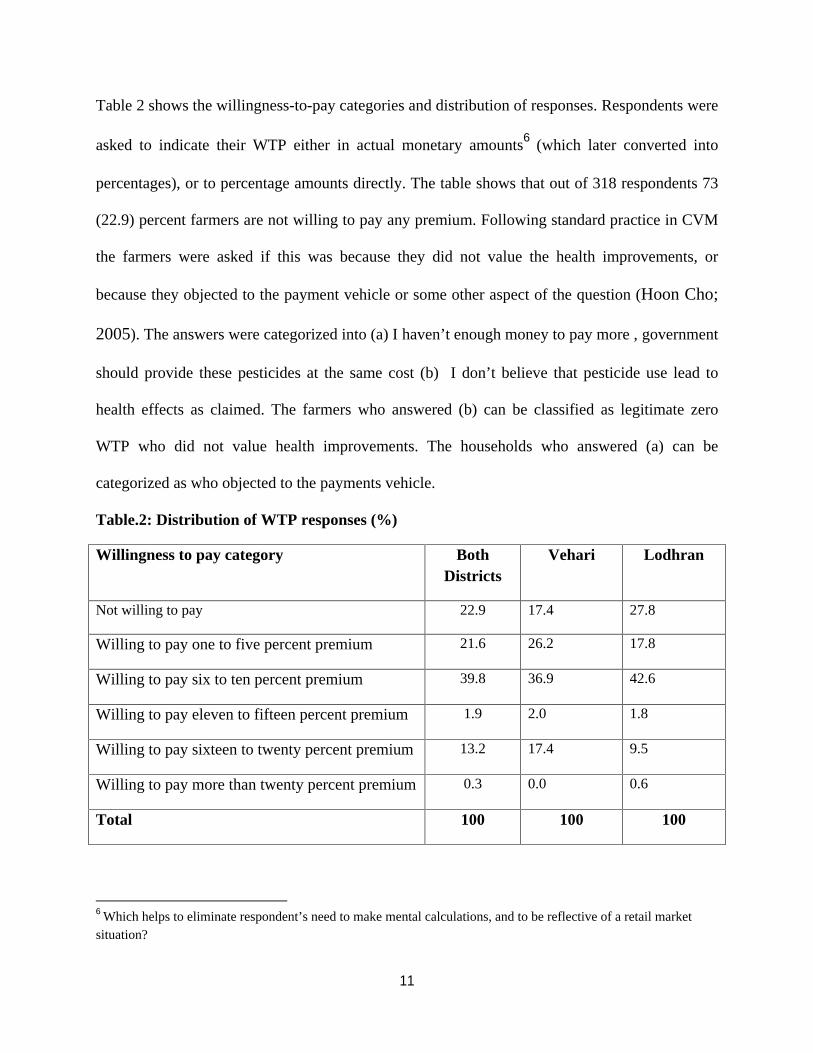
Table 2 shows the willingness-to-pay categories and distribution of responses. Respondents were
asked to indicate their WTP either in actual monetary amounts6 (which later converted into
percentages), or to percentage amounts directly. The table shows that out of 318 respondents 73
(22.9) percent farmers are not willing to pay any premium. Following standard practice in CVM
the farmers were asked if this was because they did not value the health improvements, or
because they objected to the payment vehicle or some other aspect of the question (Hoon Cho;
2005). The answers were categorized into (a) I haven’t enough money to pay more , government
should provide these pesticides at the same cost (b) I don’t believe that pesticide use lead to
health effects as claimed. The farmers who answered (b) can be classified as legitimate zero
WTP who did not value health improvements. The households who answered (a) can be
categorized as who objected to the payments vehicle.
Table.2: Distribution of WTP responses (%)
Willingness to pay category Both Districts
Vehari Lodhran
Not willing to pay 22.9 17.4 27.8
Willing to pay one to five percent premium 21.6 26.2 17.8
Willing to pay six to ten percent premium 39.8 36.9 42.6
Willing to pay eleven to fifteen percent premium 1.9 2.0 1.8
Willing to pay sixteen to twenty percent premium 13.2 17.4 9.5
Willing to pay more than twenty percent premium 0.3 0.0 0.6
Total 100 100 100
6 Which helps to eliminate respondent’s need to make mental calculations, and to be reflective of a retail market situation?

12
The zero responses are significantly higher in District Lodhran which was expected since
farmers in District Vehari are relatively more educated as well as having higher mean income
and higher risk perception. This is also evident from the table 3. The results, therefore, appear
logical and consistent with theory and existing literature.
Table.3: District Wise Mean WTP
Mean WTP (%) Mean WTP amount in (Rs)
WTP in Lodhran 7.5 542
WTP in Vehari 8.8 628
Total sample WTP 8.1 582
The mean willingness to pay appears to be very low, as compared to other studies such as
Hildegard Garming (2006) found that farmers in Nicaragua willing to pay 28% more, the total
cost of pesticide. Similarly Leah C. M.Cuyno (1999) found that Philippines farmers were willing
to pay 22% of pesticide costs for human health category. This is however not surprising, if taking
into account, that the most of the farmers are poor (small-scale farmers), and uneducated.
3.4.1 Age, Gender and Education of the Farmers
All the surveyed farmers were male; this is because usually the spraying operations are done by
male in Pakistan. Age ranges from 18 to 66 years, with an average age of 33.3 years
approximately. Most of the farmers 113 were in age groups 21-30 (35.5%) and 101 were in age
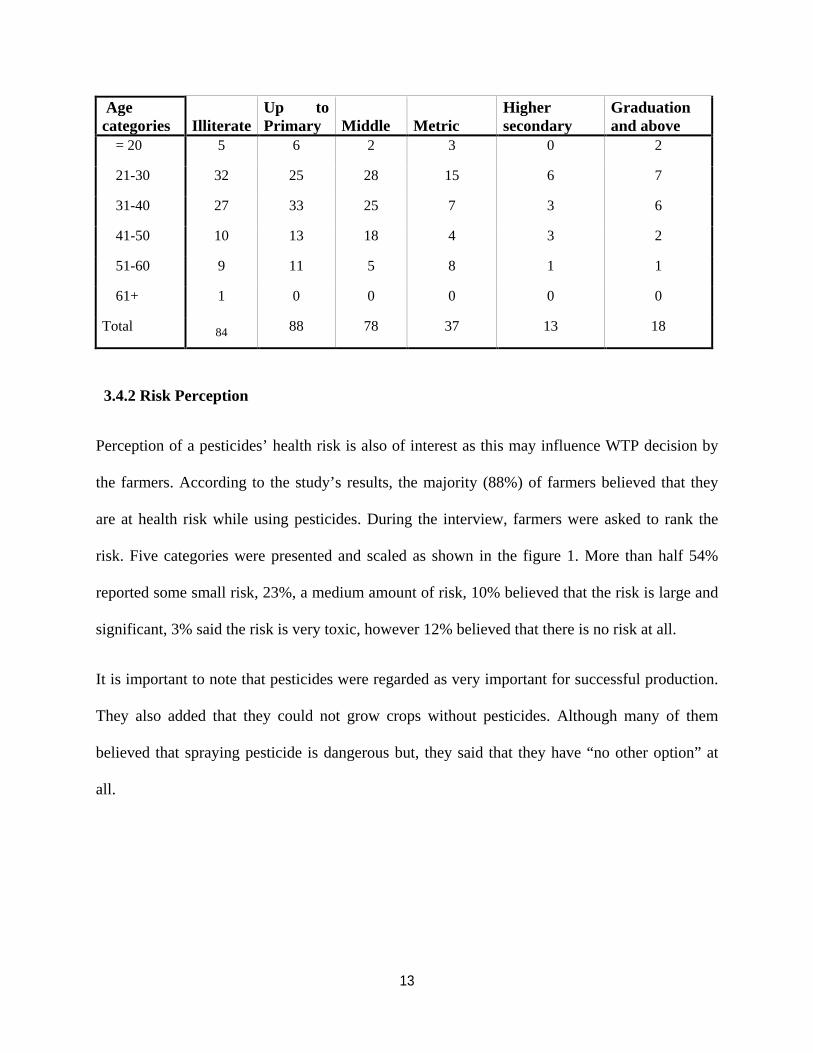
group of 31-40 (31.8%). The table 4 displays the education attainment of different age groups.
Table.4: Education attainment of different age groups
Education attainment
13
Age categories Illiterate
Up to Primary Middle Metric
Higher secondary
Graduation and above
= 20 5 6 2 3 0 2
21-30 32 25 28 15 6 7
31-40 27 33 25 7 3 6
41-50 10 13 18 4 3 2
51-60 9 11 5 8 1 1
61+ 1 0 0 0 0 0
Total 84 88 78 37 13 18
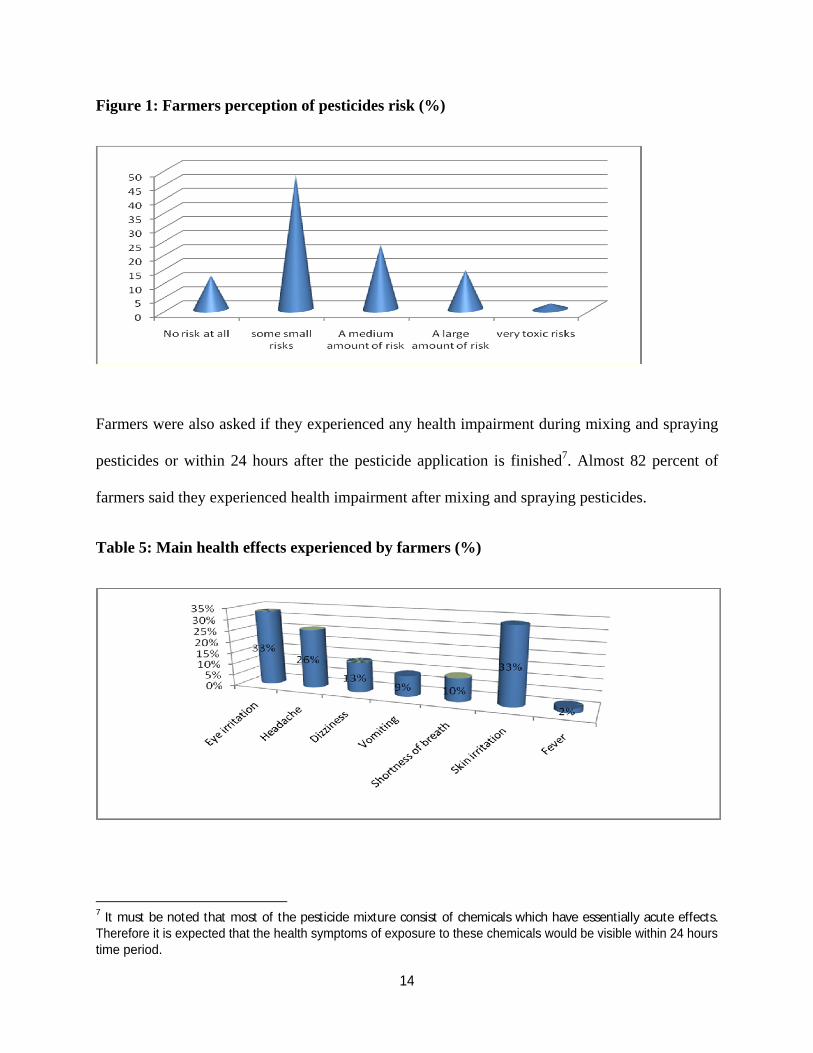
3.4.2 Risk Perception
Perception of a pesticides’ health risk is also of interest as this may influence WTP decision by
the farmers. According to the study’s results, the majority (88%) of farmers believed that they
are at health risk while using pesticides. During the interview, farmers were asked to rank the
risk. Five categories were presented and scaled as shown in the figure 1. More than half 54%
reported some small risk, 23%, a medium amount of risk, 10% believed that the risk is large and
significant, 3% said the risk is very toxic, however 12% believed that there is no risk at all.
It is important to note that pesticides were regarded as very important for successful production.
They also added that they could not grow crops without pesticides. Although many of them
believed that spraying pesticide is dangerous but, they said that they have “no other option” at
all.
14
Figure 1: Farmers perception of pesticides risk (%)
Farmers were also asked if they experienced any health impairment during mixing and spraying
pesticides or within 24 hours after the pesticide application is finished7. Almost 82 percent of
farmers said they experienced health impairment after mixing and spraying pesticides.
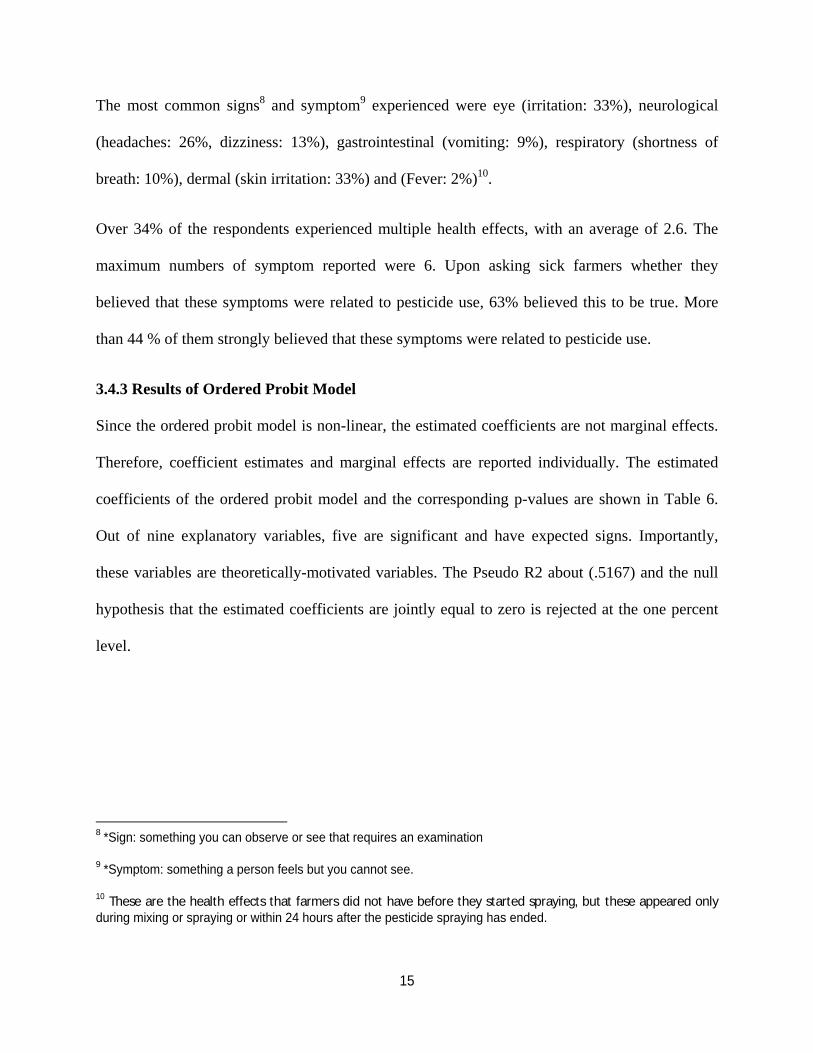
Table 5: Main health effects experienced by farmers (%)
7 It must be noted that most of the pesticide mixture consist of chemicals which have essentially acute effects. Therefore it is expected that the health symptoms of exposure to these chemicals would be visible within 24 hours time period.
15
The most common signs8 and symptom9 experienced were eye (irritation: 33%), neurological
(headaches: 26%, dizziness: 13%), gastrointestinal (vomiting: 9%), respiratory (shortness of
breath: 10%), dermal (skin irritation: 33%) and (Fever: 2%)10.
Over 34% of the respondents experienced multiple health effects, with an average of 2.6. The
maximum numbers of symptom reported were 6. Upon asking sick farmers whether they
believed that these symptoms were related to pesticide use, 63% believed this to be true. More
than 44 % of them strongly believed that these symptoms were related to pesticide use.
3.4.3 Results of Ordered Probit Model
Since the ordered probit model is non-linear, the estimated coefficients are not marginal effects.
Therefore, coefficient estimates and marginal effects are reported individually. The estimated
coefficients of the ordered probit model and the corresponding p-values are shown in Table 6.
Out of nine explanatory variables, five are significant and have expected signs. Importantly,
these variables are theoretically-motivated variables. The Pseudo R2 about (.5167) and the null
hypothesis that the estimated coefficients are jointly equal to zero is rejected at the one percent
level.
8 *Sign: something you can observe or see that requires an examination
9 *Symptom: something a person feels but you cannot see.
10 These are the health effects that farmers did not have before they started spraying, but these appeared only during mixing or spraying or within 24 hours after the pesticide spraying has ended.
16
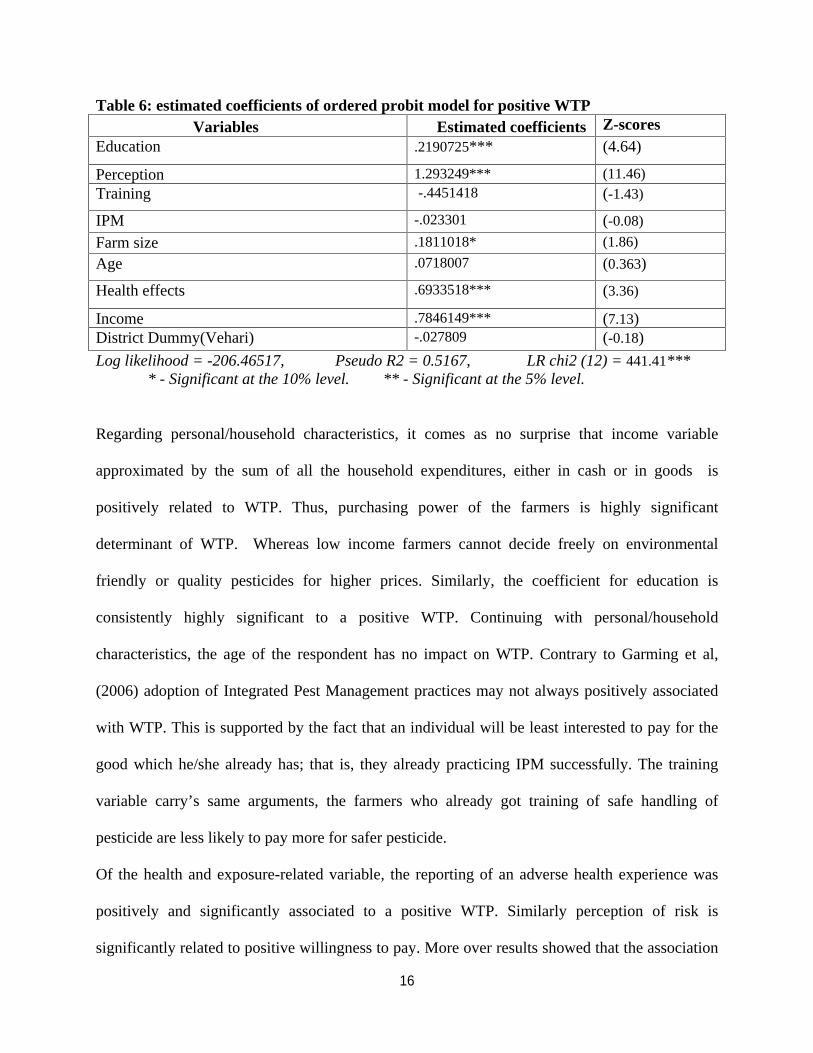
Table 6: estimated coefficients of ordered probit model for positive WTP Variable Variables W Estimated coefficients
Z-scores
Education .2190725*** (4.64)
Perception 1.293249*** (11.46) Training -.4451418 (-1.43)
IPM -.023301 (-0.08)
Farm size .1811018* (1.86)
Age .0718007 (0.363)
Health effects .6933518*** (3.36)
Income .7846149*** (7.13) District Dummy(Vehari) -.027809 (-0.18)
Log likelihood = -206.46517, Pseudo R2 = 0.5167, LR chi2 (12) = 441.41*** * - Significant at the 10% level. ** - Significant at the 5% level.
Regarding personal/household characteristics, it comes as no surprise that income variable
approximated by the sum of all the household expenditures, either in cash or in goods is
positively related to WTP. Thus, purchasing power of the farmers is highly significant
determinant of WTP. Whereas low income farmers cannot decide freely on environmental
friendly or quality pesticides for higher prices. Similarly, the coefficient for education is
consistently highly significant to a positive WTP. Continuing with personal/household
characteristics, the age of the respondent has no impact on WTP. Contrary to Garming et al,
(2006) adoption of Integrated Pest Management practices may not always positively associated
with WTP. This is supported by the fact that an individual will be least interested to pay for the
good which he/she already has; that is, they already practicing IPM successfully. The training
variable carry’s same arguments, the farmers who already got training of safe handling of
pesticide are less likely to pay more for safer pesticide.
Of the health and exposure-related variable, the reporting of an adverse health experience was
positively and significantly associated to a positive WTP. Similarly perception of risk is
significantly related to positive willingness to pay. More over results showed that the association

17
between the farmers’ risk perception and WTP is very strong. Thus risk perception is the most
important determinant for positive WTP. The size of the farm is significant to the positive WTP
in present analysis which was very much expected since it can be interpreted as an indicator of
wealth. With respect to the different regions, WTP is not significantly different in both the
districts.
The predicted probabilities for the five willingness to pay categories are reported in table 7. The
reported probabilities indicate the likelihood that on average farmers are willing-to-pay some
premium for safe pesticides which possibly improve their health.
Table 7: Predicted probabilities and marginal effects from the estimated model
WTP(=0) WTP (1-5 %) WTP (6-10%) WTP (11-20%) WTP (20 %
& above)
Predicted
probabilities
.03946155 .38032781 .57760992 .00260072 7.644e-10
Marginal effects
age -.0061195 -.0219439 .0274859 .0005775 3.40e-10
perception -.1102229 -.3952452 .4950665 .0104016 6.13e-09
Health effects -.0869063 -.1842272 .2676826 .0034509 1.66e-09
IPM .0020161 .0071064 -.0089395 -.000183 -1.05e-10
Training .0503218 .1256599 -.1735827 -.002399 -1.05e-09
Farm size -.0154352 -.0553487 .0693273 .0014566 8.58e-10
Education -.0186714 -.0669534
.0838628 .001762 1.04e-09
Income -.0668723 -.2397955
.3003572 .0063106 3.72e-09
District (Vehari)
.0023701 .008499 -.0106455 -.0002237 -1.32e-10
The table has two panels, the upper panel reports predicted probabilities and the lower indicates
the marginal effect for all explanatory variables. Model includes both continuous and binary
variables. Starting from top of the table, age of the farmers, nevertheless not significant more

18
likely to pay some premium for safer pesticides since we also assume age as the proxy of
farming/pesticide use experience, suggests that farmers who have been using pesticide since long
are more likely to perceive higher risk and therefore willing to pay premium for safer pesticides.
Differently this can also be explained in terms of income of the farmers. Old farmers are more
likely having higher income and more empowered. The “risk perception” variables have negative
marginal effects for the first two WTP categories (i.e., the not willing to pay any more and the
willing to pay between one and five percent categories), but a positive marginal effect for the
other willingness-to-pay categories. Moreover, the marginal effect tends to be very strong for the
category “medium amount of risk”. Thus the farmers who perceive pesticide a health risk are
more likely to be willing to pay premium relative to those who do not perceive pesticides a
health hazard.
The pesticide related health effect variable has negative marginal effects for first two categories
of WTP but positive marginal effects for other three categories of WTP. These results are
analogous to priory expectation since logically, negative health experiences from the pesticides
more likely to influence farmer’s attitudes to pay higher premium for safe pesticide. The
marginal effect of education is negative for the first two categories of WTP; but it is positive for
the higher categories of WTP. This suggests that holding, other things same, there is a higher
probability of being in lower WTP categories when farmer’s education is low compared relative
to when farmer’s education is higher. Differently, more educated farmers are more likely to pay
higher premium for safe pesticide relative to less educated farmers.
The marginal effects of training and IPM variables for the first two categories (i.e., the not
willing to pay any more and the willing to pay between one and five percent categories) are
positive, such that the farmers who got training of safe handling of pesticide use and farmers
19
who currently practicing IPM are more likely to pay either no premium or up to five percent
premium and very less likely willing to pay higher premium for safe pesticides. The income
variable shows a similar pattern. The marginal effect for the first two categories of WTP is
negative however these effects are positive for other categories. This is because higher income
farmers can afford premium. The farm size variable follows same reasoning. This variable is an
indicator of individual’s wealth which ultimately expands farmer’s budget constraints. Thus
more the size of farm, the more likely farmer willing to pay premium for safe pesticides. The
result is parallel to priory expectation and consistent to theory.
4. CONCLUSION
This paper highlights the results of contingent valuation method to measure health cost of
pesticide use from farmer’s point of view. Analysis shows that farmers have a positive
willingness to pay for avoiding pesticide related health risks. Theoretical validity tests show that
relevant indicators such as risk perception, previous experience of pesticide related poisoning,
education and income are significant predictors for the Positive WTP.
Compared to the other studies in literature (Garming et al, 2006, Cuyno; 1999) mean willingness
to pay is relatively small. This is not surprising, since most of the farmers are poor (small-scale
farmers), and uneducated and cannot afford premium. From the results it is evident that health
effects provided motivation for farmers to pay more for practices like IPM that reduce
dependence on pesticide use which in turn a strong motivation for policy makers to continue
research on IPM and its implementation.
References
20
A. C. Rola. (1993). Pesticides, Rice Productivity, and Farmers' Health -An Economic Assessment. IRRI, Manila, Philippines.
A.M.Freeman. (2003). The Measurement of Environmental and Resource Values: Theary and Methods. Washington DC: Resources for the future.
AJAYI, O. O. (2000). Pesticide Use Practices, Productivity and Farmers’ Health:The Case of Cotton-Rice Systems in Côte d’Ivoire,west africa. (Pesticide Policy Project Publication Series Special Issue No. 3, November 2000).
Government of Pakistan. (2000). Agriculture census 2000-Procedure and data tables Punjab. Statistics division, Agriculture census organization Lahore, Pakistan.
Government of Pakistan. (2002). Pesticide use survey report 2002- National fertilizer development center, Islamabad Pakistan.
Gunatilake, H. (2003). Environmental valuation: theory and applications, chapter 6, contingent valuation.
Hildegard Garming, H. W. (2006). Willingness to pay to avoid health risks from pesticides, a case study from Nicaragua. Working Paper 2006 No. 4, Development and Agricultural Economics, Faculty of Economics and ManagementUniversity of Hannover, Germany .
J. A. L. Cranfield, E. M. (2003). Canadian Consumer’s Willingness-to-pay for Pesticide free food Products: An Ordered Probit Analysis. International Food and Agribusiness Management Review Volume 6, Number 4, .
Jikun Huang, F. Q. (2003). Farm Pesticide, Rice Production, and Human health. http://203.116.43.77/publications/research1/ACF268.html.
LEAH C. M.CUYNO. (1999). An Economic Evaluation of the Health and Environmental Benefits of the IPM Program (IPM CRSP) in the Philippines. Agricultural and Applied Ecoomics. Blackburg, Virginia Polytechnic Institute and State University: 133.
Portney, P. R. (1994). Contingent Valuation Debate: Why economist should care. Journal of economic perspective-volume 8, number4 , 3-17.
RANDOM. ORG. (2008). Retrieved from www.random.org/nform.html.
Richard T. Carson, N. A. (2000). Contingent Valuation: Controversies and evidence. Department of Economics, UCSD.
Susmita Dasgupta, C. M. (2005). Health effects and pesticide perception as determinants of pesticide use:evidence from bangladesh. world bank policy working paper series (WPS3776) .
W.Lipton Douglas, K. W. (1995). Economic Valuation of Natural resources: A Handbook for Coastal Resource Policymakers. National Oceanic and Atmospheric Adminstration (NOAA),USA.
W.M. Hanemann. (1994). Valuing the Environment Through Contingent Valuation. Journal of Economic perspective , No. 4, 19-43.

21
Recommended