European Research Initiative on CLL (ERIC)
guidelines for the detection of minimal
residual disease in CLL using multi-
parameter (≥4CLR) flow cytometry Andy C. Rawstron; Claudia Fazi; Andreas Agathangelidis; Neus Villamor; Remi Letestu; Josep Nomdedeu; Carlos Palacio; Olga Stehlikova; Karl-Anton Kreuzer; Stuart Liptrot; David O’Brien; Ruth M. de Tute; Martin
Spacek; Johan Dobber; Arnon P. Kater; Peter Gambell; Asha Soosapilla; Gerard Lozanski; Gabriele Brachtl; Ke Lin, Curtis Hanson; Jeffrey L.
Jorgensen; Maryalice Stetler-Stevenson; Constance Yuan; Beth Broome; Fiona Craig; Julio Delgado; Carol Moreno; Francesc Bosch;
Alexander Egle; Michael Doubek; Sarka Pospisilova; Stephen Mulligan; David Westerman; Tait Shanafelt; Andy Pettitt; Thomas J. Kipps; William
G. Wierda; Florence Cymbalista; Michael Hallek; Peter Hillmen;
Emili Montserrat and Paolo Ghia
on behalf of the ERIC consortium

Lessons from the several years of attempting to
harmonise CLL MRD by flow cytometry
• The CLL community needs to progress – Flow MRD can easily achieve 10-5, but do we want this if it
then means there are insufficient cells left to test the novel assay that can achieve 10-6 ?
• The participating labs need flexibility – Variable equipment specification, reagents restricted to
certain suppliers, compatibility with local procedures, locally critical markers (CD160, ROR1)
• Researchers and biotech need to know that their assay meets requirements without re-validating every individual combination – Provide a specification for the required components so that
developers can demonstrate approved standard.

Guidelines on the validation of cell-based
assays • Sensitivity
– Either: “lowest signal detectable above background”
– Or: “true positive / true positive + false negative”
• Limit of Blank (LOB) = highest signal in the absence of measurand, calculated as mean (blank) + 1.645 SD (95% of negative values are below this limit)
• Limit of Detection (LOD) = level at which 95% of samples with low level of measurand are detected above the limit of blank, calculated as LOB + 1.645 SD
• Limit of Quantification (LoQ) = lowest level of measurand that can be reliably detected and whose total error (bias + Imprecision) meets a desired criterion for accuracy (clinical utility)
Cytometry Part B (Clinical Cytometry) 84B: 315-323

Clinically appropriate level of variation:
When BCR-ABL RQ-PCR accepted as a trial
end-point, 95% limit of agreement = ± 5-fold
CML: best 95% LOA +/- 2-fold using synthetic standards
CLL: Target: ±3-fold (0.5log), preferably ±2-fold (0.3 log)

Multiparameter flow CLL MRD Guidelines: aims
of the project
• The primary aim of this project was to identify and
validate the specification of an assay that could provide
a stable core set of markers for MRD detection:
– at the levels required by the IWCLL guidelines or better
– compatible with published outcome data
– independent of instrument/reagent manufacturer
– offer sufficient flexibility for the use and validation of additional
markers.
• The secondary aim of this study was to compare the
assay with High Throughput Sequencing to determine
the most appropriate application of each technology.
4 vs. 6 vs. 8-CLR Component markers
FITC PE PerCP-Cy5.5
PE-Cy7
APC APC-
H7
CD45 CD3 CD19 CD5
CD20 CD38 CD19 CD5
CD81 CD22 CD19 CD5
CD43 CD79b CD19 CD5
CD3 CD38 CD5 CD19 CD79b CD20
CD81 CD22 CD5 CD19 CD43 CD20
4CLR 20-50 CLL events in ≥2 of 3
tubes
6CLR 20-50 CLL events in both tubes
V450 V500 FITC PE PerCP-Cy5.5
PE-Cy7 APC APC-H7
CD5 CD3 CD81 CD79b CD22 CD19 CD43 CD20

0.00001
0.0001
0.001
0.01
0.1
1
10
0.00001 0.0001 0.001 0.01 0.1 1 10
CLL
% le
uco
cyte
s u
sin
g 1
-tu
be
8-C
LR a
ssay
Expected CLL % leucocytes
1-tube 8-CLR dilution analysis
A) 8-CLR 1-tube panel dilution
analysis
V450 V500 FITC PE PerCP-Cy5.5
PE-Cy7 APC APC-H7
CD5 CD3 CD81 CD79b CD22 CD19 CD43 CD20

0.00001
0.0001
0.001
0.01
0.1
1
10
0.00001 0.0001 0.001 0.01 0.1 1 10
CLL
% le
uco
cyte
s u
sin
g 1
-tu
be
8-C
LR a
ssay
Expected CLL % leucocytes
-1
-0.8
-0.6
-0.4
-0.2
0
0.2
0.4
0.6
0.8
1
0.0001 0.001 0.01 0.1 1 10 100
Dif
fere
nce
in C
LL %
of
leu
cocy
tes
bet
wee
n 8
-CLR
an
d
core
mar
ker
sin
gle
tub
e as
says
(lo
g tr
ansf
orm
ed)
CLL % of leucocytes average of 8-CLR and core marker single tube assays
Above LOQBelow LOD
6-markers are sufficient for MRD detection
A) 8-CLR 1-tube panel dilution
analysis
B) 6 markers are sufficient for
detection of MRD
V450 V500 FITC PE PerCP-Cy5.5
PE-Cy7 APC APC-H7
CD5 CD3 CD81 CD79b CD22 CD19 CD43 CD20

1-tube 6-CLR analysis limit of detection 10-5
with acceptable inter-operator variation
A) 6-CLR 1-tube core marker panel
dilution analysis: LoD 0.001%
B) Variation tested in 19 students at
ESCCA-sponsored educational
meetings
0.00001
0.0001
0.001
0.01
0.1
1
10
0.00001 0.0001 0.001 0.01 0.1 1 10
CLL
% le
uco
cyte
s u
sin
g M
RD
-co
re p
anel
Expected CLL % leucocytes

Figure 3: A platform-independent specification for MRD-flow
reagents
CLL cells Normal B-cells Normal T-cells
Acceptable Sub-optimal

A platform-independent specification for MRD-flow reagents
Antigen
Typical
Expression
(% pos vs.
control) ‡
Control populations in normal
peripheral blood Minimum
Relative
fluorescence
intensity
(preferred) Positive Negative
CD5 Positive (>20%) CD3+ T-cells CD19+ B-cells >30 (>65)
CD20 Weak CD19+ B-cells CD3+ T-cells >13 (>20)
CD43 Positive (>20%) CD3+ T-cells CD20+ B-cells >15 (>40)
CD79b Weak CD20+ B-cells CD3+ T-cells >15 (>30)
CD81 Weak CD3+ T-cells Granulocytes >12 (>20)

Case 1
Case 2
Case 3
Sequence 1 Sequence 2 Average of S1 & S2
LoD: (≤) 1 in a million
Dilutional analysis (Milan) assessing high-throughput sequencing: analysis of 3 CLL cases diluted into
leucocytes from leucodpletion filters in serial 1:10. Each CLL clone was tagged with 2 sequences, 1
productive and 1 non-productive. The plot shows the CLL sequence as a percentage of nucleated genomes.
For log-transformed data above the LoQ, linearity = 1.15, correlation co-efficient (Pearson R) = 0.980, average
difference = 0.15 log, 95% limit of agreement 0.76 log.
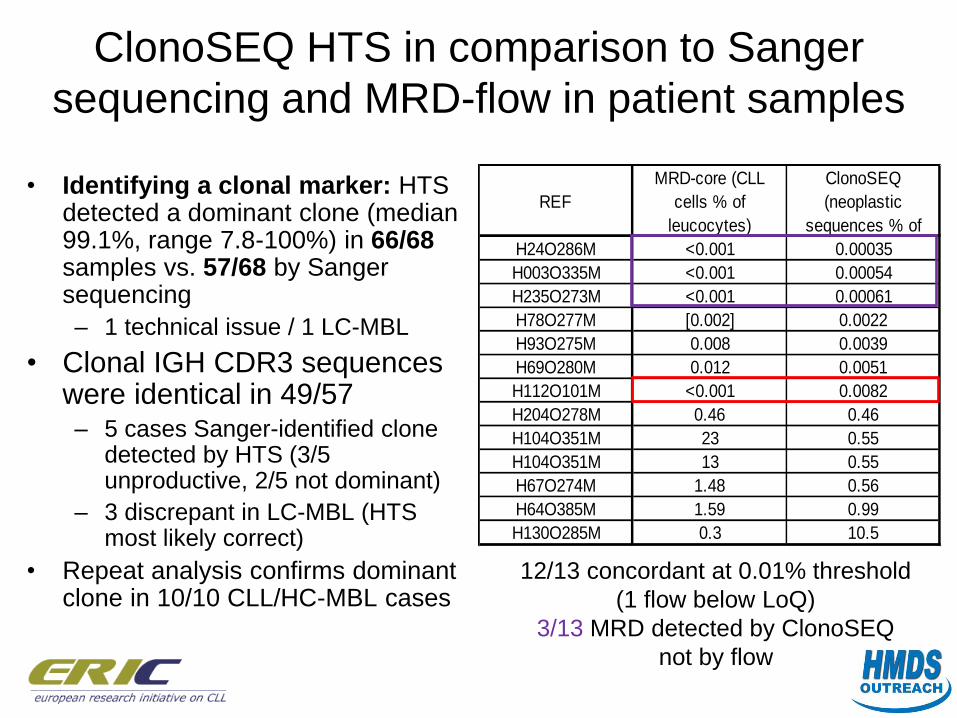
ClonoSEQ HTS in comparison to Sanger
sequencing and MRD-flow in patient samples
• Identifying a clonal marker: HTS detected a dominant clone (median 99.1%, range 7.8-100%) in 66/68 samples vs. 57/68 by Sanger sequencing
– 1 technical issue / 1 LC-MBL
• Clonal IGH CDR3 sequences were identical in 49/57 – 5 cases Sanger-identified clone
detected by HTS (3/5 unproductive, 2/5 not dominant)
– 3 discrepant in LC-MBL (HTS most likely correct)
• Repeat analysis confirms dominant clone in 10/10 CLL/HC-MBL cases
12/13 concordant at 0.01% threshold
(1 flow below LoQ)
3/13 MRD detected by ClonoSEQ
not by flow
REF
MRD-core (CLL
cells % of
leucocytes)
ClonoSEQ
(neoplastic
sequences % of
H24O286M <0.001 0.00035
H003O335M <0.001 0.00054
H235O273M <0.001 0.00061
H78O277M [0.002] 0.0022
H93O275M 0.008 0.0039
H69O280M 0.012 0.0051
H112O101M <0.001 0.0082
H204O278M 0.46 0.46
H104O351M 23 0.55
H104O351M 13 0.55
H67O274M 1.48 0.56
H64O385M 1.59 0.99
H130O285M 0.3 10.5

HTS shows greater variation in quantification above
0.01% but better accuracy below 0.01%
4-CLR vs. ≥6-CLR flow cytometry HTS vs. ≥6-CLR flow cytometry
Comparison of the MRD-core panel with ClonoSEQ high throughput sequencing: analysis of 3 CLL cases
diluted into leucocytes from leucodpletion filters in serial 1:10 dilutions and 13 CLL cases after treatment. The
results are not corrected for LoD/LoQ. For log-transformed data above the LoQ, linearity = 0.905, correlation co-
efficient (Pearson R) = 0.870, average difference = 0.078 log, 95% limit of agreement 1.5 log.

Multiparameter flow CLL MRD guidelines: aims
of the project
• Identify assay specification for CLL MRD analysis to
achieve at least 0.01% limit of quantification
– CD19 (or appropriate gating markers) in combination with CD5,
CD20, CD43, CD79b, CD81 markers meeting defined
specification
– Interoperator variation in analysis: 95% LOA within 2-fold (log-
scale, ±0.3) achieved by operators after reviewing protocol /
test cases.
• Compare ≥4CLR MRD flow with high-throughput
sequencing
– Optimal combination direct quantitative assay to 0.01 -
0.001% (10-4 to 10-5) combined with HTS to exclude disease
below 1 in a million (10-6).

B-cell
enumeration +
clonality
assessment
Relatively inexpensive and simple.
Requires capacity to reflex to full
MRD assay if CLL cells <1%
&/or B-cells polyclonal.
4-colour 4-tube
Published outcome data
Does not require pre-treatment
phenotype for typical CLL
Limit of detection >0.005%
More material required to
achieve higher detection limits
6-colour 2-tube
Harmonised with published
outcome data
Does not require pre-treatment
phenotype for typical CLL
Intermediate LoD/LoQ
Intermediate amount of
materialrequired to achieve
higher detection limits.
6-colour core
panel for ≥6-
colour assays
Flexibility for individual laboratory
requirements
LoD 0.001% (10-5), LoQ 0.0025%
Allows simultaneous analysis of
additional markers
Knowledge of pre-treatment
phenotype preferable.
High throughput
sequencing
LoD 0.0001% (10-6)
Objective analysis, does not
necessarily require expert
interpretation
Further development work on
standardisation of the
quantification
Different ERIC-harmonised approaches for
MRD detecetion

Acknowledgements Johan Dobber, Arnon Kater Academic Medical Center, Amsterdam, The Netherlands.
Remi Letestu, Florence Cymbalista AP-HP, Hôpital Avicenne, Bobigny, France
Martin Spacek Charles University in Prague, Czech Republic
Neus Villamor, Julio Delgado Hospital Clínic, Barcelona, Spain.
Josep Nomdedeu, Carol Moreno Hospital de la Santa Creu i Sant Pau, Barcelona, Spain.
Claudia Fazi, Paolo Ghia Università Vita-Salute San Raffaele, Milan, Italy
Gabriele Brachtl, Alexander Egle Paracelsus Medical University, Salzburg , Austria.
Stuart Liptrot, David O'Brien St. James's Hospital, Dublin, Ireland.
Andy C. Rawstron, Ruth M. de Tute, Peter Hillmen St. James's Institute of Oncology, Leeds Teaching Hospitals, UK.
Olga Stehlikova, Michael Doubek, Sarka Pospisilova University Hospital Brno, Czech Republic.
Karl-Anton Kreuzer, Michael Hallek University of Cologne, Köln, Germany
Carlos Palacio, Francesc Bosch Vall d'Hebron Hospital, Barcelona, Spain.
Peter Gambell, David Westerman Peter MacCallum Cancer Centre, East Melbourne, Australia
Asha Soosapilla, Stephen Mulligan Royal North Shore Hospital, University of Sydney, Australia
Constance Yuan, Maryalice Stetler-Stevenson Center for Cancer Research, National Institutes of Health, Bethesda, MD, USA.
Gerard Lozanski Department of Pathology, The Ohio State University
Curtis Hanson, Tait Shanafelt Mayo Clinic, Rochester, Minnesota, USA.
Jeffrey L. Jorgensen, William G. Wierda MD Anderson Cancer Center, University of Texas
Beth Broome, Thomas J. Kipps Moores Cancer Center, University of California, La Jolla, CA, USA.
Fiona Craig University of Pittsburgh School of Medicine, Pittsburgh, PA, USA
Frans Nauwelaers, Lucia Testolin, Jingyi Chen and Noel Warner. BD
Biosciences provided custom and commercial conjugates for testing
Carol Moreno, EMILI MONTSERRAT and PAOLO GHIA
HTS vs. Sanger: Andreas Agathangelidis
Dilution studies: Claudia Fazi
Ruth de Tute, ANDREW JACK and PETER HILLMEN
Michael Wenger for meeting support
Comparison of flow vs. next
generation sequencing

Which patients can be monitored:
diagnosis of CLL • No universal molecular abnormality
• WHO Definition: CLL cells usually co-express CD5 and CD23
• WHO Immunophenotype: using flow cytometry, the tumour cells express
dim surface IgM/IgD, CD20, CD22, CD5, CD19, CD79a, CD23, CD43 and
CD11c (weak). CD10 is negative and FMC& and CD79b are usually
negative or weakly expressed in typical CLL. Some cases may have an
atypical immunophenotype (e.g. CD5- or CD23-, FMC7+ or CD11c+,
strong sIg, or CD79b+).
• iwCLL/NCI guidelines: CLL cells co-express the T-cell antigen CD5 and
B-cell surface antigens CD19, CD20, and CD23. The levels of surface
immunoglobulin, CD20, and CD79b are characteristically low compared
with those found on normal B cells. Each clone of leukemia cells is
restricted to expression of either kappa or lambda immunoglobulin light
chains. Variations of the intensity of expression of these markers may
exist and do not prevent inclusion of a patient in clinical trials for CLL.

Difficult to validate diagnostic panels – circular argument for the gold standard

CLL Diagnostic Panel
• An invitation to participate in this study was circulated among members of the ERIC and ESCCA scientific groups.
• Responses were received from 158 members of which 154 were actively involved in CLL diagnosis: 100/154 (65%) were from diagnostic laboratories, 14/154 (9.1%) were CLL clinicians and 36/154 (23%) worked in both laboratory and clinic.
• The diagnostic workload was >20 cases per week in 23/154 (15%), 5-20 per week in 82/154 (53%) and <5% in 49/154 (32%).
• Responders were invited to classify 35 antibodies selected from publications on the diagnosis of B-lymphoproliferative disorders as being required, recommended, suggested, uninformative, or of unknown value for the diagnosis of CLL.

>75% of respondents marker is
required for CLL diagnosis:
>50% of respondents marker is
recommended for CLL diagnosis:

Proposal: required (minimum) and
recommended panel for diagnosis • Marker panel required for diagnosis:
– CD19 / CD5 / CD23 / CD20 / Kappa / Lambda
• Additional markers recommended for diagnosis and required for
clinical trials:
– CD43 / CD79b / CD81* / CD22 / CD10
• Frequently recommended but not essential for diagnosis and
monitoring:
– CD45 / CD38 / CD200 / (FMC7)
• Present in current diagnostic criteria but not universally
recommended:
– IgM/D and CD11c:
• * CD81 was considered as a required or recommended by only 40% of participants but this marker is an essential
component for the consensus MRD monitoring panels [REFS] and therefore recommended by the steering committee for
clinical trials.
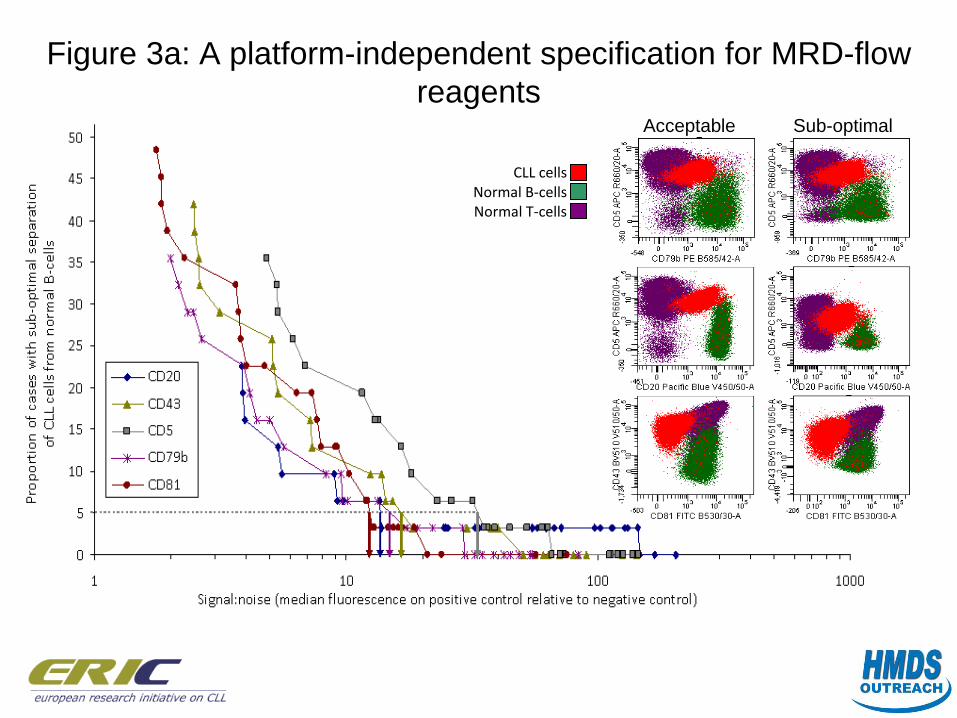
Figure 3a: A platform-independent specification for MRD-flow
reagents
CLL cells Normal B-cells Normal T-cells
Acceptable Sub-optimal

Antigen
Typical
Expression
(% pos vs.
control) ‡
Are the same
criteria required
for atypical CLL?
Control Population in normal
peripheral blood
Minimum
Relative
fluorescence
intensity
(preferred) Positive Negative
CD19 Positive (>95%) Yes CD20+ B-cells CD3+ T-cells >20†
CD5 Positive (>20%) Yes CD3+ T-cells CD16/56+ NK-
cells >14 (>18)
CD23 Positive (>20%) ? Not required CD20+CD27-
Naïve B-cells
CD20+27+
Memory B-cells >5†
CD20 Weak Not required CD19+ B-cells CD3+ T-cells >5 (>20)
Igκ
Igλ
Weak & restricted
to either Igκ or Igλ
Restricted to either
Igκ or Igλ CD20+ B-cells CD3+ T-cells >10†
CD43 Positive (>20%) Not required CD3+ T-cells CD20+ B-cells >7 (>50)
CD79b Weak Not required CD20+ B-cells CD3+ T-cells >11 (>30)
CD81 Weak Not required CD3+ T-cells Granulocytes >5 (>8)
CD22 Weak Not required CD20+ B-cells CD3+ T-cells >10†
CD10 Negative (<20%) Yes Granulocytes CD20+27+
Memory B-cells >10†
Definition of weak: median fluorescence intensity at least 20% lower than normal peripheral blood B-cells,
range to be determined within each laboratory (ICSH/ISLH/CLIA guidelines for stability require <20%
variation, therefore reduction in fluorescence intensity less than 20% may reflect antigen/sample stability)
† consensus, not specifically validated
Recommended