Ethnic Cleansing and the Long-Term Persistence
of Extractive Institutions: Evidence from the
Expulsion of the Moriscos
Eric Chaney�
September 4, 2008
Abstract
This paper uses the 1609 expulsion of 300,000 Muslims from the Iberian peninsula
to analyze the mechanisms through which exploitative institutions dampen the de-
velopment of pre-industrial economies. The evidence suggests that the persistence
of extractive arrangements in formerly Muslim lands stunted the development of
the non-agricultural sector long after the expulsion. Arguably exogenous variation
in the Christian re-settlers�human capital is then used to investigate the extent to
which initial di¤erences in human capital explain the observed divergence in between-
institutional outcomes. The results cast doubt on the long-term importance of such
di¤erences and stress the role of institutions, at least for the speci�c case of early
modern Spain.
�Department of Economics, Harvard University. I thank Manuel Ardit, Alan Auerbach, Efraim
Benmelech, Gregory Clark, Barry Eichengreen, Samuel Garrido, Claudia Goldin, Avner Greif, Larry
Katz, Meir Kohn, Michael Kremer, Naomi Lamoreaux, Chris Meissner, Alan Taylor and seminar
participants at UC Davis and SITE for helpful comments and discussions.
1
1 Introduction
In countless historical circumstances wealthy and powerful individuals have exploited
the less fortunate for their own economic gain. Although this exploitation often
served the short-term interests of the elites, recent research has highlighted the neg-
ative long-term e¤ects of exploitative arrangements. Engerman and Sokolo¤ (2002)
have argued that exploitative institutions created inequality across Central and South
America which in turn discouraged economic growth for centuries. The empirical
work of Acemoglu et al. (2001, 2002) has shown a robust relationship between �ex-
tractive�colonization and sluggish long-term economic growth. Finally, Nunn (2008)
has demonstrated that African countries hit hardest by the slave trade economically
under-performed areas that were largely spared.
While these macro-relationships stress a long-lasting negative relationship be-
tween exploitative institutional arrangements and subsequent economic outcomes,
the mechanisms through which the presence of exploitative institutions in one pe-
riod a¤ects economic performance in the next remain a subject of debate.
This debate often centers on the relative impact of human capital and institutions
on economic growth. Glaesar et al. (2004) emphasize the importance of human
capital by showing that high levels of human capital are highly correlated with �good�
institutions. They then raise the possibility that societies �rst develop high levels of
human capital which in turn lead to institutional frameworks that encourage growth.
In their view, the quality of institutions in a given society largely re�ects its human
capital. The simple imposition of �good�institutions on a given society is unlikely
to endure in the absence of a su¢ ciently large stock of �good�human capital.
Recent work by Gregory Clark (2007) further stresses the importance of human
capital, suggesting that institutional quality may be of secondary importance. Clark
shows that England had �good� institutions for hundreds of years without much
economic growth. He then argues that higher birthrates among the economically
successful for hundreds of years led to �[t]he embedding of bourgeois values into the
culture, and perhaps even the genetics�(Clark 2007, p. 11). In Clark�s view these
bourgeois values were what made England �di¤erent�from its neighbors on the eve
2
of the industrial revolution. The same set of institutions and incentives that had
failed to produce growth for centuries spurred growth in the 18th century because
the evolution of English culture had changed the way individuals responded to these
incentives.
Separating the relative importance of human capital and institutions has proven
empirically di¢ cult, since the two are highly correlated. This paper uses variation
created by the 1609 expulsion of 120,000 Valencian1 Muslims to both provide a unique
micro-level test of the long-run e¤ects of extractive arrangements and to investigate
the extent to which initial between-institutional di¤erences in human capital drive
the results.
The paper begins in section 2 by providing a brief historical overview of the
Muslim population in Valencia, detailing the institutions the Spanish2 developed to
exploit this population following the reconquest.3 These exploitative institutions re-
mained in place even after the Muslim population was forced to convert to Christian-
ity in 1525, after which these crypto-Muslims were referred to as Moriscos. Valencia�s
landowners exploited their Morisco subjects. Prominent historians have called this
relationship �colonial��Moriscos were more like slaves than vassals.
Section 3 describes how the exploitative institutional arrangements remained in
the formerly Morisco municipalities after Spain expelled its entire Morisco popula-
tion in 1609. The persistence of extractive arrangements in these areas meant that
only Valencia�s least skilled workers migrated from Christian towns to the aban-
doned Morisco municipalities. Those with low human capital sorted into areas with
exploitative institutions. Those with higher levels of human capital stayed in the
Christian4 areas that retained more benign institutional frameworks.
1Valencia is located on Spain�s eastern Mediterranean coast.2These �Spaniards�(for the purposes of this paper) were primarily from the kingdom of Aragon
which would unite with Castile in 1479.3The reconquest refers to the Christian military conquest of Muslim lands in the Iberian Penin-
sula. These lands had been conquered by Islam in 711. The reconquest was completed in 1492 with
the fall of Granada.4Obviously, following the expulsion Christians inhabited all of Valencia. Thus, when we refer to
Christian lands we are referring to lands inhabited by Christians before the expulsion.
3
The third section goes on to describe how the resettlement process created ar-
guably exogenous variation in human capital levels. Archival evidence combined with
census data from 1609 and 1646 show how Christian areas that bordered Morisco
areas prior to the expulsion lost signi�cantly more of their population following the
expulsion than Christian areas that did not border Morisco areas. The emigrants
were on average poor and heavily indebted.
Christian areas that did not border Morisco areas saw a much smaller share
of their �low�human capital emigrate. Consequently, the inhabitants of Christian
towns that bordered Morisco areas in 1609 descended from the economically success-
ful. The inhabitants of Christian areas that did not border Morisco municipalities
in 1609 descended from a less �select�stock. Similarly, formerly Morisco areas that
bordered Christian areas attracted settlers with signi�cantly higher human capital
than areas that were bordered by only Morisco areas before the expulsion. Thus, the
repopulation process provides arguably exogenous variation in the initial level of the
human capital of the Christian population within a given institutional framework.
Section 4 develops a simple model that investigates the e¤ect of an increase in the
agricultural extraction rate on the proportion of the population engaged in agricul-
ture. In the absence of trade in agricultural products and large tax-induced drops in
population, the model predicts that an increase in the extraction rate will decrease
the proportion of the population engaged in non-agricultural activities. This decline
is due to the fact that an increase in the extraction rate decreases the surplus avail-
able to the population, requiring the movement of individuals into the agricultural
sector to meet subsistence needs. The model also shows that if an increase in the ex-
traction rate decreases the overall productivity of the population, an increase in the
extraction rate can lead to an increase in the proportion of the population engaged
in agriculture even in the face of large tax-induced population changes.
In the �fth section I investigate these predictions using data from three censuses
conducted in 1609, 1646 and 1787. In 1787 formerly Morisco areas employed roughly
8% more of their active population (two-thirds of a standard deviation) in agriculture
than their Christian neighbors. This di¤erence mainly translated into a smaller
�manufacturing� sector in the formerly Morisco municipalities. These results are
4
robust to a variety of controls and do not seem to be driven by systematic di¤erences
in land quality or the severity of the 1609 population drop.
The section then uses the di¤erences in human capital endowments created by
the repopulation process to investigate the long-term importance of initial di¤erences
in human capital. The results cast doubt on the long-term importance of such
di¤erences, at least for the institutional and human capital endowments of early
modern Spain.
In conclusion, the evidence suggests that extractive institutions stunted the devel-
opment of the non-agricultural sector, highlighting the e¤ects of exploitative arrange-
ments in pre-industrial economies. Initial di¤erences in human capital seem less
important in explaining why formerly Morisco areas lagged behind their Christian
counterparts.
2 Moriscos, Christians and the Early Modern Va-
lencian Economy
2.1 The Economic Exploitation of the Muslim Population in
Valencia
Crusader armies under king James I reconquered the Muslim kingdom of Valencia
between 1229 and 1244. Before the reconquest, the kingdom was one of the richest in
Spain and supported buoyant silk and paper manufactures in addition to advanced
agricultural arrangements. Following the reconquest, the Christian re-conquerors
remained a small minority among the Muslim majority for over a century.
The wealth of Muslim Valencia and the small numbers of available immigrants
led king James I and his successors to rule in what Burns (1973, 1975) has described
as a �colonial�manner. Meyerson (1991, p. 34) sums up the general attitude of
the Christian rulers toward the Muslim population by explaining that �[the Mus-
lim vassals] were [...] perceived by their lords primarily as exploitable labor. If the
[Muslims] did not produce, there was nothing else, and least of all their religious af-
5
�liation, to justify their presence.�The high levels of exploitation drove the majority
of the Valencian Muslim population from prosperity to poverty by the eve of their
forced conversion to Christianity in 1525.
After the forced conversion of Valencia�s Muslims (afterwards known as Moriscos),
the landed nobility did not decrease the extraction rates in Morisco areas.5 An
observer of the Morisco populations in 1595 compared the treatment of the Moriscos
to that of Native Americans in Spain�s overseas colonies by noting that �the lords
are similar to the Encomenderos de Indias: they don�t want them [the Moriscos] to
[truly] convert so that they may continue to exact tribute� (Ciscar 1977, p. 68).
Casey (1979) describes the relationship between Moriscos and their Christian lords
in the 16th century as �semi-colonial.�
On the eve of their expulsion in 1609, Valencia�s Morisco community represented
26% of the region�s total population (Nadal 1976, p. 54). These Moriscos worked
primarily on lands held by Christian nobles. While in theory Morisco and Christian
peasants were subject to the same general feudal framework, Moriscos by the close
of the 16th century were treated more like slaves than vassals (Ciscar 1977, p. 90).
2.2 Moriscos, Christians and Institutions
The Spanish king, lesser nobles and the Catholic Church controlled the lion�s share
of the land in 16th century Valencia. While some Moriscos worked on ecclesiastical
lands, most worked on lands controlled by the nobility. These Moriscos worked in
segregated regions.6 The geographic distribution of Christian and Morisco areas had
largely been determined following the reconquest of Valencia in the 13th century. If
a town had resisted in the reconquest, its Muslim population was expelled following
its capture. If the town agreed to terms, the Muslim population was allowed to stay
(LaPeyre 1959, p. 29). The geographic distribution of the Morisco municipalities is
5When the Muslims of Valencia were forced to convert to Christianity in 1525, they petitioned to
have their tax rates lowered to the Christian rate. These petitions were in practice denied, moving
a contemporary to observe in 1565 that �these new converts are forced to live like Christians and
pay like Muslims�(Ciscar 1977, p. 68).6There were a few areas inhabited by both Moriscos and Christians, but these were the exception.
6
detailed on the left hand map in �gure 1.
Both Morisco and Christian peasants worked the lands under feudal arrange-
ments. While the conditions governing each town and its surrounding area varied,
both Muslims and Christians paid their lords on a regular basis for the right to work
the lands. Payments in the Christian areas changed from sharecropping to �xed cash
payments in the 14th century. These terms were �enshrined in documents and char-
ters which no subsequent senyor (lord) could set aside�(Casey 1979, p. 111). The
cash payments were not indexed for in�ation, and their real value steadily decreased
throughout the Spanish in�ation of the 16th century.7
Thus, Christian peasants by the end of the 17th century paid relatively light dues,
and they vigorously resisted attempts to increase the devalued rates. This resistance
meant that a lord that wished to increase the dues in a Christian area had to battle
the inhabitants in expensive and time-consuming suits. The courts often ruled in
favor of the peasants since these peasants possessed the original town charters from
the 13th and 14th centuries which clearly stipulated their feudal dues. The socially
and religiously marginalized Moriscos faced greater di¢ culties obtaining favorable
verdicts, and their �nancial situation seems to have worsened throughout the course
of the 16th century.
In addition to dues on the harvest, both Christians and Moriscos paid for the use
of �common areas�(such as mills, ovens...) maintained by the lords. Artisans also
paid dues on their products although there is considerably less evidence on these
dues, which do not seem to have been subject to rigorous enforcement since most
of the population engaged in agricultural activities. Eugenio Ciscar8 (2006, p. 132)
suggests that most non-agricultural products were �totally or partially exempt from
taxation.�
The lords often hired representatives in their domains to directly collect dues
although some lords preferred to farm out the right to collect payments. Regardless
7Hamilton (1934) is the classic reference for the in�ation caused by large imports of Spanish
bullion from the Americas.8Eugenio Ciscar is a prominent historian of the e¤ects of the expulsion of the Moriscos on
Valencia.
7
of how the dues were collected, Moriscos almost always paid more than Christians.
In addition to higher payments, Moriscos were often subjected to forced labor and
were denied access to judicial recourse.
2.3 The Lords
The lords reaped many bene�ts from the Moriscos�widespread exploitation. Due
to the marginal religious and social position of Moriscos, the nobles extracted much
higher rents from them than they could from their Christian subjects. When the
Inquisition and the Catholic Church began to suggest the expulsion of the Moriscos
in the 1580s, the Valencian nobles staunchly defended their continued presence in
Christian Spain despite their suspect religious practices.
Economic pressures in the late 16th century seem to have increased the nobles�
�nancial dependence on the Morisco population. In�ation throughout the 16th cen-
tury decreased landowners�real incomes (Ciscar 1977, p. 107). During this period,
the Spanish Crown also increasingly burdened these nobles with extraordinary levies
to support the vast Spanish Empire. The combination of these two factors forced
the nobles to take out ever larger loans to meet their expenditures. In exchange
for loans, they promised lenders (usually from the Valencian merchant class) a �xed
payment each year usually in perpetuity (censos). Payments came from the revenues
provided by both Morisco and Christian peasants. A detailed study of the nobles�
�nancial situation by Ciscar (1977) has shown that the annual interest payments on
the debts acquired by nobles during the 16th century at times came close to their
total income.
On the eve of the 1609 expulsion, many nobles were bankrupt. Ciscar (1977) has
argued that the Spanish Crown used this �nancial crisis to convince the nobles to
acquiesce to the expulsion. In this interpretation, the Spanish Crown promised to
intervene on behalf of the nobles with their creditors following the expulsion and to
give them the goods of the expelled Moriscos to help them pay o¤ their debts.
Regardless of the underlying reasons, it appears that the nobles were increasingly
unable (or unwilling) to withstand pressure from the Catholic Church and the Crown
8
to expel the Morisco population.
3 Exploitation after the Expulsion
On April 9, 1609 Phillip III secretly9 signed a decree authorizing the expulsion of
the Moriscos from Spanish lands.10 Crown o¢ cials recalled the Spanish Navy and
contracted merchant ships to ferry the Moriscos to North Africa. Between the an-
nouncement of the expulsion in 1609 and its conclusion in 1614, Spain expelled
approximately 300,000 Moriscos. Roughly 120,000 of these came from the kingdom
of Valencia. The remaining 180,000 were scattered throughout the rest of Spain
(LaPeyre 1959). The Moriscos were generally shipped to North Africa, although
skilled workers were allowed into northern Italy and others went to the heart of the
Ottoman Empire.
For many years historians pointed to the 1609 expulsion as a primary factor in
Spain�s 17th century economic downturn. Although recent studies have questioned
this event�s importance for the Spanish economy, there is a general agreement that
the e¤ects on the province of Valencia were grave.11 Eugenio Ciscar sums up the
evidence to suggest that the �principal e¤ect [of the expulsion of the Moriscos] was
the deepening of the economic crisis of the 17th century [...] with other more long-
lasting e¤ects such as the disappearance of entire towns [...] and the duality of the
seignorial regime�(Ciscar 1991, pp. 223-224).
The �duality of the seignorial regimes�after the expulsion consisted on the one
hand of the towns inhabited by Christians prior to the expulsion. The institutional
framework in these towns was relatively benign and re�ected pre-expulsion arrange-
9The crown worried that the Moriscos would revolt or least stop working if they learned of their
expulsion. Both of these fears proved justi�ed. When the Valencian Moriscos learned of their fate
a group rose in rebellion. When the Moriscos in Aragon (Valencia�s Moriscos were the �rst to be
expelled) learned of the plight of the Valencian Moriscos they ceased working in the �elds.10For a detailed overview of the process that led to the expulsion, see Harvey (2005) especially
chapter nine.11To the extent that an entire generation of Valencian historians attributed the failed Valencian
industrialization of the 19th century to the expulsion.
9
ments. On the other hand, municipalities that had been inhabited by Moriscos
before the expulsion were subject to more exploitative arrangements (Ciscar 1991,
p. 210). The following subsection explains how the institutions designed to exploit
the Morisco population continued to exploit the Christian inhabitants of formerly
Morisco lands long after the expulsion.
3.1 The Persistence of Extractive Institutions and Repopu-
lation following the Expulsion
Immediately following the expulsion, both the lords and their creditors were in a
desperate �nancial situation. Since the Morisco municipalities were completely de-
serted, the lords of formerly Morisco lands had both lost their source of livelihood
and the ability to pay their debts. The lords�creditors, who depended on interest
payments, were hardly in a better position.
Following the expulsion, many lords attempted to default on their loans.12 These
defaults led the lords�creditors to appeal to the Spanish Crown for assistance. The
exchange between the Valencian lords, their creditors and the Spanish Crown gener-
ated documentation that allows us to observe how both creditor and debtor worked
to maintain the previous institutional framework as far as possible to limit their
individual losses.
As the lords attempted to repopulate the Morisco municipalities by attracting the
inhabitants of the surrounding Christian communities, they had to choose between
charging the incoming Christian settlers heavy taxes or not paying their creditors.13
As it became clear that widespread default was not an option, the lords attempted to
exploit the incoming Christian population just as they had exploited the Moriscos.
The Spanish Crown rapidly issued declarations prohibiting the most abusive prac-
tices (such as the açofras or forced services) and warned that the repopulation of
the formerly Morisco lands would be di¢ cult if the lords insisted on exploiting the
12By 1614 over 70 of the 157 Valencian lords had demanded debt relief from the Spanish Crown
and were joined in 1625 by another 17 (Boronat 1901, II, pp. 637-657).13Lapeyre (1959, pp. 70,71). The lords obviously did not see their own ruin as a viable option!
10
Christian population as if they were Moriscos.14
3.1.1 The Repopulation Process, Extractive Institutions and HumanCapital
The Crown�s worries proved justi�ed as the repopulation process continued. Archival
evidence indicates that the retention of high extraction rates in the formerly Morisco
municipalities led to pronounced adverse selection among the Christian re-settlers. A
royal decree dated April 15th, 1614 forbid creditors from con�scating the belongings
of the re-settlers in order to settle past debts. The decree goes on to state that those
who went to settle the formerly Morisco lands were �in their great majority [...] very
poor and indebted�(Boronat 1901, II, p. 628). Many documents from the period
state that the majority of the re-settlers came from the ranks of the economically
disadvantaged (Ciscar 1991, pp. 189-190; Torres 1969, p 82).
This low level of human capital in the Morisco areas led the Spanish Crown to
conclude in 1614 that some lords of formerly Morisco lands had lost income �not
because of a drop in extraction rates [or population], but in the harm that results
from the poverty and stupidity of the settlers�(Boronat 1901, II, pp. 641-642). The
archival evidence suggests that the Moriscos municipalities inherited a perverse in-
stitutional framework and some of the worst human capital their Christian neighbors
had to o¤er.
There was, however, a positive side to this pronounced adverse selection in
Morisco areas. A contemporary of the events noted that Christian areas that bor-
dered formerly Morisco areas �ha[d] bene�ted [...] because those who left were poor
[and those who remained were the most] successful�(Ciscar 1991, pp.186-188).
Similarly, Morisco municipalities that bordered Christian areas had access to bet-
ter settlers. In Morisco municipalities that were not easily accessible from Christian
areas, however, the lords were forced to o¤er temporary (or permanent) concessions
to attract any settlers at all. Even in the face of concessions settlers in more remote
areas were �a miserable lot [when compared to the settlers in other Morisco areas]
14Royal document dated September 8, 1610 reproduced in Boronat (1901, II, pp. 605-606).
11
that [didn�t] even possess tools or have the means to sustain themselves� (Ciscar
1991, p. 207).
Despite the adverse selection, the lords of formerly Morisco areas opted to re-
tain as much of the extractive arrangements that had governed the Moriscos as they
could.15 Although the Christian re-settlers were not subject to the same abuses the
Moriscos had su¤ered, a contemporary noted that they were �so burdened with [agri-
cultural] taxes that it would [have been] impossible for them to [have] handle[d] any
additional burdens� (Boronat 1901, II , p. 627).16 Higher agricultural taxes con-
stituted the main institutional di¤erence between the Morisco and Christian areas,
although there is some evidence that the inhabitants of formerly Morisco areas also
had less in�uence in municipal decision making.
3.2 The Repopulated Towns and their Evolution
After 1630, when the repopulation process was largely complete, Christian and for-
merly Morisco towns appear to have evolved fairly independently of one another.
There is little evidence of large scale immigration or emigration after 1630 (Casey
1979 , pp. 8) and trade in agricultural goods even over small distances was extremely
limited (Castello 1978, pp. 53-54).17
15Although there is ample evidence that extractive institutions remained, the persistence of high
levels of extraction in formerly Morisco lands might seem sub-optimal from the lords�standpoint.
There are a few reasons this may have been optimal from the lords standpoint. Given that the best
workers in the Christian towns were being taxed at sub-optimally low rates (from the lords�stand-
point), any attempt to attract these workers would have required an �ine¢ ciently�low extraction
rate. In these circumstances, the lords seemed to have found raising the extraction rate until the
least skilled workers began to leave in their best interest.16A detailed study by Torres (1969) of the town charters of the formerly Morisco areas shows
that the tax rates on agricultural goods often surpassed 40%. Tax rates in the Christian towns
rarely was more than 25%.17In a detailed study of the early modern Valencian economy Casey (1979, pp.31) notes the
�essentially self-su¢ cient nature of the local economies of the interior, which was inevitable given
the poor communications of the day [creating] great disparity in bread prices within the limits of
the kingdom.�
12
Thus, formerly Morisco municipalities started the post-expulsion period with
signi�cant disadvantages. In addition to signi�cantly higher tax rates, these areas
had been repopulated by some of the least skilled workers in the kingdom.
The Morisco municipalities grew in the years following the expulsion. Figure 2
details the aggregate evolution of 4 types of municipalities from 1610 through 1787:
Christian municipalities and Morisco municipalities that did and did not border a
municipality of a di¤erent faith.18 Figure 2 shows that by 1787 the formerly Morisco
areas had surpassed their 1609 population level, although their population growth
rates from 1609-1787 lagged behind that of their neighbors that had been Christian
before the expulsion.
As the 17th century progressed, observers continually noted the poverty and un-
derdevelopment of the formerly Morisco areas. By the 18th century observers had
reached a general consensus that the extractive arrangements in formerly Morisco
municipalities created much poverty (Casey 1979, p. 44).
Perhaps the most convincing observations come fromCavanilles, a world-renowned
18th century scholar. During his travels through the kingdom of Valencia between
1795 and 1797 he repeatedly commented on the negative e¤ects the extractive arrange-
ments had on economic development:
Everywhere [the inhabitants of the formerly Morisco municipalities] [...]
are loaded with seignorial tributes and appear to only work to �ll the
co¤ers of their lords [...t]his arrangement is opposed to industrial and
agricultural progress; since no one wants to sweat and work to enrich
another; especially since there are other lands in the kingdom [those
inhabited by Christians prior to the expulsion] where the tax burden is
light.19
While Cavanilles provides evidence that the extractive institutions that persisted
in the Morisco areas dampened development, he also remarked how workers in some
formerly Morisco areas appeared less motivated than those in others. In one town
18These data will be discussed in section 5.19Cavanilles (1797, II, pp. 160, 202).
13
he noted that �the successors of the Moriscos �slept�[...] until around 1750, but [...]
have �nally started working�in another he remarked that �everyone could be happy,
as in other towns, if the men and women worked harder and the fruits of their labors
were distributed more equitably�(Cavanilles 1797, II pp. 26, 372-373).
Although the lackadaisical attitudes of workers in some formerly Morisco mu-
nicipalities could have been caused by the extractive arrangements in these areas,
it might be the case that this behavior was due to the persistence of the initially
low-levels of human capital among the settlers. We will investigate this question in
greater detail in section 5.
4 AModel of the E¤ect of Institutions on the non-
Agricultural Sector
Qualitative evidence from the previous sections suggests that formerly Morisco mu-
nicipalities were less developed than areas that had more benign institutional frame-
works. This section develops a simple model that investigates the e¤ect of exploita-
tive institutional arrangements on the distribution of the workforce across sectors.
4.1 Extractive Institutions and the Agricultural Sector
Throughout this section we equate extractive institutions with a higher tax rate � .
Consider total consumption of agricultural goods in municipality i in region j at time
t: �cijt. If we assume that municipality i can only consume what it produces (i.e.
there is negligible trade in agricultural products with the surrounding towns20) then
in each time period the following inequality must hold:
�cijt � (1� ��ijt)A�ijtF�ijt(K�ijt; L�ijt) (1)
20While this assumption is clearly violated by Valencia the capital (which imported large amounts
of grain by sea), there is substantial evidence that most other areas largely consumed the agricultural
goods they produced. See footnote 17.
14
where ��ijt is the tax rate on agricultural production, A�ijt is the level of agri-
cultural production �technology�, F�ijt is a concave function, K�ijt captures all non-
labor inputs (including land quality) and L�ijt represents the number of workers
in the agricultural sector. If we assume food consumption is constant per capita
(�cijt = 'ijtNijt), F to be a Cobb-Douglas production function with constant re-
turns to scale and equation (1) holds with equality then (1) yields (after dropping
subscripts for ease of exposition):
L = ('N
(1� �)AK1�� )1� (2)
If the whole population produces foodstu¤s then (2) implies:
N = K((1� �)A
')
11��
The implications of this result are intuitive and straightforward.
Assume that the number of inhabitants in a given town are such that the �Malthu-
sian�constraint does not bind (i.e. N < K( (1��)A'
)1
1�� ). Thus, the inhabitants can
produce either foodstu¤s or other goods (these other goods can be traded). The only
constraint on the number of workers in each sector is that there must be enough work-
ers in the agricultural sector to feed the entire population. Consequently, L� = N�Lwhere L� is the number of workers producing non-agricultural goods. This setup
seems natural in subsistence economies, where allocating labor to provide services
was a luxury. Individuals would �rst allocate labor to the agricultural sector to
meet subsistence needs. If and only if there was a surplus would individuals leave
the agricultural sector to specialize full time in providing other goods, otherwise
these goods would be provided by each worker at home.21 In times of famine, one
would expect demand for non-agricultural goods to fall leading to a contraction in
the non-agricultural sector.
21This point is supported by Cavanilles�observations during his travels through the kingdom.
He notes that in the poorest regions the population produced clothes and other wares at home
(Cavanilles 1797, II, p. 26).
15
A di¤erential increase in the extraction rate would then change the proportion of
the population producing non-agricultural goods by:
d
d�
L�N= � 1
�(
'N1��
(1� ��)A
�K1��
�
)1��� [N��'[
(1� �)(1� �)dNd�+N
(1� �)2AK1�� ]] (3)
Equation (3) shows that in the framework of the model, the change in the per-
centage of the population working in the non-agricultural sector associated with an
increase in the tax rate is just the negative of the change the increase in the tax rate
causes in the percentage of the population working in the agricultural sector. We
assume that an increase in the extraction rate does not encourage population growth
(dNd�< 0). Thus, an increase in the tax rate will lead to a decrease in the percentage
of the population working in the non-agricultural sector if (1� �)(1� �)dNd�+N > 0
which implies (letting � dNd�
N= �)
� >� � 1
1���
(4)
Note that d ln(1��)d�
= � 11�� , � = �
d lnNd�
= �d ln'Nd�
and � = dFdL
LF. The quantity
11�� is the percent increase in the crop needed to maintain subsistence consumption
due to the increase in the tax rate. The quantity � is both the percentage decrease
in the population due to an increase in the tax rate and the percentage decrease in
agricultural output needed to maintain subsistence consumption due to the exit of
peasants caused by the increase in the tax rate. The constant � is simply the labor
elasticity of agricultural production.
To better understand (4) let � = 3 and 11�� = 2 and �� = 0:01 so that the tax
increase needs to be accompanied by (approximately) a 2% increase in agricultural
production all else equal to maintain subsistence consumption due to the loss of
production to taxes. The increase in the tax rate, however, also leads to a 3%
decrease in the population and in the agricultural production needed to maintain
subsistence consumption. Equation (4) tells us that the increase in the tax rate will
lead to a decrease in the percentage of the population working in the non-agricultural
sector if � > 13.
16
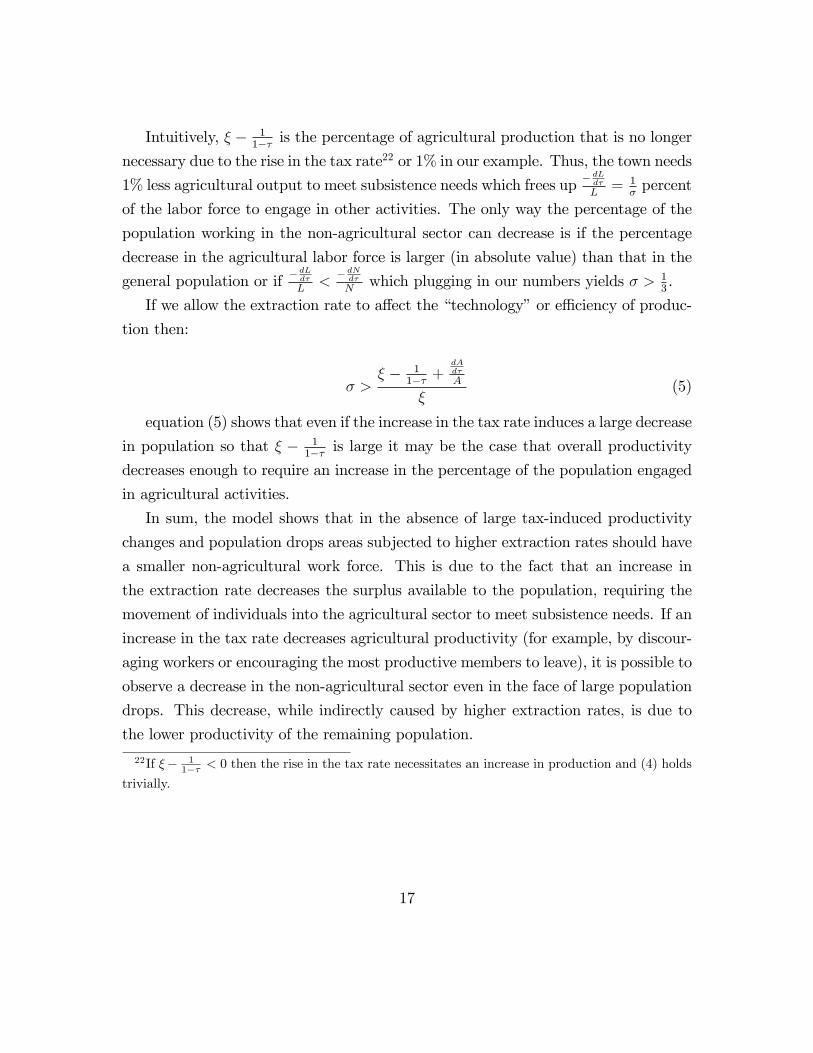
Intuitively, � � 11�� is the percentage of agricultural production that is no longer
necessary due to the rise in the tax rate22 or 1% in our example. Thus, the town needs
1% less agricultural output to meet subsistence needs which frees up � dLd�
L= 1
�percent
of the labor force to engage in other activities. The only way the percentage of the
population working in the non-agricultural sector can decrease is if the percentage
decrease in the agricultural labor force is larger (in absolute value) than that in the
general population or if �dLd�
L<
� dNd�
Nwhich plugging in our numbers yields � > 1
3.
If we allow the extraction rate to a¤ect the �technology�or e¢ ciency of produc-
tion then:
� >� � 1
1�� +dAd�
A
�(5)
equation (5) shows that even if the increase in the tax rate induces a large decrease
in population so that � � 11�� is large it may be the case that overall productivity
decreases enough to require an increase in the percentage of the population engaged
in agricultural activities.
In sum, the model shows that in the absence of large tax-induced productivity
changes and population drops areas subjected to higher extraction rates should have
a smaller non-agricultural work force. This is due to the fact that an increase in
the extraction rate decreases the surplus available to the population, requiring the
movement of individuals into the agricultural sector to meet subsistence needs. If an
increase in the tax rate decreases agricultural productivity (for example, by discour-
aging workers or encouraging the most productive members to leave), it is possible to
observe a decrease in the non-agricultural sector even in the face of large population
drops. This decrease, while indirectly caused by higher extraction rates, is due to
the lower productivity of the remaining population.
22If �� 11�� < 0 then the rise in the tax rate necessitates an increase in production and (4) holds
trivially.
17
4.2 The E¤ect of Extractive Institutions on the Composition
of the non-Agricultural Sector
The previous discussion suggests that an increase in the extraction rate decreases the
total share of the population engaged in non-agricultural activities. The composition
of the non-agricultural class, however, is not addressed. Let �ij denote the proportion
of the active population of town i in region j engaged in agricultural activities. Then
the proportion of the active population engaged in other activities is: 1��ij =Pk
�ijk
where k indexes all possible occupations and �k is the share of occupation k.
An increase in the extraction rate will a¤ect the proportion of the population
working in a given sector of the non-agricultural economy by �d�ijd��Pk 6=l
d�ijkd�
=d�ijld�.
Even though an increase in the extraction rate requires a decrease in the overall
proportion of the population engaged in non-agricultural activities, this decrease may
be concentrated in �non-productive�areas. An increase in the extraction rate could
even lead to an increase in a given sector if participation in other sectors decreases
by a large amount. If extractive institutions did stunt the economic development
of the formerly Morisco municipalities, we should see a signi�cant decrease in the
�productive�non-agricultural activities.
5 Quantitative Evidence
Theoretical considerations and the qualitative evidence suggest that the formerly
Morisco municipalities should be underdeveloped23 when compared to their non-
Morisco neighbors. This section tests the prediction using data from censuses in
1609, 1646 and 1787.
23Underdeveloped is de�ned as having a smaller proportion of the population employed in �pro-
ductive�non-agricultural activities.
18
5.1 The Data
Data on the population and location of Christian and Morisco municipalities come
from the 1609 census.24 Post-expulsion data comes from two additional censuses in
1646 and 1787.
The general census of 1609 was performed immediately before the expulsion to
assess the relative size of the Morisco population. The number of households in a
given municipality is provided, along with the religious a¢ liation of the inhabitants.
The general census of 1646 provides the number of households in each municipal
area.
Charles III ordered the 1787 census in order to evaluate the e¤ects of the regime�s
modernization e¤orts. The quality of the census is universally recognized and has
been dubbed �the most valuable census of the 18th century�(Castello 1978, p. 13)
The census provides details on the number and ages of the population in a given
municipality as well as the occupations of the inhabitants. Workers are grouped
into 11 general occupational categories25: agricultural workers, artisans, �industrial�
or textile workers, lawyers, notaries, merchants, students, lay clergy, government
workers, household servants and members of the lower nobility.
The categories �industrial�workers and artisans were designed to allow the Crown
to �clearly di¤erentiate individuals working in traditional artisanal activities (de-
noted artisans in the census) from those working in what were considered �innova-
tive�sectors (denoted �industrial�workers)�(Castello 1978, p. 60). Castello (1978)
has shown that census o¢ cials identi�ed �innovation� exclusively with the textile
industry independent of the production techniques used. Artisans included tailors,
carpenters, shoe makers, smiths, tavern keepers, butchers and locksmiths among
other activities.
Table 1 details summary statistics for the percentage of the 1787 active26 popula-
tion engaged in each sector. The �rst entry shows that roughly 80% of the Valencian
24This section follows Lapeyre (1959) and Castello (1978) closely.25I have aggregated some of the more obscure subcategories for clarity.26The results do not qualitatively change if we use the proportion of the total population.
19
population engaged in agricultural production. I have classi�ed the remaining sec-
tors into �productive�and �nonproductive�activities. Artisans were by far the most
well represented �productive�sector. Household servants and the lay clergy were the
largest �nonproductive�activities.
The 427 municipalities used in the analysis largely correspond to the 1609 mu-
nicipal boundaries. The appendix explains the data in greater detail.
5.2 Testing the Hypothesis: Empirical Strategy
In the ideal world, we would observe two observations on the same municipality in
each time period: one treated with extractive institutions, the other treated with
a benign institutional framework. A close second best would randomly assign two
types of institutions (�good�and �bad�) to municipalities. Although both of these
experiments are not feasible, the expulsion provides an experiment that plausibly
approximates the randomly assigned �gold�standard.
Cavanilles in his 1797 description of the formerly Morisco areas describes the crux
of the identi�cation strategy. He noted that
[T]he lords stipulated onerous conditions [when the Morisco lands were
resettled] giving rise to what are today [1797] known as �free�and �bur-
dened�lands in the same estate and often in two adjacent �elds, if one
belonged to a Morisco and the other to a Christian.27
The empirical strategy uses the fact that Morisco and Christian areas were often
in very close proximity to identify the e¤ect of the high extraction rates in the Morisco
areas. The key identifying assumption is that if we restrict comparison to a small
enough area, �treatment� with exploitative institutions is exogenous in the sense
described below.
This strategy is detailed graphically in �gure 1. The left hand map details the
geographic location of the Morisco municipalities in 1609 and the right hand map
27Cavanilles (1797, II, pp. 161-162)
20
details the percent of the 1787 active population engaged in agriculture. The rela-
tionship between Morisco areas and large agricultural sectors is striking.
5.2.1 The Identi�cation Strategy and the Agricultural Sector
The previously described �second best� test of the long-term e¤ect of institutions
on long-term economic outcomes would randomly assign two types of institutions
(�good�and �bad�) to municipalities. If the treatment of a given municipality i does
not a¤ect the outcome of its neighbors28 (for example if trade is limited) then the dif-
ference E[OutcomeiT jBadInstitutionsi = 1] � E[OutcomeiT jBadInstitutionsi = 0]would identify the average treatment e¤ect of �bad�institutions on a given outcome
at time T.
This experiment is not possible. The expulsion of the Moriscos, however, cre-
ated a �natural experiment� that in some ways approximates this ideal situation.
The formerly Morisco municipalities were �treated� with �bad� institutions fol-
lowing their reconquest. Whether or not a given municipality was treated with
these exploitative arrangements depended on whether the Muslim population sur-
rendered or fought as the Christian reconquering armies advanced (LaPeyre 1959,
pp. 29). If resisting or surrendering was independent of the counterfactual out-
come of municipality i,29 then on the eve of the expulsion the mean comparison
E[Outcomei1608jMoriscoi = 1] � E[Outcomei1608jMoriscoi = 0] would identify the
average treatment e¤ect (on the treated) of �bad� institutions on a given outcome
in 1608 along with other di¤erences (e.g. culture) due to the fact that the Morisco
municipalities were inhabited by crypto-Muslims and not Christians.
The expulsion removed the Moriscos without removing the extractive institutional
arrangements. The expulsion, however, added at least one additional confound.30
Morisco municipalities lost their entire populations while the surrounding Christian
28This is the assumption of stable unit treatment value (SUTVA).29This assumption would be violated, for example, if the municipalities with the worst land were
more likely to resist and bad land a¤ected a given outcome.30The adverse selection previously discussed was due, at least in part, to the institutional frame-
work and will be discussed below.
21
municipalities did not. If the e¤ects of this population shock decayed over time, by
1787 the mean comparison should identify the long-term e¤ects of the exploitative
institutional framework.
To provide some notation, consider Yij1787 de�ned as the outcome of municipality
i in region j in 1787. Each municipality was �treated�with an extractive or benign
institutional framework depending on whether or not it was inhabited by Moriscos
prior to the expulsion. Let Yij1787(1) be the outcome of municipality i in region j in
1787 �treated�with exploitative institutions and Yij1787(0) the outcome when treated
with a more benign institutional framework.
The mean comparison at the regional level
E[Yij1787(1)jj = J;Moriscoij = 1]� E[Yij1787(0)jj = J;Moriscoij = 0] = j (6)
will identify the average treatment e¤ect31 in a given region if treatment is ignorable
(in the conditional mean sense) at this level of aggregation. As the regions of com-
parison become smaller and smaller, this assumption becomes increasingly plausible.
We can estimate the weighted average of the region-speci�c average treatment e¤ects
(WATE), by examining the coe¢ cient � in the regression
Yij1787 = �j + �Moriscoij + "ij (7)
where �̂ =Pj
wj ̂j. Each region�s estimate ̂j of (6) is weighted by that region�s
share of the total variation of the dummy variableMoriscoij; wj. Regions that do not
have both Christian and Morisco municipalities will be excluded from the weighted
average. Thus, there is a trade-o¤when determining how �nely to compare the data.
As we consider increasingly smaller regions, the ignorability of treatment assumption
becomes increasingly plausible but we are able to estimate the regional ATEs for a
decreasing number of regions.
The results of (7) are presented in table 2. The �rst column shows that formerly
Morisco areas employed roughly 9.6% (three-fourths of a standard deviation) more
of their active population in agriculture than areas that had been Christian before
31On the treated.
22
the expulsion. This comparison, however, is made across all of Valencia (�j = �)
and it could be the case that Morisco municipalities were located in areas that were
systematically di¤erent from Christian areas.
To address this concern, column (2) restricts comparison to 9 regions as de�ned
by the Valencian historian Ardit (2008). To give a sense of the geographic area of
comparison, consider that the entire kingdom of Valencia was smaller than the US
state of New Jersey. The area of the largest region de�ned by Ardit is 1431 square
miles (a 39 mile by 39 mile square), the smallest region is 517 square miles (23 miles
by 23 miles). The results in column (2) show that comparing within these regions
brings the point estimate down, although the Morisco municipalities still have much
larger agricultural sectors than their regional neighbors.
Finally, historians and geographers have also divided Valencia into 32 comarcas
or macro-municipal areas. The largest of these comarcas is 572 square miles and
the smallest is 40 square miles. The results in column (3) show that comparing
municipalities at this �ner level does not alter the results.32
If �treatment�at the comarca level is ignorable, the addition of controls should
not signi�cantly a¤ect the point estimates. Column (4) shows that the introduction
of geography controls33 as well as a control for the severity of the population shock
following the expulsion do not signi�cantly change the point estimate on the variable
Morisco. Thus, the ignorability assumption seems plausible at the comarca level.34
32I also examined the sensitivity of the results to outliers. The results are extremely robust and
I could not �nd a medium-sized group of Morisco and Christian areas where the Morisco areas do
not have a statistically signi�cant larger agricultural sector.33These controls consist of the mean height and the standard deviation of heights in a given
municipality and were constructed in the Spirit of Nunn and Puga (2008). Given the small ar-
eas considered, it is likely that the majority of di¤erences in land quality were a function of the
�ruggedness�(measured by the within municipality standard deviation of heights) of the land. See
data appendix for details.34All standard errors are clustered at the comarca level. These do not substantially change if we
instead use heteroskedasticity-robust or homoskedastic errors. This result supports our assumption
of little trade in agricultural products even within comarcas. We would expect signi�cant nega-
tive correlation within comarcas if a few areas were producing most of the comarca�s agricultural
produce.
23
Columns (5) and (6) show that the decline in the non-agricultural sector in for-
merly Morisco areas translated mostly into a fall in what we have called �produc-
tive� activities. In sum, the data provide support for the model�s prediction that
the increased extraction rates in the Morisco areas strangled the development of
the non-agricultural class in these areas. Moreover, this e¤ect seems to have been
concentrated in the most �productive�non-agricultural sectors.
Institutions or Human Capital? The previous results provide evidence that
extractive institutions in the formerly Morisco municipalities dampened the devel-
opment of the non-agricultural sector. Until now, the analysis has assumed these
were direct e¤ects of the exploitative arrangements in the formerly Morisco areas.
This interpretation of the results suggests that Morisco areas remained underdevel-
oped because �bad� institutions directly dampened development by impoverishing
the population and/or a¤ecting productivity.
To address the possibility that initial di¤erences in human capital are driving
the results we use plausibly exogenous variation in the repopulation process of the
formerly Morisco municipalities.
As previously noted, there is evidence that Christian areas that bordered Morisco
municipalities prior to the expulsion lost signi�cantly more of their population follow-
ing the expulsion than areas that did not. Christian areas that did not border Morisco
areas saw a much smaller share of their �low�human capital emigrate. Consequently,
the 18th century inhabitants of Christian towns that bordered Morisco areas in 1609
descended from the economically successful.35
This �border e¤ect� is demonstrated empirically using census data from 1609
and 1646 in column (1) of table 3. Column (1) details the regression of the percent
change in population between 1609 and 1646 on a dummy variable for whether a
given municipality was Morisco in 1609, a dummy variable indicating whether a mu-
nicipality bordered that of a di¤erent faith (Bord), an interaction term and controls.
The coe¢ cient on the dummy variable Bord shows that a Christian municipality that
35After 1630 there is little evidence of widespread immigration or emigration as previously dis-
cussed.
24
bordered a Morisco area on average lost 14% more of its population than Christian
areas that did not. According to archival evidence, these emigrants were individuals
with the lowest levels of human capital.
Column (1) also details that Morisco areas bordering Christian municipalities lost
41% more of their population36 compared with 45% for those exclusively bordering
Morisco areas, although the di¤erence between the drops in Morisco areas is not
statistically signi�cant.37 There is qualitative evidence, however, that Morisco ar-
eas that bordered Christian areas attracted settlers with signi�cantly higher human
capital than areas that did not.38
If these initial human capital di¤erences remained important39 in 1787, we would
expect municipalities that bordered areas of a di¤erent faith in 1609 to be more
developed40 than those that did not.
To better understand this strategy suppose that a given outcome is related to the
level of institutions and human capital by a di¤erentiable function f(INST;HC).41
Variation in the resettlement process created 4 types of municipalities: 1) Chris-
tian municipalities that did not border Morisco municipalities in 1609 with �good�
institutions (GI) and �average� human capital (HC), 2) Christian municipalities
that bordered Morisco areas with �good� institutions and �better�human capital
(HC+GHC), 3) Morisco municipalities that bordered Christian areas with �bad�
institutions (BI) and �bad�human capital (MHC+MGHC) and 4) Morisco munici-
palities that were surrounded by Morisco municipalities that had �bad�institutions
and the �worst�human capital (MHC).
36When compared to Christian areas that did not border Morisco areas.37This may be due to the fact that the lords of the more isolated lands often lowered the rates to
attract settlers. Unfortunately, a detailed explanation of the repopulation process is not possible
here (see Ciscar (1977, 1991 and 2006) for details). Su¢ ce it to say that the concessions seem to
have been minor. There is qualitative evidence that the more isolated areas received the worst
settlers in spite of these rebates.38See section 3.1.1 for a more detailed discussion of the evidence.39And were not systematically related to unobservables.40Within a given institutional framework.41We assume that for a small enough comparison group land quality can be considered constant.
25
For notational ease denote a given outcome in municipalities of type 1 by Y11,
outcomes in those of type 2 by Y10, those of type 3 by Y01 and those of type 4 by
Y00. Then Y11 � Y10 = f(GI;HC + GHC) � f(GI;HC) � f2(GI;HC)GHC by a
Taylor expansion. Similarly, Y01�Y00 � f2(BI;MHC)MGHC. Although we do not
observe GI, MI, HC, GHC, MHC or f(�,�) under a few assumptions we can use theavailable information to ascertain the importance of human capital within a given
institutional framework.
If the level of institutions and human capital before the expulsion was constant
at the regional level in the Christian municipalities (GI = GI ;HC = HC), then
E[Y11 � Y10] � f2(GI;HC)E[GHCij] is the e¤ect in 1787 of the mean increase in
human capital in a given region due to the exodus of unskilled workers to Morisco
areas. Similarly E[Y01 � Y00] � f2(BI;MHC)E[MGHCij].
To estimate these quantities we create a dummy variable bordij = 1 if a munic-
ipality bordered at least one municipality of a di¤erent religion in 1609. We then
estimate
Yij1787 =2Xk
Xj
�kjregj �Rijk +2Xk
kbordij �Rijk + "ij (8)
where regj is a dummy variable equal to one if a given observation belongs to
region j, Rij1 = Moriscoij and Rij2 = Christianij and the other variables are as
previously de�ned. The coe¢ cients 1 and 2 represent the WATE estimates within
institutional frameworks (Christian or Morisco) of treatment with a higher level of
human capital.
These results are presented in table 4 for the percentage of the active population
in 1787. Column (2) shows that we cannot reject the hypothesis that di¤erences in
the level of the human capital of the re-settlers had no di¤erence on the percentage
of the 1787 population engaged in agriculture. This is true when we compare high
and low human capital areas at the province, region and comarca levels.
Columns (3) and (4) detail similar comparisons for the percentage of the popula-
tion engaged in �productive�and �nonproductive�non-agricultural activities. Col-
umn (3) shows that Morisco areas with better initial human capital had a larger pro-
26
ductive non-agricultural class than municipalities that got the worst settlers. Column
(4) details that this di¤erence is primarily driven by a signi�cantly larger artisanal
class in these areas.
Christian areas with initially higher human capital do not seem to have done
signi�cantly better than Christian areas that did not lose their unskilled workers.
There is some evidence in column (6), however, that these areas had more work-
ers employed in the innovative textile industries when comparison are made at the
comarca level.
It is important to remember when interpreting these results that while trade
in agricultural goods was limited, there is evidence that trade in artisanal goods
and textiles was much less constrained.42 Thus, a di¤erence in the composition
of the non-agricultural sector could be driven by systematic di¤erences in trading
opportunities. For example, former Morisco areas that were completely surrounded
by Morisco areas were also surrounded by less developed economies in 1787.
When taken in unison, the results provide little evidence that lower initial human
capital levels following the expulsion signi�cantly dampened the size of the non-
agricultural sector in 1787. There is some evidence that these initial di¤erences may
have mattered for the composition of the non-agricultural sector, although it is just
as plausible that these results are being driven by di¤erences in trading opportunities
generated by the relative development of the surrounding areas.
The Relative Importance of Institutions and Human Capital The previous
results suggest that the systematic di¤erences in institutions between Morisco and
Christian areas generated the observed di¤erences in 1787. Given that we only
observe variation in human capital within a given institutional framework, however,
it still may be the case that the long-term e¤ects of initial between-institutional
di¤erences in settler human capital drive the results.
The framework of Glaesar et al. predicts that Morisco areas that bordered
Christian areas would have better institutions and economic outcomes in 1787 than42This is due to high transportation costs that made agricultural trade largely unpro�table.
Lighter and more expensive artisanal goods and textiles, however, were traded more extensively.
27
Morisco areas that did not since the higher levels of human capital in these areas
would work to ameliorate the institutional framework. There is some evidence that
the inhabitants of a few Morisco areas successfully worked to change the institutional
framework for the better (Ciscar (1991), pp. 214-215). These institutional changes
may have generated the larger productive sector in 1787 in the Morisco towns that
bordered Christian areas. However, given that these institutional changes seem to
have been minor it seems just as likely that the observed di¤erences within Morisco
areas are due to other factors. In general, the institutional framework in the Morisco
areas appears to have remained consistently bad until the 19th century. Similarly,
there is little evidence in this period for institutional change within the Christian
areas.
If the initial di¤erences in human capital within Christian and/or Morisco ar-
eas was comparable to the initial di¤erences in the human capital levels between
institutional regimes, then it seems unlikely that Morisco areas in 1787 had worse
institutions because the initial settlers had lower levels of human capital. The insti-
tutional regimes appear to have been di¢ cult to change. Indeed, much of the good
fortune of the Christian areas came from nominal contracts (and the willingness of
the courts to uphold these contracts) that were devalued by the in�ation of the 16th
century and not by concerted peasant action.
Clark (2007) predicts that the formerly Morisco areas would be less developed
because the inhabitants had a less �industrious�culture than their neighbors. The
experience of the Christian towns that bordered Morisco areas in 1609 is a direct
test of Clark�s hypothesis. Instead of a long process through which the culture of
the economically successful spread by out-reproducing the unsuccessful, Christian
areas that bordered Morisco areas simply saw most of their unsuccessful population
leave overnight. Results in table 4 do not provide much evidence that cities where
the inhabitants descended primarily from the economically successful outperformed
areas where both the economically successful and unsuccessful remained.
In sum, variation in settlers�human capital within institutional frameworks com-
bined with qualitative evidence provides little evidence that initial di¤erences in
human capital were crucial determinants of the size of the non-agricultural sector in
28
1787. Indeed, 18th century writers often stress the industrious nature of the inhab-
itants of the Morisco areas and attribute their poverty to the perverse institutional
framework.
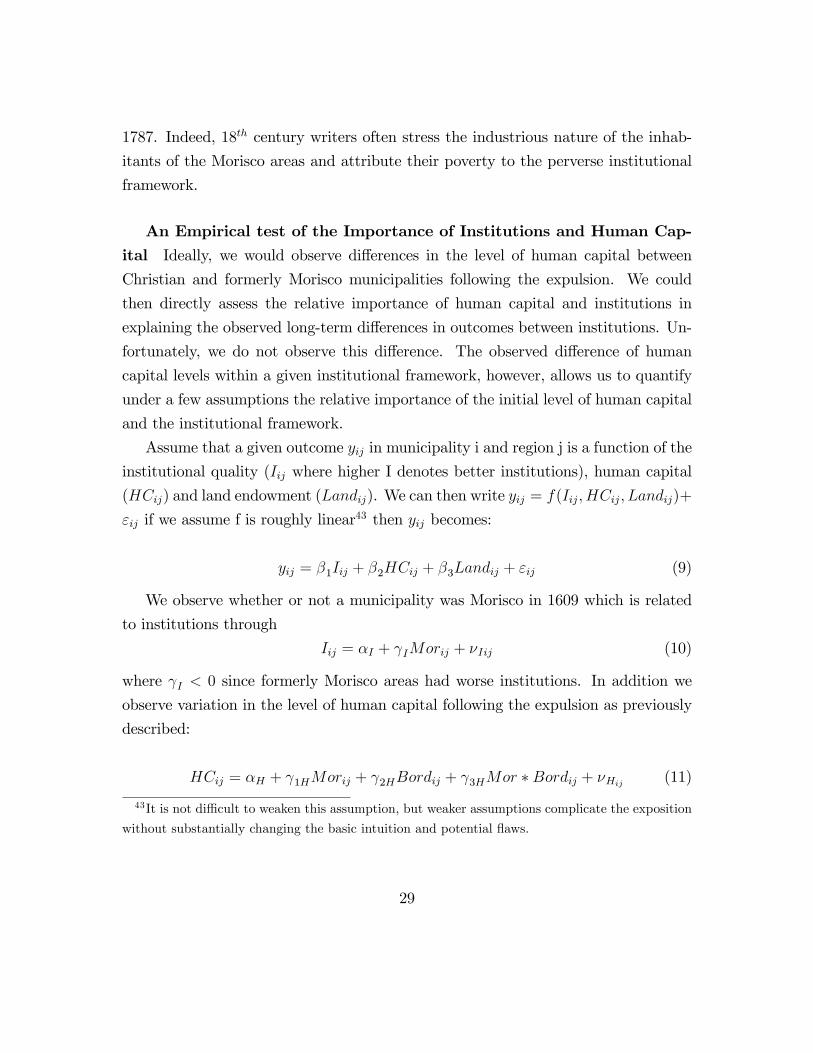
An Empirical test of the Importance of Institutions and Human Cap-ital Ideally, we would observe di¤erences in the level of human capital between
Christian and formerly Morisco municipalities following the expulsion. We could
then directly assess the relative importance of human capital and institutions in
explaining the observed long-term di¤erences in outcomes between institutions. Un-
fortunately, we do not observe this di¤erence. The observed di¤erence of human
capital levels within a given institutional framework, however, allows us to quantify
under a few assumptions the relative importance of the initial level of human capital
and the institutional framework.
Assume that a given outcome yij in municipality i and region j is a function of the
institutional quality (Iij where higher I denotes better institutions), human capital
(HCij) and land endowment (Landij). We can then write yij = f(Iij; HCij; Landij)+
"ij if we assume f is roughly linear43 then yij becomes:
yij = �1Iij + �2HCij + �3Landij + "ij (9)
We observe whether or not a municipality was Morisco in 1609 which is related
to institutions through
Iij = �I + IMorij + �Iij (10)
where I < 0 since formerly Morisco areas had worse institutions. In addition we
observe variation in the level of human capital following the expulsion as previously
described:
HCij = �H + 1HMorij + 2HBordij + 3HMor �Bordij + �Hij (11)
43It is not di¢ cult to weaken this assumption, but weaker assumptions complicate the exposition
without substantially changing the basic intuition and potential �aws.
29
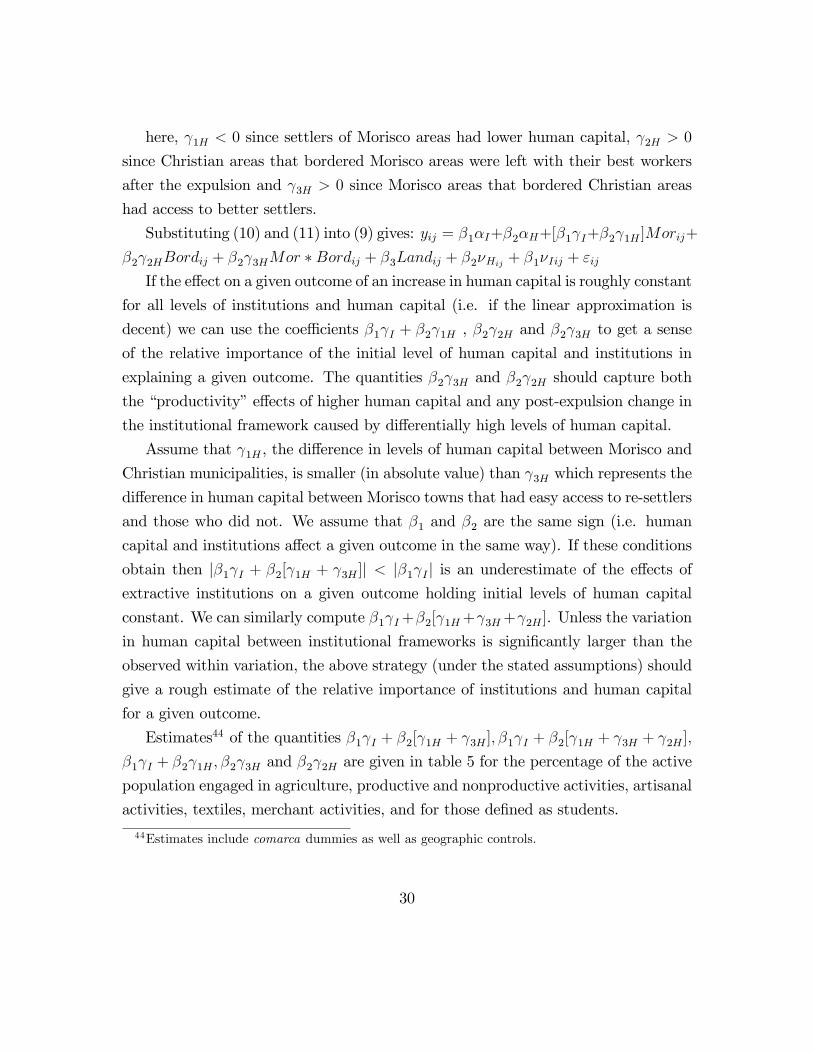
here, 1H < 0 since settlers of Morisco areas had lower human capital, 2H > 0
since Christian areas that bordered Morisco areas were left with their best workers
after the expulsion and 3H > 0 since Morisco areas that bordered Christian areas
had access to better settlers.
Substituting (10) and (11) into (9) gives: yij = �1�I+�2�H+[�1 I+�2 1H ]Morij+
�2 2HBordij + �2 3HMor �Bordij + �3Landij + �2�Hij + �1�Iij + "ij
If the e¤ect on a given outcome of an increase in human capital is roughly constant
for all levels of institutions and human capital (i.e. if the linear approximation is
decent) we can use the coe¢ cients �1 I + �2 1H , �2 2H and �2 3H to get a sense
of the relative importance of the initial level of human capital and institutions in
explaining a given outcome. The quantities �2 3H and �2 2H should capture both
the �productivity�e¤ects of higher human capital and any post-expulsion change in
the institutional framework caused by di¤erentially high levels of human capital.
Assume that 1H , the di¤erence in levels of human capital between Morisco and
Christian municipalities, is smaller (in absolute value) than 3H which represents the
di¤erence in human capital between Morisco towns that had easy access to re-settlers
and those who did not. We assume that �1 and �2 are the same sign (i.e. human
capital and institutions a¤ect a given outcome in the same way). If these conditions
obtain then j�1 I + �2[ 1H + 3H ]j < j�1 I j is an underestimate of the e¤ects ofextractive institutions on a given outcome holding initial levels of human capital
constant. We can similarly compute �1 I+�2[ 1H+ 3H+ 2H ]. Unless the variation
in human capital between institutional frameworks is signi�cantly larger than the
observed within variation, the above strategy (under the stated assumptions) should
give a rough estimate of the relative importance of institutions and human capital
for a given outcome.
Estimates44 of the quantities �1 I + �2[ 1H + 3H ]; �1 I + �2[ 1H + 3H + 2H ];
�1 I + �2 1H ; �2 3H and �2 2H are given in table 5 for the percentage of the active
population engaged in agriculture, productive and nonproductive activities, artisanal
activities, textiles, merchant activities, and for those de�ned as students.
44Estimates include comarca dummies as well as geographic controls.
30
Coe¢ cients in the �rst row detail the combined e¤ect of �bad�institutions and
low levels of human capital. The second entry provides the estimate of the e¤ect
of losing �low�human capital when endowed with �good� institutions and human
capital. The third entry gives an estimate of the e¤ect of having better human capital
settlers following the expulsion in Morisco areas. The fourth and �fth rows detail
the estimates of the e¤ects of �bad� institutions holding the human capital of the
re-settlers constant.
Column (1) shows that the large agricultural sector in Morisco areas does not
seem to be driven by di¤erences in human capital. Column (2) shows that initial
di¤erences in human capital may be driving some of the results in the productive
sector (although these results should be treated with caution as previously noted).
The third column shows that the initial level of human capital seems irrelevant for
the size of the unproductive sector. Columns (4), (5) and (6) further break up the
results in the productive sector.
The results show45 that the di¤erences in the initial levels of the settler�s human
capital do not explain much of the variation in the size of the non-agricultural sector.
Unless the di¤erences in initial human capital levels between Morisco and Christian
areas were substantially larger than those caused by the repopulation process within
institutional frameworks, then under the stated assumptions we can conclude that
the initial levels of settler human capital are at best of secondary importance.
5.3 Potential Confounds
The combination of quantitative and qualitative evidence suggests that the extrac-
tive institutions that remained in the formerly Morisco municipalities following the
expulsion dampened the development of the non-agricultural sector. There is also
evidence that this result is not solely driven by initial di¤erences in the human cap-
ital of the settlers. There are, however, at least 3 additional confounds that may be
driving the results.
The �rst alternative explanation of the results suggests that the population shock
45Under the stated assumptions.
31
the Morisco areas experienced, not the institutions, is the cause of observed di¤er-
ences in 1787. This hypothesis is not supported by the data. Columns (2), (3) and (4)
in table 3 show that while the Morisco areas were signi�cantly less densely populated
in 1646 than their neighbors, this di¤erence in 1787 is no longer statistically di¤erent
from 0.46 This suggests that the population in Morisco areas recovered after the
expulsion. Moreover, the link between population density and the non-agricultural
class is quite weak. Indeed, many areas with small 1787 populations had developed
relatively large non-agricultural sectors.
The second explanation focuses on the assumption that agricultural trade did not
occur between municipal areas. Although there is evidence that there was very little
trade in agricultural goods across even small distances,47 the identi�cation strategy
relies on municipalities that are in close proximity. It could be the fact that Morisco
areas specialized in agriculture and traded agricultural goods for manufactures from
Christian areas.48 However, even if this were the case, it is unlikely that the Morisco
areas would sort into the agricultural sector in the absence of some systematic dif-
ferences between Morisco and Christian areas. While the possibility of local trade
in agricultural products would require changing the model outlined in section 4, the
basic result that the presence of extractive institutions dampens the development of
the non-agricultural sector remains.
The third issue �rst recognizes that within-institutional variation in human cap-
ital following the expulsion may be small compared to the human capital di¤erences
between institutional regimes.49 Second, it may be that the �within-cultural�vari-
ation in human capital we observe following the expulsion is very di¤erent than
46The 3 dropped observations in columns (2), (3) and (4) correspond to municipalities where the
estimated areas were rounded to 0 by the GIS software.47The largest Valencian cities are an exception to this general rule, and the results are not sensitive
to the exclusion of these areas.48It must be stressed that although this is a possibility it is not supported by the data or the
qualitative evidence.49It may also be the case that the linear approximation in (9) is poor. This may well be the case,
although the fact that we observe little e¤ect of an increase in human capital starting from both
�good�and �bad�situations suggests this may not be an important problem.
32
�cross-cultural�variation.
Variation in human capital within-institutions may be smaller than that between-
institutions although there is qualitative evidence from the repopulation process that
the human capital in remote Morisco areas was initially considerably worse than that
in less remote areas. Descriptions of the average level of human capital in the most
isolated Morisco towns markedly di¤er from descriptions of settlers in areas that
were less isolated. While those who settled less isolated areas were described as
poor, those who went to the isolated areas were described as destitute and some
engaged in criminal activities immediately following the settlements.50
The second point is certainly possible, and if true limits the external validity of
the �ndings.
In sum, the available evidence points to the fact that the extractive institutions
that remained in the Morisco areas following the expulsion dampened the devel-
opment of the non-agricultural sector. While it is impossible to rule out that the
low-levels of human capital that accompanied the settlers of these areas played a role
in dampening development, the data do not provide much support for this hypothe-
sis.
6 Conclusion
What would Valencia have looked like in 1787 had the formerly Morisco areas adopted
the more benign institutions of the Christian municipalities following the expulsion?
The evidence suggests these areas would have seen roughly 8% of their populations
leave the agricultural sector, mainly to provide artisanal goods and other �produc-
tive�services.
The results suggest that extractive institutions in pre-industrial economies signif-
icantly dampen the emergence of a �manufacturing�sector. In the case of Valencia,
this result provides some support for the hypothesis that the institutions established
following the expulsion delayed the region�s industrialization.51
50See Ciscar (2006), especially note 35.51As has been argued by a generation of Valencian historians.
33
In addition to providing unique micro-level insights into the mechanisms through
which exploitative institutions dampen the development of pre-industrial economies,
the evidence allows us to analyze the role initial di¤erences in human capital can
have on long-term outcomes. The results suggest that initial di¤erences in human
capital have little long-run economic impact, at least for the institutional and human
capital endowments of early modern Spain. It still may be the case, however, that
di¤erences in human capital �between-cultures�do have signi�cant long-term e¤ects.
Finally, Valencia following the expulsion of the Moriscos provides a unique op-
portunity to analyze the mechanisms through which extractive institutions persist.
The evidence suggests that much of Valencia�s �nancial and economic system was
built around the exploitation of the Moriscos. After the expulsion, many of those
who had become powerful due to the exploitation of the Moriscos had much to lose.
The link between the welfare of Valencia�s elite and the persistence of the kingdom�s
extractive institutions explains much of their endurance following the expulsion.
Valencian nobles were by no means unique in their exploitation of a group of
people marginalized because of race, religion, or class. The case of Valencia holds
important insights into the long-term implications of exploitation for both the ex-
ploited and for those who hold power. The economic exploitation of Valencian Mus-
lims for over 300 years suggests that those who bene�t from this exploitation may
be dooming their descendants to poverty. While the Muslims of Valencia su¤ered
under exploitative institutions for hundreds of years, these exploitative arrangements
persisted even after their expulsion. The remaining Christian population remained
poorer and less developed over 150 years after the expulsion due to the persistence
of these extractive arrangements.
References
Acemoglu, Daron, Simon Johnson and James Robinson. 2001. �The Colo-nial Origins of Comparative Development: an Empirical Investigation�American
Economic Review, 91(3): 1369-1401.
34
Acemoglu, Daron, Simon Johnson and James Robinson. 2002. �Reversal ofFortune: Geography and Institutions in the Making of the Modern World Income
Distribution�Quarterly Journal of Economics, 117(4): 1231-1294.
Ardit, Manuel. 1985. Revolución Liberal y Revuelta Campesina. Barcelona: Ariel.Ardit, Manuel. 2008. L�expulsió dels Moriscos als Països Catalans: ideologia ihistòria Universitat de València�Institut d�Estudis Catalans: Unpublished Manu-
script.
Badenes, Miquel and Bernat, Joan. 1994. Crecimiento de la Población Valen-ciana. Valencia: Edicions Alfons el Magnànim.
Boronat, Pascual. 1901. Los Moriscos Españoles y su Expulsión: Estudio Histórico-Crítico. Valencia: Imprenta de Francisco Vives y Mora.
Burns, Robert. 1973. Islam under the Crusaders: Colonial Survival in the
Thirteenth-Century Kingdom of Valencia. Princeton: Princeton University Press.
Burns, Robert. 1975. Medieval Colonialism. Princeton: Princeton University
Press.
Casey, James. 1979. The Kingdom of Valencia in the Seventeenth Century. Lon-
don: Cambridge University Press.
Castello, Josep-Emili. 1978. El País Valenciano en el Censo de Floridablanca.Valencia: Instituto Valenciano de Estudios Históricos.
Cavanilles, Antonio. 1797. Observaciones sobre la Historia Natural Geographía,Agricultura, Población y Frutos del Reyno de Valencia. Repr., Zaragoza: Consejo
Superior de Investigaciones Cientí�cas, 1958.
Ciscar, Eugenio. 1977. Tierra y Señorío en el País Valenciano (1570-1620).
Valencia: Del Cenia al Segura.
Ciscar, Eugenio. 1991. Moriscos, Nobles y Repobladores. Valencia: Edicions
Alfons el Magnanim.
Ciscar, Eugenio. 2006. �Economía y Fiscalidad en los Señorios Pobres de la
Casa de Gandía en la Epoca de la Expulsión de los Moriscos.�Revista de Historia
Moderna, 24: 123-152.
Clark, Gregory. 2007. A Farewell to Alms. Princeton: Princeton University Press.Engerman, Stanley and Kenneth Sokolo¤. 2002. �Factor Endowments, Insti-
35
tutions, and Di¤erential Paths of Growth Among New World Economies.�NBER
Working Paper 2002.
Glaeser, Edward, Rafael La Porta, Florencio Lopez-De-Silanes and AndreiShleifer. 2004. �Do Institutions Cause Growth?�Journal of Economic Growth, 9 :271-303.
Harvey, Leonard. 2005. Muslims in Spain 1500 to 1614. Chicago: University ofChicago Press.
LaPeyre, Henri. 1959. Géographie de l�Espagne Morisque. Paris: S.E.V.P.E.N.Meyerson, Mark. 1991. The Muslims of Valencia: In the Age of Fernando andIsabel: between Coexistence and Crusade. Berkeley: University of California Press.
Nadal, Jordi. 1976. La Población Española. Barcelona: Ariel.Nunn, Nathan. 2008. �The Long-Term E¤ects of Africa�s Slave Trades�QuarterlyJournal of Economics, 123 (1): 139-176.
Nunn, Nathan and Diego Puga. 2008. �Ruggedness: The Blessing of Bad
Geography in Africa�Harvard Department of Economics: Unpublished Manuscript.
Torres Morera, Juan Ramón. 1969. Repoblación del Reino de Valencia Despuésde la Expulsión de los Moriscos. Valencia: Publicaciones del Archivo Municipal.
Data Appendix
Data from the 1609, 1646 and 1787 censuses are provided by Badenes and Bernat
(1994) and Castello (1978). I de�ne a municipality as Morisco if its namesake town
was inhabited solely by Moriscos in 1609. The small number of municipalities that
were inhabited by both Christians and Moriscos before the expulsion are classi�ed
as Christian since these areas retained the institutional framework that governed the
Christians following the expulsion.
I begin with the modern municipal boundaries of the Comunidad Autónoma Va-
lenciana which contains 541 municipalities. The 1787 census details statistics for
554 municipal divisions. I used the Instituto Nacional de Estadística�s database on
municipality boundary changes since 1842 and a variety of other sources to consol-
36
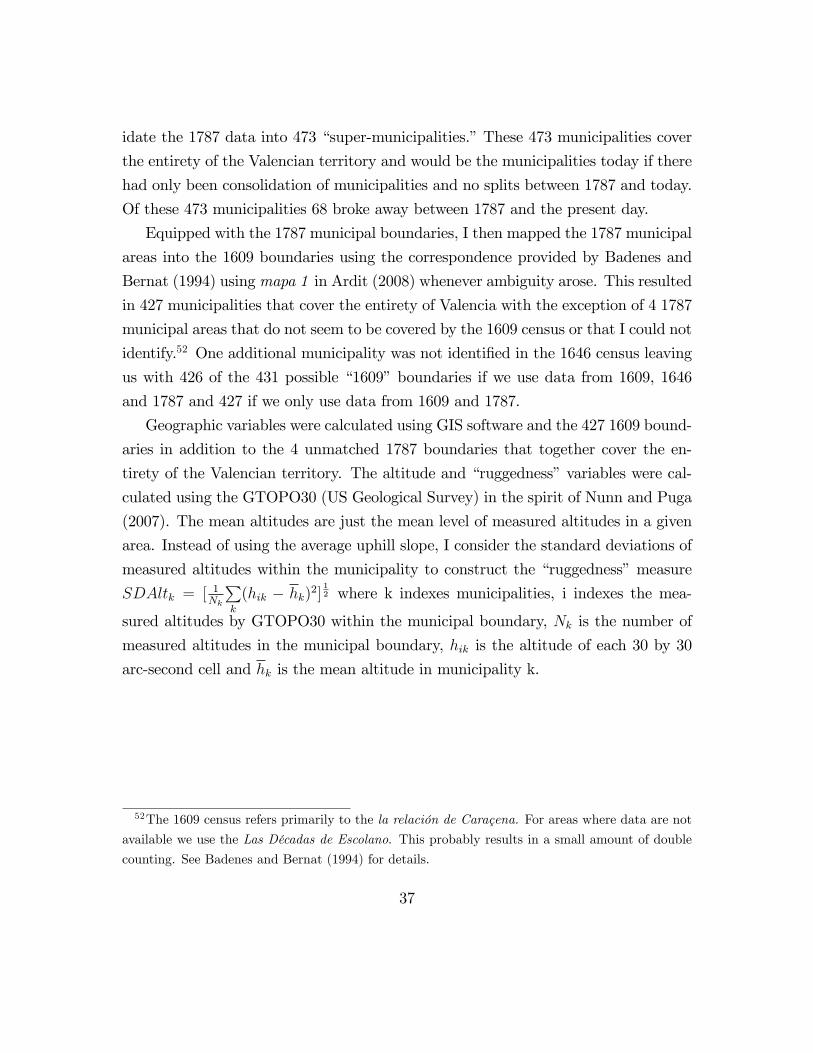
idate the 1787 data into 473 �super-municipalities.�These 473 municipalities cover
the entirety of the Valencian territory and would be the municipalities today if there
had only been consolidation of municipalities and no splits between 1787 and today.
Of these 473 municipalities 68 broke away between 1787 and the present day.
Equipped with the 1787 municipal boundaries, I then mapped the 1787 municipal
areas into the 1609 boundaries using the correspondence provided by Badenes and
Bernat (1994) usingmapa 1 in Ardit (2008) whenever ambiguity arose. This resulted
in 427 municipalities that cover the entirety of Valencia with the exception of 4 1787
municipal areas that do not seem to be covered by the 1609 census or that I could not
identify.52 One additional municipality was not identi�ed in the 1646 census leaving
us with 426 of the 431 possible �1609�boundaries if we use data from 1609, 1646
and 1787 and 427 if we only use data from 1609 and 1787.
Geographic variables were calculated using GIS software and the 427 1609 bound-
aries in addition to the 4 unmatched 1787 boundaries that together cover the en-
tirety of the Valencian territory. The altitude and �ruggedness�variables were cal-
culated using the GTOPO30 (US Geological Survey) in the spirit of Nunn and Puga
(2007). The mean altitudes are just the mean level of measured altitudes in a given
area. Instead of using the average uphill slope, I consider the standard deviations of
measured altitudes within the municipality to construct the �ruggedness�measure
SDAltk = [ 1Nk
Pk
(hik � hk)2]
12 where k indexes municipalities, i indexes the mea-
sured altitudes by GTOPO30 within the municipal boundary, Nk is the number of
measured altitudes in the municipal boundary, hik is the altitude of each 30 by 30
arc-second cell and hk is the mean altitude in municipality k.
52The 1609 census refers primarily to the la relación de Caraçena. For areas where data are not
available we use the Las Décadas de Escolano. This probably results in a small amount of double
counting. See Badenes and Bernat (1994) for details.
37
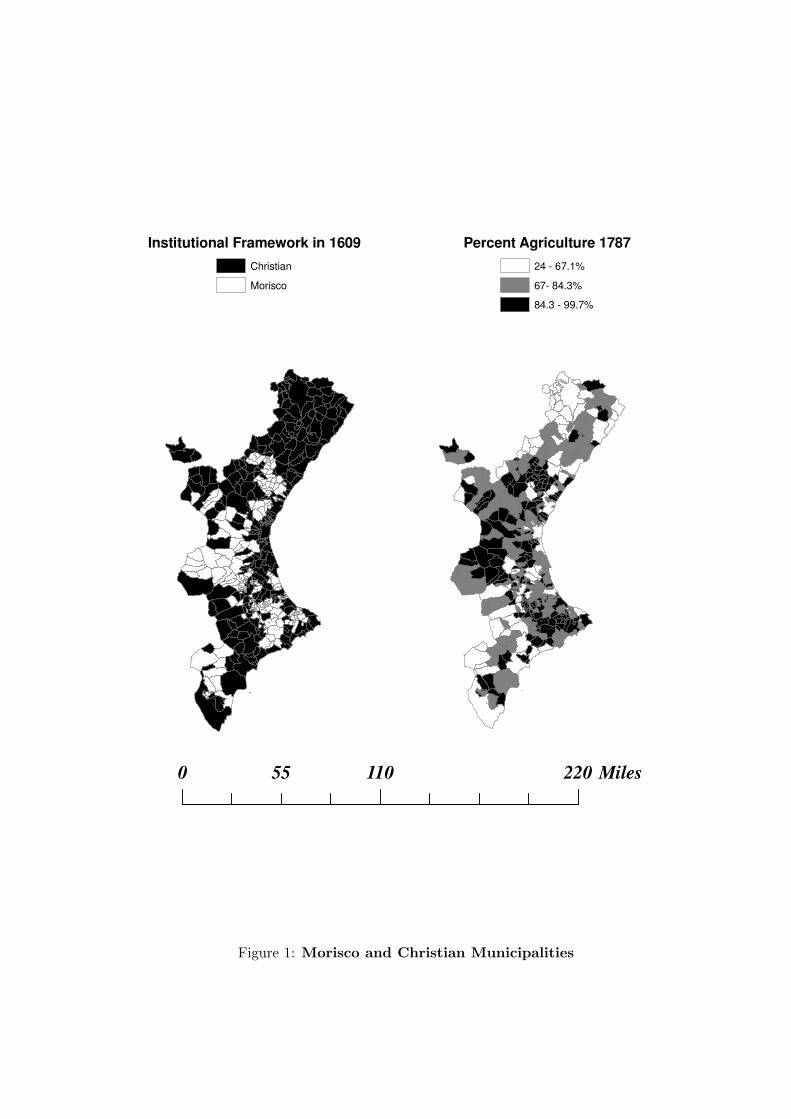
Institutional Framework in 1609
Christian
Morisco
Percent Agriculture 1787
24 - 67.1%
67- 84.3%
84.3 - 99.7%
0 110 22055 Miles
Figure 1: Morisco and Christian Municipalities
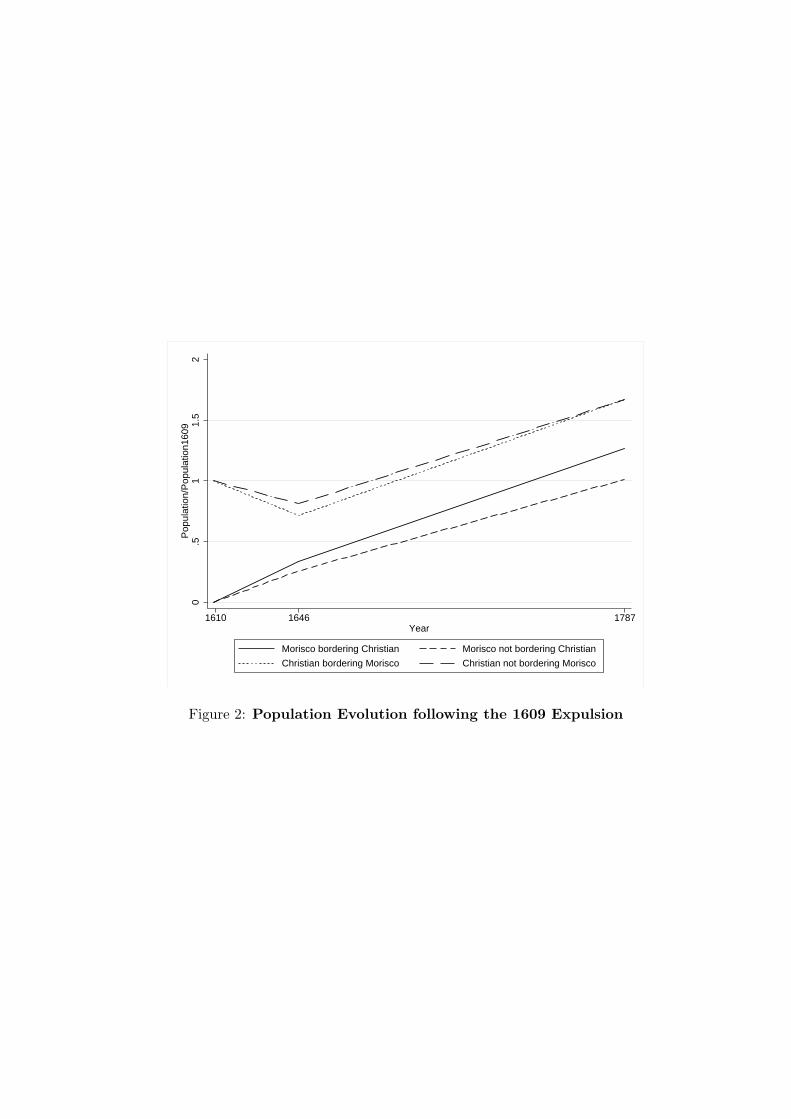
0.5
11.
52
Pop
ulat
ion/
Pop
ulat
ion1
609
1610 1646 1787Year
Morisco bordering Christian Morisco not bordering Christian
Christian bordering Morisco Christian not bordering Morisco
Figure 2: Population Evolution following the 1609 Expulsion
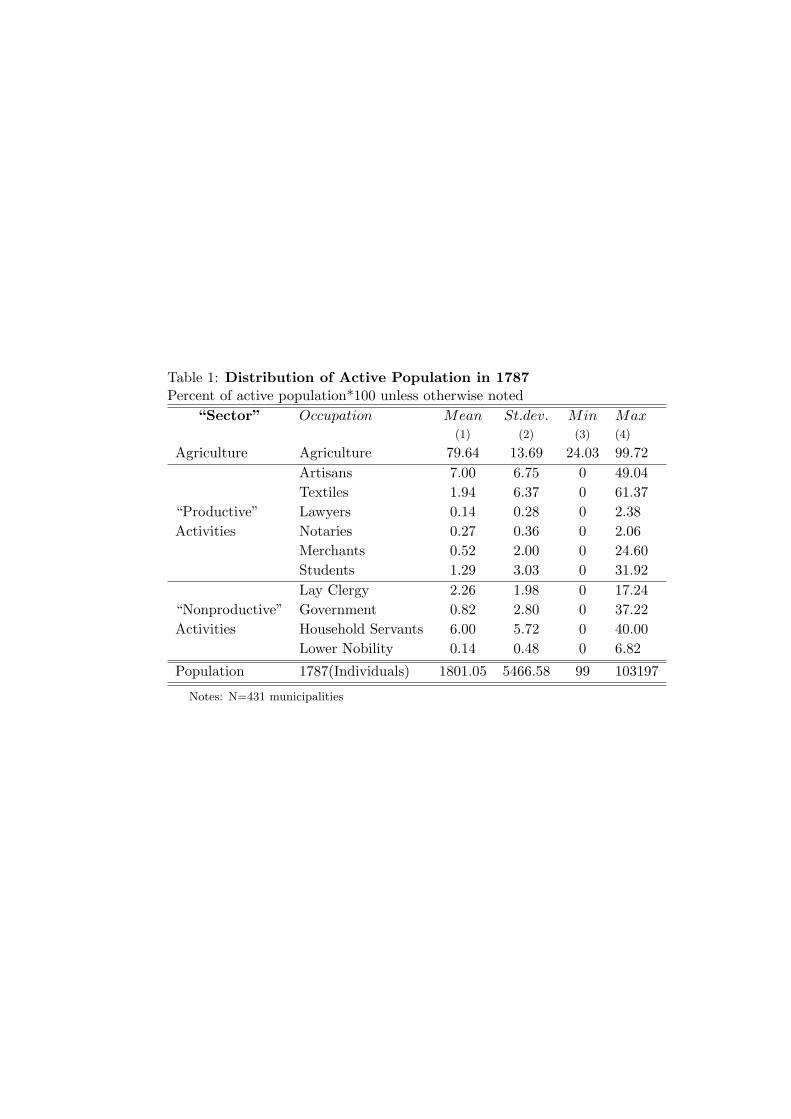
Table 1: Distribution of Active Population in 1787Percent of active population*100 unless otherwise noted
“Sector” Occupation Mean St.dev. Min Max(1) (2) (3) (4)
Agriculture Agriculture 79.64 13.69 24.03 99.72Artisans 7.00 6.75 0 49.04Textiles 1.94 6.37 0 61.37
“Productive” Lawyers 0.14 0.28 0 2.38Activities Notaries 0.27 0.36 0 2.06
Merchants 0.52 2.00 0 24.60Students 1.29 3.03 0 31.92Lay Clergy 2.26 1.98 0 17.24
“Nonproductive” Government 0.82 2.80 0 37.22Activities Household Servants 6.00 5.72 0 40.00
Lower Nobility 0.14 0.48 0 6.82
Population 1787(Individuals) 1801.05 5466.58 99 103197
Notes: N=431 municipalities
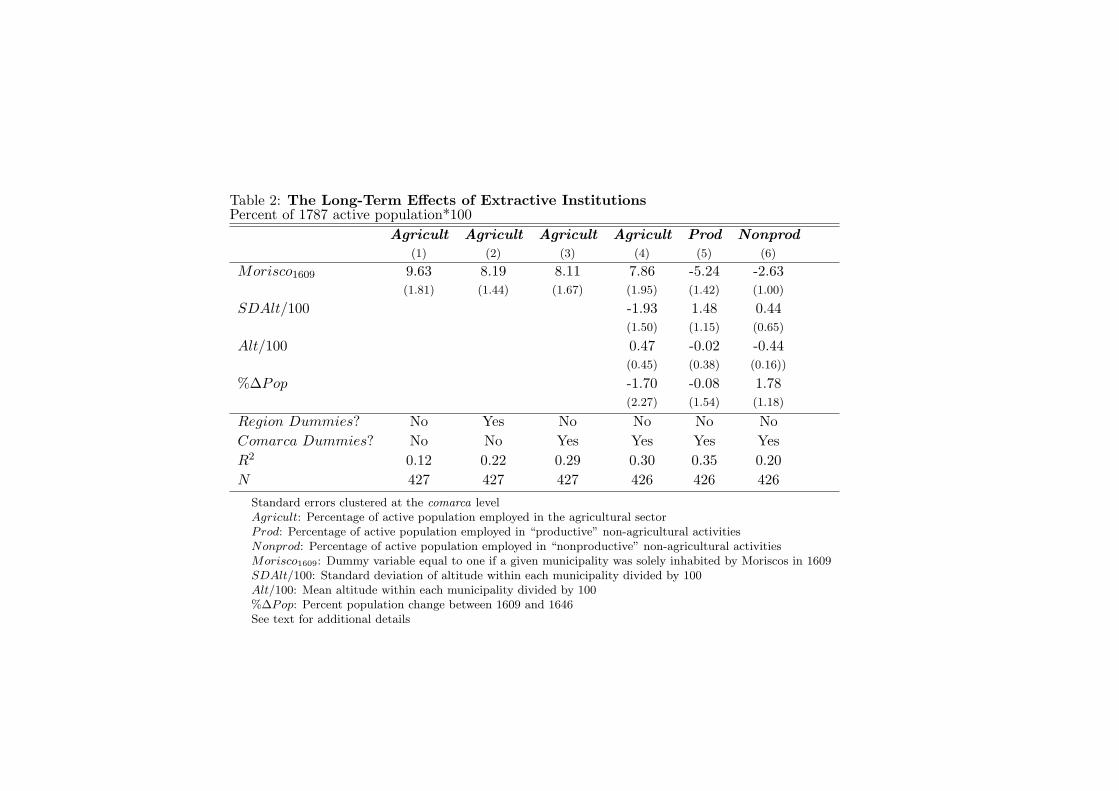
Table 2: The Long-Term Effects of Extractive InstitutionsPercent of 1787 active population*100
Agricult Agricult Agricult Agricult Prod Nonprod(1) (2) (3) (4) (5) (6)
Morisco1609 9.63 8.19 8.11 7.86 -5.24 -2.63(1.81) (1.44) (1.67) (1.95) (1.42) (1.00)
SDAlt/100 -1.93 1.48 0.44(1.50) (1.15) (0.65)
Alt/100 0.47 -0.02 -0.44(0.45) (0.38) (0.16))
%∆Pop -1.70 -0.08 1.78(2.27) (1.54) (1.18)
Region Dummies? No Yes No No No NoComarca Dummies? No No Yes Yes Yes YesR2 0.12 0.22 0.29 0.30 0.35 0.20N 427 427 427 426 426 426
Standard errors clustered at the comarca levelAgricult: Percentage of active population employed in the agricultural sectorProd: Percentage of active population employed in “productive” non-agricultural activitiesNonprod: Percentage of active population employed in “nonproductive” non-agricultural activitiesMorisco1609: Dummy variable equal to one if a given municipality was solely inhabited by Moriscos in 1609SDAlt/100: Standard deviation of altitude within each municipality divided by 100Alt/100: Mean altitude within each municipality divided by 100%∆Pop: Percent population change between 1609 and 1646See text for additional details
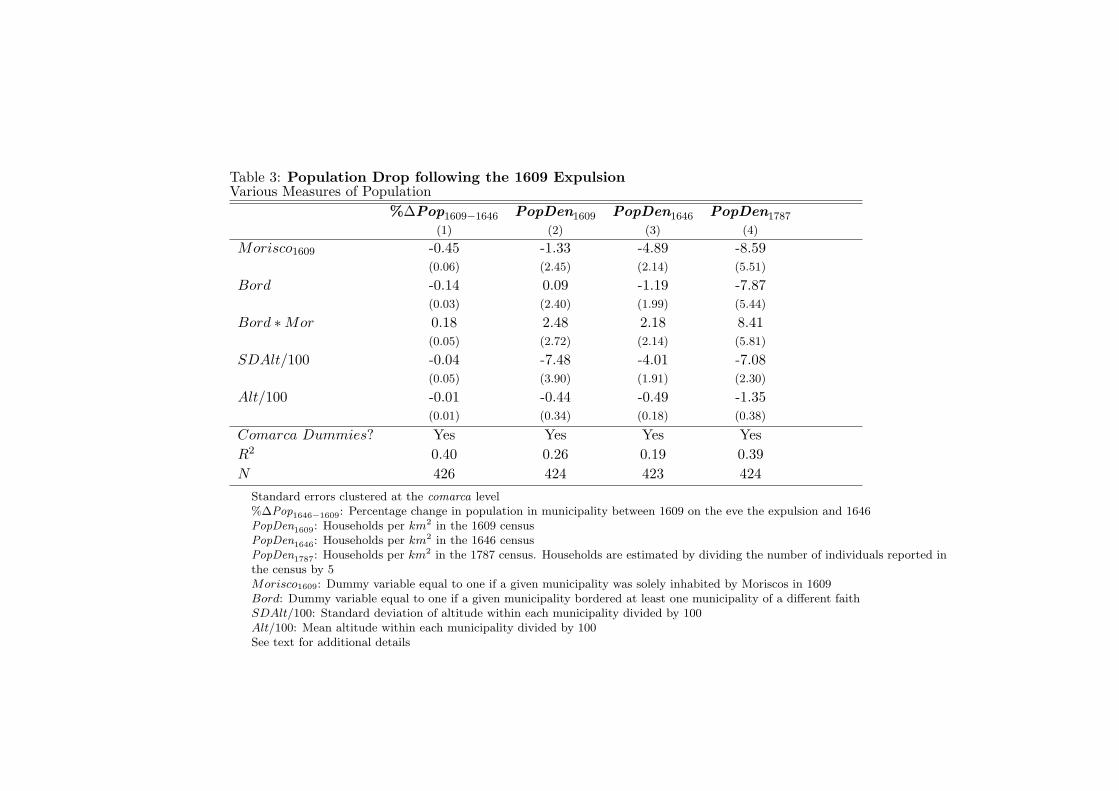
Table 3: Population Drop following the 1609 ExpulsionVarious Measures of Population
%∆Pop1609−1646 PopDen1609 PopDen1646 PopDen1787
(1) (2) (3) (4)
Morisco1609 -0.45 -1.33 -4.89 -8.59(0.06) (2.45) (2.14) (5.51)
Bord -0.14 0.09 -1.19 -7.87(0.03) (2.40) (1.99) (5.44)
Bord ∗Mor 0.18 2.48 2.18 8.41(0.05) (2.72) (2.14) (5.81)
SDAlt/100 -0.04 -7.48 -4.01 -7.08(0.05) (3.90) (1.91) (2.30)
Alt/100 -0.01 -0.44 -0.49 -1.35(0.01) (0.34) (0.18) (0.38)
Comarca Dummies? Yes Yes Yes YesR2 0.40 0.26 0.19 0.39N 426 424 423 424
Standard errors clustered at the comarca level%∆Pop1646−1609: Percentage change in population in municipality between 1609 on the eve the expulsion and 1646PopDen1609: Households per km2 in the 1609 censusPopDen1646: Households per km2 in the 1646 censusPopDen1787: Households per km2 in the 1787 census. Households are estimated by dividing the number of individuals reported inthe census by 5Morisco1609: Dummy variable equal to one if a given municipality was solely inhabited by Moriscos in 1609Bord: Dummy variable equal to one if a given municipality bordered at least one municipality of a different faithSDAlt/100: Standard deviation of altitude within each municipality divided by 100Alt/100: Mean altitude within each municipality divided by 100See text for additional details
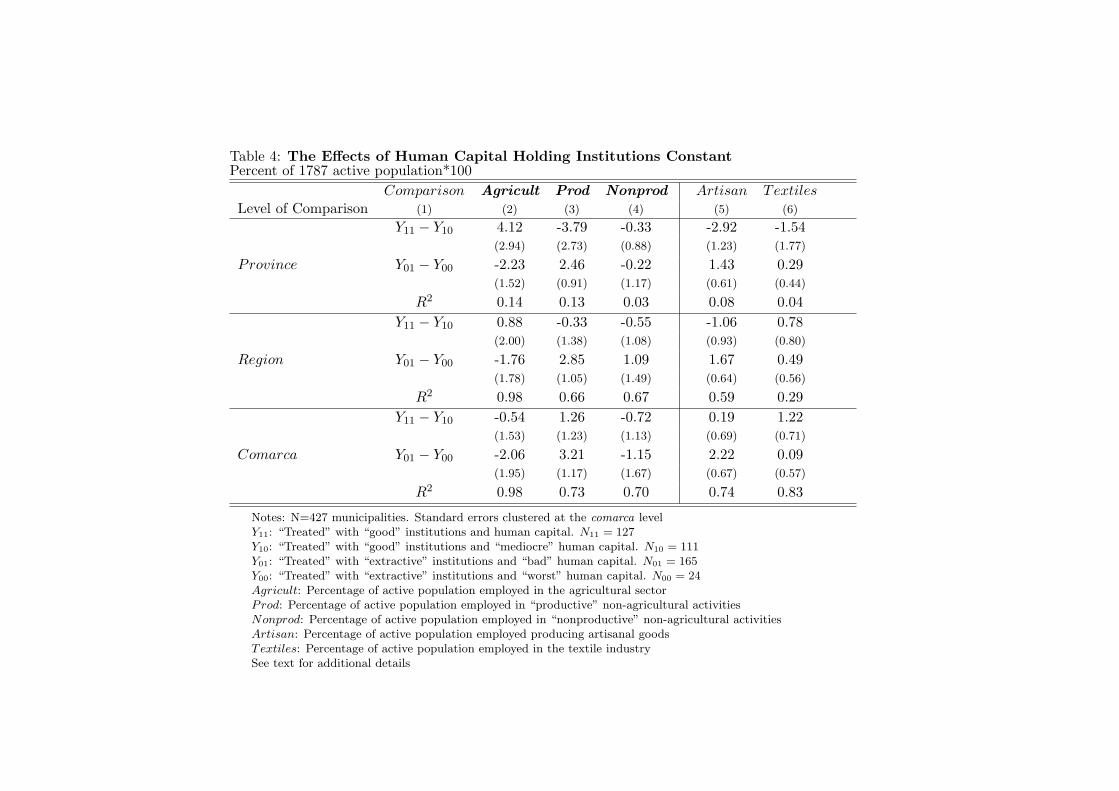
Table 4: The Effects of Human Capital Holding Institutions ConstantPercent of 1787 active population*100
Comparison Agricult Prod Nonprod Artisan TextilesLevel of Comparison (1) (2) (3) (4) (5) (6)
Y11 − Y10 4.12 -3.79 -0.33 -2.92 -1.54(2.94) (2.73) (0.88) (1.23) (1.77)
Province Y01 − Y00 -2.23 2.46 -0.22 1.43 0.29(1.52) (0.91) (1.17) (0.61) (0.44)
R2 0.14 0.13 0.03 0.08 0.04Y11 − Y10 0.88 -0.33 -0.55 -1.06 0.78
(2.00) (1.38) (1.08) (0.93) (0.80)
Region Y01 − Y00 -1.76 2.85 1.09 1.67 0.49(1.78) (1.05) (1.49) (0.64) (0.56)
R2 0.98 0.66 0.67 0.59 0.29Y11 − Y10 -0.54 1.26 -0.72 0.19 1.22
(1.53) (1.23) (1.13) (0.69) (0.71)
Comarca Y01 − Y00 -2.06 3.21 -1.15 2.22 0.09(1.95) (1.17) (1.67) (0.67) (0.57)
R2 0.98 0.73 0.70 0.74 0.83
Notes: N=427 municipalities. Standard errors clustered at the comarca levelY11: “Treated” with “good” institutions and human capital. N11 = 127Y10: “Treated” with “good” institutions and “mediocre” human capital. N10 = 111Y01: “Treated” with “extractive” institutions and “bad” human capital. N01 = 165Y00: “Treated” with “extractive” institutions and “worst” human capital. N00 = 24Agricult: Percentage of active population employed in the agricultural sectorProd: Percentage of active population employed in “productive” non-agricultural activitiesNonprod: Percentage of active population employed in “nonproductive” non-agricultural activitiesArtisan: Percentage of active population employed producing artisanal goodsTextiles: Percentage of active population employed in the textile industrySee text for additional details
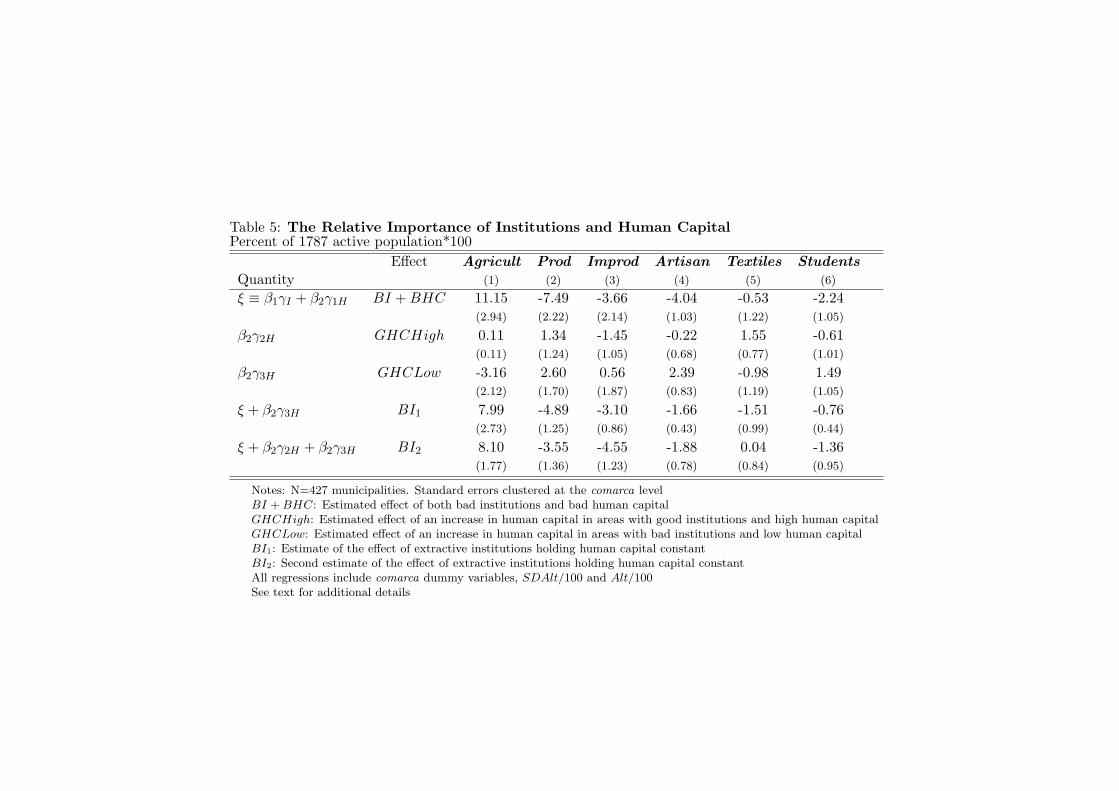
Table 5: The Relative Importance of Institutions and Human CapitalPercent of 1787 active population*100
Effect Agricult Prod Improd Artisan Textiles StudentsQuantity (1) (2) (3) (4) (5) (6)
ξ ≡ β1γI + β2γ1H BI + BHC 11.15 -7.49 -3.66 -4.04 -0.53 -2.24(2.94) (2.22) (2.14) (1.03) (1.22) (1.05)
β2γ2H GHCHigh 0.11 1.34 -1.45 -0.22 1.55 -0.61(0.11) (1.24) (1.05) (0.68) (0.77) (1.01)
β2γ3H GHCLow -3.16 2.60 0.56 2.39 -0.98 1.49(2.12) (1.70) (1.87) (0.83) (1.19) (1.05)
ξ + β2γ3H BI1 7.99 -4.89 -3.10 -1.66 -1.51 -0.76(2.73) (1.25) (0.86) (0.43) (0.99) (0.44)
ξ + β2γ2H + β2γ3H BI2 8.10 -3.55 -4.55 -1.88 0.04 -1.36(1.77) (1.36) (1.23) (0.78) (0.84) (0.95)
Notes: N=427 municipalities. Standard errors clustered at the comarca levelBI + BHC: Estimated effect of both bad institutions and bad human capitalGHCHigh: Estimated effect of an increase in human capital in areas with good institutions and high human capitalGHCLow: Estimated effect of an increase in human capital in areas with bad institutions and low human capitalBI1: Estimate of the effect of extractive institutions holding human capital constantBI2: Second estimate of the effect of extractive institutions holding human capital constantAll regressions include comarca dummy variables, SDAlt/100 and Alt/100See text for additional details
Recommended