Escaping the Under-Reform Trap
ANDERS ÅSLUND, PETER BOONE, and SIMON JOHNSON*
Most former Soviet republics have fallen into an economic and political under-reform trap. An intrusive state imposes high tax rates and drives entrepreneursinto the unofficial economy, which further aggravates the pressure on official busi-nessmen. Tax revenues and public goods dwindle, further reducing incentives toregister business activity. This economic under-reform trap has a political coun-terpart. Remarkably, Communist parties remain popular and opposed to estab-lishing the rule of law precisely in those places where they were able to delay andderail reform. No electoral backlash prompts the reforms necessary to leave theunder-reform trap. The best way out of the trap in countries such as Russia andUkraine is increased economic and political competition among the elite. [JELE65, H41, K42, P52]
Parts of East-Central Europe and most of the former Soviet Union have falleninto an economic and political under-reform trap. Managers hide their firms’
activities underground in order to escape regulation and reduce the bribes theyhave to pay. High levels of underground activity keep tax revenues low, whichmeans the government cannot afford to provide public goods, such as law andorder, thus further lowering the incentives for entrepreneurs to enter the officialeconomy. These economies are caught in a trap: as few pay taxes, the tax burdenupon those who do becomes unbearable, inducing entrepreneurs to stay under-ground even though this keeps their economic efficiency low and prevents growth.
88
IMF Staff PapersVol. 48, Special Issue© 2001 International Monetary Fund
MVPY
=
s
t
−+1
PP
S=
*
PV
QX
t
t
t+
()
+
+1
yp+ (β
1+( )i
S
*
L Y i( ), *
Y SPP
,
ε+ >*
*Anders Åslund is Senior Associate at the Carnegie Endowment for International Peace inWashington, D.C. Peter Boone is Director of Research at Brunswick UBS Warburg in Moscow, Russia.Simon Johnson is Associate Professor in the Sloan School of Management at MIT. Simon Johnson thanksthe MIT Entrepreneurship Center for support. Victoria Levin has kindly provided research assistance forthis article.
At the same time, senior officials and powerful private individuals live wellthrough corrupt deals and sharing rents.
This economic under-reform trap has also an important political dimension.Remarkably, there is little evidence of an electoral backlash against the peoplewho led countries into the under-reform trap. Countries that have not had muchreform tend to have little governmental change, quite strong Communist parties,and little impetus for more reform. Conversely, however, countries that manage toreform find that the political support for reform subsequently strengthens.
Until recently, these problems were perceived as temporary matters of transi-tion, but it is now clear that many former Soviet bloc countries have becometrapped in a rent-seeking equilibrium. Slow and ineffectual reform created theopportunity for corrupt bureaucrats and politicians to become entrenched andextract bribes from firms. High inflation offered huge temporary rents, and thelonger it lasted the richer the rent seekers became. Slow privatization facilitatedextortion by government officials. By the end of 2000 it was possible for aneconomy to be stabilized, widely privatized, and liberalized, yet remain trapped bycorruption and a large underground economy. Most former Soviet republicsappear trapped in this way.
Can a country break out once it is deeply in the trap? In this paper, the possi-bilities for two countries—Ukraine and Russia—are compared, and a two-partsolution is offered. Economically, rents need to dwindle through competition andnew entry, while political power needs to be dissipated as a consequence ofcompetition among the elite. The policy goal should be to foster such competition.It seems more difficult for Ukraine than for Russia to escape from the trap, buteven Ukraine has some reason to hope.
This paper updates findings first presented in Åslund, Boone, and Johnson(1996). The economics of the under-reform trap were studied in Johnson,Kaufmann, and Shleifer (1997). Here we explain the politics of the trap, both interms of electoral outcomes and the pattern of competition among the elite.
I. The Economic Under-Reform Trap
Post-communist market economies fall into two main groups: those withsustained recovery following a relatively radical transformation, and those stuckwithout sustained growth because of gradual reform. In 1999, measured real GDPin East-Central Europe was 5 percent lower than in 1989, but in theCommonwealth of Independent States (the former Soviet Union without theBaltics), real GDP was just 56 percent of its 1989 level (ECE, 2000, p. 225).
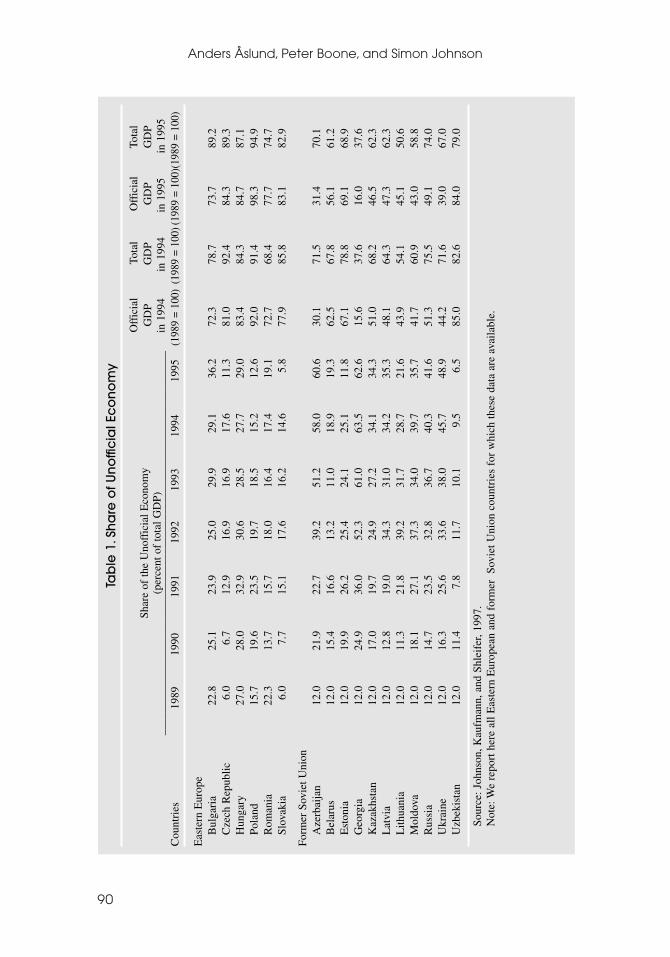
While performance has diverged dramatically, measured GDP exaggerates thediscrepancy, because the unofficial economy has expanded much more in theformer Soviet Union than in east-central Europe. Table 1 shows the results of esti-mating the share of the unofficial economy in total GDP through 1995 using theelectricity consumption-based methodology presented in Johnson, Kaufmann, andShleifer (1997). Two divergent development paths are evident. The rather liberalEast-Central European countries started with a relatively large unofficial economy,which peaked in 1992, and then declined moderately. In contrast, the unofficial
ESCAPING THE UNDER-REFORM TRAP
89
Anders Åslund, Peter Boone, and Simon Johnson
90
Tab
le 1
.Sh
are
of U
no
ffic
ial E
co
no
my
Shar
e of
the
Uno
ffic
ial E
cono
my
Off
icia
lTo
tal
Off
icia
lTo
tal
(per
cent
of
tota
l GD
P)G
DP
GD
PG
DP
GD
P__
____
____
____
____
____
____
____
____
____
____
____
____
____
____
____
____
__in
199
4in
199
4in
199
5in
199
5C
ount
ries
1989
1990
1991
1992
1993
1994
1995
(198
9 =
100)
(198
9 =
100)
(198
9 =
100)
(198
9 =
100)
Eas
tern
Eur
ope
Bul
gari
a22
.825
.123
.925
.029
.929
.136
.272
.378
.773
.789
.2C
zech
Rep
ublic
6.0
6.7
12.9
16.9
16.9
17.6
11.3
81.0
92.4
84.3
89.3
Hun
gary
27.0
28.0
32.9
30.6
28.5
27.7
29.0
83.4
84.3
84.7
87.1
Pola
nd15
.719
.623
.519
.718
.515
.212
.692
.091
.498
.394
.9R
oman
ia22
.313
.715
.718
.016
.417
.419
.172
.768
.477
.774
.7Sl
ovak
ia6.
07.
715
.117
.616
.214
.65.
877
.985
.883
.182
.9
Form
er S
ovie
t Uni
onA
zerb
aija
n12
.021
.922
.739
.251
.258
.060
.630
.171
.531
.470
.1B
elar
us12
.015
.416
.613
.211
.018
.919
.362
.567
.856
.161
.2E
ston
ia12
.019
.926
.225
.424
.125
.111
.867
.178
.869
.168
.9G
eorg
ia12
.024
.936
.052
.361
.063
.562
.615
.637
.616
.037
.6K
azak
hsta
n12
.017
.019
.724
.927
.234
.134
.351
.068
.246
.562
.3L
atvi
a12
.012
.819
.034
.331
.034
.235
.348
.164
.347
.362
.3L
ithua
nia
12.0
11.3
21.8
39.2
31.7
28.7
21.6
43.9
54.1
45.1
50.6
Mol
dova
12.0
18.1
27.1
37.3
34.0
39.7
35.7
41.7
60.9
43.0
58.8
Rus
sia
12.0
14.7
23.5
32.8
36.7
40.3
41.6
51.3
75.5
49.1
74.0
Ukr
aine
12.0
16.3
25.6
33.6
38.0
45.7
48.9
44.2
71.6
39.0
67.0
Uzb
ekis
tan
12.0
11.4
7.8
11.7
10.1
9.5
6.5
85.0
82.6
84.0
79.0
Sour
ce: J
ohns
on, K
aufm
ann,
and
Shl
eife
r, 19
97.
Not
e: W
e re
port
her
e al
l Eas
tern
Eur
opea
n an
d fo
rmer
Sov
iet U
nion
cou
ntri
es f
or w
hich
thes
e da
ta a
re a
vaila
ble.
share in former Soviet countries was initially small and rose sharply until 1994before flattening out. Strikingly, while the Polish unofficial economy sharedeclined from 1989 to 1995 by 3 percent of GDP, its share in Russia and Ukrainesurged by 30 percent and 37 percent of GDP, respectively. More recent work(through 1997) shows the same pattern has continued—the unofficial economy istypically 2–3 times larger, as a percent of GDP, in the former Soviet Union than ineast-central Europe (Eilat and Zinnes, 2000).
Adjusting for the unofficial economy, the contraction in real GDP has beenmuch lower than commonly supposed. In Russia, for example, output probablyfell no more than 20 percent during transition, but qualitatively, the large unoffi-cial economy is an essential part of the under-reform trap. A large unofficialeconomy means that few pay taxes, inciting governments to raise tax rates forthose few while providing minimal public goods, thus inducing entrepreneurs toopt for the underground economy in a vicious circle.
Conversely, a marked difference has developed especially between CentralEurope and CIS countries in terms of general government spending as a percentof both official and total GDP. In Central Europe (Poland, the Czech Republic,Slovakia, and Hungary), general government spending declined insignificantlyfrom 51 percent of GDP in 1989 to 46 percent of GDP in 1999 (Tanzi, 1999). Bycontrast, general government spending in the CIS fell on average from 46 percentof official GDP in 1992 to 27 percent in 1999 (Tanzi, 1999).
The low level of tax collection is no reflection of liberalism in most CIS coun-tries. While their level of actual tax collection varies greatly, the tax burden onthose who actually pay taxes is much higher than in Central Europe (Johnson,McMillan, and Woodruff, 2000b). In fact, either high state revenues or high defacto tax rates have characterized post-communist countries.
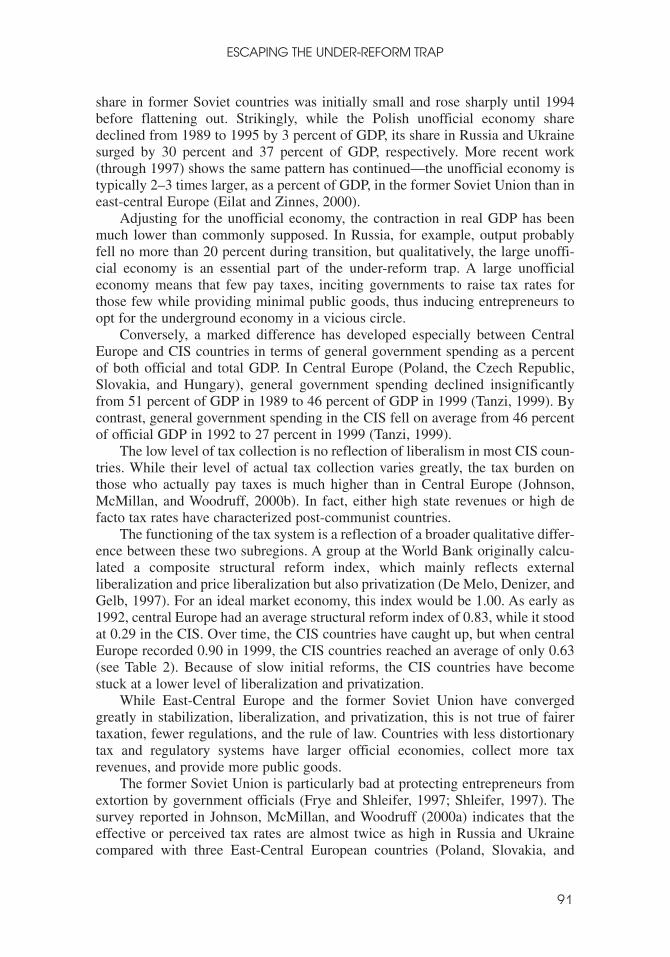
The functioning of the tax system is a reflection of a broader qualitative differ-ence between these two subregions. A group at the World Bank originally calcu-lated a composite structural reform index, which mainly reflects externalliberalization and price liberalization but also privatization (De Melo, Denizer, andGelb, 1997). For an ideal market economy, this index would be 1.00. As early as1992, central Europe had an average structural reform index of 0.83, while it stoodat 0.29 in the CIS. Over time, the CIS countries have caught up, but when centralEurope recorded 0.90 in 1999, the CIS countries reached an average of only 0.63(see Table 2). Because of slow initial reforms, the CIS countries have becomestuck at a lower level of liberalization and privatization.
While East-Central Europe and the former Soviet Union have convergedgreatly in stabilization, liberalization, and privatization, this is not true of fairertaxation, fewer regulations, and the rule of law. Countries with less distortionarytax and regulatory systems have larger official economies, collect more taxrevenues, and provide more public goods.
The former Soviet Union is particularly bad at protecting entrepreneurs fromextortion by government officials (Frye and Shleifer, 1997; Shleifer, 1997). Thesurvey reported in Johnson, McMillan, and Woodruff (2000a) indicates that theeffective or perceived tax rates are almost twice as high in Russia and Ukrainecompared with three East-Central European countries (Poland, Slovakia, and
ESCAPING THE UNDER-REFORM TRAP
91
Romania). The evidence suggests that Central Europe, in particular, has madesubstantial progress towards reforming its institutions, while most of the formerSoviet Union lags far behind, being caught in an under-reform trap, with higheffective taxation and intrusive regulation.
The most powerful entrepreneurs respond with various forms of “statecapture” (Hellman, Jones, and Kaufmann, 2000), effectively privatizing publicgoods such as taxation and regulation to their own benefit, driving out competitors
Anders Åslund, Peter Boone, and Simon Johnson
92
Table 2. Structural Reform Index, 1990–99
1990 1991 1992 1993 1994 1995 1996 1997 1998 1999
Central EuropePoland 0.68 0.72 0.82 0.82 0.83 0.79 0.79 0.81 0.86 0.86Czech Republic 0.16 0.79 0.86 0.90 0.88 0.82 0.82 0.82 0.90 0.90Slovakia 0.16 0.79 0.86 0.83 0.83 0.79 0.79 0.77 0.90 0.90Hungary 0.57 0.74 0.78 0.82 0.83 0.82 0.82 0.87 0.93 0.93
Southeast EuropeRomania 0.22 0.36 0.45 0.58 0.67 0.65 0.64 0.66 0.76 0.82Bulgaria 0.19 0.62 0.86 0.66 0.63 0.61 0.57 0.67 0.79 0.79
BalticsEstonia 0.20 0.32 0.64 0.81 0.83 0.77 0.78 0.82 0.90 0.93Latvia 0.13 0.29 0.51 0.67 0.71 0.67 0.74 0.74 0.86 0.86Lithuania 0.13 0.33 0.55 0.78 0.79 0.71 0.74 0.74 0.82 0.82
CISRussia 0.04 0.10 0.49 0.59 0.67 0.64 0.71 0.72 0.64 0.64Belarus 0.04 0.10 0.20 0.33 0.42 0.50 0.44 0.37 0.37 0.37Ukraine 0.04 0.10 0.23 0.13 0.33 0.54 0.57 0.59 0.65 0.65Moldova 0.04 0.10 0.38 0.51 0.54 0.64 0.64 0.64 0.76 0.76Armenia 0.04 0.13 0.39 0.42 0.46 0.54 0.61 0.61 0.76 0.76Azerbaijan 0.04 0.04 0.25 0.31 0.33 0.40 0.44 0.51 0.61 0.61Georgia 0.04 0.22 0.32 0.35 0.33 0.50 0.61 0.66 0.79 0.79Kazakhstan 0.04 0.14 0.35 0.35 0.42 0.50 0.64 0.66 0.79 0.72Kyrgyzstan 0.04 0.04 0.33 0.60 0.71 0.71 0.67 0.70 0.82 0.79Tajikistan 0.04 0.11 0.20 0.26 0.42 0.40 0.40 0.39 0.55 0.58Turkmenistan 0.04 0.04 0.13 0.16 0.29 0.27 0.27 0.36 0.36 0.36Uzbekistan 0.04 0.04 0.26 0.30 0.50 0.57 0.57 0.54 0.57 0.50
Sources: De Melo, Denizer, and Gelb (1997); Havrylyshyn and Wolf (1999), p. 34; authors’ calcu-lations from EBRD (1998), p. 26, and EBRD (1999), p. 24.
Notes: This index was originally established by De Melo, Denizer, and Gelb (1997), with WorldBank assessments for 1990–94. They also indicated how their assessments were related to EBRDindices. Havrylyshyn and Wolf (1999) updated their series for 1995–97, while we have updated corre-spondingly for 1998 and 1999. The formula is straightforward. The first element is 0.3 times EBRD’sindices for price liberalization and competition policy. The second element is 0.3 times EBRD’s indexfor trade and foreign exchange liberalization. The third element is 0.4 times EBRD’s indices for large-scale privatization, small-scale privatization and banking reform. Each index is normalized to reach amaximum of 1. Thus, this index represents liberalization to 73 percent, while the rest is privatization.The weights have been arbitrarily selected, but actually it does not matter much what weights arechosen for the countries relative standing to one another, as the covariance is great.
who are trying to obey the law. Small entrepreneurs exit the official economy, andabout half of the economy is now underground. Russia, Ukraine, and most of theCIS have become true rent-seeking societies with a suboptimal equilibrium of loweconomic efficiency (for modeling of such an equilibrium, see Johnson,Kaufmann, and Shleifer, 1997).
II. The Electoral Under-Reform Trap
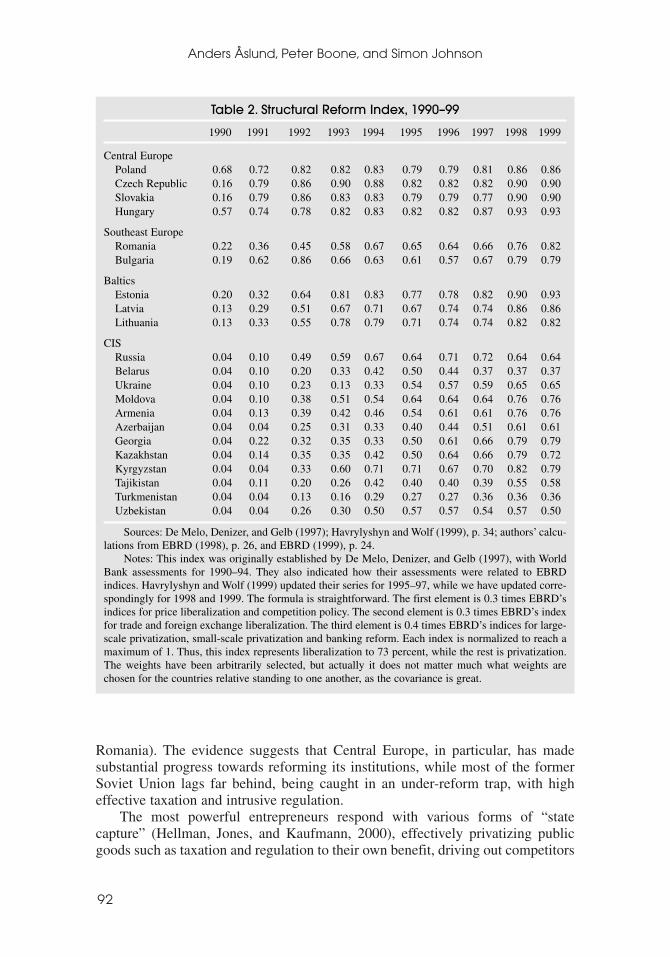
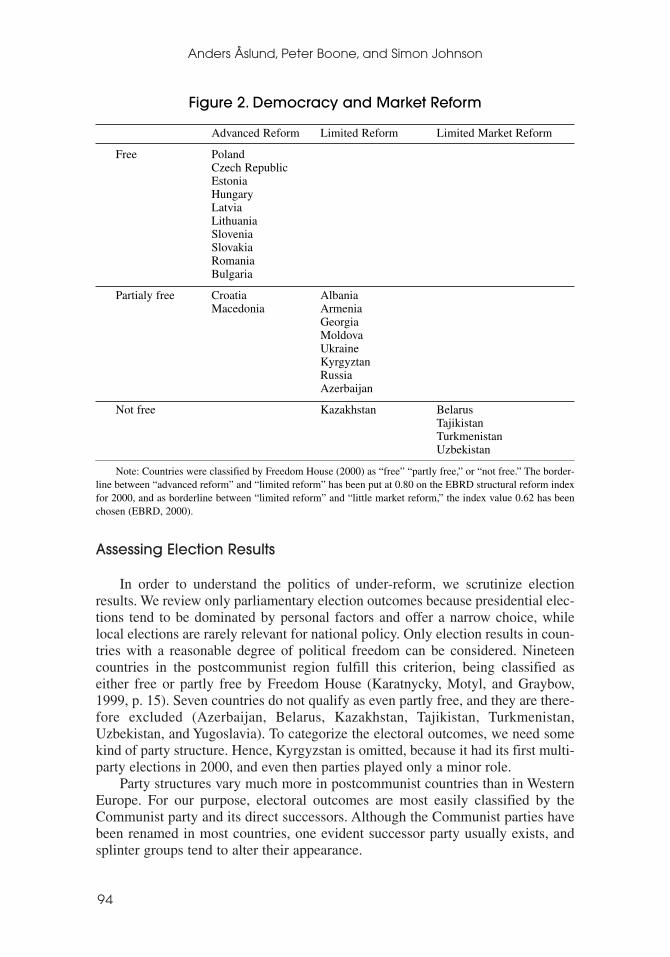
The economic under-reform trap has a political counterpart. In a democracy,it would be reasonable to presume that informed citizens would vote for politicalparties advocating policies that have brought about economic growth in othercountries. In general, among postcommunist countries, market reform and democ-racy are strongly positively related, as Figure 1 shows. Full democracies haveusually undertaken advanced market reform, while semi-democratic states haveusually pursued limited reform, and real dictatorships have done little reform, asis specified in Figure 2.
The countries of particular interest to us are those that have gotten stuck in anunder-reform trap—those in the middle of Figure 1: Ukraine, Moldova, Bulgaria,Romania, and Russia. These countries have underperformed in terms of economicreforms and economic growth (see Tables 1 and 2), and even so, the responsiblegovernments have repeatedly survived relatively free elections. How could thishave happened?
ESCAPING THE UNDER-REFORM TRAP
93
0 0.1 0.2 0.3 0.4 0.5
Turkmenistan
Belarus
Uzbekistan
Tajikistan
Kazakistan
Kyrgyz Republic
Albania
Croatia
Bulgaria
Georgia
Macedonia
Slovakia
PolandLithuaniaSlovenia
HungaryEstoniaCzech Rep.
Romania
Latvia
Moldova
Armenia
Ukraine
Azerbaijan
Russia
0.6 0.7 0.8 0.9 11
2
3
4
5
6
7
World Bank/EBRD Structural Reform Index (from 0 = low to 1 = high)
Free
dom
Hou
se P
oliti
cal a
nd C
ivil
Lib
ertie
s
(fro
m 1
= f
ree
to 7
= n
ot f
ree)
Figure 1. Democracy and Market Reform, 2000
Assessing Election Results
In order to understand the politics of under-reform, we scrutinize electionresults. We review only parliamentary election outcomes because presidential elec-tions tend to be dominated by personal factors and offer a narrow choice, whilelocal elections are rarely relevant for national policy. Only election results in coun-tries with a reasonable degree of political freedom can be considered. Nineteencountries in the postcommunist region fulfill this criterion, being classified aseither free or partly free by Freedom House (Karatnycky, Motyl, and Graybow,1999, p. 15). Seven countries do not qualify as even partly free, and they are there-fore excluded (Azerbaijan, Belarus, Kazakhstan, Tajikistan, Turkmenistan,Uzbekistan, and Yugoslavia). To categorize the electoral outcomes, we need somekind of party structure. Hence, Kyrgyzstan is omitted, because it had its first multi-party elections in 2000, and even then parties played only a minor role.
Party structures vary much more in postcommunist countries than in WesternEurope. For our purpose, electoral outcomes are most easily classified by theCommunist party and its direct successors. Although the Communist parties havebeen renamed in most countries, one evident successor party usually exists, andsplinter groups tend to alter their appearance.
Anders Åslund, Peter Boone, and Simon Johnson
94
Figure 2. Democracy and Market Reform
Advanced Reform Limited Reform Limited Market Reform
Free PolandCzech RepublicEstoniaHungaryLatviaLithuaniaSloveniaSlovakiaRomaniaBulgaria
Partialy free Croatia AlbaniaMacedonia Armenia
GeorgiaMoldovaUkraineKyrgyztanRussiaAzerbaijan
Not free Kazakhstan BelarusTajikistanTurkmenistanUzbekistan
Note: Countries were classified by Freedom House (2000) as “free” “partly free,” or “not free.” The border-line between “advanced reform” and “limited reform” has been put at 0.80 on the EBRD structural reform indexfor 2000, and as borderline between “limited reform” and “little market reform,” the index value 0.62 has beenchosen (EBRD, 2000).
Even Communist parties evolve. They can be divided roughly into two groups:those turning Social Democratic and those remaining Communist parties (some-times becoming nationalist). Among the democratic countries, the old Communistparties have become Social Democratic in Poland, Hungary, Slovakia, Lithuania,Slovenia, and Macedonia, while they remain hard line in the Czech Republic andthroughout the former Soviet Union. This dichotomy remained largely true at theend of 2000.
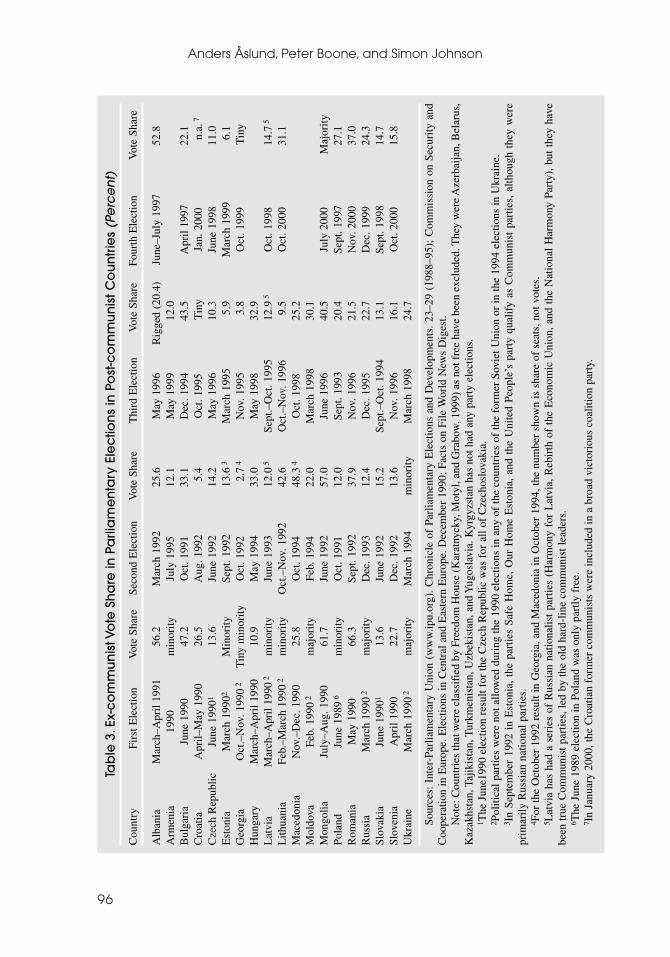
Parliamentary Election Results
All the democratic or semidemocratic countries in the region have undertakensome market economic reforms. If such reforms were truly unpopular, we wouldexpect Communist parties to gain popularity and even win electoral majorities.However, Table 3 shows that Communist parties have fared poorly regardless ofcountry and policy, with the exception of the marginal cases of Albania (where the“democratic” forces abandoned democracy in 1997) and Mongolia in 2000 (whichis disregarded here as a very special case). By 1997, no other Communist party inthe region had attained one-third of the votes cast in the most recent democraticelection, and the Communist party was not the senior partner in any government.The Communist parties in Italy, France, and Finland were actually larger duringthe Cold War. Apparently, the popular nostalgia for communism has been verylimited.
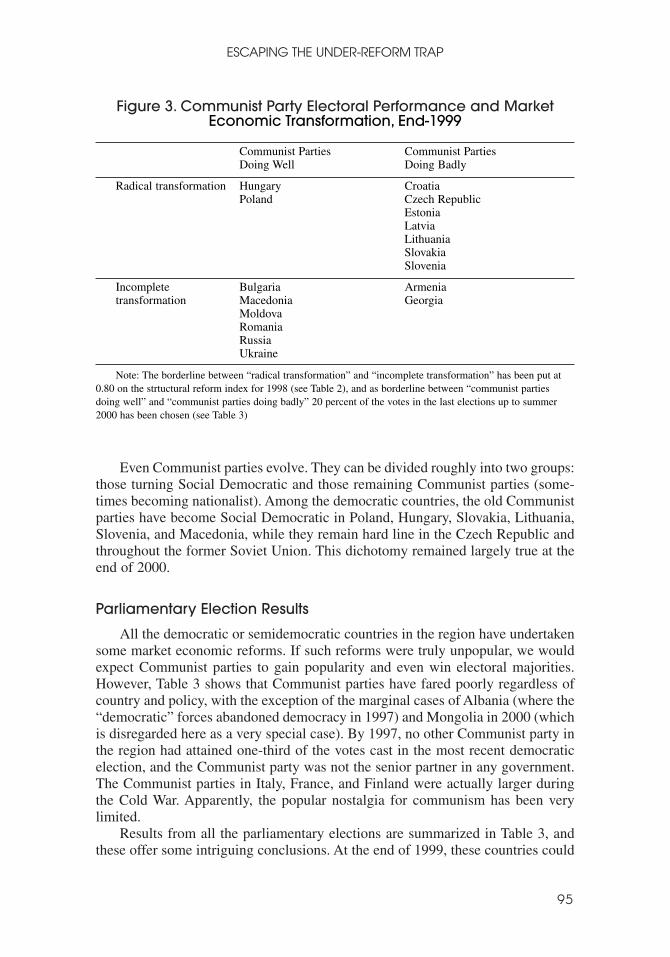
Results from all the parliamentary elections are summarized in Table 3, andthese offer some intriguing conclusions. At the end of 1999, these countries could
ESCAPING THE UNDER-REFORM TRAP
95
Figure 3. Communist Party Electoral Performance and MarketEconomic Transformation, End-1999
Communist Parties Communist Parties Doing Well Doing Badly
Radical transformation Hungary CroatiaPoland Czech Republic
EstoniaLatviaLithuaniaSlovakiaSlovenia
Incomplete Bulgaria Armeniatransformation Macedonia Georgia
MoldovaRomaniaRussiaUkraine
Note: The borderline between “radical transformation” and “incomplete transformation” has been put at0.80 on the strtuctural reform index for 1998 (see Table 2), and as borderline between “communist partiesdoing well” and “communist parties doing badly” 20 percent of the votes in the last elections up to summer2000 has been chosen (see Table 3)
Anders Åslund, Peter Boone, and Simon Johnson
96
Tab
le 3
.Ex-
co
mm
un
ist V
ote
Sh
are
in P
arli
am
en
tary
Ele
ctio
ns
in P
ost
-co
mm
un
ist C
ou
ntri
es
(Pe
rce
nt)
Cou
ntry
Firs
t Ele
ctio
nV
ote
Shar
eSe
cond
Ele
ctio
nV
ote
Shar
eT
hird
Ele
ctio
nV
ote
Shar
eFo
urth
Ele
ctio
nV
ote
Shar
e
Alb
ania
Mar
ch–A
pril
1991
56.2
Mar
ch 1
992
25.6
May
199
6R
igge
d (2
0.4)
June
–Jul
y 19
9752
.8A
rmen
ia19
90m
inor
ityJu
ly 1
995
12.1
May
199
912
.0B
ulga
ria
June
199
047
.2O
ct. 1
991
33.1
Dec
. 199
443
.5A
pril
1997
22.1
Cro
atia
Apr
il–M
ay 1
990
26.5
Aug
. 199
25.
4O
ct. 1
995
Tin
yJa
n. 2
000
n.a.
7
Cze
ch R
epub
licJu
ne 1
9901
13.6
Ju
ne 1
992
14.2
May
199
610
.3Ju
ne 1
998
11.0
Est
onia
Mar
ch 1
9902
Min
ority
Sept
. 199
213
.63
Mar
ch 1
995
5.9
Mar
ch 1
999
6.1
Geo
rgia
Oct
.–N
ov. 1
990
2T
iny
min
ority
Oct
. 199
22.
74
Nov
. 199
53.
8O
ct. 1
999
Tin
yH
unga
ryM
arch
–Apr
il 19
9010
.9M
ay 1
994
33.0
May
199
832
.9L
atvi
aM
arch
–Apr
il 19
902
min
ority
June
199
312
.05
Sept
.–O
ct. 1
995
12.9
5O
ct. 1
998
14.7
5
Lith
uani
aFe
b.–M
arch
199
02
min
ority
Oct
.–N
ov. 1
992
42.6
Oct
.–N
ov. 1
996
9.5
Oct
. 200
031
.1M
aced
onia
Nov
.–D
ec. 1
990
25.8
Oct
. 199
448
.34
Oct
. 199
825
.2M
oldo
vaFe
b. 1
990
2m
ajor
ityFe
b. 1
994
22.0
Mar
ch 1
998
30.1
Mon
golia
July
–Aug
. 199
061
.7Ju
ne 1
992
57.0
June
199
640
.5Ju
ly 2
000
Maj
ority
Pola
ndJu
ne 1
989
6m
inor
ityO
ct. 1
991
12.0
Sept
. 199
320
.4Se
pt. 1
997
27.1
Rom
ania
May
199
066
.3Se
pt. 1
992
37.9
Nov
. 199
621
.5N
ov. 2
000
37.0
Rus
sia
Mar
ch 1
990
2m
ajor
ityD
ec. 1
993
12.4
D
ec. 1
995
22.7
D
ec. 1
999
24.3
Slov
akia
June
199
0113
.6
June
199
2 15
.2Se
pt.–
Oct
. 199
413
.1Se
pt. 1
998
14.7
Slov
enia
Apr
il 19
9022
.7D
ec. 1
992
13.6
Nov
. 199
616
.1O
ct. 2
000
15.8
Ukr
aine
Mar
ch 1
990
2 m
ajor
ityM
arch
199
4m
inor
ityM
arch
199
824
.7
Sour
ces:
Int
er-P
arlia
men
tary
Uni
on (
ww
w.ip
u.or
g).
Chr
onic
le o
f Pa
rlia
men
tary
Ele
ctio
ns a
nd D
evel
opm
ents
. 23
–29
(198
8–95
); C
omm
issi
on o
n Se
curi
ty a
ndC
oope
ratio
n in
Eur
ope.
Ele
ctio
ns in
Cen
tral
and
Eas
tern
Eur
ope.
Dec
embe
r 19
90; F
acts
on
File
Wor
ld N
ews
Dig
est.
Not
e: C
ount
ries
that
wer
e cl
assi
fied
by
Free
dom
Hou
se (
Kar
atny
cky,
Mot
yl, a
nd G
rabo
w, 1
999)
as
not f
ree
have
bee
n ex
clud
ed. T
hey
wer
e A
zerb
aija
n, B
elar
us,
Kaz
akhs
tan,
Taj
ikis
tan,
Tur
kmen
ista
n, U
zbek
ista
n, a
nd Y
ugos
lavi
a. K
yrgy
zsta
n ha
s no
t had
any
par
ty e
lect
ions
.1 T
he J
une1
990
elec
tion
resu
lt fo
r th
e C
zech
Rep
ublic
was
for
all
of C
zech
oslo
vaki
a.2 P
oliti
cal p
artie
s w
ere
not a
llow
ed d
urin
g th
e 19
90 e
lect
ions
in a
ny o
f th
e co
untr
ies
of th
e fo
rmer
Sov
iet U
nion
or
in th
e 19
94 e
lect
ions
in U
krai
ne.
3 In
Sept
embe
r 19
92 i
n E
ston
ia,
the
part
ies
Safe
Hom
e, O
ur H
ome
Est
onia
, an
d th
e U
nite
d Pe
ople
’s p
arty
qua
lify
as C
omm
unis
t pa
rtie
s, a
lthou
gh t
hey
wer
epr
imar
ily R
ussi
an n
atio
nal p
artie
s.4 F
or th
e O
ctob
er 1
992
resu
lt in
Geo
rgia
, and
Mac
edon
ia in
Oct
ober
199
4, th
e nu
mbe
r sh
own
is s
hare
of
seat
s, n
ot v
otes
.5 L
atvi
a ha
s ha
d a
seri
es o
f R
ussi
an n
atio
nalis
t pa
rtie
s (H
arm
ony
for
Lat
via,
Reb
irth
of
the
Eco
nom
ic U
nion
, and
the
Nat
iona
l H
arm
ony
Part
y), b
ut t
hey
have
been
true
Com
mun
ist p
artie
s, le
d by
the
old
hard
-lin
e co
mm
unis
t lea
ders
.6 T
he J
une
1989
ele
ctio
n in
Pol
and
was
onl
y pa
rtly
fre
e.7 I
n Ja
nuar
y 20
00, t
he C
roat
ian
form
er c
omm
unis
ts w
ere
incl
uded
in a
bro
ad v
icto
riou
s co
aliti
on p
arty
.
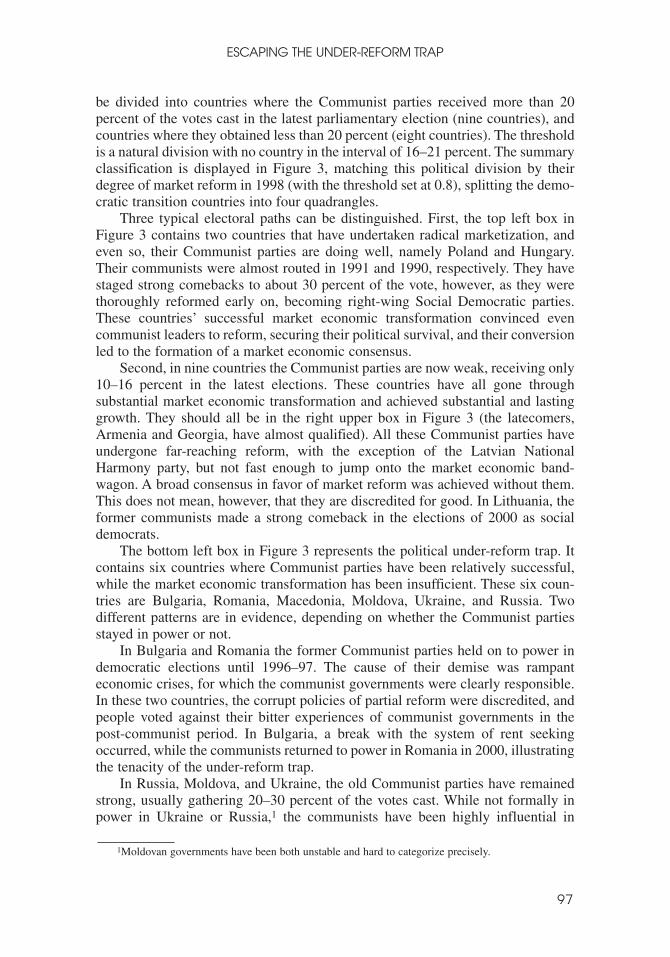
be divided into countries where the Communist parties received more than 20percent of the votes cast in the latest parliamentary election (nine countries), andcountries where they obtained less than 20 percent (eight countries). The thresholdis a natural division with no country in the interval of 16–21 percent. The summaryclassification is displayed in Figure 3, matching this political division by theirdegree of market reform in 1998 (with the threshold set at 0.8), splitting the demo-cratic transition countries into four quadrangles.
Three typical electoral paths can be distinguished. First, the top left box inFigure 3 contains two countries that have undertaken radical marketization, andeven so, their Communist parties are doing well, namely Poland and Hungary.Their communists were almost routed in 1991 and 1990, respectively. They havestaged strong comebacks to about 30 percent of the vote, however, as they werethoroughly reformed early on, becoming right-wing Social Democratic parties.These countries’ successful market economic transformation convinced evencommunist leaders to reform, securing their political survival, and their conversionled to the formation of a market economic consensus.
Second, in nine countries the Communist parties are now weak, receiving only10–16 percent in the latest elections. These countries have all gone throughsubstantial market economic transformation and achieved substantial and lastinggrowth. They should all be in the right upper box in Figure 3 (the latecomers,Armenia and Georgia, have almost qualified). All these Communist parties haveundergone far-reaching reform, with the exception of the Latvian NationalHarmony party, but not fast enough to jump onto the market economic band-wagon. A broad consensus in favor of market reform was achieved without them.This does not mean, however, that they are discredited for good. In Lithuania, theformer communists made a strong comeback in the elections of 2000 as socialdemocrats.
The bottom left box in Figure 3 represents the political under-reform trap. Itcontains six countries where Communist parties have been relatively successful,while the market economic transformation has been insufficient. These six coun-tries are Bulgaria, Romania, Macedonia, Moldova, Ukraine, and Russia. Twodifferent patterns are in evidence, depending on whether the Communist partiesstayed in power or not.
In Bulgaria and Romania the former Communist parties held on to power indemocratic elections until 1996–97. The cause of their demise was rampanteconomic crises, for which the communist governments were clearly responsible.In these two countries, the corrupt policies of partial reform were discredited, andpeople voted against their bitter experiences of communist governments in thepost-communist period. In Bulgaria, a break with the system of rent seekingoccurred, while the communists returned to power in Romania in 2000, illustratingthe tenacity of the under-reform trap.
In Russia, Moldova, and Ukraine, the old Communist parties have remainedstrong, usually gathering 20–30 percent of the votes cast. While not formally inpower in Ukraine or Russia,1 the communists have been highly influential in
ESCAPING THE UNDER-REFORM TRAP
97
1Moldovan governments have been both unstable and hard to categorize precisely.
parliament, as the electoral system made them over-represented, allowing them toblock reform legislation in coalition with other parties.
Whether in government or not, strong Communist parties have ensured thatthe state has remained all-intrusive, with high taxation and extraordinary rentseeking. The natural political outcome has been a state dominated by powerfuloligarchic business groups. The concentrated economic power around the statealso circumscribed democracy, while politics became polarized between oligarchsand communists. Ironically, both groups favor similar economic policies and agreeon having a rent-seeking state. Accordingly, the EBRD (1999) finds that statecapture is the greatest in these semi-reformed countries (see also Hellman, Jones,and Kaufmann, 2000).
The communists remain strong electorally because of dissatisfaction with thenew semi-reformed system, which produces little growth but great inequality,while noncommunists vote for the strongest organized contenders against thecommunist threat. With few independent entrepreneurs, the liberal right is tooweak to counterbalance both communists and oligarchs. Thus communists remainreasonably strong and unreformed when market-oriented economic transforma-tion is slow. This is the political under-reform trap.
III. Stickiness of the Reform Trap
The countries of greatest interest for our analysis are Russia and Ukraine.2Both countries failed to attain significant economic growth until 2000 because oflate and partial reforms. To understand their problem, we first examine the initialrents in these societies. Next, we check the ensuing effects on the dominanteconomic-political groups. Finally, we consider the stability of the situation andhow it may change.
Early Rents in Russia and Ukraine
A mixture of state enterprise managers, new entrepreneurs, government offi-cials, commodity traders, bankers, and outright criminals have grown rich ongovernment subsidies and regulations, that is, rent seeking. Today’s rent seekingcan be traced back to four dominant early forms of rent seeking in both Russia andUkraine.
The first form of rent seeking was to buy commodities on the domesticmarket, which were cheap because of price regulation, and sell them abroad at theworld market price. This required access to the commodities and export permits.About 40 percent of Ukraine’s exports in 1992 were commodities (mainly metals;IMF, 1993b, p. 113), and their average domestic price was about 10 percent of theworld market price. Hence, the total export rents amounted to some $4.1 billion or20 percent of GDP in 1992. The beneficiaries were managers of state metallurgicalcompanies, commodity traders, foreign trade officials, and some politicians. In
Anders Åslund, Peter Boone, and Simon Johnson
98
2This section draws on Åslund (1999 and 2000).
Russia, which had more commodities to export (mainly oil and metals), the exportrents in 1992 amounted to $24 billion or 30 percent of GDP (IMF, 1993a).
The second method was to import certain commodities, notably food in Russiaand energy in Ukraine, at a low subsidized exchange rate and resell them at ahigher domestic price. The main beneficiaries were a small number of gasimporters in Ukraine and food importers in Russia. In Russia, the import subsidiesamounted to 17.5 percent of GDP in 1992 (IMF, 1993a), and they were probablyas sizable in Ukraine, largely pertaining to energy imports from Russia.
The third form of rent seeking was access to subsidized credits. In 1993,Ukraine experienced 10,155 percent inflation, but huge state credits were issuedat an interest of 20 percent a year—that is, state credits were sheer gifts, and theywere given to a privileged few. In 1992, net credit expansion to enterprises was noless than 65 percent of GDP and 47 percent of GDP in 1993 (calculated from IMF,1993b, p. 109; IMF, 1995, pp. 73, 105). In Russia, the net credit issue of the centralbank was 31.6 percent of GDP, and it was less in 1993 (IMF, 1993a). Thus, theserents were greater and more lasting in Ukraine than in Russia.
The fourth form of rents was direct budget subsidies, which amounted to 8.1percent of GDP in 1992 and 10.8 percent of GDP in 1993 in Ukraine (IMF, 1995,p. 94). In Russia, they were 10.8 percent of GDP in 1992 and 9.4 percent of GDPin 1993. In both countries, these subsidies were concentrated on agriculture andenergy—that is, gas in Ukraine and the coal industry in both countries. The subsi-dized industries became totally criminalized by a struggle over these subsidies. Intotal, rents as a share of GDP were huge in both countries but somewhat higher inUkraine than in Russia in both 1992 and 1993 because of greater credit emissionin Ukraine (Åslund, 1999, 2000). Much of these rents have been accumulatedabroad in tax havens.
In this way, a small select group of privileged insiders usurped a huge share ofGDP in the early years of transition and grew strong. They have no reason toabandon their enormous power and wealth, which are based not on property, buton diverted financial flows. For society, the result has been sharply rising incomedifferentials. Ukraine has reached a Gini coefficient of 47 and Russia 48, which isabout the same as the Latin American average (Milanovic, 1998, p. 41). By 1996,macroeconomic stabilization was happily taking hold at long last in both coun-tries, as the original rents dwindled, but the rent seekers stayed rich and powerful,inventing new rents.
Both Russia and Ukraine have well-developed oligarchic power structures ofso-called financial-industrial groups, whose essence is to use political influence toextract rents. A good relationship with the presidency has been essential tosuccess. In both cases, control over the media has been helpful to developing apower base.
In Ukraine, the oligarchs sit in parliament themselves and lead large parties,while Russian oligarchs tend to hire parliamentarians and purchase specific votes.The Russian oligarchs started as small traders. Then they became bankers andcommodity traders, moving on to the production of raw materials for export in themid-1990s, and now they are going into manufacturing. The Ukrainian oligarchsremain commodity traders, but a few have taken to metallurgy and the production
ESCAPING THE UNDER-REFORM TRAP
99
of energy (Brady, 1999; Åslund, 2000). The government and the leading busi-nessmen live in a curious symbiosis and mutual dependence. In order to be re-elected, politicians need the support of the top businessmen (particularly thosewho control the media), but the tycoons can be ousted by politicians if they turnagainst the political leaders.
Especially in Ukraine, an iron triangle of government, businessmen, andparliament ruled the country until 1998. All three groups favored a maximum ofregulation and state interference to maximize rent seeking and corruption, whilethe effects on the population as a whole were of little consequence. The govern-ment malfunctioned in the interests of the rent-seeking elite. This model of self-reinforcing rent seeking looked like a frightfully stable suboptimal equilibrium,reminiscent of the distribution of power in a stagnant African country (Collier andGunning, 1999).
Yet, the nature of the oligarchs’ interaction with one another and the govern-ment changes swiftly. The main institutional change occurred with privatization.Previously, the budding oligarchs merely colluded with state enterprise managersand government officials. Now, they became owners of large enterprises, whichwere by necessity visible. Their dependence on the state diminished. They starteddefending private property rights, and they represented different industrial inter-ests. Their greater security and more clearly defined interests intensified theircompetition. As a result, their competition was transformed from obscure courtintrigue to public politics. In Russia, this occurred in 1994, after the initial voucherprivatization, while in Ukraine it happened only in 1998–99, after the large metal-lurgical companies had been privatized in obscure inside privatizations.
In parallel, the legal situation changed. At the end of communism, large-scalebusiness was pervasively criminal and the murder rate rose steeply. Governmentwas unable to provide the legal institutions that make contracts enforceable. Crimegrew increasingly organized, and major businessmen established their own secu-rity organizations. Greater order reduced the murder rate (Åslund, 1997). InRussia, the internecine murdering among major businessmen ceased in 1994,while it continued until 1996 in Ukraine. In recent years, the police have reestab-lished their monopoly of violence, but their services are often bought by busi-nessmen (Hellman, Jones, and Kaufman, 2000). The demand for court services isrising steeply, prompting higher bribes for judges, while civil servants are deprivedof bribes, since they no longer have much to sell. After most property has beendistributed by state officials, the focus of bribery moves to judges responsible forthe security or redistribution of property.
Policies for Breaking the Trap
Looking back on the past decade, the fast qualitative changes are striking, andthe stability of the suboptimal equilibrium must not be exaggerated. For instance,overindustrialization is soon to become a memory, as value detraction has faded.From 1989 to 1998, the share of industry in GDP in Russia and Ukraine contractedby 15 and 14 percent, respectively (World Bank, 2000). Future economic reformin the former Soviet Union should be seen in this new light. The best option of
Anders Åslund, Peter Boone, and Simon Johnson
100
swift, comprehensive, and radical reform is no longer available, leaving twocontrary alternatives, either collusion or competition.
The advantages of collusion or deal making have been analyzed by someeconomists and political scientists. Andrei Shleifer and Daniel Treisman (1998and 2000) and Treisman (1998) have argued that it facilitated privatization andmacroeconomic stabilization in Russia. This was certainly true for privatization.Ukraine, however, has abounded with deal making with no benefit for reform.
A competitive approach appears, instead, more likely to reduce rent seeking.In their book, Mercantilism as a Rent-Seeking Society, Robert B. Ekelund andRobert D. Tollison argued that mercantilism ended in Britain because of a compe-tition between the royal court and the parliament over monopoly rents and juris-diction. In a similar vein, Andrei Shleifer and Robert Vishny (1993) havesuggested that corruption should be fought through competition rather than prohi-bition, which often implies a reinforcement of the monopoly of corruption, char-acteristic of the Stalinist system. Shleifer and Vishny (1998) and Shleifer andTreisman (2000) have devised methods for how to organize competition amongrent seekers to drive bribes and rents down toward zero. When rents dwindle,smart operators might find productive business more lucrative.
Competition is the opposite of a political and economic monopoly, and itinvolves both politics and economics. A competitive approach to reform can bedescribed as seven related goals: (1) to split the political and business elite intodifferent groups; (2) to form independent political associations and enterpriseswith secure legal bases; (3) to encourage competition among different groups;(4) to achieve political and economic discontinuity; (5) to diminish the state’sstranglehold on economy and society; (6) to achieve a maximum of transparency;and (7) to break up or regulate monopolies. This competition should aim todiminish rent seeking, thus enhancing economic efficiency.
There is a fundamental difference between taxation and regulation with regardto desirable reforms. In taxation, competition must be avoided, as it leads to thekind of overgrazing that has proliferated in the CIS and in many developing coun-tries (Shleifer and Treisman, 2000; Johnson, Kaufmann, and Zoido-Lobaton,1998). In regulation, however, competition can minimize bribery.
A first goal is to create more independent bodies. Throughout the post-Sovietregion, rent seeking has prospered around so-called natural monopolies in energyand transportation (oil, gas, coal, pipelines, railways, and telecommunications),but many of these are not natural monopolies. Telecommunications have beendivided and successfully turned competitive in Russia. Similarly, Russia hasbroken up its oil industry into a dozen major oil companies. Although only one ofthese privatizations was undertaken through competitive bidding, the Russian oilindustry has been transformed into a highly competitive industry. The natural gasmonopoly Gazprom, on the contrary, retains most ministerial regulatory functions,forming the main bastion of asset stripping by managers through barter and transitpricing, while it is badly mismanaged.
Coase’s Theorem (Coase, 1988), that the initial distribution of property doesnot matter because property can be traded, has been much maligned. It presup-poses the absence of transaction costs, which are very high in the transition
ESCAPING THE UNDER-REFORM TRAP
101
economies. Considering high transaction costs, however, it can be modified into aless stringent hypothesis: it is more important that privatization be undertaken thanhow it is undertaken. Historically, states have lived without private property forcenturies, while robber barons tend to be disciplined by the market within a fewdecades. Over time, more property legislation is promulgated, and property rightsare reinforced through practice, as reflected by increased usage of courts by enter-prises (Hendley and others, 1997).
According to the EBRD (1997), the private sector had grown to account for 70percent of Russia’s GDP by 1997, while the Ukrainian private sector only deliv-ered 50 percent of GDP in that year but slowly expanded to 60 percent by 1999(EBRD, 2000). The combination of a growing private sector and the enhancementof property rights amount to a threat to the old habits of rent seeking.
Certain state bodies also need autonomy, especially regional and local organs,from the central state. Today, they have little independence and thus responsibility,while the center is unable to supervise them, which inspires cheating by localorgans and arbitrary rule by the center. Most taxes are shared between two or threeadministrative levels in a shifting and arbitrary fashion, which leads to additionaltax revenues of regional organs being confiscated by the central state (Kravchuk,1999). Ideally, each tax would be fully allocated to one administrative level, forinstance, VAT, excise taxes, and foreign trade taxes to the central state, and prop-erty taxes to local authorities. To make the division crystal clear, each tax baseshould be allocated to one administration level, and each kind of expenditureshould be entirely financed by one level, for instance, defense by the centralgovernment, but schools by local organs. Finally, the state tax service should bedivided between the three administrative levels as well to clarify responsibility andaccountability (Shleifer and Treisman, 2000). Fiscal autonomy would encouragecompetition between different administrative levels.
A large number of private enterprises are needed to support political competi-tion. Autonomy for small entrepreneurs has empirically proven rather easy tocreate. Essentially, only two things are needed—a simplified registration systemand a simple lump sum tax. The early introduction of wide-scale lump sum taxesspearheaded the evolution of many small private enterprises in Poland, which laterformed the social, political, and economic base of radical market economic tran-sition (Åslund, 1985). In 1998, Ukraine successfully launched a fixed lump-sumtax for small entrepreneurs. It has stimulated the development of millions of smallenterprises, which will be the base of a true market economy.
If the state is characterized by rent seeking, state resources are used for privateenrichment and the repression of enterprise. Then, falling state revenues are desirableto limit rents. With falling state revenues, resistance against a rational tax reform isalso likely to fade, as leading rent seekers will no longer perceive a cumbersome taxsystem as an effective deterrent against business by outsiders. Or they might be tooweak to block a liberal tax reform. Thus, Georgia, Kazakhstan, and Kyrgyzstanundertook radical tax reforms after state revenues had fallen sharply.
It is not enough, however, that state activities are cut for a lack of funds. Publicmandates must not be left unfunded but rather eliminated. A major cause ofcorruption is that semiautonomous state organs try to raise their own revenues to
Anders Åslund, Peter Boone, and Simon Johnson
102
finance state programs that remain on the books but are no longer funded by thecentral government (Rose-Ackerman, 1999). Such public fund-raising is usuallyundertaken through extortionary fees and penalties, being the most ineffectivetaxes and amounting to a major cause of corruption.
The most plausible interpretation of growing barter and arrears up to 1998 wasthat they formed a mechanism of extracting government subsidies and then priva-tizing these subsidies through management theft. Total enterprise subsidiesamounted to no less than 16 percent of GDP in 1998 (Pinto, Drebentsov, andMorozov, 1999). Otherwise, the cost of a barter deal should be deterring at about25 percent of the deal (Djankov, 1999, p. 131). This extraction of implicit subsi-dies through barter is facilitated through its nontransparency. With the financialcrash in Russia, barter fell like a stone from 54 percent of all interindustry trans-actions to 21 percent in August 2000 (Russian Economic Barometer, 2000). Aparallel development has occurred in Ukraine. The government was forced toharden its own budget constraints, demanding tax payments in cash, which elimi-nated the possibilities to extract tax rebates through barter or offsets. The effect ofthe dwindling barter has been not only greater monetization but also a leveling ofthe playing field, intensified competition, and economic growth.
One of the most erroneous ideas in much of the transition literature is thatpolitical and economic continuity are vital, because a valuable administrativecapital exists that must be utilized (Stiglitz, 1999). On the contrary, a maximum ofdiscontinuity is desirable in both the political and economic spheres.
The EBRD (1999) Transition Report 1999 shows that the greater the discon-tinuity in the ruling elite, the more radical and successful the market economicreform. Progress in liberalization “was twice as high in countries where the polit-ical executive was replaced as in those where the incumbent from the communistera remained in office” (p. 106). Transition countries with more competitive polit-ical systems and more unstable governments have tended to achieve greaterprogress in economic reform. The five transition countries with the most frequentchanges in government have been the three Baltic States, Poland, and Bulgaria, ofwhich four have been among the most successful reformers (p. 112). The apparentexplanation is that turnover of personnel leads to greater transparency and morechecks on corruption. The greater turnover of governments can also be seen as areflection of more effective democracy, one of the best checks on a rent-seekingelite (see Figure 1).
The same is true of certain economic discontinuity. Drazen and Grilli (1993)have modeled how economic crises may facilitate reform by undermining harmfulvested interests both financially and politically. The Russian financial crash under-mined the ruling oligarchy, thus facilitating substantial reforms, notably budgetand tax reforms, which contributed to unexpected economic growth in 1999 and2000. Thanks to its hyperinflation of 1996–97, Bulgaria changed political leader-ship through democratic elections and undertook far-reaching liberal economicreforms, seemingly breaking out of its under-reform trap. The Romanian crisis of1996–97, on the contrary, does not appear to have been sufficiently severe.Insufficient reforms proved ineffective and allowed the comeback of rather unre-formed communists through democratic elections in 2000.
ESCAPING THE UNDER-REFORM TRAP
103
Economically, market reform in Russia and Ukraine has proceeded. Bothcountries are now liberal and open economies with large exports in relation to theirGDP (see Table 2). Some monopolies are truly natural, but they can be structuredto reduce rent seeking. For example, the power companies in Russia are alignedwith individual regions, and regional governors have substantial control over tariffsetting and personnel appointments. Therefore, these companies have become thefiefdoms of regional leaders, who typically keep tariffs low, prohibit electricitycompanies to cut off local enterprises, and force them to supply regional govern-ments for free. If several regional companies are merged, they fall outside of thecontrol of each governor.
A popular idea in attempts to reduce corruption through administrative harass-ment has been the attempted establishment of one-stop shops for licensing andforeign investors in various countries, but such efforts run counter to the compet-itive approach and they have failed in many countries, as this implies a monopolyof corruption. Instead, several agencies could be allowed to issue the same licensesand permits, prompting them to provide better and cheaper services in competitionwith one another. For example, a visit to Bishkek in 1998 revealed that the cityarchitect had swiftly registered all land for housing and issued titles for the land,because two competing agencies were doing the same, and it was enough to gettitle from one of them. Similarly, enterprises could be allowed to register withdifferent agencies, as long as multiple registrations are not required. Organs atfederal, regional, and local level could all be allowed to issue all licenses thatexist.
The basis of civil society is public learning, which is probably a reason for thebrevity of each method of rent seeking. As people have understood, reforms havebecome necessary. Either followers have jumped into the game to make money forthemselves, for instance, driving rents down through arbitrage, or others havereacted against the rent seeking and demanded structural changes. For instance,cheap credits could be publicly defended in 1992 in Russia and Ukraine, buteverybody knew they caused hyperinflation by 1994. The quality, and thusfreedom, of the media is crucial for this public learning. Besides, much of the oldrent seeking has been built on structural inertia and fear of change, but as thenecessary structural changes proceed through downsizing by default, many obsta-cles to reform fade away.
Our line of argument fits the model of Daron Acemoglu and James Robinson(2000) of political losers as barriers to economic development. They argue thatsocially beneficial economic reforms are being blocked, “when the political powerof the incumbent is threatened by economic innovation” (p. 128). Their modelindicates that the incumbent monopolist is more likely to block the introduction ofnew technologies when political rents from staying in power are greater, whenmonopoly profits from blocking are greater, and when the tax revenue they cancollect from rivals are smaller. While this paper discusses an oligarchy rather thana monopoly, it shows how this confluence of political and economic oligarchyworks in practice.
A corollary of this reasoning is that an oligarchy is much better than monopolyand dictatorship. Belarus and Turkmenistan present a far more stable under-reform
Anders Åslund, Peter Boone, and Simon Johnson
104
trap, which is held together by an iron triangle of 80 percent state ownership,minimal liberalization of the economy and full dictatorship (EBRD, 2000).
IV. Conclusions
Russia and most former Soviet republics have actually become rather normalmarket economies, because most market economies have weak rule of law, a fewdominant business groups, and a close relationship between government and busi-ness. Russian and Ukrainian levels of corruption and political conflict are notunique. They have fallen into a fairly common trap: high corruption drives theeconomy underground and offers few incentives to enter the official economy. Wehave discussed this as an under-reform trap, but this is really a special case of amore general development trap.3
There are three possibilities for market economies trapped with weak institu-tions. First, there may never be growth, as has been the experience in much ofAfrica for decades. Second, if it is in the interest of some part of the elite, somegrowth may occur, and this creates the incentive for managers and governments tobehave better and steal less. Growth becomes self-fulfilling and self-supporting, asin poorer parts of Europe over the past 40 years. Eventually, institutional reformoccurs, but it usually requires the involvement of a third party (like the EuropeanUnion). Third, rapid growth may alternate with episodes of economic collapse.This has been the experience of Latin America over the past 40 years, and it maynow be the case of East Asia.
Institutions cannot be built without political demands for institutions, and suchdemands depend as much on the nature of the economic system as on the politicalsystem. For a dictatorship or business hegemony, any institution is harmful, as itimplies a reduction of absolute power. An oligarchy may find an equilibrium, butit is potentially unstable, as is an oligopoly. The question whether there is a suffi-ciently strong demand for sound market economic institutions in Russia andUkraine is a question whether the economic and political pluralism is strongenough to allow these countries to break out of their under-reform trap. The finan-cial crash in Russia broke many oligarchs both financially and politically, whilebroadening the number of big businessmen. It also increased the demand for stablefinancial institutions in all groups of society. Meanwhile, increasing competitionis bound to reduce rents, and eventually rent seekers may opt for profits instead.The driving force of positive change has to be entrepreneurs who feel they are ata disadvantage because of the privileges of others.
ESCAPING THE UNDER-REFORM TRAP
105
3For evidence on the importance of institutions in economic development more generally, and thelong-lasting effects of early institutions (such as how a country was colonized), see Acemoglu, Johnson,and Robinson (2000). For the size and determinants of the underground economy around the world, seeFriedman and others (2000).
REFERENCES
Acemoglu, Daron, and James A. Robinson, 2000, “Political Losers as a Barrier to EconomicDevelopment,” American Economic Review: Papers and Proceedings, Vol. 90 (May), pp.126–44.
Acemoglu, Daron, Simon Johnson, and James A. Robinson, 2000, “The Colonial Origins ofComparative Development: An Empirical Investigation,” NBER Working Paper No. 7771(Cambridge, Massachusetts: National Bureau of Economic Research).
Åslund, Anders, 1985, Private Enterprise in Eastern Europe: The Non-Agricultural PrivateSector in Poland and the GDR, 1945–83 (London: Macmillan).
———, 1997, “Economic Causes of Crime in Russia,” in The Rule of Law and EconomicReform in Russia, ed. by Jeffrey D. Sachs and Katharina Pistor (Boulder, Colorado:Westview Press).
———, 1999, “Why Has Russia’s Economic Transformation Been So Arduous?” paperpresented at the World Bank’s Annual Bank Conference on Development Economics,Washington, April.
———, 2000, “Why Has Ukraine Failed to Achieve Economic Growth?” in Economic Reformin Ukraine: The Unfinished Agenda, ed. by Anders Åslund and Georges de Ménil (Armonk,New York: M.E. Sharpe).
———, Peter Boone, and Simon Johnson, 1996, “How to Stabilize: Lessons from Post-Communist Countries,” Brookings Papers on Economic Activity: 1, Brookings Institution,pp. 217–313.
Brady, Rose, 1999, Kapitalizm: Russia’s Struggle to Free Its Economy (New Haven,Connecticut: Yale University Press).
Coase, Ronald H., 1988, The Firm, the Market, and the Law (Chicago, Illinois: University ofChicago Press).
Collier, Paul, and Jan Willem Gunning, 1999, “Explaining African Economic Performance,”Journal of Economic Literature, Vol. 37 (March), pp. 64–111.
De Melo, Martha, Cevdet Denizer, and Alan Gelb, 1997, “From Plan to Market: Patterns ofTransition,” in Macroeconomic Stabilization in Transition Economies, ed. by Mario I.Blejer and Marko Skreb (New York: Cambridge University Press).
Djankov, Simeon, 1999, “Enterprise Restructuring in Russia,” in Russian Enterprise Reform:Policies to Further the Transition, ed. by Harry G. Broadman, World Bank DiscussionPaper No. 400 (Washington: World Bank).
Drazen, Allan, and Vittorio Grilli, 1993, “The Benefits of Crises for Economic Reforms,”American Economic Review, Vol. 83 (June), pp. 598–607.
Economic Commission for Europe (United Nations), 2000, Economic Survey of Europe, No. 1(April).
Eilat, Yair, and Clifford Zinnes, 2000, “The Evolution of the Shadow Economy in TransitionCountries: Consequences for Economic Growth and Donor Assistance,” CAER IIDiscussion Paper No. 65 (Cambridge, Massachusetts: Harvard Institute for InternationalDevelopment).
Ekelund, Robert B., and Robert D. Tollison, 1981, Mercantilism as a Rent-Seeking Society(College Station, Texas: Texas A&M University Press).
European Bank for Reconstruction and Development, 1995, Transition Report 1995 (London).
———, 1996, Transition Report 1996 (London).
———, 1997, Transition Report 1997 (London).
Anders Åslund, Peter Boone, and Simon Johnson
106
———, 1998, Transition Report 1998 (London).
———, 1999, Transition Report 1999 (London).
———, 2000, Transition Report 2000: Employment, Skills and Transition (London).
Friedman, Eric, and others, 2000, “Dodging the Grabbing Hand: The Determinats of UnofficialActivity in 69 Countries,” Journal of Public Economics, Vol. 76 (June), pp. 459–93.
Frye, Timothy, and Andrei Shleifer, 1997, “The Invisible Hand and the Grabbing Hand,”American Economic Review, Papers and Proceedings, Vol. 87 (May), pp. 354–58.
Havrylyshyn, Oleh, and Thomas Wolf, 1999, “Growth in Transition Countries, 1991–1998: TheMain Lessons,” paper presented at the International Monetary Fund conference “A Decadeof Transition,” Washington, February.
Hellman, Joel S., Geraint Jones, and Daniel Kaufmann, 2000, “Seize the State, Seize the Day:State Capture, Corruption and Influence in Transition,” Policy Research Working PaperNo. 2444 (Washington: World Bank).
Hendley, Kathryn, and others, 1997, “Observations on the Use of Law by Russian Enterprises,”Post-Soviet Affairs, Vol. 13 (January–March), pp. 19–41.
International Monetary Fund, 1993a, Russian Federation Economic Review (Washington).
———, 1993b, Ukraine 1993 Economic Review (Washington).
———, 1995, Ukraine 1994 Economic Review (Washington).
Johnson, Simon, Daniel Kaufmann, and Andrei Shleifer, 1997, “The Unofficial Economy inTransition,” Brookings Papers on Economic Activity: 2, Brookings Institution,pp. 159–239.
Johnson, Simon, Daniel Kaufmann, and Pablo Zoido-Lobaton, 1998, “Regulatory Discretionand the Unofficial Economy,” American Economic Review: Papers and Proceedings, Vol.88 (May), pp. 387–92.
Johnson, Simon, John McMillan, and Christopher Woodruff, 2000a, “Why Do Firms Hide?Bribes and Unofficial Activity After Communism,” CEPR Discussion Paper No. 2105(London: Centre for Economic Policy Research).
———, 2000b, “Entrepreneurs and the Ordering of Institutional Reform: Poland, Slovakia,Russia, and Ukraine Compared,” Economics of Transition, Vol. 8, pp. 1–36.
Karatnycky, Adrian, Alexander Motyl, and Charles Graybow, eds., 1999, Nations in Transit,1998 (New York: Freedom House).
Kravchuk, Robert S., 1999, “The Quest for Balance: Regional Self-Government andSubnational Fiscal Policy in Ukraine,” in State and Institution Building in Ukraine, ed. byTaras Kuzio, Robert S. Kravchuk, and Paul D’Anieri (New York: St. Martin’s Press).
Milanovic, Branko, 1998, Income, Inequality, and Poverty During the Transition from Plannedto Market Economy (Washington: World Bank).
Pinto, Brian, Vladimir Drebentsov, and Alexander Morozov, 2000, “Dismantling Russia’sNonpayments System: Creating Conditions for Growth,” World Bank Technical Paper No.471 (Washington: World Bank).
Rose-Ackerman, Susan, 1999, Corruption and Government: Causes, Consequences, andReform (New York: Cambridge University Press).
Russian Economic Barometer, 2000, III Quarter (Moscow: REB).
Shleifer, Andrei, 1997, “Joseph Schumpeter Lecture: Government in Transition,” EuropeanEconomic Review, Vol. 41, pp. 385–410.
———, and Robert W. Vishny, 1993, “Corruption,” Quarterly Journal of Economics, Vol. 108(August), pp. 599–617.
ESCAPING THE UNDER-REFORM TRAP
107
———, 1998, The Grabbing Hand: Government Pathologies and Their Cures (Cambridge,Massachusetts: Harvard University Press).
Shleifer, Andrei, and Daniel Treisman, 1998, The Economics and Politics of Transition to anOpen Market Economy: Russia (Paris: OECD Development Center).
———, 2000, Without a Map: Political Tactics and Economic Reform in Russia (Cambridge,Massachusetts: MIT Press).
Stiglitz, Joseph E., 1999, “Whither Reform? Ten Years of Transition,” Annual World BankConference on Development Economics, Washington, April.
Tanzi, Vito, 1999, “Transition and the Changing Role of Government,” Finance andDevelopment, Vol. 36 (June), pp. 20–23.
Treisman, Daniel S., 1998, “Fighting Inflation in a Transitional Regime: Russia’s AnomalousStabilization,” World Politics, Vol. 50 (January), pp. 235–65.
United Nations: Economic Commission for Europe, 2000, Economic Survey of Europe, No. 1(New York).
World Bank, 2000, World Development Indicators, CD-ROM (Washington).
Anders Åslund, Peter Boone, and Simon Johnson
108
Recommended