7/30/2019 ERS-1 SAR image analysis
http://slidepdf.com/reader/full/ers-1-sar-image-analysis 1/12
This article was downloaded by:[Indian Institute of Technology Formerly University of Roorkee]
On: 24 September 2007
Access Details: [subscription number 772304775]
Publisher: Taylor & Francis
Informa Ltd Registered in England and Wales Registered Number: 1072954
Registered office: Mortimer House, 37-41 Mortimer Street, London W1T 3JH, UK
Geocarto InternationalPublication details, including instructions for authors and subscription information:
http://www.informaworld.com/smpp/title~content=t759156373
Usage of ERS SAR data over the Singhbhum Shear
Zone, India for structural mapping and tectonic studiesS. K. Pal a; T. J. Majumdar b; A. K. Bhattacharya a
a Department of Geology and Geophysics, Indian Institute of Technology,
Kharagpur, Indiab Earth Sciences and Hydrology Division, Marine and Earth Sciences Group,
Remote Sensing Applications and Image Processing Area, Space Applications
Centre (ISRO), Ahmedabad, India
Online Publication Date: 01 January 2007
To cite this Article: Pal, S. K., Majumdar, T. J. and Bhattacharya, A. K. (2007)'Usage of ERS SAR data over the Singhbhum Shear Zone, India for structural
mapping and tectonic studies', Geocarto International, 1 - 11
To link to this article: DOI: 10.1080/10106040701337642
URL: http://dx.doi.org/10.1080/10106040701337642
PLEASE SCROLL DOWN FOR ARTICLE
Full terms and conditions of use: http://www.informaworld.com/terms-and-conditions-of-access.pdf
This article maybe used for research, teaching and private study purposes. Any substantial or systematic reproduction,
re-distribution, re-selling, loan or sub-licensing, systematic supply or distribution in any form to anyone is expressly
forbidden.
The publisher does not give any warranty express or implied or make any representation that the contents will be
complete or accurate or up to date. The accuracy of any instructions, formulae and drug doses should be
independently verified with primary sources. The publisher shall not be liable for any loss, actions, claims, proceedings,
demand or costs or damages whatsoever or howsoever caused arising directly or indirectly in connection with or
arising out of the use of this material.
7/30/2019 ERS-1 SAR image analysis
http://slidepdf.com/reader/full/ers-1-sar-image-analysis 2/12
Usage of ERS SAR data over the Singhbhum Shear Zone, India for
structural mapping and tectonic studies
S. K. PAL{, T. J. MAJUMDAR*{ and A. K. BHATTACHARYA{
{Department of Geology and Geophysics, Indian Institute of Technology,
Kharagpur – 721 302, India
{Earth Sciences and Hydrology Division, Marine and Earth Sciences Group,
Remote Sensing Applications and Image Processing Area, Space Applications
Centre (ISRO), Ahmedabad – 380 015, India
(Received 19 May 2006; in final form 14 March 2007 )
The extraction of lineaments and anomalous patterns in the Singhbhum Shear
Zone, Jharkhand, India, has multifaceted applications for mineral exploration as
well as for geological interpretation of neotectonic movements. ERS-1 SAR data
are very useful for such applications because of their structural information
content. A comparative study has been attempted with ERS, Landsat and IRS
images for the interpretation of various geological structures over the Singhbhum
Shear Zone. The Rose diagram generated from this study has shown major trends
that matched well with the geological map of the area and the associated tectonic
boundary as well as with the results obtained from ground based studies.
Keywords: ERS SAR, IRS LISS II, Landsat, Singhbhum Shear Zone, Rosediagram, Lithological discrimination
1. Introduction
The Singhbhum Shear Zone (SSZ) is one of the geologically most complex and
mineralogically rich belts of the Indian subcontinent. The area has been extensively
surveyed using ground-based geological techniques (Dunn 1929, Sarkar 1963, Naha
1965, Sarkar and Saha 1977, Acharya 1984, Sarkar 1988, Saha 1994). It has a major
tectonic element that separates the cratonic block (Singhbhum-Orissa Iron Ore
craton) in the south from the Preterozoic mobile belt (Singhbhum Mobile Belt) in thenorth. It runs in a northwards direction, dipping along a northwardly convex arcuate
belt for a length of more than 160 km from Baharagora in the east to Chakradharpur
in the west. The shear zone trends NW–SE in the eastern part with a width of 5 km,
turning approximately E–W and being wider in the western part.
In the Singhbhum belt, mineralization occurs intermittently along a narrow belt in
the Precambrian terrain of Singhbhum, currently in Jharkhand. Due to occurrences
of a large number of copper and uranium deposits along this belt, it has also been
described as the Cu-U belt. Significantly this belt coincides with a zone of
conspicuous tectonic disturbances and has been described by different authors as the
*Corresponding author. Email: [email protected]
Geocarto International
2007, 1–11, iFirst article
Geocarto International ISSN 1010-6049 print/ISSN 1752-0762 online ª 2007 Taylor & Francis
http://www.tandf.co.uk/journalsDOI: 10.1080/10106040701337642
7/30/2019 ERS-1 SAR image analysis
http://slidepdf.com/reader/full/ers-1-sar-image-analysis 3/12
Singhbhum Thrust Belt or as the Singhbhum Shear Zone. The important host rocks
of mineralization in the eastern sector covering Mosabani and Rakha, and in the
central sector covering Jadugoda, Bhatin and Narwa Pahar are biotite chlorite
schist, quartz-schist, brecciated quartzite, and conglomerate schist, of which the first
two rocks are predominant.
Linears are naturally/culturally occurring features observed in small-scale remotesensing imagery. They are seen in remotely sensed images as simple or composite linear
features on the surface whose parts align in straight or slightly curving relationships
and that differ distinctly from the patterns of adjacent features in various combinations
of stream patterns, tonal changes or tonal vegetation and topographic alignments. In
general, a lineament expresses a subsurface phenomenon (Sabins 1987).
Further research work (Sarkar and Chakraborty 1982, Rakshit and Swaminathan
1985, Parsons and Yearley 1986, Javed et al . 1993, Majumdar 1995) had been carried
out in and around the study area for mineral potential mapping, lithological and
structural studies using remote sensing data. However, the belt forms one of the
potentially challenging areas for assessing the efficacy of remotely sensed data formapping of geological structural/lithological details.
2. Objectives
. To carry out regional geological mapping of the area surrounding Singhbhum
Shear Zone using ERS-1 SAR data and to compare with Landsat TM and IRS
LISS II data.
. To access the utilization of ERS-1 SAR data for structural mapping.
3. Data sources and area of study
An ERS-2 SAR Path Radiance Image (PRI)/Precision Image (path: 0842, row: 0198)
of 30 September 2002 taken over the Singhbhum Shear Zone and surrounding areas of
Jharkhand, India has been used in this study as a higher spatial resolution data source
(C band, VV polarization). The Precision Image is a path oriented and system corrected
product, being the basic product used for a variety of remote sensing applications. The
Precision Image product has fewer speckles, as it has been generated from the resultant
images of three single-look complex (SLC) data. The scene size was 100 km in range
direction and at least 102.5 km in azimuth direction. The spatial resolution was 25 m in
range direction and 15 m in azimuth direction. ENVI Software was used for
preprocessing the ERS-1 SAR data (Research Systems Inc. 2001).The study area is located in the eastern part of the Indian subcontinent between
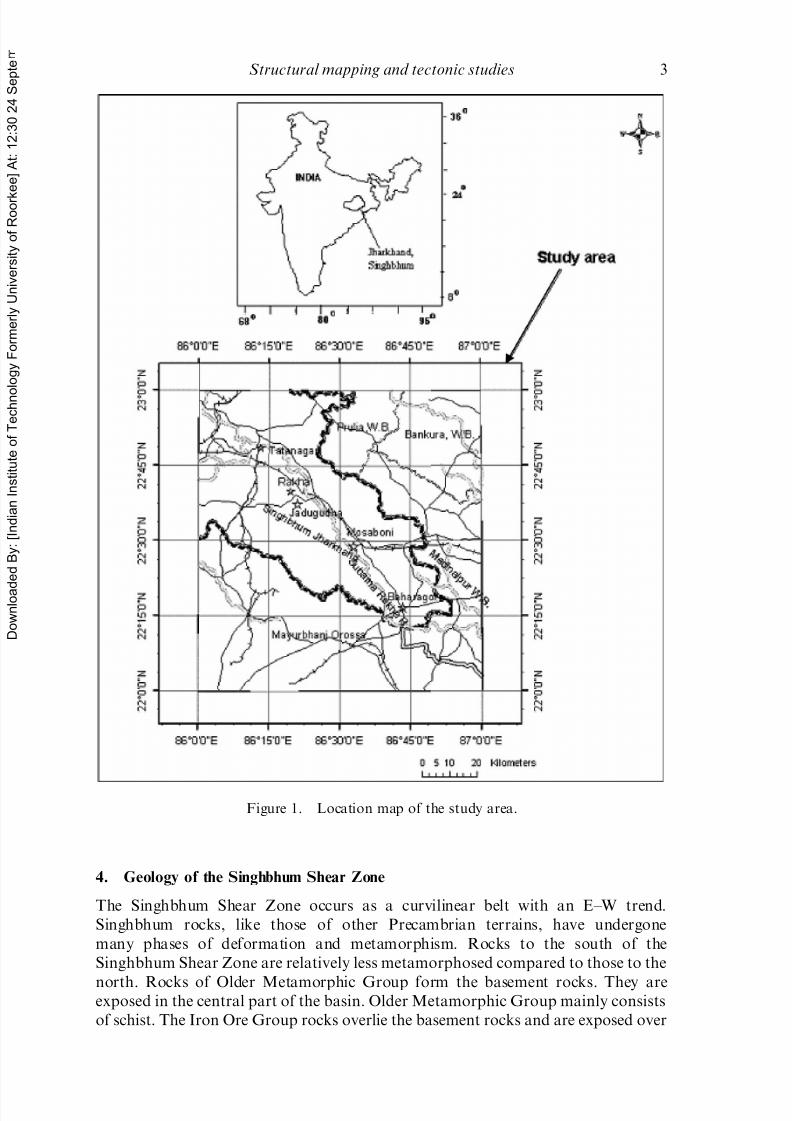
approximately 228 000 to 228 450 N latitudes and 868 000 to 868 450 E longitudes. It
covers the forest areas of the East and West Singhbhum districts of Jharkhand, and
that of the Mayurbhanj, Keonjhar and Bonai districts of Orissa (figure 1). However
a major part of the SSZ lies in Jharkhand. The region under consideration covers a
Precambrian terrain of about 6400 km2.
The data used in the present study are as follows:
. Survey of India Toposheet (73 J) of the study area in 1: 250 000 scale.
. Published geological maps of the area in 1:50 000 scale.
. Published tectonic map of the study area in 1:50 000 scale.
. ERS-1 SAR digital data, path P 0842/row S 0198, 30 September 2002.
2 S. K. Pal et al.
7/30/2019 ERS-1 SAR image analysis
http://slidepdf.com/reader/full/ers-1-sar-image-analysis 4/12
4. Geology of the Singhbhum Shear Zone
The Singhbhum Shear Zone occurs as a curvilinear belt with an E–W trend.
Singhbhum rocks, like those of other Precambrian terrains, have undergone
many phases of deformation and metamorphism. Rocks to the south of the
Singhbhum Shear Zone are relatively less metamorphosed compared to those to the
north. Rocks of Older Metamorphic Group form the basement rocks. They areexposed in the central part of the basin. Older Metamorphic Group mainly consists
of schist. The Iron Ore Group rocks overlie the basement rocks and are exposed over
Figure 1. Location map of the study area.
Structural mapping and tectonic studies 3

7/30/2019 ERS-1 SAR image analysis
http://slidepdf.com/reader/full/ers-1-sar-image-analysis 5/12
vast areas in the western part and over some areas in the east. The Iron Ore Group
succession had formed a broad NNE plunging synclinorium with an overturned
western limb. The succession has a symmetric lithology with the Banded Iron
Formation (BIF) lying in the middle of the succession bounded on the upper and
lower sides by phyllite and basaltic lava. Massive batholiths of granite to
granodiorite composition are occupying vast areas in the central part to the southof SSZ. This granitic mass was emplaced after the deformation of the Iron Ore
group. Rocks of the Dhanjori Group are exposed in the eastern part of the
Singhbhum region. This Group consists of conglomerate, arkose, quartzite and lava
flows. The bottom part of this succession is identified as the Singhbhum Group to
the north of the Singhbhum Shear Zone. Similarly the lava flows in the north are
called Dalma Lava. Dolerite dikes have intruded in the Singhbhum Granite and
occur mostly in the southern part of the Singhbhum district and Keonjhar. The
Kolhan Group occurs to the SSW of SSZ. It consists of gently dipping purple
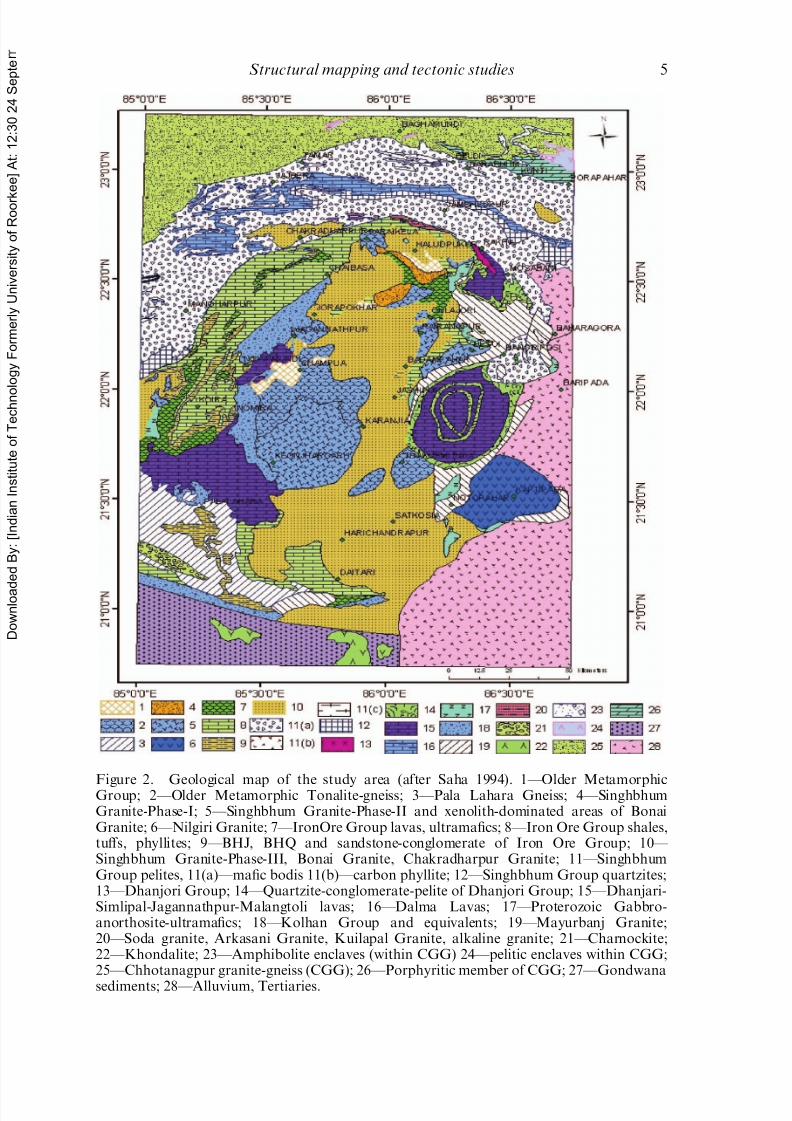
sandstones, conglomerates, limestones and slates of Proterozoic age. Figure 2 shows
the geological map of the study area.Sarkar (1982) proposed a model of converging microplates in an attempt to
interpret the Precambrian tectonic evolution of the Singhbhum and Chotanagpur
regions. In this model, the Chotanagpur block represents an overriding plate being
underthrust by the Singhbhum microplate, the collision of the two continental
microplates taking place approximately 1600 Ma ago. The tectonic evolution of this
region is considered as a consequence of long term geodynamic and geochemical
processes (41 Ga), which the subducted oceanic lithosphere of the Singhbhum
microplate has experienced. The conceptual model is reconstructed in the light of
theoretical studies on the mantle and crustal processes above the subduction zones
(Morgan 1972, Sarkar 1988).
5. Methodology
In the present study remotely sensed satellite (IRS-1A, Landsat TM, and ERS-1
SAR) data have been used for the extraction of structural features. ERS-1 SAR
(C-band) imagery has been interpreted and a structural map of Singhbhum and
surrounding areas has been generated. Finally the structural map obtained from
the ERS SAR image has been compared with similar maps obtained from
IRS-1A (LISS II, channels 2, 3 and 4 i.e. visible and infrared) and Landsat TM
(channels 2, 3 and 4, i.e. visible and infrared) data (Javed et al . 1993). Structural
information, as obtained from ERS SAR data, may be more useful due to theresponse of backscattering with respect to soil moisture in comparison with IRS
and Landsat TM (visible and infrared) data, which are otherwise rich in spectral
and spatial resolutions. Selective ground truth has been carried out over the study
area to validate the findings. Rose diagrams have also been generated over the
study area based on the interpretation using ERS-1 SAR, Landsat TM, IRS-1 A
LISS II data.
6. Results and discussion
Digital processing of satellite data using various image processing techniques mayhelp in the extraction of regional lineaments and anomalous patterns in two ways.
First, it automates the whole procedure of interpretation, which is otherwise highly
4 S. K. Pal et al.
7/30/2019 ERS-1 SAR image analysis
http://slidepdf.com/reader/full/ers-1-sar-image-analysis 6/12
Figure 2. Geological map of the study area (after Saha 1994). 1—Older MetamorphicGroup; 2—Older Metamorphic Tonalite-gneiss; 3—Pala Lahara Gneiss; 4—SinghbhumGranite-Phase-I; 5—Singhbhum Granite-Phase-II and xenolith-dominated areas of BonaiGranite; 6—Nilgiri Granite; 7—IronOre Group lavas, ultramafics; 8—Iron Ore Group shales,tuffs, phyllites; 9—BHJ, BHQ and sandstone-conglomerate of Iron Ore Group; 10— Singhbhum Granite-Phase-III, Bonai Granite, Chakradharpur Granite; 11—SinghbhumGroup pelites, 11(a)—mafic bodis 11(b)—carbon phyllite; 12—Singhbhum Group quartzites;13—Dhanjori Group; 14—Quartzite-conglomerate-pelite of Dhanjori Group; 15—Dhanjari-Simlipal-Jagannathpur-Malangtoli lavas; 16—Dalma Lavas; 17—Proterozoic Gabbro-anorthosite-ultramafics; 18—Kolhan Group and equivalents; 19—Mayurbanj Granite;20—Soda granite, Arkasani Granite, Kuilapal Granite, alkaline granite; 21—Charnockite;22—Khondalite; 23—Amphibolite enclaves (within CGG) 24—pelitic enclaves within CGG;25—Chhotanagpur granite-gneiss (CGG); 26—Porphyritic member of CGG; 27—Gondwana
sediments; 28—Alluvium, Tertiaries.
Structural mapping and tectonic studies 5
7/30/2019 ERS-1 SAR image analysis
http://slidepdf.com/reader/full/ers-1-sar-image-analysis 7/12
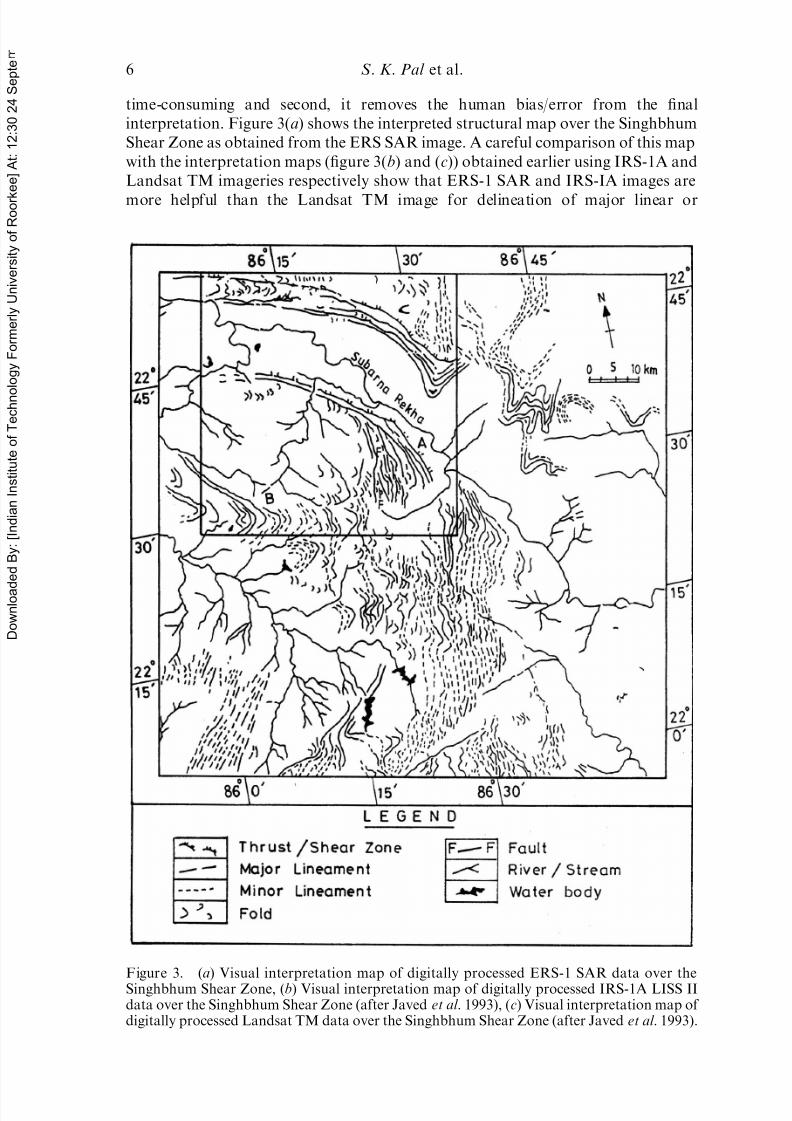
time-consuming and second, it removes the human bias/error from the final
interpretation. Figure 3(a) shows the interpreted structural map over the Singhbhum
Shear Zone as obtained from the ERS SAR image. A careful comparison of this map
with the interpretation maps (figure 3(b) and (c)) obtained earlier using IRS-1A and
Landsat TM imageries respectively show that ERS-1 SAR and IRS-IA images are
more helpful than the Landsat TM image for delineation of major linear or
Figure 3. (a) Visual interpretation map of digitally processed ERS-1 SAR data over theSinghbhum Shear Zone, (b) Visual interpretation map of digitally processed IRS-1A LISS IIdata over the Singhbhum Shear Zone (after Javed et al . 1993), (c) Visual interpretation map of digitally processed Landsat TM data over the Singhbhum Shear Zone (after Javed et al . 1993).
6 S. K. Pal et al.

7/30/2019 ERS-1 SAR image analysis
http://slidepdf.com/reader/full/ers-1-sar-image-analysis 8/12
curvilinear features e.g. lineaments, folds and faults (Javed et al . 1993, Majumdar
1995). ERS SAR imagery has also been found to be much more suitable for
delineating macro- as well as micro-structural features in the study area. It is alsoclear that major lineaments occurring in this area are along E–W and NW–SE direc-
tions, while numerous minor lineaments having N–S trend occur in the north-eastern
Figure 3. (Continued ).
Structural mapping and tectonic studies 7
7/30/2019 ERS-1 SAR image analysis
http://slidepdf.com/reader/full/ers-1-sar-image-analysis 9/12
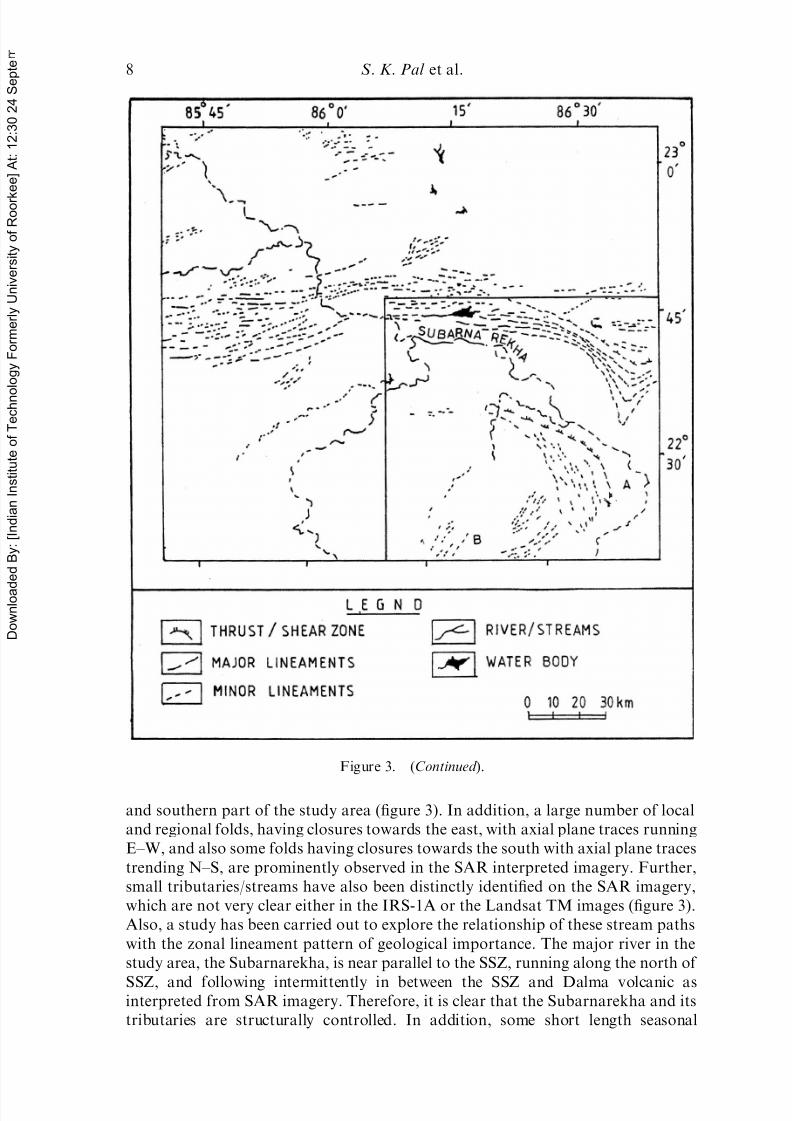
and southern part of the study area (figure 3). In addition, a large number of local
and regional folds, having closures towards the east, with axial plane traces running
E–W, and also some folds having closures towards the south with axial plane traces
trending N–S, are prominently observed in the SAR interpreted imagery. Further,
small tributaries/streams have also been distinctly identified on the SAR imagery,
which are not very clear either in the IRS-1A or the Landsat TM images (figure 3).
Also, a study has been carried out to explore the relationship of these stream paths
with the zonal lineament pattern of geological importance. The major river in the
study area, the Subarnarekha, is near parallel to the SSZ, running along the north of
SSZ, and following intermittently in between the SSZ and Dalma volcanic asinterpreted from SAR imagery. Therefore, it is clear that the Subarnarekha and its
tributaries are structurally controlled. In addition, some short length seasonal
Figure 3. (Continued ).
8 S. K. Pal et al.
7/30/2019 ERS-1 SAR image analysis
http://slidepdf.com/reader/full/ers-1-sar-image-analysis 10/12
streams are also structurally controlled in the south-west part as observed from SAR
imagery. A number of faults in the N–S direction have also been mapped near the
central part of the Dhanjori volcanic, as observed from SAR imagery.
The role of the structures includes the focusing of magmatic and/or surface-
derived fluid, the localizing of plutonic emplacement, and creation of a local fault,
fracture and lineament networks to host mineralization. Economically, the structureshave a great significance due to the probability of accumulation of the mineralized
ores in and along the weak zone of lineaments, faults, and surrounding the axial
plane of the fold. These geological structures help to locate the occurrence of the
hidden ore/mineral. The different mines such as Baharagora, Mosaboni, Jadugoda,
Rakha, and Tatanagar are along the shear zone, which correlate very well with the
anticipated results.
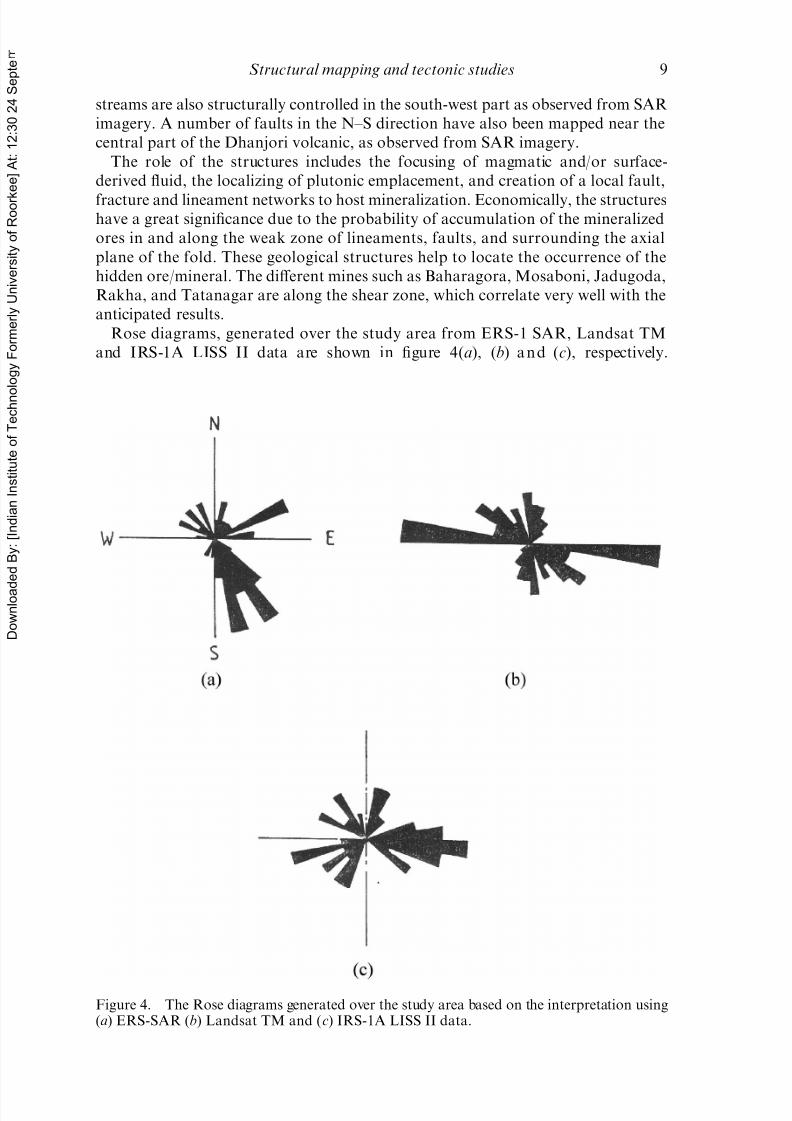
Rose diagrams, generated over the study area from ERS-1 SAR, Landsat TM
and IRS-1A LISS II data are shown in figure 4(a), (b) a n d (c), respectively.
Figure 4. The Rose diagrams generated over the study area based on the interpretation using(a) ERS-SAR (b) Landsat TM and (c) IRS-1A LISS II data.
Structural mapping and tectonic studies 9

7/30/2019 ERS-1 SAR image analysis
http://slidepdf.com/reader/full/ers-1-sar-image-analysis 11/12
The Rose diagrams represent a better perspective view and trends of the structural
features.
The maximum lineaments occurring in the north of SSZ are NNE, NNW and NW
trending, while maximum lineaments occurring in the south of SSZ are NE, ENE,
WNW, and NW trending as observed by Pal et al . (2006). The major river in the
study area, Subarnarekha, as delineated from the filtered SAR imagery, is observedto be running almost parallel along the northern boundary of SSZ for some
distance, and then following intermittently in between the SSZ and Dalma volcanic
(figure 3(a)). High contrast and darker tones emphasize the main drainage pattern of
the study area.
Those trends matched well with the geological map of the area showing trends
associated with the tectonic boundary and fractures in the Chotanagpur region as
obtained by field studies and visual interpretation of Landsat imageries with
major trends in ENE and SE directions (Sarkar 1988, Javed et al . 1993, Saha 1994)
(figures 2 and 3(a), (b) and (c)). The comparison shows good matching for
generalized lineaments along E–W, NE–SW and NW–SE directions though theintensity of occurrences varies.
7. Conclusions
Remote sensing is a very cost-effective tool for delineating different structural
features, drainage patterns etc. A number of new structural features have been
delineated on an ERS-1 SAR image, which could not be detected earlier from
other satellite imagery (figure 3(a)–(c)). Water bodies and tributaries/streams are
easily detectable from ERS-1 SAR image and the main river Subarnarekha, and few
of its tributaries have been found to be structurally controlled. The generated Rosediagram has been found helpful for the delineation of major lineament trends and
structural and tectonic patterns.
The present study also reveals that maximum lineaments occurring in the SSZ
are in E–W, NE–SW and NW–SE directions (figure 4). Also, numerous linear
features, faults/fractures and folds could be identified and demarcated using this
technique on SAR imagery, which may have a great significance for locating
hidden ore/mineral occurrences. It is found to be more suitable and effective for
delineating lineaments, as well as drainage patterns, in the study area using ERS
SAR data.
Acknowledgements
The authors wish to thank the anonymous referees for their critical comments/
suggestions for the improvement of the manuscript. They are also thankful to
Dr R. R. Navalgund, Director, Space Applications Centre (SAC), Ahmedabad,
India, Dr K. L. Majumder, Ex-Deputy. Director, Remote Sensing Applications
and Image Processing Area (RESIPA)/SAC, Space Applications Centre,
Ahmedabad, India and Dr Ajai, Group Director, Marine and Earth Sciences
Group (MESG)/RESIPA/SAC, Ahmedabad, India for their keen interest in this
study. They are also thankful to Shri R. Bhattacharyya, Senior Research
Fellow, Earth Sciences and Hydrology Division (ESHD)/MESG/RESIPA/SAC,Ahmedabad, India.
10 S. K. Pal et al.

7/30/2019 ERS-1 SAR image analysis
http://slidepdf.com/reader/full/ers-1-sar-image-analysis 12/12
References
ACHARYA, S., 1984, Stratigraphic and structural evolution of the rocks of the iron ore basins
in Singhbhum-Orissa Iron Ore Province, India. Crustal Evolution of the Indian Shield
and its bearing on Metallogeny (CEISM) Seminar, 1. Indian Journal of Earth Sciences,
1, pp. 19–28.
DUNN, J.A., 1929, The Geology of North Singhbhum. Memoir no. 54 (Bangalore: Geological
Society of India).
JAVED, A., MAJUMDAR, T.J., MOHANTY, K.K. and IQBALUDDIN, 1993, Lineament analysis and
its inferred relationship with tectonic activity through visual interpretation and digital
processing over a part of Singhbhum shear zone (Bihar). Poster presented in the
National Symposium on Remote Sensing Applications for Resource Management with
Special Emphasis on North Eastern Region, Guwahati, India, 25–27 November 1993.
MAJUMDAR, T.J., 1995, Application of fast Fourier transform over a part of Singhbhum shear
zone for extraction of linear and anomalous features. ITC Journal , 3, 241–245.
MORGAN, W.J., 1972, Deep mantle convection plumes and plate motions. American
Association of Petroleum Geologists Bulletin, 56, 201–213.
NAHA, K., 1965, Metamorphism in relation to stratigraphy, structure and movements in partsof east Singhbhum, eastern India. Quarterly Journal of Geological, Mining and
Metallurgical Society (India), 37, 41–88.
PAL, S.K., MAJUMDAR, T.J. and BHATTACHARYA, A.K., 2006, Extraction of linear and
anomalous features using ERS SAR data over Singhbhum Shear Zone, Jharkhand
using fast Fourier transform. International Journal of Remote Sensing, 27, 4513–4528.
PARSONS, A.J. and YEARLEY, R.J., 1986, An analysis of geological lineaments seen on Landsat
MSS imagery. International Journal of Remote Sensing, 7, 1773–1782.
RAKSHIT, A.M. and SWAMINATHAN, V.L., 1985, Application of digitally processed and
enhanced Landsat imagery, for geological mapping and mineral targeting in the
Singhbhum Precambrian mineralized belt, Bihar-Orissa. International Journal of
Remote Sensing, 6, 457–471.RESEARCH SYSTEMS INC., 2001, ENVI User’s Guide. Boulder, Colorado, USA.
SABINS (JR.), F.F., 1987, Remote Sensing: Principles and Interpretation. New York: W. H.
Freeman & Company.
SAHA, A.K., 1994, Crustal Evolution of Singhbhum-North Orissa, Eastern India. Memoir no. 27
(Bangalore: Geological Society of India).
SARKAR, A.N., 1982, Precambrian tectonic evolution of eastern India: a model of converging
microplates. Tectonophysics, 86, 363–397.
SARKAR, A.N., 1988, Tectonic Evolution of the Chotanagpur Plateau and the Gondowana Basins
in Eastern India: An interpretation based on supra-subduction geological processes.
Memoir no. 8 (Bangalore: Geological Society of India).
SARKAR, A.N. and CHAKRABORTY, D.K., 1982, One orogenic belt or two? A structuralreinterpretation supported by Landsat data products of the Precambrian meta-
morphics of Singhbhum, Eastern India. Photogrammetria, 37, 185–201.
SARKAR, S.N. and SAHA, A.K., 1962, A revision of the Precambrian stratigraphy and tectonics
of Singhbhum and adjacent regions. Quarterly Journal of Geological, Mining and
Metallurgical Society (India), 34, 97–136.
SARKAR, S.N. and SAHA, A.K., 1977, The present status of the Precambrian stratigraphy,
tectonics and geochronology of Singhbhum-Keonjhar-Mayurbhanj region, Eastern
India. Indian Journal of Earth Sciences, S.Ray vol., 37–65.
Structural mapping and tectonic studies 11
Recommended