Epidemiology and Surveillance: Lessons from
Past Pandemics
Arnold S. Monto, MDProfessor of Epidemiology
University of Michigan School of Public HealthFounding Director
University of Michigan Bioterrorism Preparedness InitiativeAnn Arbor, MI
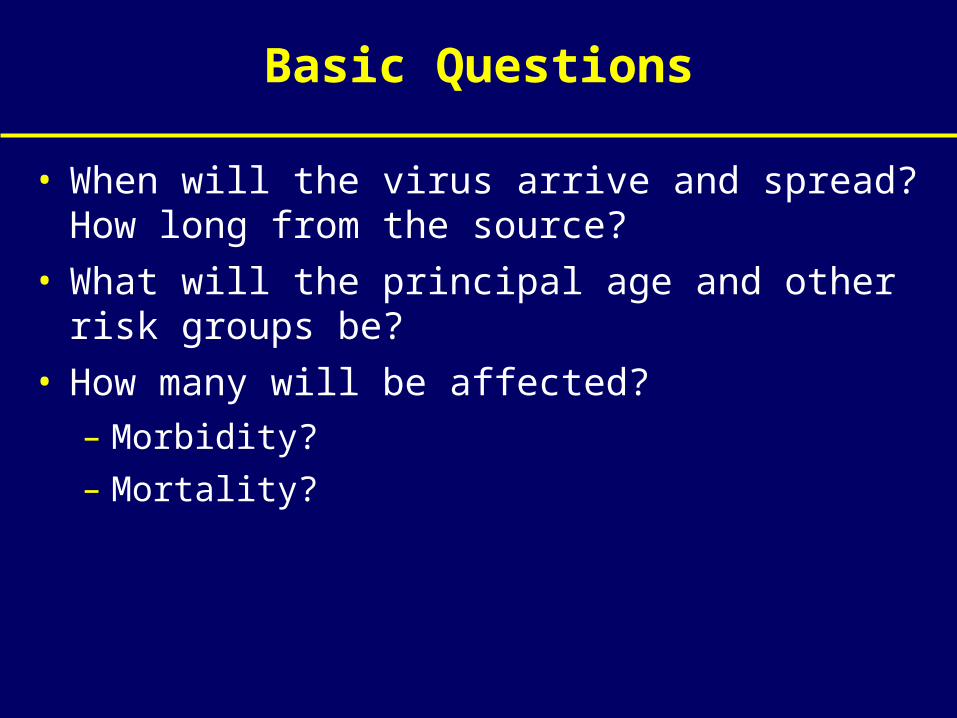
Basic Questions
• When will the virus arrive and spread? How long from the source?
• What will the principal age and other risk groups be?
• How many will be affected?– Morbidity?
– Mortality?
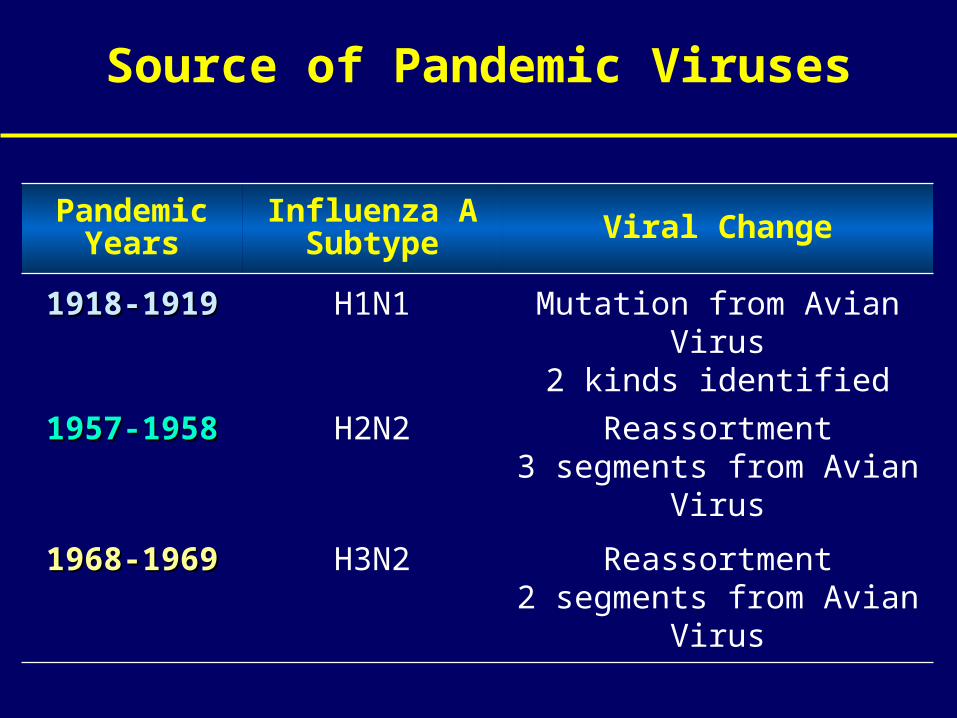
Source of Pandemic Viruses
Pandemic Years
Influenza A Subtype Viral Change
1918-19191918-1919 H1N1 Mutation from Avian Virus2 kinds identified
1957-19581957-1958 H2N2 Reassortment3 segments from Avian Virus
1968-19691968-1969 H3N2 Reassortment2 segments from Avian Virus
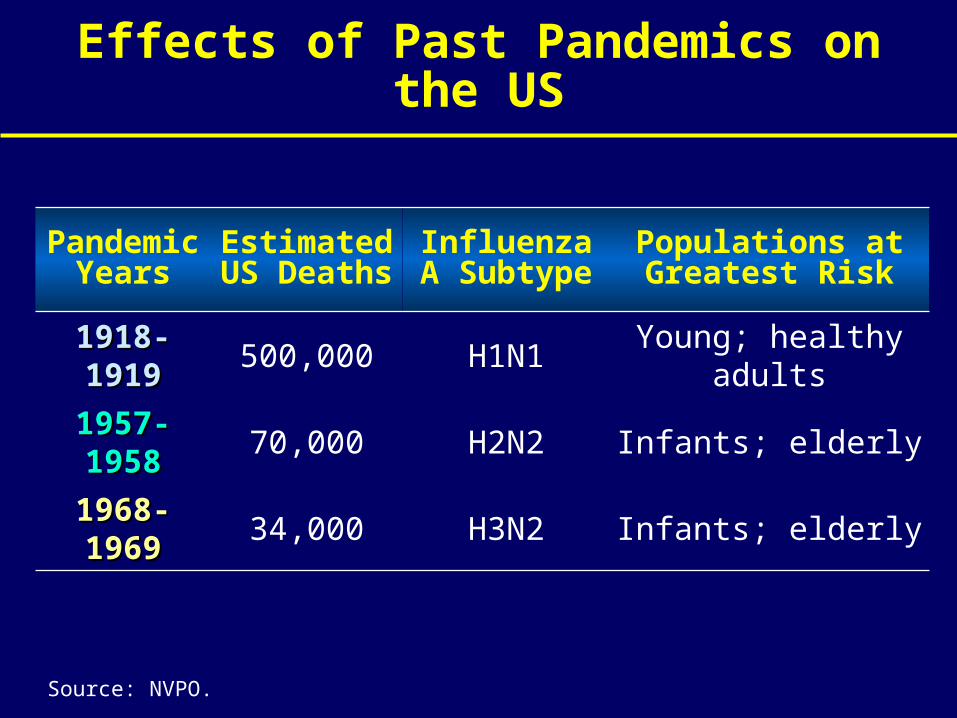
Effects of Past Pandemics on the US
Source: NVPO.
Pandemic Years
Estimated US Deaths
Influenza A Subtype
Populations at Greatest Risk
1918-19191918-1919 500,000 H1N1 Young; healthy adults
1957-19581957-1958 70,000 H2N2 Infants; elderly
1968-19691968-1969 34,000 H3N2 Infants; elderly
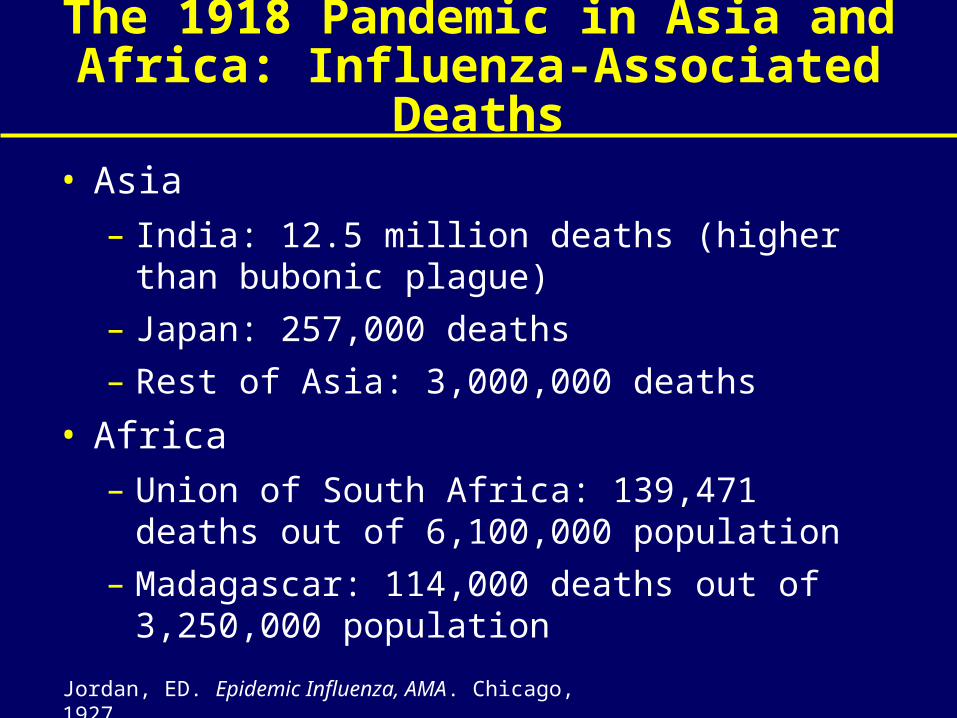
The 1918 Pandemic in Asia and Africa: Influenza-Associated Deaths
• Asia– India: 12.5 million deaths (higher than bubonic
plague)
– Japan: 257,000 deaths
– Rest of Asia: 3,000,000 deaths
• Africa– Union of South Africa: 139,471 deaths out of
6,100,000 population
– Madagascar: 114,000 deaths out of 3,250,000 population
Jordan, ED. Epidemic Influenza, AMA. Chicago, 1927.
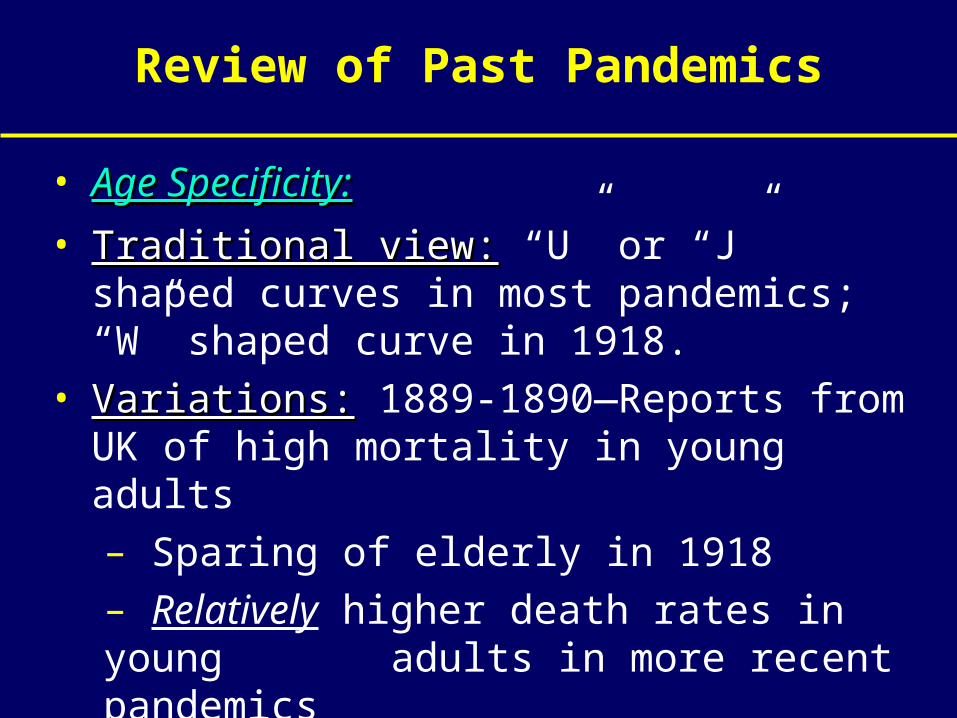
Review of Past Pandemics
• Age Specificity:Age Specificity:
• Traditional view:Traditional view: “U” or “J” shaped curves in most pandemics; “W” shaped curve in 1918.
• Variations:Variations: 1889-1890—Reports from UK of high mortality in young adults– Sparing of elderly in 1918– Relatively higher death rates in young
adults in more recent pandemics• Will past history predict the future?Will past history predict the future?
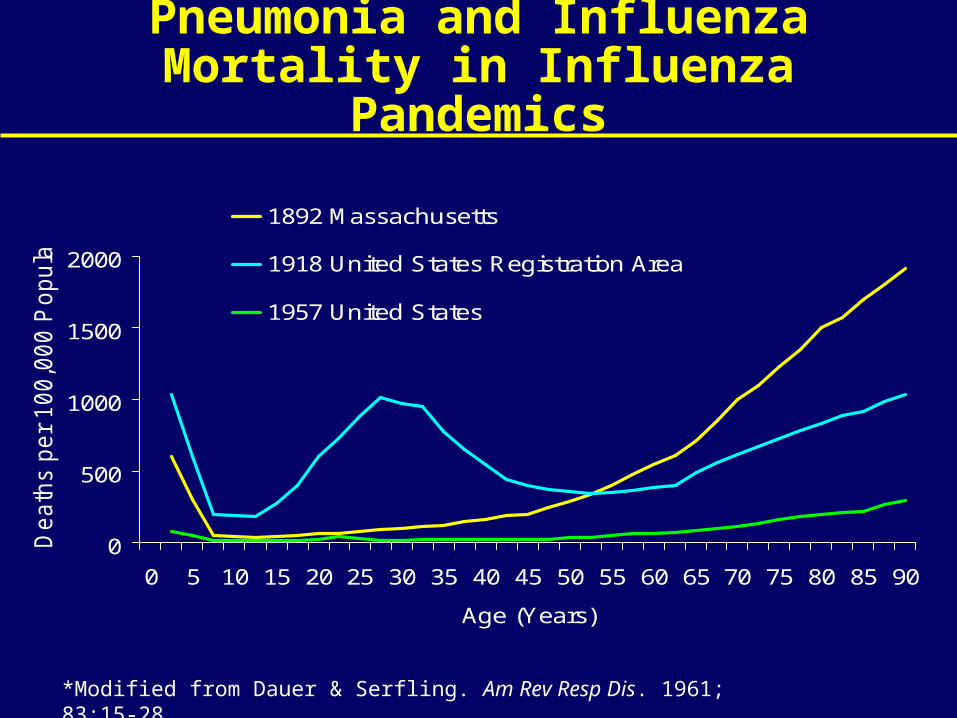
Pneumonia and Influenza Mortality in Influenza Pandemics
0
500
1000
1500
2000
0 5 10 15 20 25 30 35 40 45 50 55 60 65 70 75 80 85 90
Age (Years)
Death
s p
er
100,0
00 P
opula
tion 1892 Massachusetts
1918 United States Registration Area
1957 United States
*Modified from Dauer & Serfling. Am Rev Resp Dis. 1961; 83:15-28.
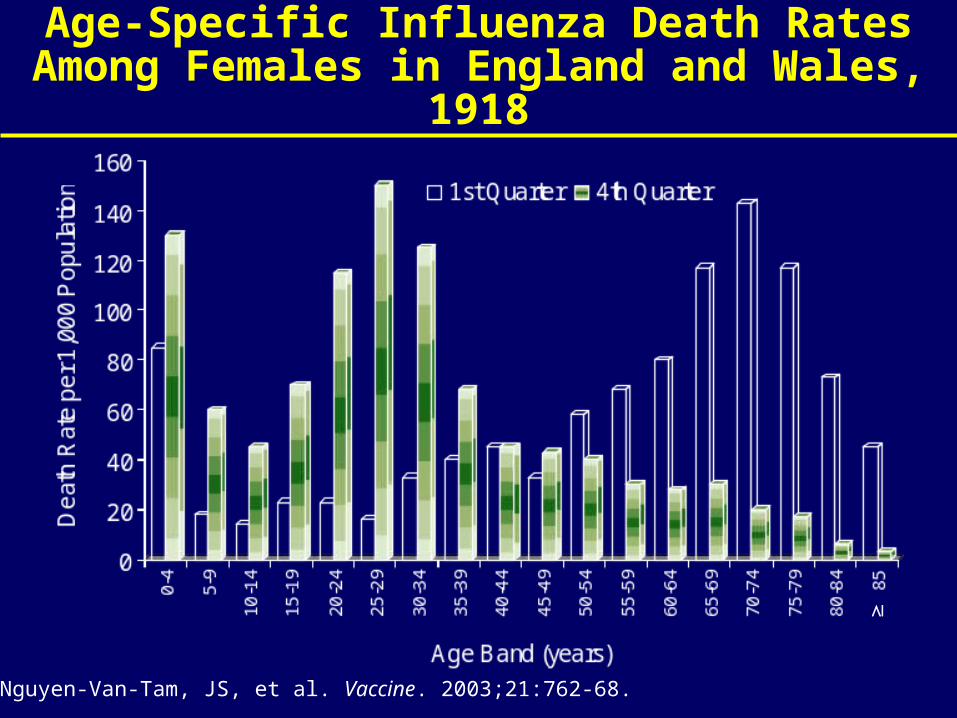
Age-Specific Influenza Death Rates Among Females in England and Wales, 1918
Nguyen-Van-Tam, JS, et al. Vaccine. 2003;21:762-68.
1957
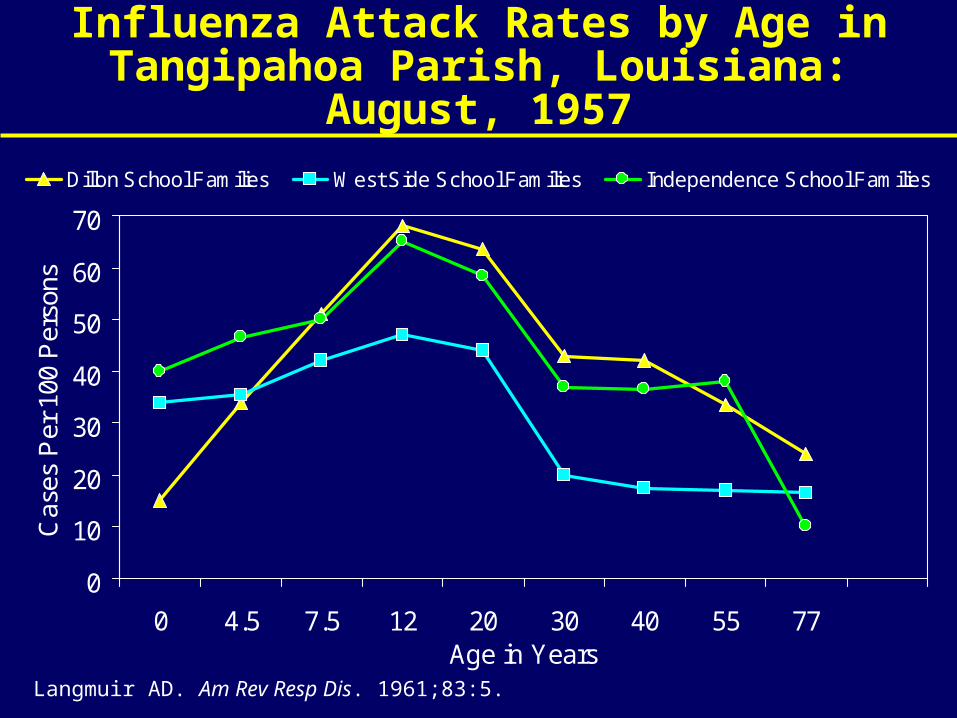
Influenza Attack Rates by Age in Tangipahoa Parish, Louisiana: August, 1957
0
10
20
30
40
50
60
70
0 4.5 7.5 12 20 30 40 55 77Age in Years
Cas
es P
er 1
00 P
erso
ns
Dillon School Families West Side School Families Independence School Families
Langmuir AD. Am Rev Resp Dis. 1961;83:5.
1968
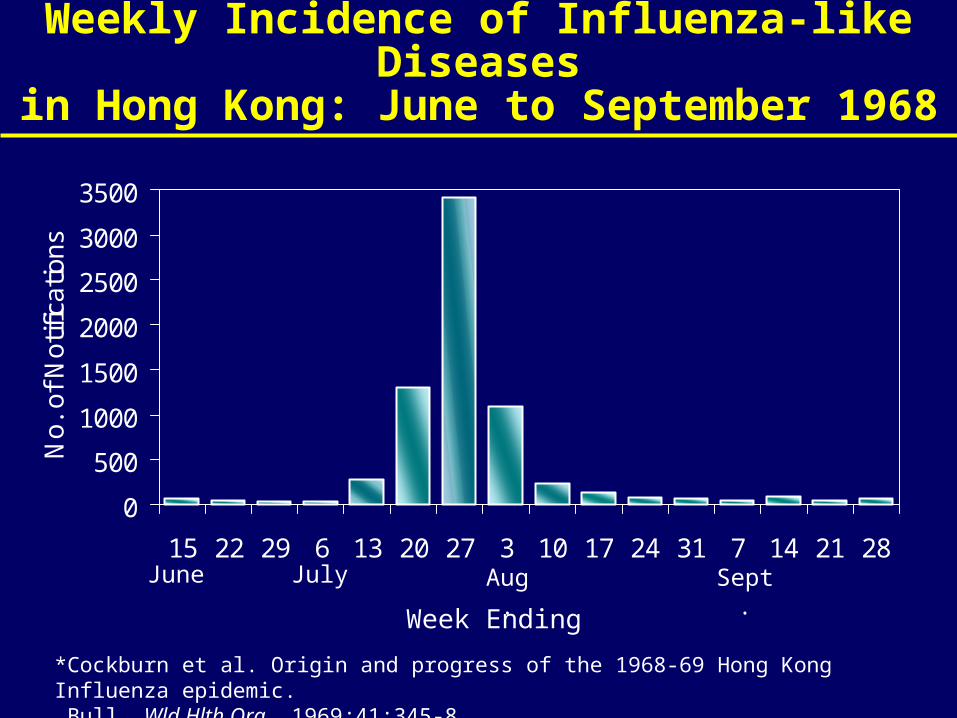
Weekly Incidence of Influenza-like Diseasesin Hong Kong: June to September 1968
0
500
1000
1500
2000
2500
3000
3500
15 22 29 6 13 20 27 3 10 17 24 31 7 14 21 28
No.
of
Not
ifica
tions
June July Aug. Sept.
*Cockburn et al. Origin and progress of the 1968-69 Hong Kong Influenza epidemic. Bull. Wld Hlth Org. 1969;41:345-8.
Week Ending
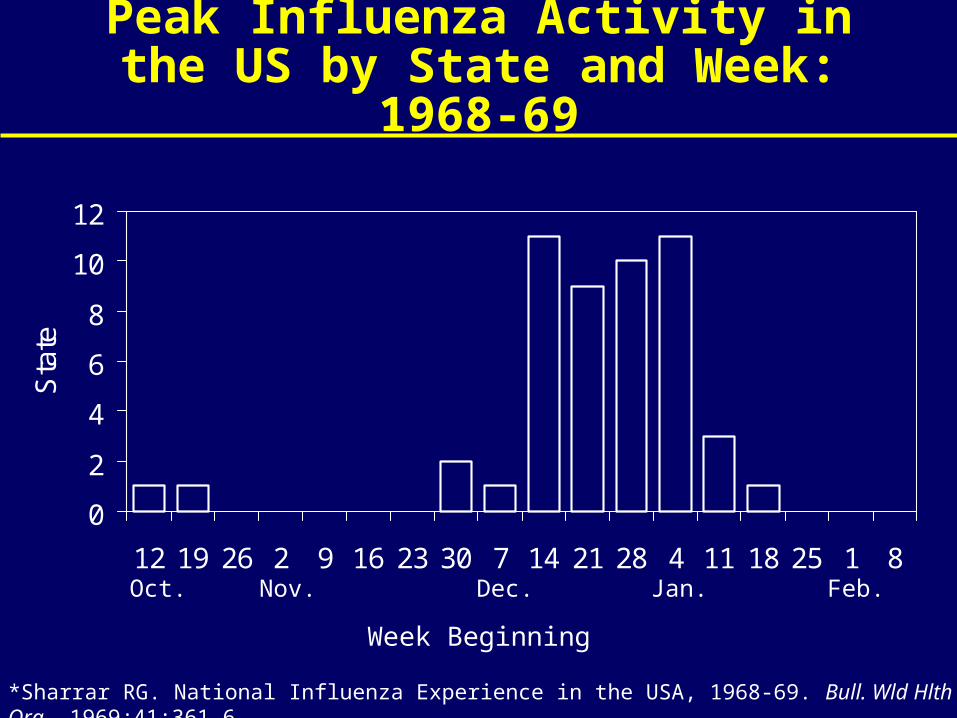
Peak Influenza Activity in the US by State and Week: 1968-69
0
2
4
6
8
10
12
12 19 26 2 9 16 23 30 7 14 21 28 4 11 18 25 1 8
Sta
te
Oct. Nov. Dec. Jan. Feb.
*Sharrar RG. National Influenza Experience in the USA, 1968-69. Bull. Wld Hlth Org. 1969;41:361-6.
Week Beginning
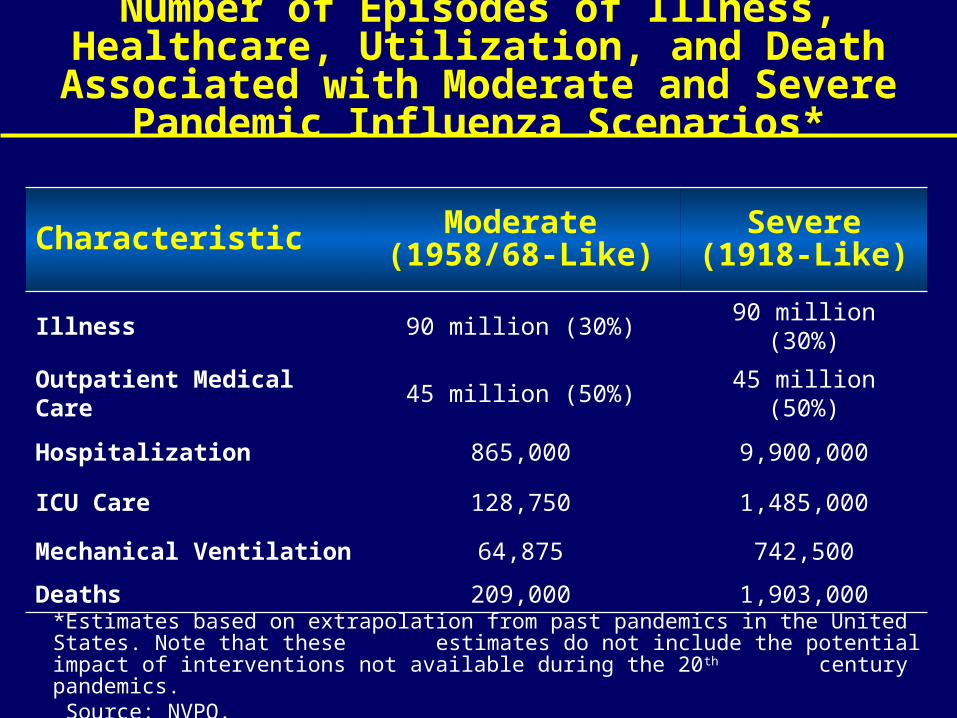
Number of Episodes of Illness, Healthcare, Utilization, and Death Associated with Moderate
and Severe Pandemic Influenza Scenarios*
Characteristic Moderate(1958/68-Like)
Severe(1918-Like)
Illness 90 million (30%) 90 million (30%)
Outpatient Medical Care 45 million (50%) 45 million (50%)
Hospitalization 865,000 9,900,000
ICU Care 128,750 1,485,000
Mechanical Ventilation 64,875 742,500
Deaths 209,000 1,903,000
*Estimates based on extrapolation from past pandemics in the United States. Note that these estimates do not include the potential impact of interventions not available during the 20 th
century pandemics. Source: NVPO.
Conclusions
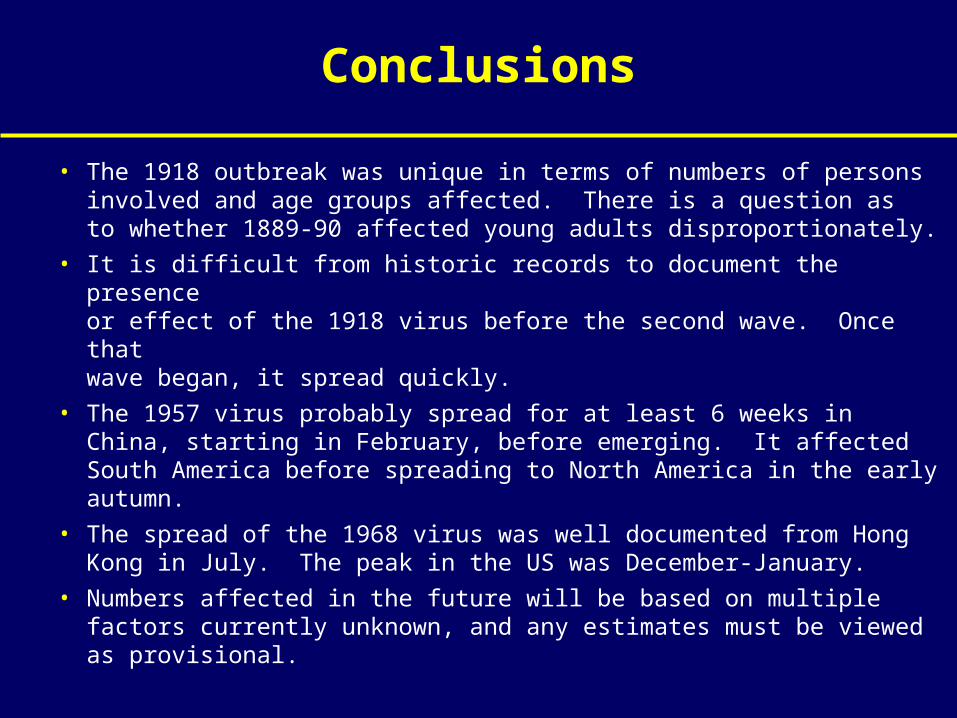
• The 1918 outbreak was unique in terms of numbers of persons involved and age groups affected. There is a question as to whether 1889-90 affected young adults disproportionately.
• It is difficult from historic records to document the presence or effect of the 1918 virus before the second wave. Once that wave began, it spread quickly.
• The 1957 virus probably spread for at least 6 weeks in China, starting in February, before emerging. It affected South America before spreading to North America in the early autumn.
• The spread of the 1968 virus was well documented from Hong Kong in July. The peak in the US was December-January.
• Numbers affected in the future will be based on multiple factors currently unknown, and any estimates must be viewed as provisional.
Recommended