Environmental Plant PhysiologyObjectives
• The objectives of this course are to learn plant responses to abiotic stresses, particularly plant growth and development, and to learn modeling methodologies on how to integrate those plant processes under multiple stress conditions.
• At the end, the students are expected to:
understand individual as well as interactive abiotic stress effects on photosynthesis, respiration, growth, development and finally yield.
understand on how to develop methodologies to integrate multiple stress factor effects on various plant/canopy processes.

Environmental and Cultural Factors Limiting Potential Yields
Atmospheric Carbon DioxideSolar RadiationTemperature (Extremes)Water (Drought and Flooding)WindNutrients (N and K)Others, ozone etc.,Growth Regulators (PIX)

The objectives of this lecture are:
• To learn global, regional and local spatial and temporal trends in atmospheric CO2.
• To learn diurnal trends in atmospheric CO2.
• Contributing factors for fluxes/changes in global CO2 concentration.
• The importance of atmospheric CO2 and its role or effects on plants and ecosystems in general.
Atmospheric Carbon Dioxide - Objectives
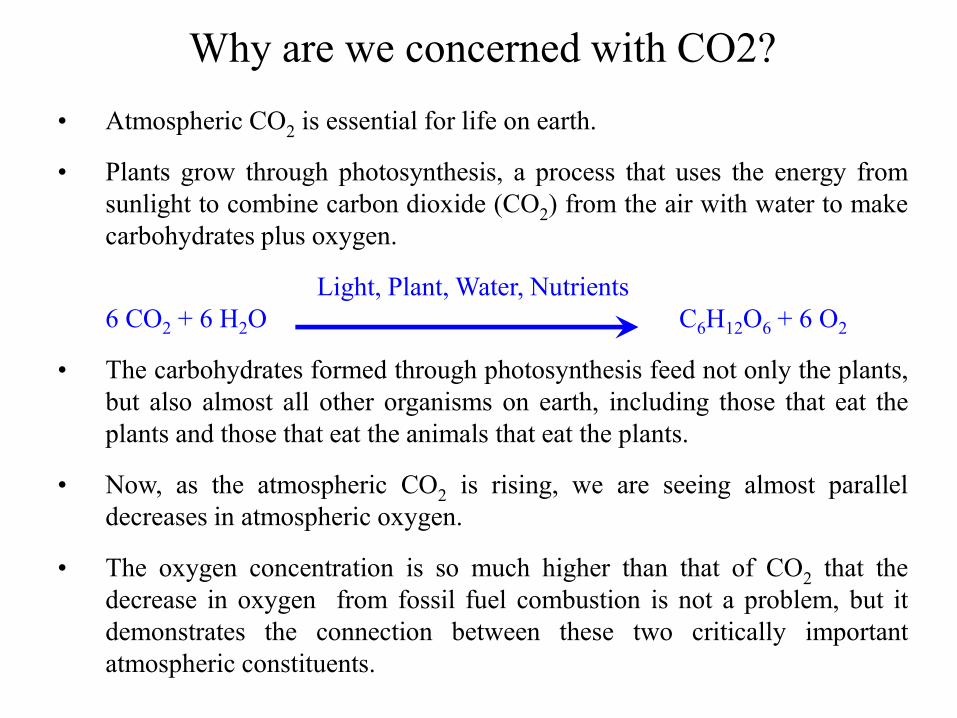
Why are we concerned with CO2?• Atmospheric CO2 is essential for life on earth.
• Plants grow through photosynthesis, a process that uses the energy fromsunlight to combine carbon dioxide (CO2) from the air with water to makecarbohydrates plus oxygen.
Light, Plant, Water, Nutrients6 CO2 + 6 H2O C6H12O6 + 6 O2
• The carbohydrates formed through photosynthesis feed not only the plants,but also almost all other organisms on earth, including those that eat theplants and those that eat the animals that eat the plants.
• Now, as the atmospheric CO2 is rising, we are seeing almost paralleldecreases in atmospheric oxygen.
• The oxygen concentration is so much higher than that of CO2 that thedecrease in oxygen from fossil fuel combustion is not a problem, but itdemonstrates the connection between these two critically importantatmospheric constituents.

CO2
About 250 per sq mm
.
H20
Plant Responses to Atmospheric Carbon Dioxide

Photosynthesis and ManagementResponse to Carbon Dioxide
Preindustrial – 286 ppm1958 – 315 ppm + 29 ppm2013 – 400 ppm + 114 ppm2017 – 406 ppm + 120 ppm
16% increase in PHS
Between 1958 and 2013
Low High
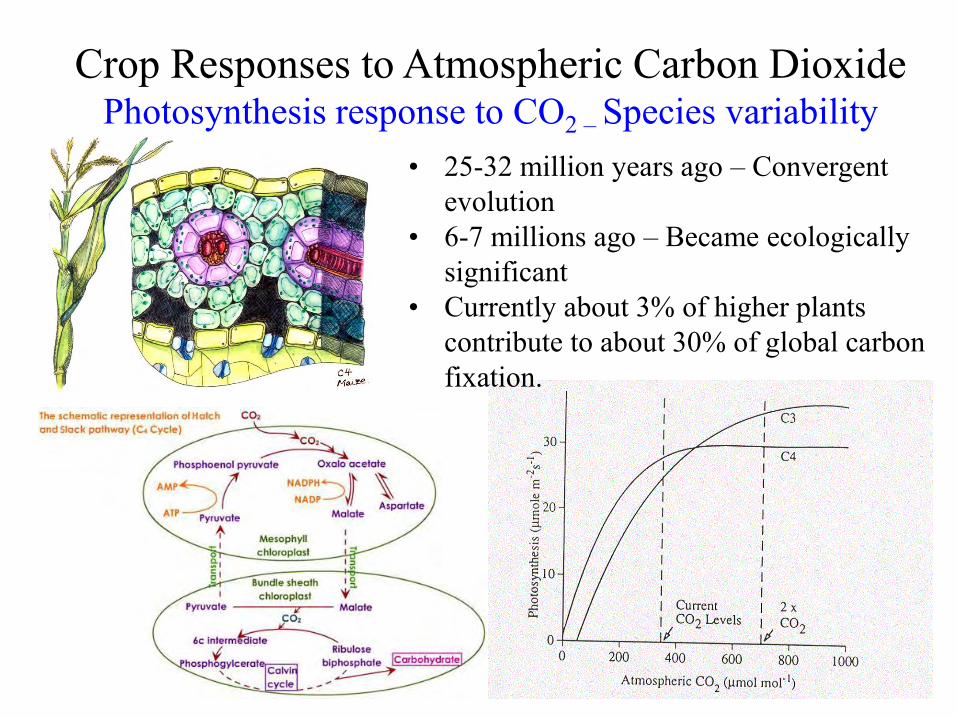
Crop Responses to Atmospheric Carbon Dioxide Photosynthesis response to CO2 – Species variability
• 25-32 million years ago – Convergent evolution
• 6-7 millions ago – Became ecologically significant
• Currently about 3% of higher plants contribute to about 30% of global carbon fixation.

A Hierarchy of Plant Responses to CO2 – C3 Plants
Atmospheric CO2
Growth and Development
Photosynthesis
Carbon Availability
Stomatal Resistance
Transpiration
Tissue Water Potential
Acock, 1990
?Photorespiration
Tissue Temperature
Yield

Plant Adaptations to Atmospheric Carbon Dioxide
Direct effect of increased CO2 on crop photosynthesis might lead to higher global food production
Weeds: Plants are NOT unique and UNIFORM in stimulation of their photosynthesis by elevated CO2.
Losses to Pests: Several recent studies show that insects eat more high-CO2 grown material because of decreased protein levels.
Climate: The connection between CO2 and climate is increasingly well understood, with vast majority of evidence indicating that continued build up of these radiative gases causes gradual warming, and other changes in climate.
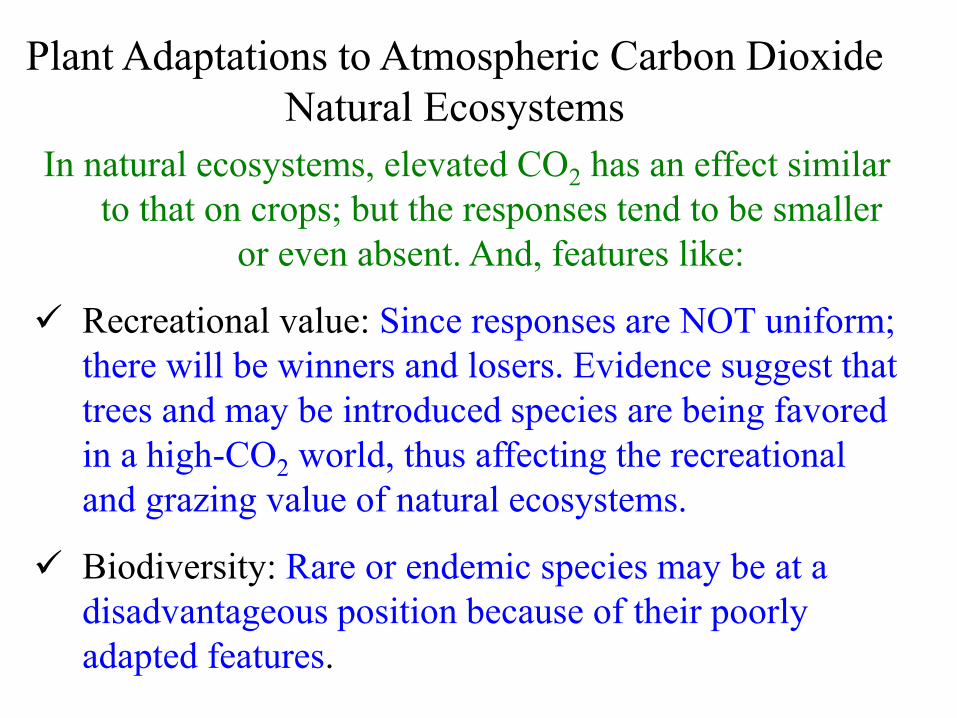
Plant Adaptations to Atmospheric Carbon Dioxide Natural Ecosystems
In natural ecosystems, elevated CO2 has an effect similar to that on crops; but the responses tend to be smaller
or even absent. And, features like:
Recreational value: Since responses are NOT uniform; there will be winners and losers. Evidence suggest that trees and may be introduced species are being favored in a high-CO2 world, thus affecting the recreational and grazing value of natural ecosystems.
Biodiversity: Rare or endemic species may be at a disadvantageous position because of their poorly adapted features.

Global Carbon FluxesGlobal carbon emissions and Carbon fixation

Global Carbon Dioxide ConcentrationsTemporal trends in CO2 from 1750 to 2000
Ice-core data and Mauna Loa (HI) measurements
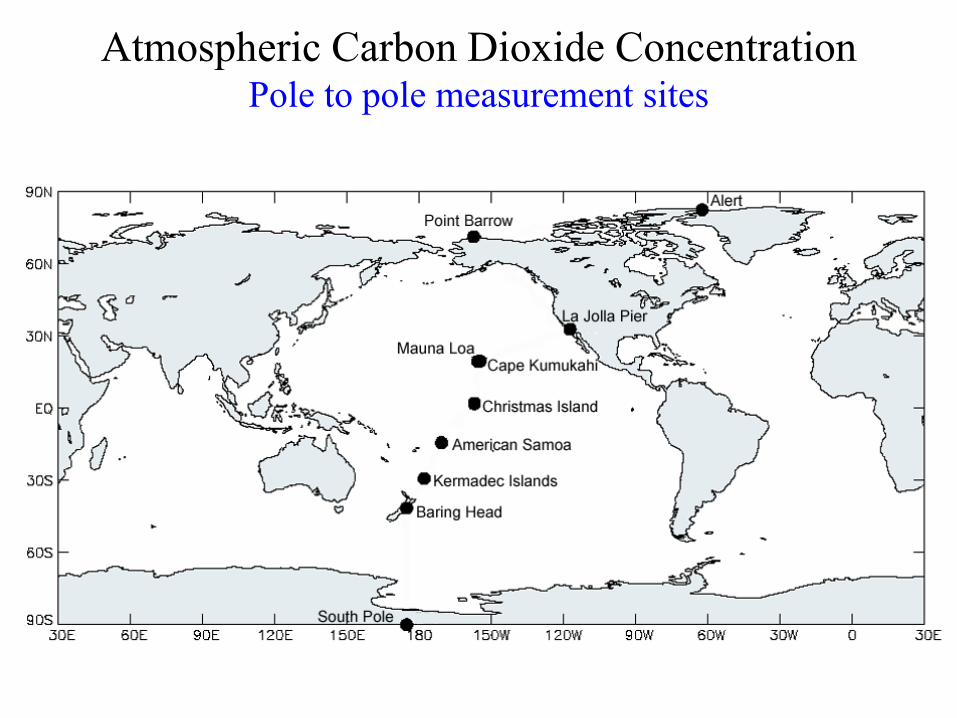
Atmospheric Carbon Dioxide ConcentrationPole to pole measurement sites

Year1957 1962 1967 1972 1977 1982 1987 1992 1997 2002 2007At
mos
pher
ic C
arbo
n D
ioxi
de C
once
ntra
tion,
µm
ol m
ol-1
300
320
340
360
380
400Mauna Loa, HIBarrow, AlaskaCap Matatula SamoaSouth PoleAlert, CanadaCape KumukahiBaring Head NZChristmas IslandKermadec IslandLo Jolla Pier
Atmospheric Carbon Dioxide ConcentrationTemporal trends in CO2 concentration from pole to pole

Global Carbon Dioxide ConcentrationsTrends – Atmospheric Carbon Dioxide – Monthly

Global Carbon Dioxide ConcentrationsDiurnal trends in CO2 – Starkville, 27 July 1999
Time of the Day (Central Standard Time)0 2 4 6 8 10 12 14 16 18 20 22 24
CO
2 Con
cent
ratio
n, p
pm
340
360
380
400
420
440
23 July 1999

Global Carbon Dioxide ConcentrationsTemporal trends in CO2 years before the Industrial revolution
(1850)

Global Circulation ModelsPredictive capabilities – Data requirements

Greenhouse Gases and Climate Change

Global Carbon Dioxide ConcentrationsProjected trends

Future trends in global carbon dioxide concentration and associated climate change,
if no interventions are made
Climate variable 2025 2050 2100
Carbon dioxide concentration
405-460 ppm
445-640 ppm
540-970 ppm
Global mean temperature change from the year 1990
0.4-1.1oC
0.8-2.6oC
1.4-5.8oC
Global mean sea-level rise from the year 1990
3-14cm
5-32cm
9-88cm

Predicted Annual Temperature Increasein GCMs for Doubled CO2 Scenario
Southeast 3.5 4.9Delta 5.3 4.4
Mountain 4.9 5.3Pacific 4.7 4.7
Northern Plains 4.7 5.9Southern Plains 4.4 4.5
GISS GFDLRegion
°C
(Adams et al., 1990)

Our biosphereis changing

Global Carbon Emissions Sources
Year1700 1750 1800 1850 1900 1950 2000
CO
2 C
once
ntra
tion,
ppm
250
275
300
325
350
375
400
Glo
bal c
arbo
n em
issi
on, b
illion
Mt.
C
0
2
4
6
8
10
12
Annu
al fl
ux o
f car
bon
from
land
-use
cha
nge,
Pg
C
0
1
2
3
4
5Preindustrial -1850 = 286 ppmCurrent, 2008 = 386 ppm Difference = 100 pmm
Preindustrial -1850 = 0.005 billion Mt.Current, 2005 = 7.99 billion Mt. Difference = 7.93 billion Mt.
Preindustrial -1850 = 501 Tg CCurrent, 2005 = 1467 Tg C Difference = 967 Tg
Year1750 1775 1800 1825 1850
Milli
on m
etric
tons
of c
arbo
n
0
10
20
30
40
50
60

Atmospheric Carbon Dioxide ConcentrationCause of recent increases in Atmospheric CO2 concentration

Global Carbon Emissions

Global Carbon EmissionsTop 20 Countries
ChinaUSARus
siaIndiaJa
pan
German
y UK
Canad
a
South
KoreaIta
lyIra
n
Mexico
South
Africa
France
Saudi
Arabia
Austra
liaBraz
ilSpa
in
Indon
esia
Ukraine
Annu
al C
O2
emis
sion
s, M
illion
Mt.
0
1000
20005000
6000
7000
2009 = 28,431.5 Million Mt.

Climate Change and Crop ProductionCO2, NPK Use, Cotton Acreage and Yields
Year1860 1880 1900 1920 1940 1960 1980 2000
Cot
ton
Lint
Yie
ld, k
g ha
-1
100
200
300
400
500
600
700
800
900
US
NP
K U
se, M
illio
n to
ns
0
5
10
15
20
25
30
35
40
Cot
ton
Har
vest
ed A
rea,
ha
(*10
00)
2000
4000
6000
8000
10000
12000
14000
16000
18000
20000
[CO
2], µ
mol
CO
2 mol
-1
280
300
320
340
360
380
Area
Yield
NPK use
CO2

Cotton Yield TrendsBest management practices, genetics, CO2
Relative contributions
Year1920 1930 1940 1950 1960 1970 1980 1990 2000
Rel
ativ
e R
espo
nse
0
1
2
3
4
5 Yield
Genetics
CO2
• 1940 (306) to 1997 (364) = 58 ppm CO2could increase yield by about 19%.
• Genetics to about 50%.
• N use efficiency about 10%.
• Best management practices (BMP’s) about 270%.
Ref: Reddy et al. 2000. Crop
ecosystem responses to
Climatic change: Cotton. In:
Climate Change and Global
Crop Productivity, Ed. KR
Reddy and HF Hodges, CABI,
UK, page 161-187.

Atmospheric [CO2] and Grain Quality
Declines of protein (-10.3%), minerals essential for humans, including iron and zinc (-8 for Fe, and 5.1% for Zn), and B vitamin complex (−17.1 for B1-Thiamine, −16.6% for B2 –foliate, −12.7% for B5 - pantothenic acid, and −30.3% B9 foliate), have been reported for crops in response to rising atmospheric carbon dioxide concentration, [CO2].
Protein Minerals (Fe and Zn) B Vitamin Complex

Summary
Atmospheric CO2 is a critical component of the atmosphere.
Increases in CO2 will have both positive and negative impacts on agriculture and natural ecosystems.
The negative impacts expressed through climate change and global warming affect not only agriculture but also other sectors.
Overall, increasing CO2 is likely to have serious consequences.

Summary
It is extremely unlikely that terrestrial uptake of CO2will be sufficient to prevent these climate problems.
A major adaptive response for agriculture ecosystems will be breeding or designing new cultivars: heat-and-cold and drought resistance crop varieties that may be better adapted to new climate (short-term fixes).
Plants in the natural ecosystems will have to cope with changes in climate and adapt accordingly.
Additional steps to limit CO2 emission by world’s nations is another possibility (long-term strategies).

Future Concerns and Promises
Permafrost, covering about 15 million km2 land surface and 24% of the land area in the Northern Hemisphere, is considered soil, rock or sediment that is frozen for more than two consecutive years.
When permafrost degrades (melts), there are impacts on drainage, ground water, river runoffs, ecological systems (such as plants and ponds), release of carbon that has been sequestered in the frozen soil, and infrastructure (such as houses, roads, airports, pipelines, and other facilities based on permafrost.
Time series of annual permafrost temperatures (b and c) measured from north to south across Alaska (a) in the continuous and (b) in the discontinuous permafrost zones [From V. Romanovsky, Arctic Report Card 2012]
Alaska, USA

Future Concerns and Promises
• Sketch of the modules used in technical photosynthesis of 1-butanol and 1-hexanol from CO2 and H2O.• Solar-powered electrochemical reduction of CO2 and H2O to syngas, followed by fermentation, could lead to
sustainable production of useful chemicals. However, due to insufficient electric current densities and instabilities of current CO2-to-CO electrolysers, a practical, scalable artificial photosynthesis remains a major challenge.
Technical photosynthesis --- Nature Catalysis, 2018, 1: 32-39.

Future Concerns and PromisesSynthetic glycolate metabolism pathways stimulate crop growth and
productivity in the field
Alternative photorespiratory pathways in tobacco. Three alternative pathways [1 (red), 2 (dark blue), and 3(light blue)] introduced into tobacco chloroplasts for more efficient recycling of glycolate. RNAi suppresses the native glycolate/glyceratetransporter PLGG1 to prevent glycolate from leaving the chloroplast and entering the native pathway (gray). https://science.sciencemag.org/content/363/6422/eaat9077.full.pdf
• Photorespiration can reduce C3 crop photosynthetic efficiency by 20 to 50%.
• Recent studies found that engineering more efficient photorespiratorypathways into tobacco while inhibiting the native pathway markedly increased both photosynthetic efficiency and vegetative biomass.

Suggested Reading Material:
1. Climate Change and the Global Harvest. C. Rosenzweig and D. Hillel. 1998. Oxford University Press, pages 1-69.
2. Climate change and variability by L. O. Mearns. In: Climate Change and Global Crop Productivity, edited by K. R. Reddy and H. F. Hodges. 2000. Pages 7-35.
3. Agricultural contribution to Greenhouse gas emissions by D. C. Reicosky, J. L. Hatfield and R. L. Sass. In: Climate Change and Global Crop Productivity, edited by K. R. Reddy and H. F. Hodges. 2000. Pages 37-55.
Recommended