Environmental Analyses
Shimadzu Analysis Guidebook
C180-E058C
Index
2.16 Analysis of Sulfurous Acid Ions in Rainwater - LC ------------------------------------- 722.17 Analysis of Anions in Snow Water - Ion Chromatograph ----------------------------- 732.18 Analysis of Anions in Seawater - LC ----------------------------------------------------- 742.19 Analysis of Ammonia Ions in Seawater - LC -------------------------------------------- 752.20 Analysis of Inorganic Components in Seawater (1) - ICP-AES ----------------------- 76
Analysis of Inorganic Components in Seawater (2) - ICP-AES ----------------------- 772.21 Analysis of Inorganic Components in Underground Water -ICP-AES --------------- 782.22 Analysis of Microcystins in Blue-green Algae (1) - LC -------------------------------- 79
Analysis of Microcystins in Blue-green Algae (2) - LC -------------------------------- 802.23 High-Sensitivity Analysis of Bisphenol A in Environment Water (1) - LC ----------- 81
High-Sensitivity Analysis of Bisphenol A in Environment Water (2) - LC ----------- 822.24 Analysis of Alkyl Mercury Compound (1) - GC ----------------------------------------- 83
Analysis of Alkyl Mercury Compound (2) - GC ----------------------------------------- 842.25 Analysis of Microcystins using GC/MS - GC/MS --------------------------------------- 852.26 Analysis of Volatile Organic Compounds (VOCs) (P/T Method) - GC/MS ----------- 862.27 Reducing Time for the Analysis of VOCs in Water using Purge&Trap GC/MS - GC/MS ----- 872.28 Analysis of Estradiol - GC/MS ------------------------------------------------------------ 88
3. Wastewater
3. 1 Analysis of Anions in Wastewater - Ion Chromatograph ------------------------------ 893. 2 Analysis of Volatile Organic Compounds (VOCs) in Wastewater - GC --------------- 903. 3 Analysis of Inorganic Components in Wastewater (1) - ICP/MS --------------------- 91
Analysis of Inorganic Components in Wastewater (2) - ICP/MS --------------------- 92
4. Atmosphere4. 1 Analysis of Acidic Substances in Exhaust Gas - Ion Chromatograph ---------------- 934. 2 Analysis of Tolylenediisocyanate (TDI) in Work Environment Monitoring (1) - LC -------- 94
Analysis of Tolylenediisocyanate (TDI) in Work Environment Monitoring (2) - LC -------- 954. 3 Analysis of Aldehyde / Ketonic products in Exhaust Gas - LC ------------------------ 964. 4 Analysis of Aldehyde / Ketonic products in Room Atmosphere (1) - LC ------------ 97
Analysis of Aldehyde / Ketonic products in Room Atmosphere (2) - LC ------------ 984. 5 Analysis of Aldehydes in Atmosphere (1) - GC ----------------------------------------- 99
Analysis of Aldehydes in Atmosphere (2) - GC --------------------------------------- 1004. 6 Analysis of Formaldehyde in Room Atmosphere - UV ------------------------------- 1014. 7 Analysis of Volatile Organic Compounds (VOCs) in Atmosphere (1) - Solid-phase Adsorption & Thermal Desorption GC/MS --- 102
Analysis of Volatile Organic Compounds (VOCs) in Atmosphere (2) - Solid-phase Adsorption & Thermal Desorption GC/MS ---- 1034. 8 Analysis of Volatile Organic Compounds (VOCs) in Atmosphere (1) - Container Collection Method GC/MS ---- 104
Analysis of Volatile Organic Compounds (VOCs) in Atmosphere (2) - Container Collection Method GC/MS ---- 1054. 9 Automatic Analysis of Micro Amount of N2O in Atmosphere - GC ----------------- 1064.10 Analysis of Inorganic Components in Atmospheric Dust - ICP-AES --------------- 1074.11 Analysis of Inorganic Components in Atmospheric Dust (1) - ICP/MS ------------ 108
Analysis of Inorganic Components in Atmospheric Dust (2) - ICP/MS ------------ 1094.12 Analysis of Inorganic Components in Fly Ash (1) - ICP/MS ------------------------- 110
Analysis of Inorganic Components in Fly Ash (2) - ICP/MS ------------------------- 111
5. Industrial Waste5. 1 Analysis of PCBs in Insulating Oil - GC ------------------------------------------------ 1125. 2 Measurement of Metals in Industrial Waste - AA ------------------------------------- 1135. 3 Screening of Waste Plastic Material using Horizontal ATR (1) - FTIR ------------- 114
Screening of Waste Plastic Material using Horizontal ATR (2) - FTIR ------------- 1155. 4 Analysis of Inorganic Components in Fly Ash - ICP/MS ----------------------------- 1165. 5 Determination of Asbestos in Admixture for Mortar - TA ---------------------------- 1175. 6 Analysis of Asbestos - XRD ------------------------------------------------------------- 1185. 7 X-ray Fluorescence Spectrometric Analysis of Industrial Waste (Sludge) - XRF ---- 119
6. Others6. 1 Easy Analysis of Residual MTBE in Soil (HS Method) - GC ------------------------- 1206. 2 Analysis of Organic Tin in Seawater and Fish (1) - GC/MS, GC --------------------- 121
Analysis of Organic Tin in Seawater and Fish (2) - GC/MS, GC --------------------- 1226. 3 Analysis of Volatile Organic Compounds (VOCs) in Soil (HS, P/T Method) (1) - GC/MS -- 123
Analysis of Volatile Organic Compounds (VOCs) in Soil (HS, P/T Method) (2) - GC/MS -- 1246. 4 Analysis of Metals in Soil - AA ---------------------------------------------------------- 1256. 5 Analysis of Chromium in Soil using Atomic Absorption Spectrometry - AA ------ 1266. 6 Analysis of Non-agitated Soil Core Sample using Microscopic FTIR (1) - FTIR -- 127
Analysis of Non-agitated Soil Core Sample using Microscopic FTIR (2) - FTIR -- 1286. 7 Analysis of Inorganic Components in Soil (1) - ICP/MS ----------------------------- 129
Analysis of Inorganic Components in Soil (2) - ICP/MS ----------------------------- 1306. 8 Analysis of Inorganic Components in Pond Sediment - ICP-AES ------------------ 1316. 9 Analysis of Inorganic Components in Sewage Sludge (1) - ICP-AES, ICP/MS ---- 132
Analysis of Inorganic Components in Sewage Sludge (2) - ICP-AES, ICP/MS ---- 133
W
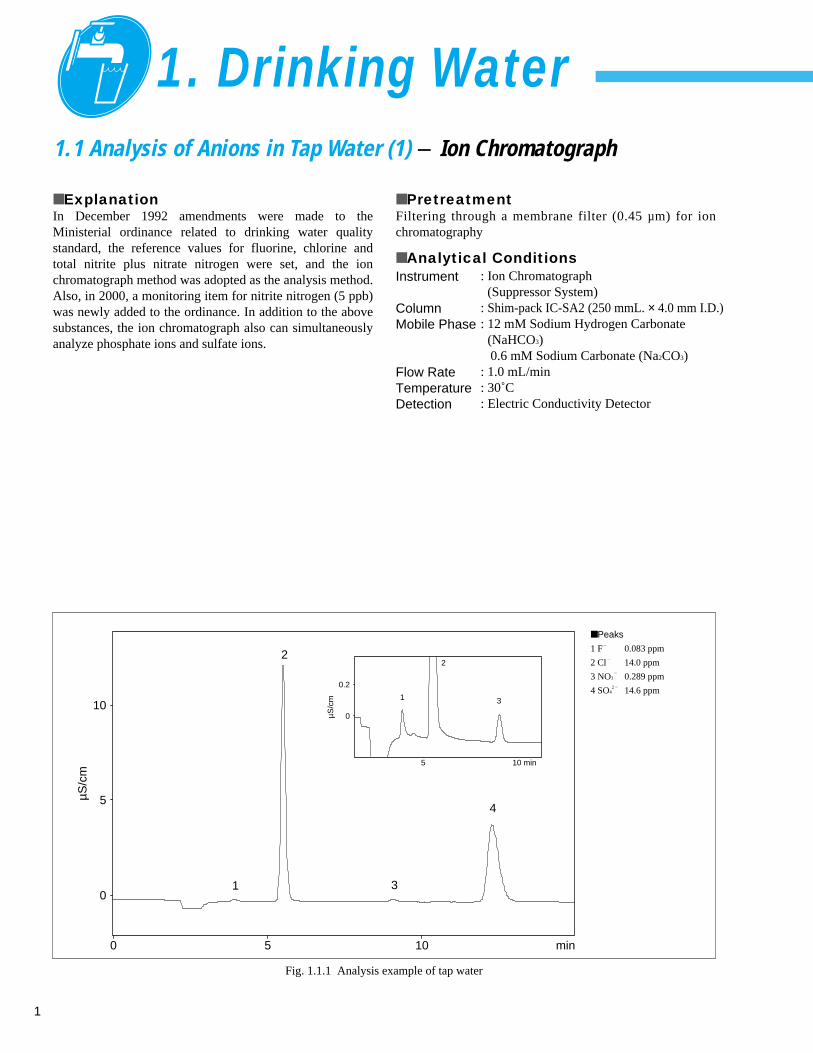
1. Drinking Water1. 1 Analysis of Anions in Tap Water (1) - Ion Chromatograph ----------------------------- 1
Analysis of Anions in Tap Water (2) - Ion Chromatograph ----------------------------- 21. 2 Analysis of Cations in Tap Water (1) - Ion Chromatograph ---------------------------- 3
Analysis of Cations in Tap Water (2) - Ion Chromatograph ---------------------------- 41. 3 Analysis of Carbofuran, Methomyl, and Carbaryl - LC ---------------------------------- 51. 4 Analysis of Diquat - LC ------------------------------------------------------------------------ 61. 5 Analysis of Iprodione, Asulam, Thiophanate-methyl, and Siduron - LC ------------------- 71. 6 Analysis of Iminoctadine Triacetate - LC ------------------------------------------------- 81. 7 Analysis of Glyphosate - LC ----------------------------------------------------------------- 91. 8 Analysis of Controlled Pesticides in Tap Water using Online Solid-Phase Extraction LC/MS - LC/MS --- 101. 9 Simultaneous Analysis of Pesticides Covered by the Water Quality Control Standards using LC/MS (1) - LC/MS --- 11
Simultaneous Analysis of Pesticides Covered by the Water Quality Control Standards using LC/MS (2) - LC/MS --- 12Simultaneous Analysis of Pesticides Covered by the Water Quality Control Standards using LC/MS (3) - LC/MS --- 13
1.10 Simultaneous Analysis of Pesticides Covered by the Water Quality Control Standards using GC/MS (1) - GC/MS --- 14Simultaneous Analysis of Pesticides Covered by the Water Quality Control Standards using GC/MS (2) - GC/MS --- 15
1.11 Analysis of Bromate by Post-Column Ion Chromatography (1) - LC ---------------- 16Analysis of Bromate by Post-Column Ion Chromatography (2) - LC ---------------- 17
1.12 Speciation Analysis of Cyanogen Compounds by Post-Column Ion Chromatography (1) - LC --- 18Speciation Analysis of Cyanogen Compounds by Post-Column Ion Chromatography (2) - LC --- 19
1.13 Analysis of Nitrite Nitrogen - Ion Chromatograph -------------------------------------- 201.14 Analysis of Chlorite, Chlorate, and Chlorine Dioxide - Ion Chromatograph --------- 211.15 Analysis of Isocyanuric Acid - LC ------------------------------------------------------------ 221.16 Analysis of Anionic Surfactants - LC ---------------------------------------------------- 231.17 Analysis of Microcystins using Online Solid-Phase Extraction LC/MS - LC/MS ---- 241.18 Analysis of Chloral Hydrate and Haloacetonitriles (1) - GC/MS ---------------------- 25
Analysis of Chloral Hydrate and Haloacetonitriles (2) - GC/MS ---------------------- 261.19 Solvent Extraction and GC/MS Analysis of Haloacetic Acids in Water - GC/MS ---- 271.20 Solid-Phase Extraction, Derivatization, and GC/MS Analysis of Phenols in Water - GC/MS ---- 281.21 Solid-Phase Extraction and GC/MS Analysis of 1,4-Dioxane in Water - GC/MS ---- 291.22 Headspace Analysis of 1,4-Dioxane in Water - GC/MS -------------------------------- 301.23 Simultaneous Analysis of 1,4-Dioxane and VOCs in Water using Purge&Trap GC/MS - GC/MS --- 311.24 Analysis of the Components Controlled under the Waterworks Law with a Single Column (1) - GC/MS --- 32
Analysis of the Components Controlled under the Waterworks Law with a Single Column (2) - GC/MS --- 33Analysis of the Components Controlled under the Waterworks Law with a Single Column (3) - GC/MS --- 34
1.25 Analysis of Volatile Organic Compounds (VOCs) in Tap Water (1) - Purge & Trap GC/MS -- 35Analysis of Volatile Organic Compounds (VOCs) in Tap Water (2) - Purge & Trap GC/MS -- 36
1.26 Simultaneous Analysis of Monitored VOCs in Water using Purge&Trap GC/MS - GC/MS --- 371.27 Analysis of Musty Smelling Components in Tap Water (P/T Method) (1) - GC/MS ---- 38
Analysis of Musty Smelling Components in Tap Water (P/T Method) (2) - GC/MS ---- 391.28 Analysis of Musty Smelling Components in Tap Water (HS Method) - GC/MS ---- 401.29 Analysis of Musty Smelling Components in Tap Water (SPME Method) - GC/MS ---- 411.30 Headspace–GC/MS Analysis of Fishy Smelling Components in Water - GC/MS --- 421.31 Analysis of Acrylamide in Water (1) - GC, GC/MS ------------------------------------- 43
Analysis of Acrylamide in Water (2) - GC, GC/MS ------------------------------------- 441.32 Analysis of Ethylenediamine Tetraacetic Acid (EDTA) - GC/MS ---------------------- 451.33 TOC Analysis of Chlorinated Isocyanuric Acid - TOC ---------------------------------- 461.34 TOC Analysis of Leachate from Water Pipes - TOC ------------------------------------ 471.35 TOC Analysis of Mineral Water and Raw Water - TOC --------------------------------- 481.36 Direct Analysis of As in Tap Water and River Water - AA ----------------------------- 491.37 Direct Analysis of Pb in Tap Water and River Water - AA ----------------------------- 501.38 Analysis of Inorganic Components in Water - ICP/MS -------------------------------- 511.39 Analysis of Nonionic Surfactants by Solid-Phase Extraction – Absorption Spectrophotometry - UV --- 52
2. Environment Water2. 1 Analysis of Anions in River Water (1) - Ion Chromatograph -------------------------- 53
Analysis of Anions in River Water (2) - Ion Chromatograph -------------------------- 542. 2 Analysis of Cations in River Water (1) - Ion Chromatograph ------------------------- 55
Analysis of Cations in River Water (2) - Ion Chromatograph ------------------------- 562. 3 Analysis of Anions in Lake Water - Ion Chromatograph ------------------------------ 572. 4 Analysis of Cations in Lake Water - Ion Chromatograph ------------------------------ 582. 5 Analysis of Golf Course Pesticides (1) - LC --------------------------------------------- 59
Analysis of Golf Course Pesticides (2) - LC --------------------------------------------- 602. 6 Analysis of Calcium and Magnesium in River Water - AA ----------------------------- 612. 7 Analysis of Zinc in River Water - AA ----------------------------------------------------- 622. 8 Direct Analysis of Cd and Cr in Seawater - AA ----------------------------------------- 632. 9 Measurement of Total Phosphorus in Water Solution by Absorption Spectrophotometry- UV --- 642.10 Analysis of Inorganic Components in River Water (1) - ICP-AES -------------------- 65
Analysis of Inorganic Components in River Water (2) - ICP-AES -------------------- 662.11 Analysis of Inorganic Components in River Water- ICP/MS -------------------------- 672.12 Analysis of Cations in Hot Spring Water - Ion Chromatograph ----------------------- 682.13 Speciation Analysis of Arsenic in Hot Spring Water - AA ----------------------------- 692.14 Analysis of Anions in Rainwater - Ion Chromatograph -------------------------------- 702.15 Analysis of Cations in Rainwater - Ion Chromatograph ------------------------------- 71
1
1. Drinking Water1.1 Analysis of Anions in Tap Water (1) - Ion Chromatograph
■ ExplanationIn December 1992 amendments were made to theMinisterial ordinance related to drinking water qualitystandard, the reference values for fluorine, chlorine andtotal nitrite plus nitrate nitrogen were set, and the ionchromatograph method was adopted as the analysis method.Also, in 2000, a monitoring item for nitrite nitrogen (5 ppb)was newly added to the ordinance. In addition to the abovesubstances, the ion chromatograph also can simultaneouslyanalyze phosphate ions and sulfate ions.
■ PretreatmentFiltering through a membrane filter (0.45 µm) for ionchromatography
■ Analytical Conditions
min0 5 10
µS/c
m
5
10
01
2
3
4
5
µS/c
m
10 min
0.2
0
1
2
3
Fig. 1.1.1 Analysis example of tap water
■ Peaks
1 F–
0.083 ppm
2 Cl–
14.0 ppm
3 NO3–
0.289 ppm
4 SO42 – 14.6 ppm
Instrument
ColumnMobile Phase
Flow RateTemperatureDetection
: Ion Chromatograph (Suppressor System)
: Shim-pack IC-SA2 (250 mmL. × 4.0 mm I.D.) : 12 mM Sodium Hydrogen Carbonate
(NaHCO3)0.6 mM Sodium Carbonate (Na2CO3)
: 1.0 mL/min: 30˚C: Electric Conductivity Detector
2
0 10 (min)
12
4
3 5
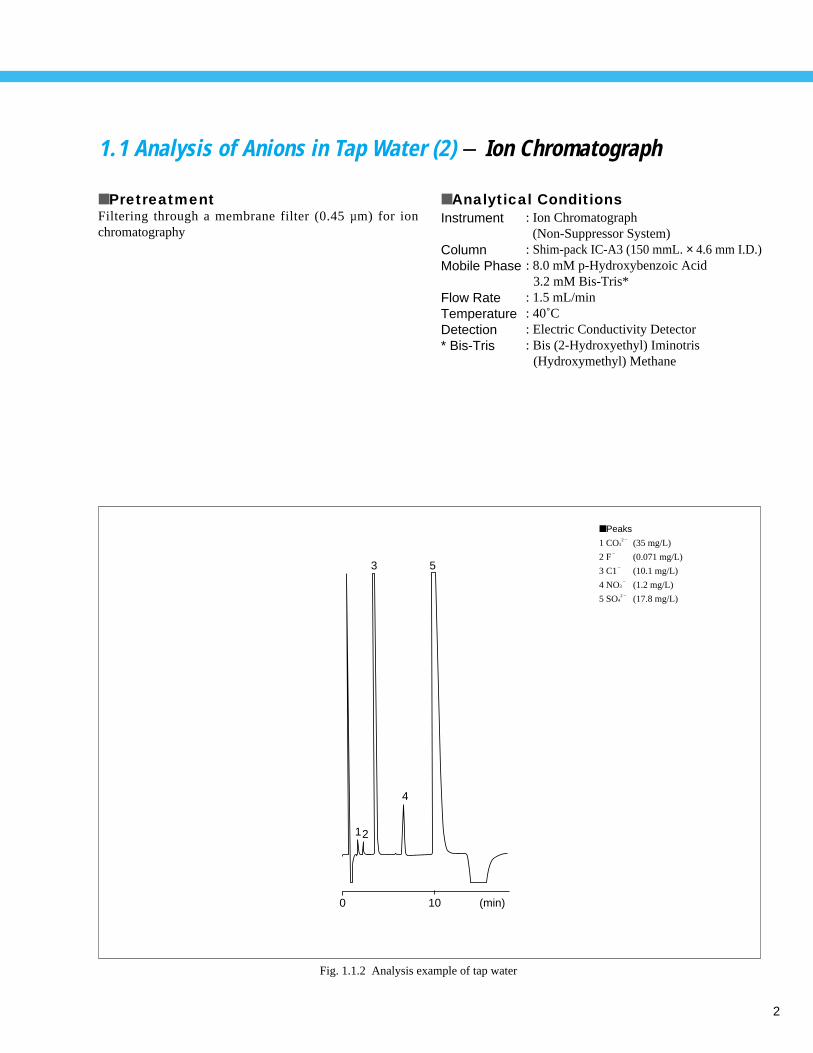
1.1 Analysis of Anions in Tap Water (2) - Ion Chromatograph
■ PretreatmentFiltering through a membrane filter (0.45 µm) for ionchromatography
■ Analytical Conditions
Fig. 1.1.2 Analysis example of tap water
■ Peaks
1 CO32 – (35 mg/L)
2 F–
(0.071 mg/L)
3 C1–
(10.1 mg/L)
4 NO3–
(1.2 mg/L)
5 SO42 – (17.8 mg/L)
Instrument
ColumnMobile Phase
Flow RateTemperatureDetection* Bis-Tris
: Ion Chromatograph (Non-Suppressor System)
: Shim-pack IC-A3 (150 mmL. × 4.6 mm I.D.): 8.0 mM p-Hydroxybenzoic Acid
3.2 mM Bis-Tris*: 1.5 mL/min: 40˚C: Electric Conductivity Detector: Bis (2-Hydroxyethyl) Iminotris
(Hydroxymethyl) Methane
3
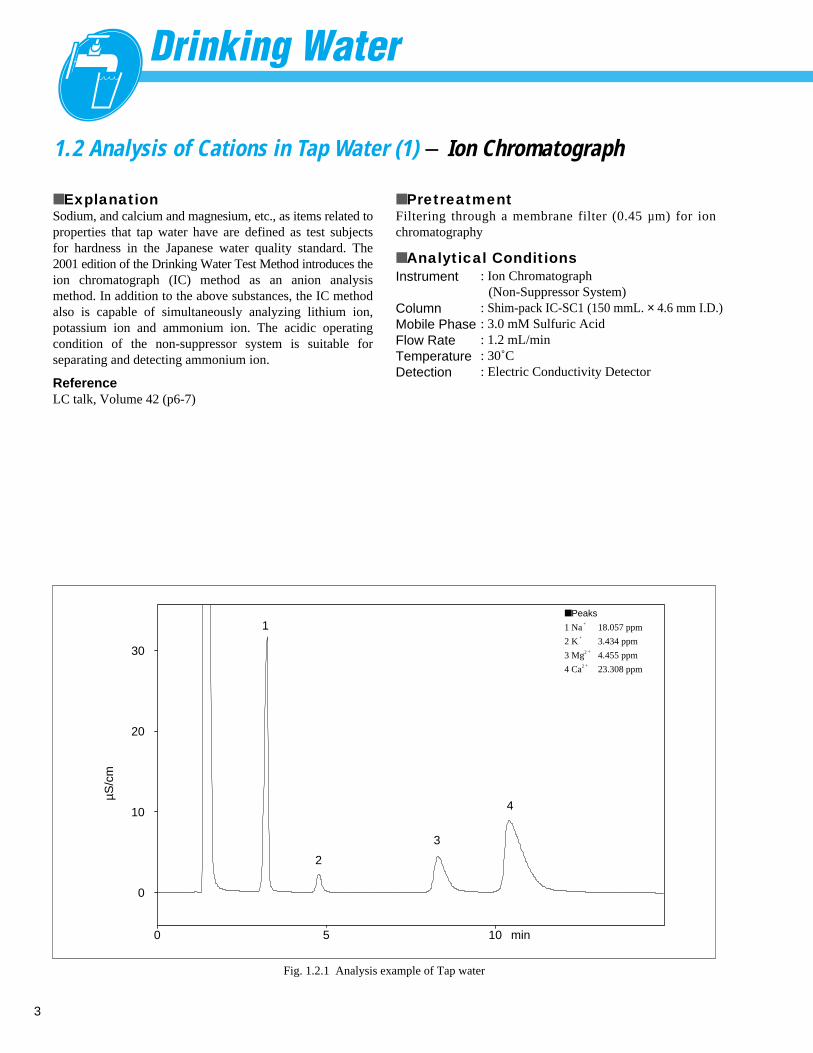
1.2 Analysis of Cations in Tap Water (1) - Ion Chromatograph
■ ExplanationSodium, and calcium and magnesium, etc., as items related toproperties that tap water have are defined as test subjectsfor hardness in the Japanese water quality standard. The2001 edition of the Drinking Water Test Method introduces theion chromatograph (IC) method as an anion analysismethod. In addition to the above substances, the IC methodalso is capable of simultaneously analyzing lithium ion,potassium ion and ammonium ion. The acidic operatingcondition of the non-suppressor system is suitable forseparating and detecting ammonium ion.
ReferenceLC talk, Volume 42 (p6-7)
■ PretreatmentFiltering through a membrane filter (0.45 µm) for ionchromatography
■ Analytical Conditions
min0 5 10
µS/c
m
10
20
30
0
1
2
3
4
Fig. 1.2.1 Analysis example of Tap water
■ Peaks
1 Na+
18.057 ppm
2 K+
3.434 ppm
3 Mg2 + 4.455 ppm
4 Ca2 + 23.308 ppm
Instrument
ColumnMobile PhaseFlow RateTemperatureDetection
: Ion Chromatograph (Non-Suppressor System)
: Shim-pack IC-SC1 (150 mmL. × 4.6 mm I.D.): 3.0 mM Sulfuric Acid: 1.2 mL/min: 30˚C: Electric Conductivity Detector
4
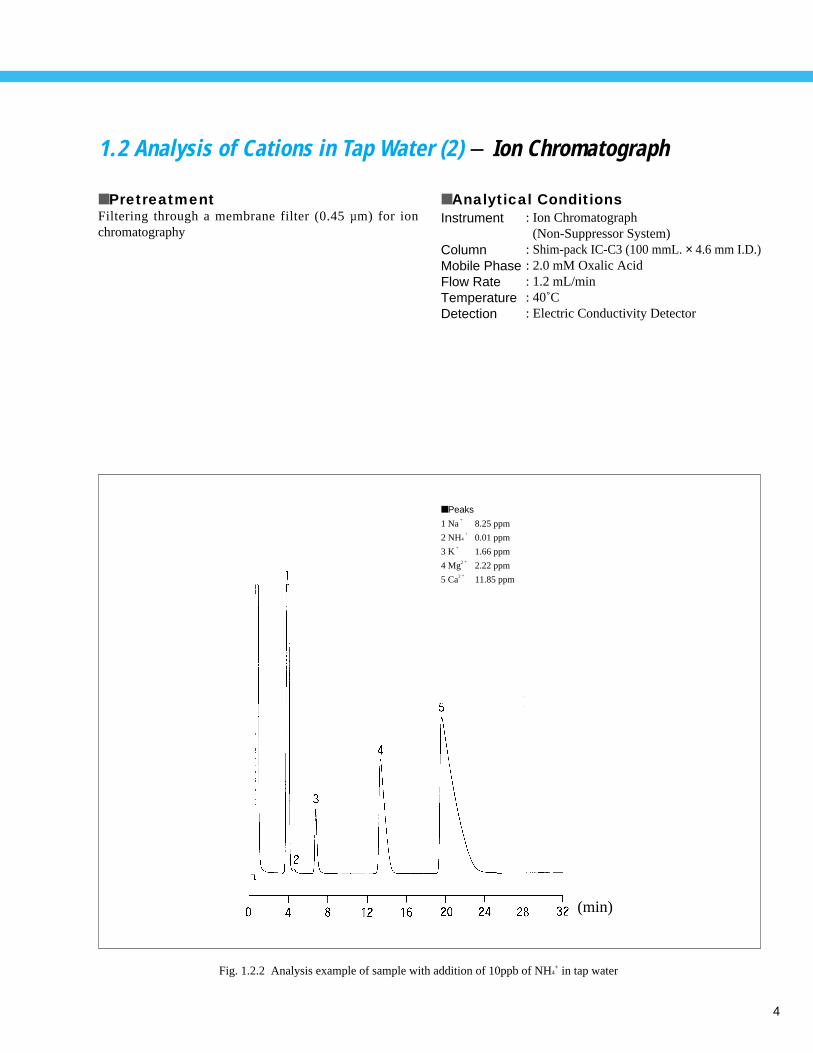
1.2 Analysis of Cations in Tap Water (2) - Ion Chromatograph
■ PretreatmentFiltering through a membrane filter (0.45 µm) for ionchromatography
■ Analytical Conditions
Fig. 1.2.2 Analysis example of sample with addition of 10ppb of NH4+ in tap water
Instrument
ColumnMobile PhaseFlow RateTemperatureDetection
: Ion Chromatograph(Non-Suppressor System)
: Shim-pack IC-C3 (100 mmL. × 4.6 mm I.D.): 2.0 mM Oxalic Acid: 1.2 mL/min: 40˚C: Electric Conductivity Detector
■ Peaks
1 Na+
8.25 ppm
2 NH4+
0.01 ppm
3 K+
1.66 ppm
4 Mg2 + 2.22 ppm
5 Ca2 + 11.85 ppm
(min)
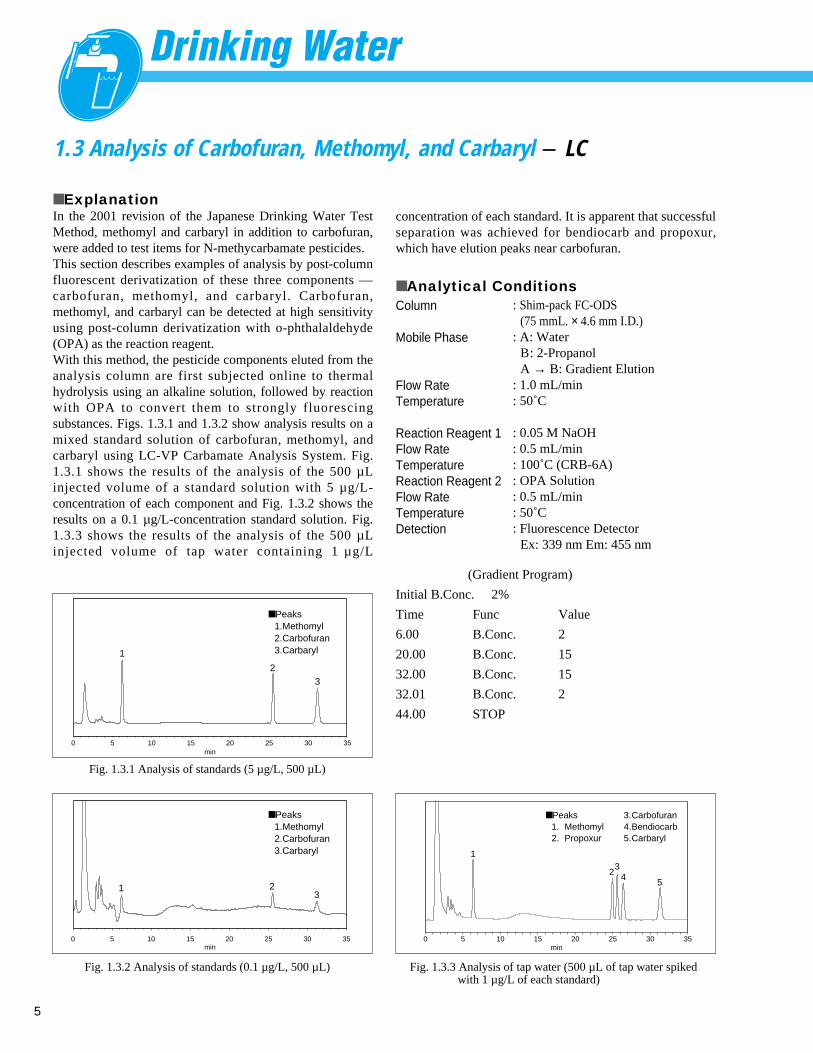
1.3 Analysis of Carbofuran, Methomyl, and Carbaryl - LC
■ ExplanationIn the 2001 revision of the Japanese Drinking Water TestMethod, methomyl and carbaryl in addition to carbofuran,were added to test items for N-methycarbamate pesticides. This section describes examples of analysis by post-columnfluorescent derivatization of these three components ––carbofuran, methomyl, and carbaryl. Carbofuran,methomyl, and carbaryl can be detected at high sensitivityusing post-column derivatization with o-phthalaldehyde(OPA) as the reaction reagent. With this method, the pesticide components eluted from theanalysis column are first subjected online to thermalhydrolysis using an alkaline solution, followed by reactionwith OPA to convert them to strongly fluorescingsubstances. Figs. 1.3.1 and 1.3.2 show analysis results on amixed standard solution of carbofuran, methomyl, andcarbaryl using LC-VP Carbamate Analysis System. Fig.1.3.1 shows the results of the analysis of the 500 µLinjected volume of a standard solution with 5 µ g/L-concentration of each component and Fig. 1.3.2 shows theresults on a 0.1 µg/L-concentration standard solution. Fig.1.3.3 shows the results of the analysis of the 500 µLinjected volume of tap water containing 1 µ g/L
■ Analytical Conditions
5
Column
Mobile Phase
Flow RateTemperature
Reaction Reagent 1 Flow RateTemperatureReaction Reagent 2Flow RateTemperatureDetection
: Shim-pack FC-ODS(75 mmL. × 4.6 mm I.D.)
: A: WaterB: 2-PropanolA → B: Gradient Elution
: 1.0 mL/min: 50˚C
: 0.05 M NaOH: 0.5 mL/min: 100˚C (CRB-6A): OPA Solution: 0.5 mL/min: 50˚C: Fluorescence Detector
Ex: 339 nm Em: 455 nm
min0 5 10 15 20 25 30 35
■ Peaks1.Methomyl2.Carbofuran3.Carbaryl 1
32
Fig. 1.3.1 Analysis of standards (5 µg/L, 500 µL)
■ Peaks1.Methomyl2.Carbofuran3.Carbaryl
min0 5 10 15 20 25 30 35
1 23
Fig. 1.3.2 Analysis of standards (0.1 µg/L, 500 µL)
min0 5 10 15 20 25 30 35
■ Peaks1. Methomyl2. Propoxur
3.Carbofuran 4.Bendiocarb 5.Carbaryl
1
23
45
Fig. 1.3.3 Analysis of tap water (500 µL of tap water spiked with 1 µg/L of each standard)
concentration of each standard. It is apparent that successfulseparation was achieved for bendiocarb and propoxur,which have elution peaks near carbofuran.
(Gradient Program)
Initial B.Conc. 2%
Time Func Value
6.00 B.Conc. 2
20.00 B.Conc. 15
32.00 B.Conc. 15
32.01 B.Conc. 2
44.00 STOP
1.4 Analysis of Diquat - LC
■ ExplanationThe Ministerial Ordinance related to new drinking waterquality control standards was officially announced on 30May 2003 (Japanese Ministry of Health, Labour andWelfare Ordinance 101, implemented 1 April 2004).Subsequently, 27 additional water control target items weredefined to supplement the water quality control standards(Ministry of Health, Labour and Welfare; Health PolicyBureau Ordinance No. 1010004, 10 Oct. 2003) and testmethods notified for them (Ministry of Health, Labour andWelfare; Health Service Bureau Water Supply Div.Ordinance No. 1010001, 10 Oct. 2003). *(1) Water-qualitytarget values are set for 101 pesticides, 11 of which areanalyzed by high-performance liquid chromatography(HPLC). Additional Method 11 defines the test method forone of these pesticides, diquat. This section describesexamples of the analysis of diquat conducted according toAdditional Method 11. Fig. 1.4.1 shows the structure of diquat dibromide. Thediquat target value is 0.005 mg/L. Additional Method 11designates 100x concentration by solid-phase extraction asa pre-treatment operation. *(1) Partial amendment on March 30,2006 (Japan’s Ministry of Health,
Labour and Welfare Ordinance No.0330001)
*(2) In this section, "diquat" indicates diquat dibromide (MW: 344).
6
Fig. 1.4.2 Chromatogram of diquat dibromide
0
0
2
4
6
8
10
mA
U
1
1 2 3 4 5min
■ Peak1 Diquat (0.4 mg/L)
2Br-N+N+
0
mA
U
0.1
0.2
0.3
0.0
-0.1
1 2 3
1
■ Peak1 Diquat (0.005 mg/L)
4 5min
Fig. 1.4.3 Chromatogram of diquat dibromide at high sensitivity
Fig. 1.4.1 Structure of diquat dibromide
■ Analytical ConditionsColumnMobile Phase
Flow RateTemperatureDetectionInjection Volume
: Shim-pack VP-ODS (150 mmL. × 4.6 mm I.D.): Aqueous Solution of 13.5 mL Phosphoric
Acid, 10 mL Diethylamine, and 3.0 g Sodium1-Pentanesulfonate, diluted to 1,000 mL
: 1.0 mL/min: 40˚C: UV Absorbance Detector 313 nm: 50 µL
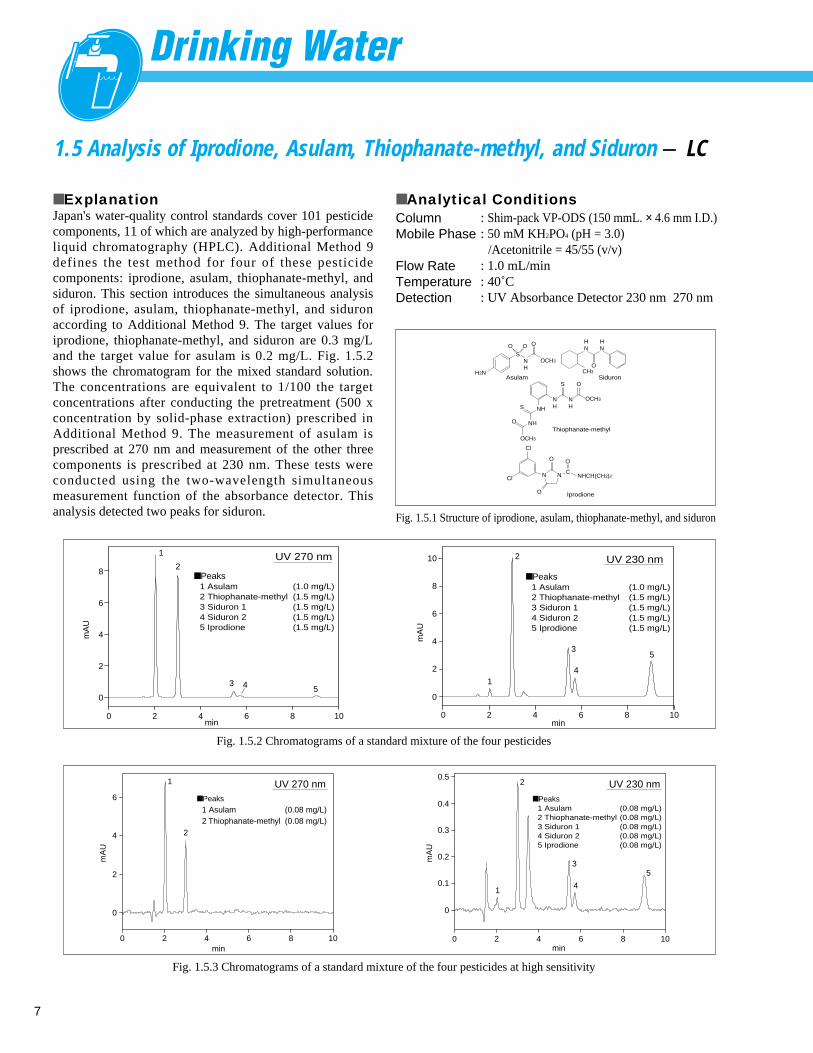
1.5 Analysis of Iprodione, Asulam, Thiophanate-methyl, and Siduron - LC
■ ExplanationJapan's water-quality control standards cover 101 pesticidecomponents, 11 of which are analyzed by high-performanceliquid chromatography (HPLC). Additional Method 9defines the test method for four of these pesticidecomponents: iprodione, asulam, thiophanate-methyl, andsiduron. This section introduces the simultaneous analysisof iprodione, asulam, thiophanate-methyl, and siduronaccording to Additional Method 9. The target values foriprodione, thiophanate-methyl, and siduron are 0.3 mg/Land the target value for asulam is 0.2 mg/L. Fig. 1.5.2shows the chromatogram for the mixed standard solution.The concentrations are equivalent to 1/100 the targetconcentrations after conducting the pretreatment (500 xconcentration by solid-phase extraction) prescribed inAdditional Method 9. The measurement of asulam isprescribed at 270 nm and measurement of the other threecomponents is prescribed at 230 nm. These tests wereconducted using the two-wavelength simultaneousmeasurement function of the absorbance detector. Thisanalysis detected two peaks for siduron.
7
■ Peaks1 Asulam2 Thiophanate-methyl3 Siduron 14 Siduron 25 Iprodione
(0.08 mg/L)(0.08 mg/L)(0.08 mg/L)(0.08 mg/L)(0.08 mg/L)
0 2 4 6 8min
1
2
10
0
2
4
6
mA
U
mA
U
0 2
2
3
4
5
1
4 6 8 10min
0
0.1
0.2
0.3
0.4
0.5
(0.08 mg/L)(0.08 mg/L)
■ Peaks
1 Asulam2 Thiophanate-methyl
UV 270 nm UV 230 nm
Fig. 1.5.3 Chromatograms of a standard mixture of the four pesticides at high sensitivity
(1.0 mg/L)(1.5 mg/L)(1.5 mg/L)(1.5 mg/L)(1.5 mg/L)
■ Peaks1 Asulam2 Thiophanate-methyl3 Siduron 14 Siduron 25 Iprodione
(1.0 mg/L)(1.5 mg/L)(1.5 mg/L)(1.5 mg/L)(1.5 mg/L)
■ Peaks1 Asulam2 Thiophanate-methyl3 Siduron 14 Siduron 25 Iprodione
UV 270 nm UV 230 nm
0
0
2
4
6
8
mA
U
mA
U
2
1
2
3 4 5
4 6 8 10min
0 2 4 6 8 10min
1
2
3
4
5
0
2
4
6
8
10
Fig. 1.5.2 Chromatograms of a standard mixture of the four pesticides
Fig. 1.5.1 Structure of iprodione, asulam, thiophanate-methyl, and siduron
■ Analytical ConditionsColumnMobile Phase
Flow RateTemperatureDetection
: Shim-pack VP-ODS (150 mmL. × 4.6 mm I.D.): 50 mM KH2PO4 (pH = 3.0)
/Acetonitrile = 45/55 (v/v) : 1.0 mL/min: 40˚C: UV Absorbance Detector 230 nm 270 nm
Asulam Siduron
Thiophanate-methyl
Iprodione
H2N
NH
HN
HN
OCH3
OO O
OCH3
NH
OCH3
OS
S
O
Cl
Cl
O
O
NHCH(CH3)2
O
OCH3
S
NH
NH
N N C
NH
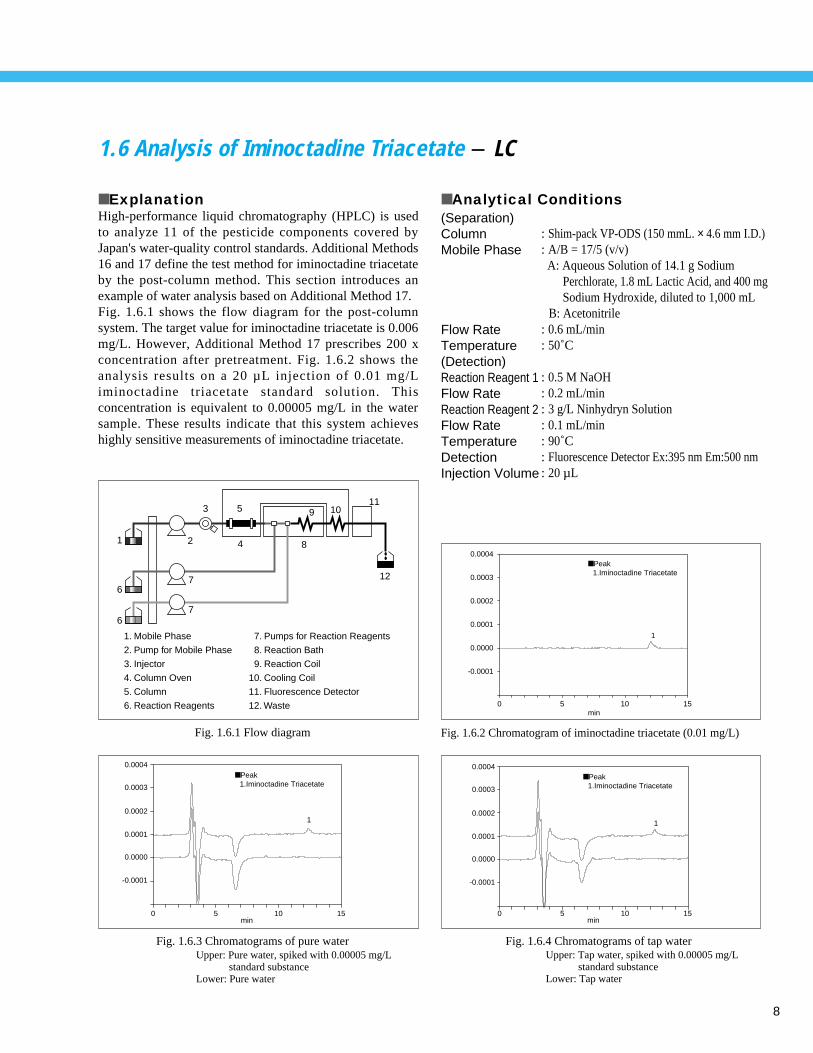
1.6 Analysis of Iminoctadine Triacetate - LC
■ ExplanationHigh-performance liquid chromatography (HPLC) is usedto analyze 11 of the pesticide components covered byJapan's water-quality control standards. Additional Methods16 and 17 define the test method for iminoctadine triacetateby the post-column method. This section introduces anexample of water analysis based on Additional Method 17.Fig. 1.6.1 shows the flow diagram for the post-columnsystem. The target value for iminoctadine triacetate is 0.006mg/L. However, Additional Method 17 prescribes 200 xconcentration after pretreatment. Fig. 1.6.2 shows theanalysis results on a 20 µ L injection of 0.01 mg/Liminoctadine triacetate standard solution. Thisconcentration is equivalent to 0.00005 mg/L in the watersample. These results indicate that this system achieveshighly sensitive measurements of iminoctadine triacetate.
8
1
■ Peak1.Iminoctadine Triacetate
0.0004
0.0003
0.0002
0.0001
0.0000
-0.0001
0 5 10min
15
Fig. 1.6.3 Chromatograms of pure water
1
■ Peak1.Iminoctadine Triacetate
0.0004
0.0003
0.0002
0.0001
0.0000
-0.0001
0 5 10min
15
Fig. 1.6.4 Chromatograms of tap water
1. Mobile Phase
2. Pump for Mobile Phase
3. Injector
4. Column Oven
5. Column
6. Reaction Reagents
7. Pumps for Reaction Reagents
8. Reaction Bath
9. Reaction Coil
10. Cooling Coil
11. Fluorescence Detector
12. Waste
911
8
7
7
6
6
5
12
41 2
3 10
Fig. 1.6.1 Flow diagram
■ Peak1.Iminoctadine Triacetate
1
0.0004
0.0003
0.0002
0.0001
0.0000
-0.0001
0 5 10min
15
Fig. 1.6.2 Chromatogram of iminoctadine triacetate (0.01 mg/L)
Upper: Pure water, spiked with 0.00005 mg/L standard substance
Lower: Pure water
■ Analytical Conditions(Separation)ColumnMobile Phase
Flow RateTemperature(Detection)Reaction Reagent 1Flow RateReaction Reagent 2Flow RateTemperatureDetectionInjection Volume
: Shim-pack VP-ODS (150 mmL. × 4.6 mm I.D.): A/B = 17/5 (v/v)
A: Aqueous Solution of 14.1 g Sodium Perchlorate, 1.8 mL Lactic Acid, and 400 mgSodium Hydroxide, diluted to 1,000 mL
B: Acetonitrile: 0.6 mL/min: 50˚C
: 0.5 M NaOH: 0.2 mL/min: 3 g/L Ninhydryn Solution: 0.1 mL/min: 90˚C: Fluorescence Detector Ex:395 nm Em:500 nm: 20 µL
Upper: Tap water, spiked with 0.00005 mg/L standard substance
Lower: Tap water
9
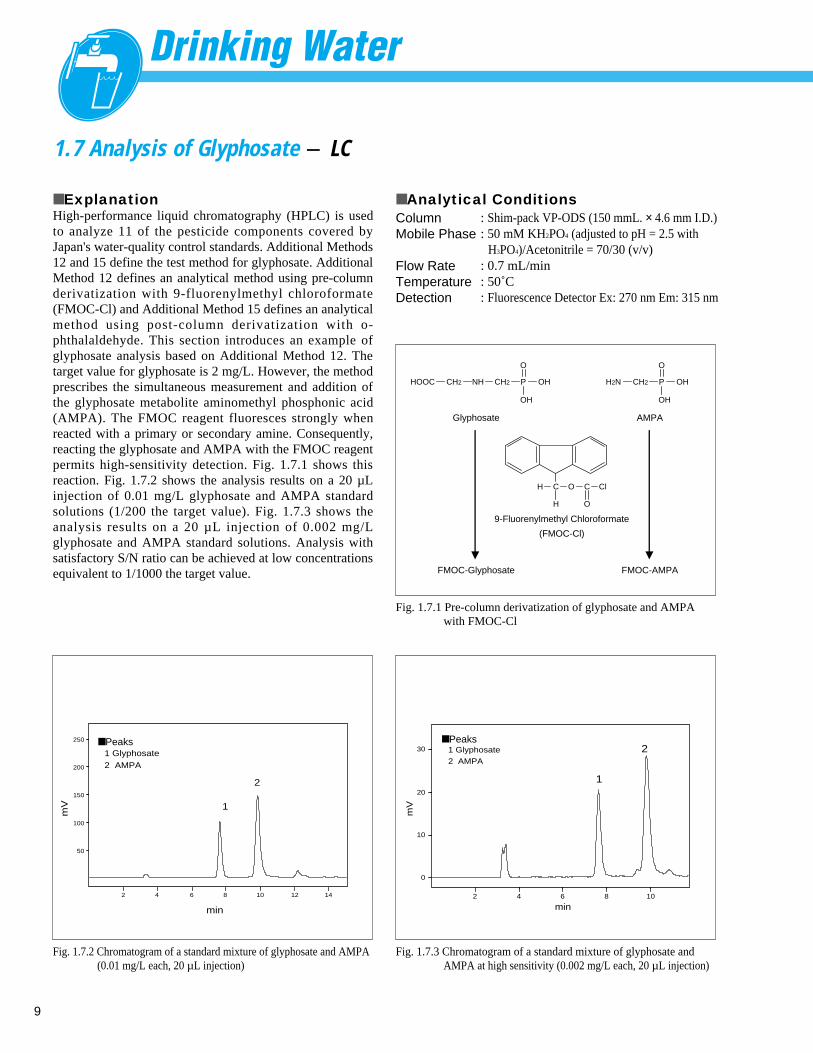
1.7 Analysis of Glyphosate - LC
■ ExplanationHigh-performance liquid chromatography (HPLC) is usedto analyze 11 of the pesticide components covered byJapan's water-quality control standards. Additional Methods12 and 15 define the test method for glyphosate. AdditionalMethod 12 defines an analytical method using pre-columnderivatization with 9-fluorenylmethyl chloroformate(FMOC-Cl) and Additional Method 15 defines an analyticalmethod using post-column derivatization with o-phthalaldehyde. This section introduces an example ofglyphosate analysis based on Additional Method 12. Thetarget value for glyphosate is 2 mg/L. However, the methodprescribes the simultaneous measurement and addition ofthe glyphosate metabolite aminomethyl phosphonic acid(AMPA). The FMOC reagent fluoresces strongly whenreacted with a primary or secondary amine. Consequently,reacting the glyphosate and AMPA with the FMOC reagentpermits high-sensitivity detection. Fig. 1.7.1 shows thisreaction. Fig. 1.7.2 shows the analysis results on a 20 µLinjection of 0.01 mg/L glyphosate and AMPA standardsolutions (1/200 the target value). Fig. 1.7.3 shows theanalysis results on a 20 µ L injection of 0.002 mg/Lglyphosate and AMPA standard solutions. Analysis withsatisfactory S/N ratio can be achieved at low concentrationsequivalent to 1/1000 the target value.
Fig. 1.7.2 Chromatogram of a standard mixture of glyphosate and AMPA (0.01 mg/L each, 20 µL injection)
■ Analytical ConditionsColumnMobile Phase
Flow RateTemperatureDetection
: Shim-pack VP-ODS (150 mmL. × 4.6 mm I.D.): 50 mM KH2PO4 (adjusted to pH = 2.5 with
H3PO4)/Acetonitrile = 70/30 (v/v): 0.7 mL/min: 50˚C: Fluorescence Detector Ex: 270 nm Em: 315 nm
2 4 6 8 10 12 14
50
100
150
200
250
1
2
■ Peaks1 Glyphosate2 AMPA
min
mV
C O CH
OH
Cl
Glyphosate
9-Fluorenylmethyl Chloroformate
(FMOC-Cl)
FMOC-Glyphosate
AMPA
FMOC-AMPA
HOOC CH2 NH CH2 P
OH
O
OH H2N CH2 P
OH
O
OH
2 4 6 8 10
0
10
20
30■ Peaks
1 Glyphosate2 AMPA
1
2
min
mV
Fig. 1.7.3 Chromatogram of a standard mixture of glyphosate and AMPA at high sensitivity (0.002 mg/L each, 20 µL injection)
Fig. 1.7.1 Pre-column derivatization of glyphosate and AMPA with FMOC-Cl
10
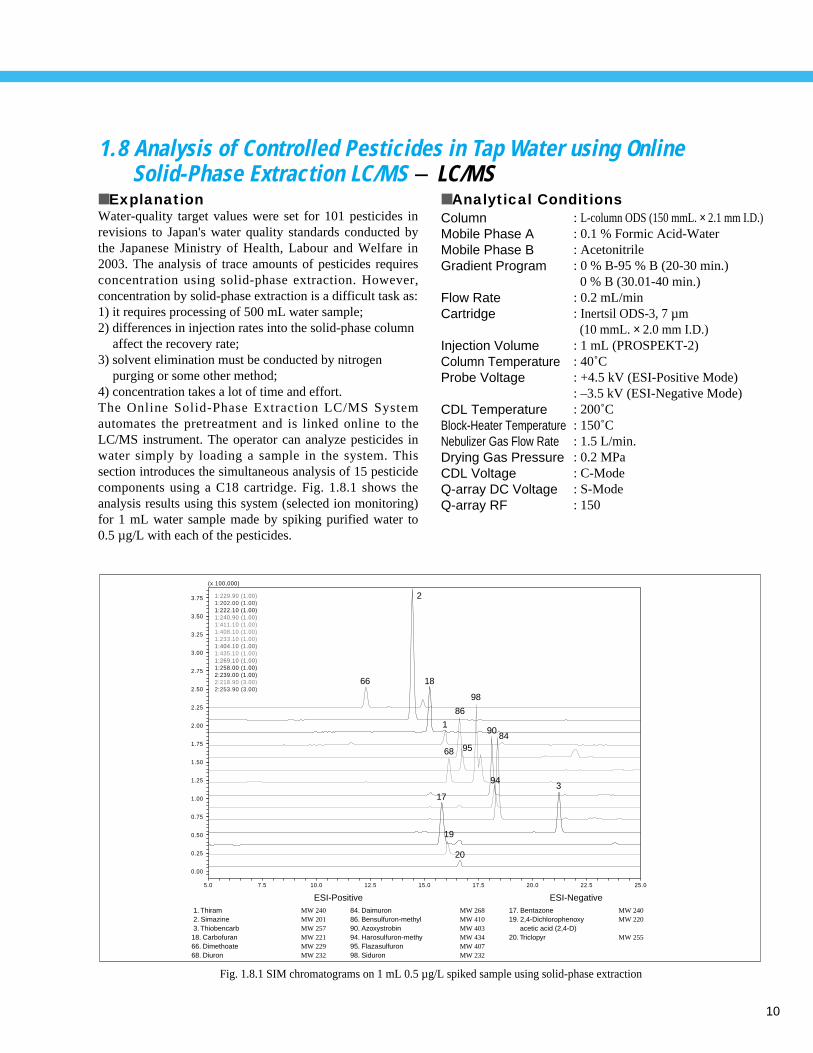
1.8 Analysis of Controlled Pesticides in Tap Water using Online Solid-Phase Extraction LC/MS - LC/MS
■ ExplanationWater-quality target values were set for 101 pesticides inrevisions to Japan's water quality standards conducted bythe Japanese Ministry of Health, Labour and Welfare in2003. The analysis of trace amounts of pesticides requiresconcentration using solid-phase extraction. However,concentration by solid-phase extraction is a difficult task as:1) it requires processing of 500 mL water sample;2) differences in injection rates into the solid-phase column
affect the recovery rate;3) solvent elimination must be conducted by nitrogen
purging or some other method;4) concentration takes a lot of time and effort.The Online Solid-Phase Extraction LC/MS Systemautomates the pretreatment and is linked online to theLC/MS instrument. The operator can analyze pesticides inwater simply by loading a sample in the system. Thissection introduces the simultaneous analysis of 15 pesticidecomponents using a C18 cartridge. Fig. 1.8.1 shows theanalysis results using this system (selected ion monitoring)for 1 mL water sample made by spiking purified water to0.5 µg/L with each of the pesticides.
■ Analytical ConditionsColumnMobile Phase AMobile Phase BGradient Program
Flow RateCartridge
Injection VolumeColumn TemperatureProbe Voltage
CDL TemperatureBlock-Heater TemperatureNebulizer Gas Flow RateDrying Gas PressureCDL VoltageQ-array DC VoltageQ-array RF
: L-column ODS (150 mmL. × 2.1 mm I.D.): 0.1 % Formic Acid-Water: Acetonitrile: 0 % B-95 % B (20-30 min.)0 % B (30.01-40 min.)
: 0.2 mL/min: Inertsil ODS-3, 7 µm
(10 mmL. × 2.0 mm I.D.): 1 mL (PROSPEKT-2): 40˚C : +4.5 kV (ESI-Positive Mode): –3.5 kV (ESI-Negative Mode): 200˚C: 150˚C: 1.5 L/min.: 0.2 MPa: C-Mode: S-Mode: 150
1. Thiram 2. Simazine 3. Thiobencarb18. Carbofuran66. Dimethoate68. Diuron
MW 240MW 201MW 257MW 221MW 229MW 232
84. Daimuron86. Bensulfuron-methyl90. Azoxystrobin94. Harosulfuron-methy95. Flazasulfuron98. Siduron
MW 268MW 410MW 403MW 434MW 407MW 232
17. Bentazone19. 2,4-Dichlorophenoxy
acetic acid (2,4-D)20. Triclopyr
MW 240MW 220
MW 255
ESI-Positive ESI-Negative
5.0 7.5 10.0 12.5 15.0 17.5 20.0 22.5 25.0
0.00
0.25
0.50
0.75
1.00
1.25
1.50
1.75
2.00
2.25
2.50
2.75
3.00
3.25
3.50
3.75
(x 100,000)
2:253.90 (3.00)2:218.90 (3.00)2:239.00 (1.00)1:258.00 (1.00)1:269.10 (1.00)1:435.10 (1.00)1:404.10 (1.00)1:233.10 (1.00)1:408.10 (1.00)1:411.10 (1.00)1:240.90 (1.00)1:222.10 (1.00)1:202.00 (1.00)1:229.90 (1.00)
66 18
98
86
1
68 95
9084
394
17
19
20
2
Fig. 1.8.1 SIM chromatograms on 1 mL 0.5 µg/L spiked sample using solid-phase extraction
11
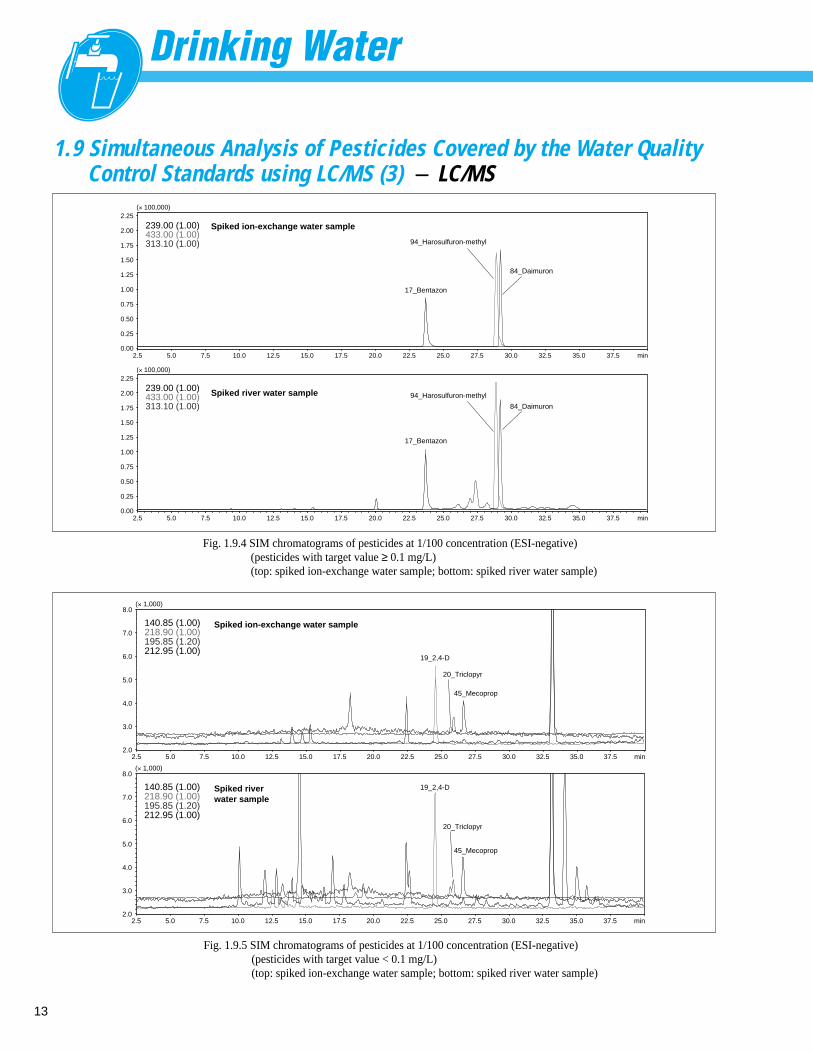
1.9 Simultaneous Analysis of Pesticides Covered by the Water Quality Control Standards using LC/MS (1) - LC/MS
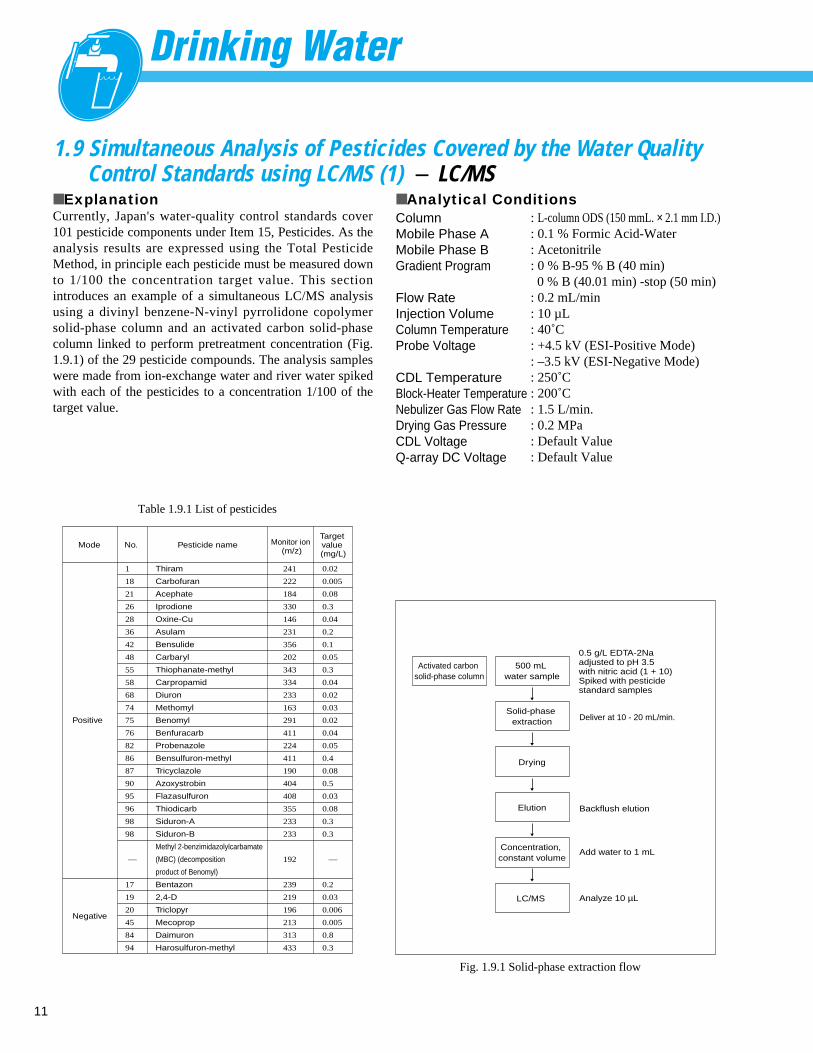
■ ExplanationCurrently, Japan's water-quality control standards cover101 pesticide components under Item 15, Pesticides. As theanalysis results are expressed using the Total PesticideMethod, in principle each pesticide must be measured downto 1/100 the concentration target value. This sectionintroduces an example of a simultaneous LC/MS analysisusing a divinyl benzene-N-vinyl pyrrolidone copolymersolid-phase column and an activated carbon solid-phasecolumn linked to perform pretreatment concentration (Fig.1.9.1) of the 29 pesticide compounds. The analysis sampleswere made from ion-exchange water and river water spikedwith each of the pesticides to a concentration 1/100 of thetarget value.
■ Analytical ConditionsColumnMobile Phase AMobile Phase BGradient Program
Flow RateInjection VolumeColumn TemperatureProbe Voltage
CDL TemperatureBlock-Heater TemperatureNebulizer Gas Flow RateDrying Gas PressureCDL VoltageQ-array DC Voltage
: L-column ODS (150 mmL. × 2.1 mm I.D.): 0.1 % Formic Acid-Water: Acetonitrile: 0 % B-95 % B (40 min)0 % B (40.01 min) -stop (50 min)
: 0.2 mL/min: 10 µL: 40˚C : +4.5 kV (ESI-Positive Mode): –3.5 kV (ESI-Negative Mode): 250˚C: 200˚C: 1.5 L/min.: 0.2 MPa: Default Value: Default Value
1
18
21
26
28
36
42
48
55
58
68
74
75
76
82
86
87
90
95
96
98
98
17
19
20
45
84
94
Thiram
Carbofuran
Acephate
Iprodione
Oxine-Cu
Asulam
Bensulide
Carbaryl
Thiophanate-methyl
Carpropamid
Diuron
Methomyl
Benomyl
Benfuracarb
Probenazole
Bensulfuron-methyl
Tricyclazole
Azoxystrobin
Flazasulfuron
Thiodicarb
Siduron-A
Siduron-B
Methyl 2-benzimidazolylcarbamate
(MBC) (decomposition
product of Benomyl)
Bentazon
2,4-D
Triclopyr
Mecoprop
Daimuron
Harosulfuron-methyl
241
222
184
330
146
231
356
202
343
334
233
163
291
411
224
411
190
404
408
355
233
233
192
239
219
196
213
313
433
0.02
0.005
0.08
0.3
0.04
0.2
0.1
0.05
0.3
0.04
0.02
0.03
0.02
0.04
0.05
0.4
0.08
0.5
0.03
0.08
0.3
0.3
0.2
0.03
0.006
0.005
0.8
0.3
Mode No. Pesticide name Monitor ion (m/z)
Target value (mg/L)
–– ––
Positive
Negative
Table 1.9.1 List of pesticides
Activated carbon solid-phase column
500 mL water sample
Deliver at 10 - 20 mL/min.
Backflush elution
Add water to 1 mL
Analyze 10 µLLC/MS
Solid-phase extraction
Drying
Elution
Concentration, constant volume
0.5 g/L EDTA-2Na adjusted to pH 3.5 with nitric acid (1 + 10) Spiked with pesticide standard samples
Fig. 1.9.1 Solid-phase extraction flow
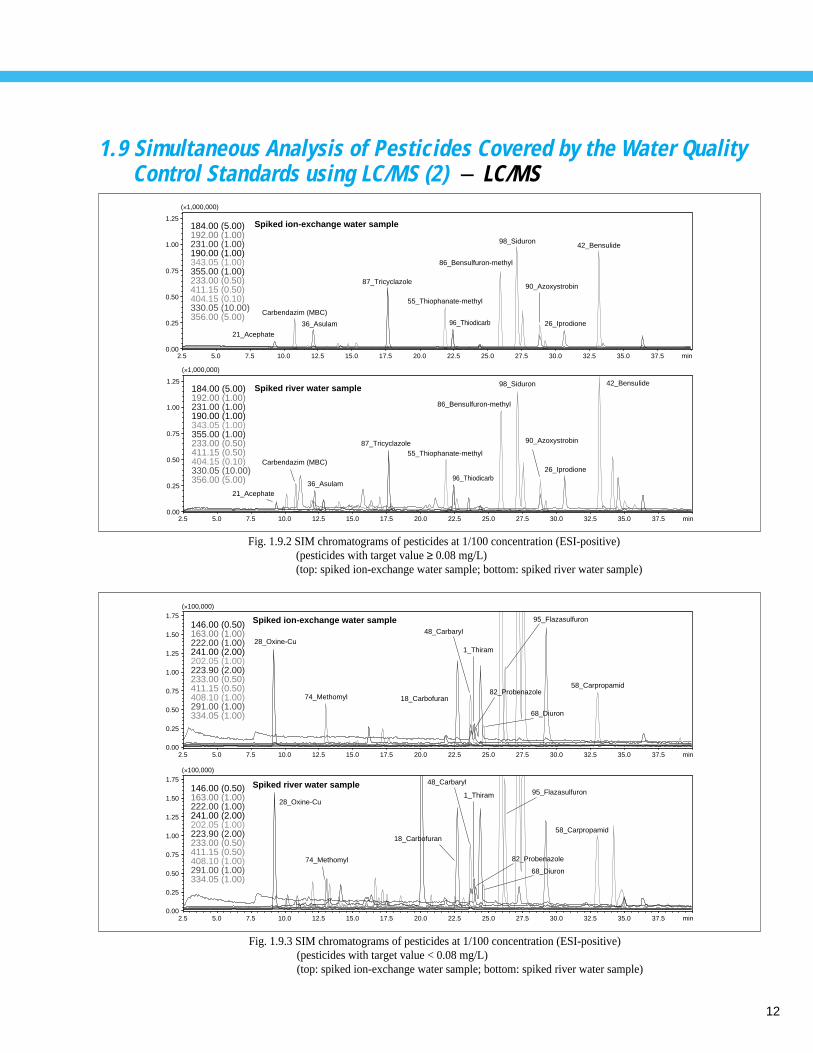
12
Fig. 1.9.2 SIM chromatograms of pesticides at 1/100 concentration (ESI-positive)(pesticides with target value ≥ 0.08 mg/L)(top: spiked ion-exchange water sample; bottom: spiked river water sample)
2.5 5.0 7.5 10.0 12.5 15.0 17.5 20.0 22.5 25.0 27.5 30.0 32.5 35.0 37.5 min0.00
0.25
0.50
0.75
1.00
1.25
(´1,000,000)
356.00 (5.00)330.05 (10.00)404.15 (0.10)411.15 (0.50)233.00 (0.50)355.00 (1.00)343.05 (1.00)190.00 (1.00)231.00 (1.00)192.00 (1.00)184.00 (5.00)
36_Asulam
36_Asulam
21_Acephate
21_Acephate
Carbendazim (MBC)
Carbendazim (MBC)
Spiked ion-exchange water sample
87_Tricyclazole
87_Tricyclazole
55_Thiophanate-methyl
55_Thiophanate-methyl
98_Siduron
98_Siduron
42_Bensulide
42_Bensulide
96_Thiodicarb
96_Thiodicarb
86_Bensulfuron-methyl
86_Bensulfuron-methyl
90_Azoxystrobin
90_Azoxystrobin
26_Iprodione
26_Iprodione
2.5 5.0 7.5 10.0 12.5 15.0 17.5 20.0 22.5 25.0 27.5 30.0 32.5 35.0 37.5 min0.00
0.25
0.50
0.75
1.00
1.25
(´1,000,000)
356.00 (5.00)330.05 (10.00)404.15 (0.10)411.15 (0.50)233.00 (0.50)355.00 (1.00)343.05 (1.00)190.00 (1.00)231.00 (1.00)192.00 (1.00)184.00 (5.00) Spiked river water sample
2.5 5.0 7.5 10.0 12.5 15.0 17.5 20.0 22.5 25.0 27.5 30.0 32.5 35.0 37.5 min0.00
0.25
0.50
0.75
1.00
1.25
1.50
1.75(´100,000)
334.05 (1.00)291.00 (1.00)408.10 (1.00)411.15 (0.50)233.00 (0.50)223.90 (2.00)202.05 (1.00)241.00 (2.00)222.00 (1.00)163.00 (1.00)146.00 (0.50)
28_Oxine-Cu
28_Oxine-Cu
95_Flazasulfuron
95_Flazasulfuron
82_Probenazole
82_Probenazole
68_Diuron
68_Diuron
1_Thiram
1_Thiram
48_Carbaryl
48_Carbaryl
18_Carbofuran
18_Carbofuran
74_Methomyl
74_Methomyl
58_Carpropamid
58_Carpropamid
Spiked ion-exchange water sample
2.5 5.0 7.5 10.0 12.5 15.0 17.5 20.0 22.5 25.0 27.5 30.0 32.5 35.0 37.5 min0.00
0.25
0.50
0.75
1.00
1.25
1.50
1.75(´100,000)
334.05 (1.00)291.00 (1.00)408.10 (1.00)411.15 (0.50)233.00 (0.50)223.90 (2.00)202.05 (1.00)241.00 (2.00)222.00 (1.00)163.00 (1.00)146.00 (0.50) Spiked river water sample
Fig. 1.9.3 SIM chromatograms of pesticides at 1/100 concentration (ESI-positive)(pesticides with target value < 0.08 mg/L)(top: spiked ion-exchange water sample; bottom: spiked river water sample)
1.9 Simultaneous Analysis of Pesticides Covered by the Water Quality Control Standards using LC/MS (2) - LC/MS
13
Fig. 1.9.4 SIM chromatograms of pesticides at 1/100 concentration (ESI-negative)(pesticides with target value ≥ 0.1 mg/L)(top: spiked ion-exchange water sample; bottom: spiked river water sample)
Fig. 1.9.5 SIM chromatograms of pesticides at 1/100 concentration (ESI-negative)(pesticides with target value < 0.1 mg/L)(top: spiked ion-exchange water sample; bottom: spiked river water sample)
1.9 Simultaneous Analysis of Pesticides Covered by the Water Quality Control Standards using LC/MS (3) - LC/MS
Spiked ion-exchange water sample
2.5 5.0 7.5 10.0 12.5 15.0 17.5 20.0 22.5 25.0 27.5 30.0 32.5 35.0 37.5 min0.00
0.25
0.50
0.75
1.00
1.25
1.50
1.75
2.00
2.25(´ 100,000)
313.10 (1.00)433.00 (1.00)239.00 (1.00)
17_Bentazon
17_Bentazon
94_Harosulfuron-methyl
94_Harosulfuron-methyl
84_Daimuron
84_Daimuron
Spiked river water sample
2.5 5.0 7.5 10.0 12.5 15.0 17.5 20.0 22.5 25.0 27.5 30.0 32.5 35.0 37.5 min0.00
0.25
0.50
0.75
1.00
1.25
1.50
1.75
2.00
2.25(´ 100,000)
313.10 (1.00)433.00 (1.00)239.00 (1.00)
Spiked ion-exchange water sample
2.5 5.0 7.5 10.0 12.5 15.0 17.5 20.0 22.5 25.0 27.5 30.0 32.5 35.0 37.5 min2.0
3.0
4.0
5.0
6.0
7.0
8.0(´ 1,000)
212.95 (1.00)195.85 (1.20)218.90 (1.00)140.85 (1.00)
19_2,4-D
19_2,4-D
20_Triclopyr
20_Triclopyr
45_Mecoprop
45_Mecoprop
Spiked river water sample
2.5 5.0 7.5 10.0 12.5 15.0 17.5 20.0 22.5 25.0 27.5 30.0 32.5 35.0 37.5 min2.0
3.0
4.0
5.0
6.0
7.0
8.0(´ 1,000)
212.95 (1.00)195.85 (1.20)218.90 (1.00)140.85 (1.00)
14
1.10 Simultaneous Analysis of Pesticides Covered by the Water QualityControl Standards using GC/MS (1) - GC/MS
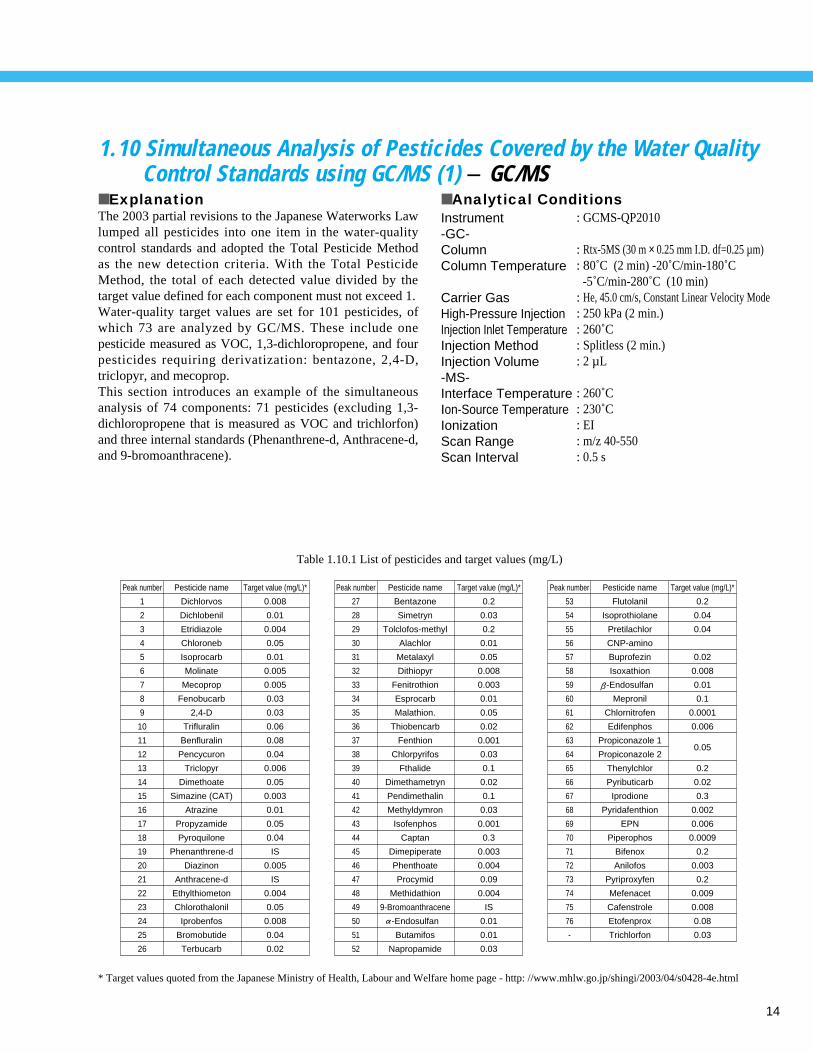
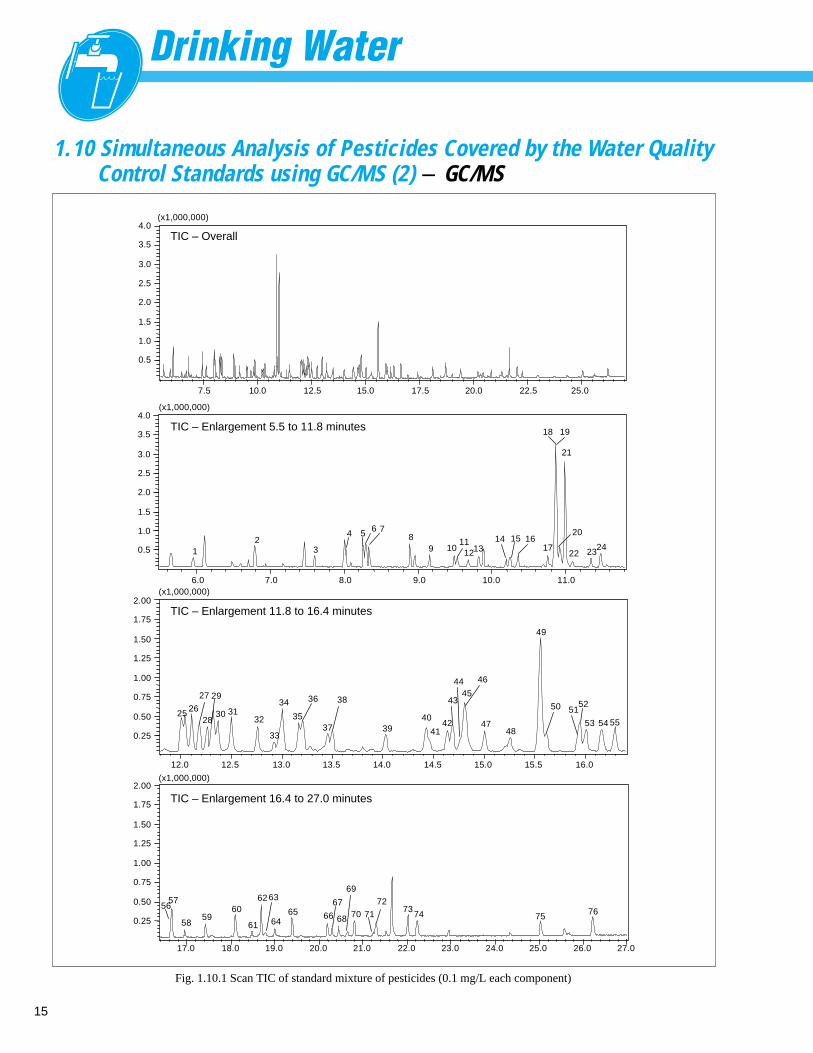
■ ExplanationThe 2003 partial revisions to the Japanese Waterworks Lawlumped all pesticides into one item in the water-qualitycontrol standards and adopted the Total Pesticide Methodas the new detection criteria. With the Total PesticideMethod, the total of each detected value divided by thetarget value defined for each component must not exceed 1. Water-quality target values are set for 101 pesticides, ofwhich 73 are analyzed by GC/MS. These include onepesticide measured as VOC, 1,3-dichloropropene, and fourpesticides requiring derivatization: bentazone, 2,4-D,triclopyr, and mecoprop. This section introduces an example of the simultaneousanalysis of 74 components: 71 pesticides (excluding 1,3-dichloropropene that is measured as VOC and trichlorfon)and three internal standards (Phenanthrene-d, Anthracene-d,and 9-bromoanthracene).
■ Analytical ConditionsInstrument-GC-ColumnColumn Temperature
Carrier GasHigh-Pressure InjectionInjection Inlet TemperatureInjection MethodInjection Volume -MS-Interface TemperatureIon-Source TemperatureIonizationScan RangeScan Interval
: GCMS-QP2010
: Rtx-5MS (30 m × 0.25 mm I.D. df=0.25 µm): 80˚C (2 min) -20˚C/min-180˚C
-5˚C/min-280˚C (10 min): He, 45.0 cm/s, Constant Linear Velocity Mode: 250 kPa (2 min.): 260˚C: Splitless (2 min.): 2 µL
: 260˚C: 230˚C: EI: m/z 40-550: 0.5 s
Peak number
1
2
3
4
5
6
7
8
9
10
11
12
13
14
15
16
17
18
19
20
21
22
23
24
25
26
Pesticide name
Dichlorvos
Dichlobenil
Etridiazole
Chloroneb
Isoprocarb
Molinate
Mecoprop
Fenobucarb
2,4-D
Trifluralin
Benfluralin
Pencycuron
Triclopyr
Dimethoate
Simazine (CAT)
Atrazine
Propyzamide
Pyroquilone
Phenanthrene-d
Diazinon
Anthracene-d
Ethylthiometon
Chlorothalonil
Iprobenfos
Bromobutide
Terbucarb
Target value (mg/L)*
0.008
0.01
0.004
0.05
0.01
0.005
0.005
0.03
0.03
0.06
0.08
0.04
0.006
0.05
0.003
0.01
0.05
0.04
IS
0.005
IS
0.004
0.05
0.008
0.04
0.02
Peak number
53
54
55
56
57
58
59
60
61
62
63
64
65
66
67
68
69
70
71
72
73
74
75
76
-
Pesticide name
Flutolanil
Isoprothiolane
Pretilachlor
CNP-amino
Buprofezin
Isoxathion
-Endosulfan
Mepronil
Chlornitrofen
Edifenphos
Propiconazole 1
Propiconazole 2
Thenylchlor
Pyributicarb
Iprodione
Pyridafenthion
EPN
Piperophos
Bifenox
Anilofos
Pyriproxyfen
Mefenacet
Cafenstrole
Etofenprox
Trichlorfon
Target value (mg/L)*
0.2
0.04
0.04
0.02
0.008
0.01
0.1
0.0001
0.006
0.05
0.2
0.02
0.3
0.002
0.006
0.0009
0.2
0.003
0.2
0.009
0.008
0.08
0.03
Peak number
27
28
29
30
31
32
33
34
35
36
37
38
39
40
41
42
43
44
45
46
47
48
49
50
51
52
Pesticide name
Bentazone
Simetryn
Tolclofos-methyl
Alachlor
Metalaxyl
Dithiopyr
Fenitrothion
Esprocarb
Malathion.
Thiobencarb
Fenthion
Chlorpyrifos
Fthalide
Dimethametryn
Pendimethalin
Methyldymron
Isofenphos
Captan
Dimepiperate
Phenthoate
Procymid
Methidathion
9-Bromoanthracene
-Endosulfan
Butamifos
Napropamide
Target value (mg/L)*
0.2
0.03
0.2
0.01
0.05
0.008
0.003
0.01
0.05
0.02
0.001
0.03
0.1
0.02
0.1
0.03
0.001
0.3
0.003
0.004
0.09
0.004
IS
0.01
0.01
0.03
Table 1.10.1 List of pesticides and target values (mg/L)
* Target values quoted from the Japanese Ministry of Health, Labour and Welfare home page - http: //www.mhlw.go.jp/shingi/2003/04/s0428-4e.html
15
7.5 10.0 12.5 15.0 17.5 20.0 22.5 25.0
0.5
1.0
1.5
2.0
2.5
3.0
3.5
4.0(x1,000,000)
TIC – Overall
TIC – Enlargement 5.5 to 11.8 minutes
TIC – Enlargement 11.8 to 16.4 minutes
TIC – Enlargement 16.4 to 27.0 minutes
6.0 7.0 8.0 9.0 10.0 11.0
0.5
1.0
1.5
2.0
2.5
3.0
3.5
4.0(x1,000,000)
12
3
4 5 6 78
9 10111213
14 15 1617
18 19
20
21
22 2324
12.0 12.5 13.0 13.5 14.0 14.5 15.0 15.5 16.0
0.25
0.50
0.75
1.00
1.25
1.50
1.75
2.00(x1,000,000)
25 26
27
28
29
30 3132
33
34
35
36
37
38
3940
4142
43
4445
46
4748
49
50 5152
53 54 55
17.0 18.0 19.0 20.0 21.0 22.0 23.0 24.0 25.0 26.0 27.0
0.25
0.50
0.75
1.00
1.25
1.50
1.75
2.00(x1,000,000)
5657
5859
60
61
6263
6465 66
67
68
69
70 71
7273
74 75 76
Fig. 1.10.1 Scan TIC of standard mixture of pesticides (0.1 mg/L each component)
1.10 Simultaneous Analysis of Pesticides Covered by the Water QualityControl Standards using GC/MS (2) - GC/MS
16
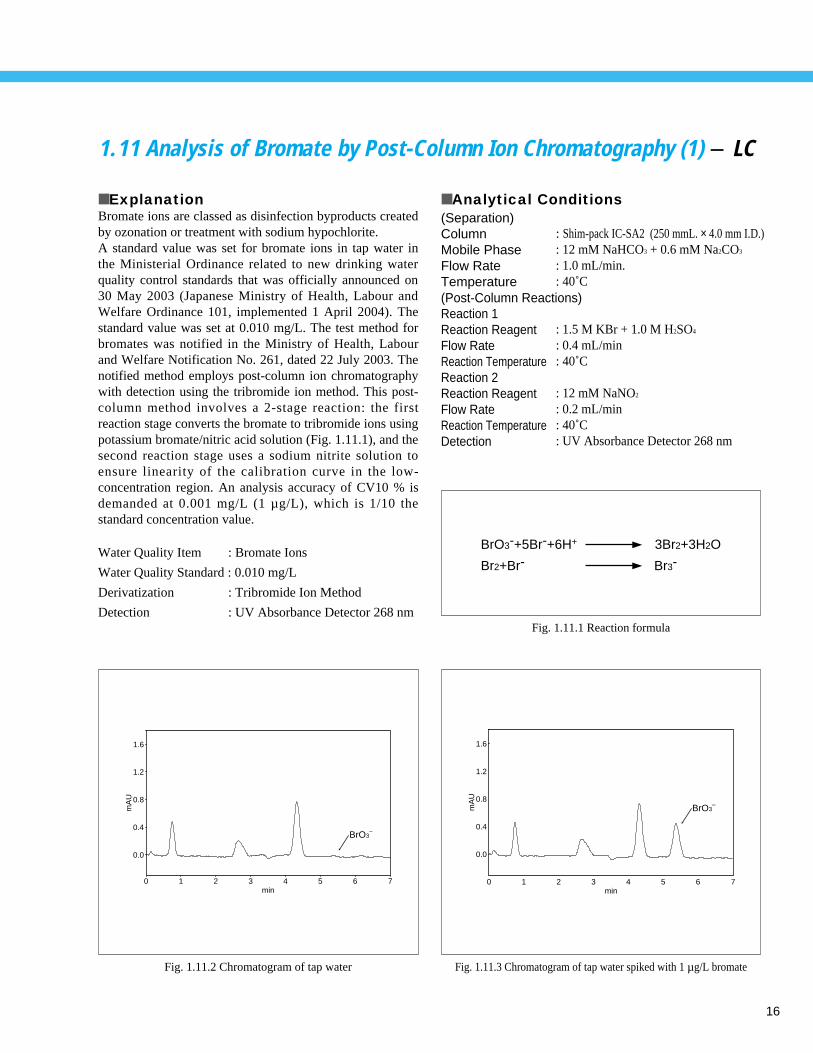
1.11 Analysis of Bromate by Post-Column Ion Chromatography (1) - LC
■ ExplanationBromate ions are classed as disinfection byproducts createdby ozonation or treatment with sodium hypochlorite.A standard value was set for bromate ions in tap water inthe Ministerial Ordinance related to new drinking waterquality control standards that was officially announced on30 May 2003 (Japanese Ministry of Health, Labour andWelfare Ordinance 101, implemented 1 April 2004). Thestandard value was set at 0.010 mg/L. The test method forbromates was notified in the Ministry of Health, Labourand Welfare Notification No. 261, dated 22 July 2003. Thenotified method employs post-column ion chromatographywith detection using the tribromide ion method. This post-column method involves a 2-stage reaction: the firstreaction stage converts the bromate to tribromide ions usingpotassium bromate/nitric acid solution (Fig. 1.11.1), and thesecond reaction stage uses a sodium nitrite solution toensure linearity of the calibration curve in the low-concentration region. An analysis accuracy of CV10 % isdemanded at 0.001 mg/L (1 µ g/L), which is 1/10 thestandard concentration value.
■ Analytical Conditions(Separation)ColumnMobile PhaseFlow RateTemperature
Reaction 1Reaction Reagent Flow RateReaction TemperatureReaction 2Reaction Reagent Flow RateReaction TemperatureDetection
: Shim-pack IC-SA2 (250 mmL. × 4.0 mm I.D.): 12 mM NaHCO3 + 0.6 mM Na2CO3
: 1.0 mL/min.: 40˚C
: 1.5 M KBr + 1.0 M H2SO4
: 0.4 mL/min: 40˚C
: 12 mM NaNO2
: 0.2 mL/min: 40˚C: UV Absorbance Detector 268 nm
Water Quality Item : Bromate Ions
Water Quality Standard : 0.010 mg/L
Derivatization : Tribromide Ion Method
Detection : UV Absorbance Detector 268 nm
(Post-Column Reactions)
min1 2 3 4 5 6 70
BrO3–
mA
U
0.0
0.4
0.8
1.2
1.6
Fig. 1.11.2 Chromatogram of tap water
min1 2 3 4 5 6 70
mA
U
0.0
0.4
0.8
1.2
1.6
BrO3–
Fig. 1.11.3 Chromatogram of tap water spiked with 1 µg/L bromate
BrO3-+5Br-+6H+ 3Br2+3H2O
Br2+Br- Br3-
Fig. 1.11.1 Reaction formula
17
1.11 Analysis of Bromate by Post-Column Ion Chromatography (2) - LC
min0 1 2 3 4 5 6 7
mA
U
0.0
0.5
1.0
1.5
2.0
2.5
3.0
3.5 BrO3–
10 µg/L
5 µg/L
1 µg/L
Fig. 1.11.6 Chromatograms of bromate standard
min 0 1 2 3 4 5 6 7
mA
U
-0.2
0.0
0.2
0.4
0.6
0.8
1.0
1.2
1.4
Retention TimeBrO3
Repeatability (CV%)
(n=10, 100 µL Inj.)
0.102.10Peak Area
BrO3–
Fig. 1.11.7 Repeatability of bromate standard (1 µg/L)
12, 3
456
Pump for Mobile PhasePumps for Reaction ReagentsDegasserAutosamplerColumn
7, 89
1011
12,13
Reaction CoilsColumn OvenUV DetectorMobile PhaseReaction Reagents
9 108765
11
12
13 4
1
2
3
Fig. 1.11.4 Flow diagram
00
50000
100000
150000
200000
250000
300000
350000
400000
20 40 60 80 100 120
r2=0.9999
Fig. 1.11.5 Calibration curve (0.5-100 µg/L)
18
1.12 Speciation Analysis of Cyanogen Compounds by Post-Column Ion Chromatography (1) - LC
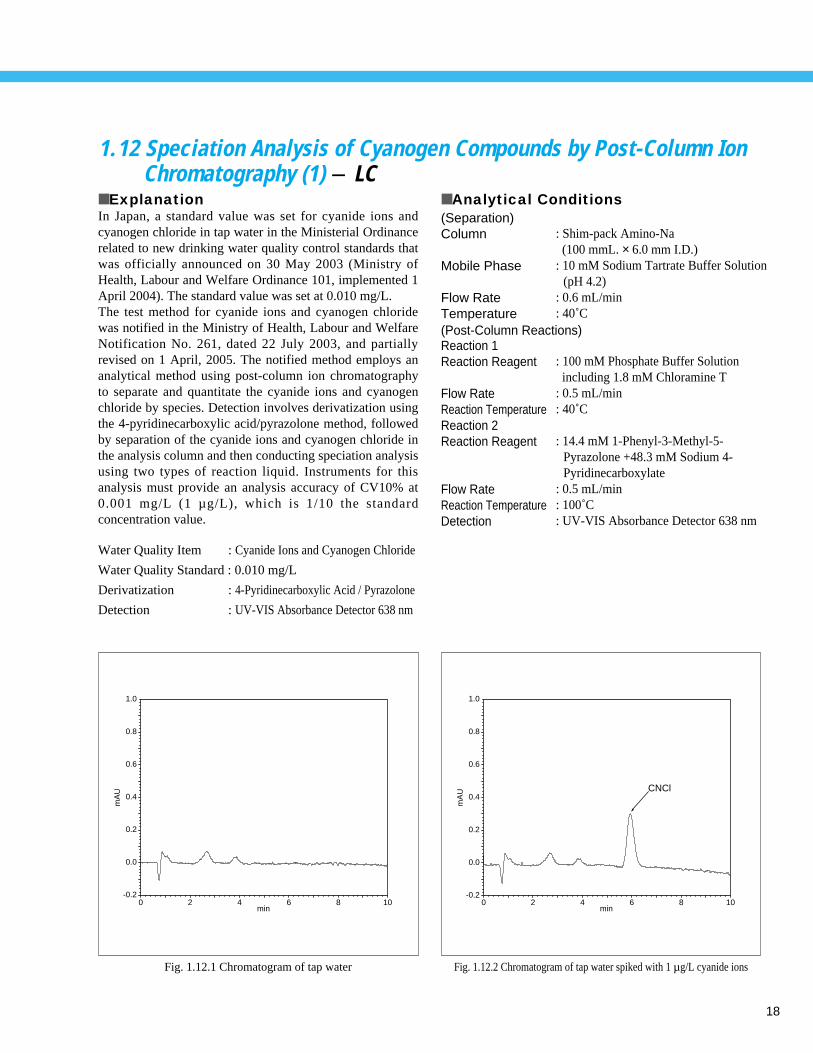
■ ExplanationIn Japan, a standard value was set for cyanide ions andcyanogen chloride in tap water in the Ministerial Ordinancerelated to new drinking water quality control standards thatwas officially announced on 30 May 2003 (Ministry ofHealth, Labour and Welfare Ordinance 101, implemented 1April 2004). The standard value was set at 0.010 mg/L. The test method for cyanide ions and cyanogen chloridewas notified in the Ministry of Health, Labour and WelfareNotification No. 261, dated 22 July 2003, and partiallyrevised on 1 April, 2005. The notified method employs ananalytical method using post-column ion chromatographyto separate and quantitate the cyanide ions and cyanogenchloride by species. Detection involves derivatization usingthe 4-pyridinecarboxylic acid/pyrazolone method, followedby separation of the cyanide ions and cyanogen chloride inthe analysis column and then conducting speciation analysisusing two types of reaction liquid. Instruments for thisanalysis must provide an analysis accuracy of CV10% at0.001 mg/L (1 µ g/L), which is 1/10 the standardconcentration value.
■ Analytical Conditions(Separation)Column
Mobile Phase
Flow RateTemperature
Reaction 1Reaction Reagent
Flow RateReaction TemperatureReaction 2Reaction Reagent
Flow RateReaction TemperatureDetection
: Shim-pack Amino-Na (100 mmL. × 6.0 mm I.D.)
: 10 mM Sodium Tartrate Buffer Solution(pH 4.2)
: 0.6 mL/min: 40˚C
: 100 mM Phosphate Buffer Solutionincluding 1.8 mM Chloramine T
: 0.5 mL/min: 40˚C
: 14.4 mM 1-Phenyl-3-Methyl-5-Pyrazolone +48.3 mM Sodium 4-Pyridinecarboxylate
: 0.5 mL/min: 100˚C: UV-VIS Absorbance Detector 638 nm
Water Quality Item : Cyanide Ions and Cyanogen Chloride
Water Quality Standard : 0.010 mg/L
Derivatization : 4-Pyridinecarboxylic Acid / Pyrazolone
Detection : UV-VIS Absorbance Detector 638 nm
(Post-Column Reactions)
Fig. 1.12.1 Chromatogram of tap water Fig. 1.12.2 Chromatogram of tap water spiked with 1 µg/L cyanide ions
min0 2 4 6 8 10
mA
U
-0.2
0.0
0.2
0.4
0.6
0.8
1.0
CNCl
mA
U
-0.2
0.0
0.2
0.4
0.6
0.8
1.0
min0 2 4 6 8 10
19
Fig. 1.12.5 Calibration curve for cyanide ions (0.5-100 µg/L) Fig. 1.12.6 Calibration curve for cyanogen chloride (0.5-100 µg/L)
Fig. 1.12.3 Flow diagram Fig. 1.12.4 Repeatability of cyanide ions and cyanogen chloride standards (1 µg/L each)
0
100000
200000
300000
400000
500000
600000
700000
800000
900000
1000000
0 20 40 60 80 100
CN : r2=0.9999
12, 3
456
7, 8
Pump for Mobile PhasePumps for Reaction ReagentsDegasserAutosamplerColumnReaction Coils
9101112
13, 14
Column OvenReaction OvenUV-VIS DetectorMobile PhaseReaction Reagents
9 11
8
765
12
13
14 4
1
2
3
10
0
100000
200000
300000
400000
500000
600000
700000
800000
900000
1000000
0 20 40 60 80 100
CNCl : r2=0.9998
min
0 1 2 3 4 5 6 7 8 9 10
mA
U
0.0
0.5
1.0
1.5
2.0
CN–
CNCl
Retention TimeCN
Repeatability (CV%)
(n=10, 100 µL Inj.)
CNCl0.05 0.020.69 1.72Peak Area
1.12 Speciation Analysis of Cyanogen Compounds by Post-Column Ion Chromatography (2) - LC
20
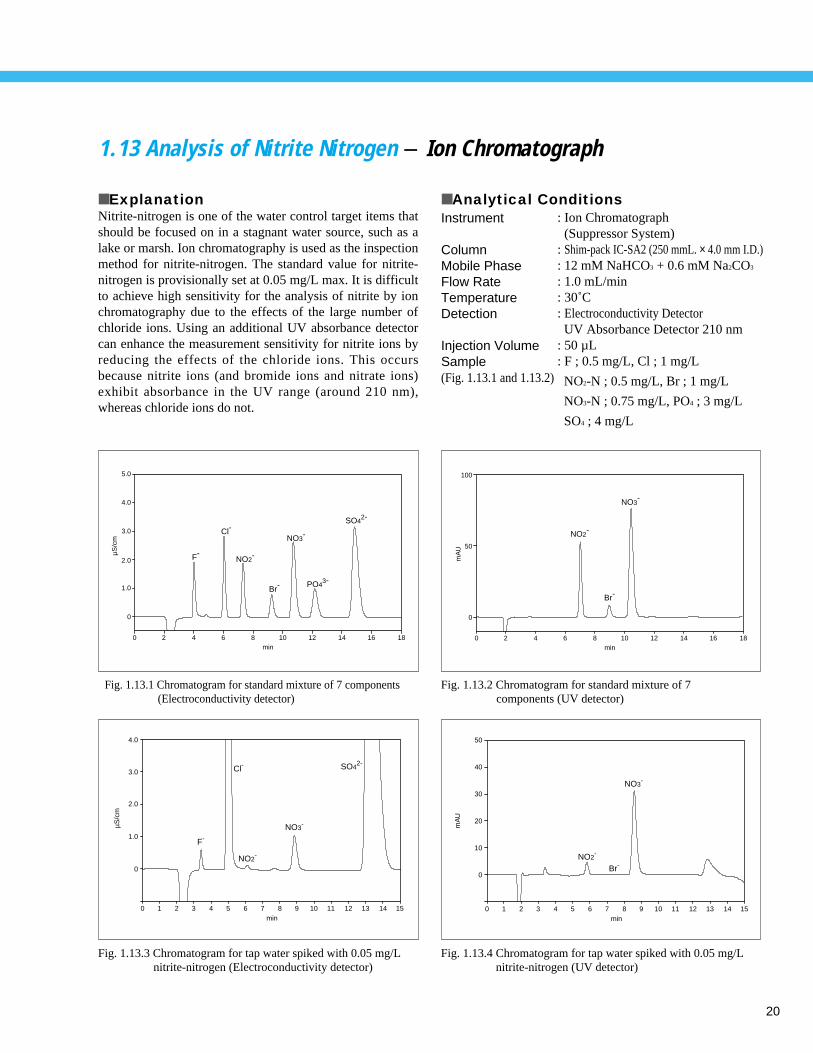
1.13 Analysis of Nitrite Nitrogen - Ion Chromatograph
■ ExplanationNitrite-nitrogen is one of the water control target items thatshould be focused on in a stagnant water source, such as alake or marsh. Ion chromatography is used as the inspectionmethod for nitrite-nitrogen. The standard value for nitrite-nitrogen is provisionally set at 0.05 mg/L max. It is difficultto achieve high sensitivity for the analysis of nitrite by ionchromatography due to the effects of the large number ofchloride ions. Using an additional UV absorbance detectorcan enhance the measurement sensitivity for nitrite ions byreducing the effects of the chloride ions. This occursbecause nitrite ions (and bromide ions and nitrate ions)exhibit absorbance in the UV range (around 210 nm),whereas chloride ions do not.
■ Analytical ConditionsInstrument
ColumnMobile PhaseFlow RateTemperatureDetection
Injection VolumeSample(Fig. 1.13.1 and 1.13.2)
: Ion Chromatograph (Suppressor System)
: Shim-pack IC-SA2 (250 mmL. × 4.0 mm I.D.): 12 mM NaHCO3 + 0.6 mM Na2CO3
: 1.0 mL/min: 30˚C: Electroconductivity DetectorUV Absorbance Detector 210 nm
: 50 µL: F ; 0.5 mg/L, Cl ; 1 mg/L
NO2-N ; 0.5 mg/L, Br ; 1 mg/L
NO3-N ; 0.75 mg/L, PO4 ; 3 mg/L
SO4 ; 4 mg/L
0
0
1.0
2.0
3.0
4.0
µS/c
m
1 2 3 4 5 6 7 8 9 10 11 12 13 14 15min
F-
Cl-
NO2-
NO3-
SO42-
F-
Cl-
NO2-
Br-
NO3-
PO43-
SO42-
0
0
1.0
2.0
µS/c
m
3.0
4.0
5.0
2 4 6 8min
10 12 14 16 18
0
0
10
20
mA
U
30
40
50
1 2 3 4 5 6 7 8 9 10 11 12 13 14 15min
NO2-
NO3-
Br-
0
0
50
mA
U
100
2 4 6 8min
10 12 14 16 18
NO2-
Br-
NO3-
Fig. 1.13.3 Chromatogram for tap water spiked with 0.05 mg/L nitrite-nitrogen (Electroconductivity detector)
Fig. 1.13.1 Chromatogram for standard mixture of 7 components (Electroconductivity detector)
Fig. 1.13.4 Chromatogram for tap water spiked with 0.05 mg/L nitrite-nitrogen (UV detector)
Fig. 1.13.2 Chromatogram for standard mixture of 7 components (UV detector)
21
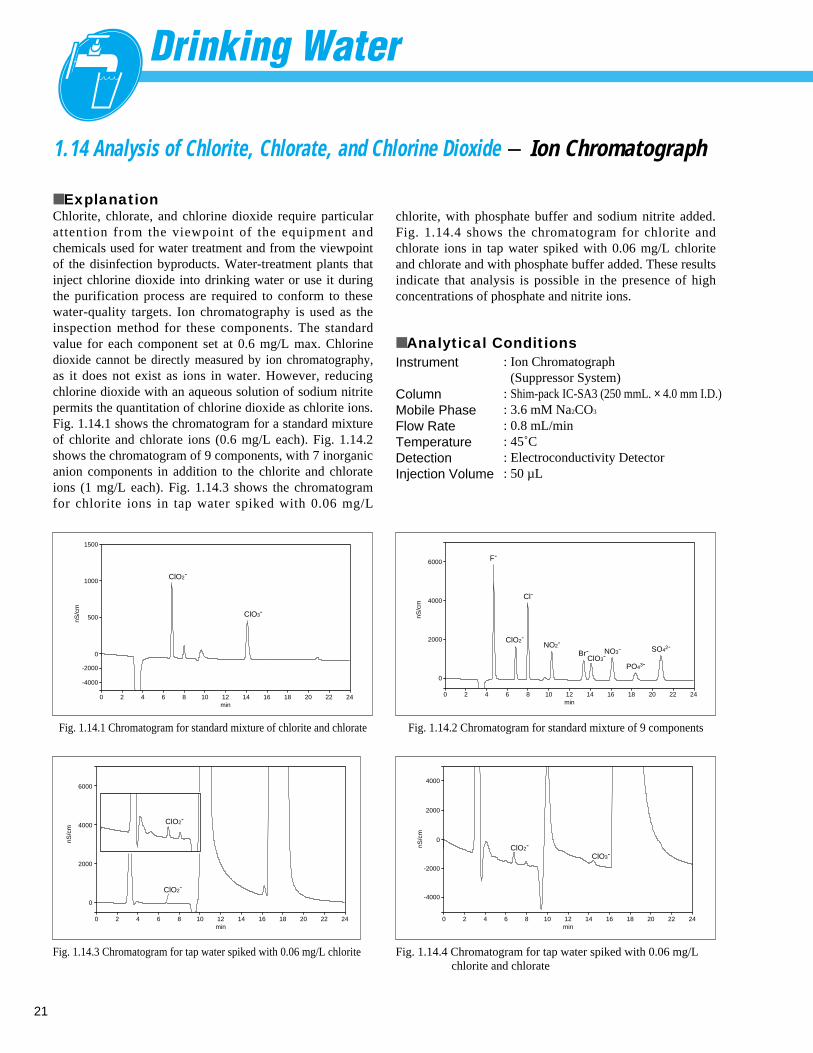
1.14 Analysis of Chlorite, Chlorate, and Chlorine Dioxide - Ion Chromatograph
■ ExplanationChlorite, chlorate, and chlorine dioxide require particularattention from the viewpoint of the equipment andchemicals used for water treatment and from the viewpointof the disinfection byproducts. Water-treatment plants thatinject chlorine dioxide into drinking water or use it duringthe purification process are required to conform to thesewater-quality targets. Ion chromatography is used as theinspection method for these components. The standardvalue for each component set at 0.6 mg/L max. Chlorinedioxide cannot be directly measured by ion chromatography,as it does not exist as ions in water. However, reducingchlorine dioxide with an aqueous solution of sodium nitritepermits the quantitation of chlorine dioxide as chlorite ions.Fig. 1.14.1 shows the chromatogram for a standard mixtureof chlorite and chlorate ions (0.6 mg/L each). Fig. 1.14.2shows the chromatogram of 9 components, with 7 inorganicanion components in addition to the chlorite and chlorateions (1 mg/L each). Fig. 1.14.3 shows the chromatogramfor chlorite ions in tap water spiked with 0.06 mg/L
■ Analytical ConditionsInstrument
ColumnMobile Phase Flow RateTemperatureDetectionInjection Volume
: Ion Chromatograph (Suppressor System)
: Shim-pack IC-SA3 (250 mmL. × 4.0 mm I.D.): 3.6 mM Na2CO3
: 0.8 mL/min: 45˚C: Electroconductivity Detector : 50 µL
chlorite, with phosphate buffer and sodium nitrite added.Fig. 1.14.4 shows the chromatogram for chlorite andchlorate ions in tap water spiked with 0.06 mg/L chloriteand chlorate and with phosphate buffer added. These resultsindicate that analysis is possible in the presence of highconcentrations of phosphate and nitrite ions.
0
500nS/c
m
1000
1500
-2000
-4000
ClO2-
ClO3-
0 2 4 6 8 10 12min
14 16 18 20 22 24
Fig. 1.14.1 Chromatogram for standard mixture of chlorite and chlorate
6000
4000
nS/c
m
2000
0
0 2 4 6 8 10 12min
ClO2-
ClO3-
F-
Cl-
NO2-Br- NO3-
PO43-
SO42-
14 16 18 20 22 24
Fig. 1.14.2 Chromatogram for standard mixture of 9 components
ClO2-
0 2 4 6 8 10 12min
14 16 18 20 22 24
6000
4000
nS/c
m
2000
0
ClO2-
Fig. 1.14.3 Chromatogram for tap water spiked with 0.06 mg/L chlorite
0 2 4 6 8 10 12min
14 16 18 20 22 24
ClO2-ClO3-
0
-2000
-4000
2000
4000
nS/c
m
Fig. 1.14.4 Chromatogram for tap water spiked with 0.06 mg/L chlorite and chlorate
22
1.15 Analysis of Isocyanuric Acid - LC
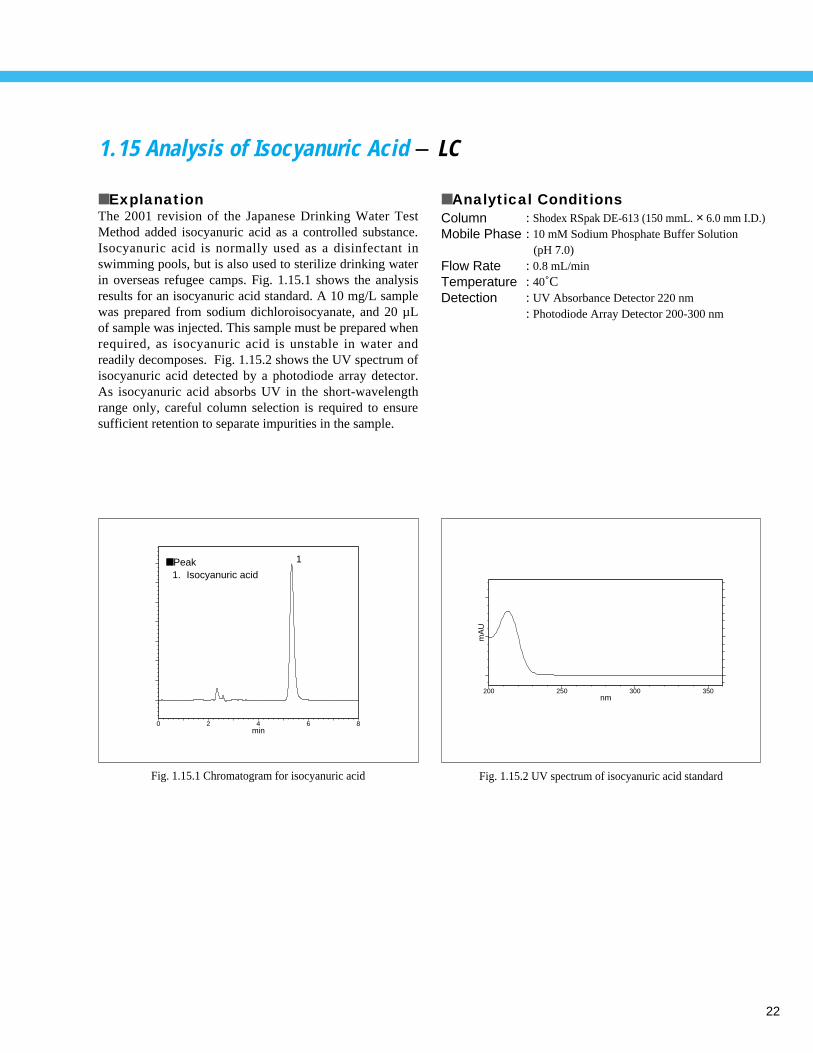
■ ExplanationThe 2001 revision of the Japanese Drinking Water TestMethod added isocyanuric acid as a controlled substance.Isocyanuric acid is normally used as a disinfectant inswimming pools, but is also used to sterilize drinking waterin overseas refugee camps. Fig. 1.15.1 shows the analysisresults for an isocyanuric acid standard. A 10 mg/L samplewas prepared from sodium dichloroisocyanate, and 20 µLof sample was injected. This sample must be prepared whenrequired, as isocyanuric acid is unstable in water andreadily decomposes. Fig. 1.15.2 shows the UV spectrum ofisocyanuric acid detected by a photodiode array detector.As isocyanuric acid absorbs UV in the short-wavelengthrange only, careful column selection is required to ensuresufficient retention to separate impurities in the sample.
■ Analytical ConditionsColumnMobile Phase
Flow RateTemperatureDetection
: Shodex RSpak DE-613 (150 mmL. × 6.0 mm I.D.): 10 mM Sodium Phosphate Buffer Solution
(pH 7.0): 0.8 mL/min: 40˚C: UV Absorbance Detector 220 nm: Photodiode Array Detector 200-300 nm
■ Peak1. Isocyanuric acid
1
min0 2 4 6 8
nm200 250 300 350
mA
U
Fig. 1.15.1 Chromatogram for isocyanuric acid Fig. 1.15.2 UV spectrum of isocyanuric acid standard
23
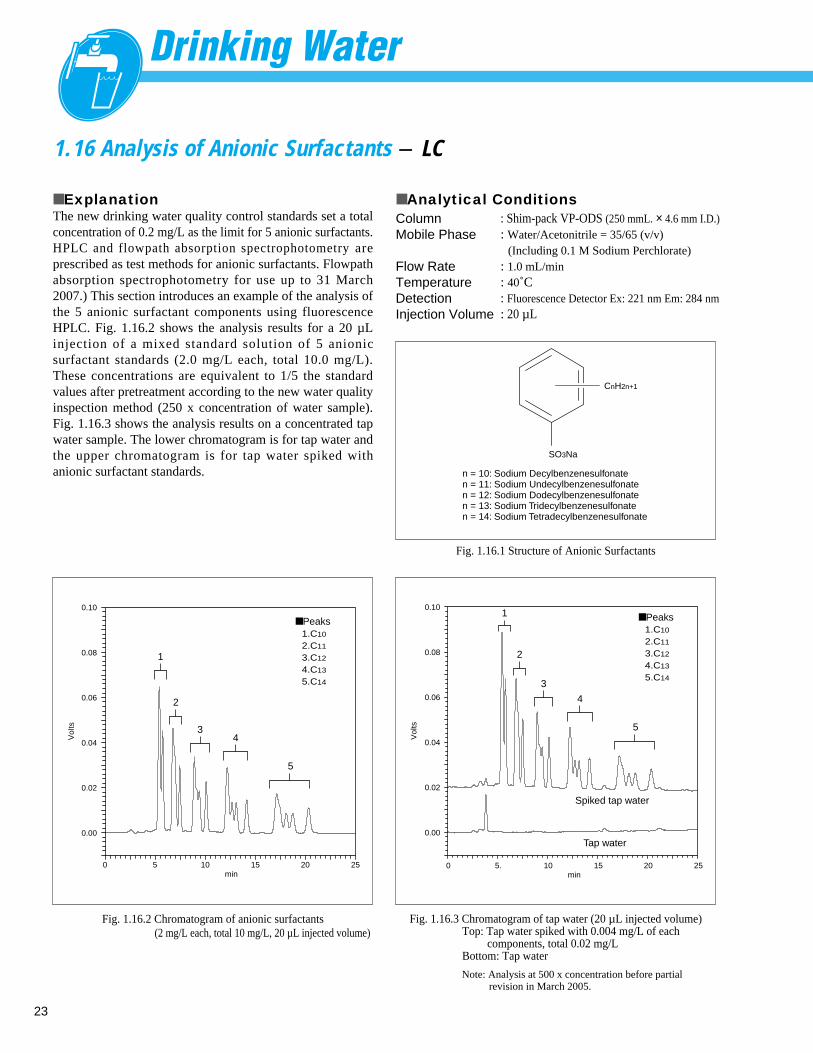
1.16 Analysis of Anionic Surfactants - LC
■ ExplanationThe new drinking water quality control standards set a totalconcentration of 0.2 mg/L as the limit for 5 anionic surfactants.HPLC and flowpath absorption spectrophotometry areprescribed as test methods for anionic surfactants. Flowpathabsorption spectrophotometry for use up to 31 March2007.) This section introduces an example of the analysis ofthe 5 anionic surfactant components using fluorescenceHPLC. Fig. 1.16.2 shows the analysis results for a 20 µLinjection of a mixed standard solution of 5 anionicsurfactant standards (2.0 mg/L each, total 10.0 mg/L).These concentrations are equivalent to 1/5 the standardvalues after pretreatment according to the new water qualityinspection method (250 x concentration of water sample).Fig. 1.16.3 shows the analysis results on a concentrated tapwater sample. The lower chromatogram is for tap water andthe upper chromatogram is for tap water spiked withanionic surfactant standards.
■ Analytical Conditions
Fig. 1.16.2 Chromatogram of anionic surfactants(2 mg/L each, total 10 mg/L, 20 µL injected volume)
Fig. 1.16.3 Chromatogram of tap water (20 µL injected volume)Top: Tap water spiked with 0.004 mg/L of each
components, total 0.02 mg/LBottom: Tap water
■ Peaks1.C10
2.C11
3.C12
4.C13
5.C14
1
min0 5 10 15 20 25
Vol
ts
0.00
0.02
0.04
0.06
0.08
0.10
2
34
5
Spiked tap water
Tap water
min0 5. 10 15 20 25
Vol
ts
0.00
0.02
0.04
0.06
0.08
0.101
2
3
4
5
■ Peaks1.C10
2.C11
3.C12
4.C13
5.C14
n = 10: Sodium Decylbenzenesulfonate n = 11: Sodium Undecylbenzenesulfonate n = 12: Sodium Dodecylbenzenesulfonate n = 13: Sodium Tridecylbenzenesulfonate n = 14: Sodium Tetradecylbenzenesulfonate
CnH2n+1
SO3Na
Fig. 1.16.1 Structure of Anionic Surfactants
Note: Analysis at 500 x concentration before partial revision in March 2005.
ColumnMobile Phase
Flow RateTemperatureDetectionInjection Volume
: Shim-pack VP-ODS (250 mmL. × 4.6 mm I.D.): Water/Acetonitrile = 35/65 (v/v)
(Including 0.1 M Sodium Perchlorate): 1.0 mL/min: 40˚C: Fluorescence Detector Ex: 221 nm Em: 284 nm: 20 µL
24
1.17 Analysis of Microcystins using Online Solid-Phase Extraction LC/MS - LC/MS
■ ExplanationMicrocystins are liver toxins and carcinogens that arecaused by the abnormal proliferation of blue-green algaedue to eutrophication of lakes and marshes. Themeasurement of these toxins is becoming increasinglyimportant in areas that take the raw water source for theirtap water supply from lakes or marshes. The 2003 revision of the Japanese Drinking Water TestMethod designated microcystin LR as a controlled item.The 2001 Drinking Water Test Method prescribed solid-phase extraction to adsorb 500 mL water sample, elution inan organic solvent and concentration of the eluate to 1 mL,and then analysis by HPLC or LC/MS. Conventionally, theextraction process required an experienced operator, as therecovery rate by solid-phase extraction differs according tothe solid-phase production lot and the water sample flowrate. The long time required for nitrogen purging and otherpretreatment operations also posed a problem for theoperators. Connecting the PROSPECT 2 automatic onlinesolid-phase extraction system to the LC/MS permits themeasurement of microcystin RR, YR, and LR down to 1/10the standard value, simply by loading the water sample intothe autosampler. As shown in Fig. 1.17.1, PROSPECT 2automates the solid-phase activation and equilibration, andsample loading. Components retained in the solid-phasecartridge are eluted online to the HPLC mobile phase,eliminating the need for nitrogen purging (evaporation) andreconstruction. Incorporating a variety of pretreatmentmethods allows automatic determination of the solid-phaseextraction conditions and the elimination of impurities byvalve switching and washing operations. Fig. 1.17.2 shows
■ Analytical ConditionsColumnMobile Phase AMobile Phase BGradient Program
Flow RateCartridgeInjection VolumeColumn TemperatureProbe VoltageCDL TemperatureBlock-Heater TemperatureNebulizer Gas Flow RateDrying Gas PressureCDL VoltageQ-array DC VoltageQ-array RF
: Shim-pack VP-ODS (150 mmL. × 2.0 mm I.D.): 0.1 % Formic Acid-Water: Acetonitrile: 10 % B-60 % B (15-20 min)
-100 % B (20.01-25 min)-10 % B (25.01-35 min)
: 0.2 mL/min: Inertsil ODS-3, 7 µm (10 mmL. × 2.0 mm I.D.): 5 mL (PROSPECT 2): 40˚C : +4.5 kV (ESI-Positive Mode): 200˚C: 200˚C: 1.5 L/min.: 0.1 MPa: +25 V (ESI-Positive Mode): S-Mode: 150
the SIM chromatograms from solid-phase extraction of 5mL of purified water samples spiked with 50 ng/Lmicrocystin RR, YR, and LR. Each sample is processed in35 minutes, as all the solid-phase extraction operationsfrom solid-phase activation to sample loading arecompleted during equilibration at the initial gradientconcentration.
2.5 5.0 7.5 10.0 12.5 15.0 17.5 min
2500
5000
7500
10000
12500
15000
17500
20000
22500
25000
27500
30000
Int.
498.50(2.80)523.50(3.39)520.00(1.00)
Microcystin RRm/z 520.00(M+2H)2+
Microcystin YRm/z 523.50(M+2H)2+
Microcystin LRm/z 498.50(M+2H)2+
Fig. 1.17.2 SIM chromatograms of microcystin RR, YR, and LR
Activa
tion
Equilib
ratio
n
Sample
load
ing
Was
hes
Analyt
e elut
ion
Evapo
ratio
n
Recon
stitut
ion
Injec
tion
anal
. col
umn
anal
. col
umn
PR
OS
PE
KT
OF
F-L
INE
"SWITCH VALVE"
N2
Fig. 1.17.1 Solid-phase extraction operations
25
1.18 Analysis of Chloral Hydrate and Haloacetonitriles (1) - GC/MS
■ ExplanationChloral hydrate and haloacetonitriles are byproducts of thedisinfection of tap water. The July 2001 revision of theJapanese Drinking Water Test Method adopted 1,2,3-trichloropropane as the internal standard and added twocomponents: chloroacetonitrile and bromochloroacetonitrile.Chloral hydrate and haloacetonitriles can be analyzedsimultaneously. Calibration curves were created for eachtarget component in the range from 10 µg/L to 1000 µg/Lusing the internal standard method. The solution of50 µL of 10 mg/L 1,2,3-trichloropropane was added to 2mLof each concentration sample as the internal standard tocreate the calibration curve. Figs. 1.18.1 to 1.18.7 show themass spectrum, the SIM mass chromatogram for a 10 µg/Lsample, and the calibration curve for each component.
■ Analytical ConditionsInstrument-GC-ColumnColumn TemperatureCarrier GasInjection MethodInjection Inlet Temperature Injection Volume-MS-Interface Temperature Ion-Source Temperature
: GCMS-QP2010
: DB-1 (30 m × 0.25 mm I.D. df=1.0 µm): 40˚C (10 min) -20˚C/min-200˚C (3 min): He, 43 cm/s, Constant Linear Velocity Mode: Splitless (2 min.): 250˚C: 1 µL
: 250˚C: 200˚C
m/z
100
30 40 50 60 70
40
487575 1,879
5.7
75*1.00
77*1.00
f(x)=0.002939*x-0.010103Correlation coefficient (R) =0.999985
1.0[*10^3]
0.0 0.5
2.0
[*10^0]
095.8
1.0
Fig. 1.18.2 Chloroacetonitrile
m/z
100
30 50 70 90 110 130
35
47
60
82
8585
111113
146
431
8.0 8.4
82*1.00
111*1.00
146*1.00
f(x)=0.001145*x+0.000235Correlation coefficient (R) = 0.999999
1.0[*10^3]
0.0 0.5
1.0
[*10^0]
0.0
0.5
Fig. 1.18.1 Chloral hydrate
26
1.18 Analysis of Chloral Hydrate and Haloacetonitrile (2) - GC/MS
m/z
100
30 40 50 60 70 80 90 100 110
3949
61
75
97
110
114
94,550
15.0
75*1.00
110*1.00
m/z
100
30 50 70 90 110 130 150 170 190
39 79 91
118
160
199
887
14.0 14.6
118*1.00
120*1.00
f(x)=0.000813*x-0.005497Correlation coefficient (R) =0.999940
[*10^3]1.00.0 0.5
8.0[*10^-1]
490.5
4.0
m/z
100
30 50 70 90 110 130 150
39 47
74
93 118 128153
1,686
12.0 12.5
74*1.00
155*1.00
f(x)=0.001713*x-0.008617Correlation coefficient (R) =0.999962
[*10^3]1.00.0 0.5
1.0
[*10^0]
105.4
0.8
m/z
100
30 40 50 60 70 80 90 100
38
47
74
86 108
1,468
7.0 7.7
74*1.00
82*1.00
f(x)=0.002115*x-0.009050Correlation coefficient (R) =0.999978
1.0[*10^3]
0.0 0.5
2.0
[*10^0]
525.4
1.0
m/z
100
30 40 50 60 70 80 90 100 110
3547 73
86
108108108 1,559
6.0 6.7
108*1.00
110*1.00
f(x)=0.002481*x-0.011735Correlation coefficient (R) =0.999963
1.0[*10^3]
0.0 0.5
2.0
[*10^0]
353.7
1.0
Fig. 1.18.3 Trichloroacetonitrile
Fig. 1.18.4 Dichloroacetonitrile
Fig. 1.18.5 Bromochloroacetonitrile
Fig. 1.18.6 Dibromoacetonitrile
Fig. 1.18.7 1,2,3-trichloropropane
27
1.19 Solvent Extraction and GC/MS Analysis of Haloacetic Acids in Water - GC/MS
■ ExplanationHaloacetic acids are known disinfection byproducts of thechlorine treatment of water. They were added to the waterquality control standards in May 2003. The standard valueswere set as 0.02 mg/L for chloroacetic acid, 0.04 mg/L fordichloroacetic acid, and 0.2 mg/L for trichloroacetic acid.These can be analyzed at high sensitivity using the SelectedIon Monitoring (SIM) method. Table 1.19.1 lists themonitor ions. Fig. 1.19.2 shows the SIM chromatograms ofstandard samples equivalent to 0.001 mg/L concentration inwater. Fig. 1.19.3 shows the calibration curves from 0.001to 0.1 mg/L. Fig. 1.19.4 shows the SIM chromatograms andquantitation results. 0.002 mg/L, which is 1/10 of the 0.02mg/L standard value, is used as the guideline for thequantitation lower limit required during the analysis of tapwater. The sensitivity achieved can satisfactorilyaccommodate this.
■ Analytical ConditionsInstrument-GC-ColumnColumn TemperatureCarrier GasInjection MethodInjection Inlet Temperature Injection Volume-MS-Interface Temperature Ion-Source TemperatureIonizationScan RangeScan IntervalSIMMonitor IonsSampling Interval
: GCMS-QP2010
: Rtx-1 (30 m × 0.25 mm I.D. df=1.0 µm): 35˚C (5 min) -15˚C/min-250˚C (5 min): He, 45 cm/s, Constant Linear Velocity Mode: Splitless (1 min.): 200˚C : 1 µL
: 230˚C : 200˚C : EI: m/z 35-350: 0.5 s
: See Table 1.19.1.: 0.2 s
Chloroacetic acid R=0.9999815
0.0 25.0 50.0 75.0 Conc Ratio0.0
0.5
1.0
1.5
2.0
2.5
3.0Area Ratio
Dichloroacetic acid R=0.9999871
0.0 25.0 50.0 75.0 Conc Ratio0.0
1.0
2.0
3.0
4.0
5.0
6.0
Area Ratio
Trichloroacetic acid R=0.9999956
0.0 25.0 50.0 75.0 Conc Ratio0.0
0.5
1.0
1.5
2.0
2.5
3.0
3.5
Area Ratio
Fig. 1.19.3 Calibration curves for haloacetic acid (0.001-0.1 mg/L)
Solvent Extraction, Derivatization, GC/MS Analysis
Sampling
50 mL water sample
Solvent extraction
Dehydration
Derivatization
GC/MS
Add 0.01 to 0.02 g sodium ascorbate per 1 mg residual chlorineReduce pH to 0.5 or below using sulfuric acid (1+1) and add 20 g sodium chloride.
4 mL methyl-t-butylether. Shake for 2 min.
Anhydrous sodium sulfate
0.2 mL diazomethane
Leave for 30-60 min
20 µL internal standard
Fig. 1.19.1 Haloacetic acid analysis flow
Chloroacetic acid
Dichloroacetic acid
Trichloroacetic acid
1,2,3-Trichloropropane
Quantitation ion
77
83
117
110
Reference ion
108
85
119
75
Table 1.19.1 Monitor ions
Chromatograms Sample name : 50 mL tap water +1 ppb
min
8,258
9.0 10.0 11.0 12
TIC8,258 TIC8,258 TIC
Chl
oroa
cetic
aci
d
Dic
hlor
oace
tic a
cid
Trich
loro
pro
pane
Tric
hlor
oace
tic a
cid
776
69
8.7
77
108
m/z: 77.00Type: TargetName: Chloroacetic acid
R.t.: 8.331Area: 257Conc.: 1.025 µg/L
m/z Intensity Ratio% Intensity Ratio%
Intensity Ratio%
108.00 97 38.00
862
1,404
10.0 10.3
83
85
m/z:83.00Type: TargetName: Dichloroacetic acid
R.t.: 9.925Area: 1425Conc.: 0.995 µg/L
m/z 85.00 885 62.00
440
411
11.0 11.7
117
119
m/z:117.00Type: TargetName: Trichloroacetic acid
R.t.: 11.309Area: 682
Conc.: 1.887 µg/L
m/z 119.00 673 99.00
Fig. 1.19.4 SIM chromatograms of tap water spiked with 0.001 mg/L standard
1,471
175
8.8
77
108
m/z: 77.00Type: TargetName: Chloroacetic acid
R.t.: 8.457Area: 471Conc.: 1.000 µg/L
m/z Intensity Ratio% 108.00 179 38.00
1,887
2,482
9.7 10.0 10.4
83
85
m/z:83.00Type: TargetName: Dichloroacetic acid
R.t.: 10.017Area: 909Conc.: 1.000 µg/L
m/z Intensity Ratio% 85.00 623 69.00
438
420
11.7
117
119
m/z:117.00Type: TargetName: Trichloroacetic acid
R.t.: 11.391Area: 623Conc.: 1.000 µg/L
m/z Intensity Ratio% 119.00 564 91.00
11,020
22,018
11.0 11.6
110
75
m/z:110.00Type: TargetName: Trichloropropane
R.t.: 11.291Area: 17160
m/z Intensity Ratio% 75.00 34618 202.00
Fig. 1.19.2 SIM chromatograms of a standard sample equivalent to 0.001 mg/L concentration in water
28
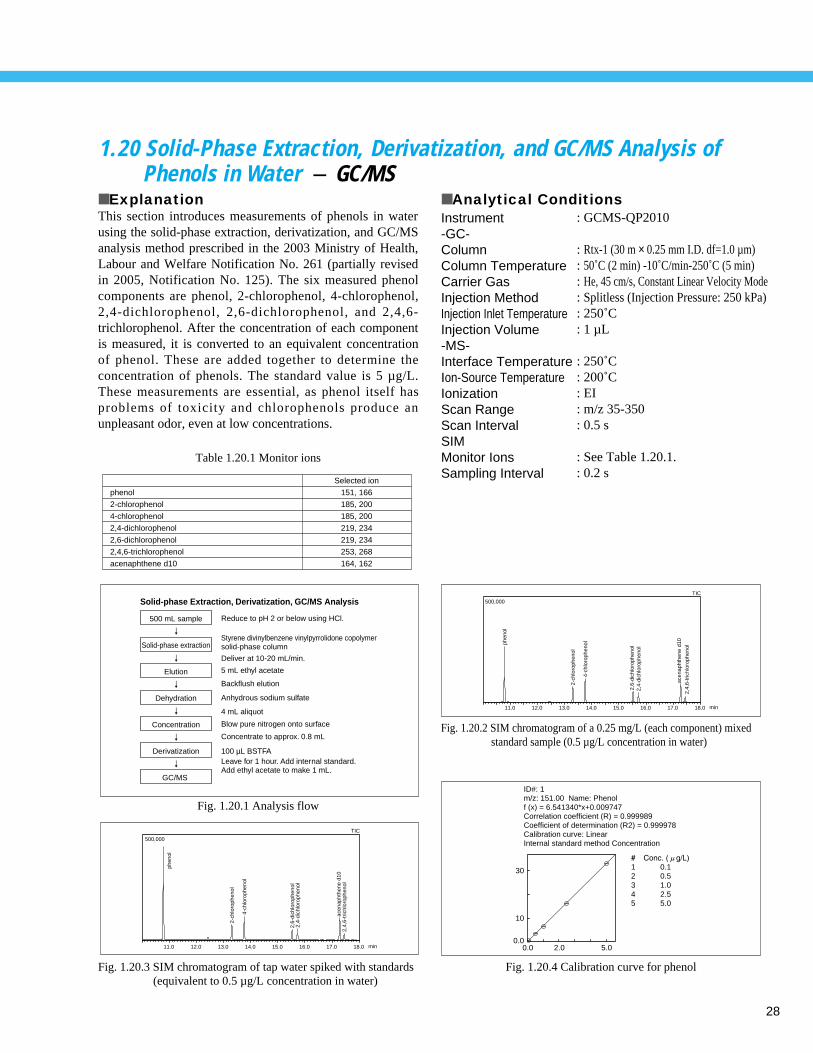
1.20 Solid-Phase Extraction, Derivatization, and GC/MS Analysis of Phenols in Water - GC/MS
■ ExplanationThis section introduces measurements of phenols in waterusing the solid-phase extraction, derivatization, and GC/MSanalysis method prescribed in the 2003 Ministry of Health,Labour and Welfare Notification No. 261 (partially revisedin 2005, Notification No. 125). The six measured phenolcomponents are phenol, 2-chlorophenol, 4-chlorophenol,2,4-dichlorophenol, 2,6-dichlorophenol, and 2,4,6-trichlorophenol. After the concentration of each componentis measured, it is converted to an equivalent concentrationof phenol. These are added together to determine theconcentration of phenols. The standard value is 5 µg/L.These measurements are essential, as phenol itself hasproblems of toxicity and chlorophenols produce anunpleasant odor, even at low concentrations.
■ Analytical ConditionsInstrument-GC-ColumnColumn TemperatureCarrier GasInjection MethodInjection Inlet Temperature Injection Volume-MS-Interface Temperature Ion-Source TemperatureIonizationScan RangeScan IntervalSIMMonitor IonsSampling Interval
: GCMS-QP2010
: Rtx-1 (30 m × 0.25 mm I.D. df=1.0 µm): 50˚C (2 min) -10˚C/min-250˚C (5 min): He, 45 cm/s, Constant Linear Velocity Mode: Splitless (Injection Pressure: 250 kPa): 250˚C : 1 µL
: 250˚C : 200˚C : EI: m/z 35-350: 0.5 s
: See Table 1.20.1.: 0.2 s
min
500,000
11.0 12.0 13.0 14.0 15.0 16.0 17.0 18.0
TIC
phen
ol
acen
apht
hene
d10
2-ch
loro
phen
ol
4-ch
loro
phen
ol
2,6-
dich
loro
phen
ol2,
4-di
chlo
roph
enol
2,4,
6-tr
ichl
orop
heno
l
Solid-phase Extraction, Derivatization, GC/MS Analysis
500 mL sample
Solid-phase extraction
Elution
Dehydration
Concentration
Derivatization
GC/MS
Styrene divinylbenzene vinylpyrrolidone copolymer solid-phase column
Reduce to pH 2 or below using HCl.
Deliver at 10-20 mL/min.
5 mL ethyl acetate
Backflush elution
Anhydrous sodium sulfate
4 mL aliquot
Blow pure nitrogen onto surface
Concentrate to approx. 0.8 mL
100 µL BSTFALeave for 1 hour. Add internal standard. Add ethyl acetate to make 1 mL.
ID#: 1m/z: 151.00 Name: Phenol
Correlation coefficient (R) = 0.999989Coefficient of determination (R2) = 0.999978Calibration curve: LinearInternal standard method Concentration
f (x) = 6.541340*x+0.009747
5.00.0 2.0
30
0.0
10
1 0.1 2 0.5 3 1.0 4 2.5 5 5.0
min
500,000
11.0 12.0 13.0 14.0 15.0 16.0 17.0 18.0
TIC
phen
ol
2-ch
loro
phen
ol
4-ch
loro
phen
ol
2,6-
dich
loro
phen
ol2,
4-di
chlo
roph
enol
acen
apht
hene
d10
2,4,
6-tr
ichl
orop
heno
l
phenol
2-chlorophenol
4-chlorophenol
2,4-dichlorophenol
2,6-dichlorophenol
2,4,6-trichlorophenol
acenaphthene d10
Selected ion
151, 166
185, 200
185, 200
219, 234
219, 234
253, 268
164, 162
Table 1.20.1 Monitor ions
Fig. 1.20.3 SIM chromatogram of tap water spiked with standards (equivalent to 0.5 µg/L concentration in water)
Fig. 1.20.4 Calibration curve for phenol
Fig. 1.20.1 Analysis flow
Fig. 1.20.2 SIM chromatogram of a 0.25 mg/L (each component) mixed standard sample (0.5 µg/L concentration in water)
29
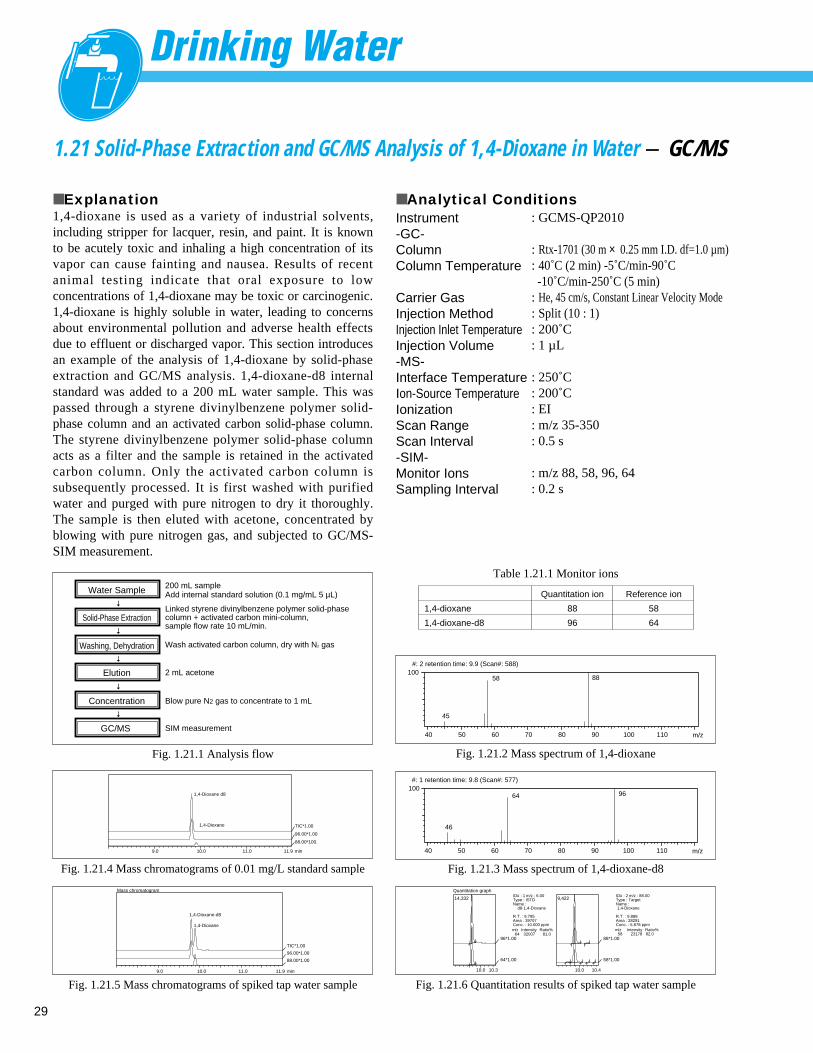
1.21 Solid-Phase Extraction and GC/MS Analysis of 1,4-Dioxane in Water - GC/MS
■ Explanation1,4-dioxane is used as a variety of industrial solvents,including stripper for lacquer, resin, and paint. It is knownto be acutely toxic and inhaling a high concentration of itsvapor can cause fainting and nausea. Results of recentanimal testing indicate that oral exposure to lowconcentrations of 1,4-dioxane may be toxic or carcinogenic.1,4-dioxane is highly soluble in water, leading to concernsabout environmental pollution and adverse health effectsdue to effluent or discharged vapor. This section introducesan example of the analysis of 1,4-dioxane by solid-phaseextraction and GC/MS analysis. 1,4-dioxane-d8 internalstandard was added to a 200 mL water sample. This waspassed through a styrene divinylbenzene polymer solid-phase column and an activated carbon solid-phase column.The styrene divinylbenzene polymer solid-phase columnacts as a filter and the sample is retained in the activatedcarbon column. Only the activated carbon column issubsequently processed. It is first washed with purifiedwater and purged with pure nitrogen to dry it thoroughly.The sample is then eluted with acetone, concentrated byblowing with pure nitrogen gas, and subjected to GC/MS-SIM measurement.
■ Analytical ConditionsInstrument-GC-ColumnColumn Temperature
Carrier GasInjection MethodInjection Inlet Temperature Injection Volume-MS-Interface Temperature Ion-Source TemperatureIonizationScan RangeScan Interval-SIM-Monitor IonsSampling Interval
: GCMS-QP2010
: Rtx-1701 (30 m × 0.25 mm I.D. df=1.0 µm): 40˚C (2 min) -5˚C/min-90˚C -10˚C/min-250˚C (5 min)
: He, 45 cm/s, Constant Linear Velocity Mode: Split (10 : 1): 200˚C : 1 µL
: 250˚C : 200˚C : EI: m/z 35-350: 0.5 s
: m/z 88, 58, 96, 64: 0.2 s
Fig. 1.21.6 Quantitation results of spiked tap water sample
Mass chromatogram
min 9.0 10.0 11.0 11.9
TIC*1.00
96.00*1.00
88.00*1.00
1,4-Dioxane-d8
1,4-Dioxane
min 9.0 10.0 11.0 11.9
TIC*1.00
96.00*1.00
88.00*100.
1,4-Dioxane d8
1,4-Dioxane
Water Sample 200 mL sample Add internal standard solution (0.1 mg/mL 5 µL)
Solid-Phase ExtractionLinked styrene divinylbenzene polymer solid-phase column + activated carbon mini-column, sample flow rate 10 mL/min.
Washing, Dehydration Wash activated carbon column, dry with N2 gas
Elution 2 mL acetone
Concentration Blow pure N2 gas to concentrate to 1 mL
GC/MS SIM measurement
Quantitation graph
14,332
10.0 10.3
96*1.00
64*1.00
ID# : 1 m/z : 6.00Type : ISTDName : d8-1,4-Dioxane
R.T. : 9.795Area : 39707Conc. : 10.000 ppmm/z Intensity Ratio% Intensity Ratio% 64 32007 81.0
9,422
10.0 10.4
88*1.00
58*1.00
ID# : 2 m/z : 88.00Type : TargetName : 1,4-Dioxane
R.T. : 9.888Area : 28291Conc. : 5.878 ppmm/z 58 23178 82.0
#: 1 retention time: 9.8 (Scan#: 577)
m/z
100
40 50 60 70 80 90 100 110
46
64 96
#: 2 retention time: 9.9 (Scan#: 588)
m/z
100
40 50 60 70 80 90 100 110
45
58 88
1,4-dioxane
1,4-dioxane-d8
Quantitation ion
88
96
Reference ion
58
64
Fig. 1.21.2 Mass spectrum of 1,4-dioxane
Fig. 1.21.3 Mass spectrum of 1,4-dioxane-d8Fig. 1.21.4 Mass chromatograms of 0.01 mg/L standard sample
Fig. 1.21.5 Mass chromatograms of spiked tap water sample
Table 1.21.1 Monitor ions
Fig. 1.21.1 Analysis flow
30
1.22 Headspace Analysis of 1,4-Dioxane in Water- GC/MS
■ Explanation1,4-dioxane is a widely used solvent for waxes and dyes.Residues in the environment and effects on human healthare causes for concern. The World Health Organization(WHO) added 1,4-dioxane as a controlled substance duringa comprehensive revision of its quality guidelines fordrinking water. As most of the solid-phase extraction andGC/MS analysis process for 1,4-dioxane must be conductedmanually, it takes time to obtain analysis results. Inaddition, discrepancies can occur in measured results due todifferences in operator skill. The headspace–GC/MS methodis used to measure volatile organic compounds in water.This method automates all operations after the sample is putinto vials. The HS–GC/MS method permits quicker andeasier analysis than the solid-phase extraction method. Fig.1.22.1 shows the total ion chromatogram and mass spectrumof 1,4-dioxane. Fig. 1.22.2 shows the SIM chromatogramsof 1,4-dioxane at concentrations of 0.001 mg/L and 0.005mg/L.
■ Analytical ConditionsInstrument
-HS-Sample VolumeThermostat TemperatureNeedle TemperatureTransfer TemperatureCarrier Gas-GC-ColumnColumn Temperature-MS-Interface Temperature Ion-Source TemperatureScan IntervalMonitor IonsSampling Interval
: TurboMarix40+GCMS-QP2010
: 10 mL (3 g NaCl): 60˚C (30 min): 100˚C : 150˚C: He, 140 kPa
: Rtx-624 (60 m × 0.32 mm I.D. df=1.8 µm): 35˚C (1 min) -10˚C/min-230˚C (5 min)
: 220˚C : 200˚C : 0.3 s: m/z 88, 58: 0.2 s
Fig. 1.22.2 SIM Chromatograms of 1,4-dioxane (0.001 mg/L and 0.005 mg/L)
Fig. 1.22.1 Total ion chromatogram and mass spectrum
0.001 mg/L1,016
1,016
9.0 9.8
88
58
1 58.00 261 78.00 1 58.00 1446 77.00
0.005 mg/L2,253
2,253
9.0 9.8
88
58
ID# : 1 m/z : 88.00Type : TargetName : 1,4-Dioxane
R.T. : 9.327Area : 964
m# #/z Intensity Ratio%
ID# : 1 m/z : 88.00Type : TargetName : 1,4-Dioxane
R.T. : 9.305Area : 5099
m/z Intensity Ratio%
min
500,000
9.0 10.0 11.0 12.0 13.0 14.0 14.9
TIC
1,4-
Dio
xane # : 1 Retention time: 9.3 (Scan#: 162) No. of peaks: 18 Base peak: 88 (76195)
Spectrum: single 9.3 (162) Background: 9.3 (155)
m/z
100
40 60 80 100 120 140 160 180 200 220 240
43
58
73
88
31
1.23 Simultaneous Analysis of 1,4-Dioxane and VOCs in Water using Purge&Trap GC/MS- GC/MS
■ ExplanationSolid-phase extraction and GC/MS is used as the analysismethod for 1,4-dioxane in water. As most of the solid-phaseextraction process must be conducted manually, it takestime to obtain analysis results. While not conforming to theofficial method, HS-GC/MS or P&T-GC/MS can also beused for the analysis of 1,4-dioxane. P&T-GC/MS, inparticular, permits high-sensitivity analysis of compoundsthat are highly soluble in water. Fig. 1.23.1 shows thechromatogram of a 1 µg/L standard solution made byadding 1,4-dioxane and methyl-t-butylether to standardsamples of 23 VOCs. Adequate separation was achieved forquantitation. Fig. 1.23.3 shows the SIM chromatograms for0.1 µ g/L 1,4-dioxane. Satisfactory repeatability wasachieved for both 1,4-dioxane and the other VOCs. Table1.23.2 shows the repeatability for 0.1 µ g/L 1,1-dichloroethylene, chloroform, 1,4-dioxane, andtetrachloroethylene.
■ Analytical ConditionsInstrument
-P&T-TrapPurge TimePurge Flow RateAdsorption/Desorption TimeSample Volume-GC-ColumnColumn Temperature
-MS-Interface Temperature Ion-Source TemperatureIonization
: AQUA PT 5000J (Tekmar) +GCMS-QP2010
: GL Trap: 7 min Preheat Temperature: 60˚C : 40 mL/min Dry Purge Time: 7 min: 3 min Temperature: 200˚C: 5 mL
: AQUATIC2 (60 m × 0.32 mm I.D. df=1.8 µm): 40˚C (7 min) -3˚C/min-80˚C
-15˚C/min-220˚C (5 min)
: 220˚C: 200˚C: EI
Fig. 1.23.3 SIM chromatograms for 0.1 µg/L 1,4-dioxane
Quantitation graph
467
18.0 18.8
88*1.00
58*1.00
ID# : 14 m/z : 88.00Type : TargetName : 1,4-Dioxane
R.T. : 18.274Area : 3016
min
1,500,000
10.0 20.0 29.0
TIC
12 3 4 5 6
7 8
9
10 1112 13 14 15
16
17181920
21
22
23
24
14
1,4-Dioxane
131211
min
10,000
16.0 17.0 18.0 19.0
1,1-DichloroethyleneChloroform1,4-DioxaneTetrachloroethylene.
1
0.0950.0930.1190.117
2
0.0920.0920.1170.118
3
0.0950.0920.120.118
4
0.0930.0910.1190.119
5
0.0920.0890.1050.12
Average
0.0940.0920.1160.119
1.51.455.51.04
CV(%)
Peak No. 123456789
101112131415161718192021222324
Compound1,1-DichloroethyleneDichloromethaneMethyl-t-butyl ethertrans-1,2-Dichloroethylenecis-1,2-DichloroethyleneChloroform1,1,1-TrichloroethaneCarbontetrachlorideBenzene1,2-DichloroethaneTrichloroethylene1,2-DichloropropaneBromodichloromethane1,4-Dioxanecis-1,3-DichloropropeneToluenetrans-1,3-Dichloropropene1,1,2-TrichloroethaneTetrachloroethyleneDibromochloromethanem,p-Xyleneo-XyleneBromoformp-Dichlorobenzene
96847396968397
1177862
13063838875917583
166129106106173146
SIM61865761618599
119774995628558
11092
11097
164127105105171148
9849
98984761
1215264
132
47
85129131
9191
175
Table 1.23.1 Table of monitor ions
Table 1.23.2 Repeatability (0.1 µg/L concentration)
Fig. 1.23.2 Enlarged chromatogram
Fig. 1.23.1 SIM chromatogram for 25 VOCs
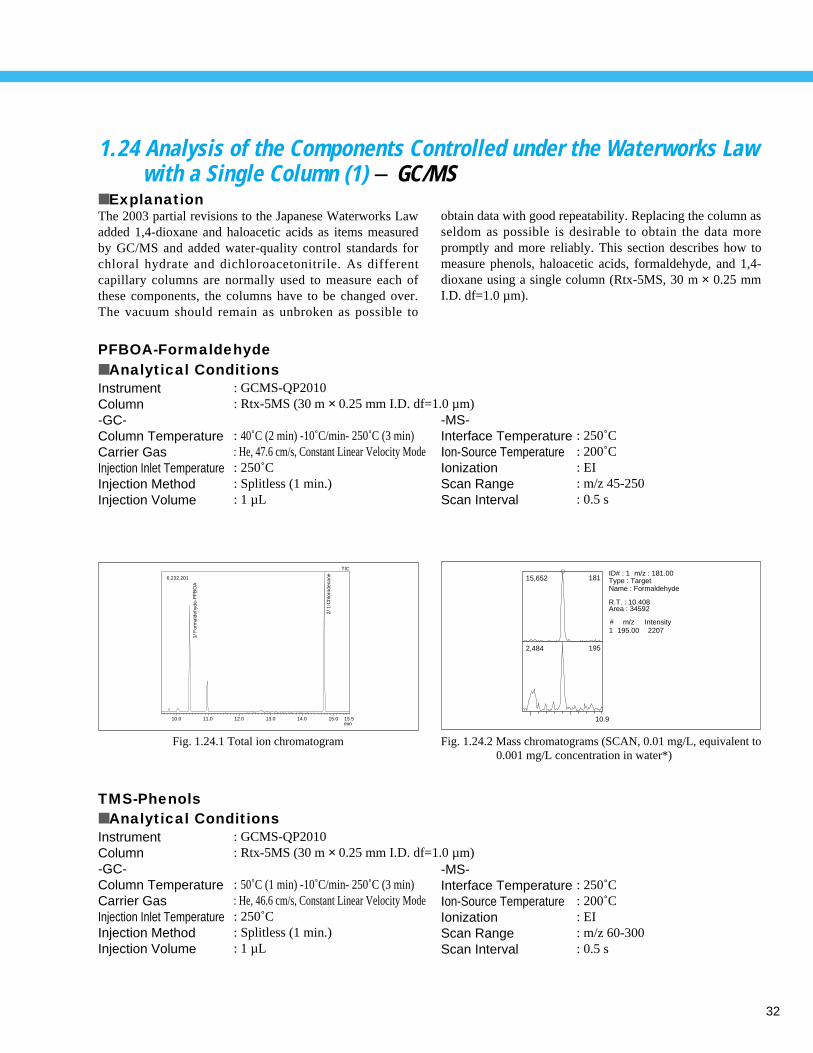
32
1.24 Analysis of the Components Controlled under the Waterworks Lawwith a Single Column (1) - GC/MS
■ ExplanationThe 2003 partial revisions to the Japanese Waterworks Lawadded 1,4-dioxane and haloacetic acids as items measuredby GC/MS and added water-quality control standards forchloral hydrate and dichloroacetonitrile. As differentcapillary columns are normally used to measure each ofthese components, the columns have to be changed over.The vacuum should remain as unbroken as possible to
■ Analytical ConditionsInstrumentColumn-GC-Column TemperatureCarrier GasInjection Inlet TemperatureInjection MethodInjection Volume
: GCMS-QP2010: Rtx-5MS (30 m × 0.25 mm I.D. df=1.0 µm)
: 40˚C (2 min) -10˚C/min- 250˚C (3 min): He, 47.6 cm/s, Constant Linear Velocity Mode: 250˚C: Splitless (1 min.) : 1 µL
obtain data with good repeatability. Replacing the column asseldom as possible is desirable to obtain the data morepromptly and more reliably. This section describes how tomeasure phenols, haloacetic acids, formaldehyde, and 1,4-dioxane using a single column (Rtx-5MS, 30 m × 0.25 mmI.D. df=1.0 µm).
PFBOA-Formaldehyde
-MS-Interface Temperature Ion-Source TemperatureIonizationScan RangeScan Interval
: 250˚C : 200˚C : EI: m/z 45-250: 0.5 s
min
6,232,201
10.0 11.0 12.0 13.0 14.0 15.0 15.5
TIC
1/ F
orm
alde
hyde
-PF
BO
A
2/ 1
-Chl
orod
ecan
e
15,652
2,484
10.9
181
195
1 195.00 2207
ID# : 1 m/z : 181.00Type : TargetName : Formaldehyde
R.T. : 10.408Area : 34592
m# /z Intensity
■ Analytical ConditionsInstrumentColumn-GC-Column TemperatureCarrier GasInjection Inlet TemperatureInjection MethodInjection Volume
: GCMS-QP2010: Rtx-5MS (30 m × 0.25 mm I.D. df=1.0 µm)
: 50˚C (1 min) -10˚C/min- 250˚C (3 min): He, 46.6 cm/s, Constant Linear Velocity Mode: 250˚C: Splitless (1 min.) : 1 µL
Fig. 1.24.1 Total ion chromatogram Fig. 1.24.2 Mass chromatograms (SCAN, 0.01 mg/L, equivalent to 0.001 mg/L concentration in water*)
-MS-Interface Temperature Ion-Source TemperatureIonizationScan RangeScan Interval
: 250˚C : 200˚C : EI: m/z 60-300: 0.5 s
TMS-Phenols
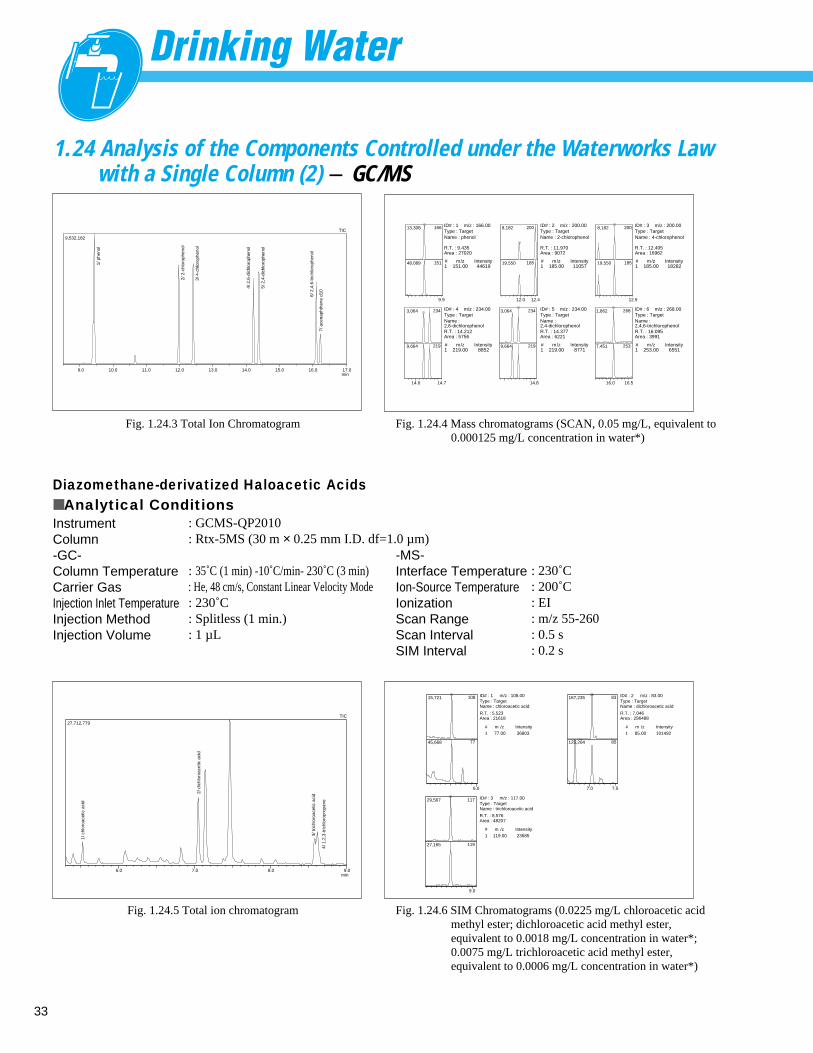
33
■ Analytical ConditionsInstrumentColumn-GC-Column TemperatureCarrier GasInjection Inlet TemperatureInjection MethodInjection Volume
: GCMS-QP2010: Rtx-5MS (30 m × 0.25 mm I.D. df=1.0 µm)
: 35˚C (1 min) -10˚C/min- 230˚C (3 min): He, 48 cm/s, Constant Linear Velocity Mode: 230˚C: Splitless (1 min.) : 1 µL
Diazomethane-derivatized Haloacetic Acids
-MS-Interface Temperature Ion-Source TemperatureIonizationScan RangeScan IntervalSIM Interval
: 230˚C : 200˚C : EI: m/z 55-260: 0.5 s: 0.2 s
min
9,532,182
9.0 10.0 11.0 12.0 13.0 14.0 15.0 16.0 17.0
TIC
1/ p
heno
l
2/ 2
-chl
orop
heno
l
3/ 4
-chl
orop
heno
l
4/ 2
,6-d
ichl
orop
heno
l
5/ 2
,4-d
ichl
orop
heno
l
6/ 2
,4,6
-tric
hlor
ophe
nol
7/ a
cena
phth
ene
d10
13,308
48,089
9.9
166
151
8,182
19,550
12.0 12.4
200
185
8,182
19,550
12.9
200
185
3,064
9,664
14.0 14.7
234
219
3,064
9,664
14.8
234
219
1,862
7,451
16.0 16.5
268
253
1 151.00 44619
ID# : 1 m/z : 166.00Type : TargetName : phenol
R.T. : 9.435Area : 27020
m# /z Intensity 1 185.00 11057
ID# : 2 m/z : 200.00Type : TargetName : 2-chlorophenol
R.T. : 11.970Area : 9072
m# /z Intensity 1 185.00 18282
ID# : 3 m/z : 200.00Type : TargetName : 4-chlorophenol
R.T. : 12.405Area : 16962
m# /z Intensity
1 219.00 8852
ID# : 4 m/z : 234.00Type : TargetName : 2,6-dichlorophenolR.T. : 14.212Area : 5756
m# /z Intensity 1 219.00 8771
ID# : 5 m/z : 234.00Type : TargetName : 2,4-dichlorophenolR.T. : 14.377Area : 6221
m# /z Intensity 1 253.00 6551
ID# : 6 m/z : 268.00Type : TargetName : 2,4,6-trichlorophenolR.T. : 16.095Area : 3991
m# /z Intensity
min
27,712,779
6.0 7.0 8.0 9.0
TIC
1/ c
hlor
oace
tic a
cid
2/ d
ichl
oroa
cetic
aci
d
3/ tr
ichl
oroa
cetic
aci
d
4/ 1
,2,3
-tric
hlor
opro
pane
15,721
45,668
6.0
108
77
167,235
125,204
7.0 7.5
83
85
29,567
27,165
9.0
117
119
1 77.00 36803
ID# : 1 m/z : 108.00Type : TargetName : chloroacetic acid
R.T. : 5.523Area : 21618
m# /z Intensity
1 119.00 23685
ID# : 3 m/z : 117.00Type : TargetName : trichloroacetic acid
R.T. : 8.576Area : 48207
m# /z Intensity
1 85.00 101492
ID# : 2 m/z : 83.00Type : TargetName : dichloroacetic acid
R.T. : 7.046Area : 296488
m# /z Intensity
1.24 Analysis of the Components Controlled under the Waterworks Lawwith a Single Column (2) - GC/MS
Fig. 1.24.3 Total Ion Chromatogram Fig. 1.24.4 Mass chromatograms (SCAN, 0.05 mg/L, equivalent to 0.000125 mg/L concentration in water*)
Fig. 1.24.5 Total ion chromatogram Fig. 1.24.6 SIM Chromatograms (0.0225 mg/L chloroacetic acid methyl ester; dichloroacetic acid methyl ester, equivalent to 0.0018 mg/L concentration in water*; 0.0075 mg/L trichloroacetic acid methyl ester, equivalent to 0.0006 mg/L concentration in water*)
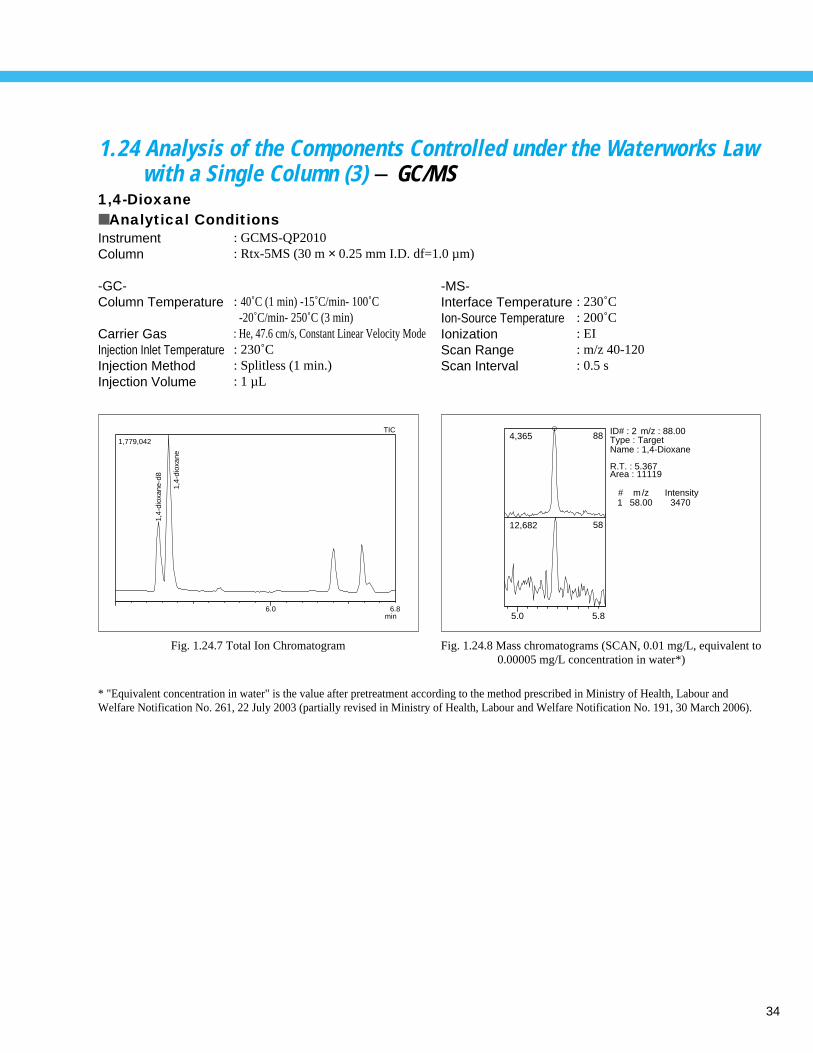
34
1.24 Analysis of the Components Controlled under the Waterworks Lawwith a Single Column (3) - GC/MS
■ Analytical ConditionsInstrumentColumn
-GC-Column Temperature
Carrier GasInjection Inlet TemperatureInjection MethodInjection Volume
: GCMS-QP2010: Rtx-5MS (30 m × 0.25 mm I.D. df=1.0 µm)
: 40˚C (1 min) -15˚C/min- 100˚C -20˚C/min- 250˚C (3 min)
: He, 47.6 cm/s, Constant Linear Velocity Mode: 230˚C: Splitless (1 min.) : 1 µL
1,4-Dioxane
-MS-Interface Temperature Ion-Source TemperatureIonizationScan RangeScan Interval
: 230˚C : 200˚C : EI: m/z 40-120: 0.5 s
min
1,779,042
6.0 6.8
TIC
1,4-
diox
ane-
d8
1,4-
diox
ane
4,365
12,682
5.0 5.8
88
58
1 58.00 3470
ID# : 2 m/z : 88.00Type : TargetName : 1,4-Dioxane
R.T. : 5.367Area : 11119
m# /z Intensity
* "Equivalent concentration in water" is the value after pretreatment according to the method prescribed in Ministry of Health, Labour and Welfare Notification No. 261, 22 July 2003 (partially revised in Ministry of Health, Labour and Welfare Notification No. 191, 30 March 2006).
Fig. 1.24.7 Total Ion Chromatogram Fig. 1.24.8 Mass chromatograms (SCAN, 0.01 mg/L, equivalent to 0.00005 mg/L concentration in water*)
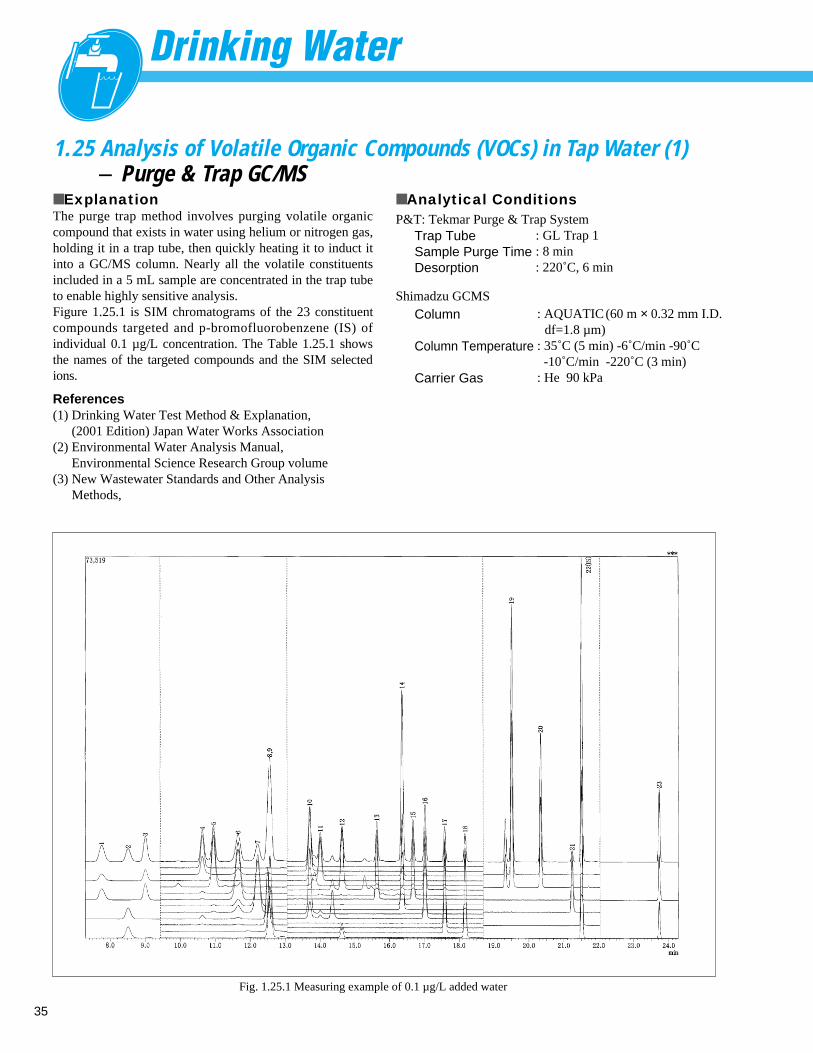
35
1.25 Analysis of Volatile Organic Compounds (VOCs) in Tap Water (1)- Purge & Trap GC/MS
■ ExplanationThe purge trap method involves purging volatile organiccompound that exists in water using helium or nitrogen gas,holding it in a trap tube, then quickly heating it to induct itinto a GC/MS column. Nearly all the volatile constituentsincluded in a 5 mL sample are concentrated in the trap tubeto enable highly sensitive analysis.Figure 1.25.1 is SIM chromatograms of the 23 constituentcompounds targeted and p-bromofluorobenzene (IS) ofindividual 0.1 µg/L concentration. The Table 1.25.1 showsthe names of the targeted compounds and the SIM selectedions.
References(1) Drinking Water Test Method & Explanation,
(2001 Edition) Japan Water Works Association(2) Environmental Water Analysis Manual,
Environmental Science Research Group volume(3) New Wastewater Standards and Other Analysis
Methods,
Trap TubeSample Purge TimeDesorption
: GL Trap 1: 8 min: 220˚C, 6 min
Fig. 1.25.1 Measuring example of 0.1 µg/L added water
Column
Column Temperature
Carrier Gas
Shimadzu GCMS
P&T: Tekmar Purge & Trap System
■ Analytical Conditions
: AQUATIC(60 m × 0.32 mm I.D.df=1.8 µm)
: 35˚C (5 min) -6˚C/min -90˚C-10˚C/min -220˚C (3 min)
: He 90 kPa
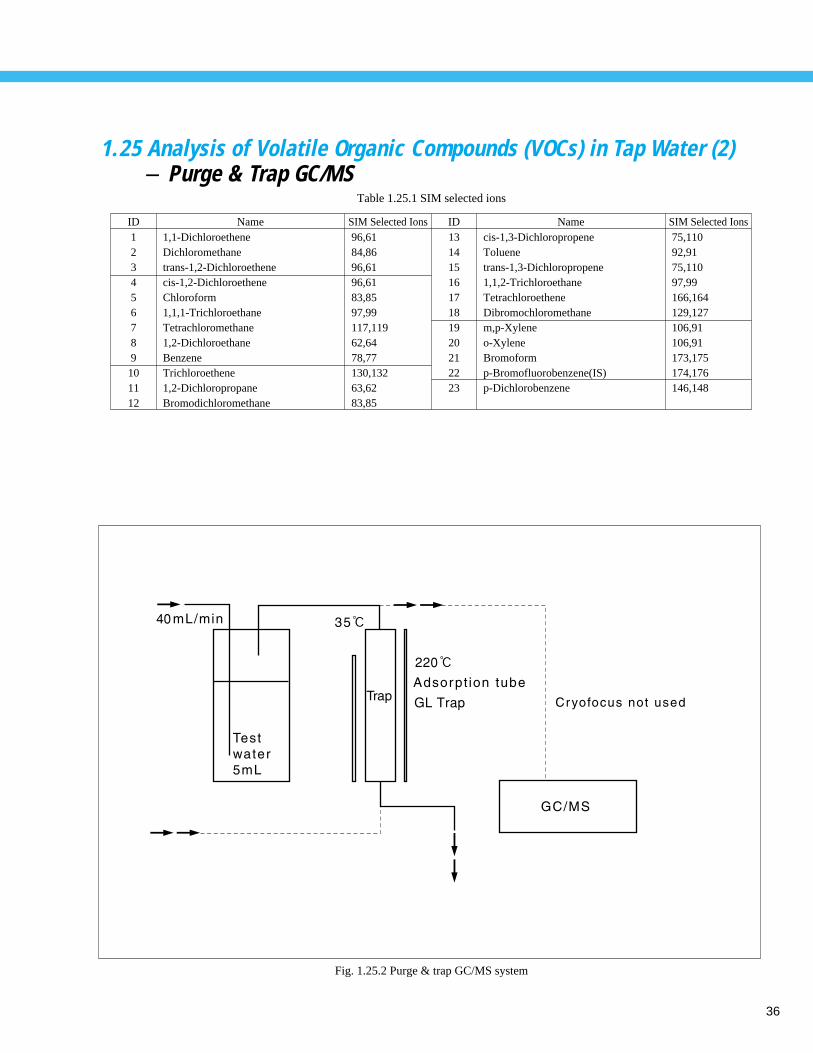
36
1.25 Analysis of Volatile Organic Compounds (VOCs) in Tap Water (2)- Purge & Trap GC/MS
Fig. 1.25.2 Purge & trap GC/MS system
123456789101112
ID1,1-DichloroetheneDichloromethanetrans-1,2-Dichloroethenecis-1,2-DichloroetheneChloroform1,1,1-TrichloroethaneTetrachloromethane1,2-DichloroethaneBenzeneTrichloroethene1,2-DichloropropaneBromodichloromethane
Name96,6184,8696,6196,6183,8597,99117,11962,6478,77130,13263,6283,85
SIM Selected Ions1314151617181920212223
IDcis-1,3-DichloropropeneToluenetrans-1,3-Dichloropropene1,1,2-TrichloroethaneTetrachloroetheneDibromochloromethanem,p-Xyleneo-XyleneBromoformp-Bromofluorobenzene(IS)p-Dichlorobenzene
Name75,11092,9175,11097,99166,164129,127106,91106,91173,175174,176146,148
SIM Selected Ions
Table 1.25.1 SIM selected ions
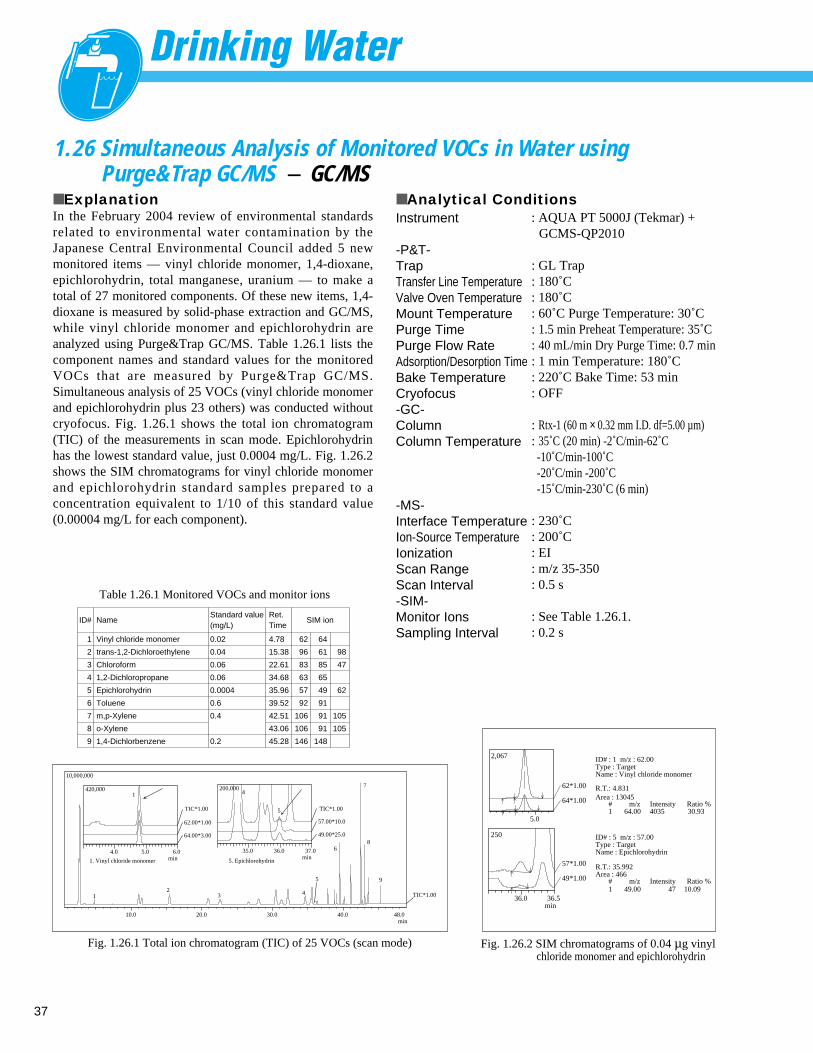
37
1.26 Simultaneous Analysis of Monitored VOCs in Water using Purge&Trap GC/MS - GC/MS
■ ExplanationIn the February 2004 review of environmental standardsrelated to environmental water contamination by theJapanese Central Environmental Council added 5 newmonitored items –– vinyl chloride monomer, 1,4-dioxane,epichlorohydrin, total manganese, uranium –– to make atotal of 27 monitored components. Of these new items, 1,4-dioxane is measured by solid-phase extraction and GC/MS,while vinyl chloride monomer and epichlorohydrin areanalyzed using Purge&Trap GC/MS. Table 1.26.1 lists thecomponent names and standard values for the monitoredVOCs that are measured by Purge&Trap GC/MS.Simultaneous analysis of 25 VOCs (vinyl chloride monomerand epichlorohydrin plus 23 others) was conducted withoutcryofocus. Fig. 1.26.1 shows the total ion chromatogram(TIC) of the measurements in scan mode. Epichlorohydrinhas the lowest standard value, just 0.0004 mg/L. Fig. 1.26.2shows the SIM chromatograms for vinyl chloride monomerand epichlorohydrin standard samples prepared to aconcentration equivalent to 1/10 of this standard value(0.00004 mg/L for each component).
■ Analytical ConditionsInstrument
-P&T-TrapTransfer Line TemperatureValve Oven TemperatureMount Temperature Purge TimePurge Flow RateAdsorption/Desorption TimeBake TemperatureCryofocus-GC-ColumnColumn Temperature
-MS-Interface Temperature Ion-Source TemperatureIonizationScan RangeScan Interval-SIM-Monitor IonsSampling Interval
: AQUA PT 5000J (Tekmar) +GCMS-QP2010
: GL Trap: 180˚C: 180˚C: 60˚C Purge Temperature: 30˚C : 1.5 min Preheat Temperature: 35˚C : 40 mL/min Dry Purge Time: 0.7 min: 1 min Temperature: 180˚C: 220˚C Bake Time: 53 min: OFF
: Rtx-1 (60 m × 0.32 mm I.D. df=5.00 µm): 35˚C (20 min) -2˚C/min-62˚C
-10˚C/min-100˚C-20˚C/min -200˚C-15˚C/min-230˚C (6 min)
: 230˚C: 200˚C: EI: m/z 35-350: 0.5 s
: See Table 1.26.1.: 0.2 s
2,067
5.0
62*1.00
64*1.00
ID# : 1 m/z : 62.00Type : TargetName : Vinyl chloride monomer
R.T.: 4.831Area : 13045
# m/z Intensity Ratio %
# m/z Intensity Ratio %
1 64.00 4035 30.93
1,935
57*1.00
49*1.00
ID# : 5 m/z : 57.00Type : TargetName : Epichlorohydrin
R.T.: 35.992Area : 466
1 49.00 47 10.09
min
250
36.0 36.5
min
10,000,000
10.0 20.0 30.0 40.0 48.0
min
420,000
4.0 5.0 6.0
62.00*1.00
64.00*3.00
min
200,000
35.0 36.0 37.0
57.00*10.0
49.00*25.0
1. Vinyl chloride monomer 5. Epichlorohydrin
21
1
5
43
6
7
8
5
9
TIC*1.00 TIC*1.00
TIC*1.00
4
ID#
1
2
3
4
5
6
7
8
9
Name
Vinyl chloride monomer
trans-1,2-Dichloroethylene
Chloroform
1,2-Dichloropropane
Epichlorohydrin
Toluene
m,p-Xylene
o-Xylene
1,4-Dichlorbenzene
Standard value(mg/L)
0.02
0.04
0.06
0.06
0.0004
0.6
0.4
0.2
Ret.Time
4.78
15.38
22.61
34.68
35.96
39.52
42.51
43.06
45.28
62
96
83
63
57
92
106
106
146
SIM ion
64
61
85
65
49
91
91
91
148
98
47
62
105
105
Table 1.26.1 Monitored VOCs and monitor ions
Fig. 1.26.1 Total ion chromatogram (TIC) of 25 VOCs (scan mode) Fig. 1.26.2 SIM chromatograms of 0.04 µg vinyl chloride monomer and epichlorohydrin
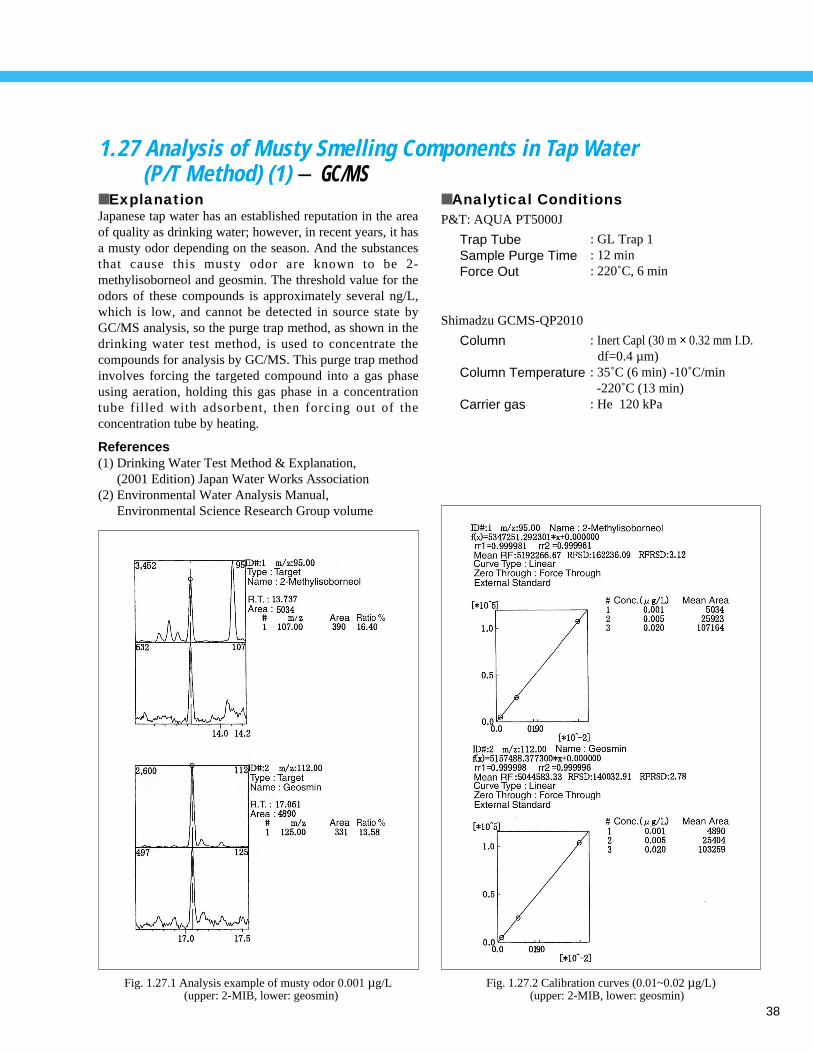
38
1.27 Analysis of Musty Smelling Components in Tap Water (P/T Method) (1) - GC/MS
■ ExplanationJapanese tap water has an established reputation in the areaof quality as drinking water; however, in recent years, it hasa musty odor depending on the season. And the substancesthat cause this musty odor are known to be 2-methylisoborneol and geosmin. The threshold value for theodors of these compounds is approximately several ng/L,which is low, and cannot be detected in source state byGC/MS analysis, so the purge trap method, as shown in thedrinking water test method, is used to concentrate thecompounds for analysis by GC/MS. This purge trap methodinvolves forcing the targeted compound into a gas phaseusing aeration, holding this gas phase in a concentrationtube filled with adsorbent, then forcing out of theconcentration tube by heating.
References (1) Drinking Water Test Method & Explanation,
(2001 Edition) Japan Water Works Association(2) Environmental Water Analysis Manual,
Environmental Science Research Group volume
■ Analytical Conditions
Fig. 1.27.1 Analysis example of musty odor 0.001 µg/L(upper: 2-MIB, lower: geosmin)
Fig. 1.27.2 Calibration curves (0.01~0.02 µg/L)(upper: 2-MIB, lower: geosmin)
P&T: AQUA PT5000J
Shimadzu GCMS-QP2010
Trap TubeSample Purge TimeForce Out
: GL Trap 1: 12 min: 220˚C, 6 min
Column
Column Temperature
Carrier gas
: Inert Capl (30 m × 0.32 mm I.D.df=0.4 µm)
: 35˚C (6 min) -10˚C/min -220˚C (13 min)
: He 120 kPa
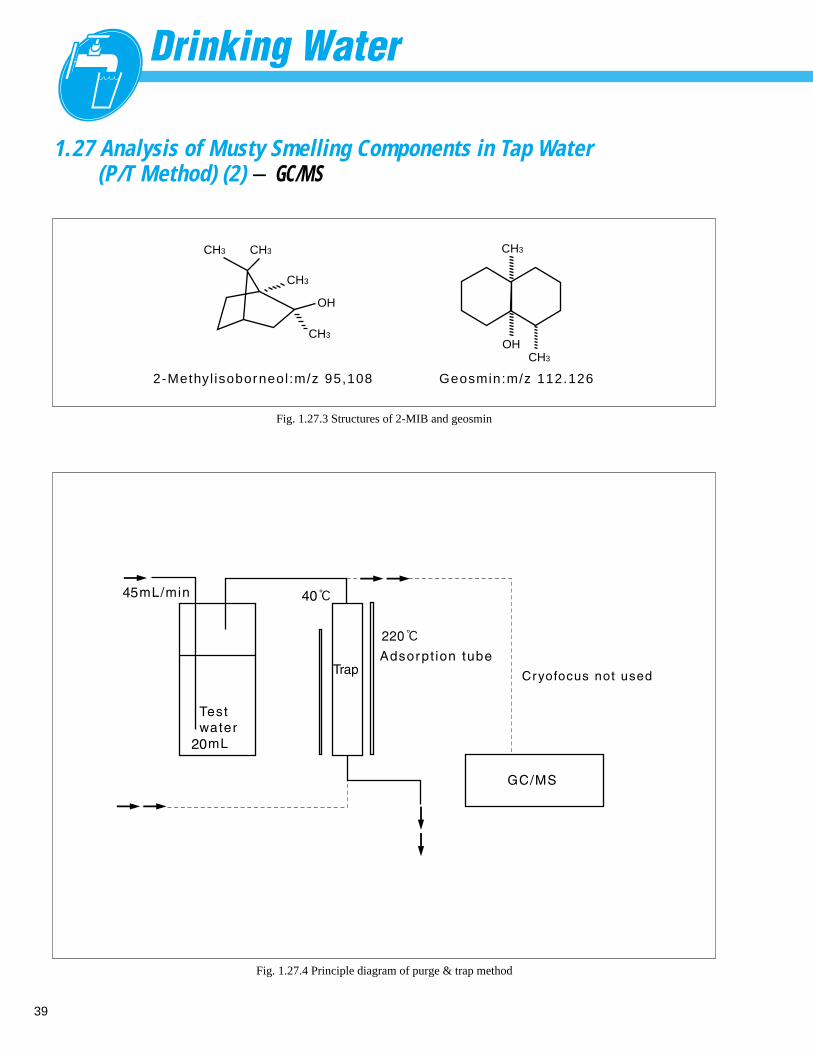
39
CH3 CH3
CH3
CH3
CH3
OHCH3
OH
2-Methyl isoborneol :m/z 95,108 Geosmin:m/z 112.126
Fig. 1.27.4 Principle diagram of purge & trap method
Fig. 1.27.3 Structures of 2-MIB and geosmin
1.27 Analysis of Musty Smelling Components in Tap Water (P/T Method) (2) - GC/MS
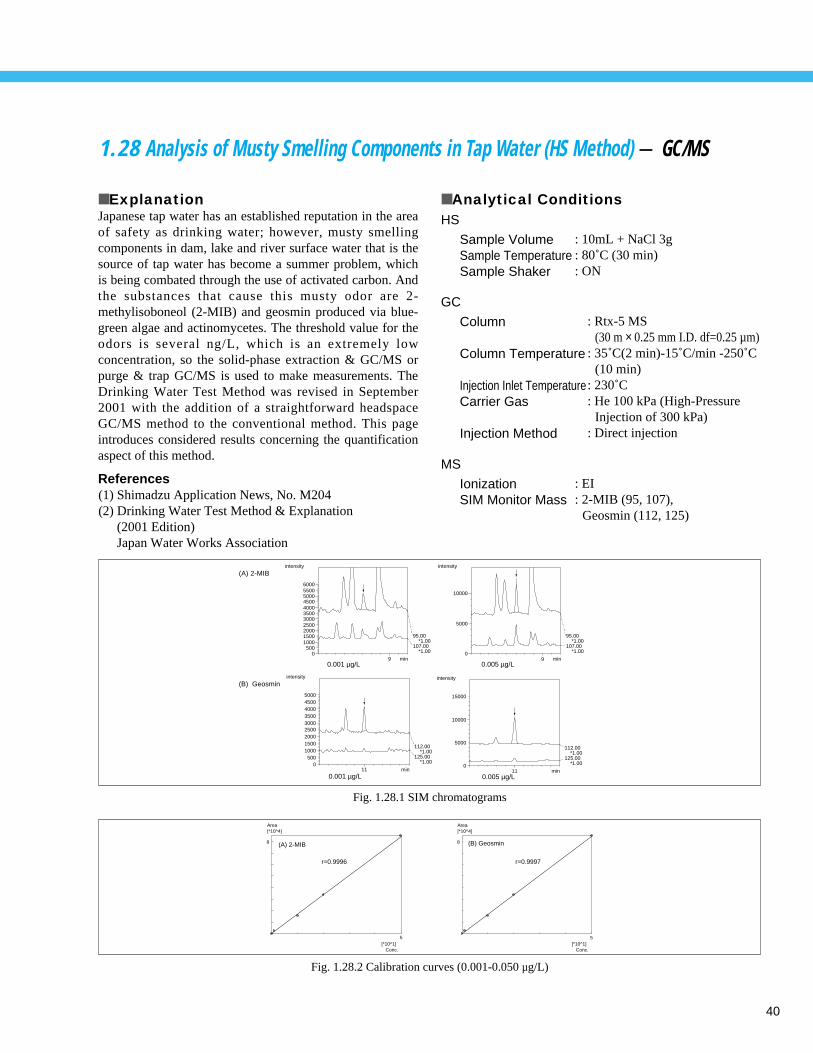
1.28 Analysis of Musty Smelling Components in Tap Water (HS Method) - GC/MS
40
■ ExplanationJapanese tap water has an established reputation in the areaof safety as drinking water; however, musty smellingcomponents in dam, lake and river surface water that is thesource of tap water has become a summer problem, whichis being combated through the use of activated carbon. Andthe substances that cause this musty odor are 2-methylisoboneol (2-MIB) and geosmin produced via blue-green algae and actinomycetes. The threshold value for theodors is several ng/L, which is an extremely lowconcentration, so the solid-phase extraction & GC/MS orpurge & trap GC/MS is used to make measurements. TheDrinking Water Test Method was revised in September2001 with the addition of a straightforward headspaceGC/MS method to the conventional method. This pageintroduces considered results concerning the quantificationaspect of this method.
References (1) Shimadzu Application News, No. M204(2) Drinking Water Test Method & Explanation
(2001 Edition)Japan Water Works Association
■ Analytical ConditionsHS
GC
Sample VolumeSample TemperatureSample Shaker
: 10mL + NaCl 3g: 80˚C (30 min): ON
MS
IonizationSIM Monitor Mass
: EI: 2-MIB (95, 107),
Geosmin (112, 125)
Column
Column Temperature
Injection Inlet TemperatureCarrier Gas
Injection Method
: Rtx-5 MS (30 m × 0.25 mm I.D. df=0.25 µm)
: 35˚C(2 min)-15˚C/min -250˚C(10 min)
: 230˚C: He 100 kPa (High-Pressure
Injection of 300 kPa): Direct injection
min
intensity
90
50010001500200025003000350040004500500055006000
95.00*1.00
107.00*1.00
min
intensity
90
5000
10000
95.00*1.00
107.00*1.00
0.001 µg/L 0.005 µg/L
min
intensity
110
500100015002000250030003500400045005000
112.00*1.00
125.00*1.00
(A) 2-MIB
(B) Geosmin
0.001 µg/L 0.005 µg/Lmin
intensity
110
5000
10000
15000
112.00*1.00
125.00*1.00
Fig. 1.28.1 SIM chromatograms
Conc.
Area
5[*10^1]
8
[*10^4]
Conc.
Area
5[*10^1]
8
[*10^4]
(A) 2-MIB (B) Geosmin
r=0.9996 r=0.9997
Fig. 1.28.2 Calibration curves (0.001-0.050 µg/L)
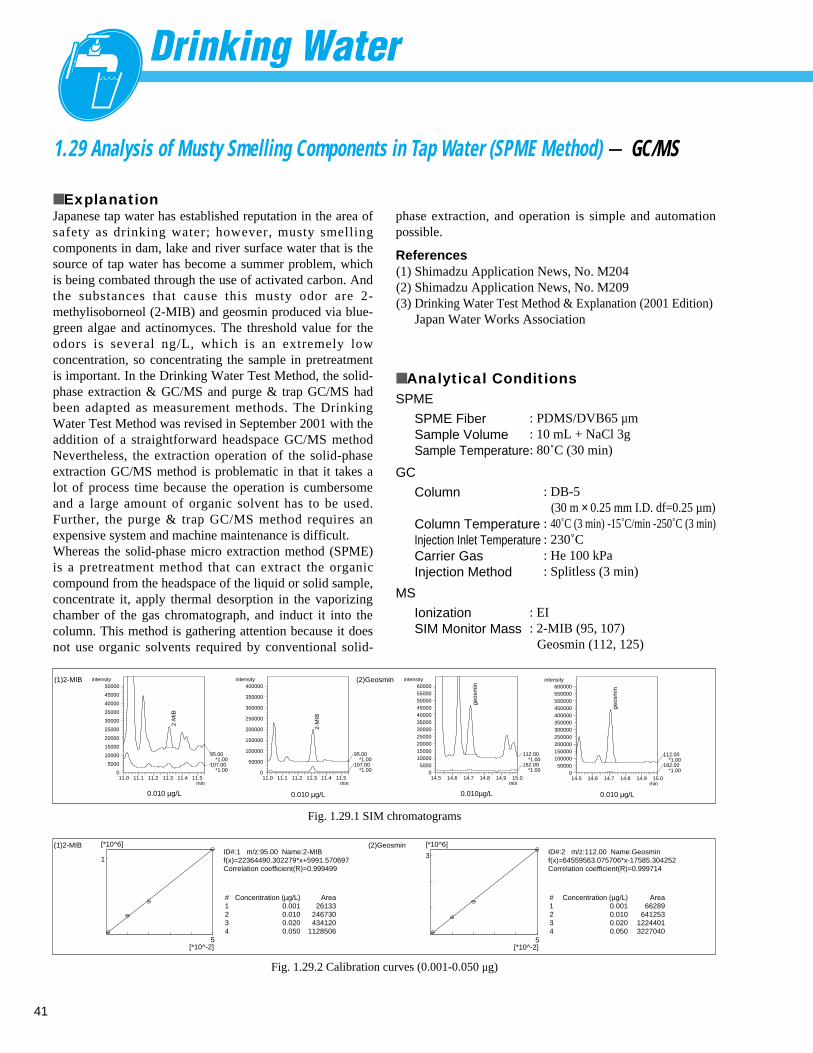
1.29 Analysis of Musty Smelling Components in Tap Water (SPME Method) - GC/MS
41
■ ExplanationJapanese tap water has established reputation in the area ofsafety as drinking water; however, musty smellingcomponents in dam, lake and river surface water that is thesource of tap water has become a summer problem, whichis being combated through the use of activated carbon. Andthe substances that cause this musty odor are 2-methylisoborneol (2-MIB) and geosmin produced via blue-green algae and actinomyces. The threshold value for theodors is several ng/L, which is an extremely lowconcentration, so concentrating the sample in pretreatmentis important. In the Drinking Water Test Method, the solid-phase extraction & GC/MS and purge & trap GC/MS hadbeen adapted as measurement methods. The DrinkingWater Test Method was revised in September 2001 with theaddition of a straightforward headspace GC/MS methodNevertheless, the extraction operation of the solid-phaseextraction GC/MS method is problematic in that it takes alot of process time because the operation is cumbersomeand a large amount of organic solvent has to be used.Further, the purge & trap GC/MS method requires anexpensive system and machine maintenance is difficult. Whereas the solid-phase micro extraction method (SPME)is a pretreatment method that can extract the organiccompound from the headspace of the liquid or solid sample,concentrate it, apply thermal desorption in the vaporizingchamber of the gas chromatograph, and induct it into thecolumn. This method is gathering attention because it doesnot use organic solvents required by conventional solid-
phase extraction, and operation is simple and automationpossible.
References (1) Shimadzu Application News, No. M204(2) Shimadzu Application News, No. M209(3) Drinking Water Test Method & Explanation (2001 Edition)
Japan Water Works Association
■ Analytical ConditionsSPME
GC
SPME FiberSample VolumeSample Temperature
: PDMS/DVB65 µm: 10 mL + NaCl 3g: 80˚C (30 min)
Column
Column TemperatureInjection Inlet TemperatureCarrier GasInjection Method
: DB-5(30 m × 0.25 mm I.D. df=0.25 µm)
: 40˚C (3 min) -15˚C/min -250˚C (3 min): 230˚C: He 100 kPa: Splitless (3 min)
MS
IonizationSIM Monitor Mass
: EI: 2-MIB (95, 107)
Geosmin (112, 125)
ID#:1 m/z:95.00 Name:2-MIBf(x)=22364490.302279*x+5991.570697Correlation coefficient(R)=0.999499
5[*10^-2]
1
[*10^6]
#1234
Concentration (µg/L)0.0010.0100.0200.050
Area26133
246730434120
1128506
(1)2-MIBID#:2 m/z:112.00 Name:Geosminf(x)=64559563.075706*x-17585.304252Correlation coefficient(R)=0.999714
5[*10^-2]
3
[*10^6]
#1234
Concentration (µg/L)0.0010.0100.0200.050
Area66289
64125312244013227040
(2)Geosmin
Fig. 1.29.2 Calibration curves (0.001-0.050 µg)
min
intensity
11.0 11.1 11.2 11.3 11.4 11.50
5000
10000
15000
20000
25000
30000
35000
40000
45000
50000
95.00*1.00
107.00*1.00
2-M
IB
min
intensity
11.0 11.1 11.2 11.3 11.4 11.50
50000
100000
150000
200000
250000
300000
350000
400000
95.00*1.00
107.00*1.00
2-M
IB
(1)2-MIB
0.010 µg/L 0.010 µg/L
min
intensity
14.5 14.6 14.7 14.8 14.9 15.00
50001000015000200002500030000350004000045000500005500060000
112.00*1.00
182.00*1.00
geos
min
min
intensity
14.5 14.6 14.7 14.8 14.9 15.00
50000100000150000200000250000300000350000400000450000500000550000600000
112.00*1.00
182.00*1.00
geos
min
(2)Geosmin
0.010µg/L 0.010 µg/L
Fig. 1.29.1 SIM chromatograms
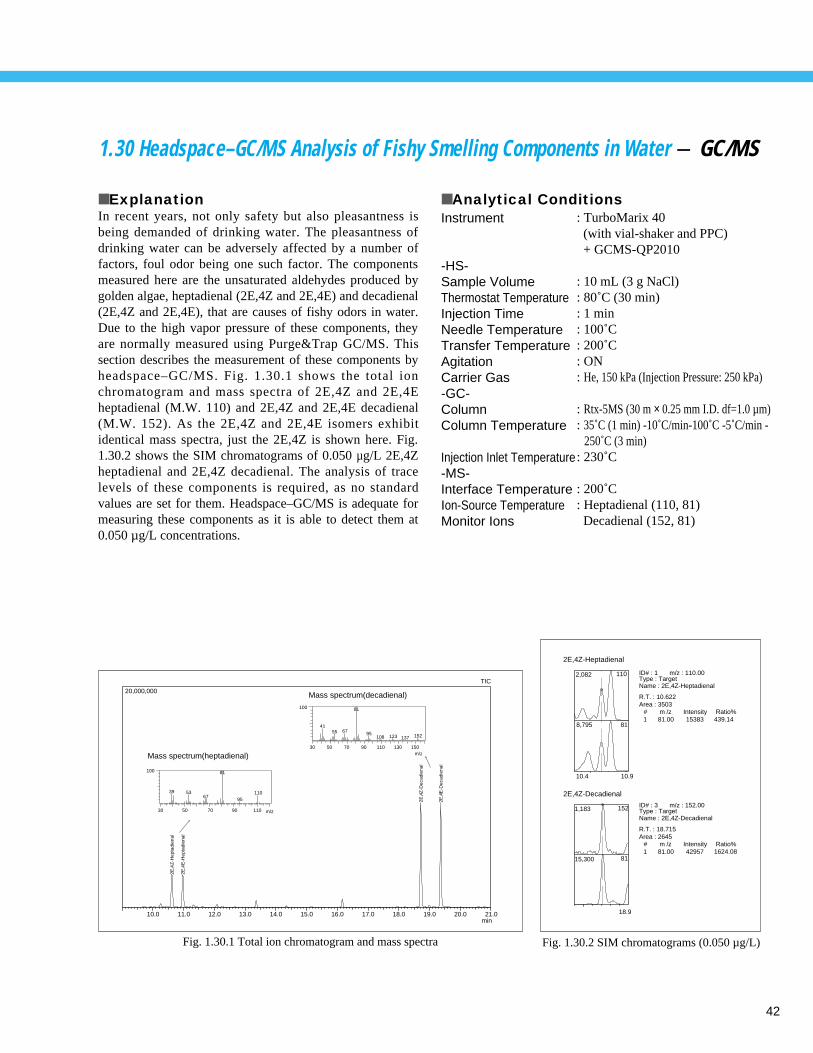
42
1.30 Headspace–GC/MS Analysis of Fishy Smelling Components in Water - GC/MS
■ ExplanationIn recent years, not only safety but also pleasantness isbeing demanded of drinking water. The pleasantness ofdrinking water can be adversely affected by a number offactors, foul odor being one such factor. The componentsmeasured here are the unsaturated aldehydes produced bygolden algae, heptadienal (2E,4Z and 2E,4E) and decadienal(2E,4Z and 2E,4E), that are causes of fishy odors in water.Due to the high vapor pressure of these components, theyare normally measured using Purge&Trap GC/MS. Thissection describes the measurement of these components byheadspace–GC/MS. Fig. 1.30.1 shows the total ionchromatogram and mass spectra of 2E,4Z and 2E,4Eheptadienal (M.W. 110) and 2E,4Z and 2E,4E decadienal(M.W. 152). As the 2E,4Z and 2E,4E isomers exhibitidentical mass spectra, just the 2E,4Z is shown here. Fig.1.30.2 shows the SIM chromatograms of 0.050 µg/L 2E,4Zheptadienal and 2E,4Z decadienal. The analysis of tracelevels of these components is required, as no standardvalues are set for them. Headspace–GC/MS is adequate formeasuring these components as it is able to detect them at0.050 µg/L concentrations.
■ Analytical ConditionsInstrument
-HS-Sample VolumeThermostat TemperatureInjection TimeNeedle TemperatureTransfer TemperatureAgitationCarrier Gas-GC-ColumnColumn Temperature
Injection Inlet Temperature-MS-Interface Temperature Ion-Source TemperatureMonitor Ions
: TurboMarix 40(with vial-shaker and PPC) + GCMS-QP2010
: 10 mL (3 g NaCl): 80˚C (30 min): 1 min: 100˚C: 200˚C: ON: He, 150 kPa (Injection Pressure: 250 kPa)
: Rtx-5MS (30 m × 0.25 mm I.D. df=1.0 µm): 35˚C (1 min) -10˚C/min-100˚C -5˚C/min -
250˚C (3 min): 230˚C
: 200˚C: Heptadienal (110, 81)Decadienal (152, 81)
min
20,000,000
10.0 11.0 12.0 13.0 14.0 15.0 16.0 17.0 18.0 19.0 20.0 21.0
TIC
2E,4
Z-H
epta
dien
al
2E,4
E-H
epta
dien
al
2E,4
Z-D
ecad
iena
l
2E,4
E-D
ecad
iena
l
m/z
100
30 50 70 90 110
39 5367
81
95110
m/z
100
30 50 70 90 110 130 150
4155 67
81
95108 123 137 152
Mass spectrum(heptadienal)
Mass spectrum(decadienal)
2,082
8,795
10.4 10.9
110
81
1,183
15,300
18.9
152
81
2E,4Z-Heptadienal
2E,4Z-Decadienal
Ratio% 439.14 1 81.00 15383
ID# : 1 m/z : 110.00Type : TargetName : 2E,4Z-Heptadienal
R.T. : 10.622Area : 3503
m# /z Intensity
Ratio% 1624.08 1 81.00 42957
ID# : 3 m/z : 152.00Type : TargetName : 2E,4Z-Decadienal
R.T. : 18.715Area : 2645
m# /z Intensity
Fig. 1.30.2 SIM chromatograms (0.050 µg/L) Fig. 1.30.1 Total ion chromatogram and mass spectra
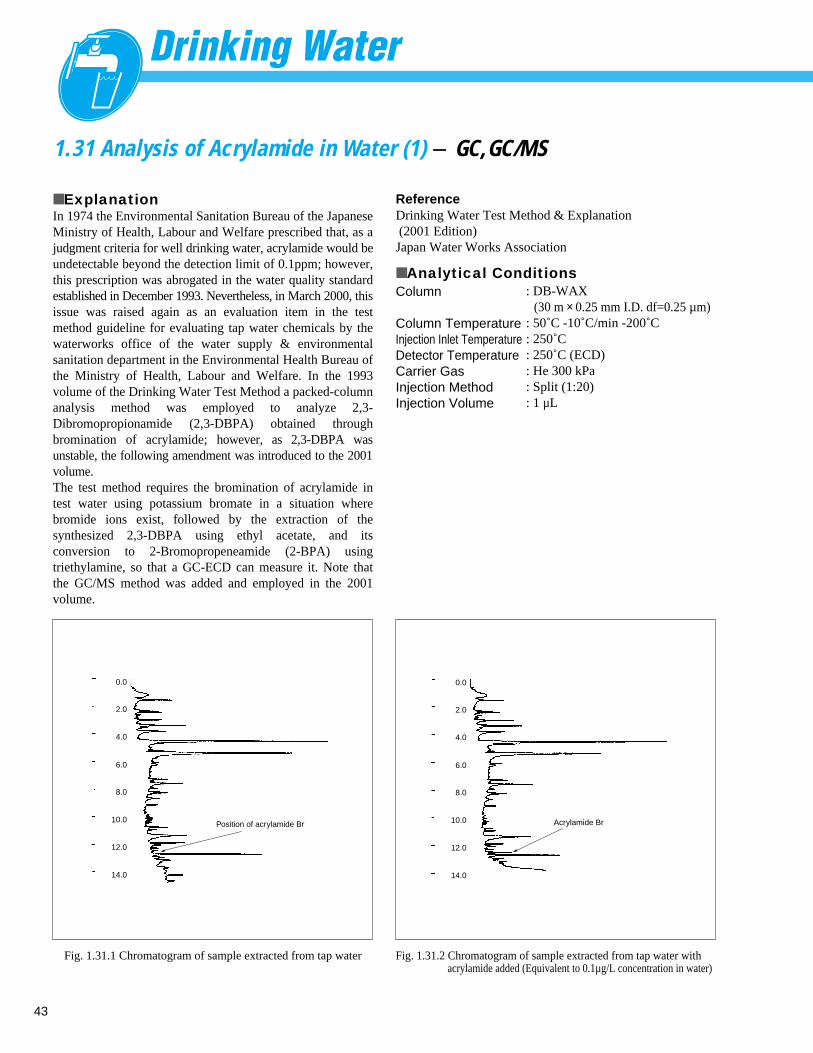
43
1.31 Analysis of Acrylamide in Water (1) - GC,GC/MS
■ ExplanationIn 1974 the Environmental Sanitation Bureau of the JapaneseMinistry of Health, Labour and Welfare prescribed that, as ajudgment criteria for well drinking water, acrylamide would beundetectable beyond the detection limit of 0.1ppm; however,this prescription was abrogated in the water quality standardestablished in December 1993. Nevertheless, in March 2000, thisissue was raised again as an evaluation item in the testmethod guideline for evaluating tap water chemicals by thewaterworks office of the water supply & environmentalsanitation department in the Environmental Health Bureau ofthe Ministry of Health, Labour and Welfare. In the 1993volume of the Drinking Water Test Method a packed-columnanalysis method was employed to analyze 2,3-Dibromopropionamide (2,3-DBPA) obtained throughbromination of acrylamide; however, as 2,3-DBPA wasunstable, the following amendment was introduced to the 2001volume.The test method requires the bromination of acrylamide intest water using potassium bromate in a situation wherebromide ions exist, followed by the extraction of thesynthesized 2,3-DBPA using ethyl acetate, and itsconversion to 2-Bromopropeneamide (2-BPA) usingtriethylamine, so that a GC-ECD can measure it. Note thatthe GC/MS method was added and employed in the 2001volume.
ReferenceDrinking Water Test Method & Explanation(2001 Edition)Japan Water Works Association
■ Analytical ConditionsColumn
Column TemperatureInjection Inlet TemperatureDetector TemperatureCarrier GasInjection MethodInjection Volume
: DB-WAX(30 m × 0.25 mm I.D. df=0.25 µm)
: 50˚C -10˚C/min -200˚C: 250˚C: 250˚C (ECD): He 300 kPa: Split (1:20): 1 µL
0.0
2.0
4.0
6.0
8.0
10.0
12.0
14.0
Position of acrylamide Br
Fig. 1.31.1 Chromatogram of sample extracted from tap water
0.0
2.0
4.0
6.0
8.0
10.0
12.0
14.0
Acrylamide Br
Fig. 1.31.2 Chromatogram of sample extracted from tap water with acrylamide added (Equivalent to 0.1µg/L concentration in water)
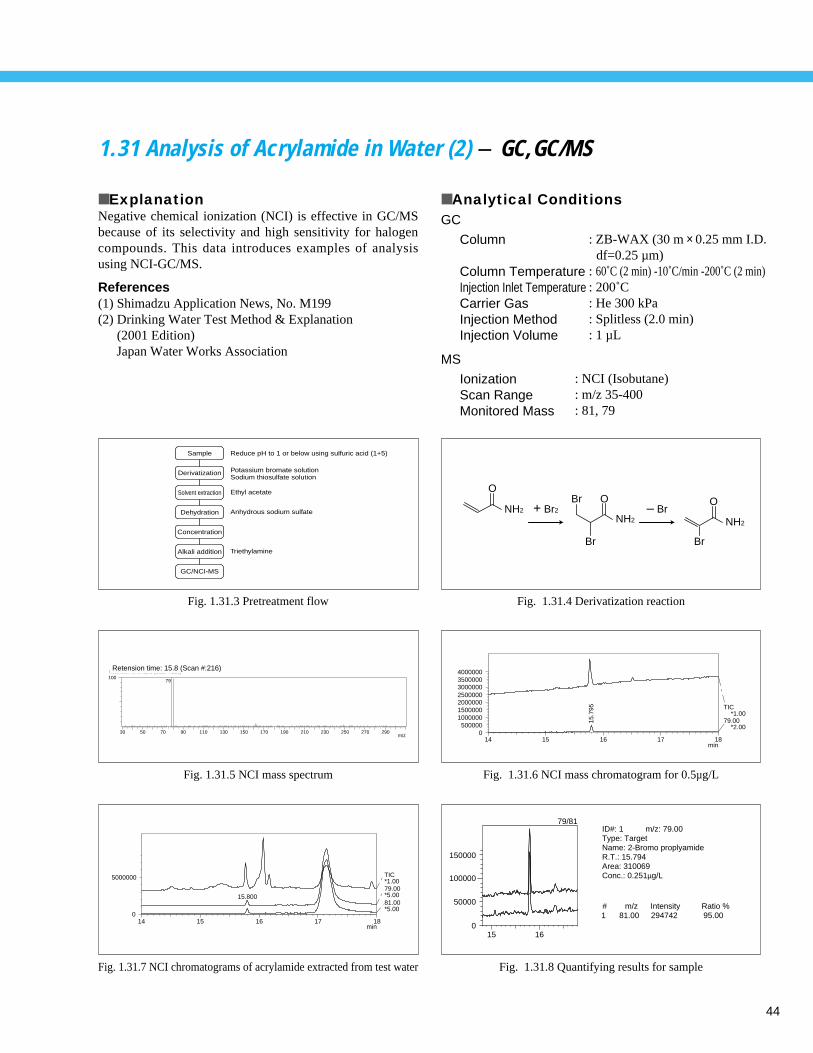
44
14 15 16 17 18min
0
5000000 TIC*1.0079.00*5.0081.00*5.00
15.800
Fig. 1.31.7 NCI chromatograms of acrylamide extracted from test water
Retension time: 15.8 (Scan #:216)100
30 50 70 90 110 130 150 170 190 210 230 250 270 290m/z
79
Retension time: 15.8 (Scan #:216)
Fig. 1.31.5 NCI mass spectrum
Sample
Derivatization
Solvent extraction
Dehydration
Concentration
Alkali addition
GC/NCI-MS
Reduce pH to 1 or below using sulfuric acid (1+5)
Potassium bromate solutionSodium thiosulfate solution
Ethyl acetate
Anhydrous sodium sulfate
Triethylamine
Fig. 1.31.3 Pretreatment flow
15 16
100000
150000
50000
0
79/81ID#: 1 m/z: 79.00Type: TargetName: 2-Bromo proplyamideR.T.: 15.794Area: 310069Conc.: 0.251µg/L
#1
m/z81.00
Intensity294742
Ratio %95.00
Fig. 1.31.8 Quantifying results for sample
14 15 16 17 18min
4000000350000030000002500000200000015000001000000500000
0
TIC *1.0079.00 *2.00
15.7
95
Fig. 1.31.6 NCI mass chromatogram for 0.5µg/L
O
NH2 + Br2 – BrNH2
Br
Br
O
Br
O
NH2
Fig. 1.31.4 Derivatization reaction
1.31 Analysis of Acrylamide in Water (2) - GC,GC/MS
■ ExplanationNegative chemical ionization (NCI) is effective in GC/MSbecause of its selectivity and high sensitivity for halogencompounds. This data introduces examples of analysisusing NCI-GC/MS.
References(1) Shimadzu Application News, No. M199(2) Drinking Water Test Method & Explanation
(2001 Edition)Japan Water Works Association
■ Analytical Conditions
MS
GC
IonizationScan RangeMonitored Mass
: NCI (Isobutane): m/z 35-400: 81, 79
Column
Column TemperatureInjection Inlet TemperatureCarrier GasInjection MethodInjection Volume
: ZB-WAX (30 m × 0.25 mm I.D.df=0.25 µm)
: 60˚C (2 min) -10˚C/min -200˚C (2 min): 200˚C: He 300 kPa: Splitless (2.0 min): 1 µL
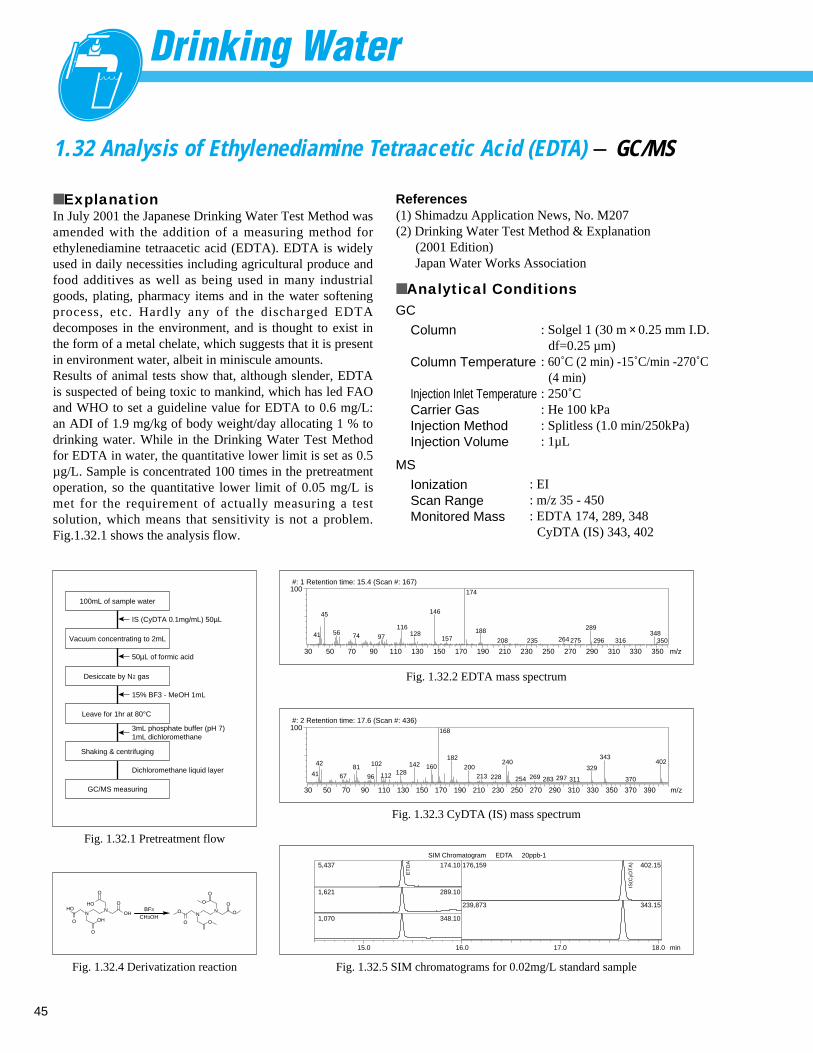
1.32 Analysis of Ethylenediamine Tetraacetic Acid (EDTA) - GC/MS
45
■ ExplanationIn July 2001 the Japanese Drinking Water Test Method wasamended with the addition of a measuring method forethylenediamine tetraacetic acid (EDTA). EDTA is widelyused in daily necessities including agricultural produce andfood additives as well as being used in many industrialgoods, plating, pharmacy items and in the water softeningprocess, etc. Hardly any of the discharged EDTAdecomposes in the environment, and is thought to exist inthe form of a metal chelate, which suggests that it is presentin environment water, albeit in miniscule amounts. Results of animal tests show that, although slender, EDTAis suspected of being toxic to mankind, which has led FAOand WHO to set a guideline value for EDTA to 0.6 mg/L:an ADI of 1.9 mg/kg of body weight/day allocating 1 % todrinking water. While in the Drinking Water Test Methodfor EDTA in water, the quantitative lower limit is set as 0.5µg/L. Sample is concentrated 100 times in the pretreatmentoperation, so the quantitative lower limit of 0.05 mg/L ismet for the requirement of actually measuring a testsolution, which means that sensitivity is not a problem.Fig.1.32.1 shows the analysis flow.
References(1) Shimadzu Application News, No. M207(2) Drinking Water Test Method & Explanation
(2001 Edition)Japan Water Works Association
■ Analytical Conditions
MS
GC
IonizationScan RangeMonitored Mass
: EI: m/z 35 - 450: EDTA 174, 289, 348
CyDTA (IS) 343, 402
Column
Column Temperature
Injection Inlet TemperatureCarrier GasInjection MethodInjection Volume
: Solgel 1 (30 m × 0.25 mm I.D.df=0.25 µm)
: 60˚C (2 min) -15˚C/min -270˚C(4 min)
: 250˚C: He 100 kPa : Splitless (1.0 min/250kPa): 1µL
ET
DA
IS(C
yDT
A)
239,873 343.15
176,159 402.15
289.10
174.10
348.10
5,437
1,621
1,070
SIM Chromatogram EDTA 20ppb-1
min15.0 16.0 17.0 18.0
Fig. 1.32.5 SIM chromatograms for 0.02mg/L standard sample
#: 2 Retention time: 17.6 (Scan #: 436)
m/z
100
30 50 70 90 110 130 150 170 190 210 230 250 270 290 310 330 350 370 390
41
42
6781
96
102
112 128142 160
168
182
200213 228
240
254 269 283 297 311
329
343
370
402
Fig. 1.32.3 CyDTA (IS) mass spectrum
#: 1 Retention time: 15.4 (Scan #: 167)
m/z
100
30 50 70 90 110 130 150 170 190 210 230 250 270 290 310 330 350
41
45
56 74 97
116128
146
157
174
188
208 235 264 275
289
296 316348
350
Fig. 1.32.2 EDTA mass spectrum
100mL of sample water
Vacuum concentrating to 2mL
Desiccate by N2 gas
Leave for 1hr at 80°C
Shaking & centrifuging
GC/MS measuring
IS (CyDTA 0.1mg/mL) 50µL
50µL of formic acid
15% BF3 - MeOH 1mL
3mL phosphate buffer (pH 7)1mL dichloromethane
Dichloromethane liquid layer
Fig. 1.32.1 Pretreatment flow
HOHO
O
O
BF3
CH3OH
O
O
O O
NN
O
O
O
O
O
OHOHN
N
Fig. 1.32.4 Derivatization reaction
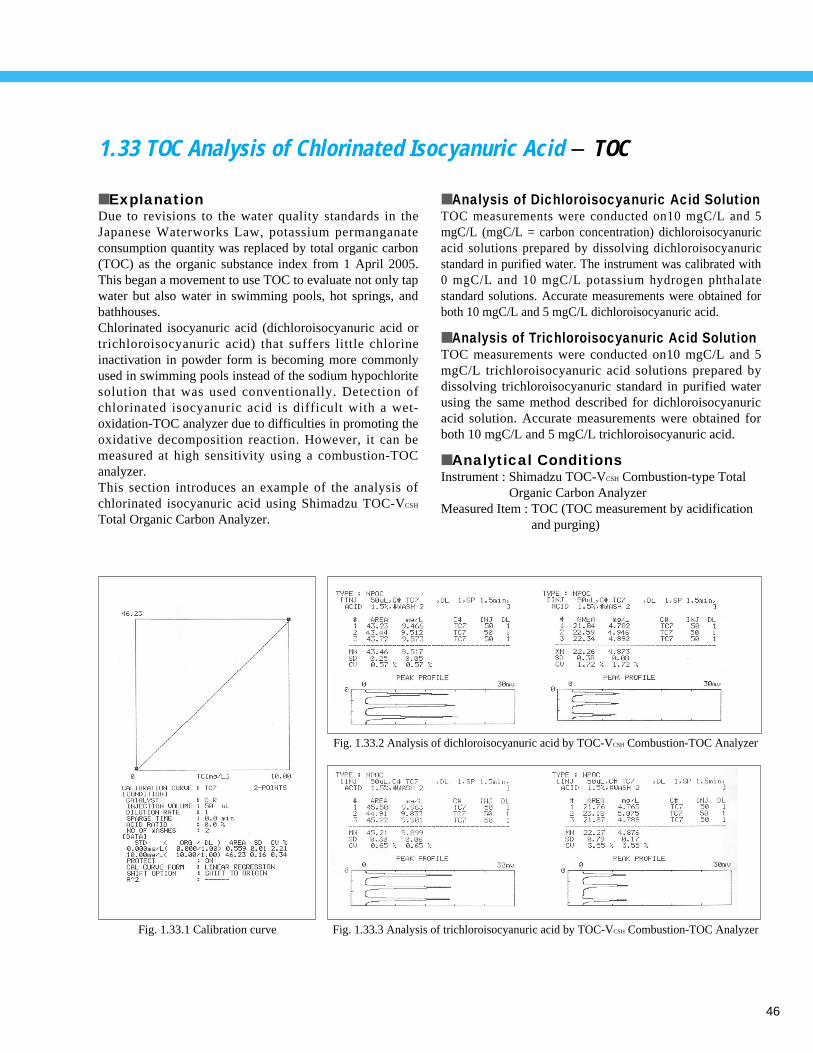
46
1.33 TOC Analysis of Chlorinated Isocyanuric Acid - TOC
■ ExplanationDue to revisions to the water quality standards in theJapanese Waterworks Law, potassium permanganateconsumption quantity was replaced by total organic carbon(TOC) as the organic substance index from 1 April 2005.This began a movement to use TOC to evaluate not only tapwater but also water in swimming pools, hot springs, andbathhouses.Chlorinated isocyanuric acid (dichloroisocyanuric acid ortrichloroisocyanuric acid) that suffers little chlorineinactivation in powder form is becoming more commonlyused in swimming pools instead of the sodium hypochloritesolution that was used conventionally. Detection ofchlorinated isocyanuric acid is difficult with a wet-oxidation-TOC analyzer due to difficulties in promoting theoxidative decomposition reaction. However, it can bemeasured at high sensitivity using a combustion-TOCanalyzer. This section introduces an example of the analysis ofchlorinated isocyanuric acid using Shimadzu TOC-VCSH
Total Organic Carbon Analyzer.
■ Analysis of Dichloroisocyanuric Acid SolutionTOC measurements were conducted on10 mgC/L and 5mgC/L (mgC/L = carbon concentration) dichloroisocyanuricacid solutions prepared by dissolving dichloroisocyanuricstandard in purified water. The instrument was calibrated with0 mgC/L and 10 mgC/L potassium hydrogen phthalatestandard solutions. Accurate measurements were obtained forboth 10 mgC/L and 5 mgC/L dichloroisocyanuric acid.
■ Analysis of Trichloroisocyanuric Acid SolutionTOC measurements were conducted on10 mgC/L and 5mgC/L trichloroisocyanuric acid solutions prepared bydissolving trichloroisocyanuric standard in purified waterusing the same method described for dichloroisocyanuricacid solution. Accurate measurements were obtained forboth 10 mgC/L and 5 mgC/L trichloroisocyanuric acid.
■ Analytical ConditionsInstrument : Shimadzu TOC-VCSH Combustion-type Total
Organic Carbon AnalyzerMeasured Item : TOC (TOC measurement by acidification
and purging)
Fig. 1.33.1 Calibration curve Fig. 1.33.3 Analysis of trichloroisocyanuric acid by TOC-VCSH Combustion-TOC Analyzer
Fig. 1.33.2 Analysis of dichloroisocyanuric acid by TOC-VCSH Combustion-TOC Analyzer
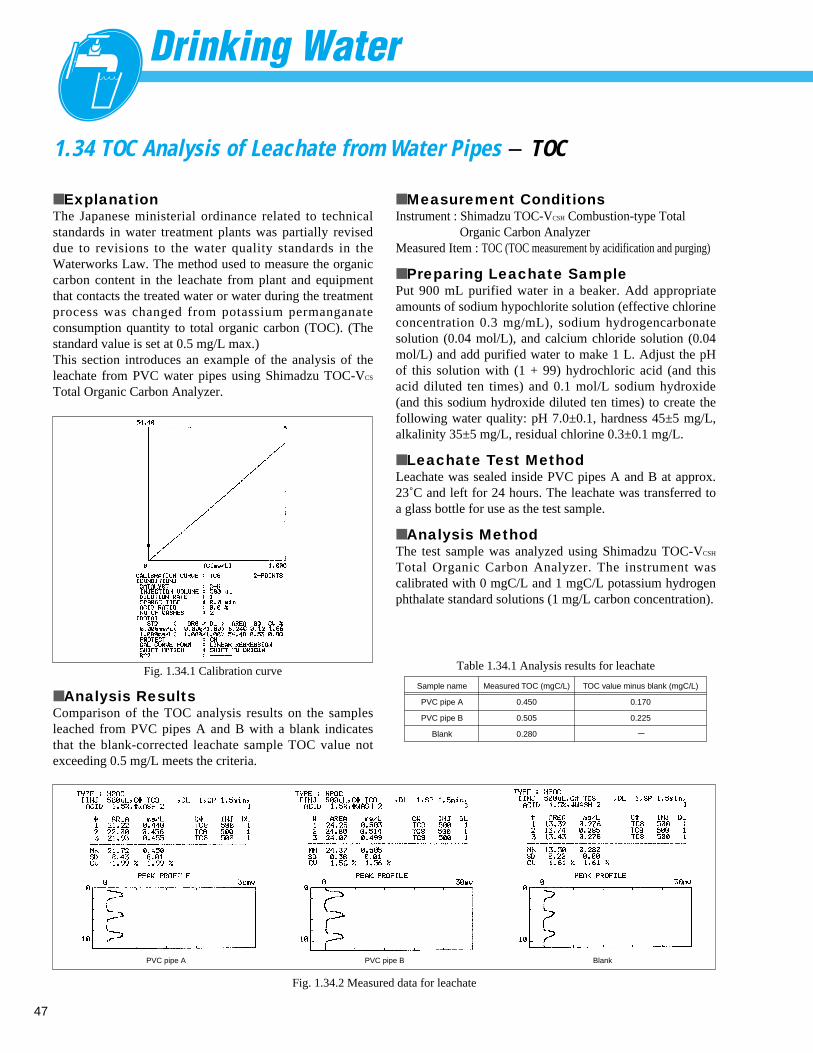
47
1.34 TOC Analysis of Leachate from Water Pipes - TOC
■ ExplanationThe Japanese ministerial ordinance related to technicalstandards in water treatment plants was partially reviseddue to revisions to the water quality standards in theWaterworks Law. The method used to measure the organiccarbon content in the leachate from plant and equipmentthat contacts the treated water or water during the treatmentprocess was changed from potassium permanganateconsumption quantity to total organic carbon (TOC). (Thestandard value is set at 0.5 mg/L max.)This section introduces an example of the analysis of theleachate from PVC water pipes using Shimadzu TOC-VCS
Total Organic Carbon Analyzer.
■ Measurement ConditionsInstrument : Shimadzu TOC-VCSH Combustion-type Total
Organic Carbon AnalyzerMeasured Item : TOC (TOC measurement by acidification and purging)
■ Preparing Leachate SamplePut 900 mL purified water in a beaker. Add appropriateamounts of sodium hypochlorite solution (effective chlorineconcentration 0.3 mg/mL), sodium hydrogencarbonatesolution (0.04 mol/L), and calcium chloride solution (0.04mol/L) and add purified water to make 1 L. Adjust the pHof this solution with (1 + 99) hydrochloric acid (and thisacid diluted ten times) and 0.1 mol/L sodium hydroxide(and this sodium hydroxide diluted ten times) to create thefollowing water quality: pH 7.0±0.1, hardness 45±5 mg/L,alkalinity 35±5 mg/L, residual chlorine 0.3±0.1 mg/L.
■ Leachate Test MethodLeachate was sealed inside PVC pipes A and B at approx.23˚C and left for 24 hours. The leachate was transferred toa glass bottle for use as the test sample.
■ Analysis MethodThe test sample was analyzed using Shimadzu TOC-VCSH
Total Organic Carbon Analyzer. The instrument wascalibrated with 0 mgC/L and 1 mgC/L potassium hydrogenphthalate standard solutions (1 mg/L carbon concentration).
Sample name
PVC pipe A
PVC pipe B
Blank
Measured TOC (mgC/L)
0.450
0.505
0.280
TOC value minus blank (mgC/L)
0.170
0.225
Fig. 1.34.1 Calibration curve Table 1.34.1 Analysis results for leachate
PVC pipe A BlankPVC pipe B
Fig. 1.34.2 Measured data for leachate
■ Analysis ResultsComparison of the TOC analysis results on the samplesleached from PVC pipes A and B with a blank indicatesthat the blank-corrected leachate sample TOC value notexceeding 0.5 mg/L meets the criteria.
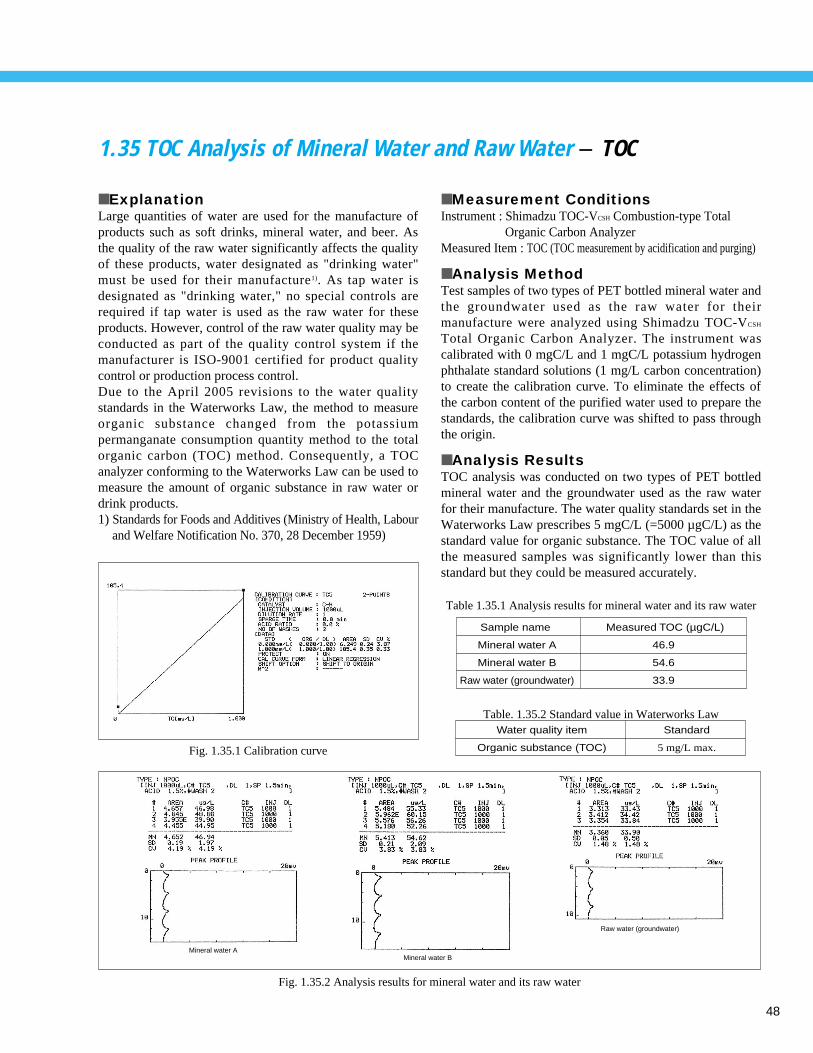
48
■ ExplanationLarge quantities of water are used for the manufacture ofproducts such as soft drinks, mineral water, and beer. Asthe quality of the raw water significantly affects the qualityof these products, water designated as "drinking water"must be used for their manufacture1). As tap water isdesignated as "drinking water," no special controls arerequired if tap water is used as the raw water for theseproducts. However, control of the raw water quality may beconducted as part of the quality control system if themanufacturer is ISO-9001 certified for product qualitycontrol or production process control. Due to the April 2005 revisions to the water qualitystandards in the Waterworks Law, the method to measureorganic substance changed from the potassiumpermanganate consumption quantity method to the totalorganic carbon (TOC) method. Consequently, a TOCanalyzer conforming to the Waterworks Law can be used tomeasure the amount of organic substance in raw water ordrink products. 1) Standards for Foods and Additives (Ministry of Health, Labour
and Welfare Notification No. 370, 28 December 1959)
■ Measurement ConditionsInstrument : Shimadzu TOC-VCSH Combustion-type Total
Organic Carbon AnalyzerMeasured Item : TOC (TOC measurement by acidification and purging)
■ Analysis MethodTest samples of two types of PET bottled mineral water andthe groundwater used as the raw water for theirmanufacture were analyzed using Shimadzu TOC-VCSH
Total Organic Carbon Analyzer. The instrument wascalibrated with 0 mgC/L and 1 mgC/L potassium hydrogenphthalate standard solutions (1 mg/L carbon concentration)to create the calibration curve. To eliminate the effects ofthe carbon content of the purified water used to prepare thestandards, the calibration curve was shifted to pass throughthe origin.
■ Analysis ResultsTOC analysis was conducted on two types of PET bottledmineral water and the groundwater used as the raw waterfor their manufacture. The water quality standards set in theWaterworks Law prescribes 5 mgC/L (=5000 µgC/L) as thestandard value for organic substance. The TOC value of allthe measured samples was significantly lower than thisstandard but they could be measured accurately.
Fig. 1.35.2 Analysis results for mineral water and its raw water
Fig. 1.35.1 Calibration curve
Table 1.35.1 Analysis results for mineral water and its raw water
1.35 TOC Analysis of Mineral Water and Raw Water - TOC
Mineral water A
Raw water (groundwater)
Mineral water B
Sample name
Mineral water A
Mineral water B
Raw water (groundwater)
Measured TOC (µgC/L)
46.9
54.6
33.9
Water quality item
Organic substance (TOC)
Standard
5 mg/L max.
Table. 1.35.2 Standard value in Waterworks Law
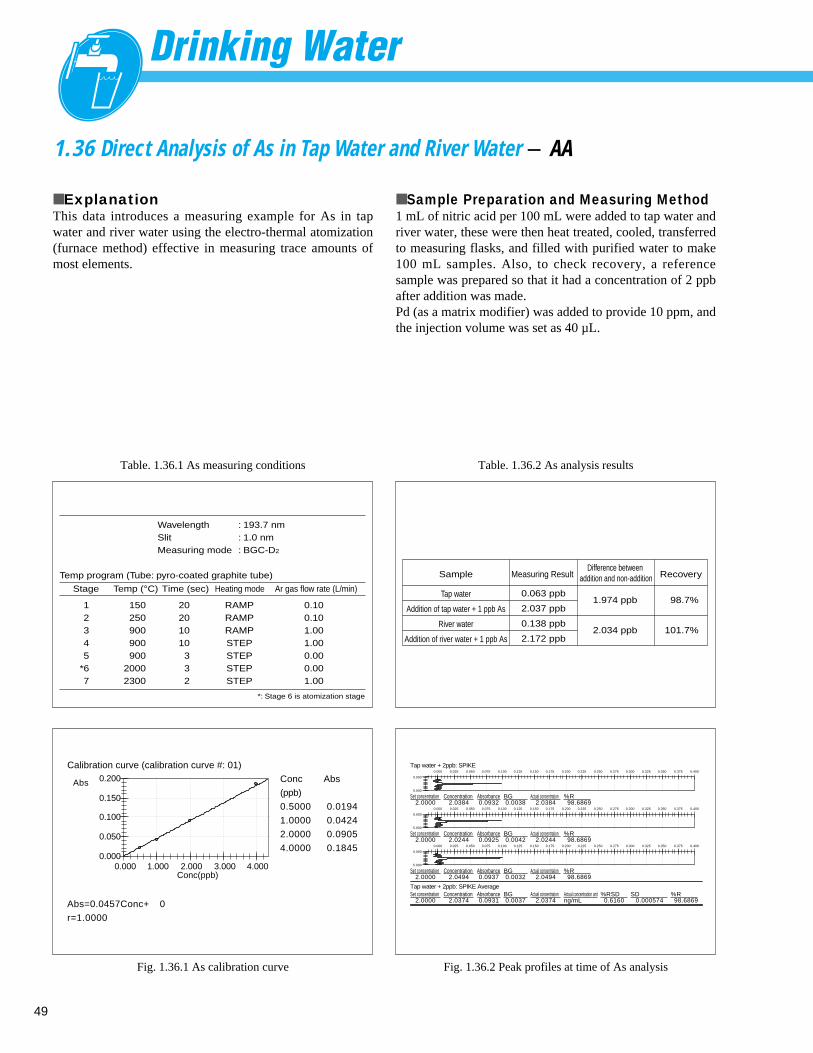
49
1.36 Direct Analysis of As in Tap Water and River Water - AA
■ ExplanationThis data introduces a measuring example for As in tapwater and river water using the electro-thermal atomization(furnace method) effective in measuring trace amounts ofmost elements.
■ Sample Preparation and Measuring Method1 mL of nitric acid per 100 mL were added to tap water andriver water, these were then heat treated, cooled, transferredto measuring flasks, and filled with purified water to make100 mL samples. Also, to check recovery, a referencesample was prepared so that it had a concentration of 2 ppbafter addition was made. Pd (as a matrix modifier) was added to provide 10 ppm, andthe injection volume was set as 40 µL.
Calibration curve (calibration curve #: 01)
Conc Abs
(ppb)
0.5000 0.0194
1.0000 0.0424
2.0000 0.0905
4.0000 0.1845
Abs=0.0457Conc+ 0
r=1.0000
0.000 1.000 2.000 3.000 4.000Conc(ppb)
0.000
0.050
0.100
0.150
0.200Abs
Fig. 1.36.1 As calibration curve
Tap water + 2ppb: SPIKE0.000 0.025 0.050 0.075 0.100 0.125 0.150 0.175 0.200 0.225 0.250 0.275 0.300 0.325 0.350 0.375 0.400
0.000
5.000
Set concentration Concentration Absorbance BG Actual concentration %R 2.0000 2.0384 0.0932 0.0038 2.0384 98.6869
0.000 0.025 0.050 0.075 0.100 0.125 0.150 0.175 0.200 0.225 0.250 0.275 0.300 0.325 0.350 0.375 0.400
0.000
5.000
Set concentration Concentration Absorbance BG Actual concentration %R 2.0000 2.0244 0.0925 0.0042 2.0244 98.6869
0.000 0.025 0.050 0.075 0.100 0.125 0.150 0.175 0.200 0.225 0.250 0.275 0.300 0.325 0.350 0.375 0.400
0.000
5.000
Set concentration Concentration Absorbance BG Actual concentration %R 2.0000 2.0494 0.0937 0.0032 2.0494 98.6869
Tap water + 2ppb: SPIKE AverageSet concentration Concentration Absorbance BG Actual concentration Actual concentration unit %RSD SD %R 2.0000 2.0374 0.0931 0.0037 2.0374 ng/mL 0.6160 0.000574 98.6869
Fig. 1.36.2 Peak profiles at time of As analysis
Wavelength : 193.7 nmSlit : 1.0 nmMeasuring mode : BGC-D2
*: Stage 6 is atomization stage
Temp program (Tube: pyro-coated graphite tube)
Stage
12345
*67
150250900900900
20002300
20201010332
RAMPRAMPRAMPSTEPSTEPSTEPSTEP
0.100.101.001.000.000.001.00
Temp (°C) Time (sec) Heating mode Ar gas flow rate (L/min)
Table. 1.36.1 As measuring conditions
Sample
Tap water
Addition of tap water + 1 ppb As
River water
Addition of river water + 1 ppb As
Measuring Result
0.063 ppb
2.037 ppb
0.138 ppb
2.172 ppb
Difference between addition and non-addition
1.974 ppb
2.034 ppb
Recovery
98.7%
101.7%
Table. 1.36.2 As analysis results
50
1.37 Direct Analysis of Pb in Tap Water and River Water - AA
■ ExplanationThis data introduces a measuring example for Pb in tapwater and river water using the electro-thermal atomization(furnace method) effective in measuring trace amounts ofmost elements.
■ Sample Preparation and Measuring Method1 mL of nitric acid per 100 mL were added to tap water andriver water, these were then heat treated, cooled, transferredto measuring flasks, and filled with purified water to make100 mL samples. Also, to check recovery, a referencesample was prepared so that it had a concentration of 1 ppbafter addition was made. Pd (as a matrix modifier) was added to provide 10 ppm, andthe injection volume was set as 40 µL.
Calibration curve (calibration curve #: 01)
Conc Abs
(ppb)
0.1000 0.0034
0.2000 0.0068
0.5000 0.0175
1.0000 0.0339
2.0000 0.0695
Abs=0.0346Conc+ 0
r=0.9999
0.000 0.500 1.000 1.500 2.000Conc(ppb)
0.000
0.025
0.050
0.075Abs
Fig. 1.37.1 Pb calibration curve
River water without addition: UNK 0.000 0.025 0.050 0.075 0.100 0.125 0.150 0.175 0.200
0.000
4.000
Concentration Absorbance BG Actual concentration 0.5420 0.0188 0.0024 0.5420
0.000 0.025 0.050 0.075 0.100 0.125 0.150 0.175 0.200
0.000
4.000
Concentration Absorbance BG Actual concentration 0.5200 0.0180 0.0018 0.5200
0.000 0.025 0.050 0.075 0.100 0.125 0.150 0.175 0.200
0.000
4.000
Concentration Absorbance BG Actual concentration 0.4997 0.0173 0.0021 0.4997
River water without addition: UNK AverageConcentration Absorbance BG Actual concentration Actual concentration unit %RSD SD 0.5206 0.0180 0.0021 0.5206 ng/mL 4.0678 0.000733
River water + 1ppb: SPIKE0.000 0.025 0.050 0.075 0.100 0.125 0.150 0.175 0.200
0.000
4.000
Set concentration Concentration Absorbance BG Actual concentration %R 1.0000 1.5343 0.0531 0.0030 1.5343 99.1492
0.000 0.025 0.050 0.075 0.100 0.125 0.150 0.175 0.200
0.000
4.000
Set concentration Concentration Absorbance BG Actual concentration %R 1.0000 1.4885 0.0515 0.0028 1.4885 99.1492
0.000 0.025 0.050 0.075 0.100 0.125 0.150 0.175 0.200
0.000
4.000
Set concentration Concentration Absorbance BG Actual concentration %R 1.0000 1.5145 0.0524 0.0028 1.5145 99.1492
River water + 1ppb: SPIKE AverageSet concentration Concentration Absorbance BG Actual concentration Actual concentration unit %RSD SD %R 1.0000 1.5124 0.0523 0.0029 1.5124 ng/mL 1.5209 0.000796 99.1492
Fig. 1.37.2 Peak profiles at time of Pb analysis
Wavelength : 283.3 nmSlit : 1.0 nmMeasuring mode : BGC-D2
*: Stage 6 is atomization stage
Temp program (Tube: pyro-coated graphite tube)
12345
*67
150250800800800
20002400
20201010332
RAMPRAMPRAMPSTEPSTEPSTEPSTEP
0.100.101.001.000.000.001.00
Stage Time (sec) Heating mode Ar gas flow rate (L/min)Stage Temp (°C) Time (sec) Heating mode Ar gas flow rate (L/min)
Table. 1.37.1 Pb measuring conditions
Sample
Tap water
Addition of tap water + 1 ppb Pb
River water
Addition of river water + 1 ppb Pb
Measuring Result
0.040 ppb
1.017 ppb
0.521 ppb
1.512 ppb
Difference between addition and non-addition
0.977 ppb
0.991 ppb
Recovery
97.7%
99.1%
Table. 1.37.2 Pb analysis results
51
1.38 Analysis of Inorganic Components in Water - ICP/MS
■ ExplanationA major revision to the water quality standards in theJapanese Waterworks Law was implemented on 30 May2003. This included notification of new test methods, andthe ICP mass spectrometer was adopted for the analysis ofmany elements. Tap water contains high concentrations ofsodium and calcium in the ppm range and traceconcentrations of elements such as uranium and lead at sub-ppb levels. The instrument to analyze these elements mustoffer both high sensitivity and a wide measuring range andbe able to analyze the elements simultaneously. This section introduces repeated spike and recovery testsconducted using Shimadzu ICPM-8500. The analysis of tapwater requires measurements at 1/10 the standard value at10 % CV or less. It must permit accurate quantitation in the100 % ± 10 % recovery rate range. Simultaneous analysis ofall elements was conducted on samples spiked with 1/100 to1/10 the element concentration of the water qualitystandards in the Waterworks Law. The measurements wererepeated ten times on samples in the sequence: tap water →(tap water + tap water spiked with 1/100 standard value)→tap water → (tap water + tap water spiked with 1/10standard value) →tap water … The internal standardelements were added to the measured samples online usingADU-1 Automatic Sample Dilution unit. Table 1.38.1shows the quantitation results, recovery rates, and CVvalues. Good recovery rates and CV values were achievedfor all elements down to 1/100 the standard value ofconcentration.
■ Analytical ConditionsInstrumentPlasma Unit RF OutputCoolant Gas Flow Rate (Ar)Plasma Gas Flow Rate (Ar)Carrier Gas Flow Rate (Ar)Sample Introduction UnitNebulizerSample Intake RateChamberPlasma TorchSampling DepthSampling Interface
: ICPM-8500
: 1.2 kW: 7 L/min: 1.5 L/min: 0.6 L/min
: Coaxial Nebulizer: 0.4 mL/min: Cooled Scott Chamber: Three-layered Mini Torch: 4 mm: Copper
References(1) Drinking Water Test Method & Explanation (2001
Edition) Japan Water Works Association (JWWA)(2) EPA Method 200.8 Ver. 5.4, 26 June 1998(3) Ordinances Related to Water Quality Standards,
Japanese Ministry of Health, Labour and WelfareOrdinance 101, announced 30 May 2003
(4) Approved Methods for Regulations Related to WaterQuality Standards Ordinance, Ministry of Health,Labour and Welfare Notification No. 261, 22 July 2003
(5) Water Quality Standards Ordinance and Partial Revisionof Waterworks Law, Ministry of Health, Labour andWelfare; Health Policy Bureau Ordinance No. 1010004,10 Oct. 2003
ElementQuantitation
resultsQuantitation
resultsQuantitation
results
Tap water Tap water spiked with 1/100 standard value Tap water spiked with 1/10 standard value
Spikedamount
Recoveryrate
Spikedamount
Recoveryrate
Table 1.38.1 Results of spike and recovery tests on tap water (units: µg/L)
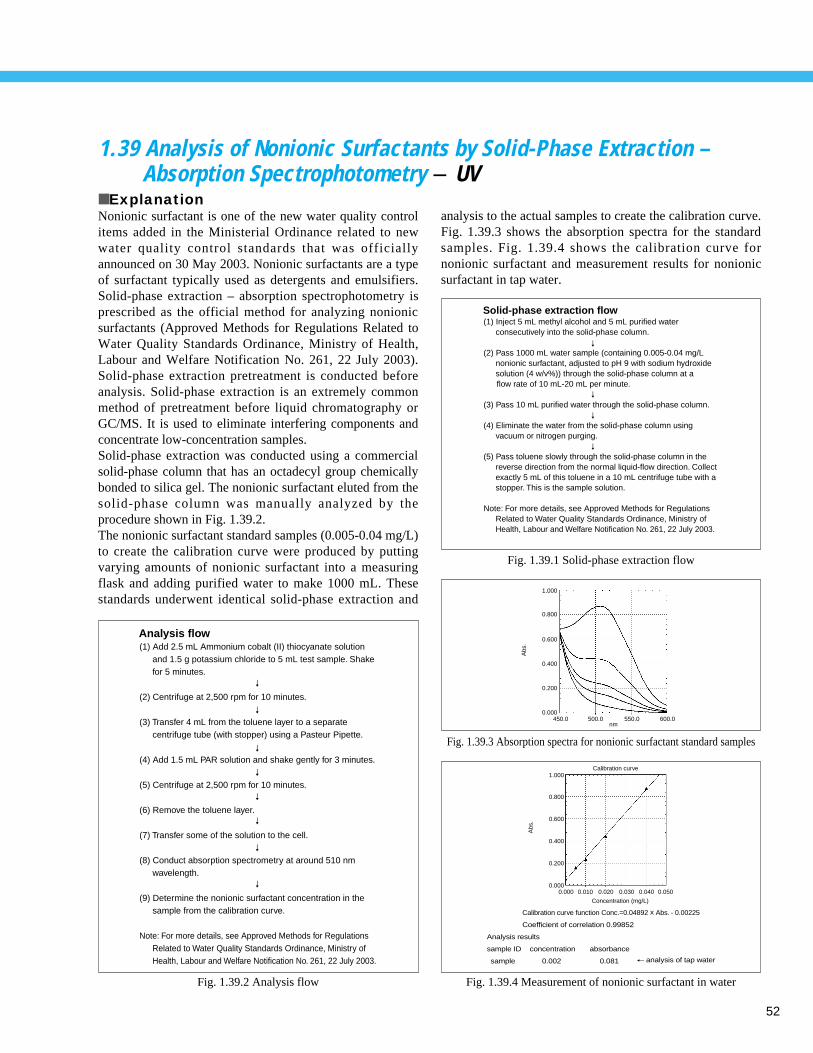
52
1.39 Analysis of Nonionic Surfactants by Solid-Phase Extraction – Absorption Spectrophotometry - UV
■ ExplanationNonionic surfactant is one of the new water quality controlitems added in the Ministerial Ordinance related to newwater quality control standards that was officiallyannounced on 30 May 2003. Nonionic surfactants are a typeof surfactant typically used as detergents and emulsifiers.Solid-phase extraction – absorption spectrophotometry isprescribed as the official method for analyzing nonionicsurfactants (Approved Methods for Regulations Related toWater Quality Standards Ordinance, Ministry of Health,Labour and Welfare Notification No. 261, 22 July 2003).Solid-phase extraction pretreatment is conducted beforeanalysis. Solid-phase extraction is an extremely commonmethod of pretreatment before liquid chromatography orGC/MS. It is used to eliminate interfering components andconcentrate low-concentration samples. Solid-phase extraction was conducted using a commercialsolid-phase column that has an octadecyl group chemicallybonded to silica gel. The nonionic surfactant eluted from thesolid-phase column was manually analyzed by theprocedure shown in Fig. 1.39.2. The nonionic surfactant standard samples (0.005-0.04 mg/L)to create the calibration curve were produced by puttingvarying amounts of nonionic surfactant into a measuringflask and adding purified water to make 1000 mL. Thesestandards underwent identical solid-phase extraction and
analysis to the actual samples to create the calibration curve.Fig. 1.39.3 shows the absorption spectra for the standardsamples. Fig. 1.39.4 shows the calibration curve fornonionic surfactant and measurement results for nonionicsurfactant in tap water.
Solid-phase extraction flow(1) Inject 5 mL methyl alcohol and 5 mL purified water
consecutively into the solid-phase column.
(2) Pass 1000 mL water sample (containing 0.005-0.04 mg/L nonionic surfactant, adjusted to pH 9 with sodium hydroxide solution (4 w/v%)) through the solid-phase column at a flow rate of 10 mL-20 mL per minute.
(3) Pass 10 mL purified water through the solid-phase column.
(4) Eliminate the water from the solid-phase column using vacuum or nitrogen purging.
(5) Pass toluene slowly through the solid-phase column in the reverse direction from the normal liquid-flow direction. Collect exactly 5 mL of this toluene in a 10 mL centrifuge tube with a stopper. This is the sample solution.
Note: For more details, see Approved Methods for Regulations Related to Water Quality Standards Ordinance, Ministry of Health, Labour and Welfare Notification No. 261, 22 July 2003.
Analysis flow(1) Add 2.5 mL Ammonium cobalt (II) thiocyanate solution
and 1.5 g potassium chloride to 5 mL test sample. Shake for 5 minutes.
(2) Centrifuge at 2,500 rpm for 10 minutes.
(3) Transfer 4 mL from the toluene layer to a separate centrifuge tube (with stopper) using a Pasteur Pipette.
(4) Add 1.5 mL PAR solution and shake gently for 3 minutes.
(5) Centrifuge at 2,500 rpm for 10 minutes.
(6) Remove the toluene layer.
(7) Transfer some of the solution to the cell.
(8) Conduct absorption spectrometry at around 510 nm wavelength.
(9) Determine the nonionic surfactant concentration in the sample from the calibration curve.
Note: For more details, see Approved Methods for Regulations Related to Water Quality Standards Ordinance, Ministry of Health, Labour and Welfare Notification No. 261, 22 July 2003.
Calibration curve function Conc.=0.04892 x Abs. - 0.00225
Coefficient of correlation 0.99852
Analysis results
sample ID concentration absorbance
sample 0.002 0.081 analysis of tap water
Concentration (mg/L)
Calibration curve
0.000 0.010 0.020 0.030 0.040 0.050
1.000
0.800
0.600
0.400
0.200
0.000
Abs
.
nm450.0
1.000
0.800
0.600
0.400
0.200
0.000500.0 550.0 600.0
Abs
.
Fig. 1.39.2 Analysis flow Fig. 1.39.4 Measurement of nonionic surfactant in water
Fig. 1.39.3 Absorption spectra for nonionic surfactant standard samples
Fig. 1.39.1 Solid-phase extraction flow
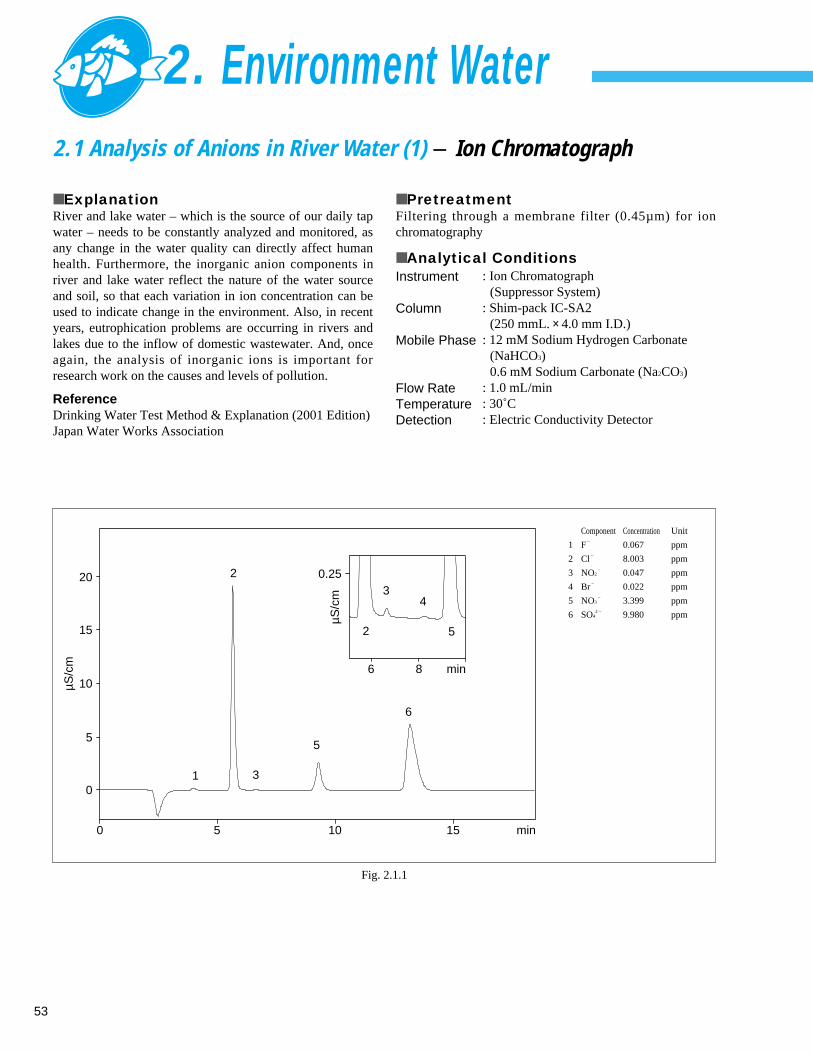
2.1 Analysis of Anions in River Water (1) - Ion Chromatograph
■ ExplanationRiver and lake water – which is the source of our daily tapwater – needs to be constantly analyzed and monitored, asany change in the water quality can directly affect humanhealth. Furthermore, the inorganic anion components inriver and lake water reflect the nature of the water sourceand soil, so that each variation in ion concentration can beused to indicate change in the environment. Also, in recentyears, eutrophication problems are occurring in rivers andlakes due to the inflow of domestic wastewater. And, onceagain, the analysis of inorganic ions is important forresearch work on the causes and levels of pollution.
ReferenceDrinking Water Test Method & Explanation (2001 Edition) Japan Water Works Association
■ PretreatmentFiltering through a membrane filter (0.45µm) for ionchromatography
■ Analytical ConditionsInstrument
Column
Mobile Phase
Flow RateTemperatureDetection
: Ion Chromatograph (Suppressor System)
: Shim-pack IC-SA2 (250 mmL. × 4.0 mm I.D.)
: 12 mM Sodium Hydrogen Carbonate(NaHCO3)0.6 mM Sodium Carbonate (Na2CO3)
: 1.0 mL/min: 30˚C: Electric Conductivity Detector
min0 5 10 15
µS/c
m
0
5
10
15
20
1
2
5
6
3
min6 8
µS/c
m
0.25
2
34
5
Fig. 2.1.1
Component Concentration Unit
1 F–
0.067 ppm
2 Cl–
8.003 ppm
3 NO2–
0.047 ppm
4 Br–
0.022 ppm
5 NO3–
3.399 ppm
6 SO42 – 9.980 ppm
53
2. Environment Water
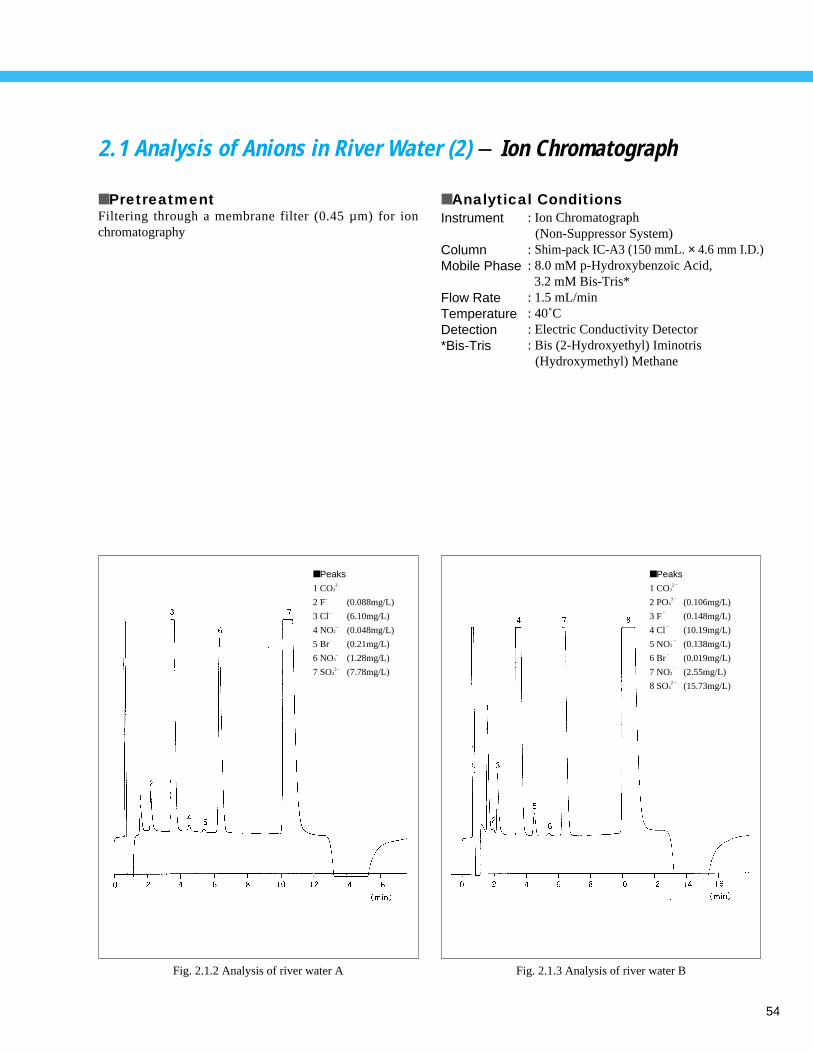
54
2.1 Analysis of Anions in River Water (2) - Ion Chromatograph
■ PretreatmentFiltering through a membrane filter (0.45 µm) for ionchromatography
■ Analytical Conditions
Fig. 2.1.2 Analysis of river water A
■ Peaks
1 CO32–
2 F– (0.088mg/L)
3 Cl– (6.10mg/L)
4 NO2– (0.048mg/L)
5 Br– (0.21mg/L)
6 NO3– (1.28mg/L)
7 SO42– (7.78mg/L)
Fig. 2.1.3 Analysis of river water B
■ Peaks
1 CO32 –
2 PO43 – (0.106mg/L)
3 F–
(0.148mg/L)
4 Cl–
(10.19mg/L)
5 NO2–
(0.138mg/L)
6 Br–
(0.019mg/L)
7 NO3–
(2.55mg/L)
8 SO42 – (15.73mg/L)
Instrument
ColumnMobile Phase
Flow RateTemperatureDetection*Bis-Tris
: Ion Chromatograph(Non-Suppressor System)
: Shim-pack IC-A3 (150 mmL. × 4.6 mm I.D.): 8.0 mM p-Hydroxybenzoic Acid, 3.2 mM Bis-Tris*
: 1.5 mL/min: 40˚C: Electric Conductivity Detector: Bis (2-Hydroxyethyl) Iminotris
(Hydroxymethyl) Methane
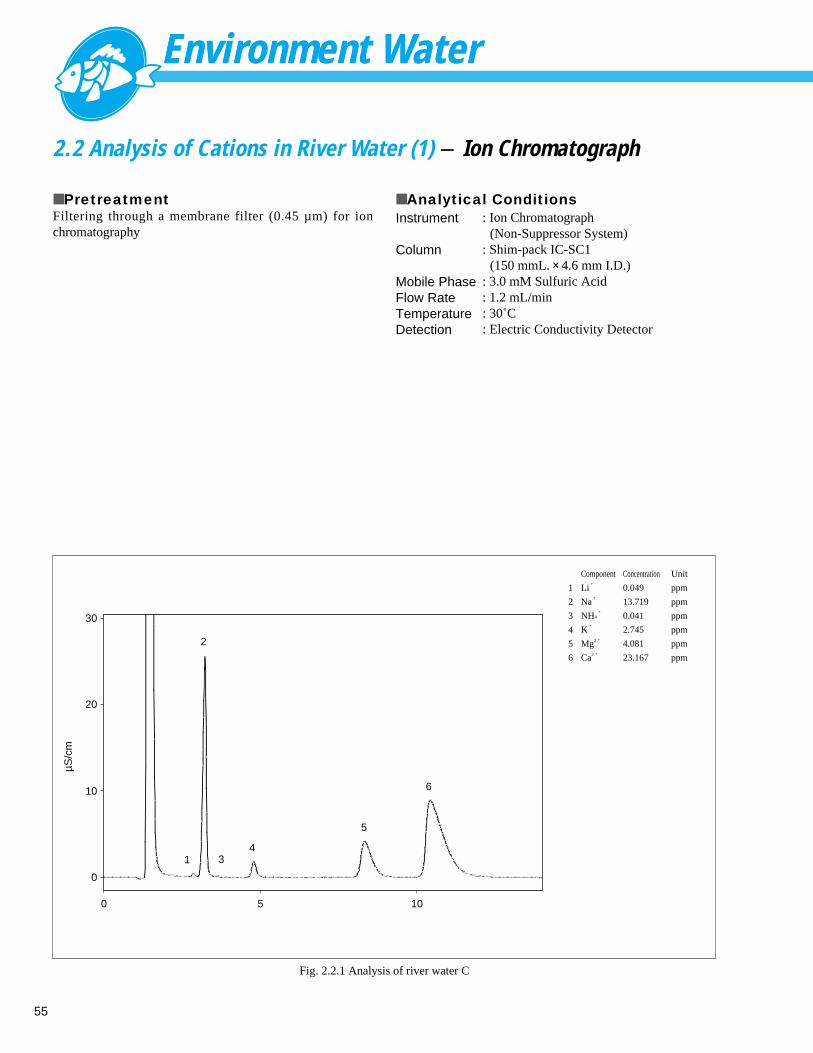
Environment Water
55
2.2 Analysis of Cations in River Water (1) - Ion Chromatograph
■ PretreatmentFiltering through a membrane filter (0.45 µm) for ionchromatography
■ Analytical Conditions
0
µS/c
m
5 10
10
0
20
30
1
2
34
5
6
Fig. 2.2.1 Analysis of river water C
Instrument
Column
Mobile PhaseFlow RateTemperatureDetection
: Ion Chromatograph(Non-Suppressor System)
: Shim-pack IC-SC1 (150 mmL. × 4.6 mm I.D.)
: 3.0 mM Sulfuric Acid: 1.2 mL/min: 30˚C: Electric Conductivity Detector
Component Concentration Unit
1 Li+
0.049 ppm
2 Na+
13.719 ppm
3 NH4+
0.041 ppm
4 K+
2.745 ppm
5 Mg2 + 4.081 ppm
6 Ca2 + 23.167 ppm
Environment Water
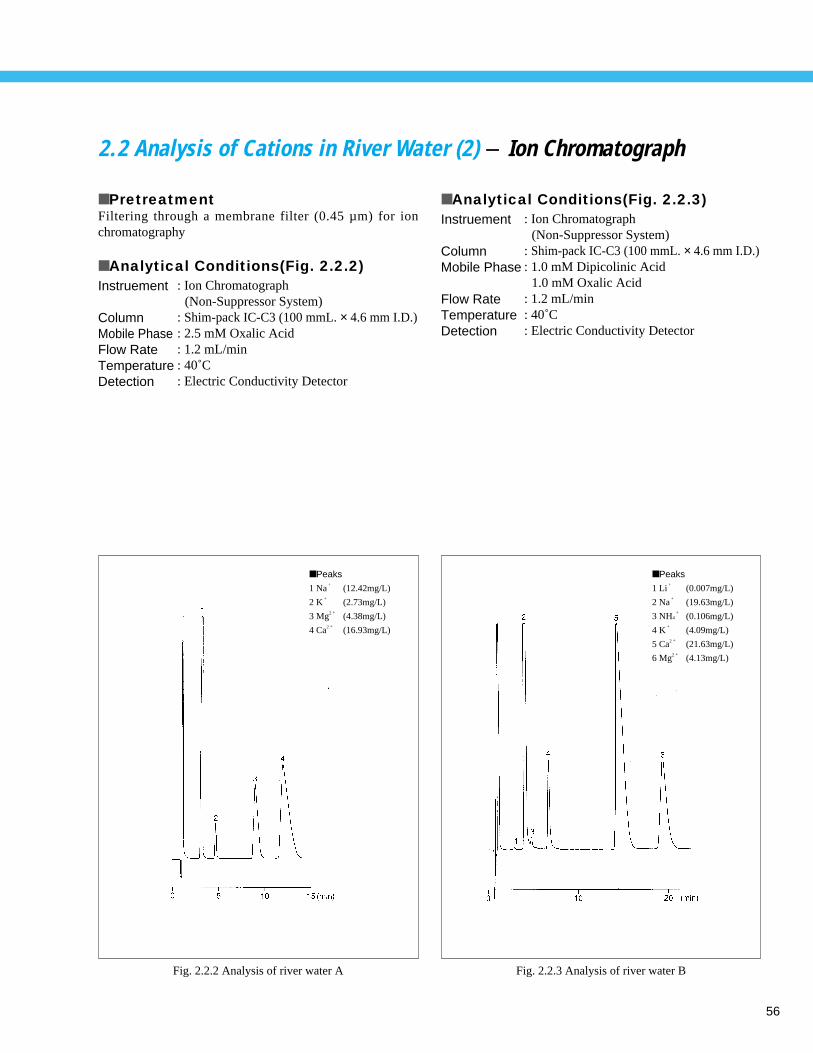
56
2.2 Analysis of Cations in River Water (2) - Ion Chromatograph
■ PretreatmentFiltering through a membrane filter (0.45 µm) for ionchromatography
■ Analytical Conditions(Fig. 2.2.2)Instruement
ColumnMobile PhaseFlow RateTemperatureDetection
: Ion Chromatograph(Non-Suppressor System)
: Shim-pack IC-C3 (100 mmL. × 4.6 mm I.D.): 2.5 mM Oxalic Acid: 1.2 mL/min: 40˚C: Electric Conductivity Detector
■ Analytical Conditions(Fig. 2.2.3)Instruement
ColumnMobile Phase
Flow RateTemperatureDetection
: Ion Chromatograph(Non-Suppressor System)
: Shim-pack IC-C3 (100 mmL. × 4.6 mm I.D.): 1.0 mM Dipicolinic Acid
1.0 mM Oxalic Acid: 1.2 mL/min: 40˚C: Electric Conductivity Detector
Fig. 2.2.2 Analysis of river water A
■ Peaks
1 Na+
(12.42mg/L)
2 K+
(2.73mg/L)
3 Mg2 + (4.38mg/L)
4 Ca2 + (16.93mg/L)
Fig. 2.2.3 Analysis of river water B
■ Peaks
1 Li+
(0.007mg/L)
2 Na+
(19.63mg/L)
3 NH4+
(0.106mg/L)
4 K+
(4.09mg/L)
5 Ca2 + (21.63mg/L)
6 Mg2 + (4.13mg/L)
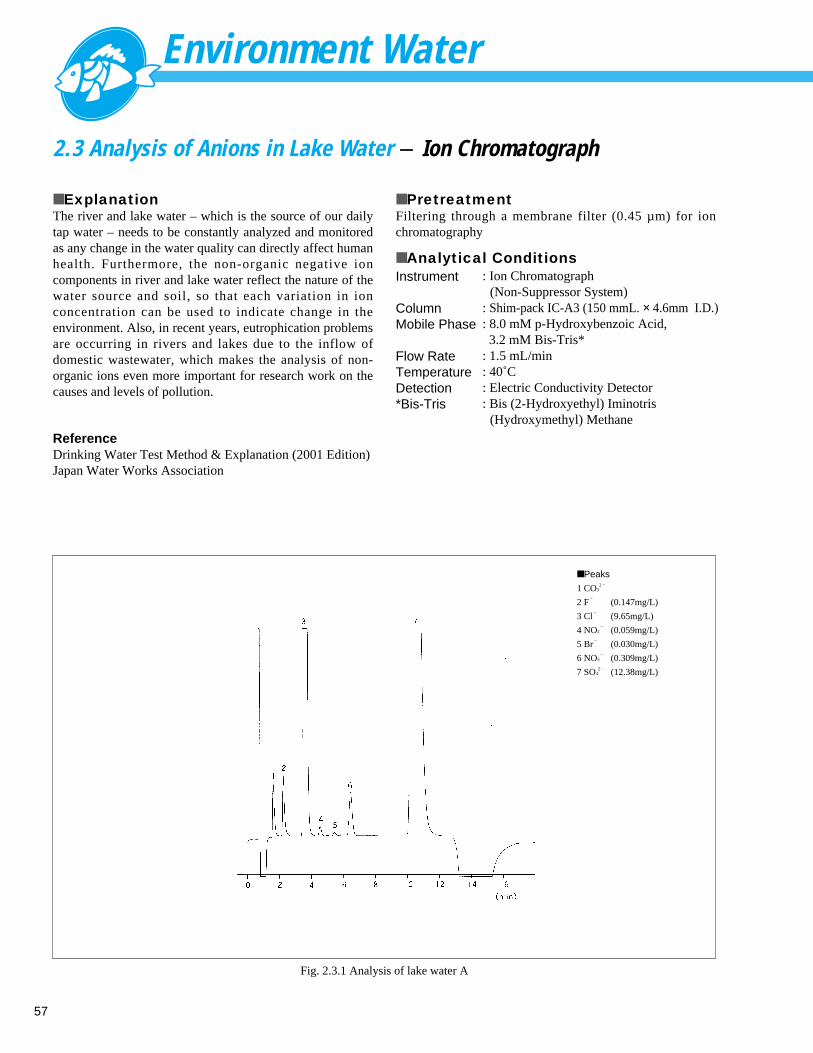
Environment Water
57
2.3 Analysis of Anions in Lake Water - Ion Chromatograph
■ ExplanationThe river and lake water – which is the source of our dailytap water – needs to be constantly analyzed and monitoredas any change in the water quality can directly affect humanhealth. Furthermore, the non-organic negative ioncomponents in river and lake water reflect the nature of thewater source and soil, so that each variation in ionconcentration can be used to indicate change in theenvironment. Also, in recent years, eutrophication problemsare occurring in rivers and lakes due to the inflow ofdomestic wastewater, which makes the analysis of non-organic ions even more important for research work on thecauses and levels of pollution.
ReferenceDrinking Water Test Method & Explanation (2001 Edition)Japan Water Works Association
■ PretreatmentFiltering through a membrane filter (0.45 µm) for ionchromatography
■ Analytical Conditions
Fig. 2.3.1 Analysis of lake water A
■ Peaks
1 CO32 –
2 F–
(0.147mg/L)
3 Cl–
(9.65mg/L)
4 NO2–
(0.059mg/L)
5 Br–
(0.030mg/L)
6 NO3–
(0.309mg/L)
7 SO42 – (12.38mg/L)
Instrument
ColumnMobile Phase
Flow RateTemperatureDetection*Bis-Tris
: Ion Chromatograph(Non-Suppressor System)
: Shim-pack IC-A3 (150 mmL. × 4.6mm I.D.): 8.0 mM p-Hydroxybenzoic Acid, 3.2 mM Bis-Tris*
: 1.5 mL/min: 40˚C: Electric Conductivity Detector: Bis (2-Hydroxyethyl) Iminotris
(Hydroxymethyl) Methane
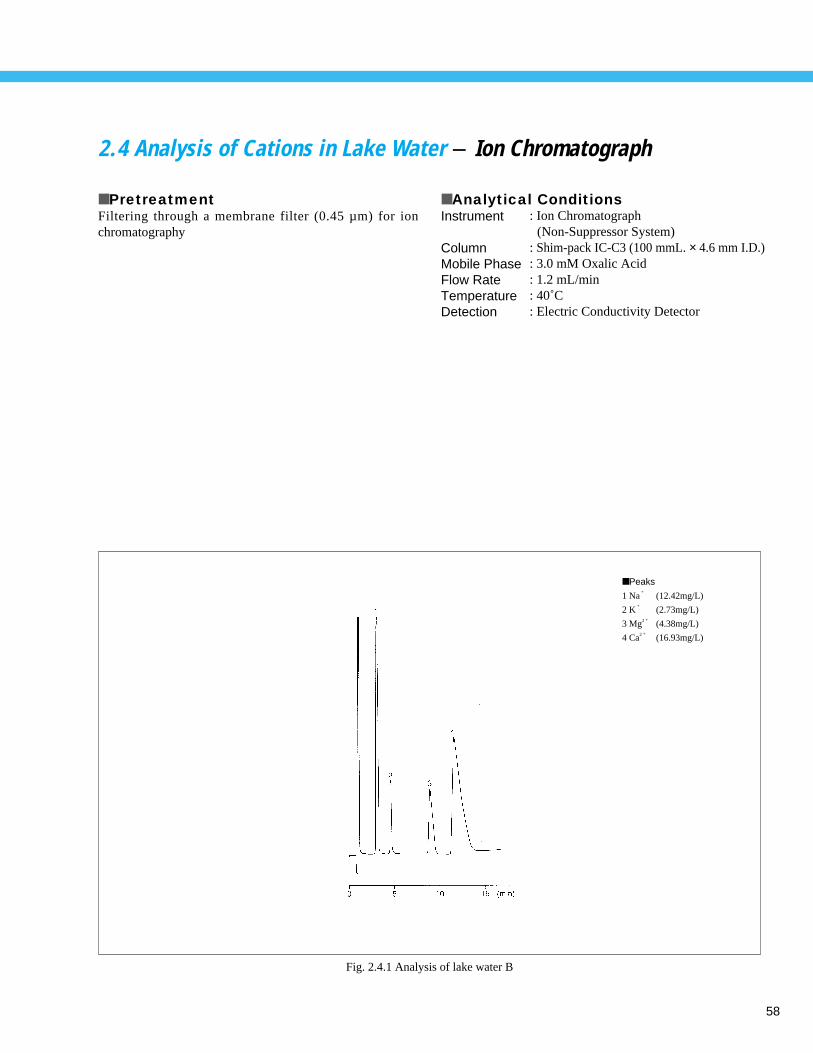
58
2.4 Analysis of Cations in Lake Water - Ion Chromatograph
■ PretreatmentFiltering through a membrane filter (0.45 µm) for ionchromatography
Fig. 2.4.1 Analysis of lake water B
■ Peaks
1 Na+
(12.42mg/L)
2 K+
(2.73mg/L)
3 Mg2 + (4.38mg/L)
4 Ca2 + (16.93mg/L)
■ Analytical ConditionsInstrument
ColumnMobile PhaseFlow RateTemperatureDetection
: Ion Chromatograph(Non-Suppressor System)
: Shim-pack IC-C3 (100 mmL. × 4.6 mm I.D.): 3.0 mM Oxalic Acid: 1.2 mL/min: 40˚C: Electric Conductivity Detector
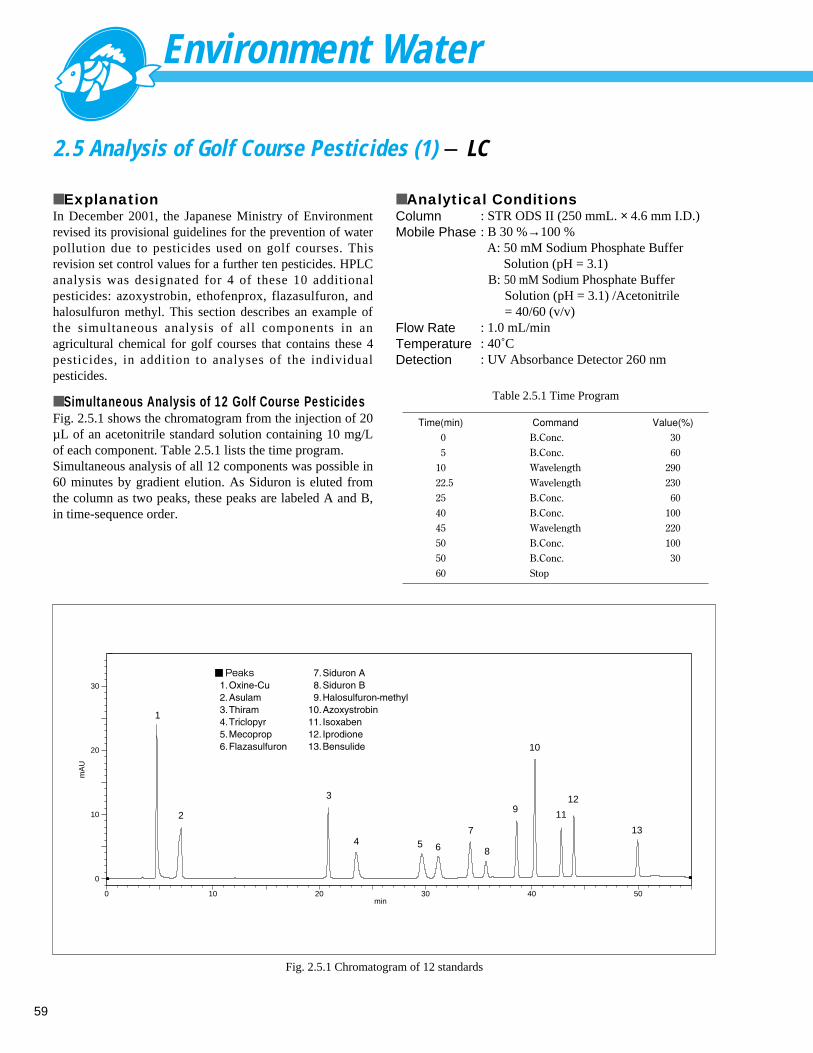
Environment Water
59
2.5 Analysis of Golf Course Pesticides (1) - LC
■ ExplanationIn December 2001, the Japanese Ministry of Environmentrevised its provisional guidelines for the prevention of waterpollution due to pesticides used on golf courses. Thisrevision set control values for a further ten pesticides. HPLCanalysis was designated for 4 of these 10 additionalpesticides: azoxystrobin, ethofenprox, flazasulfuron, andhalosulfuron methyl. This section describes an example ofthe simultaneous analysis of all components in anagricultural chemical for golf courses that contains these 4pesticides, in addition to analyses of the individualpesticides.
■ Simultaneous Analysis of 12 Golf Course PesticidesFig. 2.5.1 shows the chromatogram from the injection of 20µL of an acetonitrile standard solution containing 10 mg/Lof each component. Table 2.5.1 lists the time program.Simultaneous analysis of all 12 components was possible in60 minutes by gradient elution. As Siduron is eluted fromthe column as two peaks, these peaks are labeled A and B,in time-sequence order.
■ Analytical ConditionsColumnMobile Phase
Flow RateTemperatureDetection
: STR ODS II (250 mmL. × 4.6 mm I.D.): B 30 %→100 %A: 50 mM Sodium Phosphate Buffer
Solution (pH = 3.1)B: 50 mM Sodium Phosphate Buffer
Solution (pH = 3.1) /Acetonitrile = 40/60 (v/v)
: 1.0 mL/min: 40˚C: UV Absorbance Detector 260 nm
min0 10 20 30 40 50
mA
U
0
10
20
30
1
11
10
9
8
7
654
3
2
13
12
Fig. 2.5.1 Chromatogram of 12 standards
Table 2.5.1 Time Program
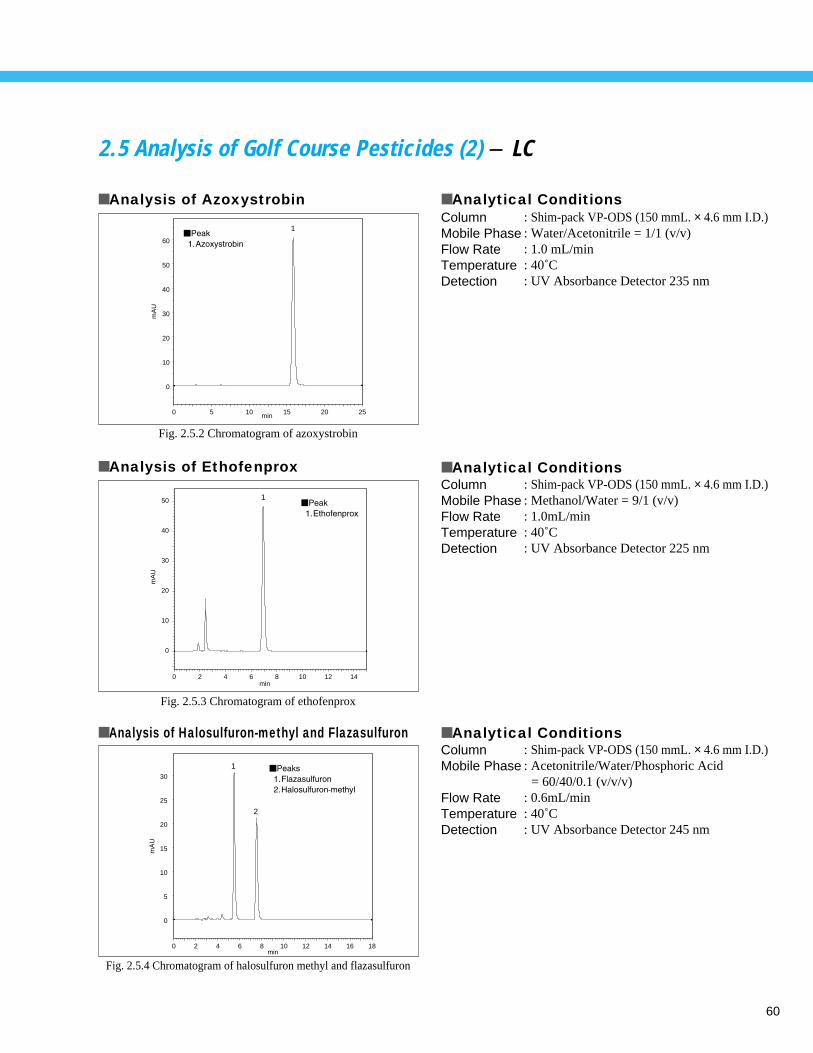
60
■ Analytical ConditionsColumnMobile PhaseFlow RateTemperatureDetection
: Shim-pack VP-ODS (150 mmL. × 4.6 mm I.D.): Water/Acetonitrile = 1/1 (v/v) : 1.0 mL/min: 40˚C: UV Absorbance Detector 235 nm
2.5 Analysis of Golf Course Pesticides (2) - LC
■ Analytical Conditions
■ Analytical Conditions
min0 5 10 15 20 25
mA
U
0
10
20
30
40
50
60
1
min0 2 4 6 8 10 12 14
0
10
20
30
40
50
mA
U
1
min0 2 4 6 8 10 12 14 16 18
mA
U
0
5
10
15
20
25
30
1
2
■ Analysis of Ethofenprox
■ Analysis of Halosulfuron-methyl and Flazasulfuron
■ Analysis of Azoxystrobin
Fig. 2.5.2 Chromatogram of azoxystrobin
Fig. 2.5.3 Chromatogram of ethofenprox
Fig. 2.5.4 Chromatogram of halosulfuron methyl and flazasulfuron
ColumnMobile PhaseFlow RateTemperatureDetection
: Shim-pack VP-ODS (150 mmL. × 4.6 mm I.D.): Methanol/Water = 9/1 (v/v): 1.0mL/min: 40˚C: UV Absorbance Detector 225 nm
ColumnMobile Phase
Flow RateTemperatureDetection
: Shim-pack VP-ODS (150 mmL. × 4.6 mm I.D.): Acetonitrile/Water/Phosphoric Acid
= 60/40/0.1 (v/v/v) : 0.6mL/min: 40˚C: UV Absorbance Detector 245 nm
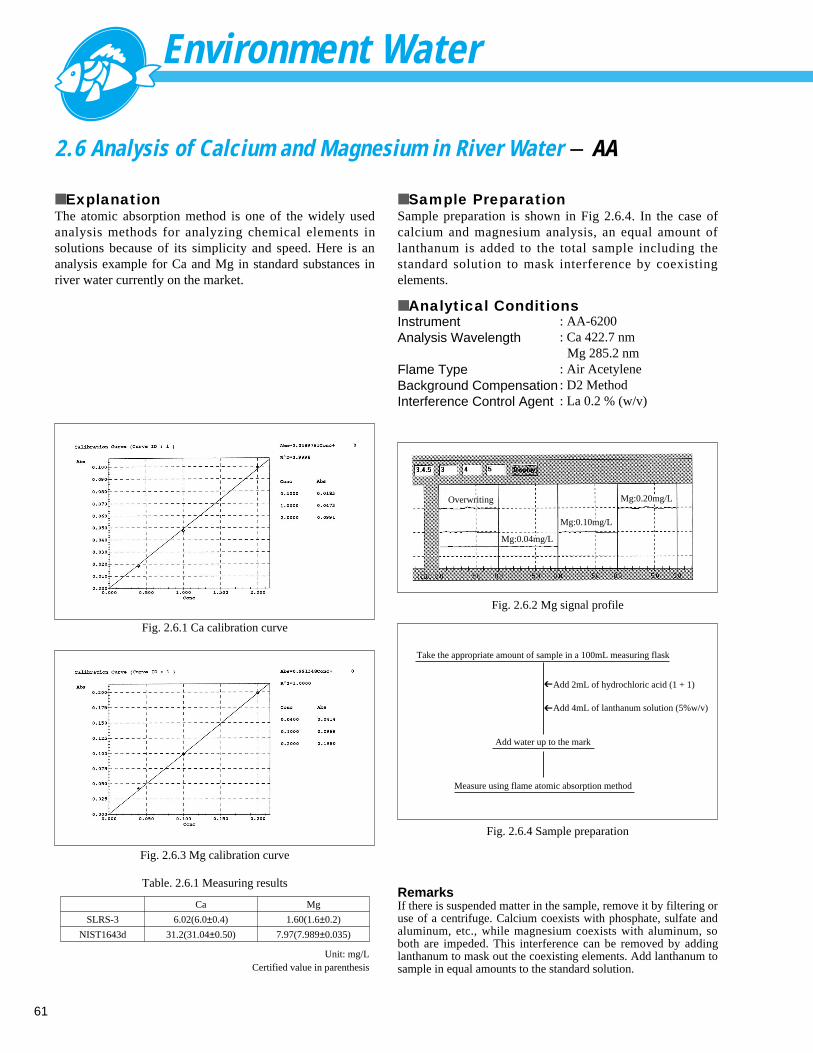
Environment Water
61
2.6 Analysis of Calcium and Magnesium in River Water - AA
■ ExplanationThe atomic absorption method is one of the widely usedanalysis methods for analyzing chemical elements insolutions because of its simplicity and speed. Here is ananalysis example for Ca and Mg in standard substances inriver water currently on the market.
■ Sample PreparationSample preparation is shown in Fig 2.6.4. In the case ofcalcium and magnesium analysis, an equal amount oflanthanum is added to the total sample including thestandard solution to mask interference by coexistingelements.
■ Analytical Conditions
Fig. 2.6.1 Ca calibration curve
Fig. 2.6.2 Mg signal profile
Fig. 2.6.3 Mg calibration curve
RemarksIf there is suspended matter in the sample, remove it by filtering oruse of a centrifuge. Calcium coexists with phosphate, sulfate andaluminum, etc., while magnesium coexists with aluminum, soboth are impeded. This interference can be removed by addinglanthanum to mask out the coexisting elements. Add lanthanum tosample in equal amounts to the standard solution.
InstrumentAnalysis Wavelength
Flame TypeBackground CompensationInterference Control Agent
: AA-6200: Ca 422.7 nm
Mg 285.2 nm: Air Acetylene: D2 Method: La 0.2 % (w/v)
SLRS-3
NIST1643d
Ca
6.02(6.0±0.4)
31.2(31.04±0.50)
Mg
1.60(1.6±0.2)
7.97(7.989±0.035)
Unit: mg/LCertified value in parenthesis
Table. 2.6.1 Measuring results
Fig. 2.6.4 Sample preparation
Take the appropriate amount of sample in a 100mL measuring flask
Add water up to the mark
Measure using flame atomic absorption method
Add 2mL of hydrochloric acid (1 + 1)
Add 4mL of lanthanum solution (5%w/v)
➔
➔
Overwriting
Mg:0.04mg/L
Mg:0.10mg/L
Mg:0.20mg/L
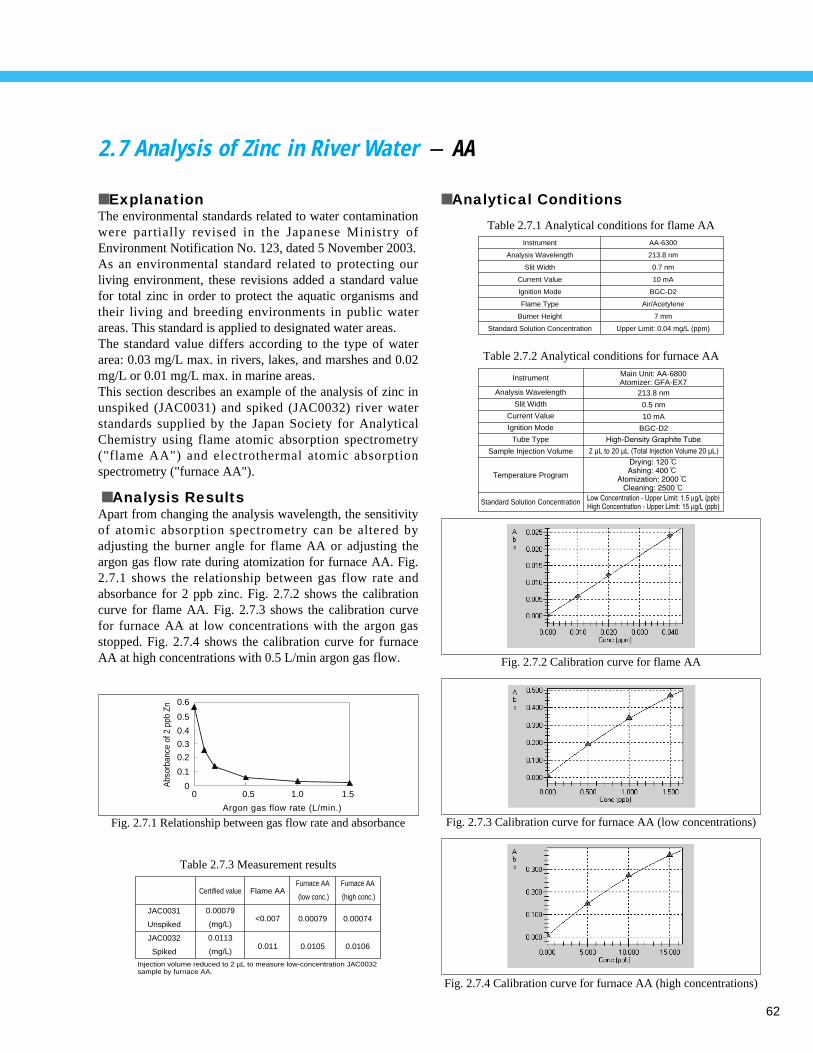
62
2.7 Analysis of Zinc in River Water - AA
■ ExplanationThe environmental standards related to water contaminationwere partially revised in the Japanese Ministry ofEnvironment Notification No. 123, dated 5 November 2003. As an environmental standard related to protecting ourliving environment, these revisions added a standard valuefor total zinc in order to protect the aquatic organisms andtheir living and breeding environments in public waterareas. This standard is applied to designated water areas. The standard value differs according to the type of waterarea: 0.03 mg/L max. in rivers, lakes, and marshes and 0.02mg/L or 0.01 mg/L max. in marine areas. This section describes an example of the analysis of zinc inunspiked (JAC0031) and spiked (JAC0032) river waterstandards supplied by the Japan Society for AnalyticalChemistry using flame atomic absorption spectrometry("flame AA") and electrothermal atomic absorptionspectrometry ("furnace AA").
■ Analysis ResultsApart from changing the analysis wavelength, the sensitivityof atomic absorption spectrometry can be altered byadjusting the burner angle for flame AA or adjusting theargon gas flow rate during atomization for furnace AA. Fig.2.7.1 shows the relationship between gas flow rate andabsorbance for 2 ppb zinc. Fig. 2.7.2 shows the calibrationcurve for flame AA. Fig. 2.7.3 shows the calibration curvefor furnace AA at low concentrations with the argon gasstopped. Fig. 2.7.4 shows the calibration curve for furnaceAA at high concentrations with 0.5 L/min argon gas flow.
■ Analytical Conditions
Instrument
Analysis Wavelength
Slit Width
Current Value
Ignition Mode
Flame Type
Burner Height
Standard Solution Concentration
AA-6300
213.8 nm
0.7 nm
10 mA
BGC-D2
Air/Acetylene
7 mm
Upper Limit: 0.04 mg/L (ppm)
Main Unit: AA-6800Atomizer: GFA-EX7
Instrument
Analysis Wavelength
Slit Width
Current Value
Ignition Mode
Tube Type
Sample Injection Volume
Temperature Program
Standard Solution Concentration
2 µL 20 µL20 µL
213.8 nm
0.5 nm
10 mA
BGC-D2
0
0.1
0.2
0.3
0.4
0.5
0.6
Argon gas flow rate (L/min.)
Abs
orba
nce
of 2
ppb
Zn
0 0.5 1.0 1.5
JAC0031
Unspiked
JAC0032
Spiked
Certified value
0.00079
(mg/L)
0.0113
(mg/L)
Flame AA
<0.007
0.011
Furnace AA
(low conc.)
0.00079
0.0105
Furnace AA
(high conc.)
0.00074
0.0106
Injection volume reduced to 2 µL to measure low-concentration JAC0032 sample by furnace AA.
Table 2.7.2 Analytical conditions for furnace AA
Table 2.7.1 Analytical conditions for flame AA
Fig. 2.7.2 Calibration curve for flame AA
Fig. 2.7.3 Calibration curve for furnace AA (low concentrations)
Fig. 2.7.4 Calibration curve for furnace AA (high concentrations)
Fig. 2.7.1 Relationship between gas flow rate and absorbance
Table 2.7.3 Measurement results
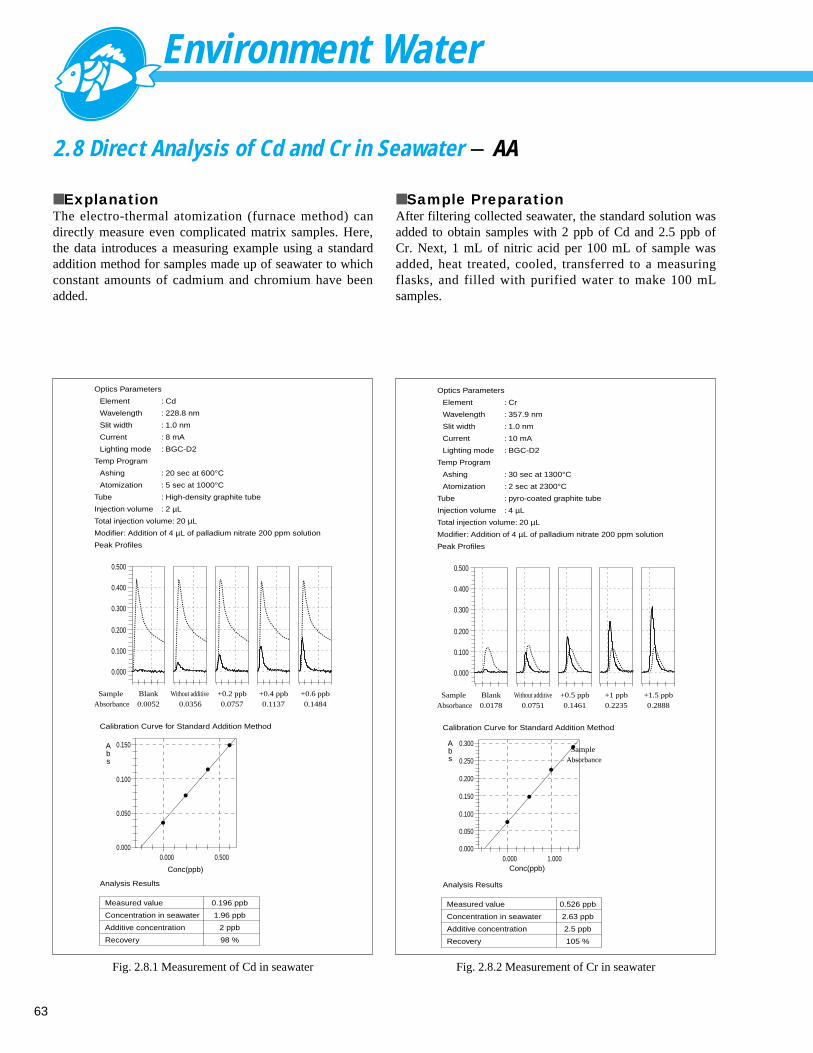
Environment Water
63
2.8 Direct Analysis of Cd and Cr in Seawater - AA
■ ExplanationThe electro-thermal atomization (furnace method) candirectly measure even complicated matrix samples. Here,the data introduces a measuring example using a standardaddition method for samples made up of seawater to whichconstant amounts of cadmium and chromium have beenadded.
■ Sample PreparationAfter filtering collected seawater, the standard solution wasadded to obtain samples with 2 ppb of Cd and 2.5 ppb ofCr. Next, 1 mL of nitric acid per 100 mL of sample wasadded, heat treated, cooled, transferred to a measuringflasks, and filled with purified water to make 100 mLsamples.
Optics Parameters
Element : Cd
Wavelength : 228.8 nm
Slit width : 1.0 nm
Current : 8 mA
Lighting mode : BGC-D2
Temp Program
Ashing : 20 sec at 600°C
Atomization : 5 sec at 1000°C
Tube : High-density graphite tube
Injection volume : 2 µL
Total injection volume: 20 µL
Modifier: Addition of 4 µL of palladium nitrate 200 ppm solution
Peak Profiles
Calibration Curve for Standard Addition Method
Analysis Results
Sample
Absorbance
Blank
0.0052
Without additive
0.0356
+0.2 ppb
0.0757
+0.4 ppb
0.1137
+0.6 ppb
0.1484
Measured value
Concentration in seawater
Additive concentration
Recovery
0.196 ppb
1.96 ppb
2 ppb
98 %
0.500
0.400
0.300
0.200
0.100
0.000
0.150
0.100
0.050
0.0000.000 0.500
Abs
Conc(ppb)
Fig. 2.8.1 Measurement of Cd in seawater
Optics Parameters
Element : Cr
Wavelength : 357.9 nm
Slit width : 1.0 nm
Current : 10 mA
Lighting mode : BGC-D2
Temp Program
Ashing : 30 sec at 1300°C
Atomization : 2 sec at 2300°C
Tube : pyro-coated graphite tube
Injection volume : 4 µL
Total injection volume: 20 µL
Modifier: Addition of 4 µL of palladium nitrate 200 ppm solution
Peak Profiles
Calibration Curve for Standard Addition Method
Analysis Results
Sample
Absorbance
Blank
0.0178
Without additive
0.0751
+0.5 ppb
0.1461
+1 ppb
0.2235
+1.5 ppb
0.2888
0.500
0.400
0.300
0.200
0.100
0.000
0.150
0.100
0.250
0.300
0.200
0.050
0.0000.000 1.000
Abs
Conc(ppb)
Measured value
Concentration in seawater
Additive concentration
Recovery
0.526 ppb
2.63 ppb
2.5 ppb
105 %
Sample
Absorbance
Fig. 2.8.2 Measurement of Cr in seawater
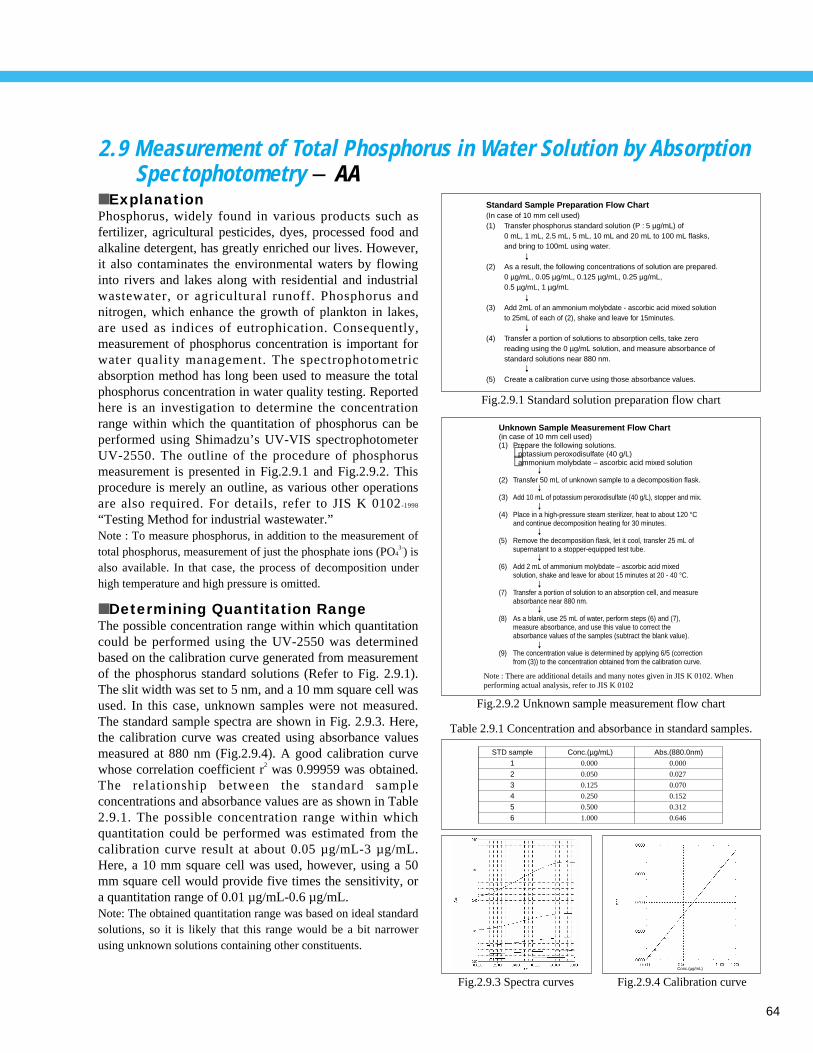
64
2.9 Measurement of Total Phosphorus in Water Solution by Absorption Spectophotometry - AA
■ ExplanationPhosphorus, widely found in various products such asfertilizer, agricultural pesticides, dyes, processed food andalkaline detergent, has greatly enriched our lives. However,it also contaminates the environmental waters by flowinginto rivers and lakes along with residential and industrialwastewater, or agricultural runoff. Phosphorus andnitrogen, which enhance the growth of plankton in lakes,are used as indices of eutrophication. Consequently,measurement of phosphorus concentration is important forwater quality management. The spectrophotometricabsorption method has long been used to measure the totalphosphorus concentration in water quality testing. Reportedhere is an investigation to determine the concentrationrange within which the quantitation of phosphorus can beperformed using Shimadzu’s UV-VIS spectrophotometerUV-2550. The outline of the procedure of phosphorusmeasurement is presented in Fig.2.9.1 and Fig.2.9.2. Thisprocedure is merely an outline, as various other operationsare also required. For details, refer to JIS K 0102-1998
“Testing Method for industrial wastewater.”Note : To measure phosphorus, in addition to the measurement oftotal phosphorus, measurement of just the phosphate ions (PO4
3-) isalso available. In that case, the process of decomposition underhigh temperature and high pressure is omitted.
■ Determining Quantitation RangeThe possible concentration range within which quantitationcould be performed using the UV-2550 was determinedbased on the calibration curve generated from measurementof the phosphorus standard solutions (Refer to Fig. 2.9.1).The slit width was set to 5 nm, and a 10 mm square cell wasused. In this case, unknown samples were not measured.The standard sample spectra are shown in Fig. 2.9.3. Here,the calibration curve was created using absorbance valuesmeasured at 880 nm (Fig.2.9.4). A good calibration curvewhose correlation coefficient r2 was 0.99959 was obtained.The relationship between the standard sampleconcentrations and absorbance values are as shown in Table2.9.1. The possible concentration range within whichquantitation could be performed was estimated from thecalibration curve result at about 0.05 µg/mL-3 µg/mL.Here, a 10 mm square cell was used, however, using a 50mm square cell would provide five times the sensitivity, ora quantitation range of 0.01 µg/mL-0.6 µg/mL.Note: The obtained quantitation range was based on ideal standardsolutions, so it is likely that this range would be a bit narrowerusing unknown solutions containing other constituents.
Standard Sample Preparation Flow Chart(In case of 10 mm cell used)(1) Transfer phosphorus standard solution (P : 5 µg/mL) of
0 mL, 1 mL, 2.5 mL, 5 mL, 10 mL and 20 mL to 100 mL flasks, and bring to 100mL using water.
(2) As a result, the following concentrations of solution are prepared.0 µg/mL, 0.05 µg/mL, 0.125 µg/mL, 0.25 µg/mL,0.5 µg/mL, 1 µg/mL
(3) Add 2mL of an ammonium molybdate - ascorbic acid mixed solution to 25mL of each of (2), shake and leave for 15minutes.
(4) Transfer a portion of solutions to absorption cells, take zero reading using the 0 µg/mL solution, and measure absorbance of standard solutions near 880 nm.
(5) Create a calibration curve using those absorbance values.
Conc.(µg/mL)
STD sample
1
2
3
4
5
6
Conc.(µg/mL)
0.000
0.050
0.125
0.250
0.500
1.000
Abs.(880.0nm)
0.000
0.027
0.070
0.152
0.312
0.646
Unknown Sample Measurement Flow Chart(in case of 10 mm cell used)(1) Prepare the following solutions.
potassium peroxodisulfate (40 g/L) ammonium molybdate – ascorbic acid mixed solution
(2) Transfer 50 mL of unknown sample to a decomposition flask.
(3) Add 10 mL of potassium peroxodisulfate (40 g/L), stopper and mix.
(4) Place in a high-pressure steam sterilizer, heat to about 120 °C and continue decomposition heating for 30 minutes.
(5) Remove the decomposition flask, let it cool, transfer 25 mL of supernatant to a stopper-equipped test tube.
(6) Add 2 mL of ammonium molybdate – ascorbic acid mixed solution, shake and leave for about 15 minutes at 20 - 40 °C.
(7) Transfer a portion of solution to an absorption cell, and measure absorbance near 880 nm.
(8) As a blank, use 25 mL of water, perform steps (6) and (7), measure absorbance, and use this value to correct the absorbance values of the samples (subtract the blank value).
(9) The concentration value is determined by applying 6/5 (correction from (3)) to the concentration obtained from the calibration curve.
⋅⋅
Note : There are additional details and many notes given in JIS K 0102. Whenperforming actual analysis, refer to JIS K 0102
Fig.2.9.1 Standard solution preparation flow chart
Fig.2.9.2 Unknown sample measurement flow chart
Table 2.9.1 Concentration and absorbance in standard samples.
Fig.2.9.3 Spectra curves Fig.2.9.4 Calibration curve
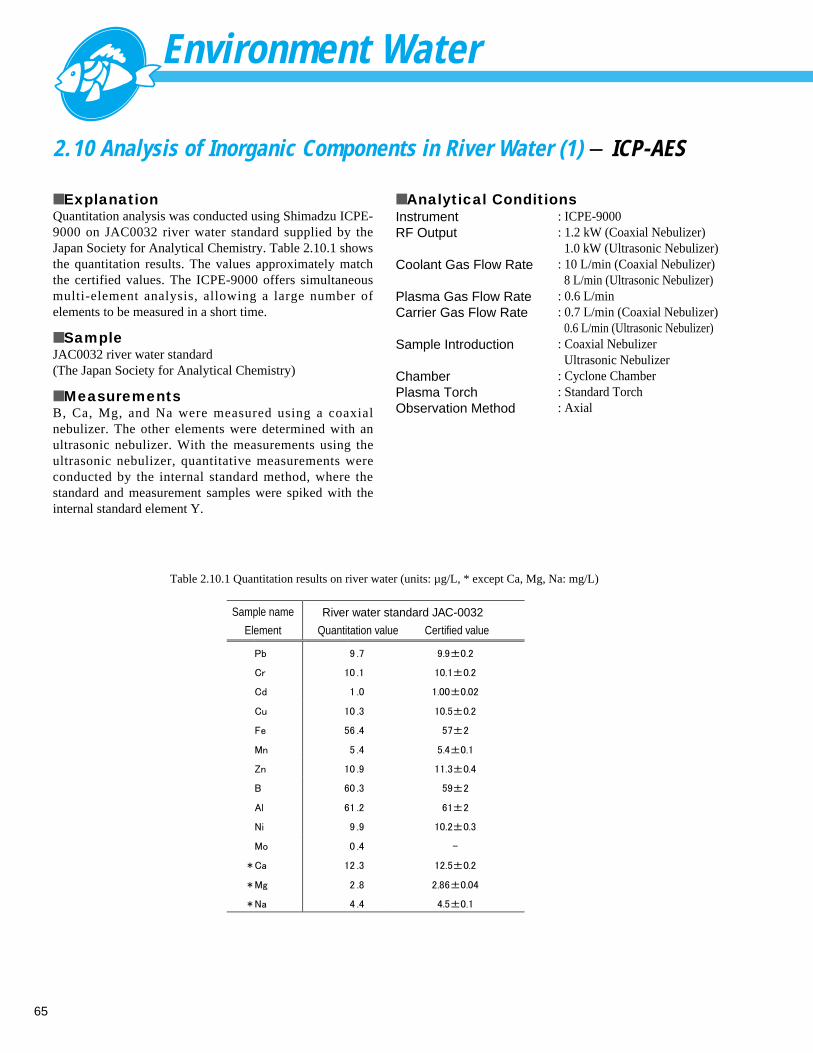
Environment Water
65
2.10 Analysis of Inorganic Components in River Water (1) - ICP-AES
Table 2.10.1 Quantitation results on river water (units: µg/L, * except Ca, Mg, Na: mg/L)
■ ExplanationQuantitation analysis was conducted using Shimadzu ICPE-9000 on JAC0032 river water standard supplied by theJapan Society for Analytical Chemistry. Table 2.10.1 showsthe quantitation results. The values approximately matchthe certified values. The ICPE-9000 offers simultaneousmulti-element analysis, allowing a large number ofelements to be measured in a short time.
■ SampleJAC0032 river water standard (The Japan Society for Analytical Chemistry)
■ MeasurementsB, Ca, Mg, and Na were measured using a coaxialnebulizer. The other elements were determined with anultrasonic nebulizer. With the measurements using theultrasonic nebulizer, quantitative measurements wereconducted by the internal standard method, where thestandard and measurement samples were spiked with theinternal standard element Y.
■ Analytical ConditionsInstrumentRF Output
Coolant Gas Flow Rate
Plasma Gas Flow RateCarrier Gas Flow Rate
Sample Introduction
ChamberPlasma TorchObservation Method
: ICPE-9000: 1.2 kW (Coaxial Nebulizer)1.0 kW (Ultrasonic Nebulizer)
: 10 L/min (Coaxial Nebulizer)8 L/min (Ultrasonic Nebulizer)
: 0.6 L/min: 0.7 L/min (Coaxial Nebulizer)
0.6 L/min (Ultrasonic Nebulizer): Coaxial NebulizerUltrasonic Nebulizer
: Cyclone Chamber: Standard Torch: Axial
River water standard JAC-0032Sample name
Element Quantitation value Certified value
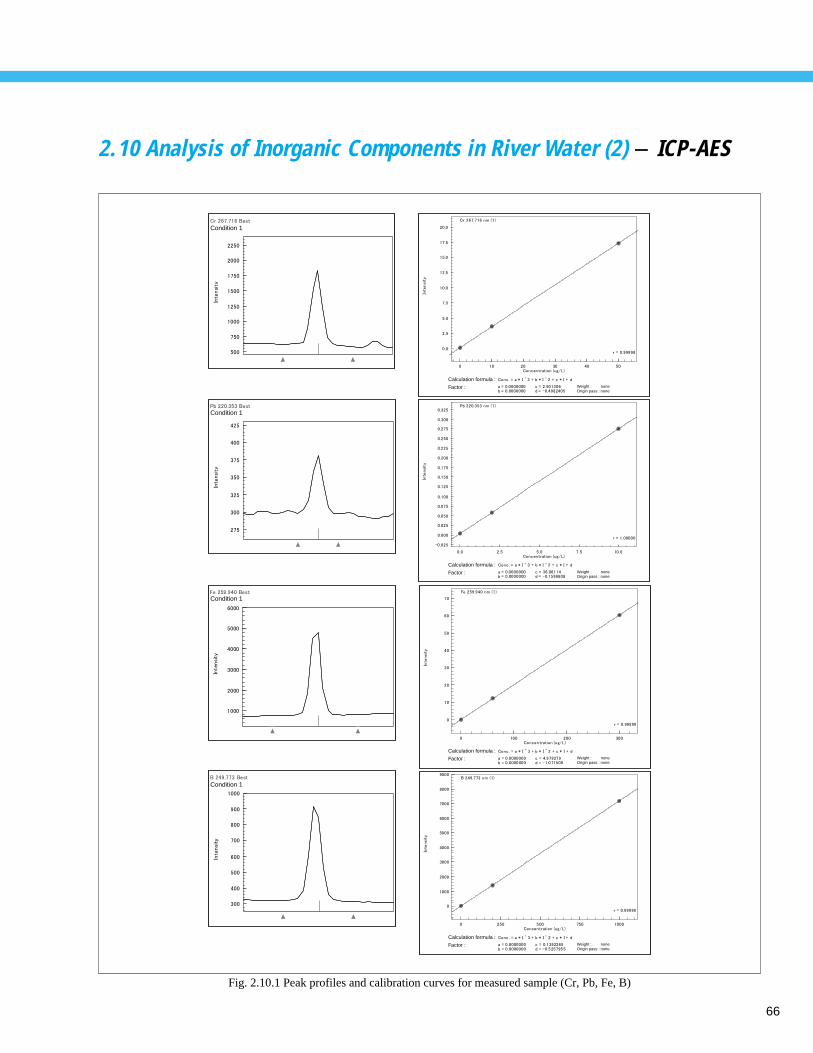
66
Fig. 2.10.1 Peak profiles and calibration curves for measured sample (Cr, Pb, Fe, B)
2.10 Analysis of Inorganic Components in River Water (2) - ICP-AES
Condition 1
Condition 1
Condition 1
Condition 1
Calculation formula :
Factor : Weight : noneOrigin pass : none
Calculation formula :
Factor : Weight : noneOrigin pass : none
Calculation formula :
Factor : Weight : noneOrigin pass : none
Calculation formula :
Factor : Weight : noneOrigin pass : none
Environment Water
67
2.11 Analysis of Inorganic Components in River Water- ICP/MS
Table 2.11.1 Quantitation results on river water (units: µg/L)
■ ExplanationRiver water standards supplied by the Japan Society forAnalytical Chemistry were quantified using the calibrationcurve method. Table 2.11.1 shows the quantitation results.The values approximately match the certified values.
■ SamplesJSAC0301-1 and JSAC0302 river water standards suppliedby the Japan Society for Analytical Chemistry
■ Analytical ConditionsInstrumentPlasma Unit RF OutputCoolant Gas Flow Rate (Ar)Plasma Gas Flow Rate (Ar)Carrier Gas Flow Rate (Ar)Sample Introduction UnitNebulizerSample Intake RateChamberPlasma TorchSampling DepthSampling Interface
: ICPM-8500
: 1.2 kW: 7 L/min: 1.5 L/min: 0.6 L/min
: Coaxial Nebulizer: 0.4 mL/min: Cooled Scott Chamber: Three-layered Mini Torch: 4 mm: Copper
Element
* values are mg/L. ( ) indicate reference values.
Quantitationresults
Certified value ± uncertainty
JSAC-0301-1
Quantitationresults
Certified value ± uncertainty
JSAC-0302
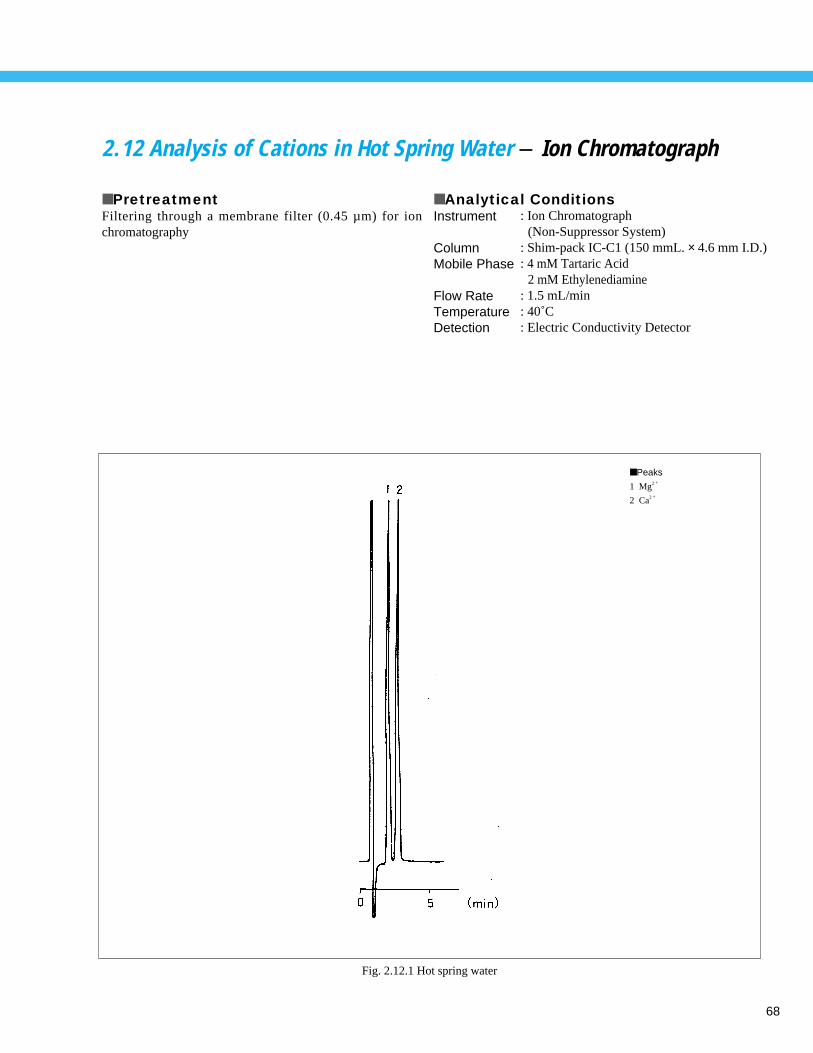
68
2.12 Analysis of Cations in Hot Spring Water- Ion Chromatograph
Fig. 2.12.1 Hot spring water
■ Peaks
1 Mg2 +
2 Ca2 +
■ PretreatmentFiltering through a membrane filter (0.45 µm) for ionchromatography
■ Analytical ConditionsInstrument
ColumnMobile Phase
Flow RateTemperatureDetection
: Ion Chromatograph(Non-Suppressor System)
: Shim-pack IC-C1 (150 mmL. × 4.6 mm I.D.): 4 mM Tartaric Acid
2 mM Ethylenediamine : 1.5 mL/min: 40˚C: Electric Conductivity Detector
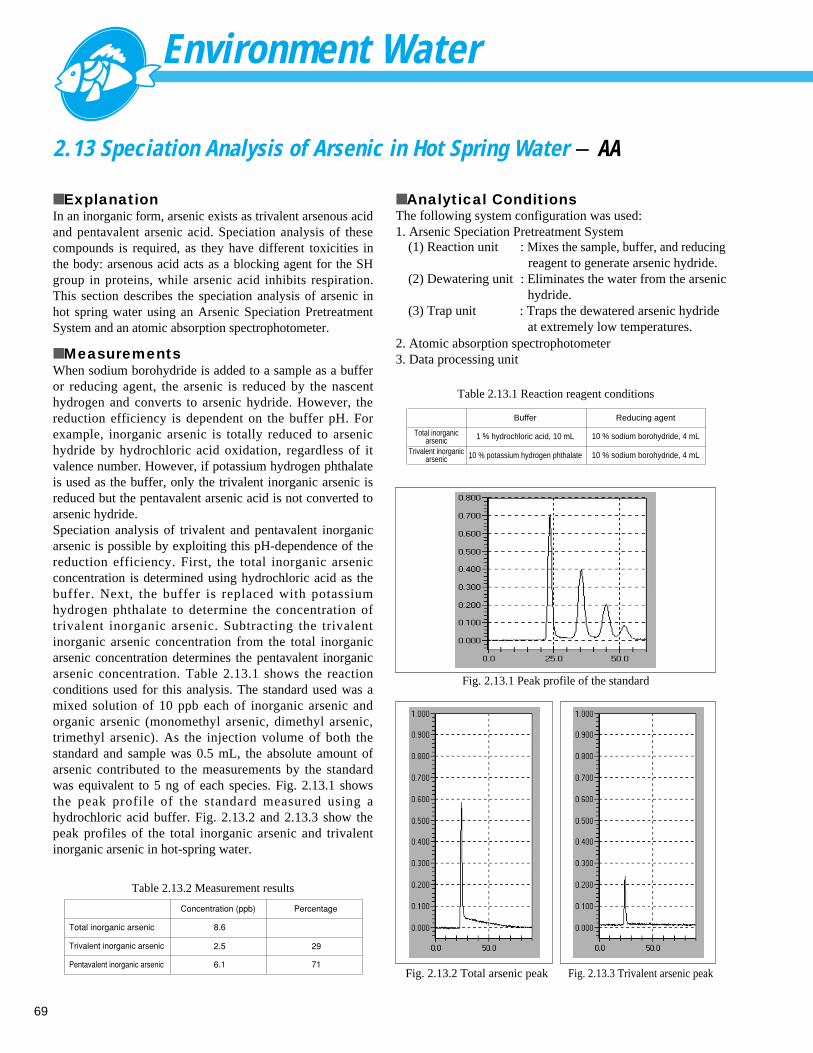
Environment Water
69
2.13 Speciation Analysis of Arsenic in Hot Spring Water - AA
■ ExplanationIn an inorganic form, arsenic exists as trivalent arsenous acidand pentavalent arsenic acid. Speciation analysis of thesecompounds is required, as they have different toxicities inthe body: arsenous acid acts as a blocking agent for the SHgroup in proteins, while arsenic acid inhibits respiration.This section describes the speciation analysis of arsenic inhot spring water using an Arsenic Speciation PretreatmentSystem and an atomic absorption spectrophotometer.
■ MeasurementsWhen sodium borohydride is added to a sample as a bufferor reducing agent, the arsenic is reduced by the nascenthydrogen and converts to arsenic hydride. However, thereduction efficiency is dependent on the buffer pH. Forexample, inorganic arsenic is totally reduced to arsenichydride by hydrochloric acid oxidation, regardless of itvalence number. However, if potassium hydrogen phthalateis used as the buffer, only the trivalent inorganic arsenic isreduced but the pentavalent arsenic acid is not converted toarsenic hydride. Speciation analysis of trivalent and pentavalent inorganicarsenic is possible by exploiting this pH-dependence of thereduction efficiency. First, the total inorganic arsenicconcentration is determined using hydrochloric acid as thebuffer. Next, the buffer is replaced with potassiumhydrogen phthalate to determine the concentration oftrivalent inorganic arsenic. Subtracting the trivalentinorganic arsenic concentration from the total inorganicarsenic concentration determines the pentavalent inorganicarsenic concentration. Table 2.13.1 shows the reactionconditions used for this analysis. The standard used was amixed solution of 10 ppb each of inorganic arsenic andorganic arsenic (monomethyl arsenic, dimethyl arsenic,trimethyl arsenic). As the injection volume of both thestandard and sample was 0.5 mL, the absolute amount ofarsenic contributed to the measurements by the standardwas equivalent to 5 ng of each species. Fig. 2.13.1 showsthe peak profile of the standard measured using ahydrochloric acid buffer. Fig. 2.13.2 and 2.13.3 show thepeak profiles of the total inorganic arsenic and trivalentinorganic arsenic in hot-spring water.
■ Analytical ConditionsThe following system configuration was used:1. Arsenic Speciation Pretreatment System
2. Atomic absorption spectrophotometer3. Data processing unit
(1) Reaction unit
(2) Dewatering unit
(3) Trap unit
: Mixes the sample, buffer, and reducingreagent to generate arsenic hydride.
: Eliminates the water from the arsenichydride.
: Traps the dewatered arsenic hydrideat extremely low temperatures.
Buffer Reducing agent
1 % hydrochloric acid, 10 mL 10 % sodium borohydride, 4 mL
10 % potassium hydrogen phthalate
Total inorganicarsenic
Trivalent inorganicarsenic 10 % sodium borohydride, 4 mL
Table 2.13.2 Measurement results
Table 2.13.1 Reaction reagent conditions
Fig. 2.13.1 Peak profile of the standard
Fig. 2.13.2 Total arsenic peak Fig. 2.13.3 Trivalent arsenic peak
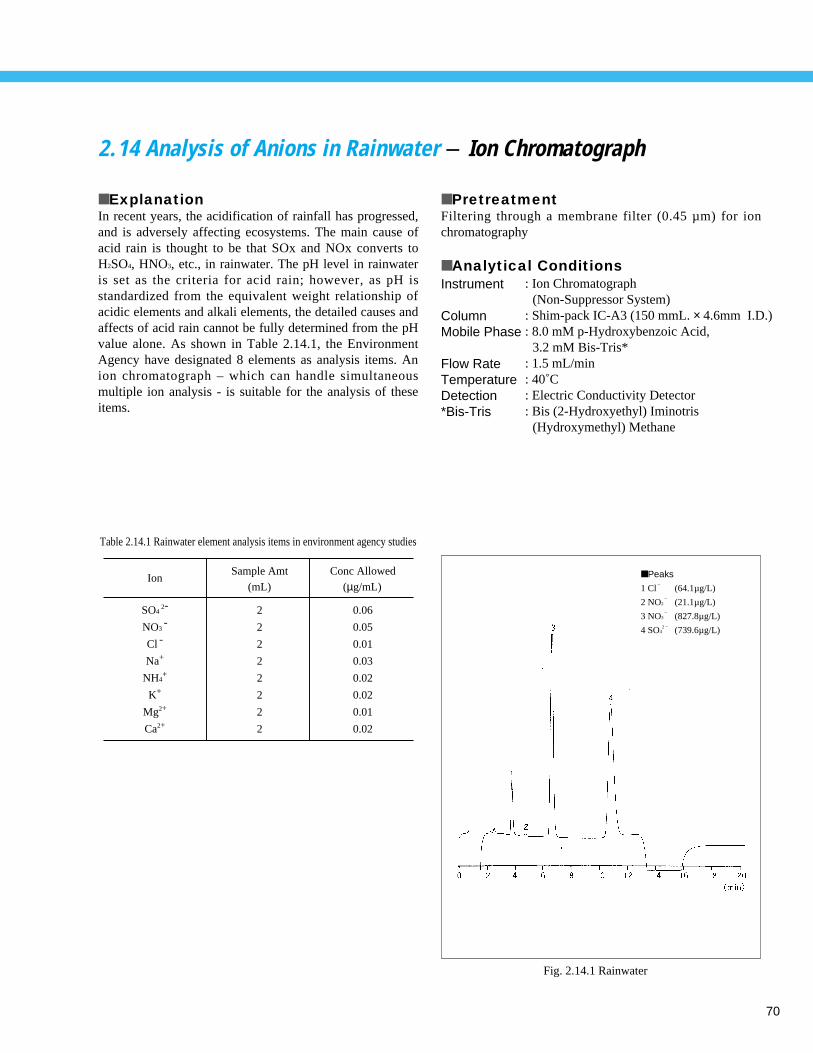
70
2.14 Analysis of Anions in Rainwater - Ion Chromatograph
■ ExplanationIn recent years, the acidification of rainfall has progressed,and is adversely affecting ecosystems. The main cause ofacid rain is thought to be that SOx and NOx converts toH2SO4, HNO3, etc., in rainwater. The pH level in rainwateris set as the criteria for acid rain; however, as pH isstandardized from the equivalent weight relationship ofacidic elements and alkali elements, the detailed causes andaffects of acid rain cannot be fully determined from the pHvalue alone. As shown in Table 2.14.1, the EnvironmentAgency have designated 8 elements as analysis items. Anion chromatograph – which can handle simultaneousmultiple ion analysis - is suitable for the analysis of theseitems.
Fig. 2.14.1 Rainwater
■ Peaks
1 Cl–
(64.1µg/L)
2 NO2–
(21.1µg/L)
3 NO3–
(827.8µg/L)
4 SO42 – (739.6µg/L)
■ PretreatmentFiltering through a membrane filter (0.45 µm) for ionchromatography
■ Analytical ConditionsInstrument
ColumnMobile Phase
Flow RateTemperatureDetection*Bis-Tris
: Ion Chromatograph(Non-Suppressor System)
: Shim-pack IC-A3 (150 mmL. × 4.6mm I.D.): 8.0 mM p-Hydroxybenzoic Acid,
3.2 mM Bis-Tris*: 1.5 mL/min: 40˚C: Electric Conductivity Detector: Bis (2-Hydroxyethyl) Iminotris
(Hydroxymethyl) Methane
Table 2.14.1 Rainwater element analysis items in environment agency studies
Ion
SO4 2-
NO3 -
Cl -
Na+
NH4+
K+
Mg2+
Ca2+
Sample Amt
2
2
2
2
2
2
2
2
Conc Allowed
0.06
0.05
0.01
0.03
0.02
0.02
0.01
0.02
(mL) (µg/mL)
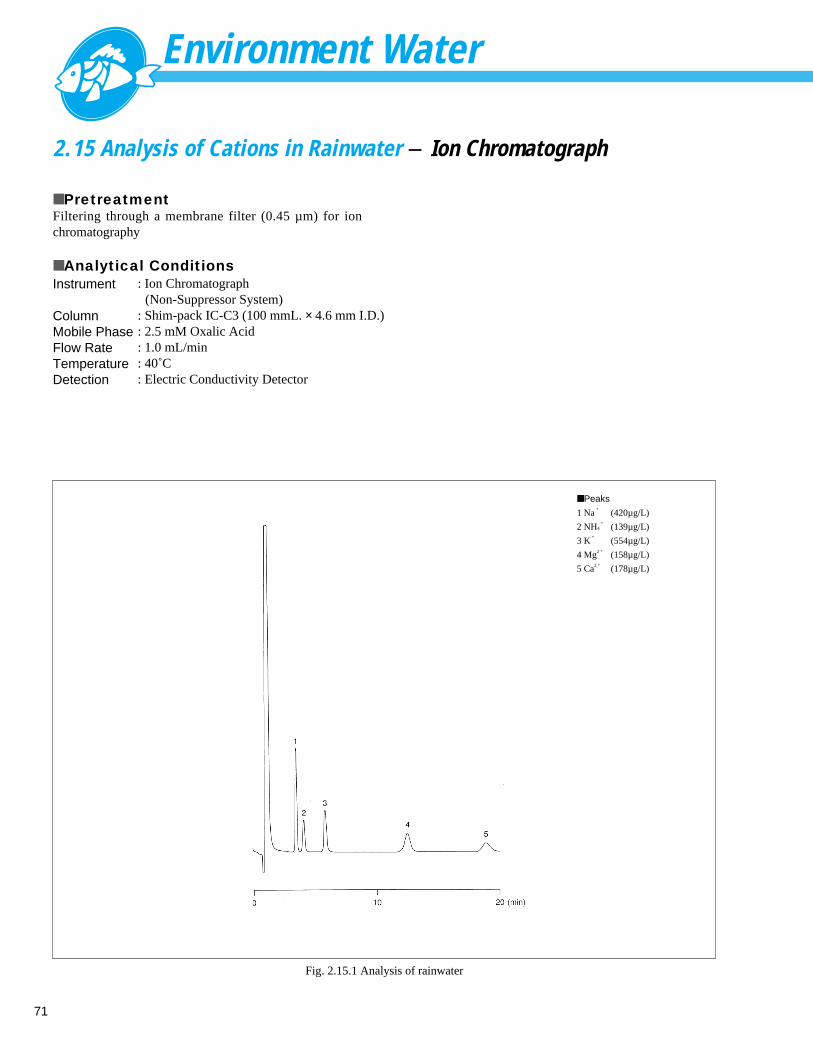
Environment Water
71
2.15 Analysis of Cations in Rainwater - Ion Chromatograph
Fig. 2.15.1 Analysis of rainwater
■ Peaks
1 Na+
(420µg/L)
2 NH4+
(139µg/L)
3 K+
(554µg/L)
4 Mg2 + (158µg/L)
5 Ca2 + (178µg/L)
■ PretreatmentFiltering through a membrane filter (0.45 µm) for ionchromatography
■ Analytical ConditionsInstrument
ColumnMobile PhaseFlow RateTemperatureDetection
: Ion Chromatograph(Non-Suppressor System)
: Shim-pack IC-C3 (100 mmL. × 4.6 mm I.D.): 2.5 mM Oxalic Acid: 1.0 mL/min: 40˚C: Electric Conductivity Detector
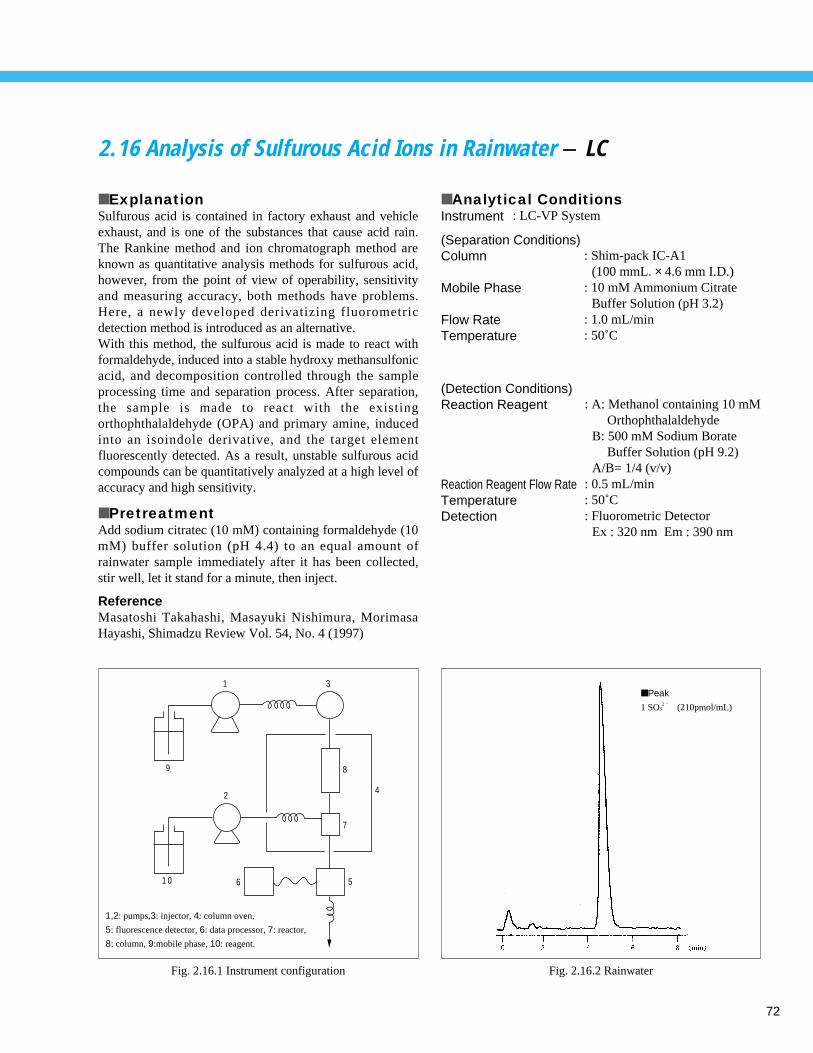
72
2.16 Analysis of Sulfurous Acid Ions in Rainwater - LC
■ ExplanationSulfurous acid is contained in factory exhaust and vehicleexhaust, and is one of the substances that cause acid rain.The Rankine method and ion chromatograph method areknown as quantitative analysis methods for sulfurous acid,however, from the point of view of operability, sensitivityand measuring accuracy, both methods have problems.Here, a newly developed derivatizing fluorometricdetection method is introduced as an alternative.With this method, the sulfurous acid is made to react withformaldehyde, induced into a stable hydroxy methansulfonicacid, and decomposition controlled through the sampleprocessing time and separation process. After separation,the sample is made to react with the existingorthophthalaldehyde (OPA) and primary amine, inducedinto an isoindole derivative, and the target elementfluorescently detected. As a result, unstable sulfurous acidcompounds can be quantitatively analyzed at a high level ofaccuracy and high sensitivity.
■ PretreatmentAdd sodium citratec (10 mM) containing formaldehyde (10mM) buffer solution (pH 4.4) to an equal amount ofrainwater sample immediately after it has been collected,stir well, let it stand for a minute, then inject.
ReferenceMasatoshi Takahashi, Masayuki Nishimura, MorimasaHayashi, Shimadzu Review Vol. 54, No. 4 (1997)
Fig. 2.16.2 Rainwater
■ Peak
1 SO32 – (210pmol/mL)
1
9
3
2
8
4
7
561 0
Fig. 2.16.1 Instrument configuration
■ Analytical ConditionsInstrument
(Separation Conditions)Column
Mobile Phase
Flow RateTemperature
(Detection Conditions)Reaction Reagent
Reaction Reagent Flow RateTemperatureDetection
: A: Methanol containing 10 mM Orthophthalaldehyde
B: 500 mM Sodium Borate Buffer Solution (pH 9.2)
A/B= 1/4 (v/v): 0.5 mL/min: 50˚C: Fluorometric Detector
Ex : 320 nm Em : 390 nm
: LC-VP System
1,2: pumps,3: injector, 4: column oven,
5: fluorescence detector, 6: data processor, 7: reactor,
8: column, 9:mobile phase, 10: reagent.
: Shim-pack IC-A1(100 mmL. × 4.6 mm I.D.)
: 10 mM Ammonium CitrateBuffer Solution (pH 3.2)
: 1.0 mL/min: 50˚C
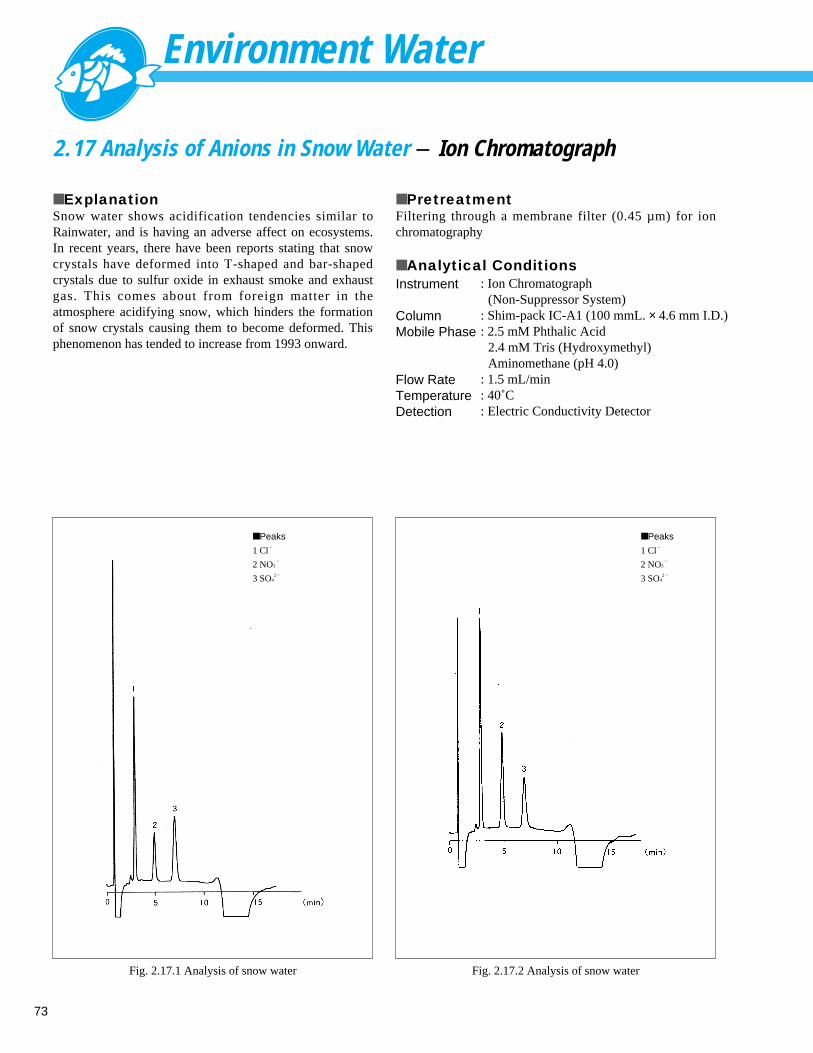
Environment Water
73
2.17 Analysis of Anions in Snow Water - Ion Chromatograph
■ ExplanationSnow water shows acidification tendencies similar toRainwater, and is having an adverse affect on ecosystems.In recent years, there have been reports stating that snowcrystals have deformed into T-shaped and bar-shapedcrystals due to sulfur oxide in exhaust smoke and exhaustgas. This comes about from foreign matter in theatmosphere acidifying snow, which hinders the formationof snow crystals causing them to become deformed. Thisphenomenon has tended to increase from 1993 onward.
Fig. 2.17.2 Analysis of snow water
■ Peaks
1 Cl–
2 NO3–
3 SO42 –
Fig. 2.17.1 Analysis of snow water
■ Peaks
1 Cl–
2 NO3–
3 SO42 –
■ PretreatmentFiltering through a membrane filter (0.45 µm) for ionchromatography
■ Analytical ConditionsInstrument
ColumnMobile Phase
Flow RateTemperatureDetection
: Ion Chromatograph(Non-Suppressor System)
: Shim-pack IC-A1 (100 mmL. × 4.6 mm I.D.): 2.5 mM Phthalic Acid
2.4 mM Tris (Hydroxymethyl)Aminomethane (pH 4.0)
: 1.5 mL/min: 40˚C: Electric Conductivity Detector
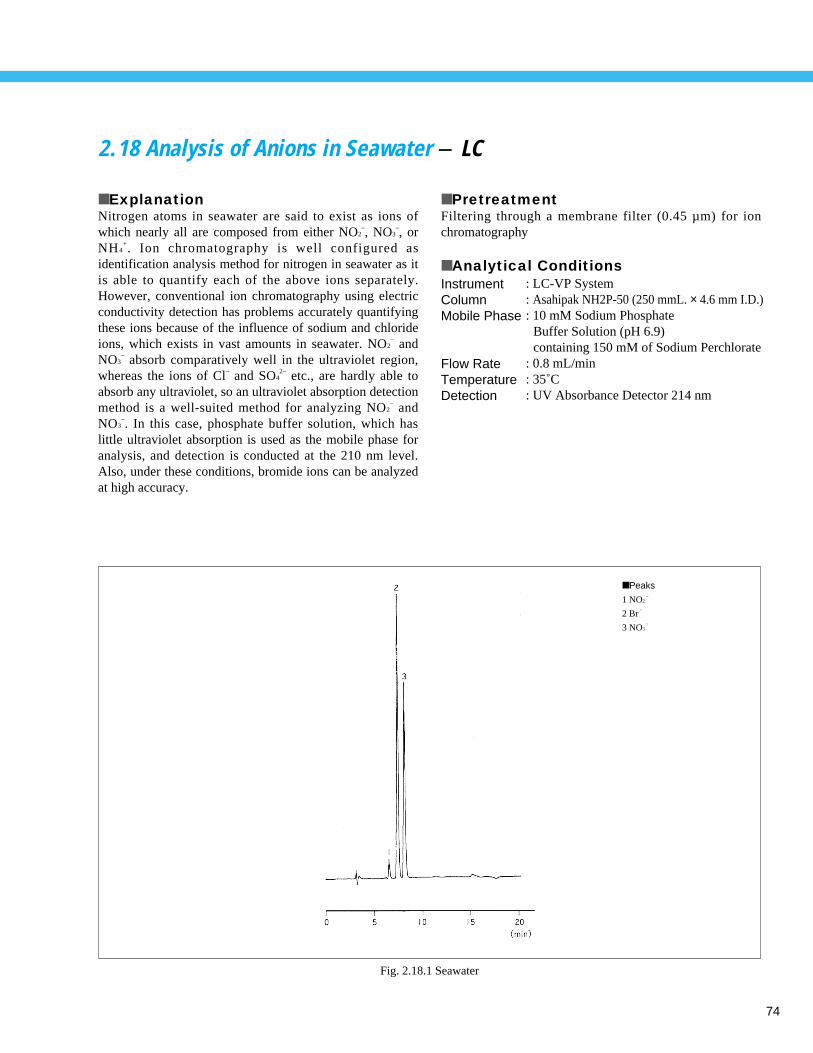
74
2.18 Analysis of Anions in Seawater - LC
■ ExplanationNitrogen atoms in seawater are said to exist as ions ofwhich nearly all are composed from either NO2
–, NO3–, or
NH4+. Ion chromatography is well configured as
identification analysis method for nitrogen in seawater as itis able to quantify each of the above ions separately.However, conventional ion chromatography using electricconductivity detection has problems accurately quantifyingthese ions because of the influence of sodium and chlorideions, which exists in vast amounts in seawater. NO2
– andNO3
– absorb comparatively well in the ultraviolet region,whereas the ions of Cl– and SO4
2– etc., are hardly able toabsorb any ultraviolet, so an ultraviolet absorption detectionmethod is a well-suited method for analyzing NO2
– andNO3
–. In this case, phosphate buffer solution, which haslittle ultraviolet absorption is used as the mobile phase foranalysis, and detection is conducted at the 210 nm level.Also, under these conditions, bromide ions can be analyzedat high accuracy.
Fig. 2.18.1 Seawater
■ Peaks
1 NO2–
2 Br–
3 NO3–
■ PretreatmentFiltering through a membrane filter (0.45 µm) for ionchromatography
■ Analytical ConditionsInstrumentColumnMobile Phase
Flow RateTemperatureDetection
: LC-VP System: Asahipak NH2P-50 (250 mmL. × 4.6 mm I.D.): 10 mM Sodium Phosphate
Buffer Solution (pH 6.9) containing 150 mM of Sodium Perchlorate
: 0.8 mL/min: 35˚C: UV Absorbance Detector 214 nm
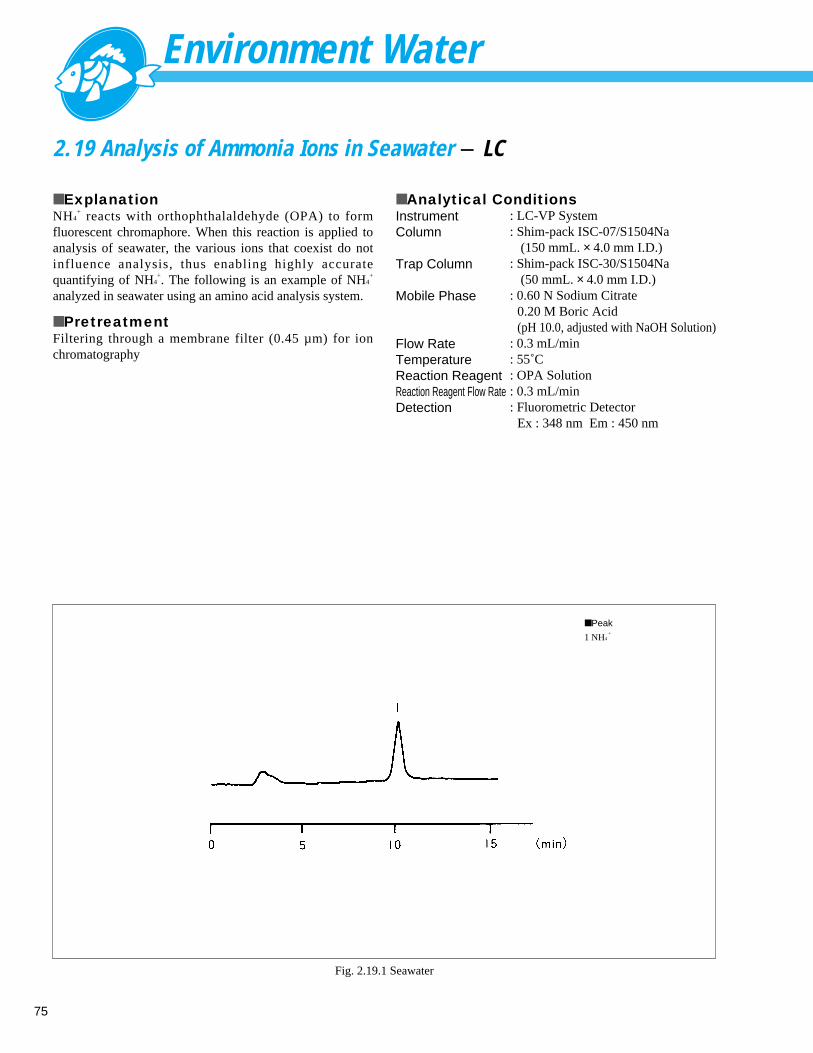
Environment Water
75
2.19 Analysis of Ammonia Ions in Seawater - LC
■ ExplanationNH4
+ reacts with orthophthalaldehyde (OPA) to formfluorescent chromaphore. When this reaction is applied toanalysis of seawater, the various ions that coexist do notinfluence analysis, thus enabling highly accuratequantifying of NH4
+. The following is an example of NH4+
analyzed in seawater using an amino acid analysis system.
■ PretreatmentFiltering through a membrane filter (0.45 µm) for ionchromatography
Fig. 2.19.1 Seawater
■ Peak
1 NH4+
■ Analytical ConditionsInstrumentColumn
Trap Column
Mobile Phase
Flow RateTemperatureReaction ReagentReaction Reagent Flow RateDetection
: LC-VP System: Shim-pack ISC-07/S1504Na
(150 mmL. × 4.0 mm I.D.): Shim-pack ISC-30/S1504Na
(50 mmL. × 4.0 mm I.D.): 0.60 N Sodium Citrate
0.20 M Boric Acid (pH 10.0, adjusted with NaOH Solution)
: 0.3 mL/min: 55˚C: OPA Solution: 0.3 mL/min: Fluorometric Detector
Ex : 348 nm Em : 450 nm
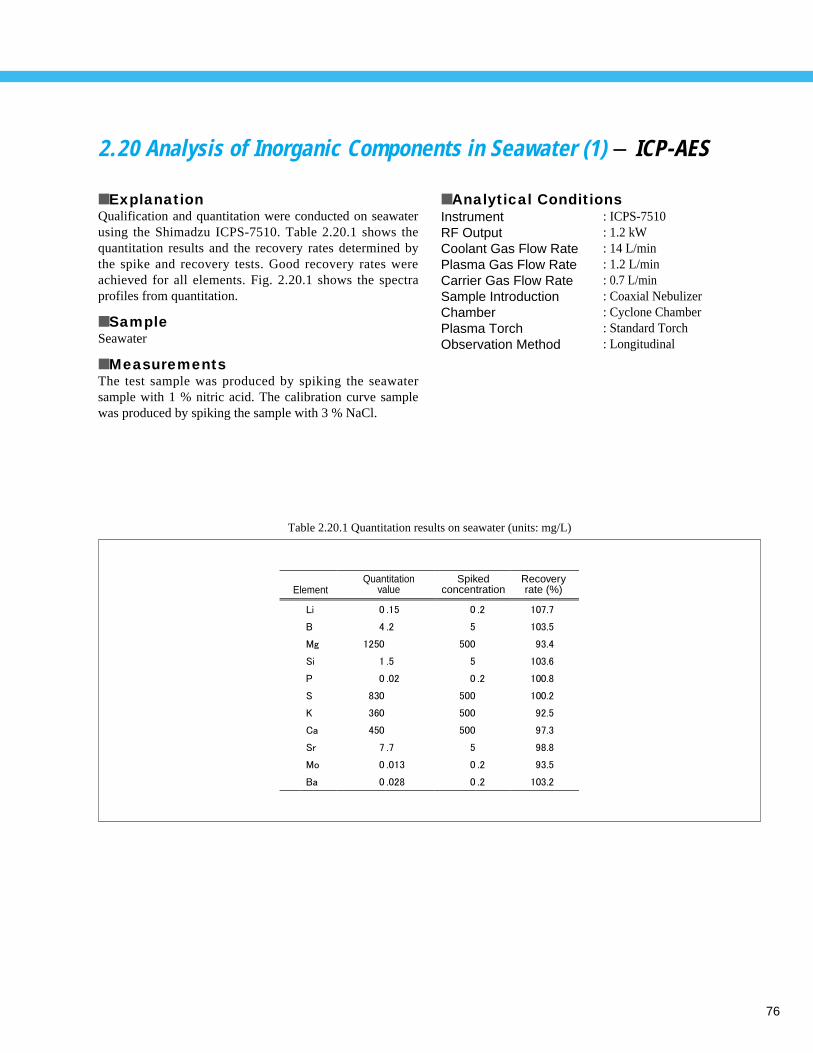
76
2.20 Analysis of Inorganic Components in Seawater (1) - ICP-AES
■ ExplanationQualification and quantitation were conducted on seawaterusing the Shimadzu ICPS-7510. Table 2.20.1 shows thequantitation results and the recovery rates determined bythe spike and recovery tests. Good recovery rates wereachieved for all elements. Fig. 2.20.1 shows the spectraprofiles from quantitation.
■ SampleSeawater
■ MeasurementsThe test sample was produced by spiking the seawatersample with 1 % nitric acid. The calibration curve samplewas produced by spiking the sample with 3 % NaCl.
InstrumentRF OutputCoolant Gas Flow Rate Plasma Gas Flow RateCarrier Gas Flow RateSample Introduction ChamberPlasma TorchObservation Method
: ICPS-7510: 1.2 kW: 14 L/min: 1.2 L/min: 0.7 L/min: Coaxial Nebulizer: Cyclone Chamber: Standard Torch: Longitudinal
Element Quantitation
valueSpiked
concentrationRecoveryrate (%)
Table 2.20.1 Quantitation results on seawater (units: mg/L)
■ Analytical Conditions
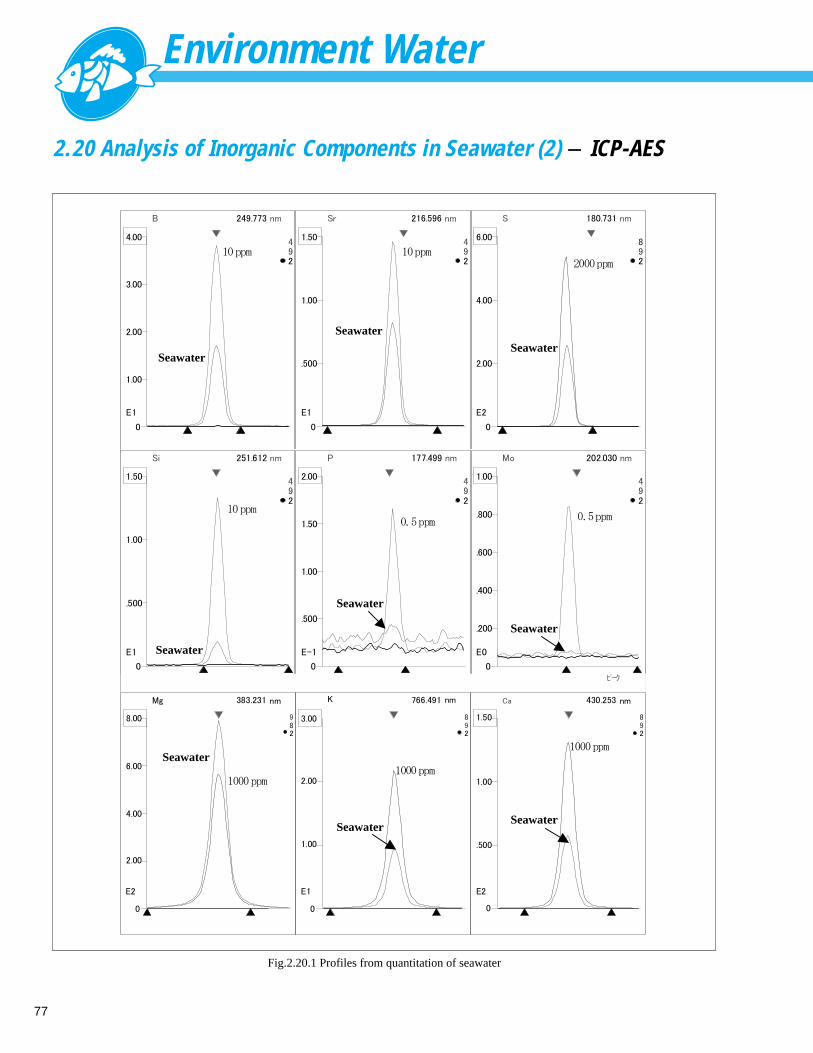
Environment Water
77
Seawater
SeawaterSeawater
Seawater
Seawater
Seawater
Seawater
Seawater
Seawater
2.20 Analysis of Inorganic Components in Seawater (2) - ICP-AES
Fig.2.20.1 Profiles from quantitation of seawater
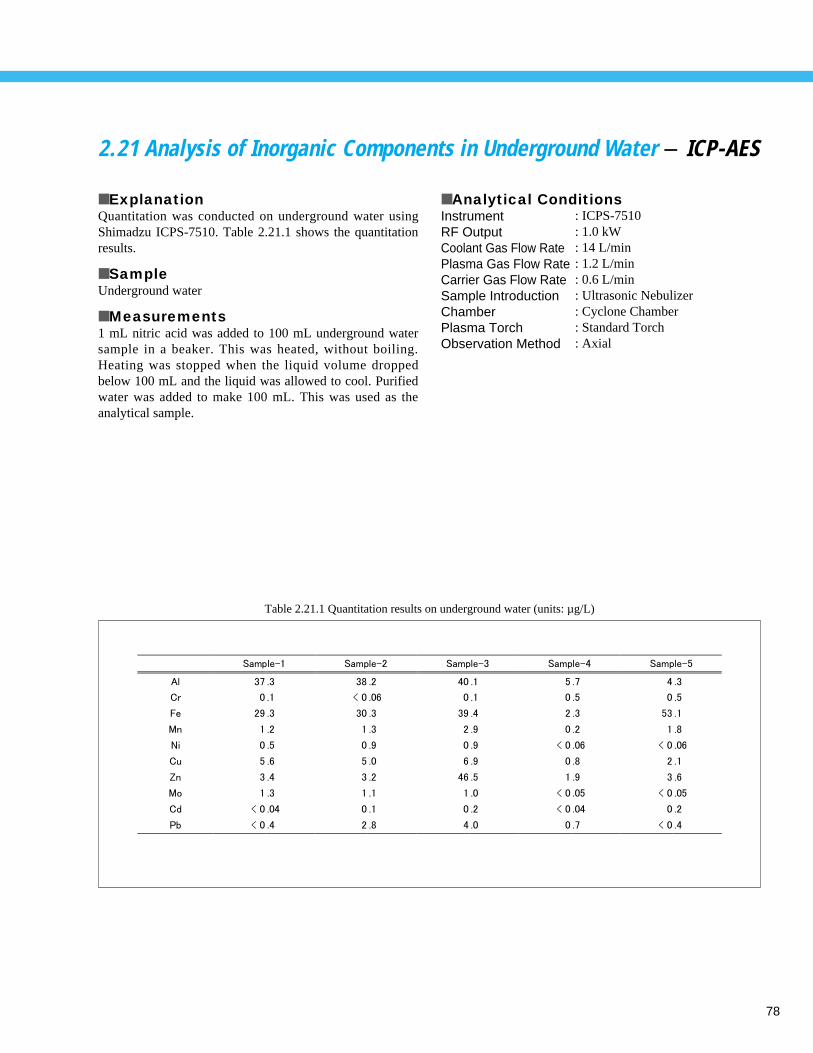
78
2.21 Analysis of Inorganic Components in Underground Water - ICP-AES
■ ExplanationQuantitation was conducted on underground water usingShimadzu ICPS-7510. Table 2.21.1 shows the quantitationresults.
■ SampleUnderground water
■ Measurements1 mL nitric acid was added to 100 mL underground watersample in a beaker. This was heated, without boiling.Heating was stopped when the liquid volume droppedbelow 100 mL and the liquid was allowed to cool. Purifiedwater was added to make 100 mL. This was used as theanalytical sample.
Table 2.21.1 Quantitation results on underground water (units: µg/L)
■ Analytical ConditionsInstrumentRF OutputCoolant Gas Flow RatePlasma Gas Flow RateCarrier Gas Flow RateSample Introduction ChamberPlasma TorchObservation Method
: ICPS-7510: 1.0 kW: 14 L/min: 1.2 L/min: 0.6 L/min: Ultrasonic Nebulizer: Cyclone Chamber: Standard Torch: Axial
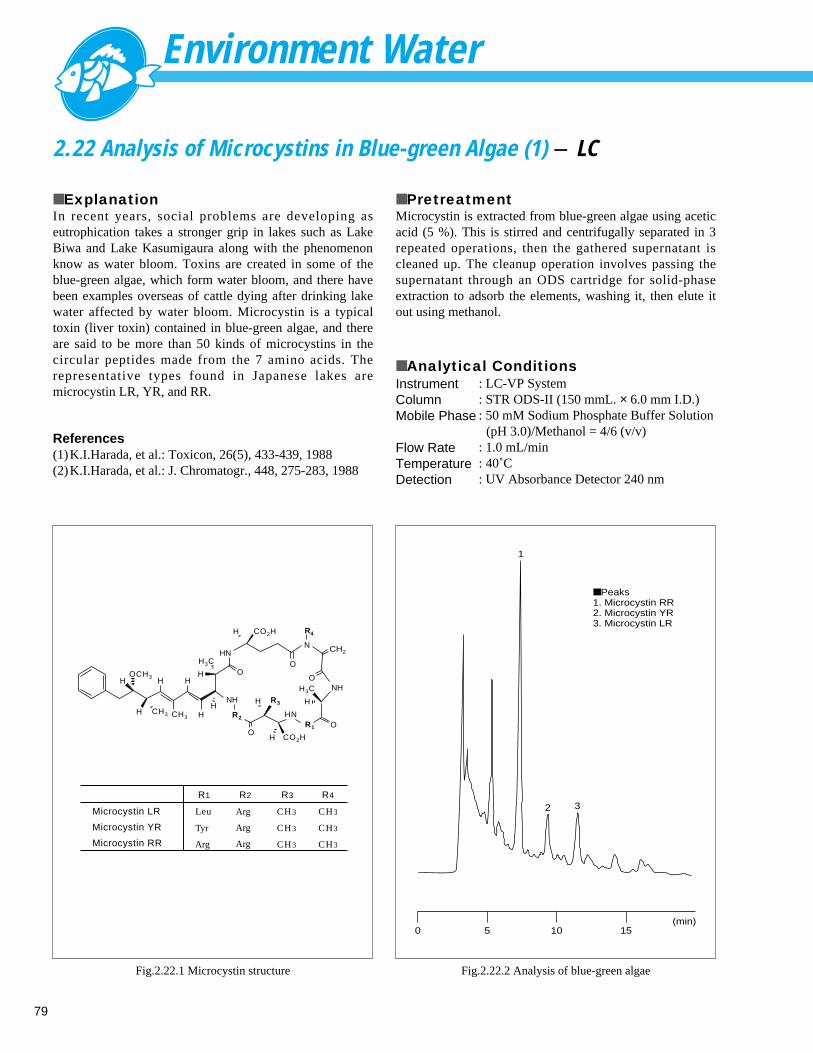
Environment Water
79
2.22 Analysis of Microcystins in Blue-green Algae (1) - LC
■ ExplanationIn recent years, social problems are developing aseutrophication takes a stronger grip in lakes such as LakeBiwa and Lake Kasumigaura along with the phenomenonknow as water bloom. Toxins are created in some of theblue-green algae, which form water bloom, and there havebeen examples overseas of cattle dying after drinking lakewater affected by water bloom. Microcystin is a typicaltoxin (liver toxin) contained in blue-green algae, and thereare said to be more than 50 kinds of microcystins in thecircular peptides made from the 7 amino acids. Therepresentative types found in Japanese lakes aremicrocystin LR, YR, and RR.
References(1)K.I.Harada, et al.: Toxicon, 26(5), 433-439, 1988(2)K.I.Harada, et al.: J. Chromatogr., 448, 275-283, 1988
■ PretreatmentMicrocystin is extracted from blue-green algae using aceticacid (5 %). This is stirred and centrifugally separated in 3repeated operations, then the gathered supernatant iscleaned up. The cleanup operation involves passing thesupernatant through an ODS cartridge for solid-phaseextraction to adsorb the elements, washing it, then elute itout using methanol.
H H HH
H
O
O
O
O
O
N
R4
CH2HN
NH
H
HH
H
H
NH
H
OCH3
H3C
H3CR3
R2R1
CO2H
CO2H
CH3 CH3 HN
Microcystin LR
R4R1 R2 R3
Microcystin YR
Microcystin RR
Leu
Tyr
Arg Arg
Arg
Arg CH3
CH3
CH3
CH3
CH3
CH3
Fig.2.22.1 Microcystin structure
■ Analytical ConditionsInstrumentColumnMobile Phase
Flow RateTemperatureDetection
: LC-VP System: STR ODS-II (150 mmL. × 6.0 mm I.D.): 50 mM Sodium Phosphate Buffer Solution
(pH 3.0)/Methanol = 4/6 (v/v): 1.0 mL/min: 40˚C: UV Absorbance Detector 240 nm
■ Peaks1. Microcystin RR2. Microcystin YR3. Microcystin LR
1
2 3
0 5 10 15(min)
Fig.2.22.2 Analysis of blue-green algae
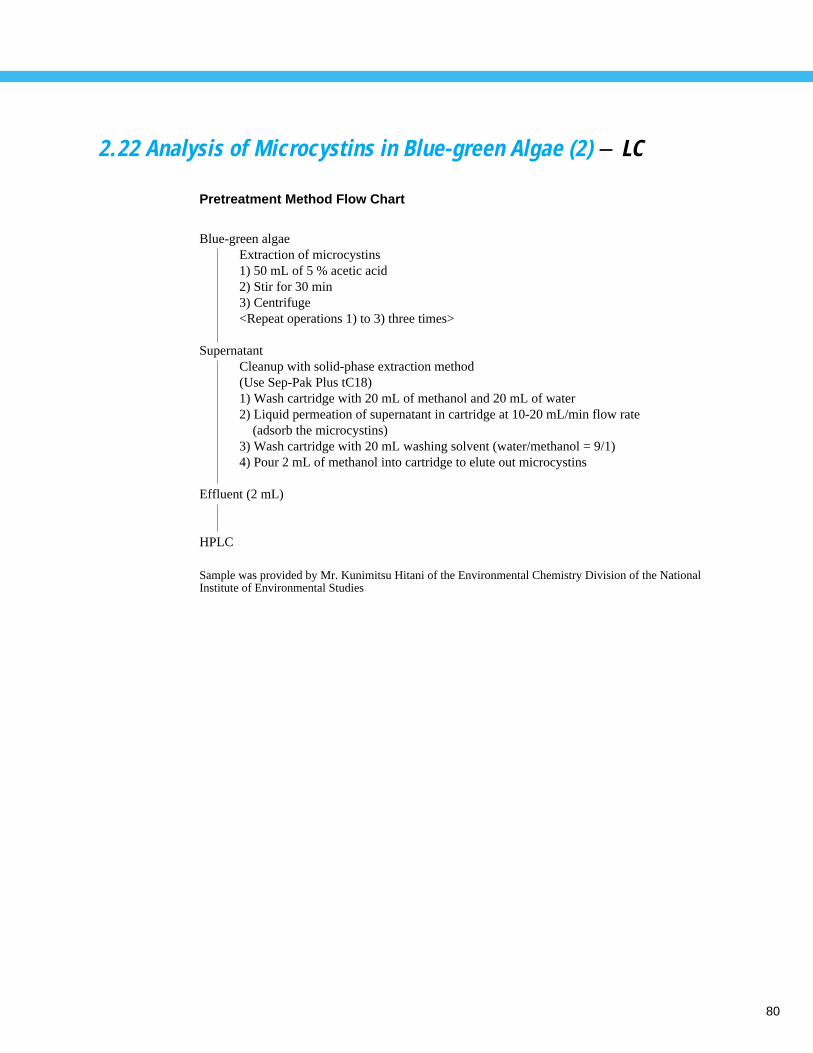
80
2.22 Analysis of Microcystins in Blue-green Algae (2) - LC
Pretreatment Method Flow Chart
Blue-green algaeExtraction of microcystins1) 50 mL of 5 % acetic acid 2) Stir for 30 min3) Centrifuge<Repeat operations 1) to 3) three times>
SupernatantCleanup with solid-phase extraction method(Use Sep-Pak Plus tC18)1) Wash cartridge with 20 mL of methanol and 20 mL of water2) Liquid permeation of supernatant in cartridge at 10-20 mL/min flow rate
(adsorb the microcystins)3) Wash cartridge with 20 mL washing solvent (water/methanol = 9/1)4) Pour 2 mL of methanol into cartridge to elute out microcystins
Effluent (2 mL)
HPLC
Sample was provided by Mr. Kunimitsu Hitani of the Environmental Chemistry Division of the National Institute of Environmental Studies
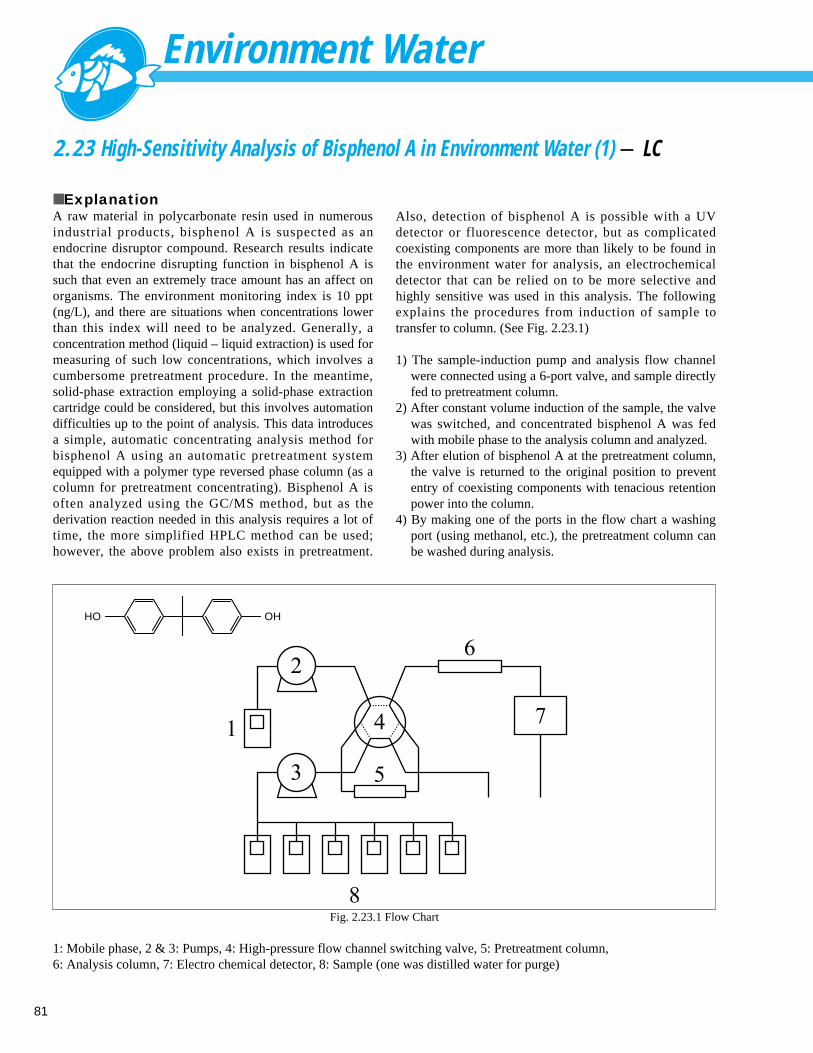
Environment Water
81
2.23 High-Sensitivity Analysis of Bisphenol A in Environment Water (1) - LC
■ ExplanationA raw material in polycarbonate resin used in numerousindustrial products, bisphenol A is suspected as anendocrine disruptor compound. Research results indicatethat the endocrine disrupting function in bisphenol A issuch that even an extremely trace amount has an affect onorganisms. The environment monitoring index is 10 ppt(ng/L), and there are situations when concentrations lowerthan this index will need to be analyzed. Generally, aconcentration method (liquid – liquid extraction) is used formeasuring of such low concentrations, which involves acumbersome pretreatment procedure. In the meantime,solid-phase extraction employing a solid-phase extractioncartridge could be considered, but this involves automationdifficulties up to the point of analysis. This data introducesa simple, automatic concentrating analysis method forbisphenol A using an automatic pretreatment systemequipped with a polymer type reversed phase column (as acolumn for pretreatment concentrating). Bisphenol A isoften analyzed using the GC/MS method, but as thederivation reaction needed in this analysis requires a lot oftime, the more simplified HPLC method can be used;however, the above problem also exists in pretreatment.
Also, detection of bisphenol A is possible with a UVdetector or fluorescence detector, but as complicatedcoexisting components are more than likely to be found inthe environment water for analysis, an electrochemicaldetector that can be relied on to be more selective andhighly sensitive was used in this analysis. The followingexplains the procedures from induction of sample totransfer to column. (See Fig. 2.23.1)
1) The sample-induction pump and analysis flow channelwere connected using a 6-port valve, and sample directlyfed to pretreatment column.
2) After constant volume induction of the sample, the valvewas switched, and concentrated bisphenol A was fedwith mobile phase to the analysis column and analyzed.
3) After elution of bisphenol A at the pretreatment column,the valve is returned to the original position to prevententry of coexisting components with tenacious retentionpower into the column.
4) By making one of the ports in the flow chart a washingport (using methanol, etc.), the pretreatment column canbe washed during analysis.
1
2
3
4
5
6
7
8
HO OH
Fig. 2.23.1 Flow Chart
1: Mobile phase, 2 & 3: Pumps, 4: High-pressure flow channel switching valve, 5: Pretreatment column, 6: Analysis column, 7: Electro chemical detector, 8: Sample (one was distilled water for purge)
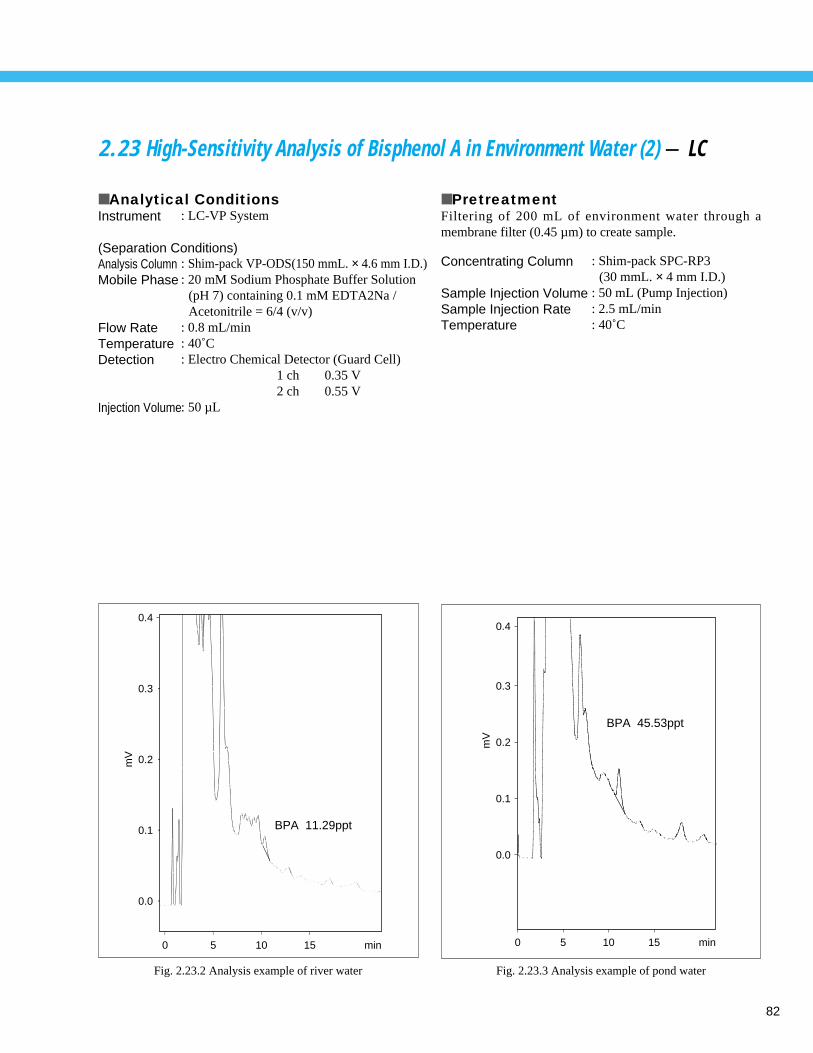
82
2.23 High-Sensitivity Analysis of Bisphenol A in Environment Water (2) - LC
■ Analytical Conditions ■ PretreatmentFiltering of 200 mL of environment water through amembrane filter (0.45 µm) to create sample.
Instrument
(Separation Conditions)Analysis ColumnMobile Phase
Flow RateTemperatureDetection
Injection Volume
: LC-VP System
: Shim-pack VP-ODS(150 mmL. × 4.6 mm I.D.): 20 mM Sodium Phosphate Buffer Solution
(pH 7) containing 0.1 mM EDTA2Na /Acetonitrile = 6/4 (v/v)
: 0.8 mL/min: 40˚C: Electro Chemical Detector (Guard Cell)
1 ch 0.35 V2 ch 0.55 V
: 50 µL
Concentrating Column
Sample Injection VolumeSample Injection RateTemperature
: Shim-pack SPC-RP3(30 mmL. × 4 mm I.D.)
: 50 mL (Pump Injection): 2.5 mL/min: 40˚C
mV
0.4
0.3
0.2
0.1
0.0
15 min1050
BPA 45.53ppt
Fig. 2.23.3 Analysis example of pond waterFig. 2.23.2 Analysis example of river water
mV
0.4
0.3
0.2
0.1
0.0
0 5 10 15 min
BPA 11.29ppt
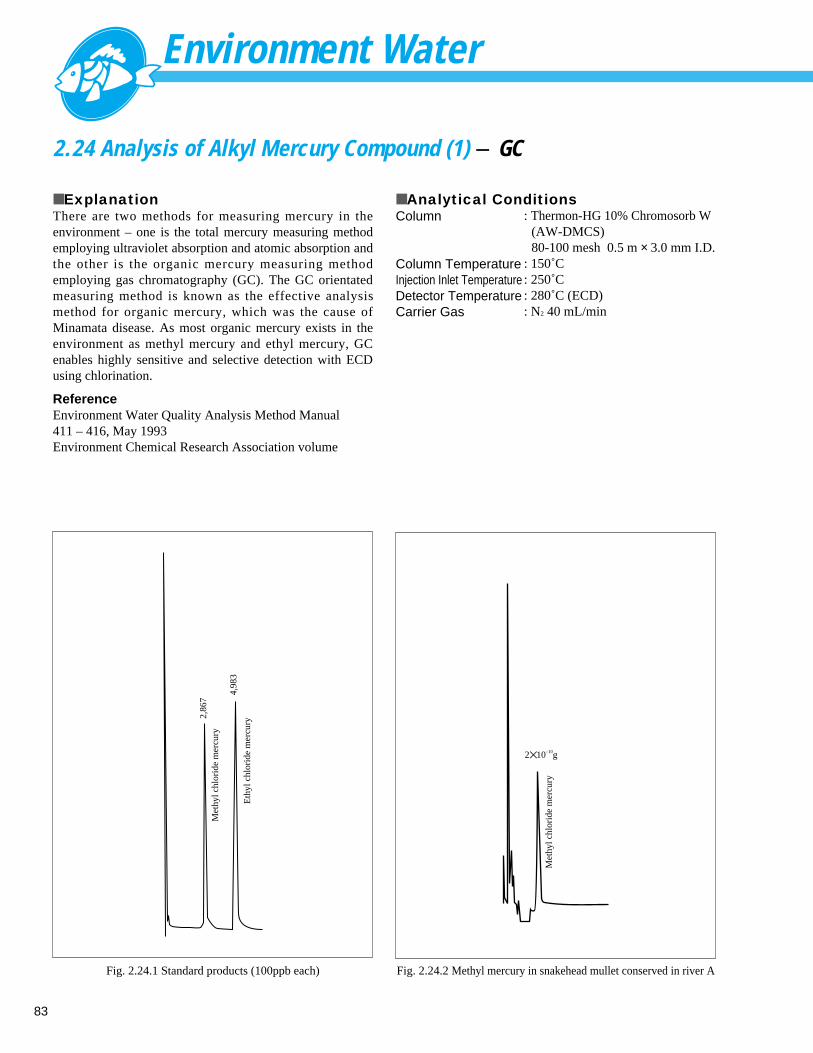
Environment Water
83
2.24 Analysis of Alkyl Mercury Compound (1) - GC
■ ExplanationThere are two methods for measuring mercury in theenvironment – one is the total mercury measuring methodemploying ultraviolet absorption and atomic absorption andthe other is the organic mercury measuring methodemploying gas chromatography (GC). The GC orientatedmeasuring method is known as the effective analysismethod for organic mercury, which was the cause ofMinamata disease. As most organic mercury exists in theenvironment as methyl mercury and ethyl mercury, GCenables highly sensitive and selective detection with ECDusing chlorination.
ReferenceEnvironment Water Quality Analysis Method Manual 411 – 416, May 1993Environment Chemical Research Association volume
Fig. 2.24.2 Methyl mercury in snakehead mullet conserved in river AFig. 2.24.1 Standard products (100ppb each)
■ Analytical ConditionsColumn
Column TemperatureInjection Inlet TemperatureDetector TemperatureCarrier Gas
: Thermon-HG 10% Chromosorb W(AW-DMCS)80-100 mesh 0.5 m × 3.0 mm I.D.
: 150˚C: 250˚C: 280˚C (ECD): N2 40 mL/min
4,98
3
Eth
ylch
lori
dem
ercu
ry
Met
hylc
hlor
ide
mer
cury
2,86
7
2✕ 10–10g
Met
hylc
hlor
ide
mer
cury
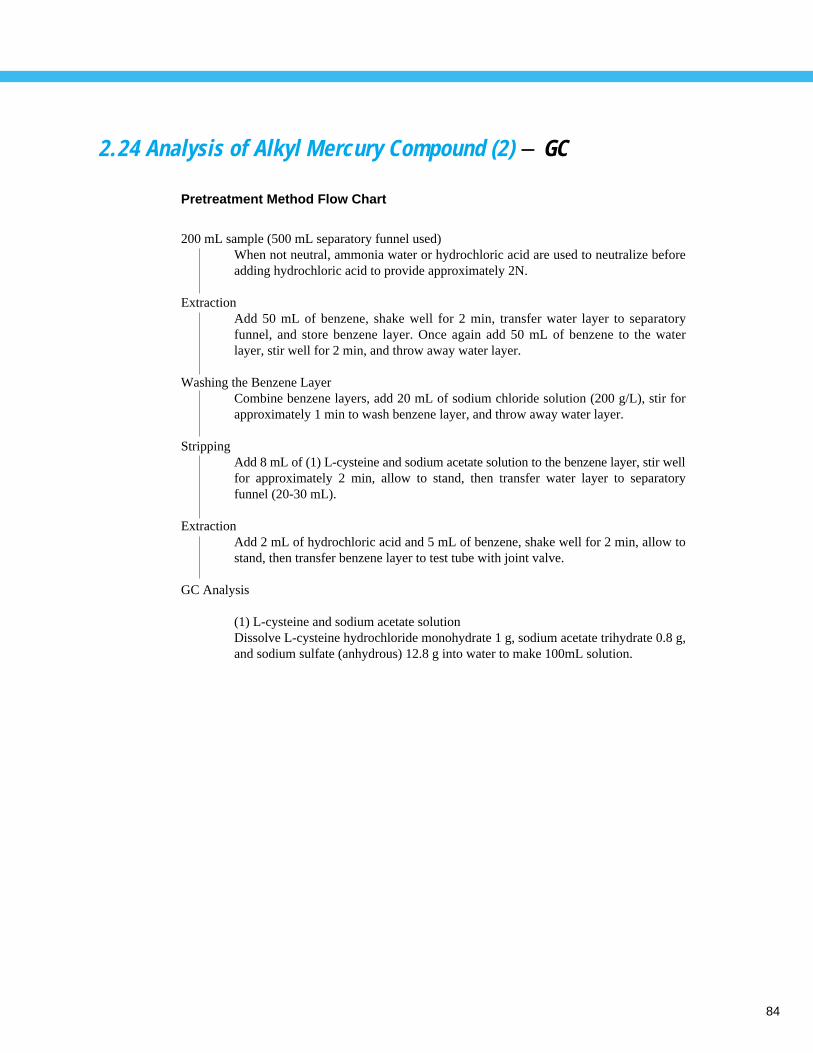
84
2.24 Analysis of Alkyl Mercury Compound (2) - GC
Pretreatment Method Flow Chart
200 mL sample (500 mL separatory funnel used)When not neutral, ammonia water or hydrochloric acid are used to neutralize beforeadding hydrochloric acid to provide approximately 2N.
ExtractionAdd 50 mL of benzene, shake well for 2 min, transfer water layer to separatoryfunnel, and store benzene layer. Once again add 50 mL of benzene to the waterlayer, stir well for 2 min, and throw away water layer.
Washing the Benzene LayerCombine benzene layers, add 20 mL of sodium chloride solution (200 g/L), stir forapproximately 1 min to wash benzene layer, and throw away water layer.
StrippingAdd 8 mL of (1) L-cysteine and sodium acetate solution to the benzene layer, stir wellfor approximately 2 min, allow to stand, then transfer water layer to separatoryfunnel (20-30 mL).
ExtractionAdd 2 mL of hydrochloric acid and 5 mL of benzene, shake well for 2 min, allow tostand, then transfer benzene layer to test tube with joint valve.
GC Analysis
(1) L-cysteine and sodium acetate solutionDissolve L-cysteine hydrochloride monohydrate 1 g, sodium acetate trihydrate 0.8 g,and sodium sulfate (anhydrous) 12.8 g into water to make 100mL solution.
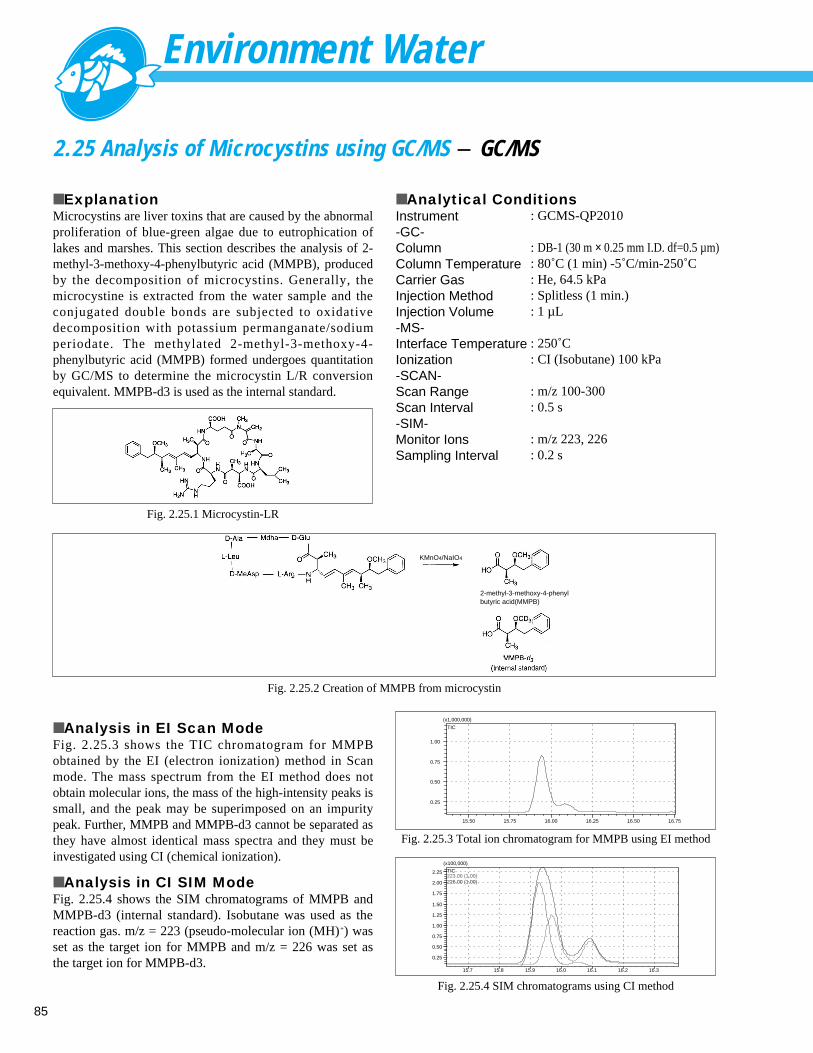
Environment Water
85
2.25 Analysis of Microcystins using GC/MS - GC/MS
■ ExplanationMicrocystins are liver toxins that are caused by the abnormalproliferation of blue-green algae due to eutrophication oflakes and marshes. This section describes the analysis of 2-methyl-3-methoxy-4-phenylbutyric acid (MMPB), producedby the decomposition of microcystins. Generally, themicrocystine is extracted from the water sample and theconjugated double bonds are subjected to oxidativedecomposition with potassium permanganate/sodiumperiodate. The methylated 2-methyl-3-methoxy-4-phenylbutyric acid (MMPB) formed undergoes quantitationby GC/MS to determine the microcystin L/R conversionequivalent. MMPB-d3 is used as the internal standard.
■ Analytical ConditionsInstrument-GC-ColumnColumn TemperatureCarrier GasInjection MethodInjection Volume-MS-Interface TemperatureIonization-SCAN-Scan RangeScan Interval-SIM-Monitor IonsSampling Interval
: GCMS-QP2010
: DB-1 (30 m × 0.25 mm I.D. df=0.5 µm): 80˚C (1 min) -5˚C/min-250˚C: He, 64.5 kPa: Splitless (1 min.): 1 µL
: 250˚C : CI (Isobutane) 100 kPa
: m/z 100-300: 0.5 s
: m/z 223, 226: 0.2 s
■ Analysis in EI Scan ModeFig. 2.25.3 shows the TIC chromatogram for MMPBobtained by the EI (electron ionization) method in Scanmode. The mass spectrum from the EI method does notobtain molecular ions, the mass of the high-intensity peaks issmall, and the peak may be superimposed on an impuritypeak. Further, MMPB and MMPB-d3 cannot be separated asthey have almost identical mass spectra and they must beinvestigated using CI (chemical ionization).
■ Analysis in CI SIM ModeFig. 2.25.4 shows the SIM chromatograms of MMPB andMMPB-d3 (internal standard). Isobutane was used as thereaction gas. m/z = 223 (pseudo-molecular ion (MH)+) wasset as the target ion for MMPB and m/z = 226 was set asthe target ion for MMPB-d3.
KMnO4/NaIO4
2-methyl-3-methoxy-4-phenylbutyric acid(MMPB)
15.50 15.75 16.00 16.25 16.50 16.75
0.25
0.50
0.75
1.00
(x1,000,000)
TIC
15.7 15.8 15.9 16.0 16.1 16.2 16.3
0.25
0.50
0.75
1.00
1.25
1.50
1.75
2.00
2.25
(x100,000)
226.00 (1.00)223.00 (1.00)TIC
Fig. 2.25.1 Microcystin-LR
Fig. 2.25.3 Total ion chromatogram for MMPB using EI method
Fig. 2.25.4 SIM chromatograms using CI method
Fig. 2.25.2 Creation of MMPB from microcystin
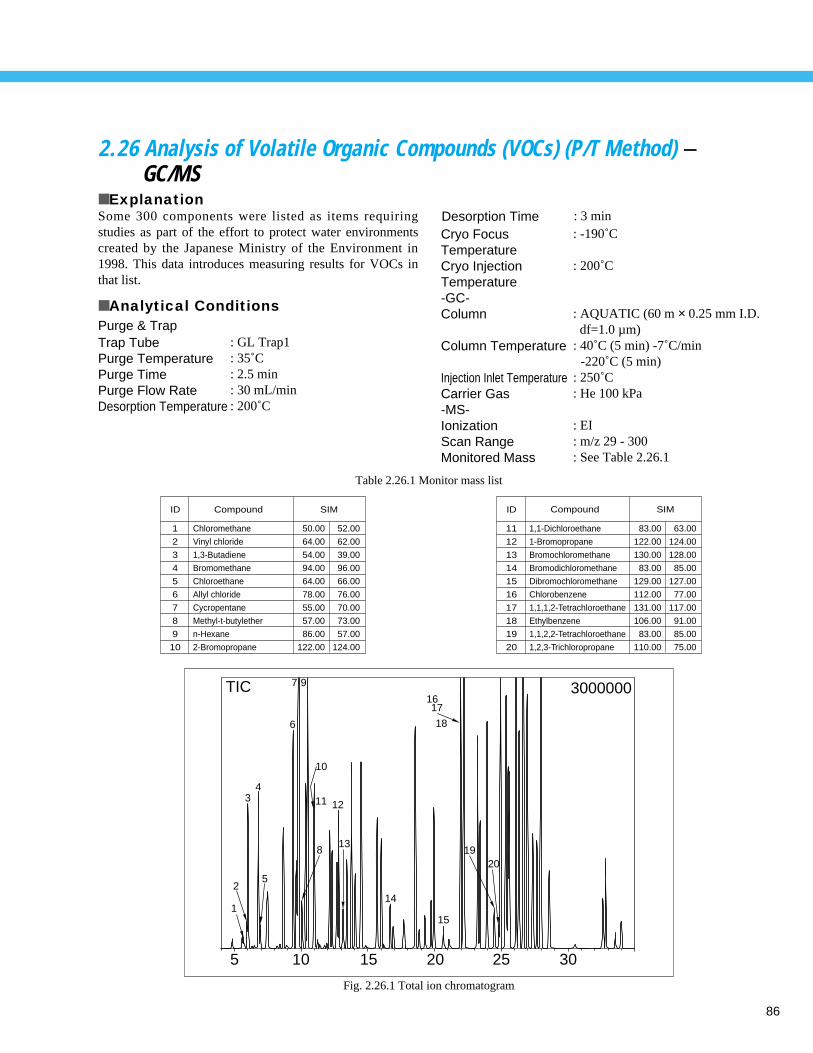
86
TIC 3000000
5 10 15 20 25 30
1
2
34
5
6
7
8
9
10
11 12
13
14
15
1617
18
1920
Fig. 2.26.1 Total ion chromatogram
1
2
3
4
5
6
7
8
9
10
Chloromethane
Vinyl chloride
1,3-Butadiene
Bromomethane
Chloroethane
Allyl chloride
Cycropentane
Methyl-t-butylether
n-Hexane
2-Bromopropane
Compound
50.00
64.00
54.00
94.00
64.00
78.00
55.00
57.00
86.00
122.00
52.00
62.00
39.00
96.00
66.00
76.00
70.00
73.00
57.00
124.00
SIMID ID
11
12
13
14
15
16
17
18
19
20
1,1-Dichloroethane
1-Bromopropane
Bromochloromethane
Bromodichloromethane
Dibromochloromethane
Chlorobenzene
1,1,1,2-Tetrachloroethane
Ethylbenzene
1,1,2,2-Tetrachloroethane
1,2,3-Trichloropropane
Compound
83.00
122.00
130.00
83.00
129.00
112.00
131.00
106.00
83.00
110.00
63.00
124.00
128.00
85.00
127.00
77.00
117.00
91.00
85.00
75.00
SIM
Table 2.26.1 Monitor mass list
2.26 Analysis of Volatile Organic Compounds (VOCs) (P/T Method) -GC/MS
■ ExplanationSome 300 components were listed as items requiringstudies as part of the effort to protect water environmentscreated by the Japanese Ministry of the Environment in1998. This data introduces measuring results for VOCs inthat list.
■ Analytical Conditions
Desorption Time : 3 minCryo FocusTemperatureCryo InjectionTemperature -GC-Column
Column Temperature
Injection Inlet TemperatureCarrier Gas-MS-IonizationScan RangeMonitored Mass
: -190˚C
: 200˚C
: AQUATIC (60 m × 0.25 mm I.D. df=1.0 µm)
: 40˚C (5 min) -7˚C/min -220˚C (5 min)
: 250˚C: He 100 kPa
: EI: m/z 29 - 300: See Table 2.26.1
Purge & TrapTrap TubePurge TemperaturePurge TimePurge Flow RateDesorption Temperature
: GL Trap1: 35˚C: 2.5 min: 30 mL/min: 200˚C
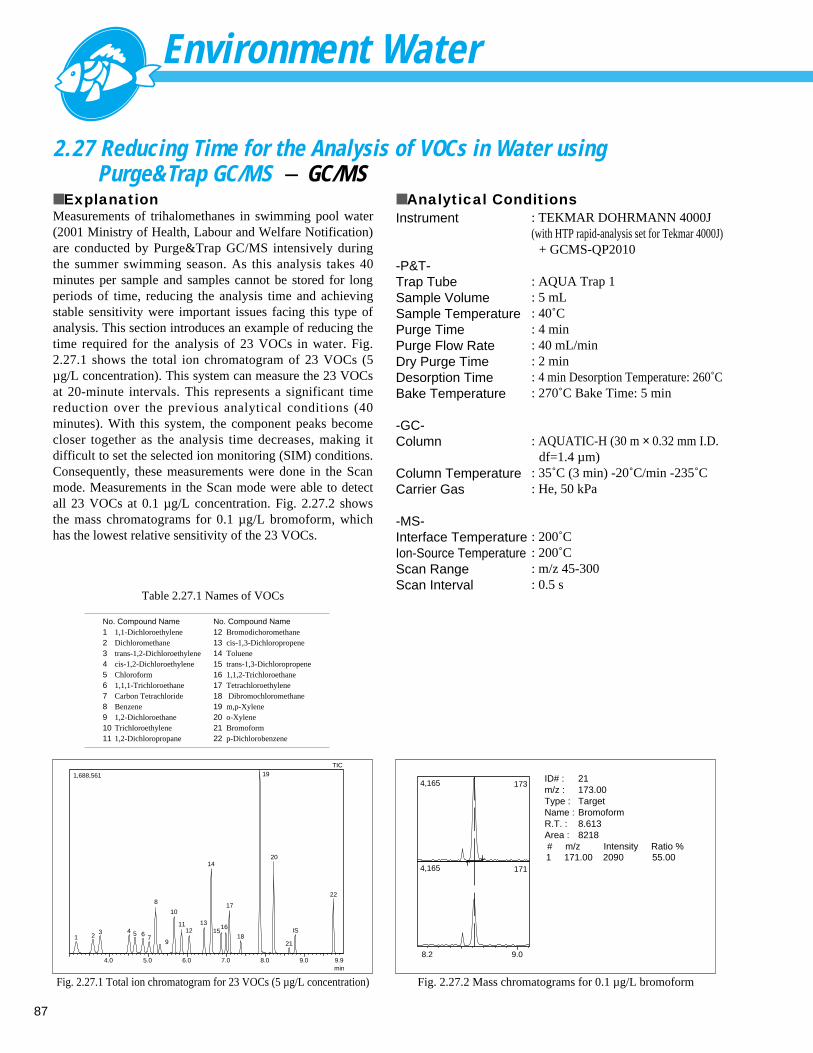
Environment Water
87
2.27 Reducing Time for the Analysis of VOCs in Water using Purge&Trap GC/MS - GC/MS
■ ExplanationMeasurements of trihalomethanes in swimming pool water(2001 Ministry of Health, Labour and Welfare Notification)are conducted by Purge&Trap GC/MS intensively duringthe summer swimming season. As this analysis takes 40minutes per sample and samples cannot be stored for longperiods of time, reducing the analysis time and achievingstable sensitivity were important issues facing this type ofanalysis. This section introduces an example of reducing thetime required for the analysis of 23 VOCs in water. Fig.2.27.1 shows the total ion chromatogram of 23 VOCs (5µg/L concentration). This system can measure the 23 VOCsat 20-minute intervals. This represents a significant timereduction over the previous analytical conditions (40minutes). With this system, the component peaks becomecloser together as the analysis time decreases, making itdifficult to set the selected ion monitoring (SIM) conditions.Consequently, these measurements were done in the Scanmode. Measurements in the Scan mode were able to detectall 23 VOCs at 0.1 µg/L concentration. Fig. 2.27.2 showsthe mass chromatograms for 0.1 µg/L bromoform, whichhas the lowest relative sensitivity of the 23 VOCs.
■ Analytical ConditionsInstrument
-P&T-Trap TubeSample VolumeSample TemperaturePurge TimePurge Flow RateDry Purge TimeDesorption TimeBake Temperature
-GC-Column
Column TemperatureCarrier Gas
-MS-Interface Temperature Ion-Source TemperatureScan RangeScan Interval
: TEKMAR DOHRMANN 4000J (with HTP rapid-analysis set for Tekmar 4000J)
+ GCMS-QP2010
: AQUA Trap 1: 5 mL : 40˚C: 4 min: 40 mL/min: 2 min: 4 min Desorption Temperature: 260˚C: 270˚C Bake Time: 5 min
: AQUATIC-H (30 m × 0.32 mm I.D.df=1.4 µm)
: 35˚C (3 min) -20˚C/min -235˚C : He, 50 kPa
: 200˚C : 200˚C : m/z 45-300: 0.5 s
min
1,688,561
4.0 5.0 6.0 7.0 8.0 9.0 9.9
TIC
1 23 4 5 6 7
8
9
10
1112
13
14
1516
17
18
19
20
21
IS
22
4,165
4,165
8.2 9.0
173
171 1 171.00 2090 55.00
ID# : 21m/z : 173.00Type : TargetName : BromoformR.T. : 8.613Area : 8218 # m/z Intensity Ratio %
No. Compound Name1234 56789 1011
1,1-DichloroethyleneDichloromethanetrans-1,2-Dichloroethylenecis-1,2-Dichloroethylene Chloroform1,1,1-TrichloroethaneCarbon TetrachlorideBenzene1,2-Dichloroethane Trichloroethylene1,2-Dichloropropane
No. Compound Name1213141516171819202122
Bromodichoromethanecis-1,3-DichloropropeneToluenetrans-1,3-Dichloropropene1,1,2-TrichloroethaneTetrachloroethylene Dibromochloromethanem,p-Xyleneo-XyleneBromoformp-Dichlorobenzene
Table 2.27.1 Names of VOCs
Fig. 2.27.1 Total ion chromatogram for 23 VOCs (5 µg/L concentration) Fig. 2.27.2 Mass chromatograms for 0.1 µg/L bromoform
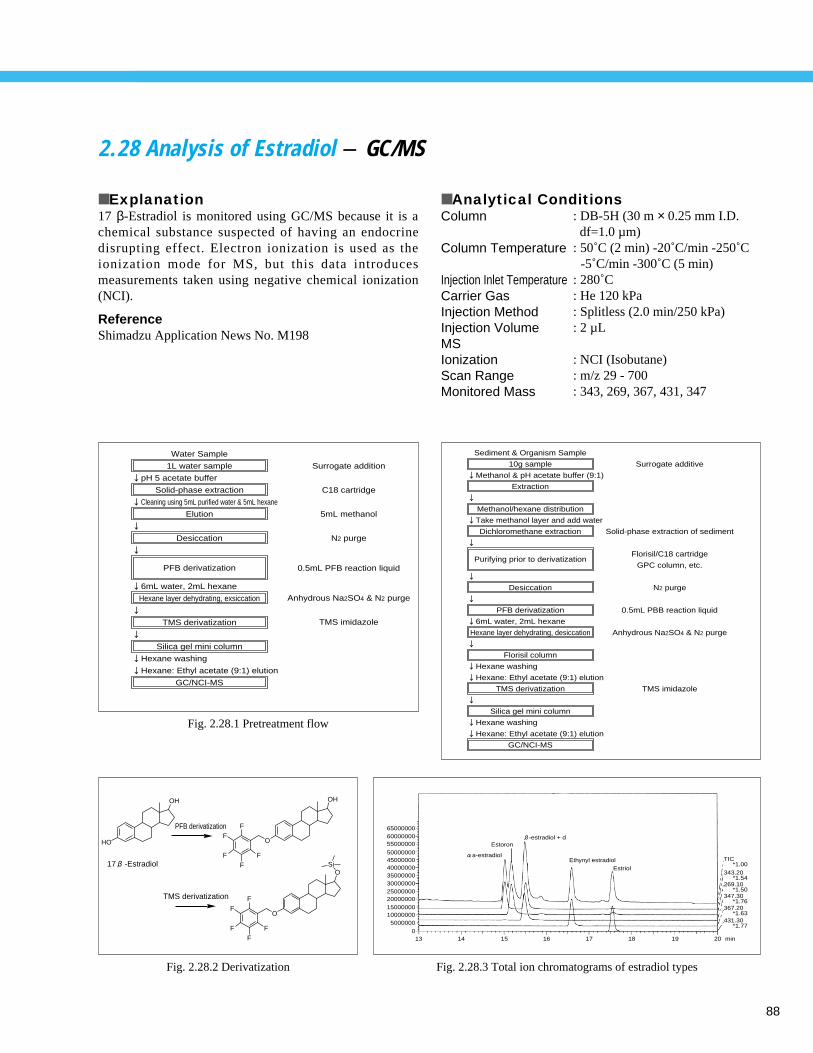
88
2.28 Analysis of Estradiol - GC/MS
■ Explanation17 β-Estradiol is monitored using GC/MS because it is achemical substance suspected of having an endocrinedisrupting effect. Electron ionization is used as theionization mode for MS, but this data introducesmeasurements taken using negative chemical ionization(NCI).
ReferenceShimadzu Application News No. M198
■ Analytical ConditionsColumn
Column Temperature
Injection Inlet TemperatureCarrier GasInjection MethodInjection VolumeMSIonizationScan RangeMonitored Mass
: DB-5H (30 m × 0.25 mm I.D. df=1.0 µm)
: 50˚C (2 min) -20˚C/min -250˚C -5˚C/min -300˚C (5 min)
: 280˚C: He 120 kPa : Splitless (2.0 min/250 kPa): 2 µL
: NCI (Isobutane): m/z 29 - 700: 343, 269, 367, 431, 347
Water Sample
1L water sample
Solid-phase extraction
Elution
Desiccation
Hexane layer dehydrating, exsiccation
TMS derivatization
Silica gel mini column
GC/NCI-MS
Surrogate addition
C18 cartridge
5mL methanol
N2 purge
0.5mL PFB reaction liquid
Anhydrous Na2SO4 & N2 purge
TMS imidazole
pH 5 acetate buffer
Cleaning using 5mL purified water & 5mL hexane
6mL water, 2mL hexane
Hexane washing
Hexane: Ethyl acetate (9:1) elution
PFB derivatization
Sediment & Organism Sample
10g sample
Extraction
Methanol/hexane distribution
Dichloromethane extraction
Desiccation
PFB derivatization
Hexane layer dehydrating, desiccation
Florisil column
TMS derivatization
Silica gel mini column
GC/NCI-MS
Surrogate additive
Solid-phase extraction of sediment
Florisil/C18 cartridge
GPC column, etc.
N2 purge
0.5mL PBB reaction liquid
Anhydrous Na2SO4 & N2 purge
TMS imidazole
Methanol & pH acetate buffer (9:1)
Take methanol layer and add water
6mL water, 2mL hexane
Hexane washing
Hexane: Ethyl acetate (9:1) elution
Hexane washing
Hexane: Ethyl acetate (9:1) elution
Purifying prior to derivatization
HO
OH OH
O
FF
F
FFPFB derivatization
O
O
FF
F
FF
Si
TMS derivatization
17 -Estradiol
650000006000000055000000
5000000045000000400000003500000030000000250000002000000015000000100000005000000
0
a-estradiol
Estoron-estradiol + d
Ethynyl estradiolEstriol
13 14 15 16 17 18 19 20 min
TIC *1.00343.20 *1.54269.10 *1.50347.30 *1.76367.20 *1.63431.30 *1.77
Fig. 2.28.1 Pretreatment flow
Fig. 2.28.2 Derivatization Fig. 2.28.3 Total ion chromatograms of estradiol types
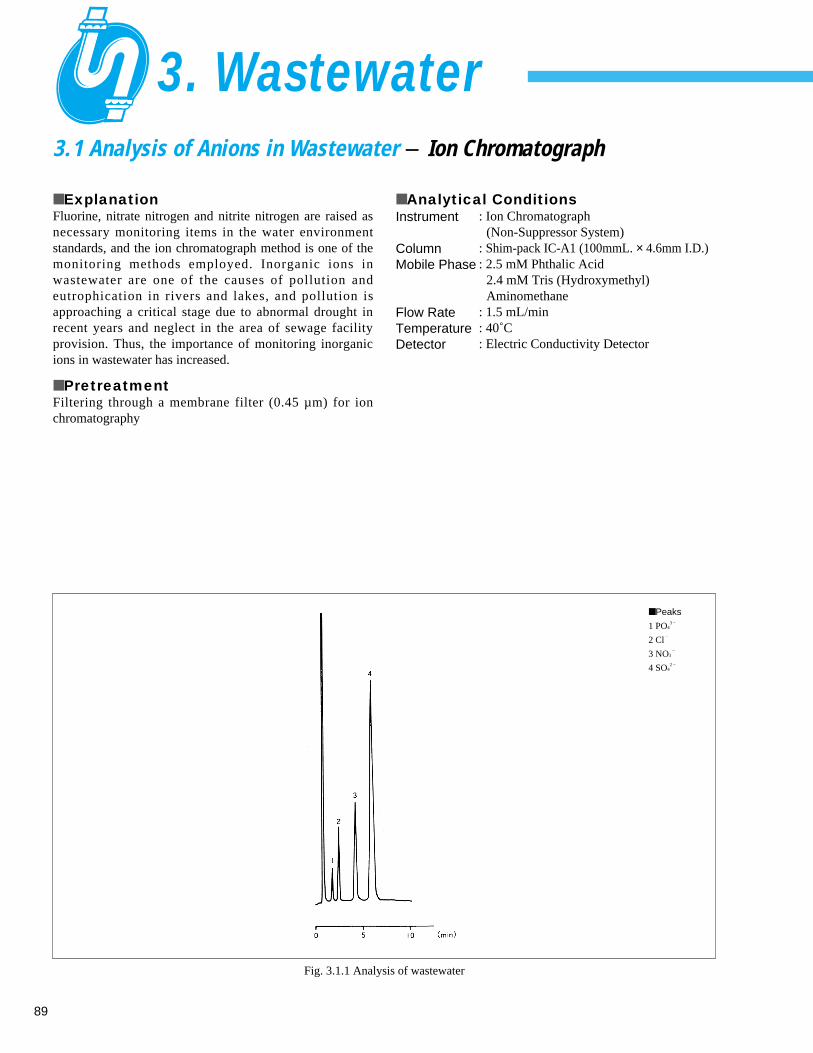
89
3.1 Analysis of Anions in Wastewater - Ion Chromatograph
■ ExplanationFluorine, nitrate nitrogen and nitrite nitrogen are raised asnecessary monitoring items in the water environmentstandards, and the ion chromatograph method is one of themonitoring methods employed. Inorganic ions inwastewater are one of the causes of pollution andeutrophication in rivers and lakes, and pollution isapproaching a critical stage due to abnormal drought inrecent years and neglect in the area of sewage facilityprovision. Thus, the importance of monitoring inorganicions in wastewater has increased.
■ PretreatmentFiltering through a membrane filter (0.45 µm) for ionchromatography
■ Analytical Conditions
Fig. 3.1.1 Analysis of wastewater
■ Peaks
1 PO43 –
2 Cl–
3 NO3–
4 SO42 –
Instrument
ColumnMobile Phase
Flow RateTemperatureDetector
: Ion Chromatograph (Non-Suppressor System)
: Shim-pack IC-A1 (100mmL. × 4.6mm I.D.): 2.5 mM Phthalic Acid
2.4 mM Tris (Hydroxymethyl)Aminomethane
: 1.5 mL/min: 40˚C: Electric Conductivity Detector
3. Wastewater
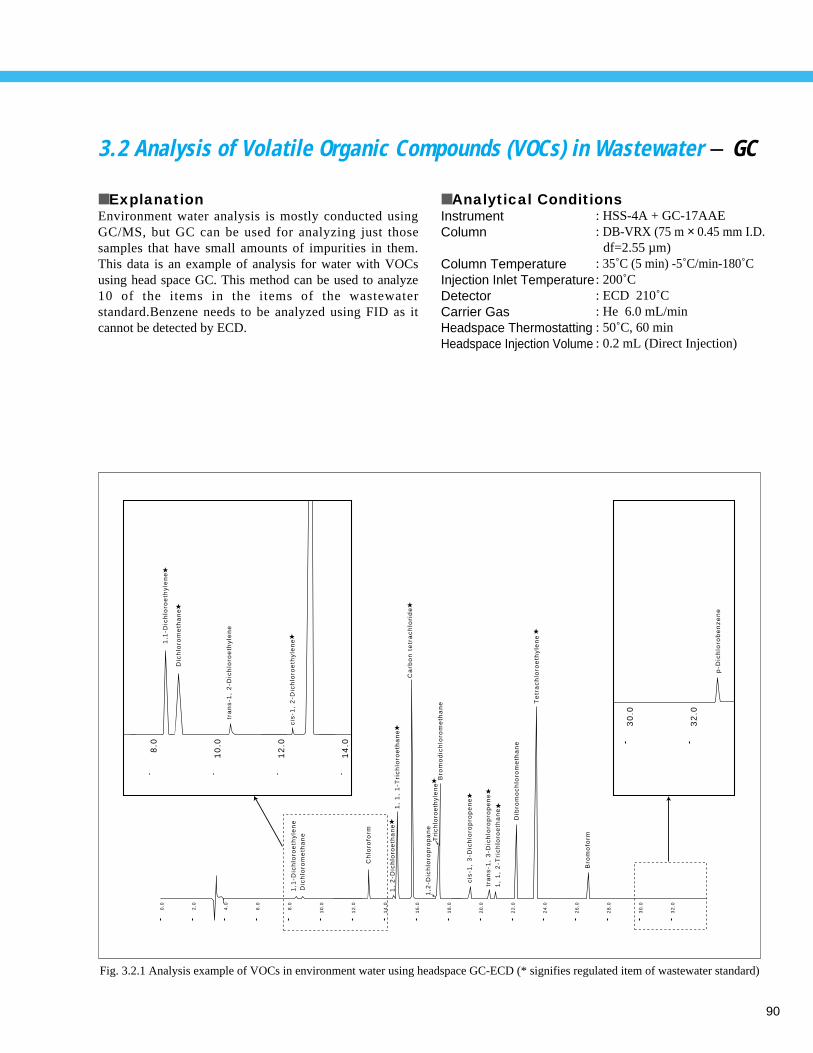
90
3.2 Analysis of Volatile Organic Compounds (VOCs) in Wastewater - GC0
.0
8.0
10
.0
12
.0
30
.0
32
.0
14
.0
2.0
4.0
6.0
8.0
10
.0
12
.0
14
.0
16
.0
18
.0
20
.0
22
.0
24
.0
26
.0
28
.0
30
.0
32
.0
1,1
-Dic
hlo
roe
thy
len
e
1,1
-Dic
hlo
roe
thy
len
e
Dic
hlo
rom
eth
an
e
Dic
hlo
rom
eth
an
e
tra
ns
-1,
2-D
ich
loro
eth
yle
ne
cis
-1,
2-D
ich
loro
eth
yle
ne
Ch
loro
form
1,
2-D
ich
loro
eth
an
e1
, 1
, 1
-Tri
ch
loro
eth
an
e
Ca
rbo
n t
etr
ac
hlo
rid
e
Dib
rom
oc
hlo
rom
eth
an
e
Te
tra
ch
loro
eth
yle
ne
Bro
mo
form
p-D
ich
loro
be
nz
en
e
1,2
-Dic
hlo
rop
rop
an
e
Bro
mo
dic
hlo
rom
eth
an
e
cis
-1,
3-D
ich
loro
pro
pe
ne
tra
ns
-1,
3-D
ich
loro
pro
pe
ne
1,
1,
2-T
ric
hlo
roe
tha
ne
★
★
★
★
★
Tri
ch
loro
eth
yle
ne
★
★★
★
★
★
Fig. 3.2.1 Analysis example of VOCs in environment water using headspace GC-ECD (* signifies regulated item of wastewater standard)
■ ExplanationEnvironment water analysis is mostly conducted usingGC/MS, but GC can be used for analyzing just thosesamples that have small amounts of impurities in them.This data is an example of analysis for water with VOCsusing head space GC. This method can be used to analyze10 of the items in the items of the wastewaterstandard.Benzene needs to be analyzed using FID as itcannot be detected by ECD.
■ Analytical ConditionsInstrumentColumn
Column TemperatureInjection Inlet TemperatureDetectorCarrier GasHeadspace ThermostattingHeadspace Injection Volume
: HSS-4A + GC-17AAE: DB-VRX (75 m × 0.45 mm I.D.
df=2.55 µm): 35˚C (5 min) -5˚C/min-180˚C: 200˚C: ECD 210˚C: He 6.0 mL/min: 50˚C, 60 min: 0.2 mL (Direct Injection)
Wastewater
91
3.3 Analysis of Inorganic Components in Wastewater (1) - ICP/MS
■ ExplanationWastewater samples comprise several matrices, includingorganic components, alkaline elements, and alkaline earthelements. These matrices differ significantly depending onthe wastewater discharge location and type of industry.Consequently, a highly sensitive analysis method thatsuffers from little interference is required to accuratelyanalyze trace elements in wastewater. This sectionintroduces the results of the analysis of factory wastewaterusing Shimadzu ICPM-8500.
■ SamplesFactory wastewater A, B
■ PretreatmentAdd 2 mL ultra-pure-grade nitric acid (Tama ChemicalsAA-100) to 50 mL sample solution. Thermally decomposethe mixture using the microwave oven in power mode.After cooling, make up to 50 mL to produce the analysissample. Spike this analysis sample with the target elementsto make the standard spiked sample.
■ Quantitative AnalysisThe analysis sample and standard spiked sample wereanalyzed using the internal standard method – calibrationcurve method. . Internal standard elements
The internal standard elements were spiked online usingADU-1 Automatic Sample Dilution unit.
Table 3.3.1 shows the quantitation results and recoveryrates. A satisfactory recovery rate was achieved for eachelement.
■ Analytical ConditionsInstrumentPlasma Unit RF OutputCoolant Gas Flow Rate (Ar)Plasma Gas Flow Rate (Ar)Carrier Gas Flow Rate (Ar)Sample Introduction UnitNebulizerSample Intake RateChamberPlasma TorchSampling DepthSampling Interface
: ICPM-8500
: 1.2 kW: 7 L/min: 1.5 L/min: 0.58 L/min
: Coaxial Nebulizer: 0.5 mL/min: Cooled Scott Chamber: Three-layered Mini Torch: 3.5 mm: Copper
References(1) JIS K0102-1998 Testing Methods for Industrial Wastewater(2) Partial revision of Ordinances of Water Pollution
Prevention Law Related to Environmental Standards, 8 March 1993
(3) Microwave Assisted Acid Digestion Of Siliceous And Organically Based Matrices (EPA Method3052)
(4) EPA Method200.8 Ver.5.4 Date : F06/26/98
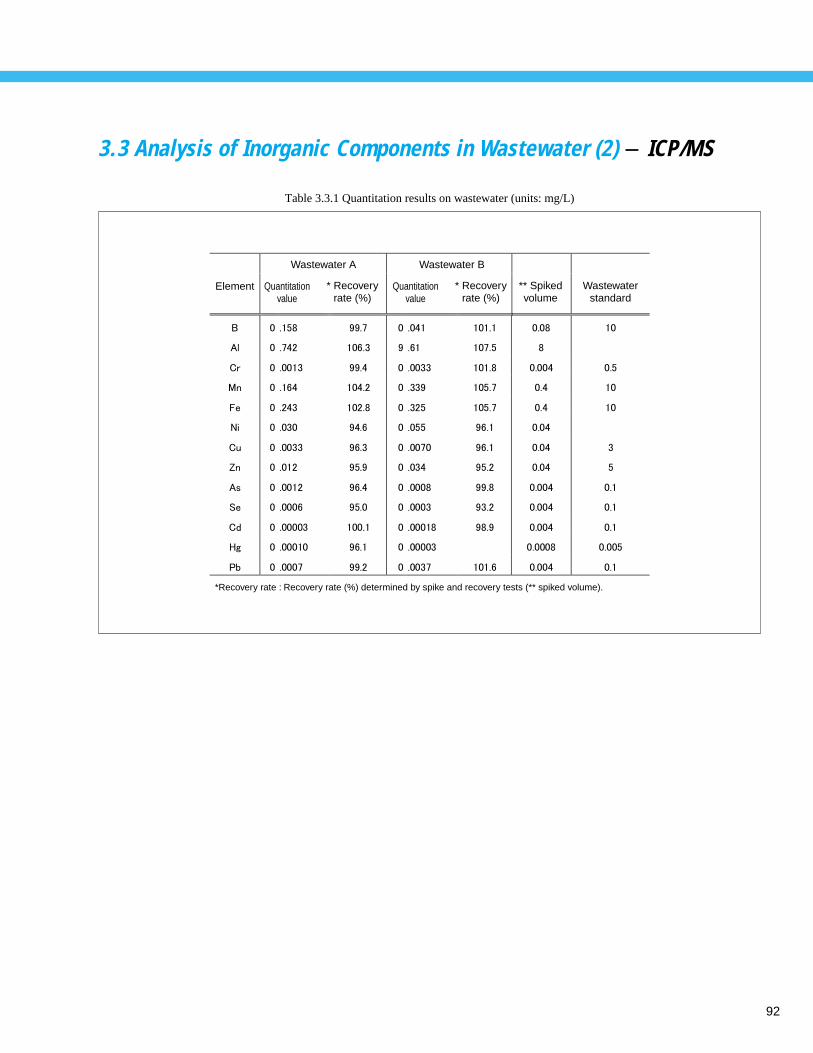
92
3.3 Analysis of Inorganic Components in Wastewater (2) - ICP/MS
Wastewater A
Element Quantitationvalue
* Recoveryrate (%)
Wastewater B
Quantitationvalue
* Recoveryrate (%)
** Spikedvolume
Wastewaterstandard
*Recovery rate : Recovery rate (%) determined by spike and recovery tests (** spiked volume).
Table 3.3.1 Quantitation results on wastewater (units: mg/L)
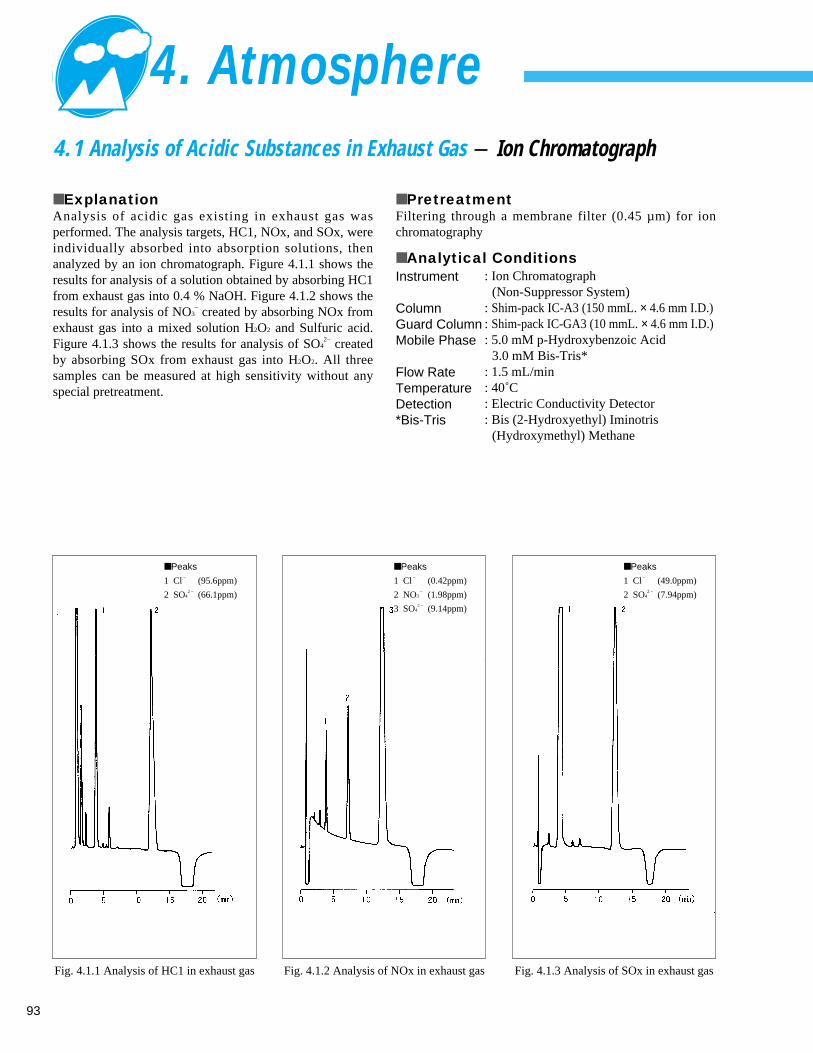
93
4.1 Analysis of Acidic Substances in Exhaust Gas - Ion Chromatograph
■ ExplanationAnalysis of acidic gas existing in exhaust gas wasperformed. The analysis targets, HC1, NOx, and SOx, wereindividually absorbed into absorption solutions, thenanalyzed by an ion chromatograph. Figure 4.1.1 shows theresults for analysis of a solution obtained by absorbing HC1from exhaust gas into 0.4 % NaOH. Figure 4.1.2 shows theresults for analysis of NO3
– created by absorbing NOx fromexhaust gas into a mixed solution H2O2 and Sulfuric acid.Figure 4.1.3 shows the results for analysis of SO4
2– createdby absorbing SOx from exhaust gas into H2O2. All threesamples can be measured at high sensitivity without anyspecial pretreatment.
Fig. 4.1.1 Analysis of HC1 in exhaust gas Fig. 4.1.2 Analysis of NOx in exhaust gas Fig. 4.1.3 Analysis of SOx in exhaust gas
■ PretreatmentFiltering through a membrane filter (0.45 µm) for ionchromatography
■ Analytical ConditionsInstrument
ColumnGuard ColumnMobile Phase
Flow RateTemperatureDetection*Bis-Tris
: Ion Chromatograph(Non-Suppressor System)
: Shim-pack IC-A3 (150 mmL. × 4.6 mm I.D.): Shim-pack IC-GA3 (10 mmL. × 4.6 mm I.D.): 5.0 mM p-Hydroxybenzoic Acid
3.0 mM Bis-Tris*: 1.5 mL/min: 40˚C: Electric Conductivity Detector: Bis (2-Hydroxyethyl) Iminotris
(Hydroxymethyl) Methane
■ Peaks
1 Cl–
(95.6ppm)
2 SO42 – (66.1ppm)
■ Peaks
1 Cl–
(0.42ppm)
2 NO3–
(1.98ppm)
3 SO42 – (9.14ppm)
■ Peaks
1 Cl–
(49.0ppm)
2 SO42 – (7.94ppm)
4. Atmosphere
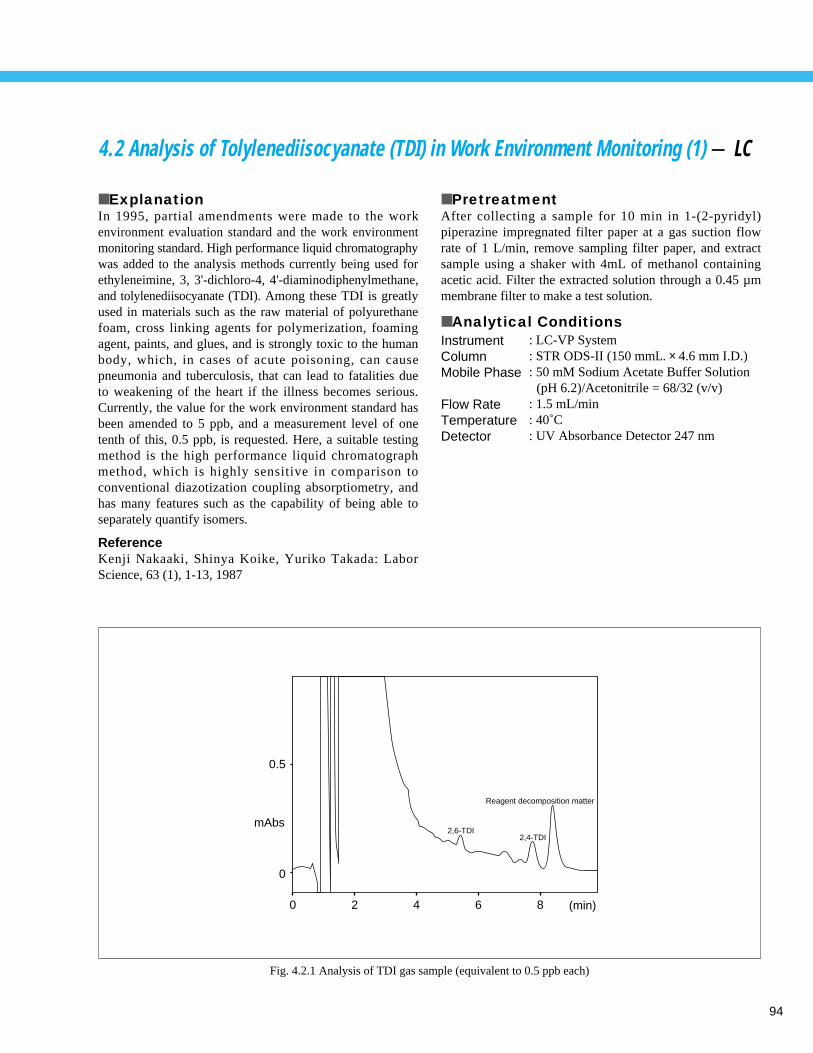
94
4.2 Analysis of Tolylenediisocyanate (TDI) in Work Environment Monitoring (1)- LC
2,6-TDI
0
0
0.5
mAbs
2 4 (min)6 8
2,4-TDI
Reagent decomposition matter
Fig. 4.2.1 Analysis of TDI gas sample (equivalent to 0.5 ppb each)
■ ExplanationIn 1995, partial amendments were made to the workenvironment evaluation standard and the work environmentmonitoring standard. High performance liquid chromatographywas added to the analysis methods currently being used forethyleneimine, 3, 3'-dichloro-4, 4'-diaminodiphenylmethane,and tolylenediisocyanate (TDI). Among these TDI is greatlyused in materials such as the raw material of polyurethanefoam, cross linking agents for polymerization, foamingagent, paints, and glues, and is strongly toxic to the humanbody, which, in cases of acute poisoning, can causepneumonia and tuberculosis, that can lead to fatalities dueto weakening of the heart if the illness becomes serious.Currently, the value for the work environment standard hasbeen amended to 5 ppb, and a measurement level of onetenth of this, 0.5 ppb, is requested. Here, a suitable testingmethod is the high performance liquid chromatographmethod, which is highly sensitive in comparison toconventional diazotization coupling absorptiometry, andhas many features such as the capability of being able toseparately quantify isomers.
ReferenceKenji Nakaaki, Shinya Koike, Yuriko Takada: LaborScience, 63 (1), 1-13, 1987
■ PretreatmentAfter collecting a sample for 10 min in 1-(2-pyridyl)piperazine impregnated filter paper at a gas suction flowrate of 1 L/min, remove sampling filter paper, and extractsample using a shaker with 4mL of methanol containingacetic acid. Filter the extracted solution through a 0.45 µmmembrane filter to make a test solution.
■ Analytical ConditionsInstrumentColumnMobile Phase
Flow RateTemperatureDetector
: LC-VP System: STR ODS-II (150 mmL. × 4.6 mm I.D.): 50 mM Sodium Acetate Buffer Solution
(pH 6.2)/Acetonitrile = 68/32 (v/v): 1.5 mL/min: 40˚C: UV Absorbance Detector 247 nm
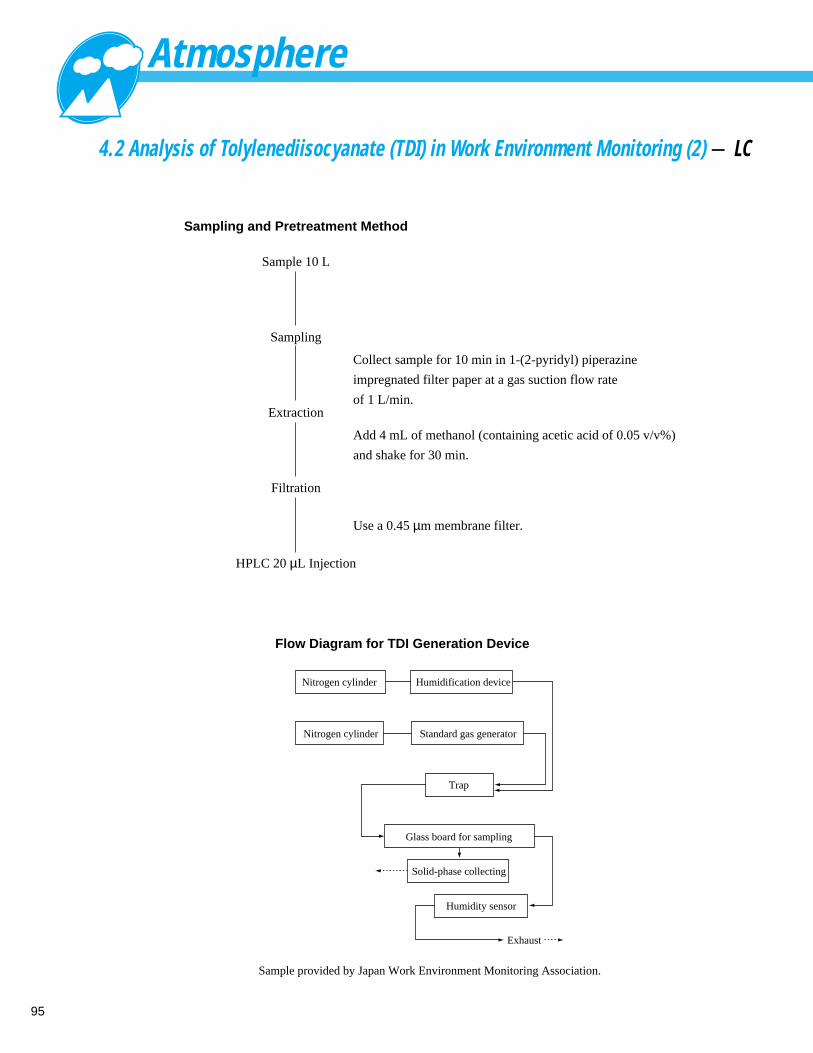
Atmosphere
95
4.2 Analysis of Tolylenediisocyanate (TDI) in Work Environment Monitoring (2)- LC
Sampling and Pretreatment Method
Sample 10 L
Sampling
Collect sample for 10 min in 1-(2-pyridyl) piperazine
impregnated filter paper at a gas suction flow rate
of 1 L/min.
Add 4 mL of methanol (containing acetic acid of 0.05 v/v%)
and shake for 30 min.
Extraction
Filtration
Use a 0.45 µm membrane filter.
HPLC 20 µL Injection
Nitrogen cylinder
Nitrogen cylinder Standard gas generator
Glass board for sampling
Solid-phase collecting
Humidity sensor
Exhaust
Trap
Humidification device
Sample provided by Japan Work Environment Monitoring Association.
Flow Diagram for TDI Generation Device
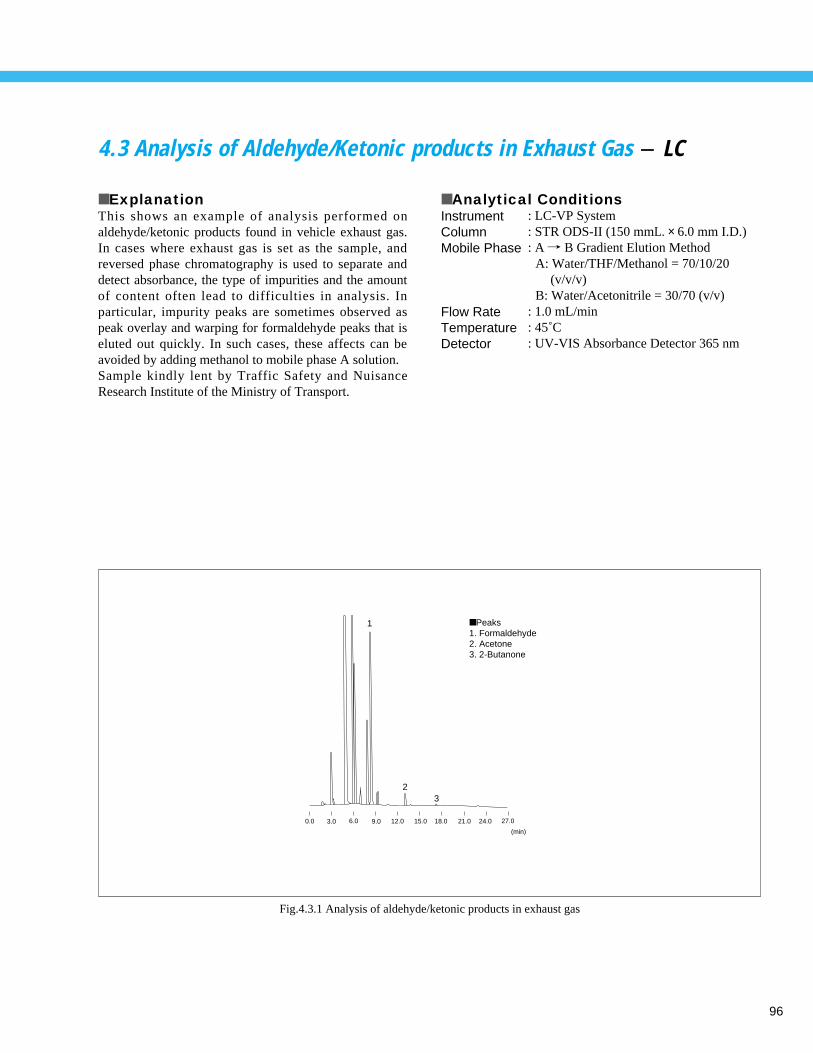
96
4.3 Analysis of Aldehyde/Ketonic products in Exhaust Gas - LC
■ ExplanationThis shows an example of analysis performed onaldehyde/ketonic products found in vehicle exhaust gas.In cases where exhaust gas is set as the sample, andreversed phase chromatography is used to separate anddetect absorbance, the type of impurities and the amountof content often lead to difficulties in analysis. Inparticular, impurity peaks are sometimes observed aspeak overlay and warping for formaldehyde peaks that iseluted out quickly. In such cases, these affects can beavoided by adding methanol to mobile phase A solution.Sample kindly lent by Traffic Safety and NuisanceResearch Institute of the Ministry of Transport.
3.00.0 9.06.0 15.012.0 21.018.0 27.024.0
(min)
1
23
■ Peaks1. Formaldehyde2. Acetone3. 2-Butanone
Fig.4.3.1 Analysis of aldehyde/ketonic products in exhaust gas
■ Analytical ConditionsInstrumentColumnMobile Phase
Flow RateTemperatureDetector
: LC-VP System: STR ODS-II (150 mmL. × 6.0 mm I.D.): A / B Gradient Elution Method
A: Water/THF/Methanol = 70/10/20 (v/v/v)
B: Water/Acetonitrile = 30/70 (v/v): 1.0 mL/min: 45˚C: UV-VIS Absorbance Detector 365 nm
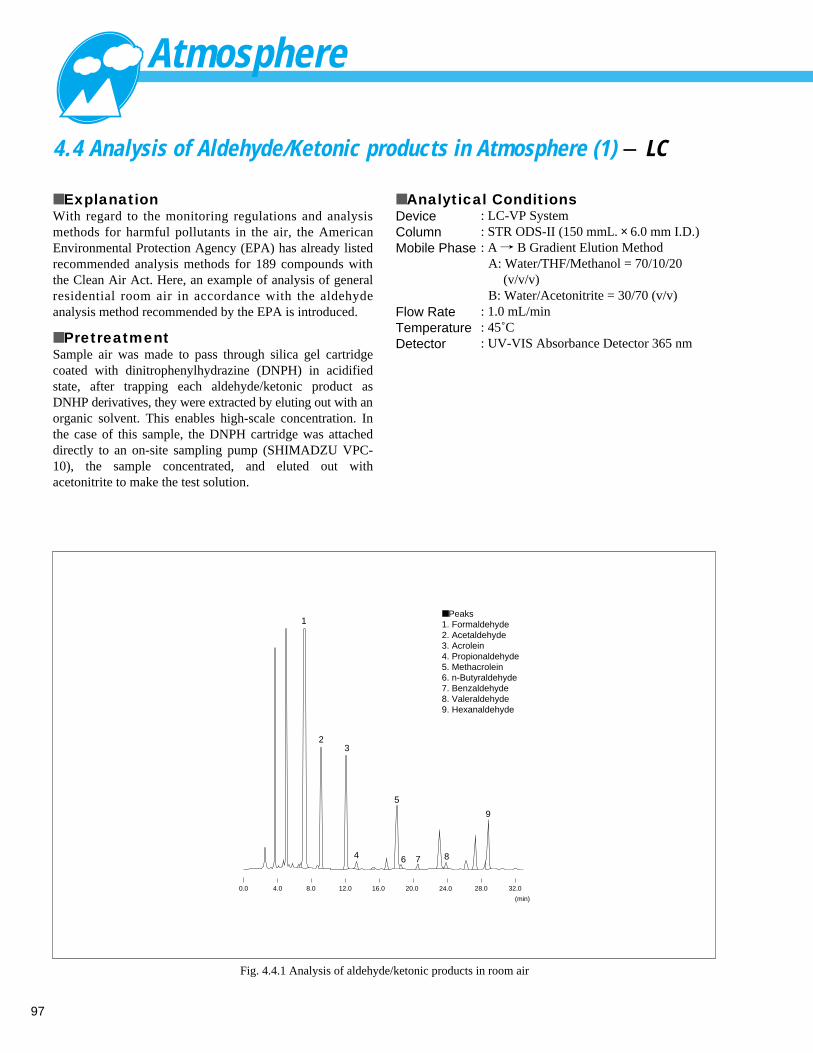
Atmosphere
97
■ ExplanationWith regard to the monitoring regulations and analysismethods for harmful pollutants in the air, the AmericanEnvironmental Protection Agency (EPA) has already listedrecommended analysis methods for 189 compounds withthe Clean Air Act. Here, an example of analysis of generalresidential room air in accordance with the aldehydeanalysis method recommended by the EPA is introduced.
■ PretreatmentSample air was made to pass through silica gel cartridgecoated with dinitrophenylhydrazine (DNPH) in acidifiedstate, after trapping each aldehyde/ketonic product asDNHP derivatives, they were extracted by eluting out with anorganic solvent. This enables high-scale concentration. Inthe case of this sample, the DNPH cartridge was attacheddirectly to an on-site sampling pump (SHIMADZU VPC-10), the sample concentrated, and eluted out withacetonitrite to make the test solution.
■ Analytical ConditionsDeviceColumnMobile Phase
Flow RateTemperatureDetector
: LC-VP System: STR ODS-II (150 mmL. × 6.0 mm I.D.): A / B Gradient Elution Method
A: Water/THF/Methanol = 70/10/20 (v/v/v)
B: Water/Acetonitrite = 30/70 (v/v): 1.0 mL/min: 45˚C: UV-VIS Absorbance Detector 365 nm
(min)
0.0 4.0 8.0 12.0 16.0 20.0 24.0 28.0 32.0
1
32
4
5
6 7 8
9
■ Peaks1. Formaldehyde2. Acetaldehyde3. Acrolein4. Propionaldehyde5. Methacrolein6. n-Butyraldehyde7. Benzaldehyde8. Valeraldehyde9. Hexanaldehyde
Fig. 4.4.1 Analysis of aldehyde/ketonic products in room air
4.4 Analysis of Aldehyde/Ketonic products in Atmosphere (1) - LC
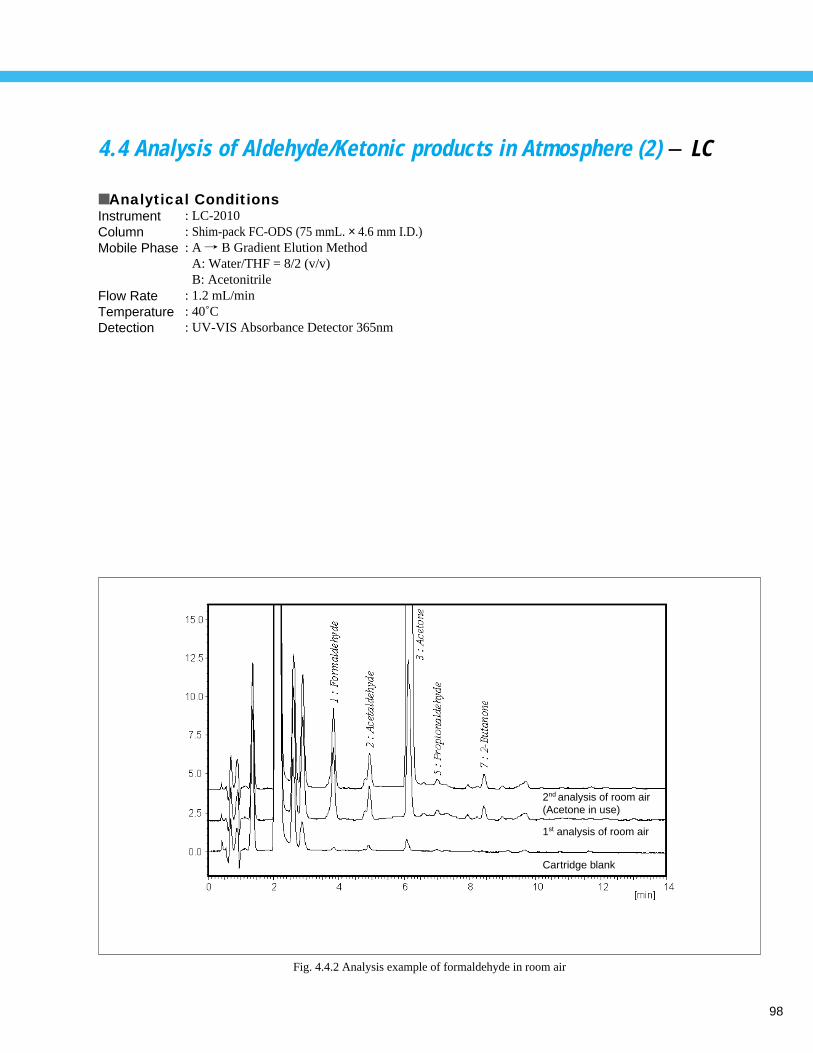
98
2nd analysis of room air(Acetone in use)
1st analysis of room air
Cartridge blank
Fig. 4.4.2 Analysis example of formaldehyde in room air
4.4 Analysis of Aldehyde/Ketonic products in Atmosphere (2) - LC
■ Analytical ConditionsInstrumentColumnMobile Phase
Flow RateTemperatureDetection
: LC-2010: Shim-pack FC-ODS (75 mmL. × 4.6 mm I.D.): A / B Gradient Elution Method: A: Water/THF = 8/2 (v/v): B: Acetonitrile: 1.2 mL/min: 40˚C: UV-VIS Absorbance Detector 365nm
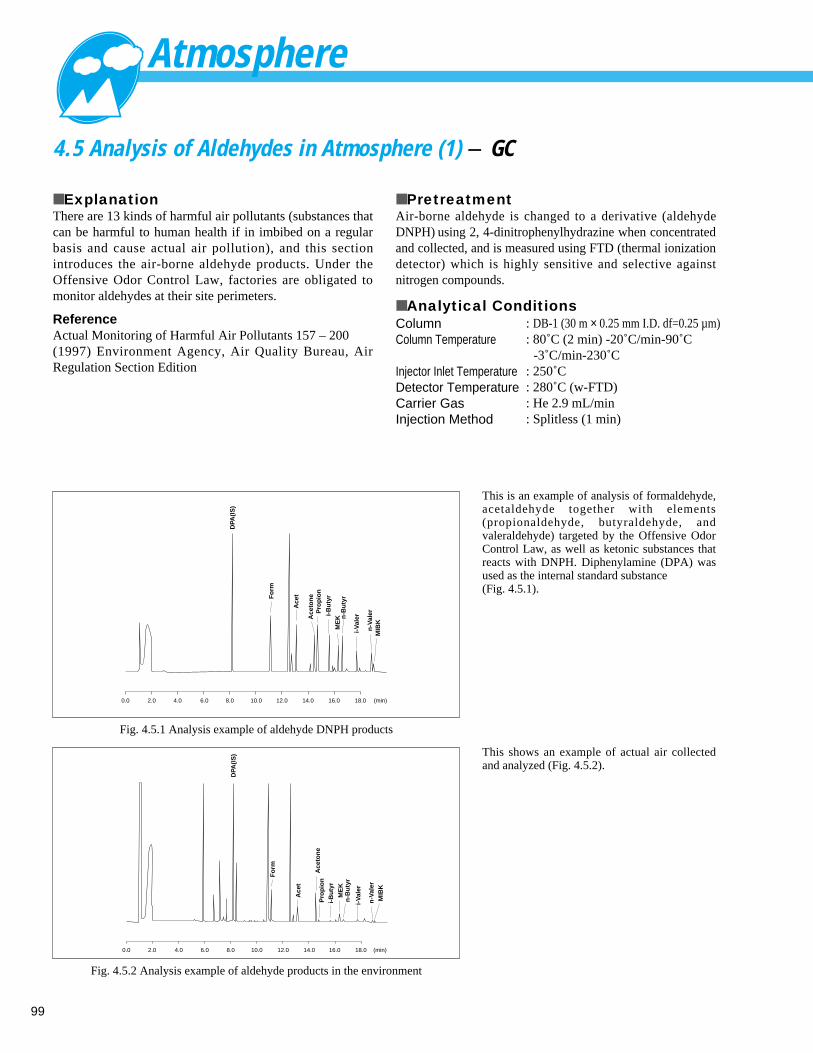
Atmosphere
99
4.5 Analysis of Aldehydes in Atmosphere (1) - GC
■ ExplanationThere are 13 kinds of harmful air pollutants (substances thatcan be harmful to human health if in imbibed on a regularbasis and cause actual air pollution), and this sectionintroduces the air-borne aldehyde products. Under theOffensive Odor Control Law, factories are obligated tomonitor aldehydes at their site perimeters.
ReferenceActual Monitoring of Harmful Air Pollutants 157 – 200(1997) Environment Agency, Air Quality Bureau, AirRegulation Section Edition
DPA
(IS
)
Fo
rm
Ace
t
Ace
ton
eP
rop
ion
i-B
uty
rM
EK n
-Bu
tyr
i-V
aler
n-V
aler
MIB
K
0.0 2.0 4.0 6.0 8.0 10.0 12.0 14.0 16.0 18.0 (min)
Fig. 4.5.1 Analysis example of aldehyde DNPH products
DPA
(IS
)
Fo
rm
Ace
t
Ace
ton
eP
rop
ion
i-B
uty
r
ME
Kn
-Bu
tyr
i-V
aler
n-V
aler
MIB
K
0.0 2.0 4.0 6.0 8.0 10.0 12.0 14.0 16.0 18.0 (min)
Fig. 4.5.2 Analysis example of aldehyde products in the environment
This is an example of analysis of formaldehyde,acetaldehyde together with elements(propionaldehyde, butyraldehyde, andvaleraldehyde) targeted by the Offensive OdorControl Law, as well as ketonic substances thatreacts with DNPH. Diphenylamine (DPA) wasused as the internal standard substance (Fig. 4.5.1).
This shows an example of actual air collectedand analyzed (Fig. 4.5.2).
■ PretreatmentAir-borne aldehyde is changed to a derivative (aldehydeDNPH) using 2, 4-dinitrophenylhydrazine when concentratedand collected, and is measured using FTD (thermal ionizationdetector) which is highly sensitive and selective againstnitrogen compounds.
■ Analytical ConditionsColumnColumn Temperature
Injector Inlet TemperatureDetector TemperatureCarrier GasInjection Method
: DB-1 (30 m × 0.25 mm I.D. df=0.25 µm): 80˚C (2 min) -20˚C/min-90˚C
-3˚C/min-230˚C: 250˚C: 280˚C (w-FTD): He 2.9 mL/min: Splitless (1 min)
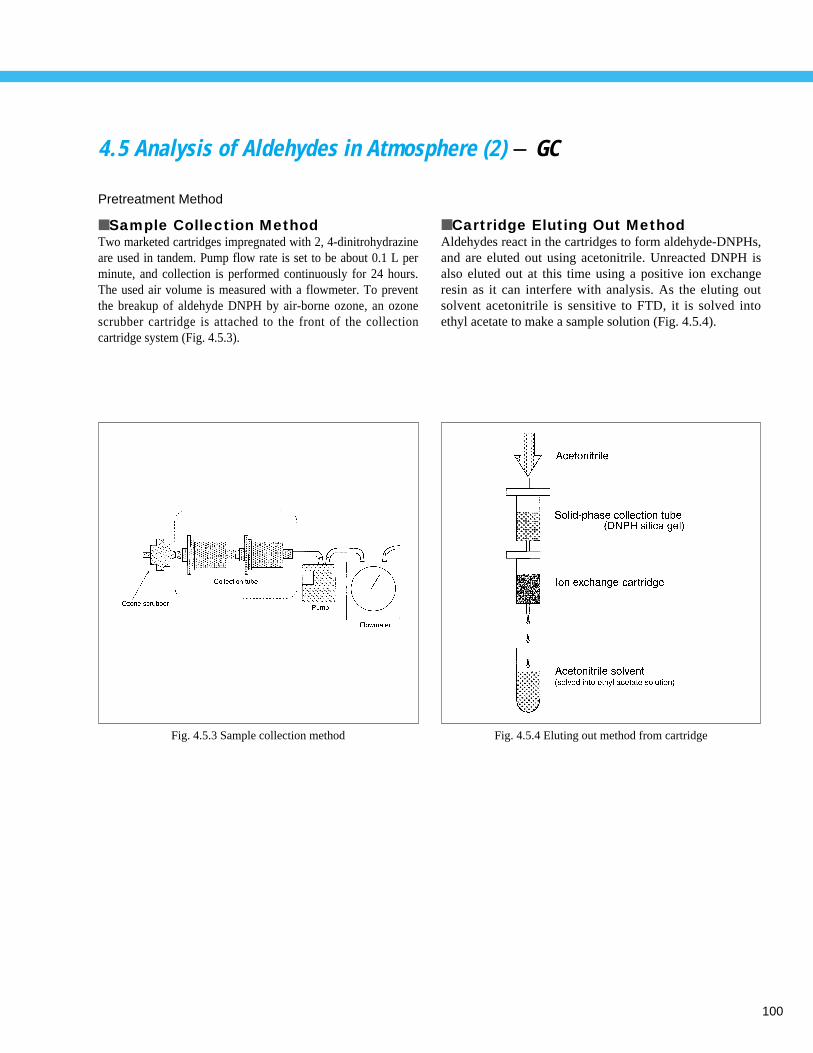
100
4.5 Analysis of Aldehydes in Atmosphere (2) - GC
Pretreatment Method
■ Sample Collection MethodTwo marketed cartridges impregnated with 2, 4-dinitrohydrazineare used in tandem. Pump flow rate is set to be about 0.1 L perminute, and collection is performed continuously for 24 hours.The used air volume is measured with a flowmeter. To preventthe breakup of aldehyde DNPH by air-borne ozone, an ozonescrubber cartridge is attached to the front of the collectioncartridge system (Fig. 4.5.3).
■ Cartridge Eluting Out MethodAldehydes react in the cartridges to form aldehyde-DNPHs,and are eluted out using acetonitrile. Unreacted DNPH isalso eluted out at this time using a positive ion exchangeresin as it can interfere with analysis. As the eluting outsolvent acetonitrile is sensitive to FTD, it is solved intoethyl acetate to make a sample solution (Fig. 4.5.4).
Fig. 4.5.3 Sample collection method Fig. 4.5.4 Eluting out method from cartridge
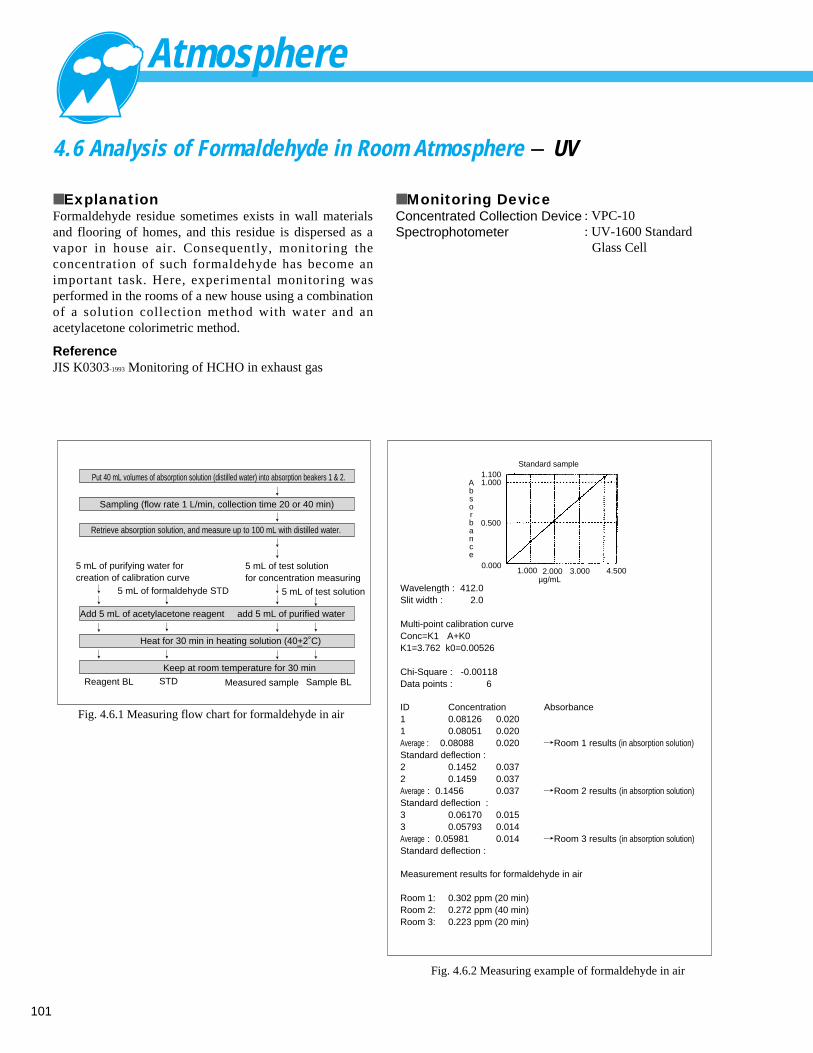
Atmosphere
101
4.6 Analysis of Formaldehyde in Room Atmosphere - UV
■ ExplanationFormaldehyde residue sometimes exists in wall materialsand flooring of homes, and this residue is dispersed as avapor in house air. Consequently, monitoring theconcentration of such formaldehyde has become animportant task. Here, experimental monitoring wasperformed in the rooms of a new house using a combinationof a solution collection method with water and anacetylacetone colorimetric method.
ReferenceJIS K0303-1993 Monitoring of HCHO in exhaust gas
■ Monitoring DeviceConcentrated Collection DeviceSpectrophotometer
: VPC-10: UV-1600 Standard
Glass Cell
//
//
//
/
//
//
//
/
//
/ /
Heat for 30 min in heating solution (40+2˚C)
Keep at room temperature for 30 min
5 mL of purifying water for creation of calibration curve
5 mL of formaldehyde STD
5 mL of test solution for concentration measuring
5 mL of test solution
Sample BLMeasured sampleSTDReagent BL
Wavelength : 412.0Slit width : 2.0
Multi-point calibration curveConc=K1 A+K0K1=3.762 k0=0.00526
Chi-Square : -0.00118Data points : 6
ID Concentration Absorbance1 0.08126 0.0201 0.08051 0.020Average : 0.08088 0.020 /Room 1 results (in absorption solution)Standard deflection : 2 0.1452 0.0372 0.1459 0.037Average : 0.1456 0.037 /Room 2 results (in absorption solution)Standard deflection :3 0.06170 0.0153 0.05793 0.014Average : 0.05981 0.014 /Room 3 results (in absorption solution)Standard deflection :
Measurement results for formaldehyde in air
Room 1: 0.302 ppm (20 min)Room 2: 0.272 ppm (40 min)Room 3: 0.223 ppm (20 min)
Put 40 mL volumes of absorption solution (distilled water) into absorption beakers 1 & 2.
Sampling (flow rate 1 L/min, collection time 20 or 40 min)
Retrieve absorption solution, and measure up to 100 mL with distilled water.
Add 5 mL of acetylacetone reagent add 5 mL of purified water
µg/mL
1.0001.100
0.000
0.500
1.000 2.000 3.000 4.500
Absorbance
Standard sample
–
Fig. 4.6.1 Measuring flow chart for formaldehyde in air
Fig. 4.6.2 Measuring example of formaldehyde in air
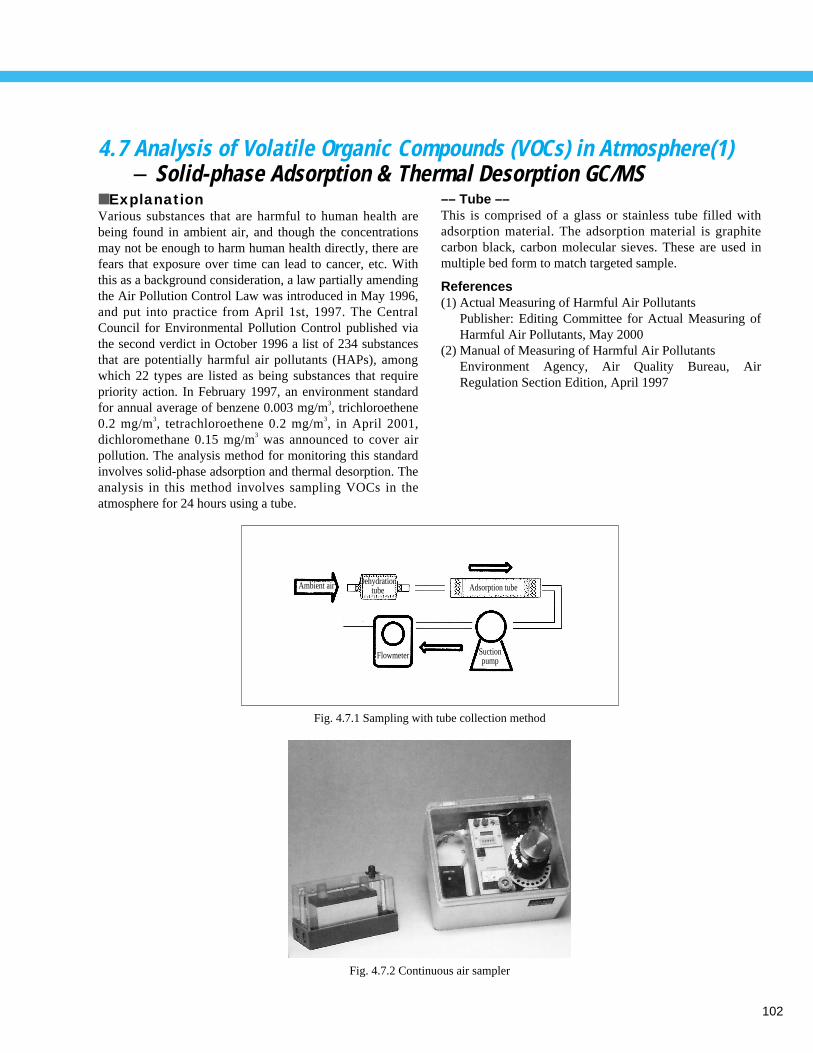
102
4.7 Analysis of Volatile Organic Compounds (VOCs) in Atmosphere(1)- Solid-phase Adsorption & Thermal Desorption GC/MS
■ ExplanationVarious substances that are harmful to human health arebeing found in ambient air, and though the concentrationsmay not be enough to harm human health directly, there arefears that exposure over time can lead to cancer, etc. Withthis as a background consideration, a law partially amendingthe Air Pollution Control Law was introduced in May 1996,and put into practice from April 1st, 1997. The CentralCouncil for Environmental Pollution Control published viathe second verdict in October 1996 a list of 234 substancesthat are potentially harmful air pollutants (HAPs), amongwhich 22 types are listed as being substances that requirepriority action. In February 1997, an environment standardfor annual average of benzene 0.003 mg/m3, trichloroethene0.2 mg/m3, tetrachloroethene 0.2 mg/m3, in April 2001,dichloromethane 0.15 mg/m3 was announced to cover airpollution. The analysis method for monitoring this standardinvolves solid-phase adsorption and thermal desorption. Theanalysis in this method involves sampling VOCs in theatmosphere for 24 hours using a tube.
–– Tube ––This is comprised of a glass or stainless tube filled withadsorption material. The adsorption material is graphitecarbon black, carbon molecular sieves. These are used inmultiple bed form to match targeted sample.
References(1) Actual Measuring of Harmful Air Pollutants
Publisher: Editing Committee for Actual Measuring ofHarmful Air Pollutants, May 2000
(2) Manual of Measuring of Harmful Air PollutantsEnvironment Agency, Air Quality Bureau, AirRegulation Section Edition, April 1997
Fig. 4.7.1 Sampling with tube collection method
Fig. 4.7.2 Continuous air sampler
Dehydration tube
Flowmeter Suctionpump
Adsorption tubeAmbient air
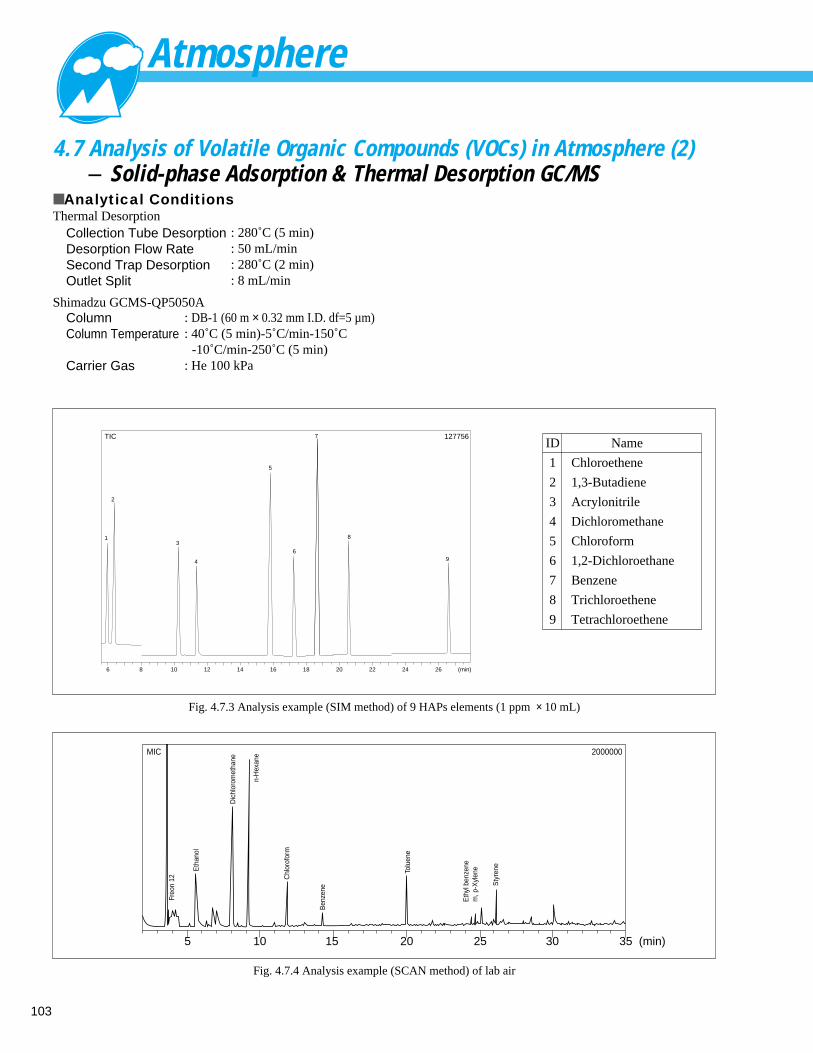
Atmosphere
103
4.7 Analysis of Volatile Organic Compounds (VOCs) in Atmosphere (2)- Solid-phase Adsorption & Thermal Desorption GC/MS
■ Analytical ConditionsThermal Desorption
Collection Tube DesorptionDesorption Flow RateSecond Trap DesorptionOutlet Split
: 280˚C (5 min): 50 mL/min: 280˚C (2 min): 8 mL/min
Shimadzu GCMS-QP5050AColumnColumn Temperature
Carrier Gas
: DB-1 (60 m × 0.32 mm I.D. df=5 µm): 40˚C (5 min)-5˚C/min-150˚C
-10˚C/min-250˚C (5 min): He 100 kPa
5 10 15 20 25 30 35 (min)
MIC 2000000
Freo
n 12
Eth
anol
Dic
hlor
omet
hane
n-H
exan
e
Chl
orof
orm
Ben
zene
Tolu
ene
Eth
yl b
enze
nem
, p-X
ylen
e
Sty
rene
6 8 10 12 14 16 18 20 22 24 26 (min)
2
13
4
5
6
7
8
9
TIC 127756ID
1
2
3
4
5
6
7
8
9
Name
Chloroethene
1,3-Butadiene
Acrylonitrile
Dichloromethane
Chloroform
1,2-Dichloroethane
Benzene
Trichloroethene
Tetrachloroethene
Fig. 4.7.3 Analysis example (SIM method) of 9 HAPs elements (1 ppm × 10 mL)
Fig. 4.7.4 Analysis example (SCAN method) of lab air
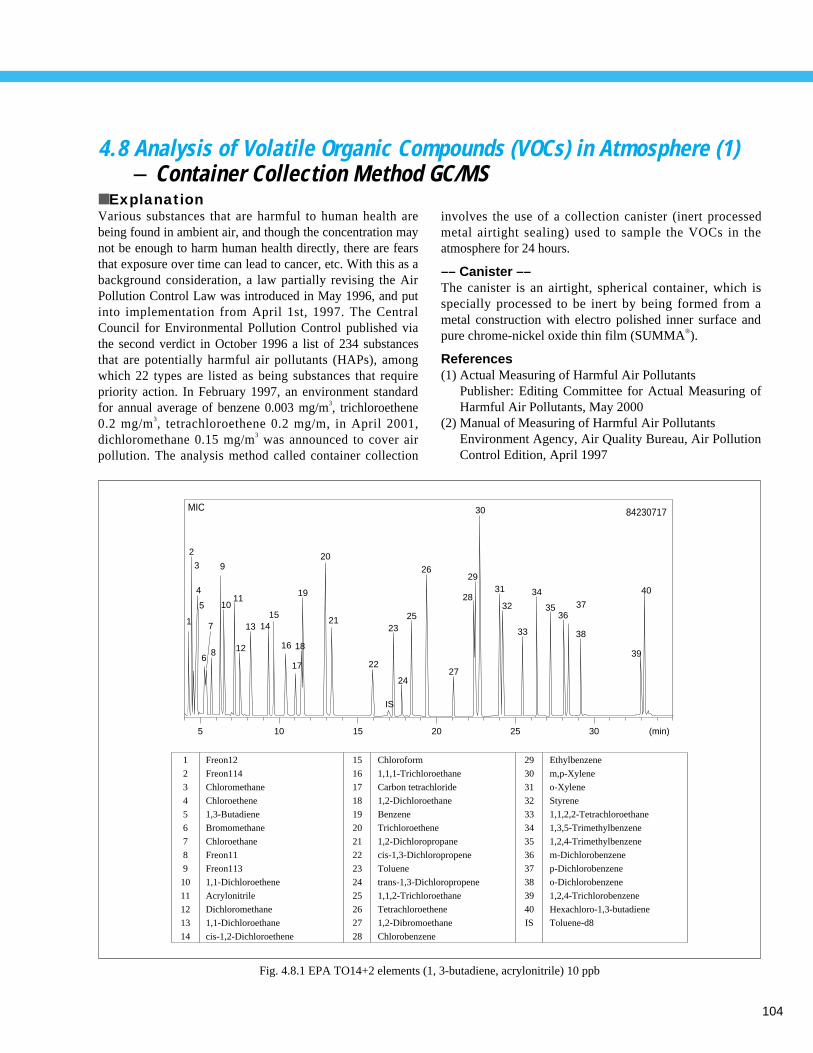
104
4.8 Analysis of Volatile Organic Compounds (VOCs) in Atmosphere (1) - Container Collection Method GC/MS
■ ExplanationVarious substances that are harmful to human health arebeing found in ambient air, and though the concentration maynot be enough to harm human health directly, there are fearsthat exposure over time can lead to cancer, etc. With this as abackground consideration, a law partially revising the AirPollution Control Law was introduced in May 1996, and putinto implementation from April 1st, 1997. The CentralCouncil for Environmental Pollution Control published viathe second verdict in October 1996 a list of 234 substancesthat are potentially harmful air pollutants (HAPs), amongwhich 22 types are listed as being substances that requirepriority action. In February 1997, an environment standardfor annual average of benzene 0.003 mg/m3, trichloroethene0.2 mg/m3, tetrachloroethene 0.2 mg/m, in April 2001,dichloromethane 0.15 mg/m3 was announced to cover airpollution. The analysis method called container collection
5 10 15 20 25 30 (min)
1
2
3
4
5
6
7
8
9
1011
12
13 1415
16
17
18
19
20
21
22
IS
23
24
25
26
30
29
28
27
31
32
33
34
3536
37
38
39
40
MIC 84230717
Fig. 4.8.1 EPA TO14+2 elements (1, 3-butadiene, acrylonitrile) 10 ppb
1
2
3
4
5
6
7
8
9
10
11
12
13
14
Freon12
Freon114
Chloromethane
Chloroethene
1,3-Butadiene
Bromomethane
Chloroethane
Freon11
Freon113
1,1-Dichloroethene
Acrylonitrile
Dichloromethane
1,1-Dichloroethane
cis-1,2-Dichloroethene
15
16
17
18
19
20
21
22
23
24
25
26
27
28
Chloroform
1,1,1-Trichloroethane
Carbon tetrachloride
1,2-Dichloroethane
Benzene
Trichloroethene
1,2-Dichloropropane
cis-1,3-Dichloropropene
Toluene
trans-1,3-Dichloropropene
1,1,2-Trichloroethane
Tetrachloroethene
1,2-Dibromoethane
Chlorobenzene
29
30
31
32
33
34
35
36
37
38
39
40
IS
Ethylbenzene
m,p-Xylene
o-Xylene
Styrene
1,1,2,2-Tetrachloroethane
1,3,5-Trimethylbenzene
1,2,4-Trimethylbenzene
m-Dichlorobenzene
p-Dichlorobenzene
o-Dichlorobenzene
1,2,4-Trichlorobenzene
Hexachloro-1,3-butadiene
Toluene-d8
involves the use of a collection canister (inert processedmetal airtight sealing) used to sample the VOCs in theatmosphere for 24 hours.
–– Canister ––The canister is an airtight, spherical container, which isspecially processed to be inert by being formed from ametal construction with electro polished inner surface andpure chrome-nickel oxide thin film (SUMMA®).
References(1) Actual Measuring of Harmful Air Pollutants
Publisher: Editing Committee for Actual Measuring ofHarmful Air Pollutants, May 2000
(2) Manual of Measuring of Harmful Air PollutantsEnvironment Agency, Air Quality Bureau, Air PollutionControl Edition, April 1997
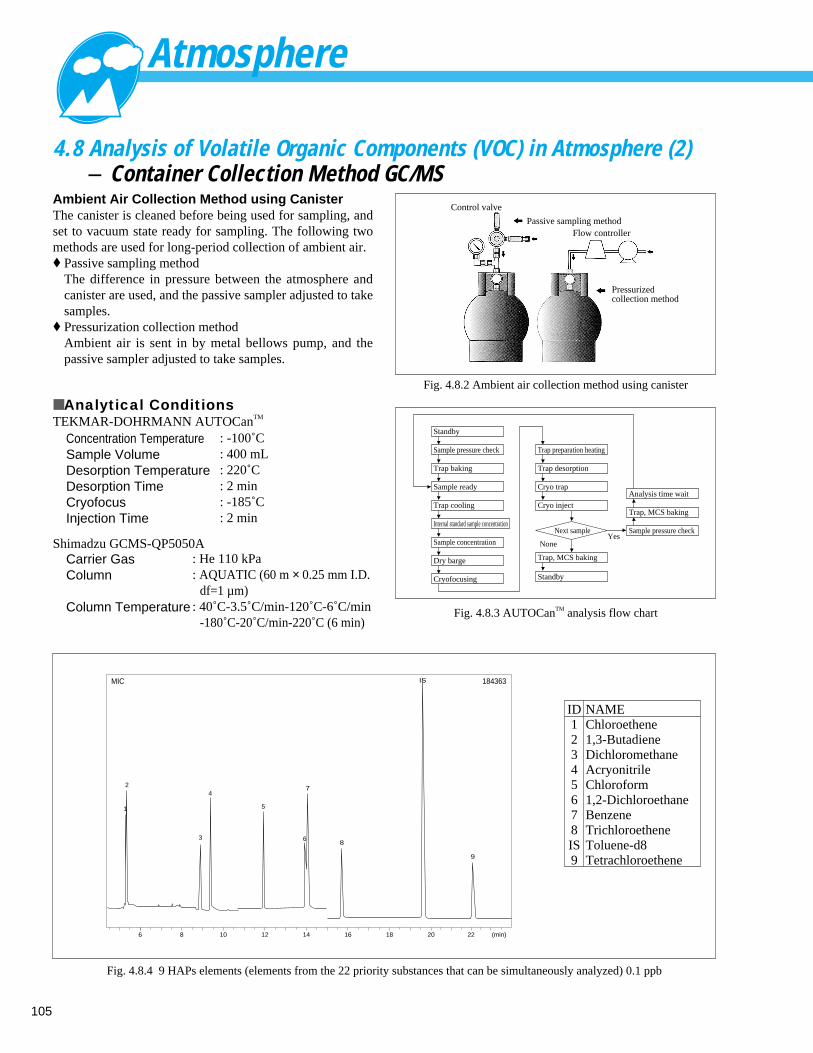
105
4.8 Analysis of Volatile Organic Components (VOC) in Atmosphere (2)- Container Collection Method GC/MS
Standby
Sample pressure check
Trap baking
Sample ready
Trap cooling
Internal standard sample concentration
Sample concentration
Dry barge
Cryofocusing
Trap preparation heating
Trap desorption
Cryo trapAnalysis time wait
Trap, MCS baking
Sample pressure checkYes
None
Cryo inject
Trap, MCS baking
Standby
Next sample
Fig. 4.8.3 AUTOCanTM analysis flow chart
Ambient Air Collection Method using CanisterThe canister is cleaned before being used for sampling, andset to vacuum state ready for sampling. The following twomethods are used for long-period collection of ambient air.♦ Passive sampling method
The difference in pressure between the atmosphere andcanister are used, and the passive sampler adjusted to takesamples.
♦ Pressurization collection methodAmbient air is sent in by metal bellows pump, and thepassive sampler adjusted to take samples.
■ Analytical ConditionsTEKMAR-DOHRMANN AUTOCanTM
Concentration TemperatureSample VolumeDesorption TemperatureDesorption TimeCryofocusInjection Time
: -100˚C: 400 mL: 220˚C: 2 min: -185˚C: 2 min
Shimadzu GCMS-QP5050ACarrier GasColumn
Column Temperature
: He 110 kPa: AQUATIC (60 m × 0.25 mm I.D.
df=1 µm): 40˚C-3.5˚C/min-120˚C-6˚C/min
-180˚C-20˚C/min-220˚C (6 min)
Control valve
Passive sampling methodFlow controller
Pressurizedcollection method
Fig. 4.8.2 Ambient air collection method using canister
6 8 10 12 14 16 18 20 22 (min)
1
2
3
4
5
68
7
IS
9
MIC 184363
Fig. 4.8.4 9 HAPs elements (elements from the 22 priority substances that can be simultaneously analyzed) 0.1 ppb
ID12345678IS9
NAMEChloroethene1,3-ButadieneDichloromethaneAcryonitrileChloroform1,2-DichloroethaneBenzeneTrichloroetheneToluene-d8Tetrachloroethene
Atmosphere
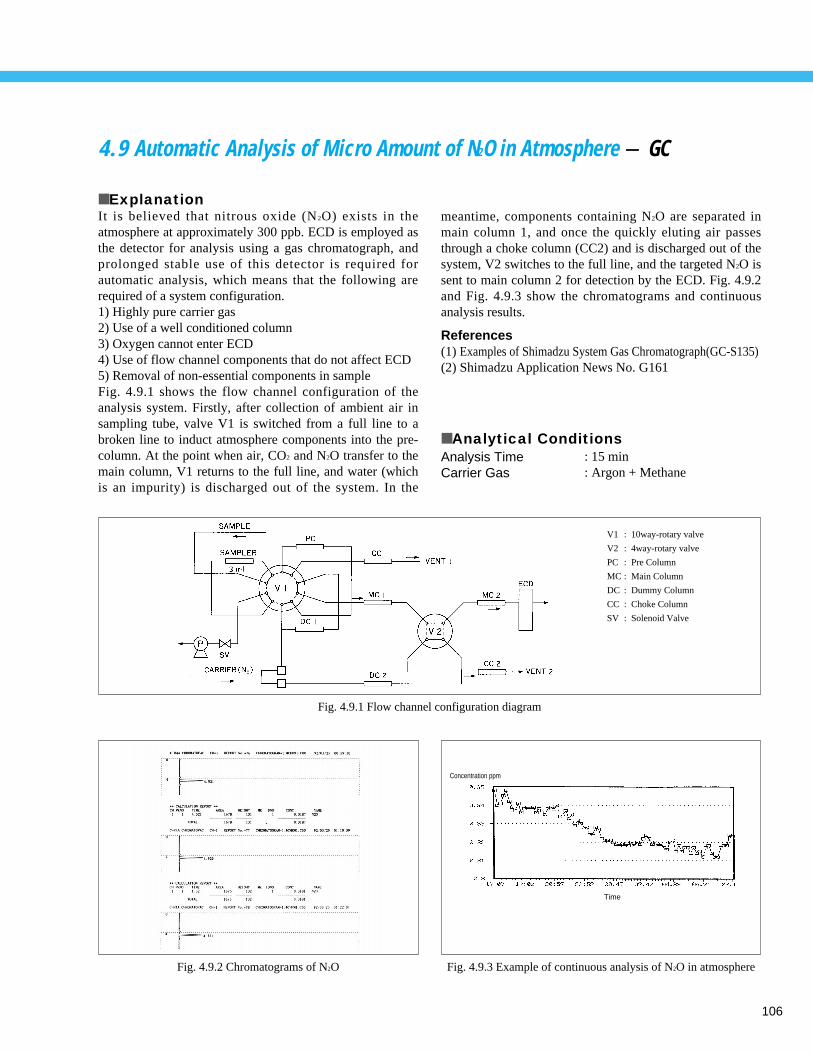
106
Fig. 4.9.1 Flow channel configuration diagram
Fig. 4.9.2 Chromatograms of N2O Fig. 4.9.3 Example of continuous analysis of N2O in atmosphere
V1 : 10way-rotary valve
V2 : 4way-rotary valve
PC : Pre Column
MC : Main Column
DC : Dummy Column
CC : Choke Column
SV : Solenoid Valve
Time
4.9 Automatic Analysis of Micro Amount of N2O in Atmosphere - GC
meantime, components containing N2O are separated inmain column 1, and once the quickly eluting air passesthrough a choke column (CC2) and is discharged out of thesystem, V2 switches to the full line, and the targeted N2O issent to main column 2 for detection by the ECD. Fig. 4.9.2and Fig. 4.9.3 show the chromatograms and continuousanalysis results.
References(1) Examples of Shimadzu System Gas Chromatograph(GC-S135) (2) Shimadzu Application News No. G161
■ Analytical ConditionsAnalysis TimeCarrier Gas
: 15 min: Argon + Methane
■ ExplanationIt is believed that nitrous oxide (N2O) exists in theatmosphere at approximately 300 ppb. ECD is employed asthe detector for analysis using a gas chromatograph, andprolonged stable use of this detector is required forautomatic analysis, which means that the following arerequired of a system configuration.1) Highly pure carrier gas2) Use of a well conditioned column3) Oxygen cannot enter ECD4) Use of flow channel components that do not affect ECD5) Removal of non-essential components in sampleFig. 4.9.1 shows the flow channel configuration of theanalysis system. Firstly, after collection of ambient air insampling tube, valve V1 is switched from a full line to abroken line to induct atmosphere components into the pre-column. At the point when air, CO2 and N2O transfer to themain column, V1 returns to the full line, and water (whichis an impurity) is discharged out of the system. In the
Concentration ppm
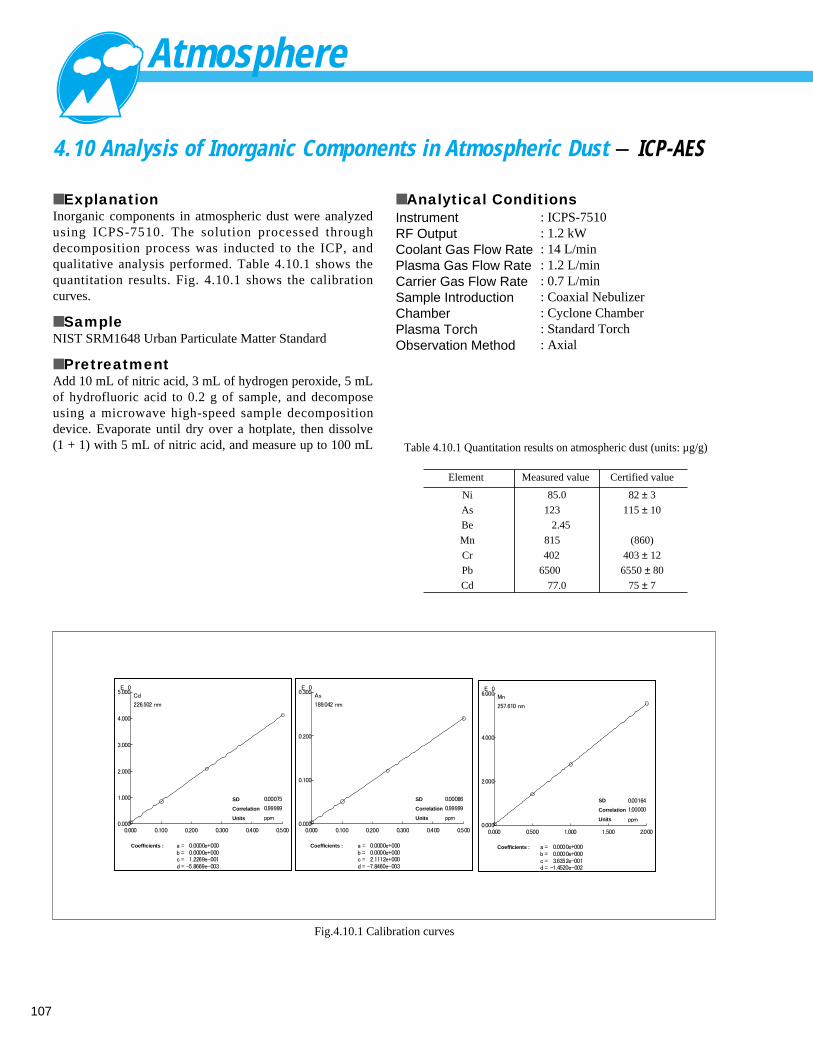
Atmosphere
107
4.10 Analysis of Inorganic Components in Atmospheric Dust - ICP-AES
■ Analytical ConditionsInstrumentRF OutputCoolant Gas Flow Rate Plasma Gas Flow Rate Carrier Gas Flow Rate Sample Introduction ChamberPlasma TorchObservation Method
: ICPS-7510: 1.2 kW: 14 L/min: 1.2 L/min: 0.7 L/min: Coaxial Nebulizer: Cyclone Chamber: Standard Torch: Axial
■ ExplanationInorganic components in atmospheric dust were analyzedusing ICPS-7510. The solution processed throughdecomposition process was inducted to the ICP, andqualitative analysis performed. Table 4.10.1 shows thequantitation results. Fig. 4.10.1 shows the calibrationcurves.
■ SampleNIST SRM1648 Urban Particulate Matter Standard
■ PretreatmentAdd 10 mL of nitric acid, 3 mL of hydrogen peroxide, 5 mLof hydrofluoric acid to 0.2 g of sample, and decomposeusing a microwave high-speed sample decompositiondevice. Evaporate until dry over a hotplate, then dissolve(1 + 1) with 5 mL of nitric acid, and measure up to 100 mL Table 4.10.1 Quantitation results on atmospheric dust (units: µg/g)
Fig.4.10.1 Calibration curves
SD
Correlation
Units
SD
Correlation
Units
SD
Correlation
Units
Coefficients : Coefficients : Coefficients :
Element
Ni
As
Be
Mn
Cr
Pb
Cd
Measured value
85.0
123
2.45
815
402
6500
77.0
Certified value
82 ± 3
115 ± 10
(860)
403 ± 12
6550 ± 80
75 ± 7
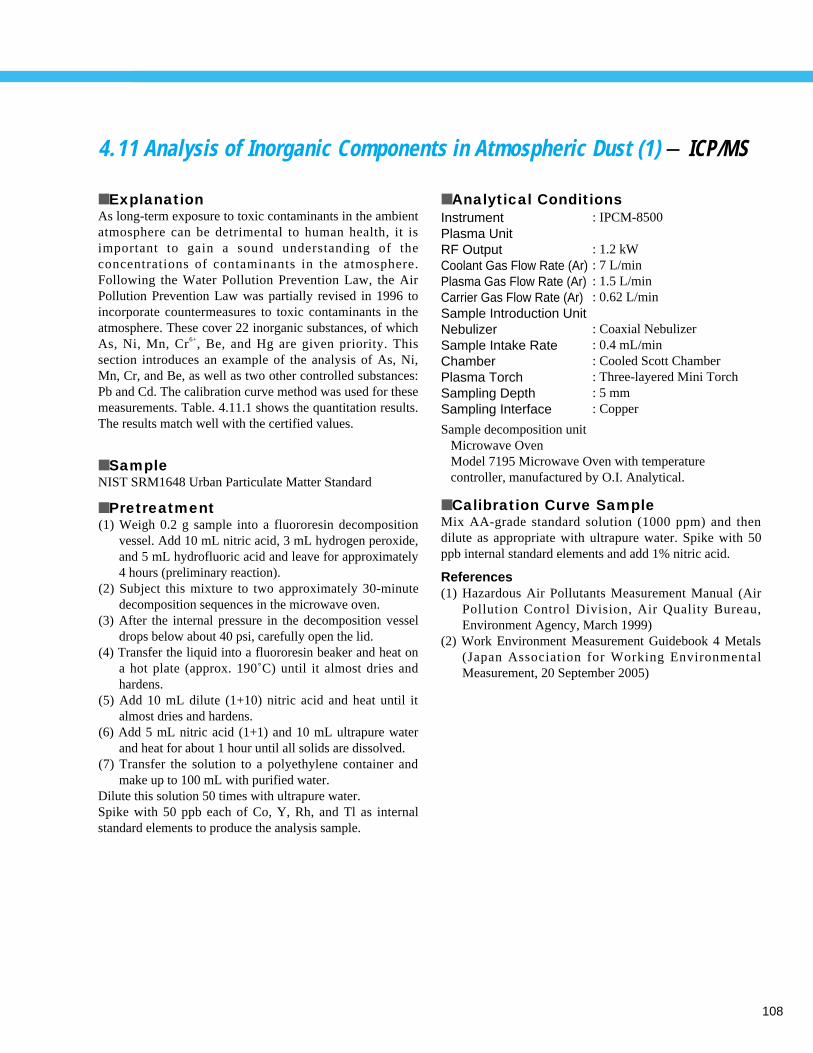
108
4.11 Analysis of Inorganic Components in Atmospheric Dust (1)- ICP/MS
■ Analytical ConditionsInstrumentPlasma Unit RF OutputCoolant Gas Flow Rate (Ar)Plasma Gas Flow Rate (Ar)Carrier Gas Flow Rate (Ar)Sample Introduction UnitNebulizerSample Intake RateChamberPlasma TorchSampling DepthSampling Interface
: IPCM-8500
: 1.2 kW: 7 L/min: 1.5 L/min: 0.62 L/min
: Coaxial Nebulizer: 0.4 mL/min: Cooled Scott Chamber: Three-layered Mini Torch: 5 mm: Copper
■ ExplanationAs long-term exposure to toxic contaminants in the ambientatmosphere can be detrimental to human health, it isimportant to gain a sound understanding of theconcentrations of contaminants in the atmosphere.Following the Water Pollution Prevention Law, the AirPollution Prevention Law was partially revised in 1996 toincorporate countermeasures to toxic contaminants in theatmosphere. These cover 22 inorganic substances, of whichAs, Ni, Mn, Cr6+, Be, and Hg are given priority. Thissection introduces an example of the analysis of As, Ni,Mn, Cr, and Be, as well as two other controlled substances:Pb and Cd. The calibration curve method was used for thesemeasurements. Table. 4.11.1 shows the quantitation results.The results match well with the certified values.
■ SampleNIST SRM1648 Urban Particulate Matter Standard
■ Pretreatment(1) Weigh 0.2 g sample into a fluororesin decomposition
vessel. Add 10 mL nitric acid, 3 mL hydrogen peroxide,and 5 mL hydrofluoric acid and leave for approximately4 hours (preliminary reaction).
(2) Subject this mixture to two approximately 30-minutedecomposition sequences in the microwave oven.
(3) After the internal pressure in the decomposition vesseldrops below about 40 psi, carefully open the lid.
(4) Transfer the liquid into a fluororesin beaker and heat ona hot plate (approx. 190˚C) until it almost dries andhardens.
(5) Add 10 mL dilute (1+10) nitric acid and heat until italmost dries and hardens.
(6) Add 5 mL nitric acid (1+1) and 10 mL ultrapure waterand heat for about 1 hour until all solids are dissolved.
(7) Transfer the solution to a polyethylene container andmake up to 100 mL with purified water.
Dilute this solution 50 times with ultrapure water. Spike with 50 ppb each of Co, Y, Rh, and Tl as internalstandard elements to produce the analysis sample.
Sample decomposition unitMicrowave OvenModel 7195 Microwave Oven with temperature controller, manufactured by O.I. Analytical.
■ Calibration Curve SampleMix AA-grade standard solution (1000 ppm) and thendilute as appropriate with ultrapure water. Spike with 50ppb internal standard elements and add 1% nitric acid.
References(1) Hazardous Air Pollutants Measurement Manual (Air
Pollution Control Division, Air Quality Bureau,Environment Agency, March 1999)
(2) Work Environment Measurement Guidebook 4 Metals(Japan Association for Working EnvironmentalMeasurement, 20 September 2005)
Atmosphere
109
4.11 Analysis of Inorganic Components in Atmospheric Dust (2)- ICP/MS
Fig. 4.11.1 Calibration curves for atmospheric dust
Table 4.11.1 Quantitation results on atmospheric dust (units: µg/g)
Element
Quantitation valueCertified value
Measured value (µg/mL) Converted to solid
SD
Correlation
Units
SD
Correlation
Units
Coefficients :
SD
Correlation
Units
Coefficients :
SD
Correlation
Units
Coefficients :Coefficients :
110
4.12 Analysis of Inorganic Components in Fly Ash (1) - ICP/MS
■ Analytical ConditionsInstrumentPlasma Unit RF OutputCoolant Gas Flow Rate (Ar)Plasma Gas Flow Rate (Ar)Carrier Gas Flow Rate (Ar)Sample Introduction UnitNebulizerSample Intake RateChamberPlasma TorchSampling DepthSampling Interface
: IPCM-8500
: 1.2 kW: 7 L/min: 1.5 L/min: 0.62 L/min
: Coaxial Nebulizer: 0.4 mL/min: Cooled Scott Chamber: Three-layered Mini Torch: 5 mm: Copper
■ ExplanationInorganic components in coal fly ash were analyzed usingShimadzu ICPM-8500. Quantitation was conducted usingthe calibration curve method. Table 4.12.1 shows thequantitation results converted to concentrations in solids.The results match well with the certified values. Fig 4.12.1shows the mass spectrum.
■ SampleNIST SRM1633-b Coal Fly Ash
■ Pretreatment(1) Weigh 0.1 g sample into a fluororesin decomposition
vessel. Add 10 mL nitric acid, 3 mL hydrogen peroxide,and 5 mL hydrofluoric acid and leave for approximately4 hours (preliminary reaction).
(2) Subject this mixture to a decomposition sequence in themicrowave oven.
(3) After the internal pressure in the decomposition vesseldrops below about 40 psi, carefully open the lid.
(4) Transfer the liquid into a fluororesin beaker and heat ona hot plate (approx. 190˚C) to drive off the hydrofluoricacid.
(5) Immediately before it solidifies, add 10 mL dilute(1+10) nitric acid and heat again until it almost dries andhardens.
(6) Add 5 mL nitric acid (1+1) and 10 mL ultrapure waterand heat for about 1 hour until all solids are dissolved.
(7) Transfer the solution to a polyethylene container andmake up to 100 mL with purified water.
Spike with 50 ppb each of Rh and Te as internal standardelements to produce the analysis sample.
Sample decomposition unitMicrowave OvenModel 7195 Microwave Oven with temperature controller, manufactured by O.I. Analytical.
■ Calibration Curve SampleMix AA-grade standard solution (1000 ppm) and then diluteas appropriate with ultrapure water. Spike with 50 ppb Rhand Te internal standard elements and add 1 % nitric acid.
References(1) Hazardous Air Pollutants Measurement Manual (Air
Pollution Control Division, Air Quality Bureau,Environment Agency, March 1999)
(2) Work Environment Measurement Guidebook 4 Metals(Japan Association for Working EnvironmentalMeasurement, 20 September 2005)
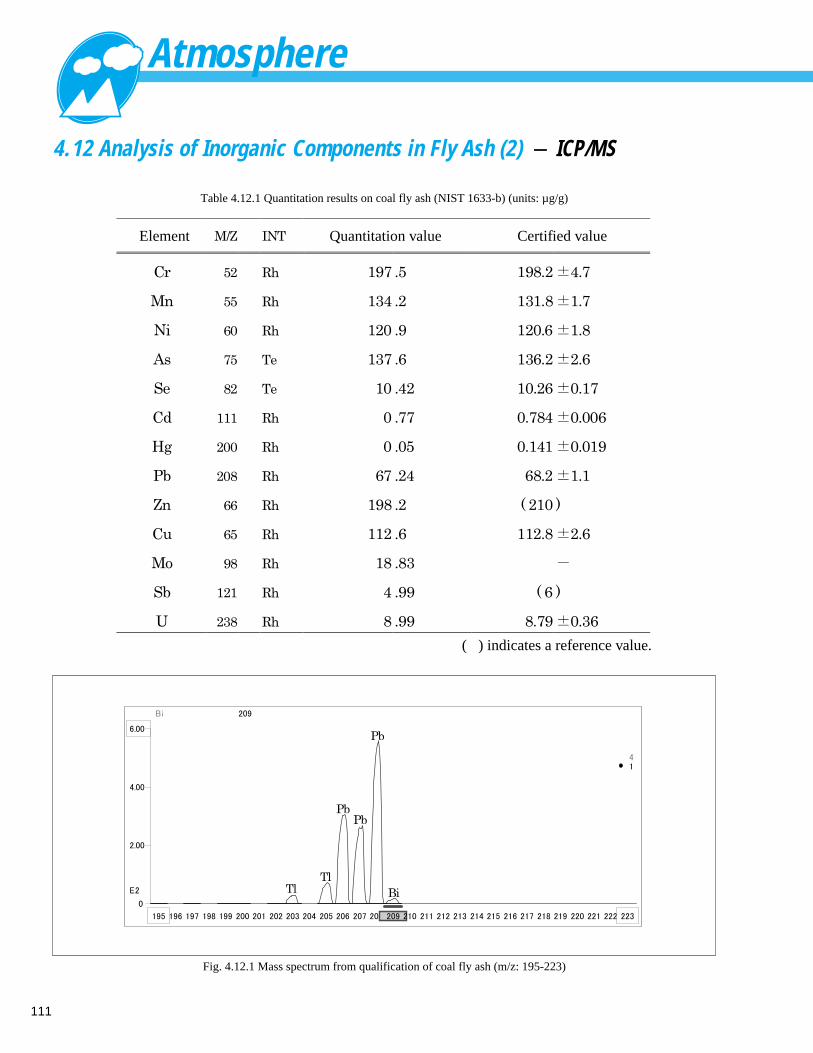
Atmosphere
111
Fig. 4.12.1 Mass spectrum from qualification of coal fly ash (m/z: 195-223)
Table 4.12.1 Quantitation results on coal fly ash (NIST 1633-b) (units: µg/g)
4.12 Analysis of Inorganic Components in Fly Ash (2) - ICP/MS
Element Quantitation value Certified value
( ) indicates a reference value.
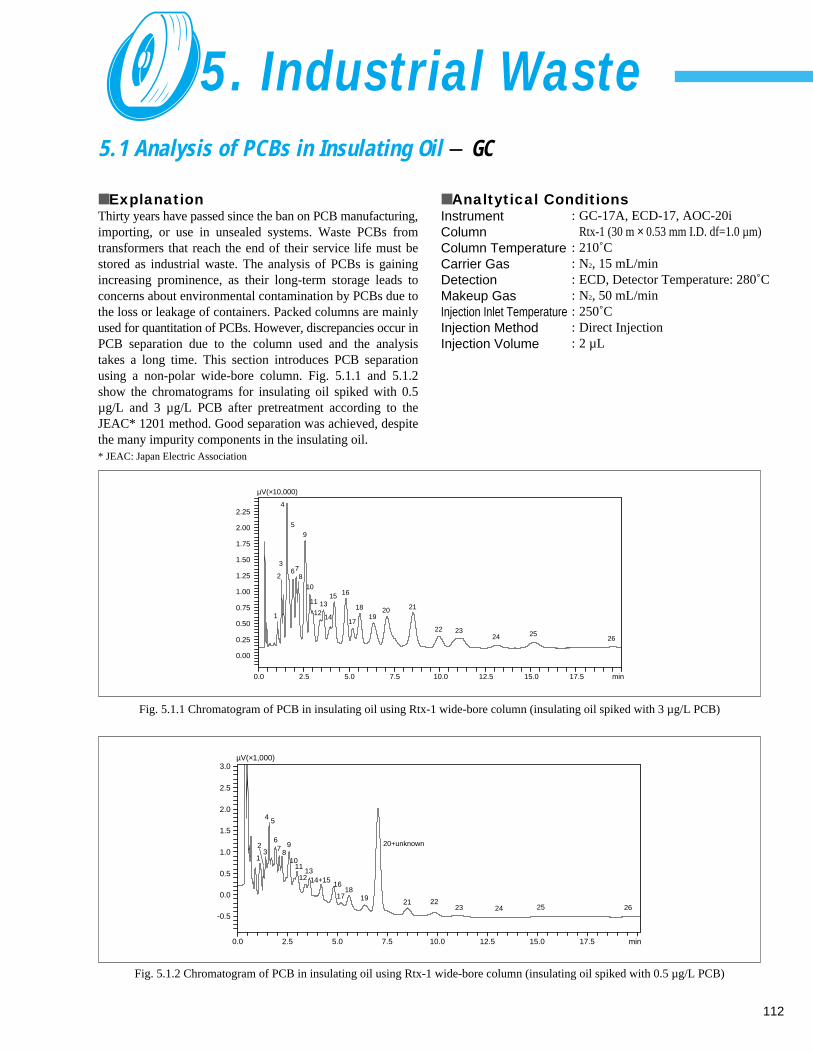
112
5.1 Analysis of PCBs in Insulating Oil - GC
■ ExplanationThirty years have passed since the ban on PCB manufacturing,importing, or use in unsealed systems. Waste PCBs fromtransformers that reach the end of their service life must bestored as industrial waste. The analysis of PCBs is gainingincreasing prominence, as their long-term storage leads toconcerns about environmental contamination by PCBs due tothe loss or leakage of containers. Packed columns are mainlyused for quantitation of PCBs. However, discrepancies occur inPCB separation due to the column used and the analysistakes a long time. This section introduces PCB separationusing a non-polar wide-bore column. Fig. 5.1.1 and 5.1.2show the chromatograms for insulating oil spiked with 0.5µg/L and 3 µg/L PCB after pretreatment according to theJEAC* 1201 method. Good separation was achieved, despitethe many impurity components in the insulating oil. * JEAC: Japan Electric Association
5. Industrial Waste
■ Analtytical ConditionsInstrumentColumnColumn TemperatureCarrier GasDetectionMakeup GasInjection Inlet TemperatureInjection MethodInjection Volume
: GC-17A, ECD-17, AOC-20iRtx-1 (30 m × 0.53 mm I.D. df=1.0 µm)
: 210˚C: N2, 15 mL/min: ECD, Detector Temperature: 280˚C : N2, 50 mL/min: 250˚C : Direct Injection: 2 µL
Fig. 5.1.1 Chromatogram of PCB in insulating oil using Rtx-1 wide-bore column (insulating oil spiked with 3 µg/L PCB)
Fig. 5.1.2 Chromatogram of PCB in insulating oil using Rtx-1 wide-bore column (insulating oil spiked with 0.5 µg/L PCB)
0.0
1
23
4 5
67 8
9
1011
1213
14+1516
1718
19
20+unknown
21 2223 24 25 26
2.5 5.0 7.5 10.0 12.5 15.0 17.5 min
-0.5
0.0
0.5
1.0
1.5
2.0
2.5
3.0µV(×1,000)
0.0 2.5
1
2
3
4
5
678
9
10
11
1213
14
15 16
17
1819
20 21
22 2324 25
26
5.0 7.5 10.0 12.5 15.0 17.5 min
0.00
0.25
0.50
0.75
1.00
1.25
1.50
1.75
2.00
2.25
µV(×10,000)
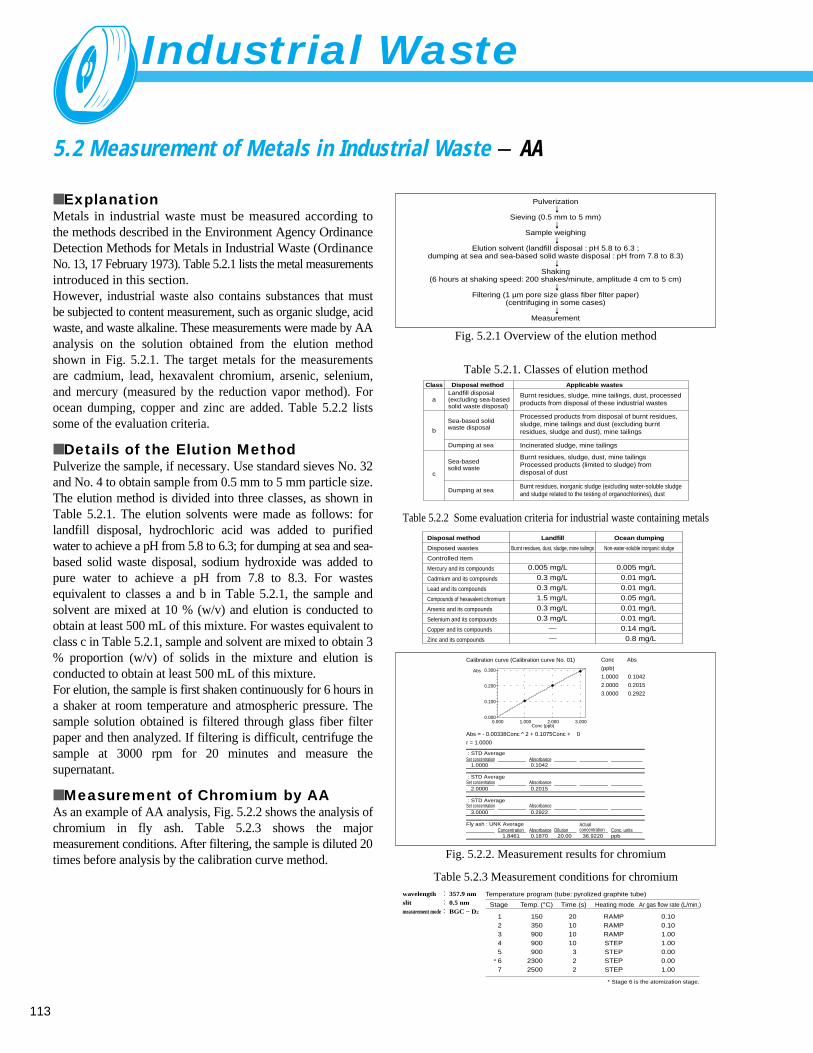
Industrial Waste
113
5.2 Measurement of Metals in Industrial Waste - AA
■ ExplanationMetals in industrial waste must be measured according tothe methods described in the Environment Agency OrdinanceDetection Methods for Metals in Industrial Waste (OrdinanceNo. 13, 17 February 1973). Table 5.2.1 lists the metal measurementsintroduced in this section.However, industrial waste also contains substances that mustbe subjected to content measurement, such as organic sludge, acidwaste, and waste alkaline. These measurements were made by AAanalysis on the solution obtained from the elution methodshown in Fig. 5.2.1. The target metals for the measurementsare cadmium, lead, hexavalent chromium, arsenic, selenium,and mercury (measured by the reduction vapor method). Forocean dumping, copper and zinc are added. Table 5.2.2 listssome of the evaluation criteria.
■ Details of the Elution MethodPulverize the sample, if necessary. Use standard sieves No. 32and No. 4 to obtain sample from 0.5 mm to 5 mm particle size.The elution method is divided into three classes, as shown inTable 5.2.1. The elution solvents were made as follows: forlandfill disposal, hydrochloric acid was added to purifiedwater to achieve a pH from 5.8 to 6.3; for dumping at sea and sea-based solid waste disposal, sodium hydroxide was added topure water to achieve a pH from 7.8 to 8.3. For wastesequivalent to classes a and b in Table 5.2.1, the sample andsolvent are mixed at 10 % (w/v) and elution is conducted toobtain at least 500 mL of this mixture. For wastes equivalent toclass c in Table 5.2.1, sample and solvent are mixed to obtain 3% proportion (w/v) of solids in the mixture and elution isconducted to obtain at least 500 mL of this mixture.For elution, the sample is first shaken continuously for 6 hours ina shaker at room temperature and atmospheric pressure. Thesample solution obtained is filtered through glass fiber filterpaper and then analyzed. If filtering is difficult, centrifuge thesample at 3000 rpm for 20 minutes and measure thesupernatant.
■ Measurement of Chromium by AAAs an example of AA analysis, Fig. 5.2.2 shows the analysis ofchromium in fly ash. Table 5.2.3 shows the majormeasurement conditions. After filtering, the sample is diluted 20times before analysis by the calibration curve method.
Table 5.2.1. Classes of elution method
Fig. 5.2.1 Overview of the elution method
Table 5.2.2 Some evaluation criteria for industrial waste containing metals
Fig. 5.2.2. Measurement results for chromium
Table 5.2.3 Measurement conditions for chromium
Pulverization
Sieving (0.5 mm to 5 mm)
Sample weighing
Elution solvent (landfill disposal : pH 5.8 to 6.3 ;dumping at sea and sea-based solid waste disposal : pH from 7.8 to 8.3)
Shaking(6 hours at shaking speed: 200 shakes/minute, amplitude 4 cm to 5 cm)
Filtering (1 µm pore size glass fiber filter paper)(centrifuging in some cases)
Measurement
Processed products from disposal of burnt residues, sludge, mine tailings and dust (excluding burnt residues, sludge and dust), mine tailings
Landfill disposal(excluding sea-basedsolid waste disposal)
a
b
c
Sea-based solidwaste disposal
Burnt residues, sludge, dust, mine tailings Processed products (limited to sludge) from disposal of dust
Burnt residues, inorganic sludge (excluding water-soluble sludge and sludge related to the testing of organochlorines), dust
Sea-basedsolid waste
Dumping at sea
Dumping at sea
Burnt residues, sludge, mine tailings, dust, processedproducts from disposal of these industrial wastes
Incinerated sludge, mine tailings
Class Disposal method Applicable wastes
0.005 mg/L0.3 mg/L0.3 mg/L1.5 mg/L0.3 mg/L0.3 mg/L
0.005 mg/L0.01 mg/L0.01 mg/L0.05 mg/L0.01 mg/L0.01 mg/L0.14 mg/L
0.8 mg/L
Disposal method
Disposed wastes
Controlled item
Mercury and its compounds
Cadmium and its compounds
Lead and its compounds
Compounds of hexavalent chromium
Arsenic and its compounds
Selenium and its compounds
Copper and its compounds
Zinc and its compounds
Landfill
Burnt residues, dust, sludge, mine tailings
Ocean dumping
Non-water-soluble inorganic sludge
Calibration curve (Calibration curve No. 01) Conc Abs
(ppb)
1.0000 0.1042
2.0000 0.2015
3.0000 0.2922
Abs = - 0.00338Conc ^ 2 + 0.1075Conc + 0
r = 1.0000
0.000 1.000 2.000 3.000Conc (ppb)
0.000
0.100
0.200
0.300Abs
: STD AverageSet concentration Absorbance
Set concentration Absorbance
Set concentration Absorbance
1.0000 0.1042
: STD Average
2.0000 0.2015
: STD Average
3.0000 0.2922
Fly ash : UNK AverageConcentration Absorbance Dilution
Actualconcentration Conc. units
1.8461 0.1870 20.00 36.9220 ppb
wavelengthslitmeasurement mode
357.9 nm0.5 nmBGC – D2
Temperature program (tube: pyrolized graphite tube)
Stage
12345
* 67
150350900900900
23002500
20101010
322
RAMPRAMPRAMPSTEPSTEPSTEPSTEP
0.100.101.001.000.000.001.00
Temp. (°C) Time (s) Heating mode Ar gas flow rate (L/min.)
* Stage 6 is the atomization stage.
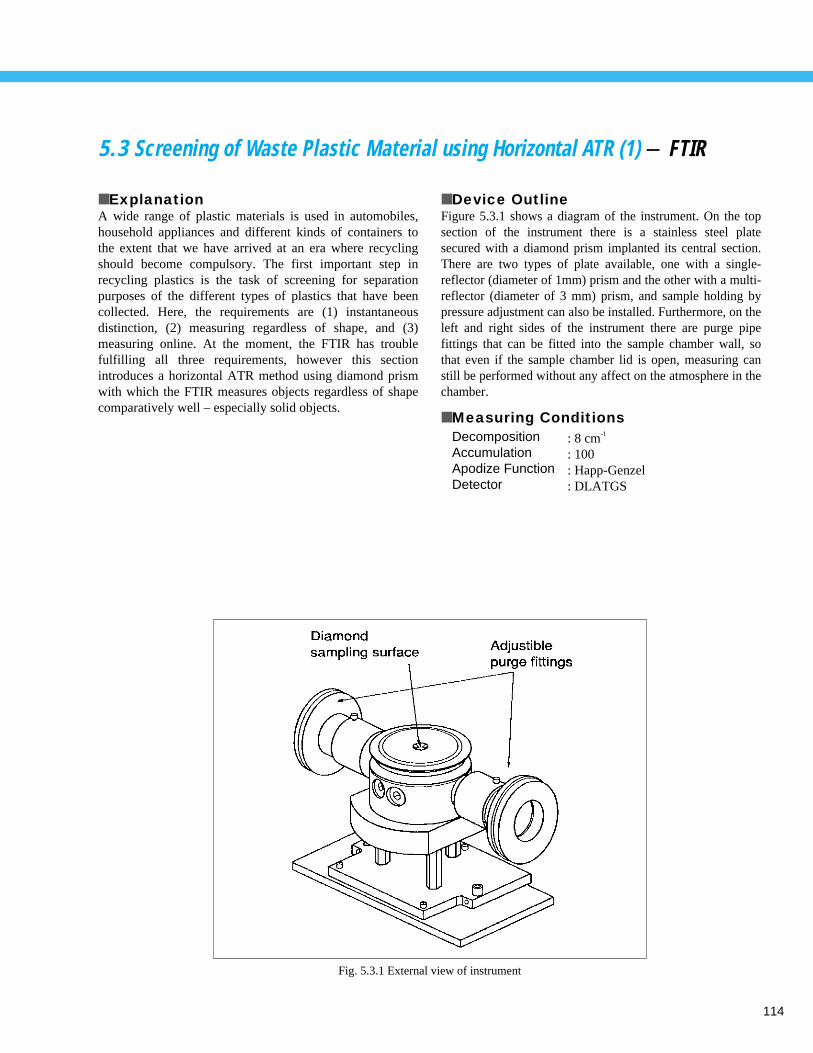
114
5.3 Screening of Waste Plastic Material using Horizontal ATR (1) - FTIR
■ ExplanationA wide range of plastic materials is used in automobiles,household appliances and different kinds of containers tothe extent that we have arrived at an era where recyclingshould become compulsory. The first important step inrecycling plastics is the task of screening for separationpurposes of the different types of plastics that have beencollected. Here, the requirements are (1) instantaneousdistinction, (2) measuring regardless of shape, and (3)measuring online. At the moment, the FTIR has troublefulfilling all three requirements, however this sectionintroduces a horizontal ATR method using diamond prismwith which the FTIR measures objects regardless of shapecomparatively well – especially solid objects.
■ Device OutlineFigure 5.3.1 shows a diagram of the instrument. On the topsection of the instrument there is a stainless steel platesecured with a diamond prism implanted its central section.There are two types of plate available, one with a single-reflector (diameter of 1mm) prism and the other with a multi-reflector (diameter of 3 mm) prism, and sample holding bypressure adjustment can also be installed. Furthermore, on theleft and right sides of the instrument there are purge pipefittings that can be fitted into the sample chamber wall, sothat even if the sample chamber lid is open, measuring canstill be performed without any affect on the atmosphere in thechamber.
■ Measuring Conditions
Fig. 5.3.1 External view of instrument
DecompositionAccumulationApodize FunctionDetector
: 8 cm-1
: 100: Happ-Genzel: DLATGS
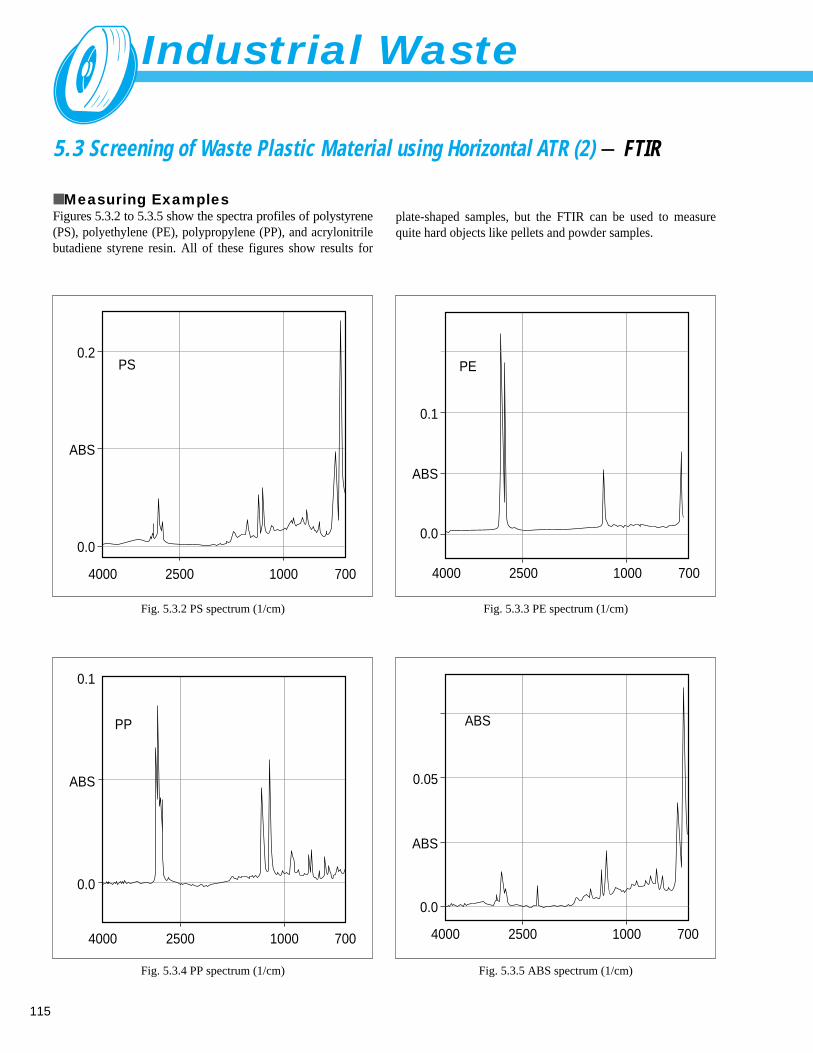
Industrial Waste
115
5.3 Screening of Waste Plastic Material using Horizontal ATR (2) - FTIR
■ Measuring ExamplesFigures 5.3.2 to 5.3.5 show the spectra profiles of polystyrene(PS), polyethylene (PE), polypropylene (PP), and acrylonitrilebutadiene styrene resin. All of these figures show results for
plate-shaped samples, but the FTIR can be used to measurequite hard objects like pellets and powder samples.
Fig. 5.3.2 PS spectrum (1/cm)
0.2
ABS
PS
0.0
2500 1000 7004000
Fig. 5.3.3 PE spectrum (1/cm)
PE
2500 1000 7004000
0.1
ABS
0.0
Fig. 5.3.4 PP spectrum (1/cm)
PP
0.1
2500 1000 7004000
ABS
0.0
Fig. 5.3.5 ABS spectrum (1/cm)
2500 1000 7004000
0.05
ABS
ABS
0.0
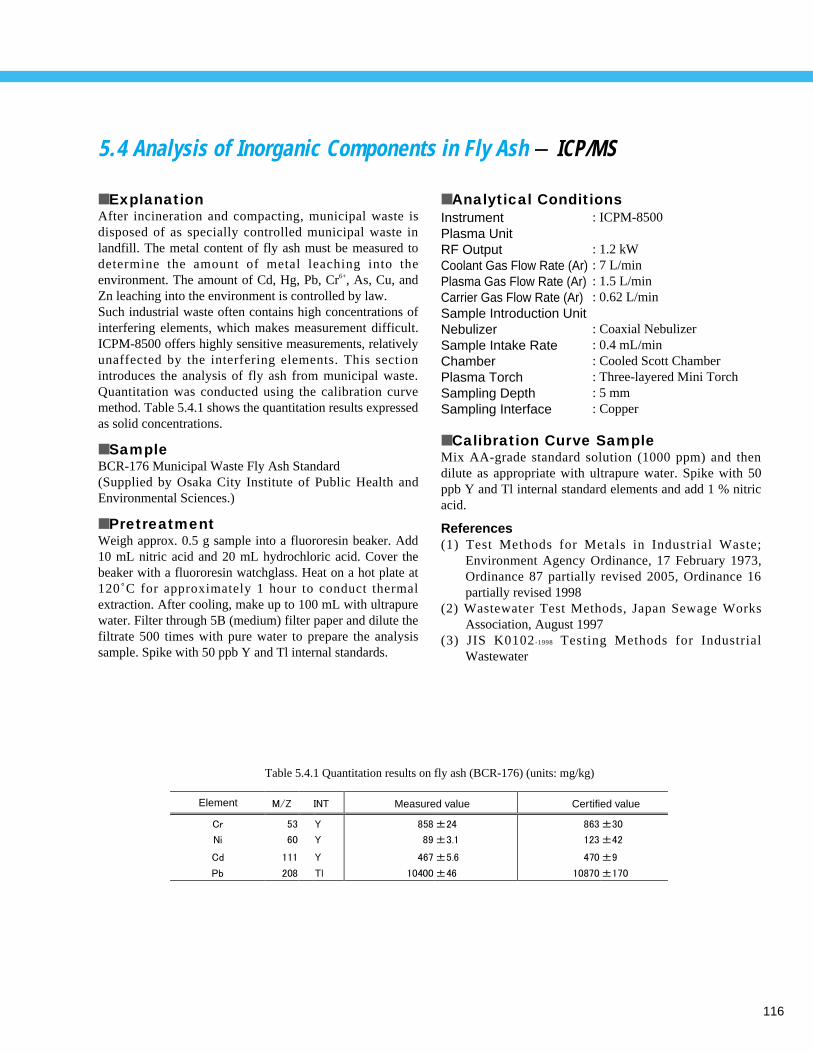
116
5.4 Analysis of Inorganic Components in Fly Ash - ICP/MS
■ Analytical ConditionsInstrumentPlasma Unit RF OutputCoolant Gas Flow Rate (Ar)Plasma Gas Flow Rate (Ar)Carrier Gas Flow Rate (Ar)Sample Introduction UnitNebulizerSample Intake RateChamberPlasma TorchSampling DepthSampling Interface
: ICPM-8500
: 1.2 kW: 7 L/min: 1.5 L/min: 0.62 L/min
: Coaxial Nebulizer: 0.4 mL/min: Cooled Scott Chamber: Three-layered Mini Torch: 5 mm: Copper
■ ExplanationAfter incineration and compacting, municipal waste isdisposed of as specially controlled municipal waste inlandfill. The metal content of fly ash must be measured todetermine the amount of metal leaching into theenvironment. The amount of Cd, Hg, Pb, Cr6+, As, Cu, andZn leaching into the environment is controlled by law. Such industrial waste often contains high concentrations ofinterfering elements, which makes measurement difficult.ICPM-8500 offers highly sensitive measurements, relativelyunaffected by the interfering elements. This sectionintroduces the analysis of fly ash from municipal waste.Quantitation was conducted using the calibration curvemethod. Table 5.4.1 shows the quantitation results expressedas solid concentrations.
■ SampleBCR-176 Municipal Waste Fly Ash Standard(Supplied by Osaka City Institute of Public Health andEnvironmental Sciences.)
■ PretreatmentWeigh approx. 0.5 g sample into a fluororesin beaker. Add10 mL nitric acid and 20 mL hydrochloric acid. Cover thebeaker with a fluororesin watchglass. Heat on a hot plate at120˚C for approximately 1 hour to conduct thermalextraction. After cooling, make up to 100 mL with ultrapurewater. Filter through 5B (medium) filter paper and dilute thefiltrate 500 times with pure water to prepare the analysissample. Spike with 50 ppb Y and Tl internal standards.
■ Calibration Curve SampleMix AA-grade standard solution (1000 ppm) and thendilute as appropriate with ultrapure water. Spike with 50ppb Y and Tl internal standard elements and add 1 % nitricacid.
References(1) Test Methods for Metals in Industrial Waste;
Environment Agency Ordinance, 17 February 1973,Ordinance 87 partially revised 2005, Ordinance 16partially revised 1998
(2) Wastewater Test Methods, Japan Sewage WorksAssociation, August 1997
(3) JIS K0102-1998 Testing Methods for IndustrialWastewater
Certified valueElement Measured value
Table 5.4.1 Quantitation results on fly ash (BCR-176) (units: mg/kg)
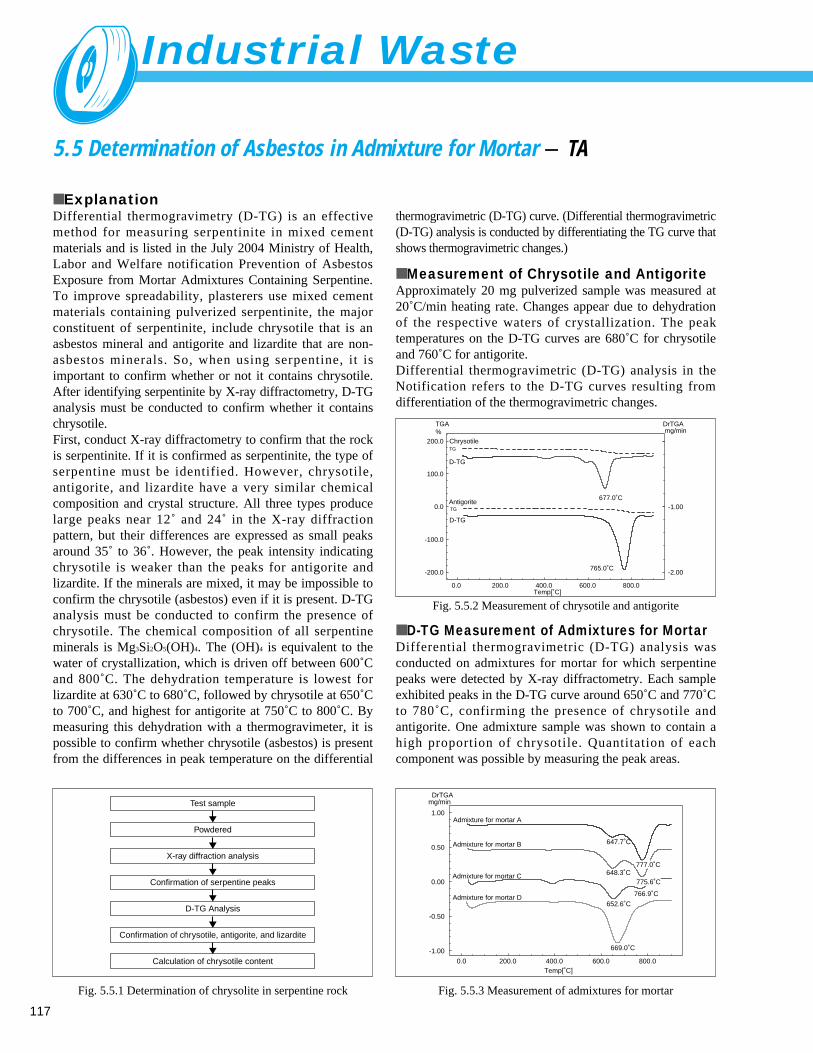
Industrial Waste
117
5.5 Determination of Asbestos in Admixture for Mortar - TA
■ ExplanationDifferential thermogravimetry (D-TG) is an effectivemethod for measuring serpentinite in mixed cementmaterials and is listed in the July 2004 Ministry of Health,Labor and Welfare notification Prevention of AsbestosExposure from Mortar Admixtures Containing Serpentine.To improve spreadability, plasterers use mixed cementmaterials containing pulverized serpentinite, the majorconstituent of serpentinite, include chrysotile that is anasbestos mineral and antigorite and lizardite that are non-asbestos minerals. So, when using serpentine, it isimportant to confirm whether or not it contains chrysotile.After identifying serpentinite by X-ray diffractometry, D-TGanalysis must be conducted to confirm whether it containschrysotile. First, conduct X-ray diffractometry to confirm that the rockis serpentinite. If it is confirmed as serpentinite, the type ofserpentine must be identified. However, chrysotile,antigorite, and lizardite have a very similar chemicalcomposition and crystal structure. All three types producelarge peaks near 12˚ and 24˚ in the X-ray diffractionpattern, but their differences are expressed as small peaksaround 35˚ to 36˚. However, the peak intensity indicatingchrysotile is weaker than the peaks for antigorite andlizardite. If the minerals are mixed, it may be impossible toconfirm the chrysotile (asbestos) even if it is present. D-TGanalysis must be conducted to confirm the presence ofchrysotile. The chemical composition of all serpentineminerals is Mg3Si2O5(OH)4. The (OH)4 is equivalent to thewater of crystallization, which is driven off between 600˚Cand 800˚C. The dehydration temperature is lowest forlizardite at 630˚C to 680˚C, followed by chrysotile at 650˚Cto 700˚C, and highest for antigorite at 750˚C to 800˚C. Bymeasuring this dehydration with a thermogravimeter, it ispossible to confirm whether chrysotile (asbestos) is presentfrom the differences in peak temperature on the differential
thermogravimetric (D-TG) curve. (Differential thermogravimetric(D-TG) analysis is conducted by differentiating the TG curve thatshows thermogravimetric changes.)
■ Measurement of Chrysotile and AntigoriteApproximately 20 mg pulverized sample was measured at20˚C/min heating rate. Changes appear due to dehydrationof the respective waters of crystallization. The peaktemperatures on the D-TG curves are 680˚C for chrysotileand 760˚C for antigorite. Differential thermogravimetric (D-TG) analysis in theNotification refers to the D-TG curves resulting fromdifferentiation of the thermogravimetric changes.
■ D-TG Measurement of Admixtures for MortarDifferential thermogravimetric (D-TG) analysis wasconducted on admixtures for mortar for which serpentinepeaks were detected by X-ray diffractometry. Each sampleexhibited peaks in the D-TG curve around 650˚C and 770˚Cto 780˚C, confirming the presence of chrysotile andantigorite. One admixture sample was shown to contain ahigh proportion of chrysotile. Quantitation of eachcomponent was possible by measuring the peak areas.
0.0 200.0 400.0 600.0 800.0Temp[˚C]
-1.00
-0.50
0.00
0.50
1.00
mg/minDrTGA
669.0˚C
648.3˚C
652.6˚C
766.9˚C
647.7˚C
Admixture for mortar A
Admixture for mortar B
Admixture for mortar C
Admixture for mortar D
775.6˚C
777.0˚C
775.6˚C
777.0˚C
Test sample
Powdered
X-ray diffraction analysis
Confirmation of serpentine peaks
D-TG Analysis
Confirmation of chrysotile, antigorite, and lizardite
Calculation of chrysotile content
Fig. 5.5.1 Determination of chrysolite in serpentine rock Fig. 5.5.3 Measurement of admixtures for mortar
0.0 200.0 400.0 600.0 800.0Temp[˚C]
-200.0
-100.0
0.0
100.0
200.0
TGA%
-2.00
-1.00
mg/minDrTGA
765.0˚C
677.0˚C
Chrysotile
Antigorite
TG
D-TG
TG
D-TG
Fig. 5.5.2 Measurement of chrysotile and antigorite
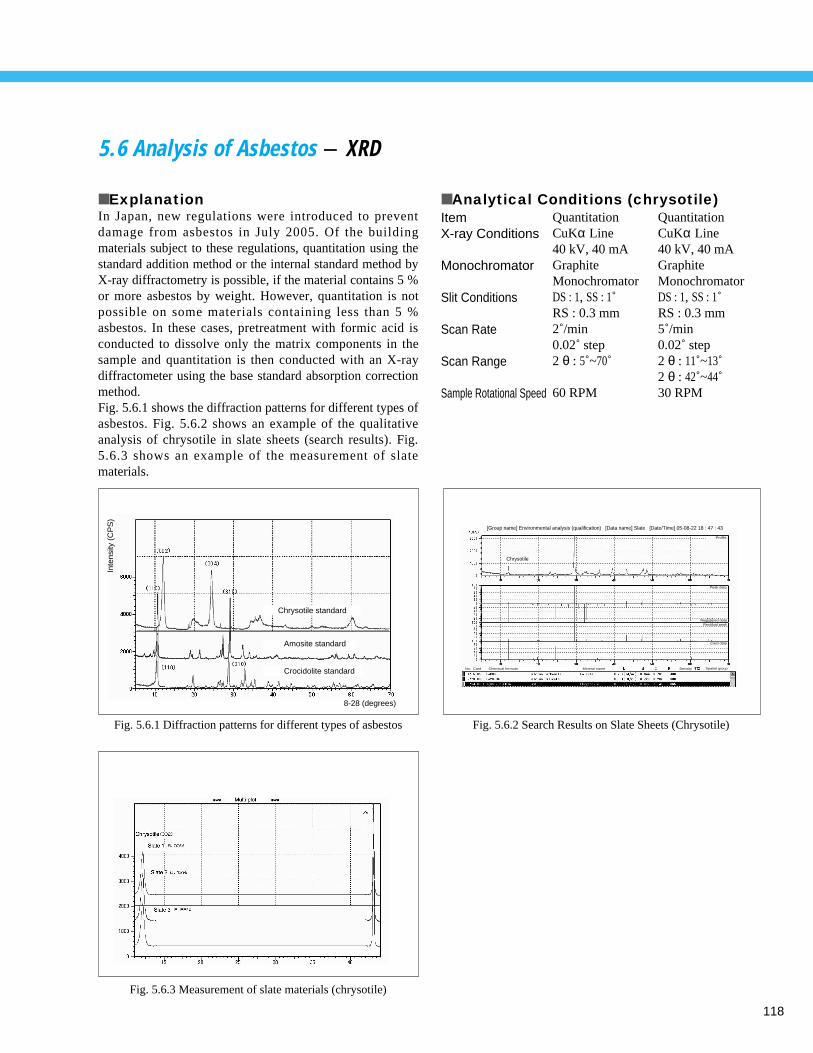
118
5.6 Analysis of Asbestos - XRD
■ Analytical Conditions (chrysotile)ItemX-ray Conditions
Monochromator
Slit Conditions
Scan Rate
Scan Range
Sample Rotational Speed
QuantitationCuKα Line40 kV, 40 mAGraphite MonochromatorDS : 1, SS : 1˚RS : 0.3 mm2˚/min0.02˚ step2 θ : 5˚~70˚
60 RPM
■ ExplanationIn Japan, new regulations were introduced to preventdamage from asbestos in July 2005. Of the buildingmaterials subject to these regulations, quantitation using thestandard addition method or the internal standard method byX-ray diffractometry is possible, if the material contains 5 %or more asbestos by weight. However, quantitation is notpossible on some materials containing less than 5 %asbestos. In these cases, pretreatment with formic acid isconducted to dissolve only the matrix components in thesample and quantitation is then conducted with an X-raydiffractometer using the base standard absorption correctionmethod. Fig. 5.6.1 shows the diffraction patterns for different types ofasbestos. Fig. 5.6.2 shows an example of the qualitativeanalysis of chrysotile in slate sheets (search results). Fig.5.6.3 shows an example of the measurement of slatematerials.
QuantitationCuKα Line40 kV, 40 mAGraphite MonochromatorDS : 1, SS : 1˚RS : 0.3 mm5˚/min0.02˚ step2 θ : 11˚~13˚2 θ : 42˚~44˚30 RPM
Chrysotile standard
Amosite standard
Crocidolite standard
Inte
nsity
(C
PS
)
8-28 (degrees)
[Group name] Environmental analysis (qualification) [Data name] Slate [Date/Time] 05-08-22 18 : 47 : 43
Chrysotile
Peak data
Profile
Registered dataResidual peak
Card data
No. Card Chemical formula Mineral name Density Spatial group
Fig. 5.6.1 Diffraction patterns for different types of asbestos
Fig. 5.6.3 Measurement of slate materials (chrysotile)
Fig. 5.6.2 Search Results on Slate Sheets (Chrysotile)
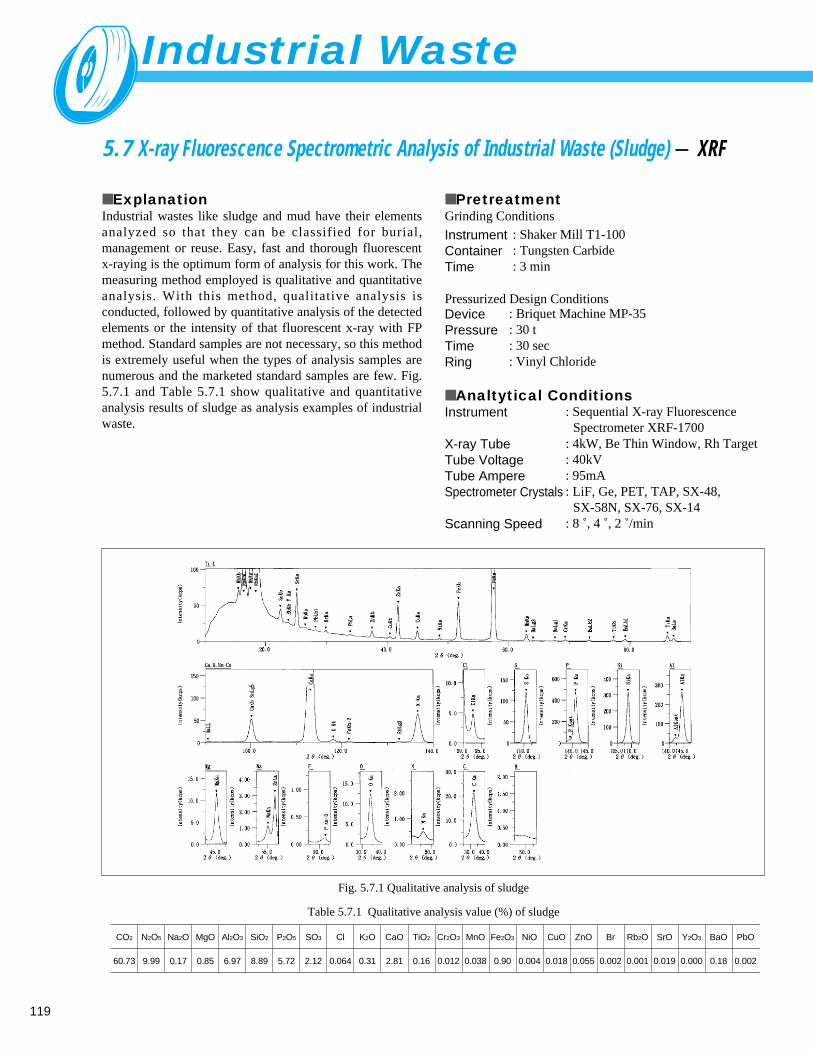
Industrial Waste
119
5.7 X-ray Fluorescence Spectrometric Analysis of Industrial Waste (Sludge) - XRF
Fig. 5.7.1 Qualitative analysis of sludge
Table 5.7.1 Qualitative analysis value (%) of sludge
■ ExplanationIndustrial wastes like sludge and mud have their elementsanalyzed so that they can be classified for burial,management or reuse. Easy, fast and thorough fluorescentx-raying is the optimum form of analysis for this work. Themeasuring method employed is qualitative and quantitativeanalysis. With this method, qualitative analysis isconducted, followed by quantitative analysis of the detectedelements or the intensity of that fluorescent x-ray with FPmethod. Standard samples are not necessary, so this methodis extremely useful when the types of analysis samples arenumerous and the marketed standard samples are few. Fig.5.7.1 and Table 5.7.1 show qualitative and quantitativeanalysis results of sludge as analysis examples of industrialwaste.
■ PretreatmentGrinding Conditions
InstrumentContainerTime
: Shaker Mill T1-100: Tungsten Carbide : 3 min
DevicePressureTimeRing
: Briquet Machine MP-35: 30 t: 30 sec: Vinyl Chloride
■ Analtytical ConditionsInstrument
X-ray TubeTube VoltageTube AmpereSpectrometer Crystals
Scanning Speed
: Sequential X-ray FluorescenceSpectrometer XRF-1700
: 4kW, Be Thin Window, Rh Target: 40kV: 95mA: LiF, Ge, PET, TAP, SX-48,
SX-58N, SX-76, SX-14: 8 ˚, 4 ˚, 2 ˚/min
Pressurized Design Conditions
CO2
60.73
N2O5
9.99
Na2O
0.17
MgO
0.85
Al2O3
6.97
SiO2
8.89
P2O5
5.72
SO3
2.12
Cl
0.064
K2O
0.31
CaO
2.81
TiO2
0.16
Cr2O3
0.012
MnO
0.038
Fe2O3
0.90
NiO
0.004
CuO
0.018
ZnO
0.055
Br
0.002
Rb2O
0.001
SrO
0.019
Y2O3
0.000
BaO
0.18
PbO
0.002
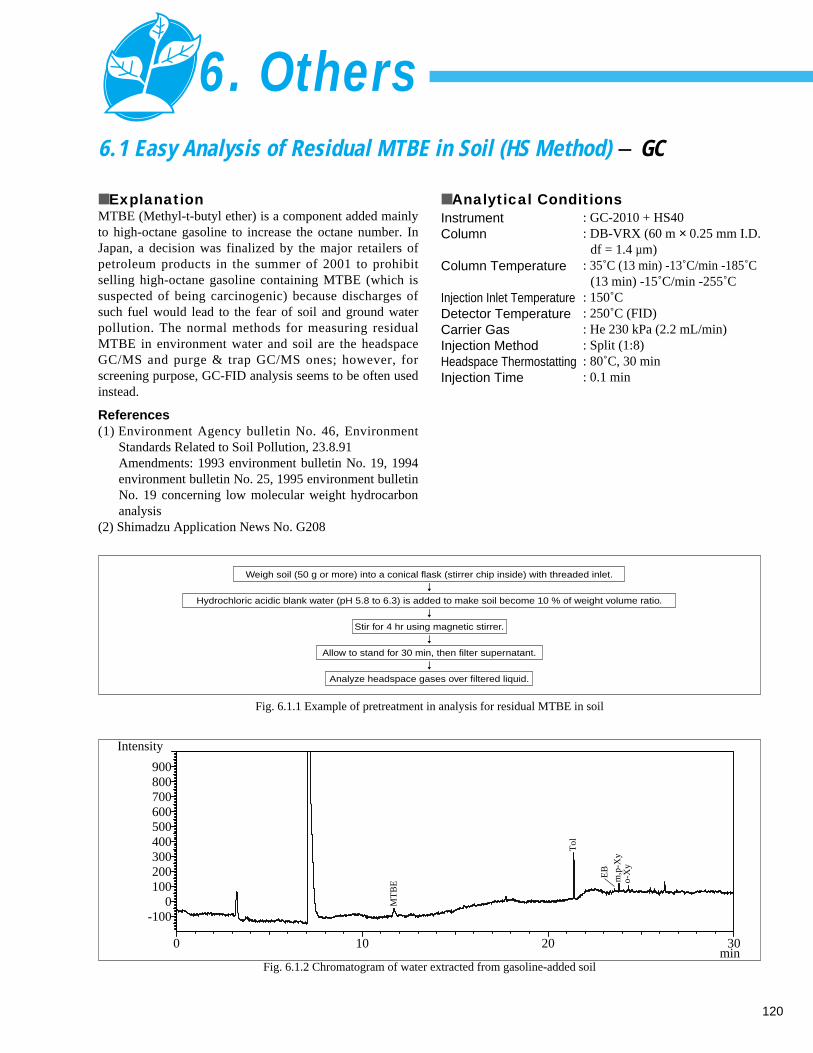
120
6. Others
Weigh soil (50 g or more) into a conical flask (stirrer chip inside) with threaded inlet.
Hydrochloric acidic blank water (pH 5.8 to 6.3) is added to make soil become 10 % of weight volume ratio.
Stir for 4 hr using magnetic stirrer.
Allow to stand for 30 min, then filter supernatant.
Analyze headspace gases over filtered liquid.
Fig. 6.1.1 Example of pretreatment in analysis for residual MTBE in soil
min
Intensity
0 10 20 30
-1000
100200300400500600700800900
MT
BE
Tol
EB
m,p
-Xy
o-X
y
Fig. 6.1.2 Chromatogram of water extracted from gasoline-added soil
6.1 Easy Analysis of Residual MTBE in Soil (HS Method) - GC
■ ExplanationMTBE (Methyl-t-butyl ether) is a component added mainlyto high-octane gasoline to increase the octane number. InJapan, a decision was finalized by the major retailers ofpetroleum products in the summer of 2001 to prohibitselling high-octane gasoline containing MTBE (which issuspected of being carcinogenic) because discharges ofsuch fuel would lead to the fear of soil and ground waterpollution. The normal methods for measuring residualMTBE in environment water and soil are the headspaceGC/MS and purge & trap GC/MS ones; however, forscreening purpose, GC-FID analysis seems to be often usedinstead.
References(1) Environment Agency bulletin No. 46, Environment
Standards Related to Soil Pollution, 23.8.91Amendments: 1993 environment bulletin No. 19, 1994environment bulletin No. 25, 1995 environment bulletinNo. 19 concerning low molecular weight hydrocarbonanalysis
(2) Shimadzu Application News No. G208
■ Analytical ConditionsInstrumentColumn
Column Temperature
Injection Inlet TemperatureDetector TemperatureCarrier GasInjection MethodHeadspace ThermostattingInjection Time
: GC-2010 + HS40: DB-VRX (60 m × 0.25 mm I.D.
df = 1.4 µm): 35˚C (13 min) -13˚C/min -185˚C
(13 min) -15˚C/min -255˚C: 150˚C: 250˚C (FID): He 230 kPa (2.2 mL/min): Split (1:8): 80˚C, 30 min: 0.1 min
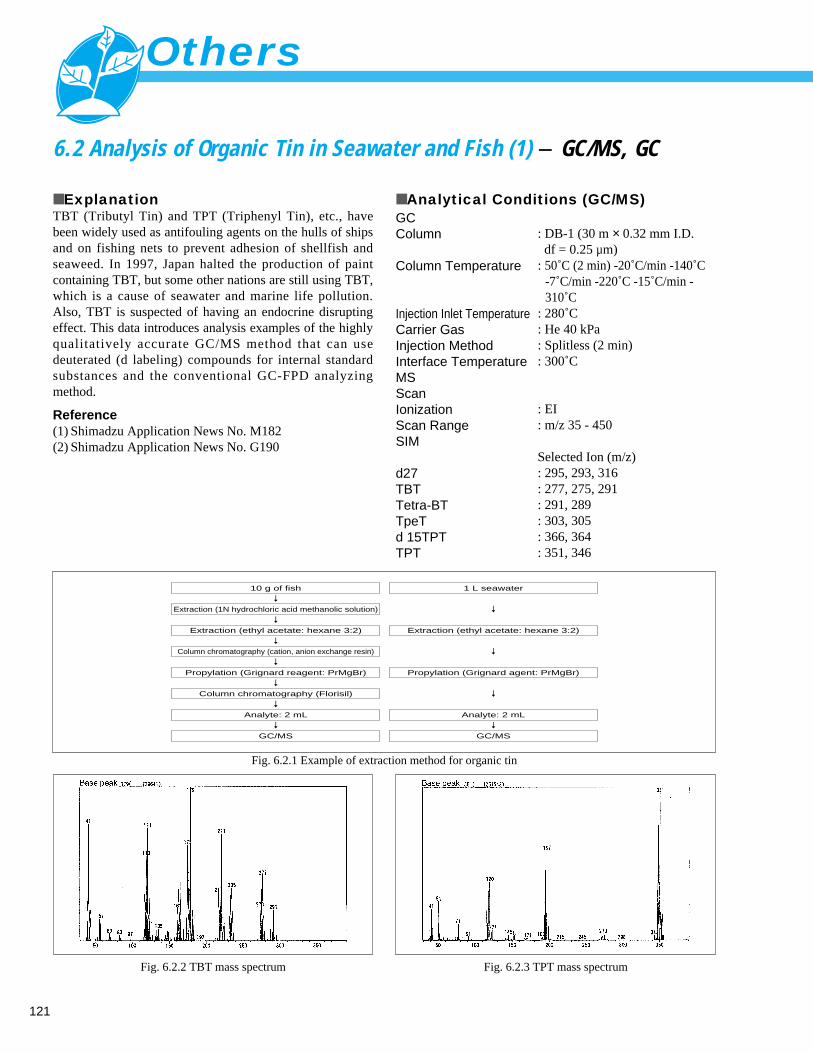
121
10 g of fish
GC/MS
Analyte: 2 mL
Column chromatography (Florisil)
Propylation (Grignard reagent: PrMgBr)
Column chromatography (cation, anion exchange resin)
Extraction (ethyl acetate: hexane 3:2)
Extraction (1N hydrochloric acid methanolic solution)
1 L seawater
GC/MS
Analyte: 2 mL
Propylation (Grignard agent: PrMgBr)
Extraction (ethyl acetate: hexane 3:2)
Fig. 6.2.1 Example of extraction method for organic tin
Fig. 6.2.2 TBT mass spectrum Fig. 6.2.3 TPT mass spectrum
6.2 Analysis of Organic Tin in Seawater and Fish (1) - GC/MS, GC
■ ExplanationTBT (Tributyl Tin) and TPT (Triphenyl Tin), etc., havebeen widely used as antifouling agents on the hulls of shipsand on fishing nets to prevent adhesion of shellfish andseaweed. In 1997, Japan halted the production of paintcontaining TBT, but some other nations are still using TBT,which is a cause of seawater and marine life pollution.Also, TBT is suspected of having an endocrine disruptingeffect. This data introduces analysis examples of the highlyqualitatively accurate GC/MS method that can usedeuterated (d labeling) compounds for internal standardsubstances and the conventional GC-FPD analyzingmethod.
Reference(1) Shimadzu Application News No. M182(2) Shimadzu Application News No. G190
■ Analytical Conditions (GC/MS)GCColumn
Column Temperature
Injection Inlet TemperatureCarrier GasInjection MethodInterface TemperatureMSScanIonizationScan RangeSIM
d27TBTTetra-BTTpeTd 15TPTTPT
: DB-1 (30 m × 0.32 mm I.D. df = 0.25 µm)
: 50˚C (2 min) -20˚C/min -140˚C -7˚C/min -220˚C -15˚C/min -310˚C
: 280˚C: He 40 kPa : Splitless (2 min): 300˚C
: EI: m/z 35 - 450
Selected Ion (m/z): 295, 293, 316 : 277, 275, 291: 291, 289: 303, 305: 366, 364: 351, 346
Others
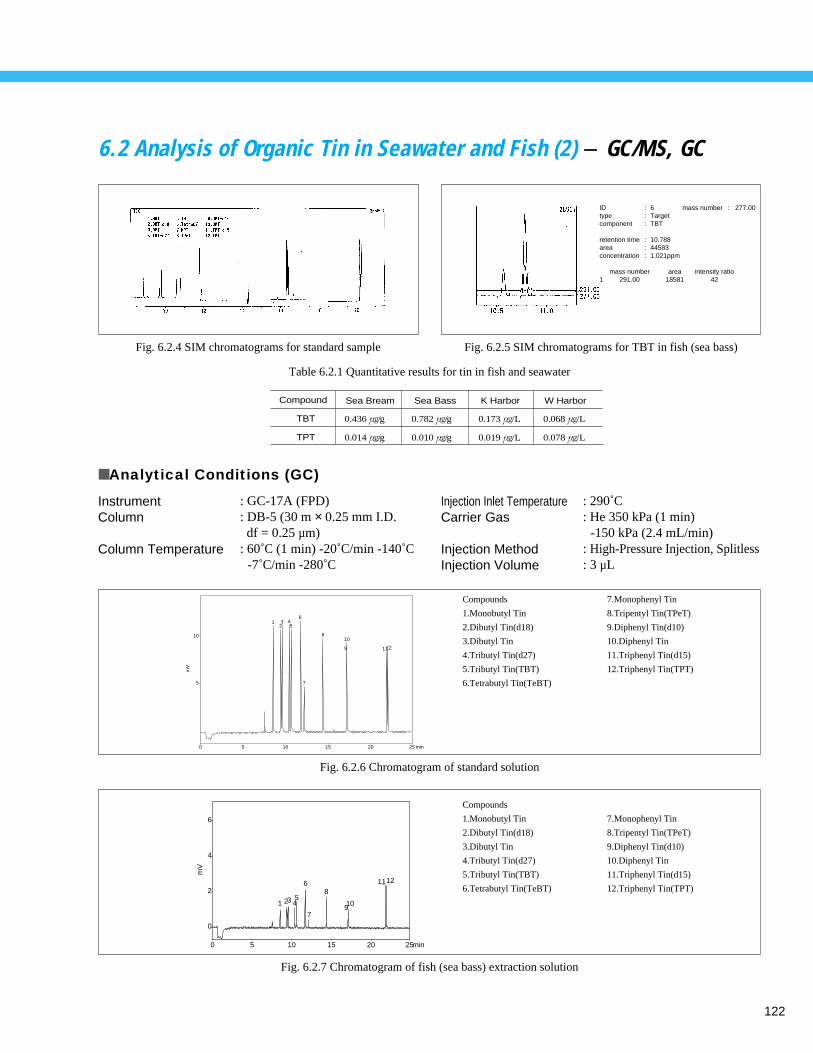
122
■ Analytical Conditions (GC)
Sea Bream
0.436 µ/g
0.014 µ/g
0.782 µ/g
0.010 µ/g
0.173 µ/L
0.019 µ/L
0.068 µ/L
0.078 µ/L
Compound
TBT
TPT
Sea Bass K Harbor W Harbor
0 5 10 15 20 25 min
5
mV
10
123 4
5
6
8
9
7
10
1112
0 5 10 15 20 25min
mV
0
2
1 23 45
6
7
8
910
1112
4
6
Fig. 6.2.4 SIM chromatograms for standard sample Fig. 6.2.5 SIM chromatograms for TBT in fish (sea bass)
Table 6.2.1 Quantitative results for tin in fish and seawater
Fig. 6.2.6 Chromatogram of standard solution
Fig. 6.2.7 Chromatogram of fish (sea bass) extraction solution
Compounds
1.Monobutyl Tin
2.Dibutyl Tin(d18)
3.Dibutyl Tin
4.Tributyl Tin(d27)
5.Tributyl Tin(TBT)
6.Tetrabutyl Tin(TeBT)
7.Monophenyl Tin
8.Tripentyl Tin(TPeT)
9.Diphenyl Tin(d10)
10.Diphenyl Tin
11.Triphenyl Tin(d15)
12.Triphenyl Tin(TPT)
Compounds
1.Monobutyl Tin
2.Dibutyl Tin(d18)
3.Dibutyl Tin
4.Tributyl Tin(d27)
5.Tributyl Tin(TBT)
6.Tetrabutyl Tin(TeBT)
7.Monophenyl Tin
8.Tripentyl Tin(TPeT)
9.Diphenyl Tin(d10)
10.Diphenyl Tin
11.Triphenyl Tin(d15)
12.Triphenyl Tin(TPT)
6.2 Analysis of Organic Tin in Seawater and Fish (2) - GC/MS, GC
InstrumentColumn
Column Temperature
: GC-17A (FPD): DB-5 (30 m × 0.25 mm I.D.
df = 0.25 µm): 60˚C (1 min) -20˚C/min -140˚C
-7˚C/min -280˚C
Injection Inlet TemperatureCarrier Gas
Injection MethodInjection Volume
: 290˚C: He 350 kPa (1 min)
-150 kPa (2.4 mL/min): High-Pressure Injection, Splitless: 3 µL
ID : 6 mass number : 277.00type : Targetcomponent : TBT
retention time : 10.788area : 44583concentration : 1.021ppm
mass number area intensity ratio1 291.00 18581 42
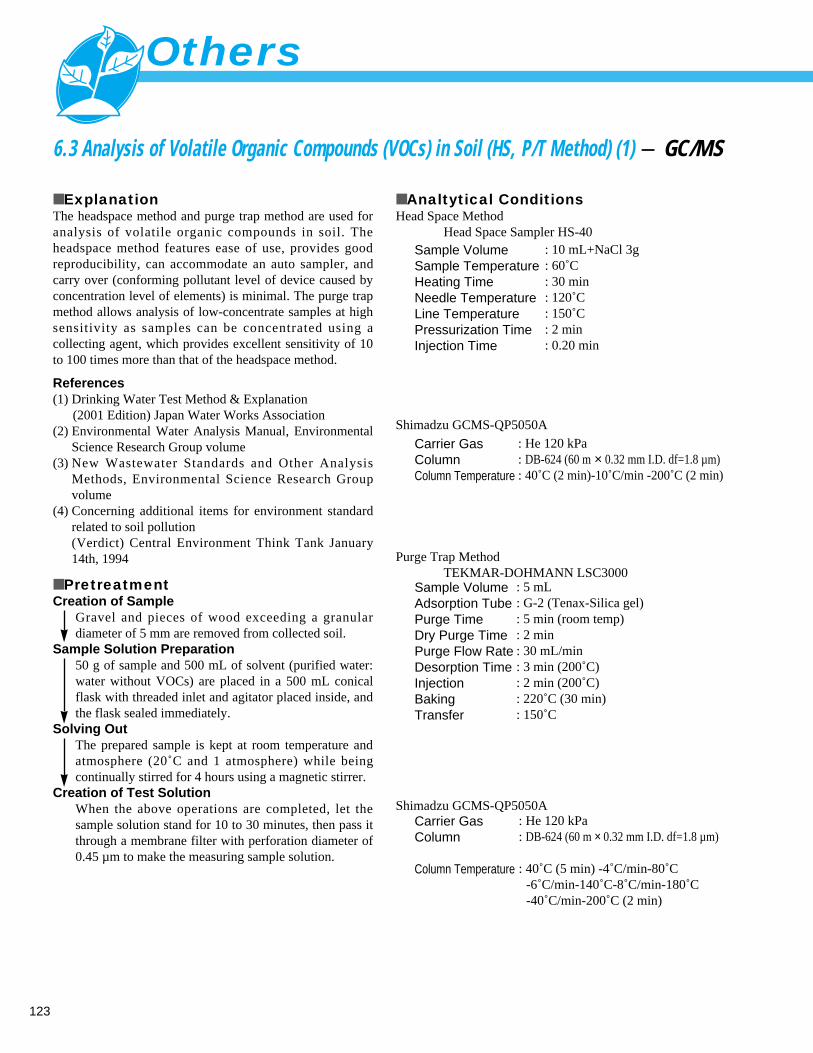
123
6.3 Analysis of Volatile Organic Compounds (VOCs) in Soil (HS, P/T Method) (1) - GC/MS
■ ExplanationThe headspace method and purge trap method are used foranalysis of volatile organic compounds in soil. Theheadspace method features ease of use, provides goodreproducibility, can accommodate an auto sampler, andcarry over (conforming pollutant level of device caused byconcentration level of elements) is minimal. The purge trapmethod allows analysis of low-concentrate samples at highsensitivity as samples can be concentrated using acollecting agent, which provides excellent sensitivity of 10to 100 times more than that of the headspace method.
References(1) Drinking Water Test Method & Explanation
(2001 Edition) Japan Water Works Association(2) Environmental Water Analysis Manual, Environmental
Science Research Group volume(3) New Wastewater Standards and Other Analysis
Methods, Environmental Science Research Groupvolume
(4) Concerning additional items for environment standardrelated to soil pollution(Verdict) Central Environment Think Tank January14th, 1994
■ PretreatmentCreation of Sample
Gravel and pieces of wood exceeding a granulardiameter of 5 mm are removed from collected soil.
Sample Solution Preparation50 g of sample and 500 mL of solvent (purified water:water without VOCs) are placed in a 500 mL conicalflask with threaded inlet and agitator placed inside, andthe flask sealed immediately.
Solving OutThe prepared sample is kept at room temperature andatmosphere (20˚C and 1 atmosphere) while beingcontinually stirred for 4 hours using a magnetic stirrer.
Creation of Test SolutionWhen the above operations are completed, let thesample solution stand for 10 to 30 minutes, then pass itthrough a membrane filter with perforation diameter of0.45 µm to make the measuring sample solution.
■ Analtytical ConditionsHead Space Method
Head Space Sampler HS-40Sample VolumeSample TemperatureHeating TimeNeedle TemperatureLine TemperaturePressurization TimeInjection Time
: 10 mL+NaCl 3g: 60˚C: 30 min: 120˚C: 150˚C: 2 min: 0.20 min
Shimadzu GCMS-QP5050A
Carrier GasColumnColumn Temperature
: He 120 kPa: DB-624 (60 m × 0.32 mm I.D. df=1.8 µm): 40˚C (2 min)-10˚C/min -200˚C (2 min)
Purge Trap MethodTEKMAR-DOHMANN LSC3000
Sample VolumeAdsorption TubePurge TimeDry Purge TimePurge Flow RateDesorption TimeInjectionBakingTransfer
: 5 mL: G-2 (Tenax-Silica gel): 5 min (room temp): 2 min: 30 mL/min: 3 min (200˚C): 2 min (200˚C): 220˚C (30 min): 150˚C
Shimadzu GCMS-QP5050ACarrier GasColumn
Column Temperature
: He 120 kPa: DB-624 (60 m × 0.32 mm I.D. df=1.8 µm)
: 40˚C (5 min) -4˚C/min-80˚C-6˚C/min-140˚C-8˚C/min-180˚C-40˚C/min-200˚C (2 min)
Others
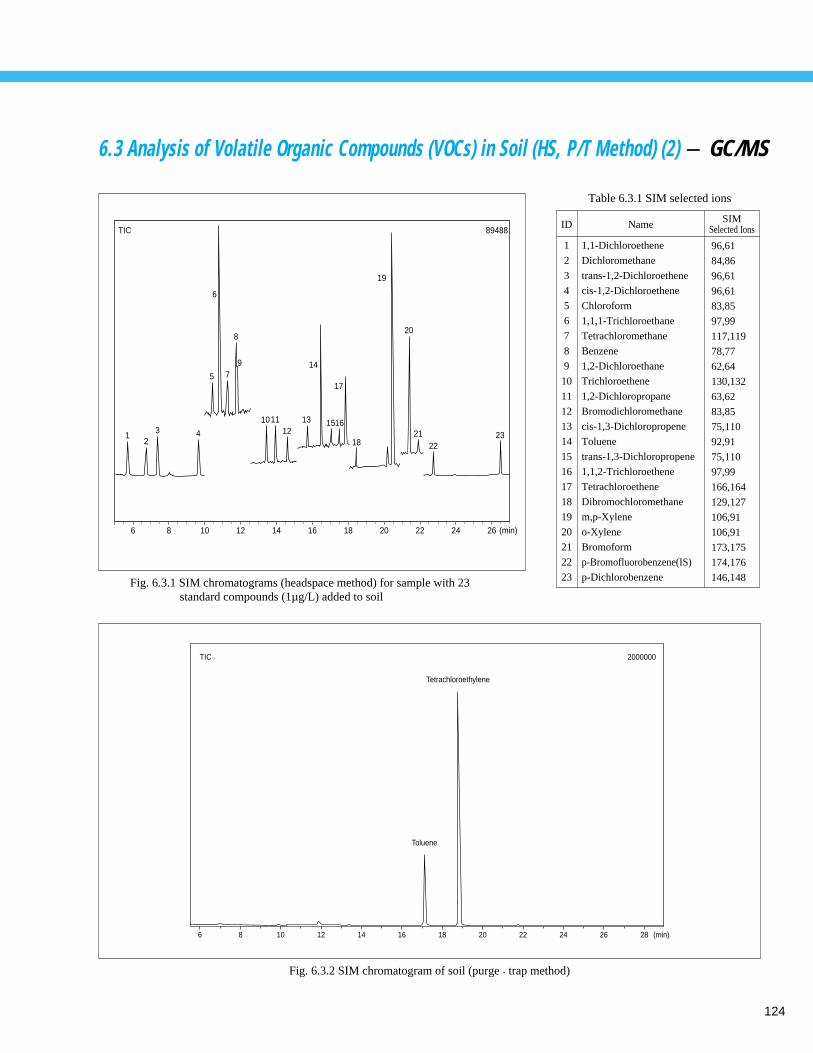
124
6.3 Analysis of Volatile Organic Compounds (VOCs) in Soil (HS, P/T Method) (2) - GC/MS
6 8 10 12 14 16 18 20 22 24 26 (min)
12
3 4
5
6
TIC 89488
7
8
9
101112
13
14
15
17
16
18
19
20
2122
23
Fig. 6.3.1 SIM chromatograms (headspace method) for sample with 23standard compounds (1µg/L) added to soil
TIC
Toluene
Tetrachloroethylene
2000000
6 8 10 12 14 16 18 20 22 24 26 28 (min)
Fig. 6.3.2 SIM chromatogram of soil (purge . trap method)
1
2
3
4
5
6
7
8
9
10
11
12
13
14
15
16
17
18
19
20
21
22
23
ID
1,1-Dichloroethene
Dichloromethane
trans-1,2-Dichloroethene
cis-1,2-Dichloroethene
Chloroform
1,1,1-Trichloroethane
Tetrachloromethane
Benzene
1,2-Dichloroethane
Trichloroethene
1,2-Dichloropropane
Bromodichloromethane
cis-1,3-Dichloropropene
Toluene
trans-1,3-Dichloropropene
1,1,2-Trichloroethene
Tetrachloroethene
Dibromochloromethane
m,p-Xylene
o-Xylene
Bromoform
p-Bromofluorobenzene(IS)
p-Dichlorobenzene
Name
96,61
84,86
96,61
96,61
83,85
97,99
117,119
78,77
62,64
130,132
63,62
83,85
75,110
92,91
75,110
97,99
166,164
129,127
106,91
106,91
173,175
174,176
146,148
SIMSelected Ions
Table 6.3.1 SIM selected ions
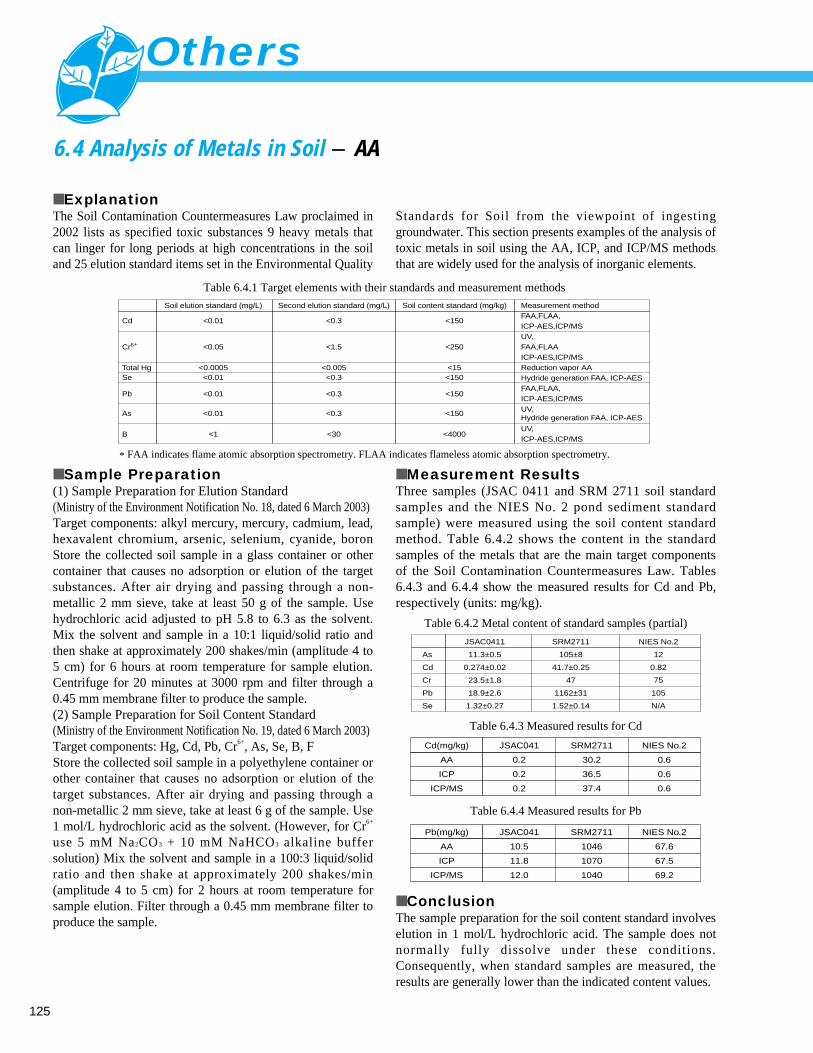
125
Others
6.4 Analysis of Metals in Soil - AA
■ ExplanationThe Soil Contamination Countermeasures Law proclaimed in2002 lists as specified toxic substances 9 heavy metals thatcan linger for long periods at high concentrations in the soiland 25 elution standard items set in the Environmental Quality
Standards for Soil from the viewpoint of ingestinggroundwater. This section presents examples of the analysis oftoxic metals in soil using the AA, ICP, and ICP/MS methodsthat are widely used for the analysis of inorganic elements.
■ Sample Preparation(1) Sample Preparation for Elution Standard(Ministry of the Environment Notification No. 18, dated 6 March 2003)Target components: alkyl mercury, mercury, cadmium, lead,hexavalent chromium, arsenic, selenium, cyanide, boronStore the collected soil sample in a glass container or othercontainer that causes no adsorption or elution of the targetsubstances. After air drying and passing through a non-metallic 2 mm sieve, take at least 50 g of the sample. Usehydrochloric acid adjusted to pH 5.8 to 6.3 as the solvent.Mix the solvent and sample in a 10:1 liquid/solid ratio andthen shake at approximately 200 shakes/min (amplitude 4 to5 cm) for 6 hours at room temperature for sample elution.Centrifuge for 20 minutes at 3000 rpm and filter through a0.45 mm membrane filter to produce the sample.(2) Sample Preparation for Soil Content Standard(Ministry of the Environment Notification No. 19, dated 6 March 2003)Target components: Hg, Cd, Pb, Cr6+, As, Se, B, FStore the collected soil sample in a polyethylene container orother container that causes no adsorption or elution of thetarget substances. After air drying and passing through anon-metallic 2 mm sieve, take at least 6 g of the sample. Use1 mol/L hydrochloric acid as the solvent. (However, for Cr6+
use 5 mM Na2CO3 + 10 mM NaHCO3 alkaline buffersolution) Mix the solvent and sample in a 100:3 liquid/solidratio and then shake at approximately 200 shakes/min(amplitude 4 to 5 cm) for 2 hours at room temperature forsample elution. Filter through a 0.45 mm membrane filter toproduce the sample.
■ Measurement ResultsThree samples (JSAC 0411 and SRM 2711 soil standardsamples and the NIES No. 2 pond sediment standardsample) were measured using the soil content standardmethod. Table 6.4.2 shows the content in the standardsamples of the metals that are the main target componentsof the Soil Contamination Countermeasures Law. Tables6.4.3 and 6.4.4 show the measured results for Cd and Pb,respectively (units: mg/kg).
■ ConclusionThe sample preparation for the soil content standard involveselution in 1 mol/L hydrochloric acid. The sample does notnormally fully dissolve under these conditions.Consequently, when standard samples are measured, theresults are generally lower than the indicated content values.
Table 6.4.2 Metal content of standard samples (partial)
Table 6.4.3 Measured results for Cd
Table 6.4.4 Measured results for Pb
Table 6.4.1 Target elements with their standards and measurement methods
Cd
Cr6+
Total HgSe
Pb
As
B
Measurement methodFAA,FLAA,ICP-AES,ICP/MSUV,FAA,FLAAICP-AES,ICP/MSReduction vapor AAHydride generation FAA, ICP-AESFAA,FLAA,ICP-AES,ICP/MSUV,Hydride generation FAA, ICP-AES
UV,ICP-AES,ICP/MS
Soil content standard (mg/kg)
<150
<250
<15<150
<150
<150
<4000
Second elution standard (mg/L)
<0.3
<1.5
<0.005<0.3
<0.3
<0.3
<30
Soil elution standard (mg/L)
<0.01
<0.05
<0.0005<0.01
<0.01
<0.01
<1
As
Cd
Cr
Pb
Se
JSAC0411
11.3±0.5
0.274±0.02
23.5±1.8
18.9±2.6
1.32±0.27
SRM2711
105±8
41.7±0.25
47
1162±31
1.52±0.14
NIES No.2
12
0.82
75
105
N/A
Pb(mg/kg)
AA
ICP
ICP/MS
JSAC041
10.5
11.8
12.0
SRM2711
1046
1070
1040
NIES No.2
67.6
67.5
69.2
Cd(mg/kg)
AA
ICP
ICP/MS
JSAC041
0.2
0.2
0.2
SRM2711
30.2
36.5
37.4
NIES No.2
0.6
0.6
0.6
* FAA indicates flame atomic absorption spectrometry. FLAA indicates flameless atomic absorption spectrometry.
126
6.5 Analysis of Chromium in Soil using Atomic Absorption Spectrometry - AA
■ ExplanationThe Soil Contamination Countermeasures Law implementedin Japan in 2003 defines soil elution standards and soil contentstandards for metals such as cadmium and lead and also forhexavalent chromium. This section descries the analysis ofchromium in a commercial soil standard sample (JSAC 0411Brown forest soil, Japan Society for Analytical Chemistry).
■ Sample PreparationFig. 6.5.1 and Fig. 6.5.2 show an outline of the samplepreparation method for hexavalent chromium according tothe soil elution standard (Ministry of the EnvironmentNotification No. 18, dated 6 March 2003) and according tothe soil content standard (Ministry of the EnvironmentNotification No. 19, dated 6 March 2003), respectively.
■ Analysis MethodThe sample was measured according to the analysis methodfor hexavalent chromium described in item 65.2 of JISK0102-1998 Testing Methods for Industrial Waste Water.JIS K0102-1998 defines five methods for the analysis ofhexavalent chromium, including diphenylcarbazideabsorption spectrometry and flame atomic absorptionspectrometry. However, this analysis was conducted byelectrothermal flame atomic absorption spectrometry("furnace AA"). Of these methods, only diphenylcarbazideabsorption spectrometry has selectivity for hexavalentchromium. Therefore, if the sample contains trivalentchromium, the analysis methods define iron coprecipitationto remove it. However, separation by iron coprecipitationwas not conducted during the analysis described here. Afixed volume of the sample solution was spiked with nitricacid and subjected to thermal decomposition beforeappropriate dilution to form the measurement sample. Tables6.5.2 and 6.5.3 list the major measurement conditions.
■ Measurement ResultsFig. 6.5.3 and Fig. 6.5.4 show parts of the peak profile from themeasurements and Table 6.5.4 lists the measurement results. Asthe elution concentration depends on the chemical species ofthe substance and the elution conditions, it is important toprocess the sample in compliance with the test method.
Sample preparation method
Concentration in sample (mg/L)
Liquid/solid ratio
Concentration in soil (mg/kg)
pH 6 extraction (elution test)
0.160
10/1
1.60
Alkaline extraction (content test)
0.0519
100/3
1.73
Abs0.500
0.250
0.000
Temperature Program
Tube TypeSample Injection VolumeInterference Inhibitor
Signal Processing
Drying: 150˚C, 20 s; 250˚C, 10 sAshing: 1000˚C, 25 s
Atomization: 2400˚C, 3 sCleaning: 2600˚C, 2 s
Pyrolized Graphite Tube5 µL
500 ppm Magnesium Nitrate, 5 µLArea
Analysis wavelength
Slid width
Current value
Ignition mode
357.9 nm
0.7 nm
10 mA
BGC-D2
Element
CdPbCrAsSeBeCuZn
Certified Value mg/kg (ppm)
4.25±0.4126±4
50.4±5.110.62±0.650.27±0.055.28±0.3515.3±1.366.8±2.7
10 ppb
5 ppb
2 ppb
Blank
Abs
0.500
0.250
0.000
Fig. 6.5.3 Peak profile of standard solution
Table 6.5.4 Measurement results for chromium in JSAC 0401 soil standard
Fig. 6.5.4 Peak profile of sample
Table 6.5.3 Atomization parameters
Table 6.5.2 Optics parameters
Fig. 6.5.2 Sample preparation method according to the soil content standard
Fig. 6.5.1 Sample preparation method according to the soil elution standard
Table 6.5.1 Certified values of metal element content of the soil standard sample (JSAC 0411 Brown Forest Soil) (partial)
127
6.6 Analysis of Non-agitated Soil Core Sample using Microscopic FTIR (1) - FTIR
■ ExplanationTo understand the existing form and distribution status ofinorganic compounds and organic compounds contained insoil, important information - such as knowledge of thefeatures attributable to the quality and formation of the soil inquestion - is needed. There are almost no examples of directsoil sampling using FTIR, but sampling of soil hardenedwith resin is possible. As a soil analysis method, the resinhardening method (1) is actively used to observe andanalyze micro structures and surface analysis, because soilsamples can be taken by core sampler and kept in a non-agitated state. Here, this section introduces a measuringexample of a sample prepared using this method.
Reference(1) Kenji Tamura, Sadao Nagatsuka, Hiroshi Ohba
Japan Soil Nutrient Society Magazine: 166-176 (1993)
■ PretreatmentThe sample used consisted of the A layer of black soil takenfrom an eulalia plain, and the pretreatment consisted of themethod depicted in reference material (1), which was
performed in the following way. The sample provided bycore sampler was wind dried, then hardened byimpregnation of a polyester-based resin. The sample wasthen cut to a suitable size, the surface polished, and used formeasuring. The prepared sample was set on the stage of aninfrared microscope, and measured by mapping employing areflective method for 5 × 5 mm range with aperture size 200 µmsquare.
■ ResultsFigures 6.6.1 and 6.6.2 show the silicic acid compoundfrom the spectra obtained in the measuring results. Bothfigures show absorption peculiarities for silicic acidcompound in the vicinity of 1100 cm-1.
■ Measuring Conditions
0.2
Abs
0.15
0.1
0.05
0.0
4000.0 2000.0 1000.0
Fig. 6.6.1 Inorganic compound spectrum (1)
ModeDecompositionAccumulationApodize FunctionDetectorData Processing Device
: Reflection: 8 cm-1
: 40: Happ-Genzel: MCT: Kramers-Kronig conv.
0.25
Abs
0.2
0.15
0.05
0.1
0.0
4000.0 2000.0 1000.0
Fig. 6.6.2 Inorganic compound spectrum (2)
Others
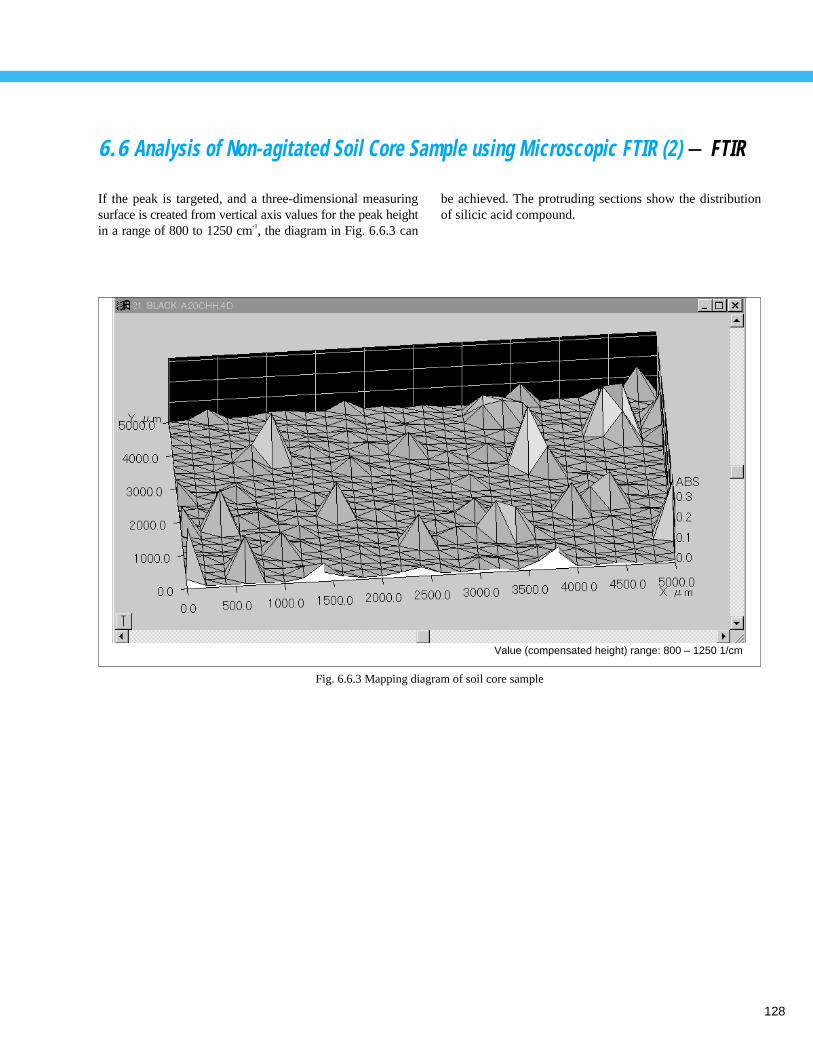
128
6.6 Analysis of Non-agitated Soil Core Sample using Microscopic FTIR (2) - FTIR
If the peak is targeted, and a three-dimensional measuringsurface is created from vertical axis values for the peak heightin a range of 800 to 1250 cm-1, the diagram in Fig. 6.6.3 can
be achieved. The protruding sections show the distributionof silicic acid compound.
Value (compensated height) range: 800 – 1250 1/cm
Fig. 6.6.3 Mapping diagram of soil core sample
129
6.7 Analysis of Inorganic Components in Soil (1) - ICP/MS
■ExplanationSoil samples often contain extremely complex interferingsubstances at high concentrations, which normally makesthe measurement of trace elements extremely difficult. Theanalysis method must achieve high sensitivity with littleinterference. This section describes the quantitation of soilsamples using Shimadzu ICPM-8500. Table 6.7.1 shows the quantitation results. The results aremultiplied by a dilution factor of 1000 to express them as aconcentration in a solid sample. Fig. 6.7.1 shows thecalibration curves.
■SamplesSoil standard samples NDG-2 (Field Subsoil) and NDG-7,8 (Rice Paddy Soil), produced by the Japanese Society ofSoil Science and Plant Nutrition.Supplied by Soil Chemistry Laboratory, Department ofPlant Production Chemistry, Tokyo University ofAgriculture
■PretreatmentWeigh 0.5 g soil sample into a fluororesin pressurizeddecomposition vessel. Add 5 mL high-purity nitric acid.Seal the vessel and heat at 170˚C for 3 hours. Allow tocool. Spike with internal standard elements and make up to100 mL with ultrapure water. Filter through 5B (medium)filter paper and dilute the filtrate 5 times with ultrapurewater to make the analysis sample.
■Calibration Curve SampleMix AA-grade standard solution (1000 ppm) and thendilute as appropriate with ultrapure water. Spike with 50ppb internal standard elements and add 1% nitric acid.
■Analytical ConditionsInstrumentPlasma Unit RF OutputCoolant Gas Flow Rate (Ar)Plasma Gas Flow Rate (Ar)Carrier Gas Flow Rate (Ar)Sample Introduction UnitNebulizerSample Intake RateChamberPlasma TorchSampling DepthSampling Interface
: ICPM-8500
: 1.2 kW: 7 L/min: 1.5 L/min: 0.62 L/min
: Coaxial Nebulizer: 0.4 mL/min: Cooled Scott Chamber: Three-layered Mini Torch: 5 mm: Copper
References(1) Partial revision of Ordinances of Water Pollution
Prevention Law Related to Environmental Standards, 8 March 1993
(2) JIS K0102-1998 Testing Methods for Industrial Waste Water
Others
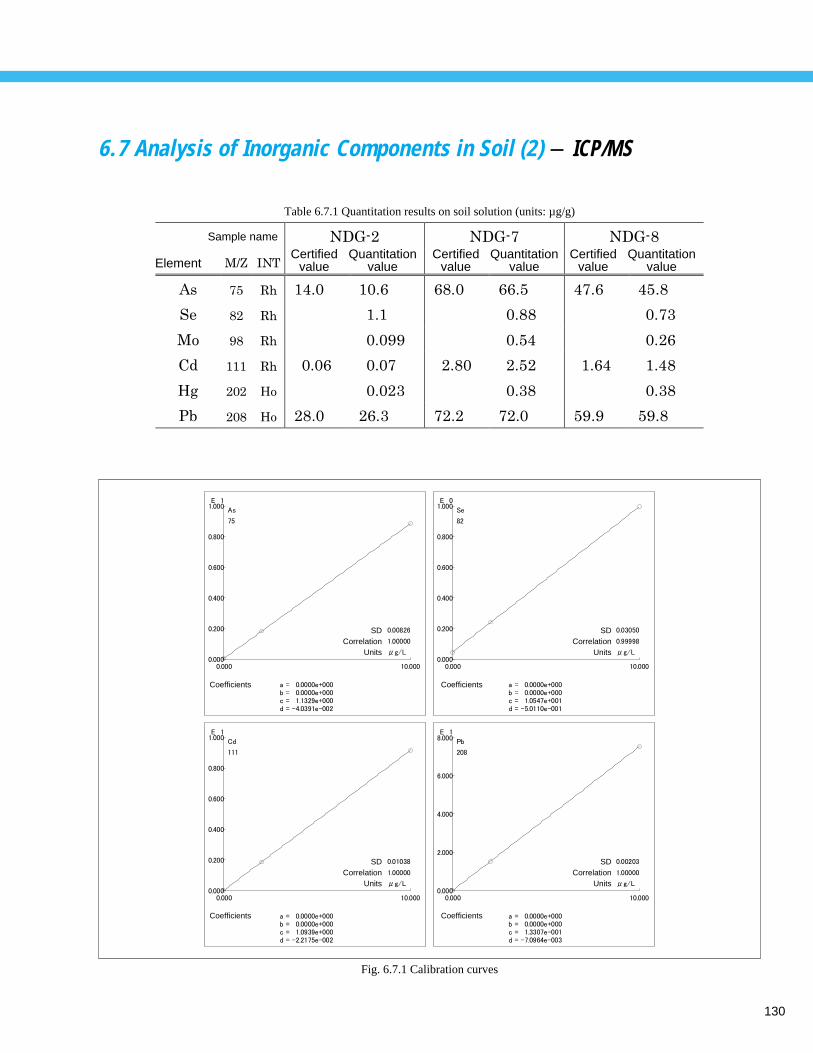
130
6.7 Analysis of Inorganic Components in Soil (2) - ICP/MS
Table 6.7.1 Quantitation results on soil solution (units: µg/g)
Fig. 6.7.1 Calibration curves
Sample name
ElementCertified
valueQuantitation
valueCertified
valueQuantitation
valueCertified
valueQuantitation
value
SDCorrelation
Units
SDCorrelation
Units
SDCorrelation
Units
SDCorrelation
Units
Coefficients
Coefficients
Coefficients
Coefficients
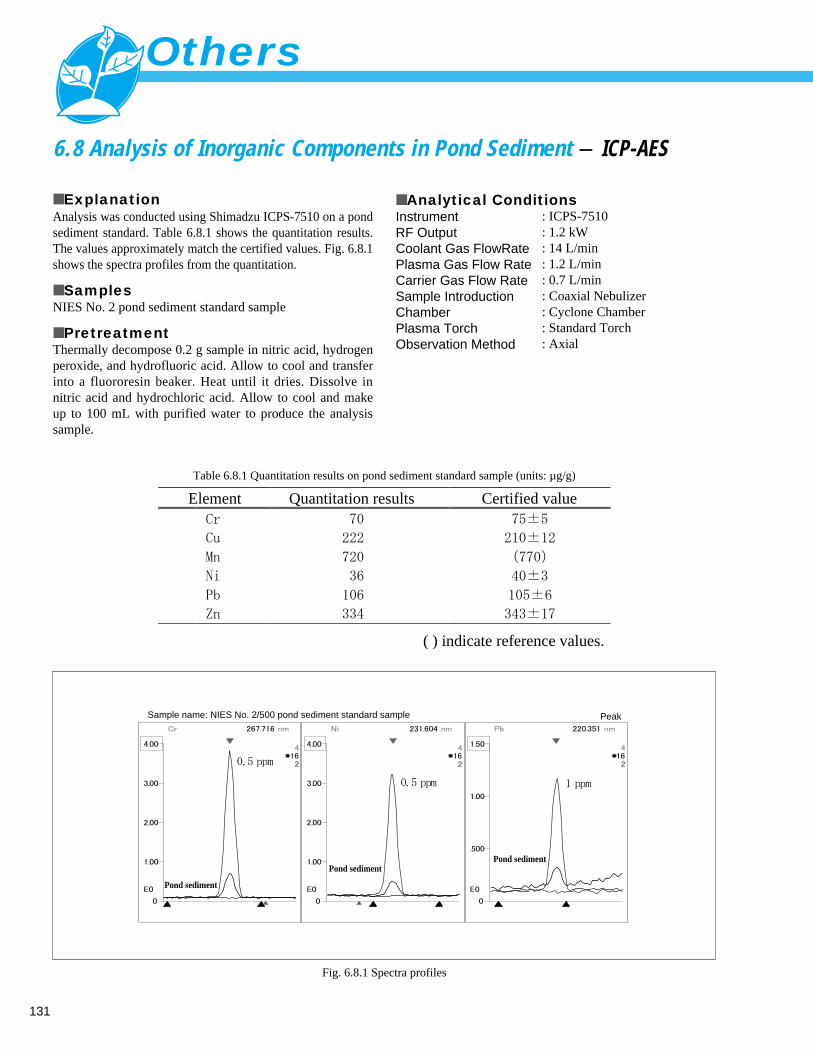
131
6.8 Analysis of Inorganic Components in Pond Sediment - ICP-AES
■ExplanationAnalysis was conducted using Shimadzu ICPS-7510 on a pondsediment standard. Table 6.8.1 shows the quantitation results.The values approximately match the certified values. Fig. 6.8.1shows the spectra profiles from the quantitation.
■SamplesNIES No. 2 pond sediment standard sample
■PretreatmentThermally decompose 0.2 g sample in nitric acid, hydrogenperoxide, and hydrofluoric acid. Allow to cool and transferinto a fluororesin beaker. Heat until it dries. Dissolve innitric acid and hydrochloric acid. Allow to cool and makeup to 100 mL with purified water to produce the analysissample.
■Analytical ConditionsInstrumentRF OutputCoolant Gas FlowRatePlasma Gas Flow RateCarrier Gas Flow RateSample Introduction ChamberPlasma TorchObservation Method
: ICPS-7510: 1.2 kW: 14 L/min: 1.2 L/min: 0.7 L/min: Coaxial Nebulizer: Cyclone Chamber: Standard Torch: Axial
Sample name: NIES No. 2/500 pond sediment standard sample Peak
Pond sediment
Pond sedimentPond sediment
Certified valueElement Quantitation results
( ) indicate reference values.
Table 6.8.1 Quantitation results on pond sediment standard sample (units: µg/g)
Fig. 6.8.1 Spectra profiles
Others
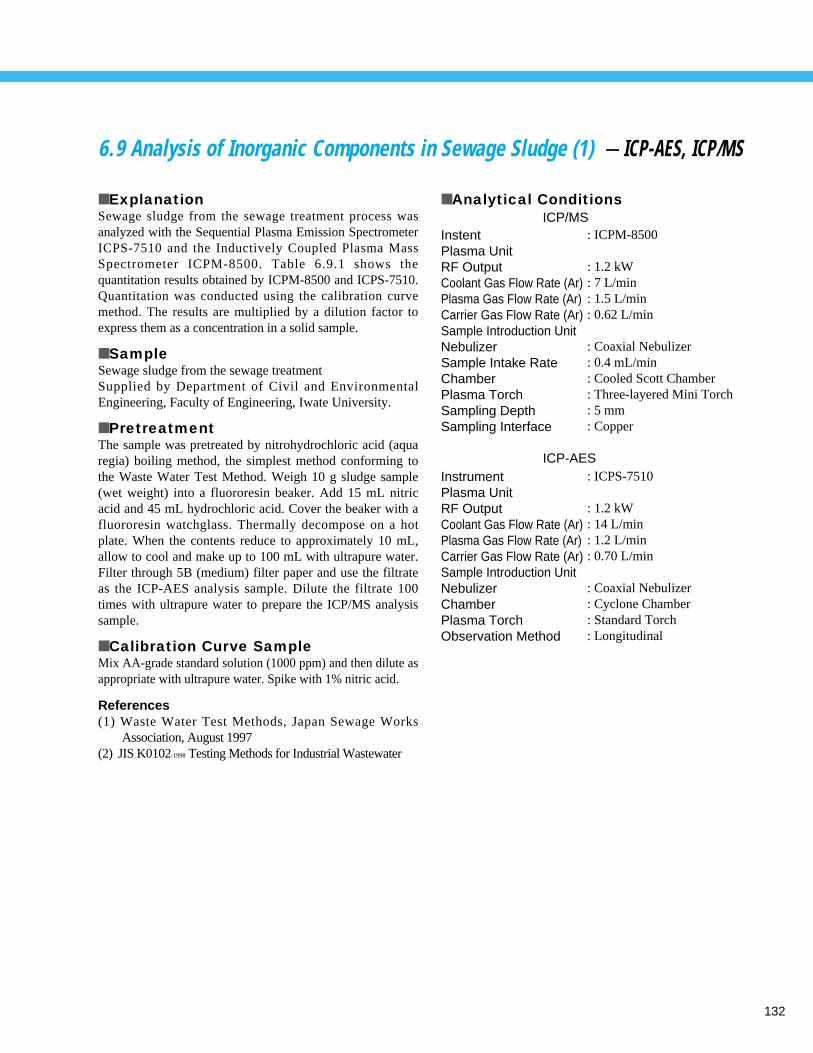
132
6.9 Analysis of Inorganic Components in Sewage Sludge (1) -ICP-AES, ICP/MS
■ExplanationSewage sludge from the sewage treatment process wasanalyzed with the Sequential Plasma Emission SpectrometerICPS-7510 and the Inductively Coupled Plasma MassSpectrometer ICPM-8500. Table 6.9.1 shows thequantitation results obtained by ICPM-8500 and ICPS-7510.Quantitation was conducted using the calibration curvemethod. The results are multiplied by a dilution factor toexpress them as a concentration in a solid sample.
■SampleSewage sludge from the sewage treatmentSupplied by Department of Civil and EnvironmentalEngineering, Faculty of Engineering, Iwate University.
■PretreatmentThe sample was pretreated by nitrohydrochloric acid (aquaregia) boiling method, the simplest method conforming tothe Waste Water Test Method. Weigh 10 g sludge sample(wet weight) into a fluororesin beaker. Add 15 mL nitricacid and 45 mL hydrochloric acid. Cover the beaker with afluororesin watchglass. Thermally decompose on a hotplate. When the contents reduce to approximately 10 mL,allow to cool and make up to 100 mL with ultrapure water.Filter through 5B (medium) filter paper and use the filtrateas the ICP-AES analysis sample. Dilute the filtrate 100times with ultrapure water to prepare the ICP/MS analysissample.
■Calibration Curve SampleMix AA-grade standard solution (1000 ppm) and then dilute asappropriate with ultrapure water. Spike with 1% nitric acid.
References(1) Waste Water Test Methods, Japan Sewage Works
Association, August 1997(2) JIS K0102-1998 Testing Methods for Industrial Wastewater
■Analytical Conditions
InstentPlasma Unit RF OutputCoolant Gas Flow Rate (Ar)Plasma Gas Flow Rate (Ar)Carrier Gas Flow Rate (Ar)Sample Introduction UnitNebulizerSample Intake RateChamberPlasma TorchSampling DepthSampling Interface
: ICPM-8500
: 1.2 kW: 7 L/min: 1.5 L/min: 0.62 L/min
: Coaxial Nebulizer: 0.4 mL/min: Cooled Scott Chamber: Three-layered Mini Torch: 5 mm: Copper
InstrumentPlasma Unit RF OutputCoolant Gas Flow Rate (Ar)Plasma Gas Flow Rate (Ar)Carrier Gas Flow Rate (Ar)Sample Introduction UnitNebulizerChamberPlasma TorchObservation Method
: ICPS-7510
: 1.2 kW: 14 L/min: 1.2 L/min: 0.70 L/min
: Coaxial Nebulizer: Cyclone Chamber: Standard Torch: Longitudinal
ICP/MS
ICP-AES
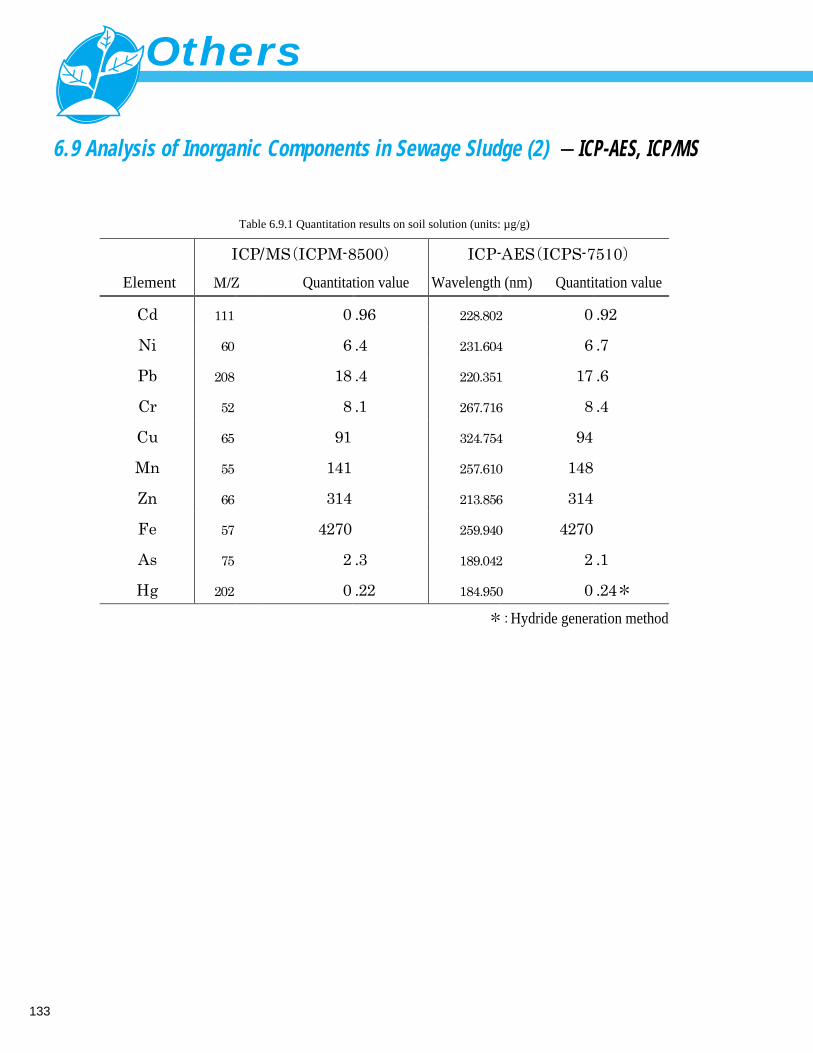
133
6.9 Analysis of Inorganic Components in Sewage Sludge (2) -ICP-AES, ICP/MS
Table 6.9.1 Quantitation results on soil solution (units: µg/g)
Element Quantitation value Quantitation valueWavelength (nm)
Hydride generation method
Others
134
INDEXINDEX
1-Bromopropane 86
1-Chlorodecane 32
1,1-Dichloroethane 86,104
1,1-Dichloroethene 36,104,124
1,1-Dichloroethylene 31,87,90
1,1,1-Trichloroethane 31,36,87,90,104,124
1,1,1,2-Tetrachloroethane 86
1,1,2-Trichloroethane 31,36,87,90,104
1,1,2,2-Tetrachloroethane 86,104
1,2-Dibromoethane 104
1,2-Dichloroethane 31,36,87,90,103,104,105,124
1,2-Dichloropropane 31,36,37,87,90,104,124
1-(2-pyridyl) piperazine 94,95
1,2,3-Trichloropropane 26,27,33,86
1,2,4-Trichlorobenzene 104
1,2,4-Trimethylbenzene 104
1,3-Butadiene 86,103,104,105
1,3,5-Trimethylbenzene 104
1,4-Dichlorbenzene 37
1,4-Dioxane 29,30,31,34
1,4-Dioxane-d8 29,34
2-BPA (bromopropenamide) 43
2-Bromopropane 86
2-Butanone 96,98
2-Chlorophenol 28,33
2-Methylisoborneol 38,39,41
2-MIB 38,39,40,41
2,3-DBPA (dibromopropionamide) 43
2,4-Dichlorophenol 28,33
2,4-D (dichlorophenoxy acetic acid) 10,11,13,14
2,4-DNPH(Dinitrophenylhydrazine) 97,99,100
2,4-TDI 94
2,4,6-Trichlorophenol 28,33
2,6-Dichlorophenol 28,33
2,6-TDI 94
3,3'-Dichloro-4,4'-diaminodiphenylmethane 94
4-Chlorophenol 28,33
9-Bromoanthracene 14
9-Fluorenylmethyl chloroformate (FMOC-Cl) 9
17β-Estradiol 88
α-Estradiol 88
α-Endosulfan 14
β-Estradiol 88
β-Endosulfan 14
AA 49,50,61,62,63,64,69,113,125,126
ABS 115
Acenaphthene d10 28,33
Acephate 11,12
Acetaldehyde 97,98,99
Acetone 29,96,98,99
Acetonitrile 7,8,9,10,11,23,24,59,60,82,94,96, 98,100
DESCRIPTION PAGE
Acetylacetone 101
Acrolein 97,99
Acrylamide 43,44
Acrylamide Br 43
Acrylonitrile 103,104,115
Acrylonitrile-Butadiene-Styrene (ABS) Resin 115
Actinomycetes 40
Additional Method 9 7
Additional Method 11 6
Additional Method 12 9
Additional Method 15 9
Additional Method 16 8
Additional Method 17 8
ADI 45
ADU-1 51,91
Al 51,65,67,78,92
Al2O3 119
Alachlor 14
Aldehyde 96,97,98,99,100
Alkyl mercury 83,84,125
Allyl chloride 86
Ammonium citrate 72
Ammonium ion 3
Amosite 118
AMPA (amino methyl phosphoric acid) 9
Anilofos 14
Anionic surfactant 23
Anthracene-d 14
Antigorite 117
Apodize Function 114,127
AQUA Trap 1 87
AQUATIC 35,62,86,105
AQUATIC2 31
AQUATIC-H 87
Argon 62,106
Arsenic 69,113,125
Arsenic hydride 69
As 49,51,67,92,107,108,109,
111,116,125, 126, 130,133
Asahipak NH2P-50 74
Asbestos 117,118
Asulam 7,11,12,59
Atmospheric dust 107,108,109
Atomic absorption spectrometry 62,125,126
ATR 114,115
Atrazine 14
Azoxystrobin 10,11,12,59,60
B 51,65,66,67,76,77,92,125
Ba 67,76
BaO 119
BCR-176 116
DESCRIPTION PAGE
135
INDEX
Be 67,107,108,109,119,126
Bendiocarb 5
Benfluralin 14
Benfuracarb 11
Benomyl 11
Bensulfuron-methyl 10,11,12
Bensulide (SAP) 11,12,59
Bentazon 10,11,13,14
Benzaldehyde 97
Benzene 31,36,84,87,90,103,104,105,124
Bi 67
Bifenox 14
Bisphenol A (BPA) 81,82
Bis-Tris (bis(2-hydroxyethyl)iminotris(hydroxymethyl)methane)
2,54,57,70,93
Blue-green algae 24,79,80,85
Boron 125
Br 20,44,119
Br– 16,20,21,53,54,57,74
BrO3– 16,17
Bromate ion 16
Bromide ion 20,43,74
Bromination 43
Bromobutide 14
Bromochloroacetonitrile 25,26
Bromochloromethane 86
Bromodichloromethane 31,36,86,90,124
Bromoform 31,36,87,90,124
Bromomethane 86,104
Buprofezin 14
Butamifos 14
Butyraldehyde 97,99
C10 23
C11 23
C12 23
C13 23
C14 23
Ca 61,65,67,76,77
Ca2+ 3,4,55,56,58,68,70,71
Cafenstrole 14
Calcium 3,47,51,61
Canister 104,105
CaO 119
Captan 14
Carbaryl 5,11,12
Carbofuran 5,10,11,12
Carbon tetrachloride 31,87,90,104
Carpropamid 11,12
Cd 51,63,65,67,78,92,107,108,
109,111,116,125,126,130,133
Cadmium 63,113,125,126
DESCRIPTION PAGE
Chloral hydrate 25,26,32
Chloramine T 18
Chlorate 21
Chloride ion 20,74
Chlorine 1,21,27,46,47
Chlorine dioxide 21
Chlorite 21
Chlornitrofen 14
Chloroacetic acid 27,33
Chloroacetic acid methyl ester 33
Chloroacetonitrile 25
Chlorobenzene 86,104
Chloroethane 86,104
Chloroethene 103,104,105
Chloroform 31,36,37,87,90,103,104,105,124
Chloromethane 86,104
Chloroneb 14
Chlorothalonil 14
Chlorpyrifos 14
Chromium 63,113,125,126
Chrysotile 117,118
cis-1,2-Dichloroethene 36,104,124
cis-1,2-Dichloroethylene 31,87,90
cis-1,3-Dichloropropene 31,36,87,90,104,124
Cl 20,119
Cl– 1,2,20,21,53,54,57,70,73,74,89,93
Clean Air Act 97
ClO2– 21
ClO3– 21
CN– 19
CNCl 18,19
CNP-amino 14
Co 108
CO2 106,119
CO32– 2,54,57
Copper 51,67,91,108,110,113,116,129,132
Core sampler 127
Cr 51,63,65,66,67,78,92,107,108,
109,111,116,125,126,131,133
Cr6+ 108,116,125
Cr2O3 119
Cu 51,65,67,78,92,111,116,126,131,133
CuO 119
Cyanide ions 18,19
Cyanogen chloride 18,19
Cycropentane 86
CyDTA 45
D2 method 61
Daimuron 10,11,13
DB-1 25,85,99,103,121
DB-5 41,122
DESCRIPTION PAGE
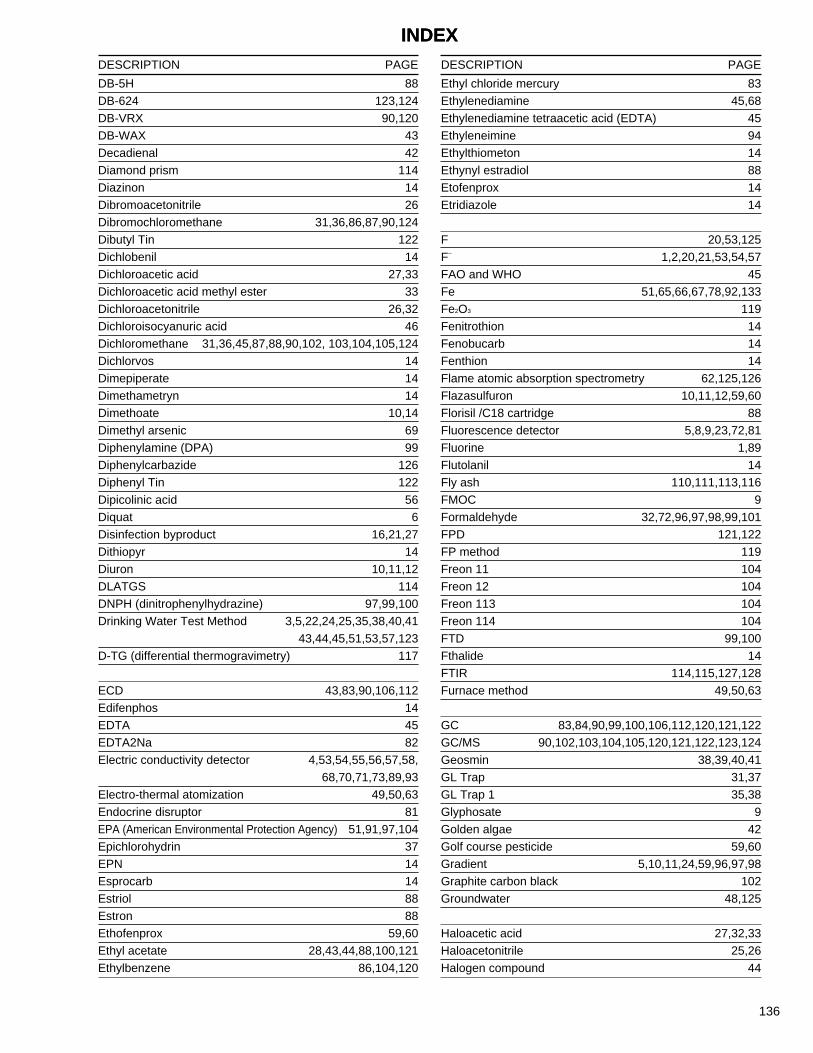
136
INDEXINDEX
DB-5H 88
DB-624 123,124
DB-VRX 90,120
DB-WAX 43
Decadienal 42
Diamond prism 114
Diazinon 14
Dibromoacetonitrile 26
Dibromochloromethane 31,36,86,87,90,124
Dibutyl Tin 122
Dichlobenil 14
Dichloroacetic acid 27,33
Dichloroacetic acid methyl ester 33
Dichloroacetonitrile 26,32
Dichloroisocyanuric acid 46
Dichloromethane 31,36,45,87,88,90,102, 103,104,105,124
Dichlorvos 14
Dimepiperate 14
Dimethametryn 14
Dimethoate 10,14
Dimethyl arsenic 69
Diphenylamine (DPA) 99
Diphenylcarbazide 126
Diphenyl Tin 122
Dipicolinic acid 56
Diquat 6
Disinfection byproduct 16,21,27
Dithiopyr 14
Diuron 10,11,12
DLATGS 114
DNPH (dinitrophenylhydrazine) 97,99,100
Drinking Water Test Method 3,5,22,24,25,35,38,40,41
43,44,45,51,53,57,123
D-TG (differential thermogravimetry) 117
ECD 43,83,90,106,112
Edifenphos 14
EDTA 45
EDTA2Na 82
Electric conductivity detector 4,53,54,55,56,57,58,
68,70,71,73,89,93
Electro-thermal atomization 49,50,63
Endocrine disruptor 81
EPA (American Environmental Protection Agency) 51,91,97,104
Epichlorohydrin 37
EPN 14
Esprocarb 14
Estriol 88
Estron 88
Ethofenprox 59,60
Ethyl acetate 28,43,44,88,100,121
Ethylbenzene 86,104,120
DESCRIPTION PAGE
Ethyl chloride mercury 83
Ethylenediamine 45,68
Ethylenediamine tetraacetic acid (EDTA) 45
Ethyleneimine 94
Ethylthiometon 14
Ethynyl estradiol 88
Etofenprox 14
Etridiazole 14
F 20,53,125
F– 1,2,20,21,53,54,57
FAO and WHO 45
Fe 51,65,66,67,78,92,133
Fe2O3 119
Fenitrothion 14
Fenobucarb 14
Fenthion 14
Flame atomic absorption spectrometry 62,125,126
Flazasulfuron 10,11,12,59,60
Florisil /C18 cartridge 88
Fluorescence detector 5,8,9,23,72,81
Fluorine 1,89
Flutolanil 14
Fly ash 110,111,113,116
FMOC 9
Formaldehyde 32,72,96,97,98,99,101
FPD 121,122
FP method 119
Freon 11 104
Freon 12 104
Freon 113 104
Freon 114 104
FTD 99,100
Fthalide 14
FTIR 114,115,127,128
Furnace method 49,50,63
GC 83,84,90,99,100,106,112,120,121,122
GC/MS 90,102,103,104,105,120,121,122,123,124
Geosmin 38,39,40,41
GL Trap 31,37
GL Trap 1 35,38
Glyphosate 9
Golden algae 42
Golf course pesticide 59,60
Gradient 5,10,11,24,59,96,97,98
Graphite carbon black 102
Groundwater 48,125
Haloacetic acid 27,32,33
Haloacetonitrile 25,26
Halogen compound 44
DESCRIPTION PAGE
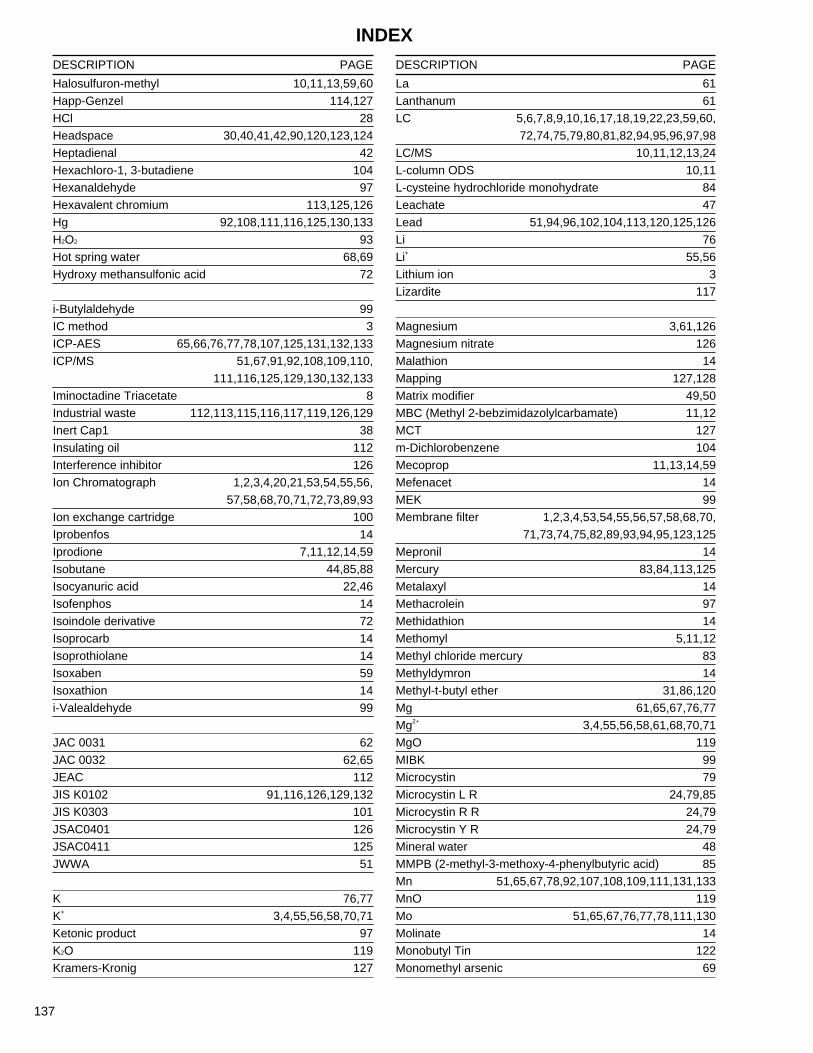
137
INDEX
Halosulfuron-methyl 10,11,13,59,60
Happ-Genzel 114,127
HCl 28
Headspace 30,40,41,42,90,120,123,124
Heptadienal 42
Hexachloro-1, 3-butadiene 104
Hexanaldehyde 97
Hexavalent chromium 113,125,126
Hg 92,108,111,116,125,130,133
H2O2 93
Hot spring water 68,69
Hydroxy methansulfonic acid 72
i-Butylaldehyde 99
IC method 3
ICP-AES 65,66,76,77,78,107,125,131,132,133
ICP/MS 51,67,91,92,108,109,110,
111,116,125,129,130,132,133
Iminoctadine Triacetate 8
Industrial waste 112,113,115,116,117,119,126,129
Inert Cap1 38
Insulating oil 112
Interference inhibitor 126
Ion Chromatograph 1,2,3,4,20,21,53,54,55,56,
57,58,68,70,71,72,73,89,93
Ion exchange cartridge 100
Iprobenfos 14
Iprodione 7,11,12,14,59
Isobutane 44,85,88
Isocyanuric acid 22,46
Isofenphos 14
Isoindole derivative 72
Isoprocarb 14
Isoprothiolane 14
Isoxaben 59
Isoxathion 14
i-Valealdehyde 99
JAC 0031 62
JAC 0032 62,65
JEAC 112
JIS K0102 91,116,126,129,132
JIS K0303 101
JSAC0401 126
JSAC0411 125
JWWA 51
K 76,77
K+ 3,4,55,56,58,70,71
Ketonic product 97
K2O 119
Kramers-Kronig 127
DESCRIPTION PAGE
La 61
Lanthanum 61
LC 5,6,7,8,9,10,16,17,18,19,22,23,59,60,
72,74,75,79,80,81,82,94,95,96,97,98
LC/MS 10,11,12,13,24
L-column ODS 10,11
L-cysteine hydrochloride monohydrate 84
Leachate 47
Lead 51,94,96,102,104,113,120,125,126
Li 76
Li+ 55,56
Lithium ion 3
Lizardite 117
Magnesium 3,61,126
Magnesium nitrate 126
Malathion 14
Mapping 127,128
Matrix modifier 49,50
MBC (Methyl 2-bebzimidazolylcarbamate) 11,12
MCT 127
m-Dichlorobenzene 104
Mecoprop 11,13,14,59
Mefenacet 14
MEK 99
Membrane filter 1,2,3,4,53,54,55,56,57,58,68,70,
71,73,74,75,82,89,93,94,95,123,125
Mepronil 14
Mercury 83,84,113,125
Metalaxyl 14
Methacrolein 97
Methidathion 14
Methomyl 5,11,12
Methyl chloride mercury 83
Methyldymron 14
Methyl-t-butyl ether 31,86,120
Mg 61,65,67,76,77
Mg2+ 3,4,55,56,58,61,68,70,71
MgO 119
MIBK 99
Microcystin 79
Microcystin L R 24,79,85
Microcystin R R 24,79
Microcystin Y R 24,79
Mineral water 48
MMPB (2-methyl-3-methoxy-4-phenylbutyric acid) 85
Mn 51,65,67,78,92,107,108,109,111,131,133
MnO 119
Mo 51,65,67,76,77,78,111,130
Molinate 14
Monobutyl Tin 122
Monomethyl arsenic 69
DESCRIPTION PAGE
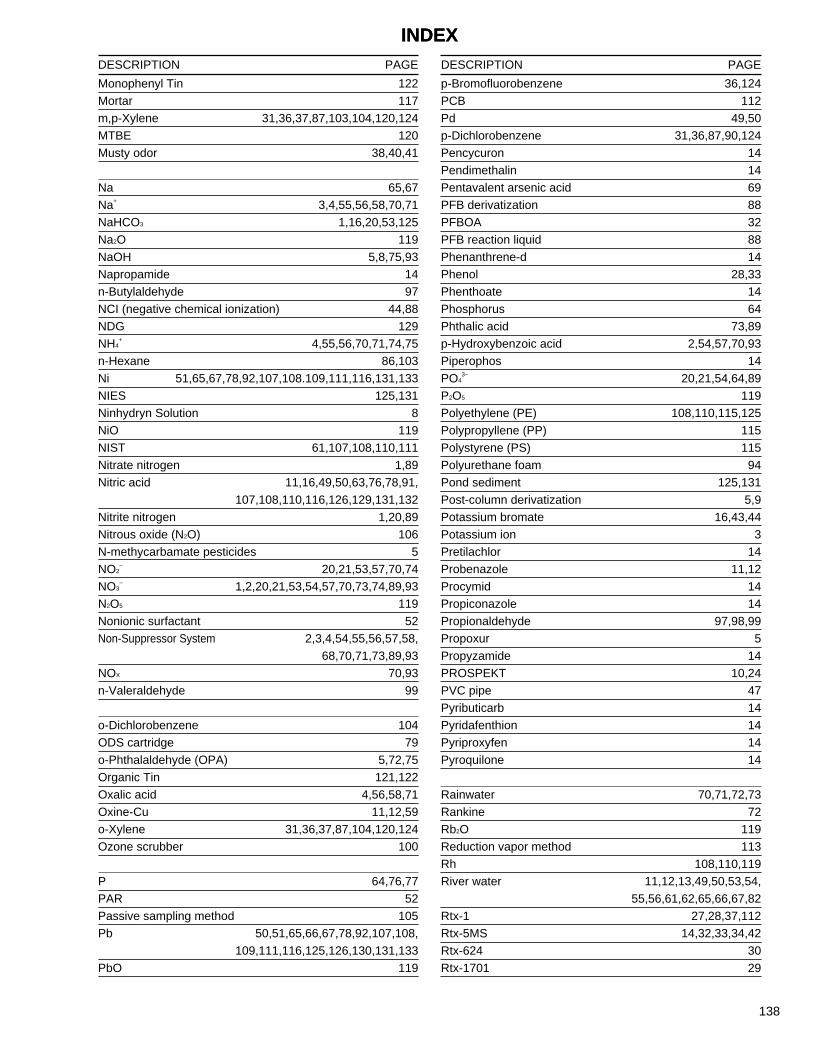
138
INDEXINDEX
Monophenyl Tin 122
Mortar 117
m,p-Xylene 31,36,37,87,103,104,120,124
MTBE 120
Musty odor 38,40,41
Na 65,67
Na+ 3,4,55,56,58,70,71
NaHCO3 1,16,20,53,125
Na2O 119
NaOH 5,8,75,93
Napropamide 14
n-Butylaldehyde 97
NCI (negative chemical ionization) 44,88
NDG 129
NH4+ 4,55,56,70,71,74,75
n-Hexane 86,103
Ni 51,65,67,78,92,107,108.109,111,116,131,133
NIES 125,131
Ninhydryn Solution 8
NiO 119
NIST 61,107,108,110,111
Nitrate nitrogen 1,89
Nitric acid 11,16,49,50,63,76,78,91,
107,108,110,116,126,129,131,132
Nitrite nitrogen 1,20,89
Nitrous oxide (N2O) 106
N-methycarbamate pesticides 5
NO2– 20,21,53,57,70,74
NO3– 1,2,20,21,53,54,57,70,73,74,89,93
N2O5 119
Nonionic surfactant 52
Non-Suppressor System 2,3,4,54,55,56,57,58,
68,70,71,73,89,93
NOX 70,93
n-Valeraldehyde 99
o-Dichlorobenzene 104
ODS cartridge 79
o-Phthalaldehyde (OPA) 5,72,75
Organic Tin 121,122
Oxalic acid 4,56,58,71
Oxine-Cu 11,12,59
o-Xylene 31,36,37,87,104,120,124
Ozone scrubber 100
P 64,76,77
PAR 52
Passive sampling method 105
Pb 50,51,65,66,67,78,92,107,108,
109,111,116,125,126,130,131,133
PbO 119
DESCRIPTION PAGE
p-Bromofluorobenzene 36,124
PCB 112
Pd 49,50
p-Dichlorobenzene 31,36,87,90,124
Pencycuron 14
Pendimethalin 14
Pentavalent arsenic acid 69
PFB derivatization 88
PFBOA 32
PFB reaction liquid 88
Phenanthrene-d 14
Phenol 28,33
Phenthoate 14
Phosphorus 64
Phthalic acid 73,89
p-Hydroxybenzoic acid 2,54,57,70,93
Piperophos 14
PO43– 20,21,54,64,89
P2O5 119
Polyethylene (PE) 108,110,115,125
Polypropyllene (PP) 115
Polystyrene (PS) 115
Polyurethane foam 94
Pond sediment 125,131
Post-column derivatization 5,9
Potassium bromate 16,43,44
Potassium ion 3
Pretilachlor 14
Probenazole 11,12
Procymid 14
Propiconazole 14
Propionaldehyde 97,98,99
Propoxur 5
Propyzamide 14
PROSPEKT 10,24
PVC pipe 47
Pyributicarb 14
Pyridafenthion 14
Pyriproxyfen 14
Pyroquilone 14
Rainwater 70,71,72,73
Rankine 72
Rb2O 119
Reduction vapor method 113
Rh 108,110,119
River water 11,12,13,49,50,53,54,
55,56,61,62,65,66,67,82
Rtx-1 27,28,37,112
Rtx-5MS 14,32,33,34,42
Rtx-624 30
Rtx-1701 29
DESCRIPTION PAGE
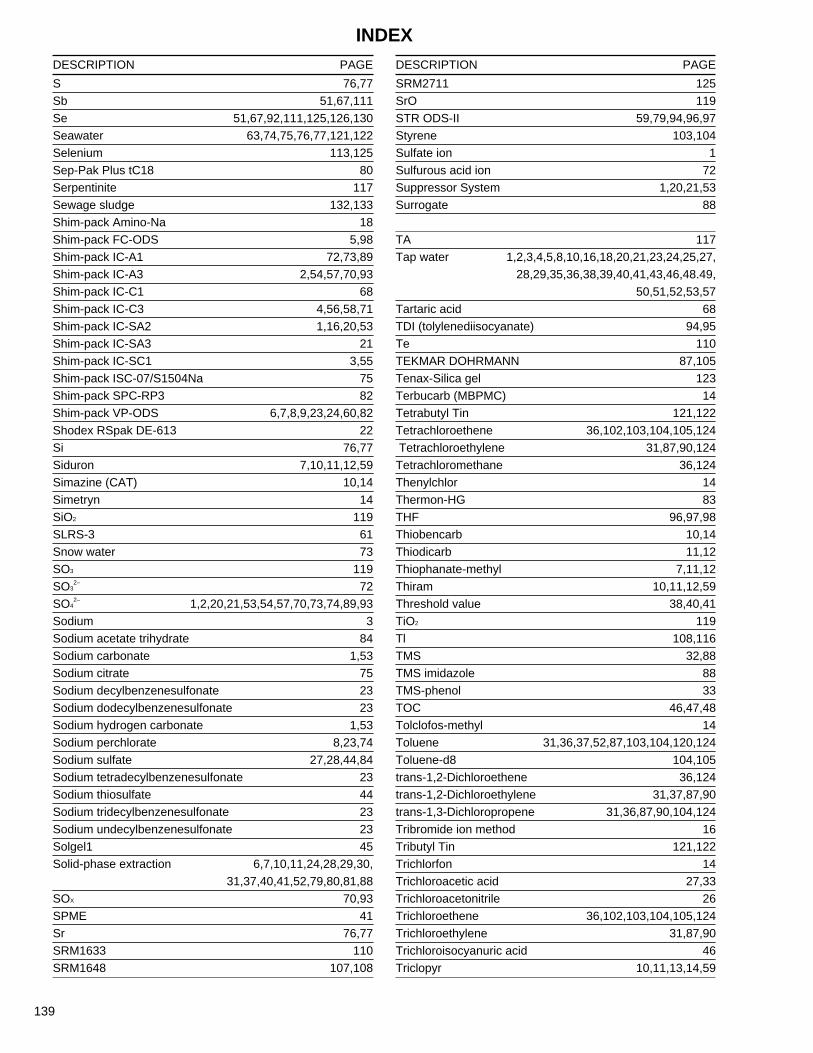
139
INDEX
S 76,77
Sb 51,67,111
Se 51,67,92,111,125,126,130
Seawater 63,74,75,76,77,121,122
Selenium 113,125
Sep-Pak Plus tC18 80
Serpentinite 117
Sewage sludge 132,133
Shim-pack Amino-Na 18
Shim-pack FC-ODS 5,98
Shim-pack IC-A1 72,73,89
Shim-pack IC-A3 2,54,57,70,93
Shim-pack IC-C1 68
Shim-pack IC-C3 4,56,58,71
Shim-pack IC-SA2 1,16,20,53
Shim-pack IC-SA3 21
Shim-pack IC-SC1 3,55
Shim-pack ISC-07/S1504Na 75
Shim-pack SPC-RP3 82
Shim-pack VP-ODS 6,7,8,9,23,24,60,82
Shodex RSpak DE-613 22
Si 76,77
Siduron 7,10,11,12,59
Simazine (CAT) 10,14
Simetryn 14
SiO2 119
SLRS-3 61
Snow water 73
SO3 119
SO32– 72
SO42– 1,2,20,21,53,54,57,70,73,74,89,93
Sodium 3
Sodium acetate trihydrate 84
Sodium carbonate 1,53
Sodium citrate 75
Sodium decylbenzenesulfonate 23
Sodium dodecylbenzenesulfonate 23
Sodium hydrogen carbonate 1,53
Sodium perchlorate 8,23,74
Sodium sulfate 27,28,44,84
Sodium tetradecylbenzenesulfonate 23
Sodium thiosulfate 44
Sodium tridecylbenzenesulfonate 23
Sodium undecylbenzenesulfonate 23
Solgel1 45
Solid-phase extraction 6,7,10,11,24,28,29,30,
31,37,40,41,52,79,80,81,88
SOX 70,93
SPME 41
Sr 76,77
SRM1633 110
SRM1648 107,108
DESCRIPTION PAGE
SRM2711 125
SrO 119
STR ODS-II 59,79,94,96,97
Styrene 103,104
Sulfate ion 1
Sulfurous acid ion 72
Suppressor System 1,20,21,53
Surrogate 88
TA 117
Tap water 1,2,3,4,5,8,10,16,18,20,21,23,24,25,27,
28,29,35,36,38,39,40,41,43,46,48.49,
50,51,52,53,57
Tartaric acid 68
TDI (tolylenediisocyanate) 94,95
Te 110
TEKMAR DOHRMANN 87,105
Tenax-Silica gel 123
Terbucarb (MBPMC) 14
Tetrabutyl Tin 121,122
Tetrachloroethene 36,102,103,104,105,124
Tetrachloroethylene 31,87,90,124
Tetrachloromethane 36,124
Thenylchlor 14
Thermon-HG 83
THF 96,97,98
Thiobencarb 10,14
Thiodicarb 11,12
Thiophanate-methyl 7,11,12
Thiram 10,11,12,59
Threshold value 38,40,41
TiO2 119
Tl 108,116
TMS 32,88
TMS imidazole 88
TMS-phenol 33
TOC 46,47,48
Tolclofos-methyl 14
Toluene 31,36,37,52,87,103,104,120,124
Toluene-d8 104,105
trans-1,2-Dichloroethene 36,124
trans-1,2-Dichloroethylene 31,37,87,90
trans-1,3-Dichloropropene 31,36,87,90,104,124
Tribromide ion method 16
Tributyl Tin 121,122
Trichlorfon 14
Trichloroacetic acid 27,33
Trichloroacetonitrile 26
Trichloroethene 36,102,103,104,105,124
Trichloroethylene 31,87,90
Trichloroisocyanuric acid 46
Triclopyr 10,11,13,14,59
DESCRIPTION PAGE
140
INDEXINDEX
Tricyclazole 11,12
Triethylamine 43,44
Trifluralin 14
Trihalomethane 87
Trimethyl arsenic 69
Triphenyl Tin 121,122
Trivalent arsenous acid 69
U 51,67,111
Uranium 37,51
Underground water 78
Valeraldehyde 97,99
Vinyl chloride 86,119
Vinyl chloride monomer 37
VOC (volatile organic compound) 14,31,35,36,37,86,87,
90,102,103,104,105,123,124
VPC-10 97,101
Wastewater 35,53,57,64,89,90,91,92,116,123,132
Wastewater Standards 35,123
Water bloom 79
Water-quality Control Standards 7,8,9,11,14,32
Waterworks Law 14,29,30,32,33,34,46,47,48,51
XRD 118
XRF 119
Y 65,108,116
Y2O3 119
ZB-WAX 44
Zinc 62,113
Zn 51,62,65,67,78,92,111,116,126,131,133
ZnO 119
DESCRIPTION PAGE DESCRIPTION PAGE
Printed in Japan 3295-02706-10A-IK
The contents of this brochure are subject to change without notice.
JQA-0376
SHIMADZU CORPORATION. International Marketing Division3. Kanda-Nishikicho 1-chome, Chiyoda-ku, Tokyo 101-8448, Japan Phone: 81(3)3219-5641 Fax. 81(3)3219-5710URL http://www.shimadzu.com
Founded in 1875, Shimadzu Corporation, a leader in the development of advanced technologies, has a distinguished history of innovation built on the foundation of contributing to society through science and technology. We maintain a global network of sales, service, technical support and applications centers on six continents, and have established long-term relationships with a host of highly trained distributors located in over 100 countries. For information about Shimadzu, and to contact your local office, please visit our Web site at www.shimadzu.com
Recommended