Quarterly Activities Report - for the period ended 30 September 2014 Market Cap: A$46m (5c-a-share) Cash at Bank*: A$10.4m Enterprise Value: A$35.6m Debt/Hedge: nil *As at 30 Sept 2014.
ASX Code: HIG Shares on Issue: 919 million Options on Issue: 7.2 million Performance Rights: 24.4 million Shareholders: ~8,300
Directors Ken MacDonald, Chairman John Gooding, Managing Director Mike Carroll Dan Wood Bart Philemon Management Craig Lennon, CFO & Company Secretary Larry Queen, Chief Geologist Peter Jolly, GM Technical Ron Gawi, GM Port Moresby
For further information, please contact: John Gooding and Craig Lennon Highlands Pacific - 07 3239 7800 Media Enquiries to: Simon Jemison c/- Collins Street Media – 03 9224 5319 The resources, reserves and exploration results contained in this document are unchanged from those previously reported under the 2012 edition of the JORC Code www.highlandspacific.com
HIGHLIGHTS Frieda River Copper Gold Project (20%) Glencore-PanAust transaction completed on 25 August 2014. PanAust now
owns an 80% interest in the Frieda River Joint Venture with Highlands owning 20%.
PanAust exercised its right to subscribe for AU$5 million worth of Highlands shares at AU7.76 cents taking their interest in Highlands to 14.0%.
PanAust is responsible for 100% of the costs incurred by the Frieda River Joint Venture up to the point of lodgement of the Mining or Special Mining Lease application.
EL58 the main resource exploration license was signed by the Minister for Mines for renewal.
Frieda River feasibility study development concept released detailing a US$1.7 billion (2013 dollars) capital cost estimate excluding mining fleet and power station, life-of-mine mill feed of 600Mt with an average processing rate of 30Mtpa over a 20-year mine life producing 125,000tpa copper and 200,000ozpa gold in concentrate at a C1 cash cost of US$1.30-1.40/lb copper (assuming US$1,300/oz gold price). [Refer presentation 2 September 2014]
Anticipated that the feasibility study will be completed and application for Special Mining License lodged before November 2015.
Ramu Nickel Cobalt Mine (8.56% with potential to move to 20.55%) Average production rate of 77% of nameplate rate achieved for the September
quarter. Ore mined during the quarter was 1,632,000t (wet). Ore transported to the
treatment plant during the quarter was 613,000t (dry). During the quarter 16,546t (dry) of mixed nickel cobalt hydroxide intermediate
product produced containing approximately 6,018t of nickel and 636t of cobalt. Currently assessing merits of nominating into the project to receive share of
operating surpluses.
Star Mountains – Copper Gold Porphyry Exploration Discussions continuing with potential joint venture partners for the next stage
of exploration programmes. Star Mountains camps remain on a care and maintenance basis. Four licences covering 515sqkms, approximately 25kms from the Ok Tedi
Mine. Of 17 identified copper-gold targets, six have been preliminarily drilled with
the majority intersecting copper-gold mineralisation.
Sewa Bay Nickel and Gold Exploration No work undertaken during the September quarter however discussion with
third parties in relation to joint venture opportunities are progressing.
COMMENTS by Managing Director John Gooding, “The completion of the Glencore-PanAust transaction is
great news and paves the way for PanAust to complete the feasibility study for their development concept. There are a number of further opportunities to be explored in their development concept but already the project is showing robust economics at consensus commodity pricing.” “The continued improvement in production at Ramu is pleasing and we are now assessing our nomination into the project early next year depending on continued production performance, nickel price and final year audited accounts. These operating surpluses will be used to pay our capped share of development costs with the remainder flowing through to us. We hope to be able to give further guidance on this early in the new year. In relation to Star Mountains we had hoped to have finalised joint venture discussions during the September quarter and while this did not occur we remain confident that finalisation is not far away.”
For
per
sona
l use
onl
y

About Frieda River Location: Located in the north-west of Papua New Guinea. Ownership: PanAust 80% Highlands 20%. 2007 - 2013: Glencore’s spend was US$300m on project studies and exploration. 2014: PanAust acquires 80% interest in the project. Late 2015: Feasibility study to be completed and SML application to be lodged. Late 2016: Permitting and approvals anticipated to be received. 2017: Construction to commence. 2019: Initial production and ramp-up to commence. The Frieda River district endowment totals some 2.8 billion tonnes of resource containing 12.9 Mt of copper and 20.4 Moz of gold. This makes it PNG’s largest and most important copper-gold project. The studies to date have focused only on the three deposits Horse, Ivaal and Trukai; estimated to contain 2,090 million tonnes at a grade of 0.45% copper, 0.22g/t gold and 0.70g/t silver
FRIEDA RIVER COPPER - GOLD PROJECT (20%)
On 25 August 2014 the share sale and purchase agreement between PanAust Limited (PanAust) and a subsidiary of Glencore plc (Glencore) for PanAust to acquire an 80% interest in the Frieda River Copper-Gold project in Papua New Guinea was finally completed. This was originally announced on 1 November 2013 but had been subject to a condition precedent relating to all applicable regulatory approvals. Also announced on 25 August 2014 and completed on 1 September 2014, PanAust exercised its right to subscribe to a second tranche of AU$5 million worth of shares in Highlands (64,432,990 shares at AU7.76 cents a share). This second placement sees PanAust’s holding in Highlands increase from 7.5% to 14.0% and lifted Highlands’ cash at bank at the time of the placement to AU$11 million. The terms of the agreement between PanAust and Highlands provide that should the Government of PNG elect to take up its right under PNG Law to 30% of the project, PanAust will sell down the first 20% of its joint venture interest and thereafter the parties will sell down in equal amounts. Under a scenario where the Government of PNG elects to take up its maximum 30% of the project, the respective joint venture interests would be PanAust 55%, the Government of PNG 30% and Highlands 15%. PanAust is responsible for 100% of the costs incurred by the Frieda River Joint Venture to finalise the definitive feasibility study for PanAust’s development concept and will appoint and fund the cost of an independent expert to provide a peer review. PanAust will also be responsible for 100% of the costs to maintain the Frieda River project site, assets and community relations programmes up to the point in time of lodgement of the Mining Lease or Special Mining Lease application. On 2 September 2014 PanAust announced details of the Frieda River feasibility study development concept which superseded the due diligence project parameters reported by PanAust on 1 November 2013. This update was the result of further data analysis and the development of a definitive scope for the feasibility study and a base case development concept completed during the period November 2013 to August 2014. In early October PanAust hosted a site visit for a number of analysts from Australia which further detailed the Frieda River feasibility study development concept (presentation released on 13 October 2014).
For
per
sona
l use
onl
y

Facility 2012 study Due Diligence New Feasibility
Concept
Case purpose Feasibility study acquisition development
Grinding circuit 2*(24MW SAG+2*16.4MW BM) 17MW SAG+2*10MW BM 26MW SAG+2*15MW BM
Throughput model Starkey Starkey Starkey
Nominal rate 50Mtpa 24Mtpa 30Mtpa ±20%
Mining fleet 6*shovels, 39*793 3*shovels, 32*793 5*shovels, 32*793
Power generation 200 MW hydro dam on Frieda 75 MW IFO at Iniok 110 MW IFO
Power price 0.4c /kWh 16 c/kWh 19 c/kWh
Power transmission 17 km @ 220 kV 130 km @ 110 kV 40 km @ 110 kV
Access road 130 km (ridges) 120 km (valley) 40km (valley)
River port Kubkain on Sepik River Iniok on Sepik River Airstrip on Frieda River
Export port Hansa Bay – silo vessel Wewak (trans-ship) Wewak (trans-ship)
Concentrate dewater port plant site plant site
Concentrate to port 126 km pipeline truck truck
Layout Separate mine and plant Combined mine and plant Combined mine and plant
Plant location 1 km from pit exit on Ekwai 1 km from pit exit to south 2 km from pit exit to north
TSF location Ok Binai above hydro dam Ok Binai Nena
Mine waste disposal crush/convey/barge to TSF Split - truck fines to TSF truck to TSF
Plant waste disposal sub-aqueous sub-aqueous 25%, sub-aerial 75% sub-aqueous
Camp 2 km from plant 3 km from plant Adjacent to plant
Scope change history
New feasibility study concept
Parameter Unit Feasibility
Concept
Production (average LOM)
Copper tpa 125,000
Gold oz 200,000
Physicals - LOM
Mine Life yrs 20
Strip Ratio (waste:ore) t:t 0.7:1
Processing rate Mtpa 30 +/-20%
Total Tonnes Treated Mt 600
Copper Head Grade % 0.50%
Gold Head Grade g/t 0.30
Opex - LOM
C1 Costs US$/lb 1.30 – 1.40
All-in Sustaining Costs US$/lb 1.60 – 1.70
Capex
Initial Development Capex (excl. leased) US$Bn Circa 1.7
• Higher production in the first 5 years with processing rates expected to be 20% higher than the 30Mtpa LOM average
• Costs worked up from scaled 2012 feasibility study data
• Costs worked up from scaled PhuKham actual data
• Key cost inputs verified with Ok TediMining Limited
For
per
sona
l use
onl
y

Parameter 2012 study New Feasibility Scaling
Mining inventory 964Mt 600Mt (initially) 62%
Ore grade 0.45% Cu, 0.26 g/t Au 0.5% Cu, 0.3 g/t Au 113%
Strip ratio (w:o) 1.1 0.7 64%
Mining waste 1,070Mt 400Mt 37%
Tailings waste 946Mt 590Mt 62%
Pre-strip 42Mt 11Mt 26%
Production rate 50Mtpa nominal, 65Mtpa peak 30Mtpa nominal, 36Mtpa peak 60%
Mine Life 20 yr 20 yr 100%
Ore hardness DWi 5.2 kWh/m3 4.5 kWh/m3 87%
Recovery Cu 84% 84% 100%
Recovery Au 70% 72% 103%
Production Cu 3.9 Mt 2.25 Mt 58%
Production Au 5.7 Moz 3.9 Moz 68%
Power Draw ~180 MW ~ 96MW 53%
Personnel ~3,200 ~1,500 47%
By the physicals – less is more!
For
per
sona
l use
onl
y
Horse-Ivaal-Trukai Mineral Resources at 0.2% Cu cut off and constrained by a pit shell (US$2.50/lb Cu & US$1,000/oz Au)
Category MT Cu(%) Au(g/t) Ag(g/t)
Measured 780 0.51 0.28 0.79
Indicated 410 0.44 0.20 0.72
Inferred 900 0.4 0.2 0.7
Total 2090 0.45 0.22 0.76
Koki Mineral Resources at 0.2% Cu cut off
Category MT Cu(%) Au(g/t)
Inferred 452 0.37 0.25
Ekwai Mineral Resources at 0.2% Cu cut off
Category MT Cu(%) Au(g/t)
Inferred 170 0.37 0.23
Competent Person Statement: The database information used for the Horse-Ivaal-Trukai, Koki and Ekwai Resource Estimates was compiled and verified as suitable for this estimate by Mr Larry Queen. Details contained in this report that pertain to the Horse-Ivaal-Trukai, Koki and Ekwai Resource Estimates are based upon, and fairly represent, information and supporting documents compiled by Mr Simon Tear. Mr Queen is a full-time employee of Highlands Pacific Group and a Member of The Australasian Institute of Mining and Metallurgy. Mr Tear is a full-time employee of H&S Consulting Pty Ltd and a Member of The Australasian Institute of Mining and Metallurgy. Both Mr Queen and Mr Tear have sufficient experience which is relevant to the style of mineralisation and type of deposit under consideration to qualify as a Competent Person as defined in the 2012 Edition of the ‘Australasian Code for Reporting of Exploration Results, Mineral Resources and Ore Reserves’. Mr Queen and Mr Tear consent to the inclusion in the report of the matters based on his information in the form and context in which it appears.
Nena Mineral Resources at 0.3% Cu cut off
Category MT Cu(%) Au(g/t) As(%) Sb(ppm)
Indicated 33 2.81 0.65 0.22 153
Inferred 12 1.84 0.45 0.14 88
Total 45 2.55 0.60 0.20 136
Competent Person Statement: Details contained in this report that pertain to the Nena Resource Estimates are based upon, and fairly represent, information and supporting documents compiled by Mr Paul Gow. Mr Gow is a Member of The Australasian Institute of Mining and Metallurgy and was a full-time employee of Glencore Xstrata plc at the time the estimate was prepared. Mr Gow has sufficient experience which is relevant to the style of mineralisation and type of deposit under consideration and to the activity which he is undertaking to qualify as a Competent Person as defined in the 2012 Edition of the ‘Australasian Code for Reporting of Exploration Results, Mineral Resources and Ore Reserves’. Mr Gow consents to the inclusion in the report of the matters based on his information in the form and context in which it appears. The information on the Frieda River project is extracted from the report entitled “Frieda – Mineral Resource & Ore Statement” created on 14 March 2014 and available on the Company website. Highlands confirms that it is not aware of any new information or data that materially affects the information included in the original market announcement and, in the case of estimates of Mineral Resources or Ore Reserves that all material assumptions and technical parameters underpinning the estimates in the relevant market announcement continue to apply and have not materially changed. Highlands confirms that the form and context in which the Competent Person’s findings are presented have not been materially modified from the original market announcement.
For
per
sona
l use
onl
y

About Ramu Nickel Cobalt Project Location: The Kurumbukari mine is connected to the Basamuk treatment plant by a 135km pipeline which is on the coast and 75 km east of the provincial capital of Madang, PNG. Production: The 3 autoclave Basamuk treatment plant is designed to have an annual production of 31,150 tonnes of nickel and 3,300 tonnes of cobalt. Equity: Highlands has an 8.56% interest in the project which will increase to 11.3% at no cost after internal project debt has been repaid from operating cash flow. Highlands has an option to acquire an additional 9.25% at fair market value which could increase its interest to 20.55%. Share: Highland’s share of product based on its 8.56% share is 2,666 tpa of nickel and 282 tpa of cobalt, rising to 3,520 tpa of nickel and 373 tpa of cobalt when equity increases to 11.30%. Highlands can market its share of product. Free Carry: The Ramu project debt funding is non-recourse to Highlands with Highlands’ equity interest free carried. About MCC: The project’s operator and majority owner is Hong Kong and Shanghai listed Metallurgical Corporation of China Limited (MCC). MCC is a multi-asset multi-disciplinary company, well known for its strength in scientific research, industrial engineering practice and international trading. MCC hold a 61% interest in MCC Ramu NiCo Limited which holds an 85% interest in the Project, with a number of other Chinese end user entities holding the remaining 39%.
RAMU NICKEL PROJECT (8.56% with potential to move to 20.55%)
The Kurumbukari mine, the Basamuk treatment plant and the 135km slurry pipeline to the treatment plant continues to ramp up to full production. The plant has achieved an average of 77% of nameplate capacity for September quarter against a planned rate of 80% and a continued improvement on the 52% achieved during the March quarter and 68% achieved during the June quarter. The operator continues to forecast 22,000 tonnes of nickel (70% of name plate capacity) for the 2014 year before reaching full production of 31,150 tonnes of nickel in 2015. Sales contracts are in place for the full 2014 and 2015 forecast production with Chinese and international buyers. The mid-range forecasts for the LME Nickel price remain positive with deficits forecasted for years 2015 to 2017.
2012 Year
2013 Year
2014 YTD
Name-plate
Ore Mined (wet tonnes) 1,547,000 3,481,800 4,365,550 8,500,000
Ore Processed (dry tonnes) 647,000 1,252,998 1,647,037 3,400,000
MHP Produced (dry tonnes) 13,777 29,736 41,879 78,000
Contained Nickel (tonnes) 5,283 11,369 15,410 31,150
Contained Cobalt (tonnes) 469 1,013 1,593 3,300
MHP Shipped (dry tonnes) 576 39,472 40,632 78,000
Contained Nickel (tonnes) 217 15,123 15,079 31,150
Contained Cobalt (tonnes) 19 1,338 1,549 3,300
Percentage of Nameplate Production Capacity
17% 36% 66% 100%
2014 Mar Qtr
2014 June Qtr
2014 Sept Qtr
Ore Mined (wet tonnes) 1,283,975 1,449,950 1,631,625
Ore Processed (dry tonnes)
454,466 579,906 612,665
MHP Produced (dry tonnes)
10,871 14,468 16,540
Contained Nickel (tonnes) 4,080 5,312 6,018
Contained Cobalt (tonnes) 413 543 636
MHP Shipped (dry tonnes) 5,433 18,940 16,259
Contained Nickel (tonnes) 2,081 7,030 5,968
Contained Cobalt (tonnes) 203 711 635
Percentage of Nameplate Production Capacity
52% 68% 77%
For
per
sona
l use
onl
y

All major operating elements of the treatment plant are working as designed. Additional washplant capacity is being commissioned in October and should be fully operational from November. This is at no cost to Highlands and is expected to enhance production ramp up to nameplate capacity. Importantly for Highlands there is no recourse for operating cash flow shortages during this ramp-up stage, with Highlands and its PNG Joint Venture partner MRDC protected from capital increases and ramp-up operating losses.
Loading MHP product on to ship for sale
Mining of laterite ore at Kurumbukari mine site
For
per
sona
l use
onl
y
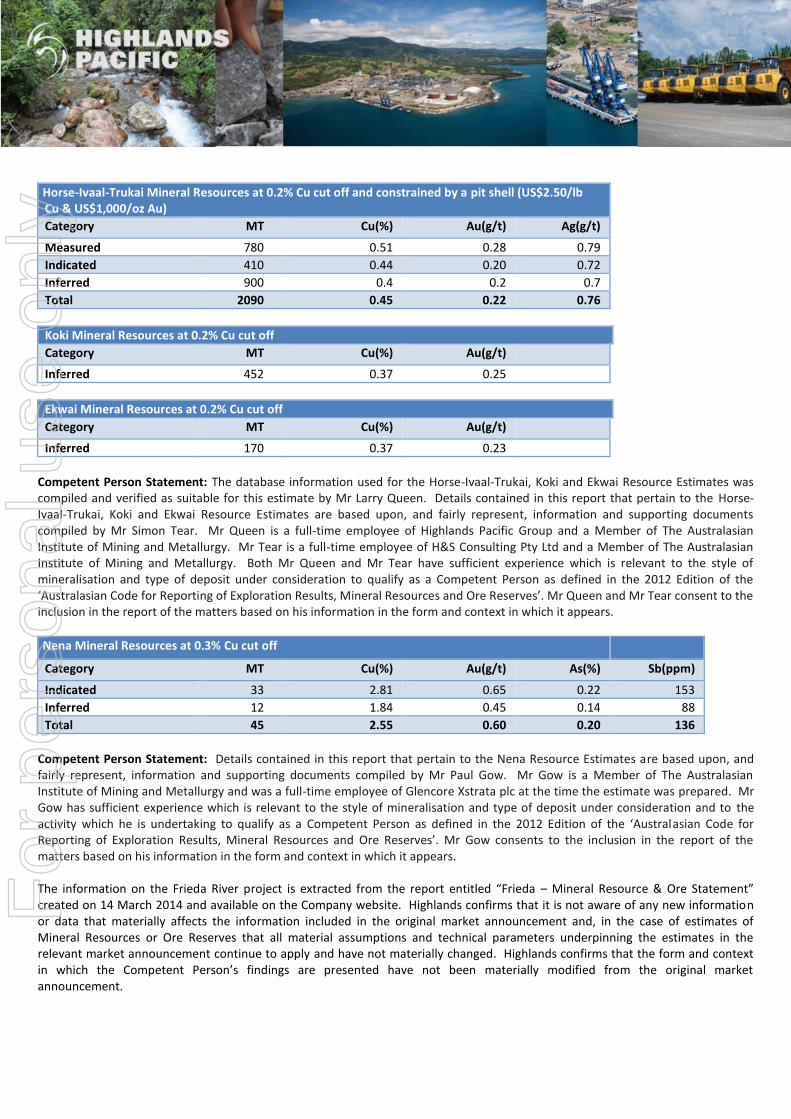
Ramu Mineral Resources (at a 0.5% nominal cut-off and excluding oversize (+2mm))
Kurumbukari
Category MT Ni(%) Co(%)
Measured 40 0.9 0.1
Indicated 7 1.4 0.1
Inferred 4 1.2 0.1
Total 51 1.0 0.1
Ramu West
Category MT Ni(%) Co(%)
Indicated 17 0.8 0.1
Inferred 3 1.5 0.2
Total 20 0.9 0.1
Greater Ramu
Category MT Ni(%) Co(%)
Inferred 60 1.0 0.1
Global Total MT Ni(%) Co(%)
131 1.0 0.1
Competent Persons Statement: The information in this report that relates to Ramu Mineral Resources is based on information compiled by Mr Larry Queen, who is a Member of The Australasian Institute of Mining and Metallurgy. Mr Queen is a full-time employee of Highlands Pacific and has sufficient experience which is relevant to the style of mineralization and type of deposit under consideration and to the activity which he is undertaking to qualify as a Competent Person as defined in the 2012 Edition of the ‘Australasian Code for Reporting of Exploration Results, Mineral Resources and Ore Reserves’. Mr Queen consents to the inclusion in the report of the matters based on his information in the form and context in which it appears.
For
per
sona
l use
onl
y

Ramu Ore Reserve
Kurumbukari
Category MT Ni(%) Co(%) Rocks +2mm MT
Proved 35 0.9 0.1
Probable 7 1.4 0.1 11
Total 42 1.0 0.1 11
Ramu West
Category MT Ni(%) Co(%) Rocks +2mm MT
Proved
Probable 14 0.9 0.1
Total 14 0.9 0.1
Global Total MT Ni(%) Co(%)
55 1.0 0.1 11
Competent Persons Statement: Details contained in this report that pertain to the Ramu Ore Reserve Estimate are based upon, and fairly represent, information and supporting documentation compiled by Mr Patrick Smith, a Member of The Australasian Institute of Mining and Metallurgy CP (Min) and a full-time employee of AMC Consultants Pty Ltd. Mr Smith has sufficient experience which is relevant to the style of mineralization and type of deposit under consideration and to the activity which he is undertaking to qualify as a Competent Person as defined in the 2012 Edition of the ‘Australasian Code for Reporting of Exploration Results, Mineral Resources and Ore Reserves.’ Mr Smith consents to the inclusion in the report of the matters based on his information in the form and context in which it appears. The information on the Ramu project is extracted from the report entitled “Ramu – Mineral Resource & Ore Statement” created on 14 March 2014 and available on the Company website. Highlands confirms that it is not aware of any new information or data that materially affects the information included in the original market announcement and, in the case of estimates of Mineral Resources or Ore Reserves that all material assumptions and technical parameters underpinning the estimates in the relevant market announcement continue to apply and have not materially changed. Highlands confirms that the form and context in which the Competent Person’s findings are presented have not been materially modified from the original market announcement.
For
per
sona
l use
onl
y

Location: The Star Mountains refers to a range of mountains in far west PNG. The first prospect drilled, Olgal, is approx 20kms NE of the Ok Tedi copper mine. Total area 515km2 History: First explored by Kennecott in the early 1970s. Kennecott went on to discover the Ok Tedi deposit. 2011 Program: Focused on the completion of Stage 1 drilling program on the Olgal prospect. 2012 Program: 5,587m of drilling for 17 holes covering 6 prospect areas. Ownership: The Tifalmin lease (EL 1392), Munbil (EL 1781), Benstead (EL 2001) and the Nong River lease (EL 1312) are 100% owned by Highlands. All lease interests are subject to potential 30% PNG Government participation should it elect to do so.
STAR MOUNTAINS - COPPER GOLD PORPHYRY EXPLORATION
The project remains on a care and maintenance basis, however discussions with potential joint venture partners for the next stage of exploration programmes are continuing. To date the company has preliminarily drilled six of 17 targets with the majority of the targets producing shows of porphyry style copper-gold mineralisation.
Olgal Prospect: 12 of 14 holes encountering copper and gold mineralisation with two significant successes.
Futik Prospect: 2 of 4 holes encountering copper and gold mineralisation.
Rattatat Prospect: showed narrow intercepts of porphyry copper style mineralisation.
Kum Kom Prospect: 1 of 2 holes encountered a significant intercept of skarn type alteration.
For
per
sona
l use
onl
y

Location: Normanby Island, Milne Bay Province Ownership: The Esa’ala lease (EL 1761) is 100% owned by Highlands. Area: 758 km2
SEWA BAY – NICKEL LATERITE / GOLD EXPLORATION
There was no work undertaken during the September quarter however discussion with third parties in relation to joint venture opportunities are progressing. These discussions will continue in the December quarter. As reported earlier a reconnaissance auger sampling program was carried out during the June 2013 quarter with 43 auger and 13 rock chip samples collected from the three main exposures of ultramafic rocks. The sampling program confirmed the extent of the ultramafic bedrock (dunites and pyroxenites) and the wide spread development of laterite soil over these rocks. Thickness of the laterite soil varied from 0 metres on the slopes to +3 metres over the low relief benches and hill tops. Results were released on 9 August 2013 and were encouraging.
STAR MOUNTAINS & SEWA BAY Competent Persons Statement: Details contained in this report that pertain to exploration results and exploration targets are based upon, and fairly represent, information and supporting documentation compiled by Mr Larry Queen, a member of the Australasian Institute of Mining and Metallurgy, and who is a full-time employee of Highlands Pacific. Mr Queen has sufficient experience relevant to the style of mineralisation and the type of deposit under consideration, and to the activity which he is undertaking, to qualify as a Competent Person as defined in the 2012 edition of the “Australasian Code for Reporting of Exploration Results, Mineral Resources and Ore Reserves”. Mr Queen consents to the inclusion in the report of the matters based on the information compiled by him in the form and context in which it appears.
The information on Star Mountains and Sewa Bay is extracted from the report entitled “Exploration – Table One Results” created on 14 March 2014 and available on the Company website. Highlands confirms that it is not aware of any new information or data that materially affects the information included in the original market announcement and, in the case of estimates of Mineral Resources or Ore Reserves that all material assumptions and technical parameters underpinning the estimates in the relevant market announcement continue to apply and have not materially changed. Highlands confirms that the form and context in which the Competent Person’s findings are presented have not been materially modified from the original market announcement.
For
per
sona
l use
onl
y

A T T A C H M E N T 1
LIST OF MINING TENEMENTS
(All located in Papua New Guinea)
Tenement Reference
Beneficial Interest at Commencement of
Period
Beneficial Interest at End of Period
Location - Province
Exploration (Highlands Pacific Resources Limited)
ELs 1312, 1392, 1781 and 2001
EL 1761
EL 2131
100% Note 1
100% Note 1
100% Note 1
100% Note 1
100% Note 1
100% Note 1
Sanduan Province
Milne Bay Province
Western Province
Frieda River Project (Highlands Frieda Limited)
ELs 0058, 1895 and 1956
ELs 1212, 1746 and 1957
ELs 1743, 1744, 1745, and 1896
20% Note 1, 3
20% - Note 1,3
20% - Note 1,3
20% Note 1, 3
20% Note 1, 3
20% - Note 1,3
Sanduan Province
Sanduan & East Sepik Province
East Sepik Province
Ramu Project (Ramu Nickel Limited)
SML 8
ML 149
LMPs 42, 43, 44, 45, 46, 47, 48 and 49
MEs 75, 76, 77, 78 and 79
ELs 193 and 1178
8.56%
8.56%
8.56%
8.56%
8.56%
8.56%
8.56%
8.56%
8.56%
8.56%
Madang Province
Madang Province
Madang Province
Madang Province
Madang Province
Mining Tenements acquired or disposed of during the quarter – nil. Beneficial percentage interests held in farm-in or farm-out agreements – all the mining tenements for the Frieda River Project and the Ramu Project are held in joint venture. The percentage detailed in the table above indicates the percentage held by Highlands. Beneficial percentage interests in farm-in or farm-out agreements acquired or disposed of during the quarter – nil.
NOTES
1. Subject to the right of the Independent State of Papua New Guinea to acquire a 30% equity interest in any mining development in that country by paying its pro-rata share of historical sunk costs and future developments costs.
2. Definitions:
EL - Exploration Licence ELA - Exploration Licence Application SML - Special Mining Lease ML - Mining Lease LMP - Lease for Mining Purpose ME - Mining Easements
3. Refer section on Frieda for change in ownership explanation.
For
per
sona
l use
onl
y

A P P E N D I X 5 B
MINING EXPLORATION ENTITY QUARTERLY REPORT
Name of entity
ACN or ARBN QUARTER ENDED (“CURRENT QUARTER”)
NOTE: As Highlands operating and mining development decisions are based on US dollars, Highlands Directors have adopted the US dollar as Highlands functional and management reporting currency. For ease of understanding by the Australian and PNG investment communities, results have been converted, in this report, to $A at the rate ruling at the end of the quarter of $A/$US 0.8752.
CONSOLIDATED STATEMENT OF CASH FLOWS
Current quarter Current quarterYear to date
(9 months)
Year to date
(9 months)
$US'000 $A'000 $US'000 $A'000
Cash flows related to operating activities
1.1 Receipts from product sales and related debtors 2 2 7 8
1.2 Payments for:
(a) exploration and evaluation (508) (580) (1,335) (1,525)
(b) development - - - -
(c) production - - - -
(d) administration (848) (969) (2,677) (3,059)
1.3 Dividends received - - - -
1.4 Interest and other items of a similar nature received 43 49 87 99
1.5 Interest and other costs of finance paid - - - -
1.6 Income taxes paid - - - -
1.7 Other - - - -
Net Operating Cash Flows (1,311) (1,498) (3,918) (4,477)
Cash flows related to investing activities
1.8 Payment for purchases of:
(a) prospects - - - -
(b) equity investments - - - -
(c) other fixed assets (2) (2) (2) (2)
1.9 Proceeds from sale of: - -
(a) prospects - - - -
(b) equity investments - - - -
(c) other fixed assets - - - -
1.10 Loans to other entities - - - -
1.11 Loans repaid by other entities - - - -
1.12 Other - - - -
Net investing cash flows (2) (2) (2) (2)
1.13 Total operating and investing cash flows (carried forward) (1,313) (1,500) (3,920) (4,479)
HIGHLANDS PACIFIC LIMITED
ARBN 078 118 653 30 September 2014
For
per
sona
l use
onl
y
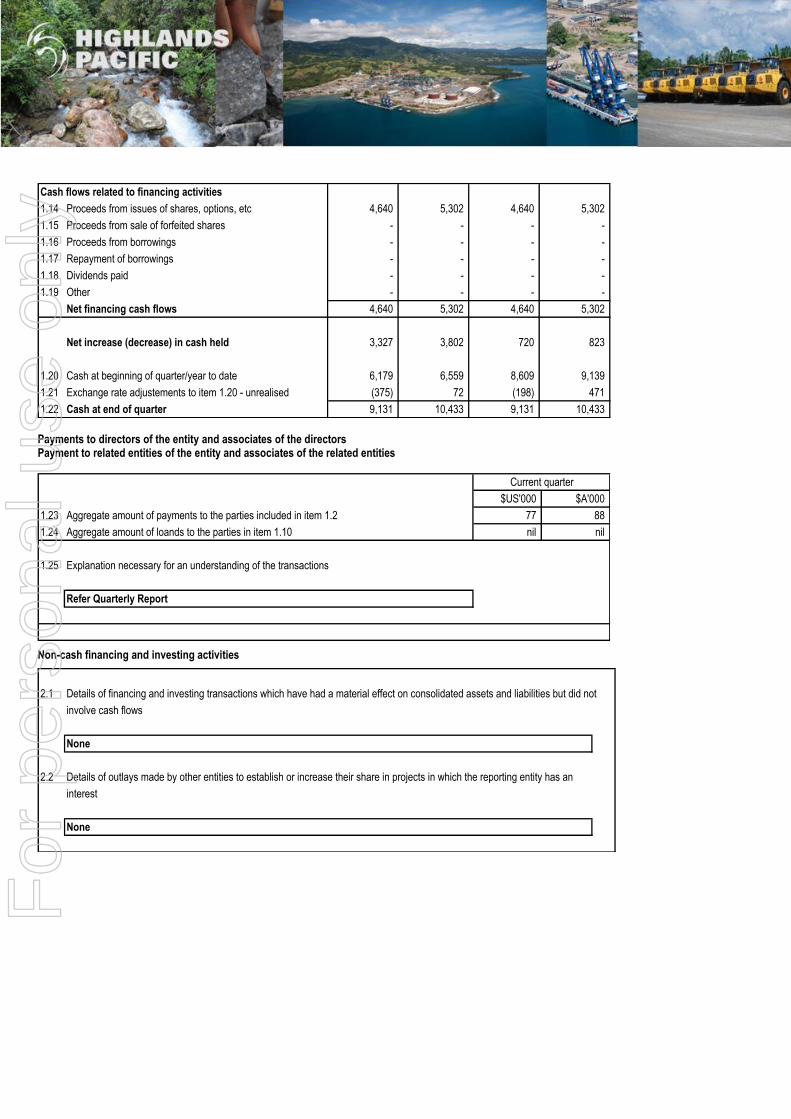
Cash flows related to financing activities
1.14 Proceeds from issues of shares, options, etc 4,640 5,302 4,640 5,302
1.15 Proceeds from sale of forfeited shares - - - -
1.16 Proceeds from borrowings - - - -
1.17 Repayment of borrowings - - - -
1.18 Dividends paid - - - -
1.19 Other - - - -
Net financing cash flows 4,640 5,302 4,640 5,302
Net increase (decrease) in cash held 3,327 3,802 720 823
1.20 Cash at beginning of quarter/year to date 6,179 6,559 8,609 9,139
1.21 Exchange rate adjustements to item 1.20 - unrealised (375) 72 (198) 471
1.22 Cash at end of quarter 9,131 10,433 9,131 10,433 Payments to directors of the entity and associates of the directors Payment to related entities of the entity and associates of the related entities
$US'000 $A'000
1.23 Aggregate amount of payments to the parties included in item 1.2 77 88
1.24 Aggregate amount of loands to the parties in item 1.10 nil nil
1.25 Explanation necessary for an understanding of the transactions
Refer Quarterly Report
Current quarter
Non-cash financing and investing activities
2.1 Details of financing and investing transactions which have had a material effect on consolidated assets and liabilities but did not
involve cash flows
None
2.2 Details of outlays made by other entities to establish or increase their share in projects in which the reporting entity has an
interest
None
For
per
sona
l use
onl
y

Financing facilities available
$US'000 $A'000 $US'000 $A'000
3.1 Loan facilities Nil Nil n/a n/a
3.2 Credit standby arrangements Nil Nil n/a n/a
Amount available Amount used
Estimated cash outflows for next quarter
$US'000 $A'000
4.1 Exploration and evaluation
Wau/Bulolo - -
Nong River / Tifalmin 240 274
Frieda Holding Costs (joint venture costs funded by PanAust) 30 34
Total Exploration and evaluation 270 309
4.2 Development
Other - -
Total Development - -
4.3 Ramu Production - Holding Costs (joint venture costs funded by MCC) 78 89
4.4 Administration 854 976
Total 1,202 1,373
Reconciliation of cash
Reconciliation of cash at the end of the quarter (as shown in the Current quarter Current quarter Previous quarter Previous quarter
consolidated statement of cash flows) to the related items in the $US'000 $A'000 $US'000 $A'000
accounts is as follows.
5.1 Cash on hand and at bank 3,404 3,889 1,122 1,191
5.2 Deposits at call - - - -
5.3 Bank overdraft - - - -
5.4 Other short-term deposits 5,727 6,544 5,057 5,368
Total cash at end of quarter (item 1.22) 9,131 10,433 6,179 6,559
Changes in interests in mining tenements
Tenement Nature of interest Interest at Interest at
reference (note 2) beginning of qtr end of qtr
6.1 Interests in mining tenements relinquished, reduced or Refer Table 2
lapsed in Quarterly Report
Refer Table 2
6.2 Interests in mining tenements acquired or increased in Quarterly Report
For
per
sona
l use
onl
y

Issued and quoted securities at end of current quarter Description includes rate of interest and any redemption or conversion rights together with prices and dates.
Total number Number quotedIssue price per
security (cents)
Amount paid up per
security (cents)
7.1 Preference + securities (description)
7.2 Issued during quarter
7.3 + Ordinary securities 918,694,336 918,694,336
7.4 Issued during quarter 64,432,990 64,432,990
7.5
+ Convertible debt securities (decscription and
conversation factor)
7.6 Issued during quarter
Refer Attachment A Exercise Price
7.7 Options (description and conversation factor)
Directors' and Executives' Option Incentive Scheme 7,225,000 Nil Refer attached Nil
Performance Rights Plan 24,370,000 Nil Refer attached Nil
7.8 Issued during quarter (Performance Rights) Nil n/a n/a n/a
7.9 Exercised during quarter (Performance Rights) Nil n/a n/a n/a
7.10 Expired & lapsed during quarter (PR's) Nil n/a n/a n/a
7.11 Debentures Nil Nil
(totals only)
7.12 Unsecured notes (totals only) Nil Nil
For
per
sona
l use
onl
y

COMPLIANCE STATEMENT
1 This statement has been prepared under accounting policies which comply with accounting standards as de fined in the Corporations Law or other
standards acceptable to ASX (see note 4). 2 This statement does give a true and fair view of the matters disclosed.
Sign here: …………………………..………………………………. Date: 28 October 2014 (Director/Company Secretary)
Print name: C T LENNON Notes 1 The quarterly report provides a basis for informing the market how the entity’s activities have been financed for the past quarter and the effect on its cash
position. An entity wanting to disclose additional information is encouraged to do so, in a note or notes attached to this report 2 The “Nature of interest” (items 6.1 and 6.2) includes options in respect of interests in mining tenements acquired, exercised or lapsed during the reporting
period. If the entity is involved in a joint venture agreement and there are conditions precedent which will change its percentage interest in a mining tenement, it should disclose the change of percentage interest and conditions precedent in the list required for items 6.1 and 6.2.
3 Issued and quoted securities The issue price and amount paid up is not required in items 7.1 and 7.3 for fully paid securities. 4 The definitions in, and provisions of, AASB 1022: Accounting for Extractive Industries and AASB 1026: Statement of Cash Flows apply to this report. 5 Accounting Standards ASX will accept, for example, the use of International Accounting Standards for foreign entities. If the standards used do not
address a topic, the Australian standard on that topic (if any) must be complied with.
For
per
sona
l use
onl
y

A T T A C H M E N T A
HIGHLANDS PACIFIC LIMITED
APPENDIX 5B – ITEM 7.7
OPTIONS (DESCRIPTION AND CONVERSION FACTOR)
Outstanding at the end of the quarter
Details Issued Previously
Exercised
Exercise Price A$0.266
Number of Options 5,000,000 Nil
Expiry Date 31 Mar 2015
Exercise Price A$0.266
Number of Options 2,725,000 500,000
Expiry Date 31 Mar 2015
There were no options that lapsed during the quarter
There were no options issued during the quarter
There were no options exercised during the quarter
For
per
sona
l use
onl
y

PERFORMANCE RIGHTS (DESCRIPTION AND CONVERSION FACTOR)
Outstanding at the end of the quarter
Details Issued Previously
Exercised
Exercise Price A$0.00
Number of Performance Rights 4,430,000
Expiry Date 31 Dec 2014
(Subject to service and performance conditions)
Exercise Price A$0.00
Number of Performance Rights 7,200,000
Expiry Date 31 Dec 2015
(Subject to service and performance conditions)
Exercise Price A$0.00
Number of Performance Rights 12,740,000
Expiry Date 31 Dec 2016
(Subject to service and performance conditions)
No Performance Rights were issued during the quarter
No Performance Rights lapsed or were exercised during the quarter
For
per
sona
l use
onl
y
Recommended
![VENTURE CAPITAL FOR SUSTAINABILITY 2007 REPORT [2007] Venture Capital... · growing sector as Venture Capital for Sustainability ... Venture Capitalists’ stake in ... Venture Capital](https://img.pdfslide.us/doc/110x75/5a7926b77f8b9a00168dc540/venture-capital-for-sustainability-2007-2007-venture-capitalgrowing-sector.jpg)