1
Enhanced Dispersion and Stability of Petroleum Coke Water Slurries via
Triblock Copolymer and Xanthan Gum: Rheological and Adsorption Studies
Supporting Information
Brian P. Williams1, Shubham Pinge
1, Young-Kwang Kim
2, Juhoe Kim
2, and Yong Lak Joo
1,*
1 School of Chemical and Biomolecular Engineering, Cornell University, Ithaca, NY 14853 USA
2 Energy R&D Center, SK Innovation, Daejeon, 305-712, Korea
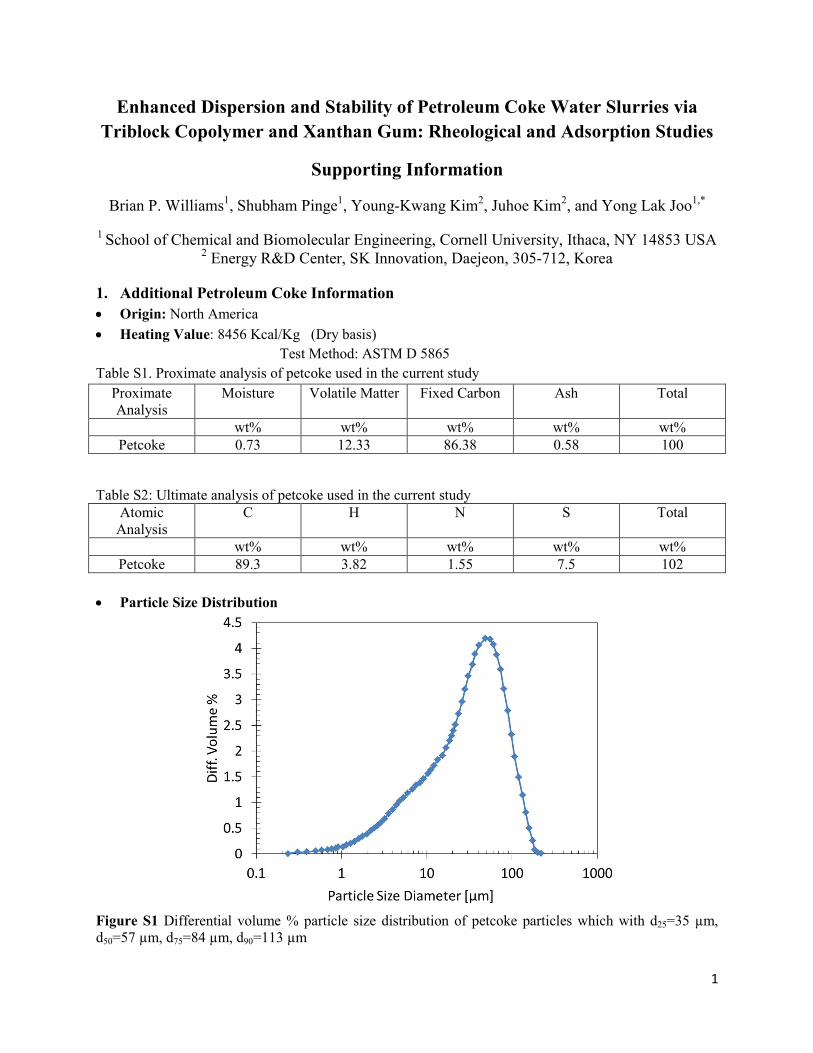
1. Additional Petroleum Coke Information
• Origin: North America
• Heating Value: 8456 Kcal/Kg (Dry basis)
Test Method: ASTM D 5865
Table S1. Proximate analysis of petcoke used in the current study
Proximate
Analysis
Moisture Volatile Matter Fixed Carbon Ash Total
wt% wt% wt% wt% wt%
Petcoke 0.73 12.33 86.38 0.58 100
Table S2: Ultimate analysis of petcoke used in the current study
Atomic
Analysis
C H N S Total
wt% wt% wt% wt% wt%
Petcoke 89.3 3.82 1.55 7.5 102
• Particle Size Distribution
Figure S1 Differential volume % particle size distribution of petcoke particles which with d25=35 µm,
d50=57 µm, d75=84 µm, d90=113 µm
2
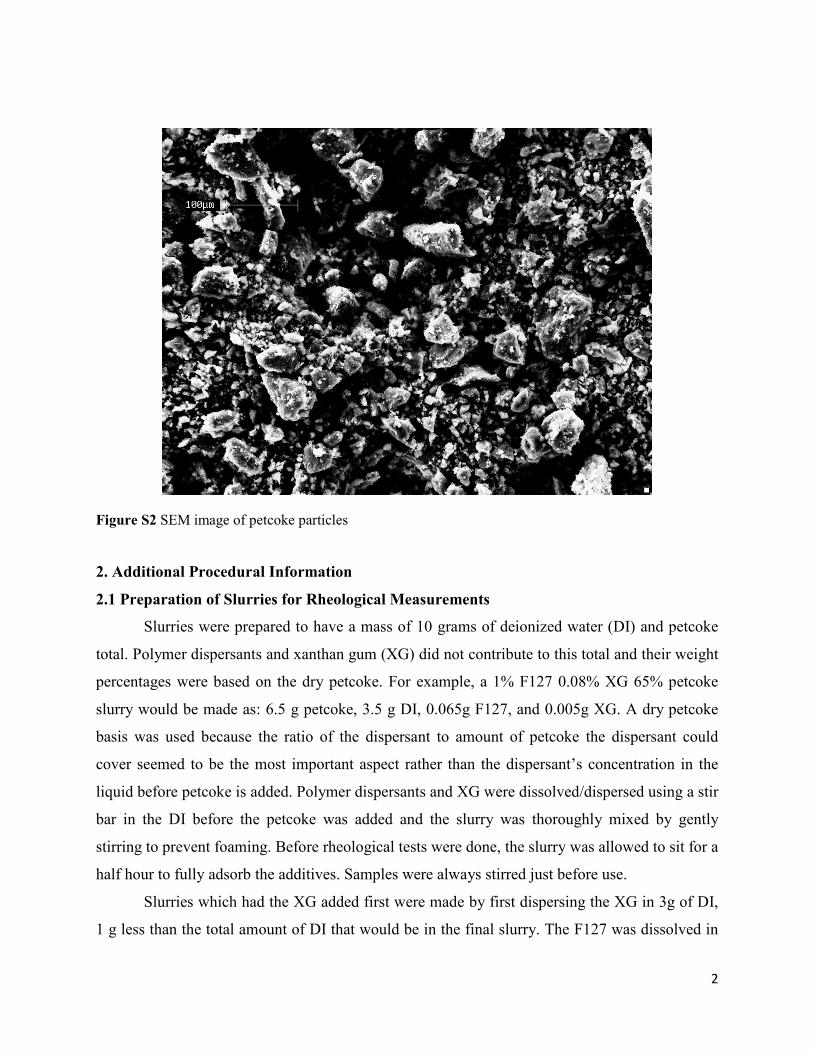
Figure S2 SEM image of petcoke particles
2. Additional Procedural Information
2.1 Preparation of Slurries for Rheological Measurements
Slurries were prepared to have a mass of 10 grams of deionized water (DI) and petcoke
total. Polymer dispersants and xanthan gum (XG) did not contribute to this total and their weight
percentages were based on the dry petcoke. For example, a 1% F127 0.08% XG 65% petcoke
slurry would be made as: 6.5 g petcoke, 3.5 g DI, 0.065g F127, and 0.005g XG. A dry petcoke
basis was used because the ratio of the dispersant to amount of petcoke the dispersant could
cover seemed to be the most important aspect rather than the dispersant’s concentration in the
liquid before petcoke is added. Polymer dispersants and XG were dissolved/dispersed using a stir
bar in the DI before the petcoke was added and the slurry was thoroughly mixed by gently
stirring to prevent foaming. Before rheological tests were done, the slurry was allowed to sit for a
half hour to fully adsorb the additives. Samples were always stirred just before use.
Slurries which had the XG added first were made by first dispersing the XG in 3g of DI,
1 g less than the total amount of DI that would be in the final slurry. The F127 was dissolved in

3
remaining 1g of water in a separate vial. The full 6 g petcoke (60wt%) was added to the XG
containing vial, thoroughly mixed, and was allowed to sit for 1 hour. Then the dissolved F127
was added and mixed.
Slurries that were prepared just below, at, or above the maximum loading were prepared
by first finding the approximate maximum loading with a separate slurry sample. A 1%
dispersant 74% petcoke slurry, which was above the maximum loading for any dispersant, was
prepared and DI was slowly added and mixed in at 0.1 to 0.2g increments until a slow flow could
be seen. Then several slurries around that concentration were made to confirm the visual
observation with the rheometer for several samples.
2.2 Procedure for Rheometry Experiments
Rheological measurements were taken with a Physica MCR 300 rheometer with a 50 mm
parallel plate at a 1mm gap. Low viscosity light mineral oil was used at the edges to prevent
water evaporation. Ten seconds were allowed to reach equilibrium for every point measured.
Ramps proceeded on a “points per a decade” fashion and ten points were taken per a decade.
Each ramp took approximately 5 minutes. Approximately 4.5g of sample was used in each test.
Experiments which required shear rate ramps and shear stress ramps each had their own fresh
sample placed on the rheometer. Shear rate ramps and shear stress ramps were immediately
repeated on the same sample several times to obtain steady state responses. The second run of
these ramps was reported as they were the most reproducible. Allowing up to 5 minutes between
the first and second run for any structure broken down in the first run to potentially reform did
not significant change the response in the second run. It was thought that if delicate XG
structures which take a long time to reform were an issue that the stirring performed before
placing the sample on the rheometer to disperse any sediment would disrupt them anyway. Also
samples which can settle quickly showed less settling behavior when they were not allowed to
rest.
2.3 Adsorption Isotherm
20wt% petcoke slurries with varying wt% F127 were made and were allowed to settle
overnight. The liquid that could be easily poured off was filtered using a PTFE 0.2 µm VWR
syringe filter and was massed. The syringe and syringe filter were rinse in a 1% F127 solution

4
and then rinsed with DI water several times before their use. Solutions which do contain petcoke
such as the 1% F127 solution contained the same initial F127 liquid concentration as a 60%
petcoke slurry. From there the maximum mass of F127 that could be in the filtrate, assuming
uniform F127 concentration, was calculated from the percent of filtrate which was recovered
from the original slurry solution including the mass of the polymer. The filtrate was dried and the
resulting Pluronic residue was massed. The fraction of the F127 mass not in the filtrate but could
have been was assumed to have adsorbed to the petcoke, and this fraction was multiplied by total
mass of F127 added to the original slurry to calculate the mass of F127 adsorbed. The mass
adsorbed was then divided by the mass of petcoke in the slurry and the surface area of the
petcoke. The BET surface area of the petcoke was measured to be 1.7m2/g in liquid nitrogen with
a Gemini VII 2390t.
2.4 AFM Sample Preparation
Atomic force images (AFM) were taken with an Asylum MFP-3D in tapping mode using
100 µm silicon nitride cantilevers in deionized water at a frequency ~7kHz and an amplitude of
~1-3V. Petcoke was fixed to glass slides using epoxy and were allowed to equilibrate with the
dispersant solution for 1 hour. The solutions were made like the solutions used for a 60%
petcoke slurry except no petcoke was added.
To the make the 0.1% F127 solution used in the AFM, 0.1% F127 20% petcoke slurry
was made with petcoke and allowed to equilibrate overnight. The liquid which was used in the
AFM was then separated from the slurry using a PTFE 0.2 µm VWR syringe filter that was
rinsed and washed with 1% F127 solution and DI water. The filtrate was used because at this
concentration of F127 there is not enough F127 to cover all the surface area in the native slurry,
though when there are only a few petcoke particles epoxied to a glass slide such as in the AFM
sample, there is more than enough to cover every particle even with a low concentration standard
solution made from directly dissolving 0.1% F127. To reproduce the concentration of F127 in
the liquid phase after equilibrium is reached with the majority of petcoke particles in slurry, the
liquid proportion of a 0.1% F127 slurry was used. This was not necessary at 1% since only a
small fraction of the F127 in the slurry is actually adsorbed to the surface.
To create the sample with F127 first then XG, a standard 1% F127 solution was added to the
slide and allowed to equilibrate. The F127solution was then poured off and rinsed with excess

5
1% F127 0.08% XG solution, and then the F127 + XG solution was added and allowed to
equilibrate for 1 hour.
2.5 XPS and Contact Angle Measurements
X-ray photoelectron spectroscopy was performed with a Surface Science Instruments X-
Probe SSX-100 by Cornell Center for Materials Research technical staff and the data was
analyzed with CasaXPS. Contact angle measurements were taken with a Rame-Hart 500
goniometer and were analyzed with Image J. Powder samples are applied to painter’s tape and
the excess was shaken off. To find a clear baseline, powder was lightly scrapped near the drop.
Multiple drops ~3 µL of deionized water were measured on petcoke and lignite and a single
image was selected to show in section 4. A contact angle measurement was taken of the tape to
show that the tape had little impact on the measured angle. Even with the tape, small amounts of
powder did adhere to the surface of drop making some drops unsymmetrical towards the bottom
of the drop. Measurements were carried out the side of drop where the powder adhering to the
drop was minimal.
3. Supplemental Results
3.1 XPS Analysis

6
Figure S3 XPS results of three different carbon samples: a) petcoke, b) lignite, and c) carbonized PAN

7
3.2 Contact Angle Images
Figure S4 Contact angle measurements of a) petcoke, b) lignite, c) carbonized PAN, and d) supporting
tape
8
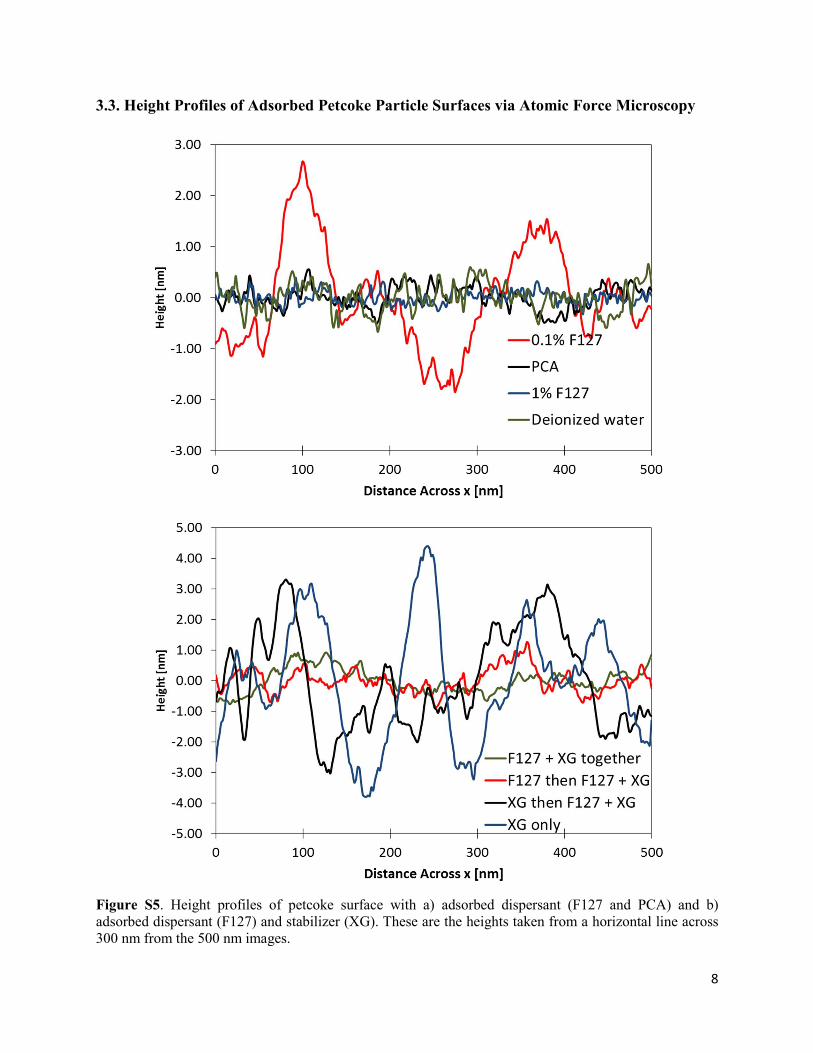
3.3. Height Profiles of Adsorbed Petcoke Particle Surfaces via Atomic Force Microscopy
Figure S5. Height profiles of petcoke surface with a) adsorbed dispersant (F127 and PCA) and b)
adsorbed dispersant (F127) and stabilizer (XG). These are the heights taken from a horizontal line across
300 nm from the 500 nm images.
Recommended