Lopa Parikh, Edison Electric Institute
National Conference of State Legislatures
Indianapolis, Indiana
June 27, 2018
Introduction to Electricity Markets
Overview of the Electric Industry Regulation
3
▪ 1890s—Electric utilities began to develop primarily inurban areas because of economies of scale
▪ Industry had characteristics of a “natural monopoly” – A natural monopoly is where, for technical and social reasons, it is most
efficient to have only one provider of a good or service• Exclusive utility franchises came with an obligation to serve all customers
in a defined service area• Provided service regarded as vital to economic and
social fabric of community (i.e., a “public utility”)• Operated through large, integrated networks• Highly capital-intensive, requiring significant investment
▪ 1907—State regulation of electric utilities began in New York and Wisconsin
– Regulation spreads to two-thirds of states by 1920– Shareholder-owned utilities are now regulated in all 50 states
State Regulation of Shareholder -
Owned Utilities
4
1935:Congress passed federal legislation regulating interstate utility operations
Federal Regulation of Shareholder
- Owned Utilities
Federal Power Act (FPA)
Regulates interstate sales and resale of electricity, primarily of shareholder-owned utilities
Public Utility Holding Company Act (PUHCA)
Addressed corporate structure of utilities
5
▪ FERC is an independent regulatory agency in the Executive
Branch.
▪ Its predecessor is the Federal Power Commission (FPC).
▪ FPC was reorganized as FERC in 1977.
FERC
• Although officially organized as part of the Department of Energy, FERC is an independent government agency.
• Headquarters: Washington D.C.
• Regional offices: Atlanta, Chicago, New York, Portland, Carmel, Sacramento, Little Rock and San Francisco. (Primary responsibilities: monitor hydropower dam safety, environmental compliance, and RTOs.)
6
▪ FERC has limited jurisdiction as provided by Congress
- Federal Power Act
- Natural Gas Act
- Interstate Commerce Act
- PURPA
- Authority as delegated by DOE
FERC Jurisdiction
7
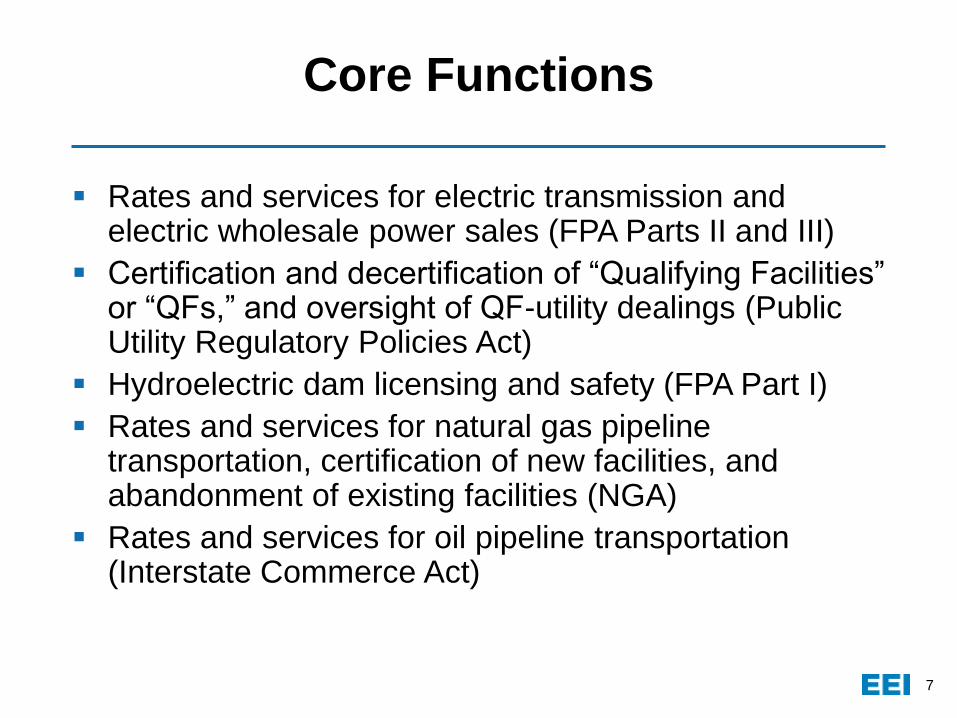
▪ Rates and services for electric transmission and electric wholesale power sales (FPA Parts II and III)
▪ Certification and decertification of “Qualifying Facilities” or “QFs,” and oversight of QF-utility dealings (Public Utility Regulatory Policies Act)
▪ Hydroelectric dam licensing and safety (FPA Part I)
▪ Rates and services for natural gas pipeline transportation, certification of new facilities, and abandonment of existing facilities (NGA)
▪ Rates and services for oil pipeline transportation (Interstate Commerce Act)
Core Functions
8
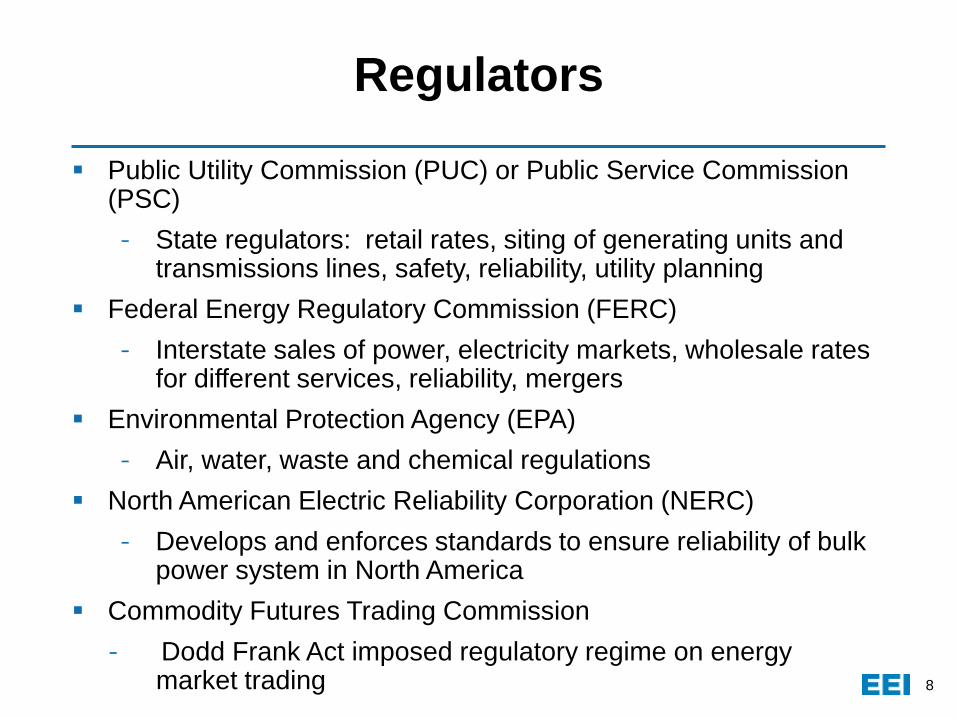
▪ Public Utility Commission (PUC) or Public Service Commission (PSC)
- State regulators: retail rates, siting of generating units and transmissions lines, safety, reliability, utility planning
▪ Federal Energy Regulatory Commission (FERC)
- Interstate sales of power, electricity markets, wholesale rates for different services, reliability, mergers
▪ Environmental Protection Agency (EPA)
- Air, water, waste and chemical regulations
▪ North American Electric Reliability Corporation (NERC)
- Develops and enforces standards to ensure reliability of bulk power system in North America
▪ Commodity Futures Trading Commission
- Dodd Frank Act imposed regulatory regime on energy market trading
Regulators
9
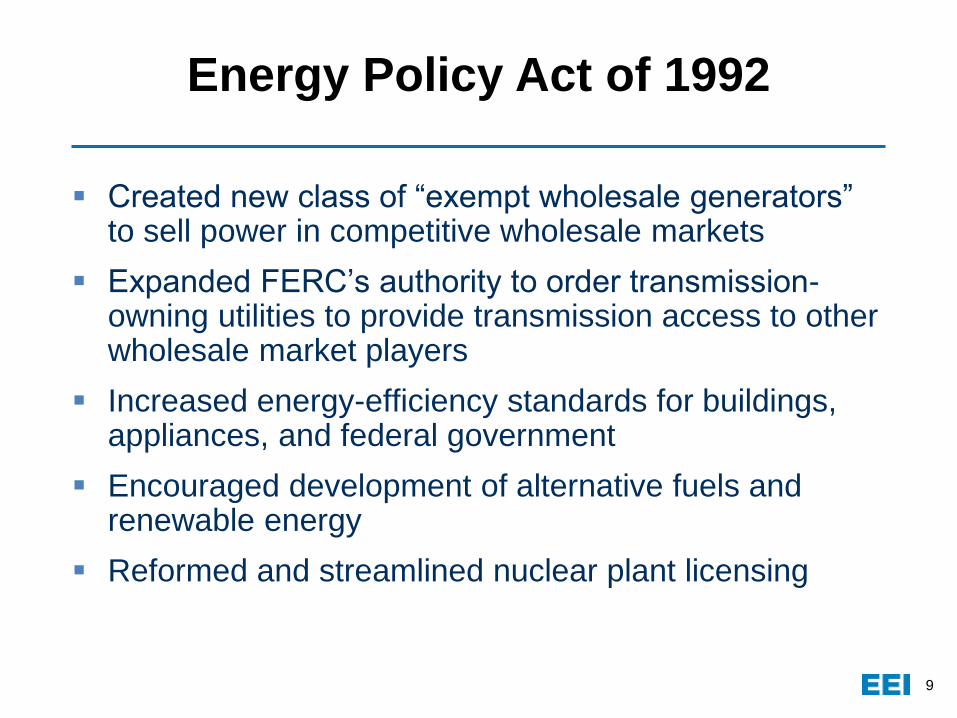
▪ Created new class of “exempt wholesale generators” to sell power in competitive wholesale markets
▪ Expanded FERC’s authority to order transmission-owning utilities to provide transmission access to other wholesale market players
▪ Increased energy-efficiency standards for buildings, appliances, and federal government
▪ Encouraged development of alternative fuels and renewable energy
▪ Reformed and streamlined nuclear plant licensing
Energy Policy Act of 1992

Market Evolution
11
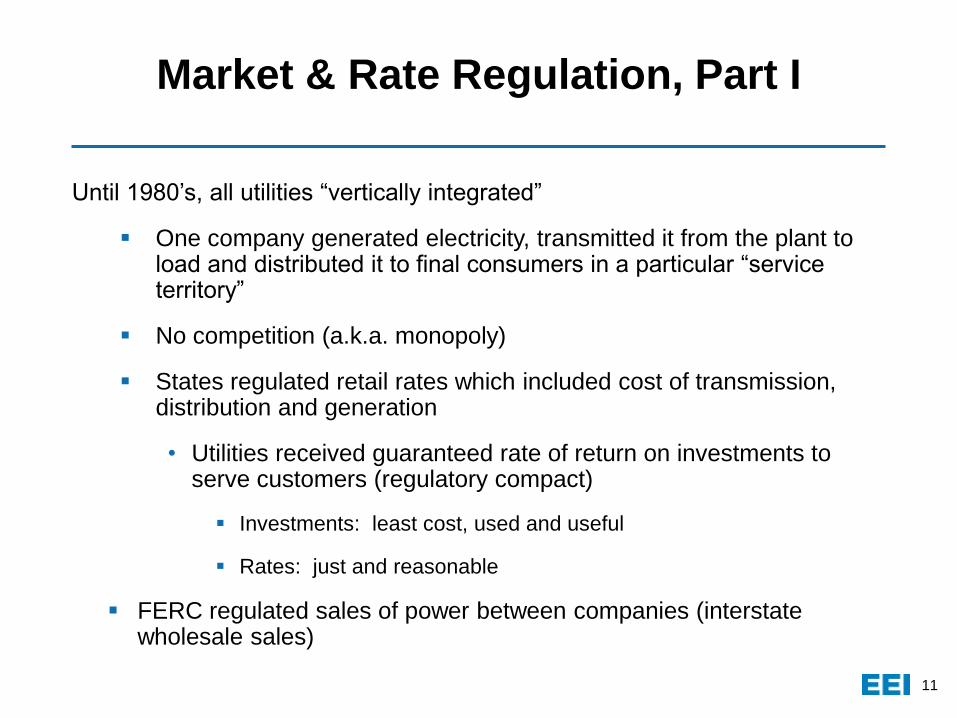
Until 1980’s, all utilities “vertically integrated”
▪ One company generated electricity, transmitted it from the plant to load and distributed it to final consumers in a particular “service territory”
▪ No competition (a.k.a. monopoly)
▪ States regulated retail rates which included cost of transmission, distribution and generation
• Utilities received guaranteed rate of return on investments to serve customers (regulatory compact)
▪ Investments: least cost, used and useful
▪ Rates: just and reasonable
▪ FERC regulated sales of power between companies (interstate wholesale sales)
Market & Rate Regulation, Part I
12
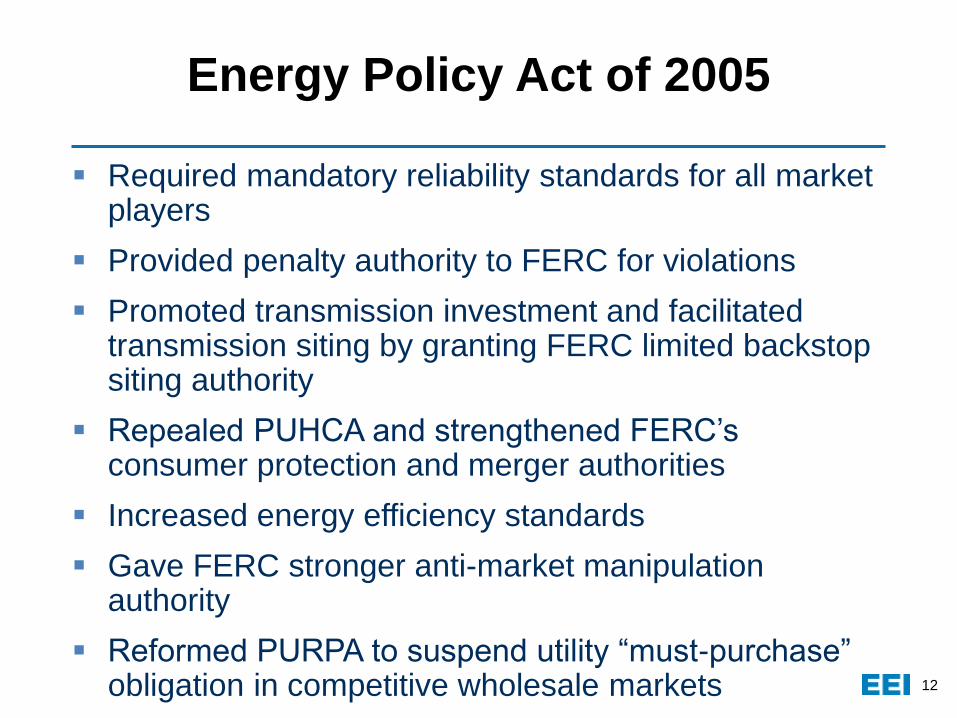
▪ Required mandatory reliability standards for all market players
▪ Provided penalty authority to FERC for violations
▪ Promoted transmission investment and facilitated transmission siting by granting FERC limited backstop siting authority
▪ Repealed PUHCA and strengthened FERC’s consumer protection and merger authorities
▪ Increased energy efficiency standards
▪ Gave FERC stronger anti-market manipulation authority
▪ Reformed PURPA to suspend utility “must-purchase” obligation in competitive wholesale markets
Energy Policy Act of 2005
1313
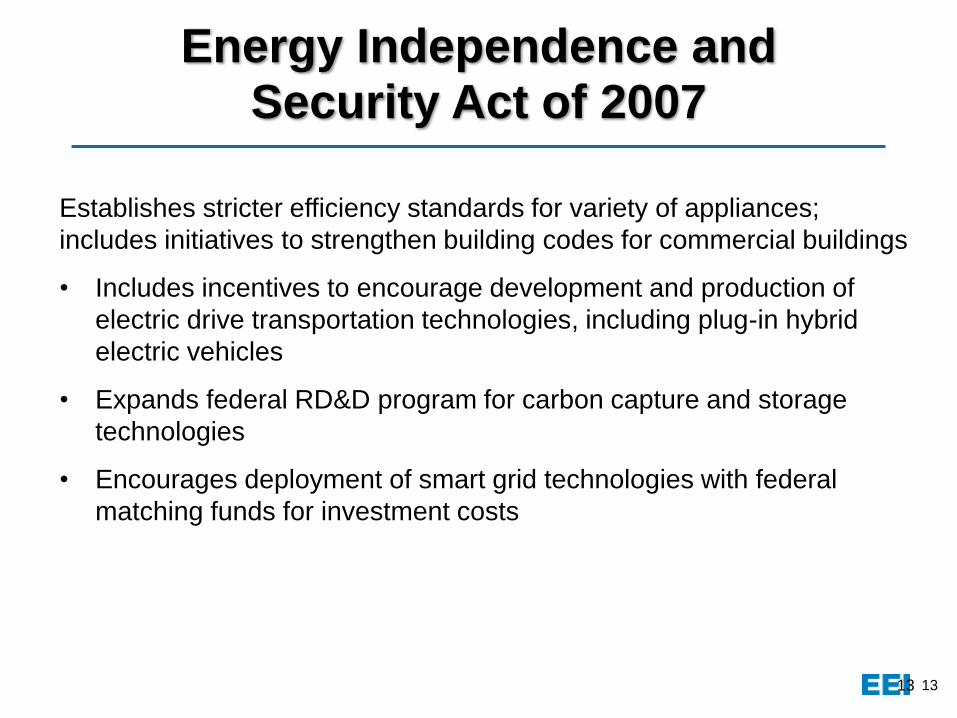
Establishes stricter efficiency standards for variety of appliances;
includes initiatives to strengthen building codes for commercial buildings
• Includes incentives to encourage development and production of
electric drive transportation technologies, including plug-in hybrid
electric vehicles
• Expands federal RD&D program for carbon capture and storage
technologies
• Encourages deployment of smart grid technologies with federal
matching funds for investment costs
Energy Independence and Security Act of 2007
14
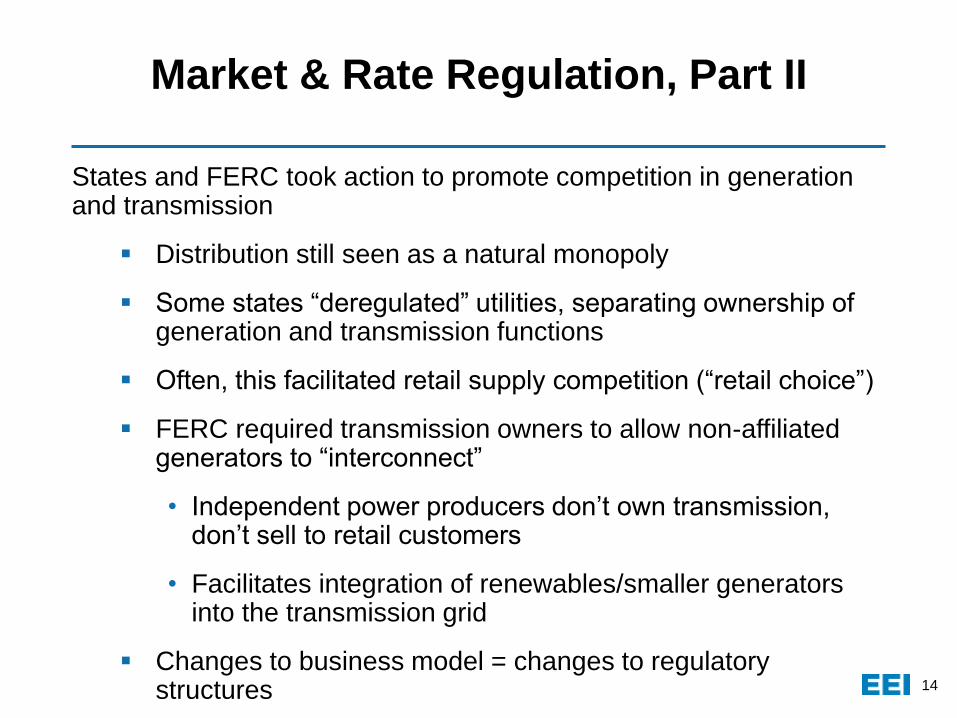
States and FERC took action to promote competition in generation and transmission
▪ Distribution still seen as a natural monopoly
▪ Some states “deregulated” utilities, separating ownership of generation and transmission functions
▪ Often, this facilitated retail supply competition (“retail choice”)
▪ FERC required transmission owners to allow non-affiliated generators to “interconnect”
• Independent power producers don’t own transmission, don’t sell to retail customers
• Facilitates integration of renewables/smaller generators into the transmission grid
▪ Changes to business model = changes to regulatory structures
Market & Rate Regulation, Part II
1515
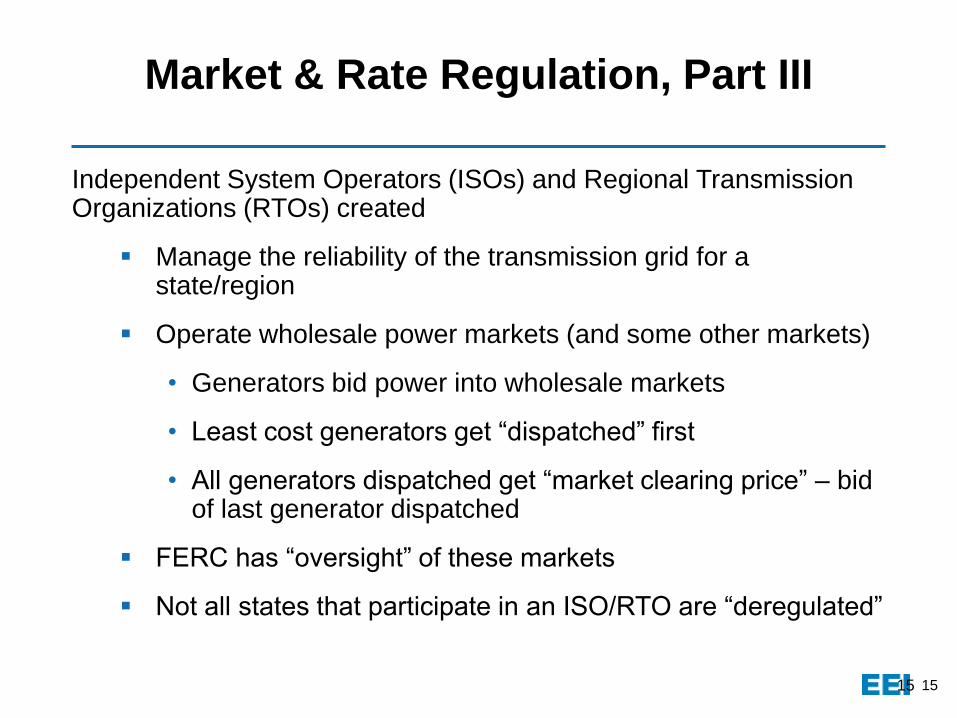
Independent System Operators (ISOs) and Regional Transmission Organizations (RTOs) created
▪ Manage the reliability of the transmission grid for a state/region
▪ Operate wholesale power markets (and some other markets)
• Generators bid power into wholesale markets
• Least cost generators get “dispatched” first
• All generators dispatched get “market clearing price” – bid of last generator dispatched
▪ FERC has “oversight” of these markets
▪ Not all states that participate in an ISO/RTO are “deregulated”
Market & Rate Regulation, Part III
16
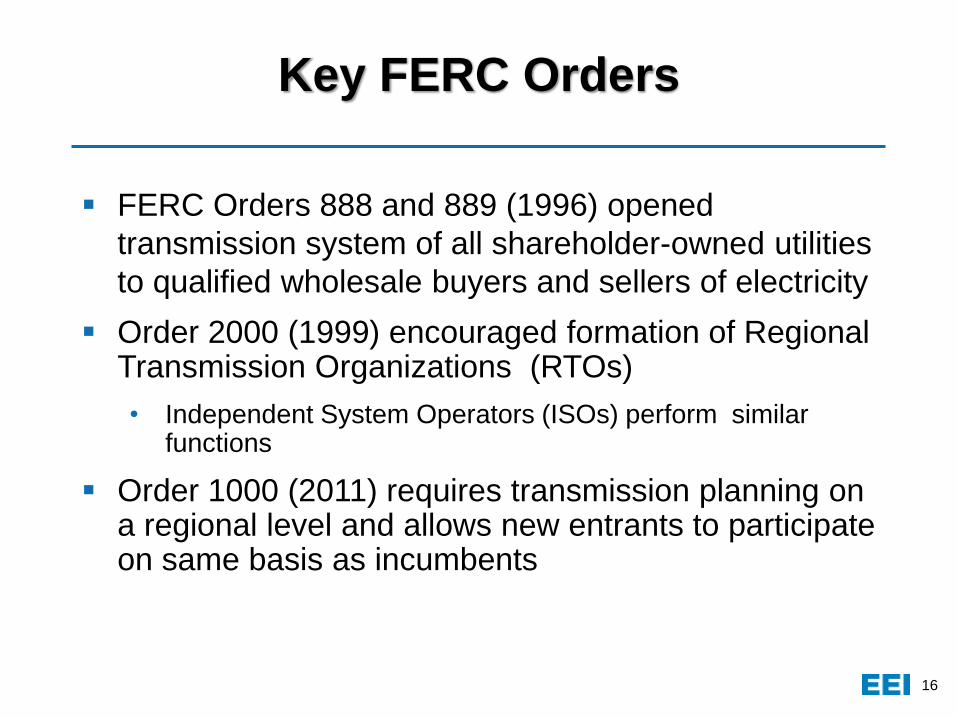
▪ FERC Orders 888 and 889 (1996) opened
transmission system of all shareholder-owned utilities
to qualified wholesale buyers and sellers of electricity
▪ Order 2000 (1999) encouraged formation of Regional Transmission Organizations (RTOs)
• Independent System Operators (ISOs) perform similar functions
▪ Order 1000 (2011) requires transmission planning on a regional level and allows new entrants to participate on same basis as incumbents
Key FERC Orders
17
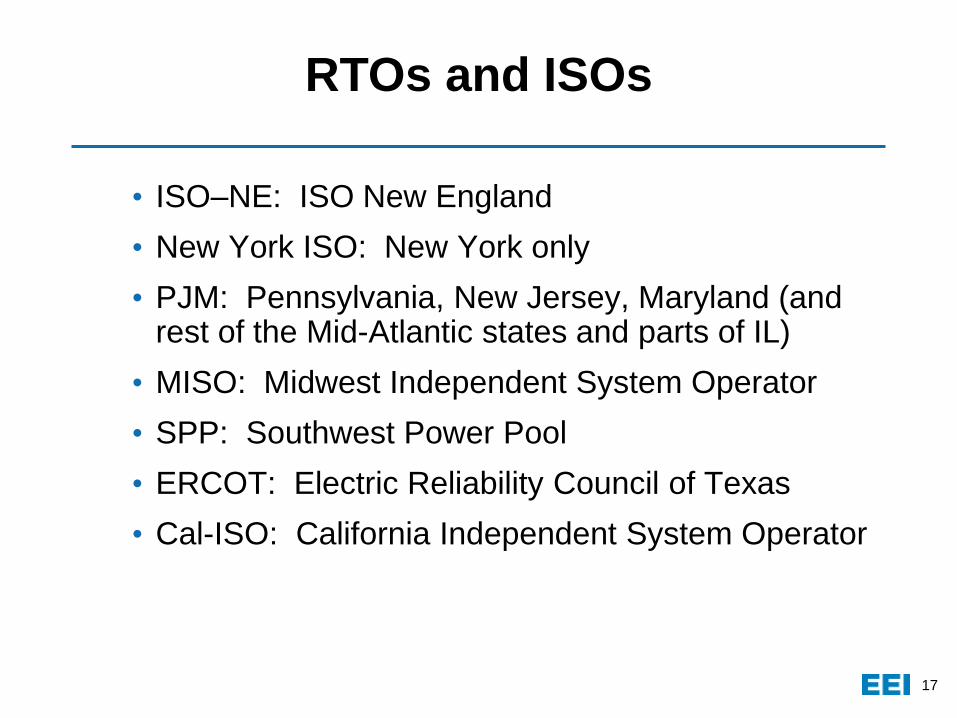
• ISO–NE: ISO New England
• New York ISO: New York only
• PJM: Pennsylvania, New Jersey, Maryland (and rest of the Mid-Atlantic states and parts of IL)
• MISO: Midwest Independent System Operator
• SPP: Southwest Power Pool
• ERCOT: Electric Reliability Council of Texas
• Cal-ISO: California Independent System Operator
RTOs and ISOs
18
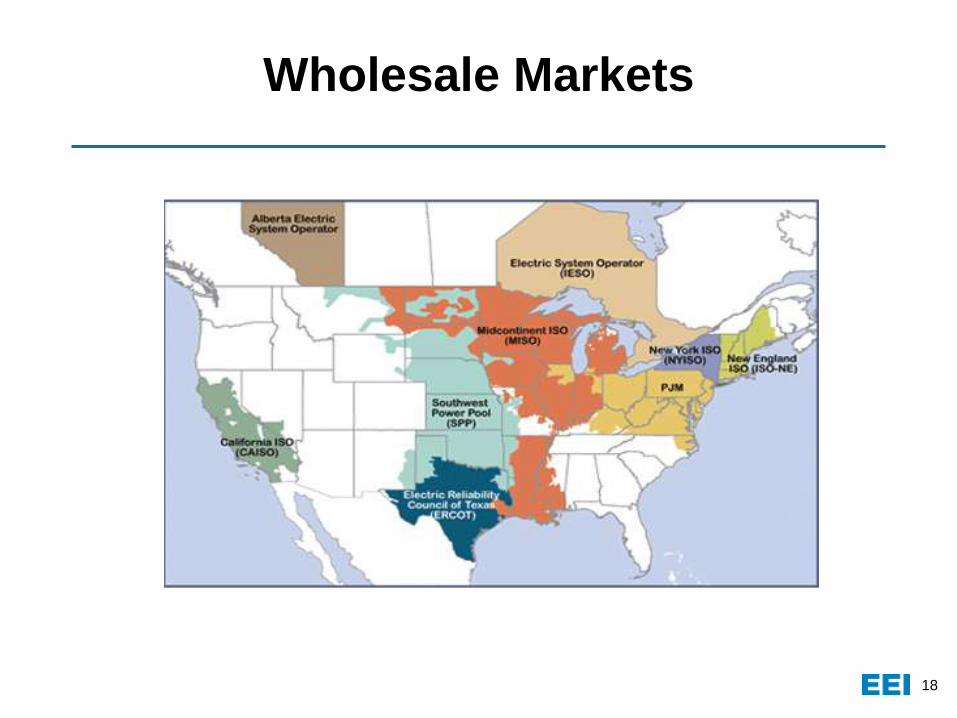
Wholesale Markets
19
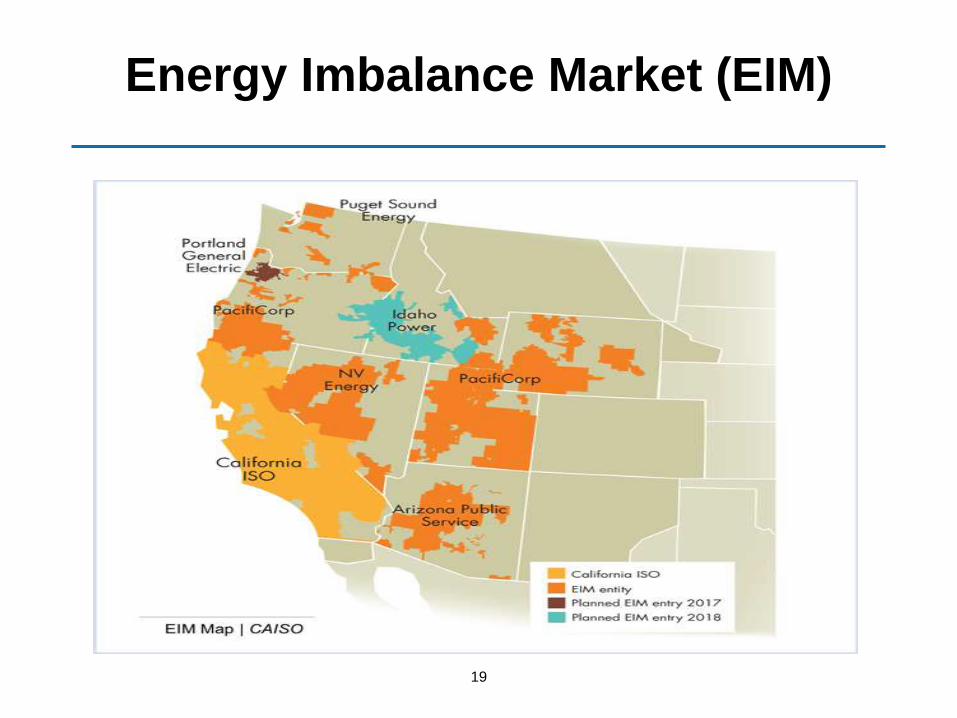
Energy Imbalance Market (EIM)

What’s Next
22
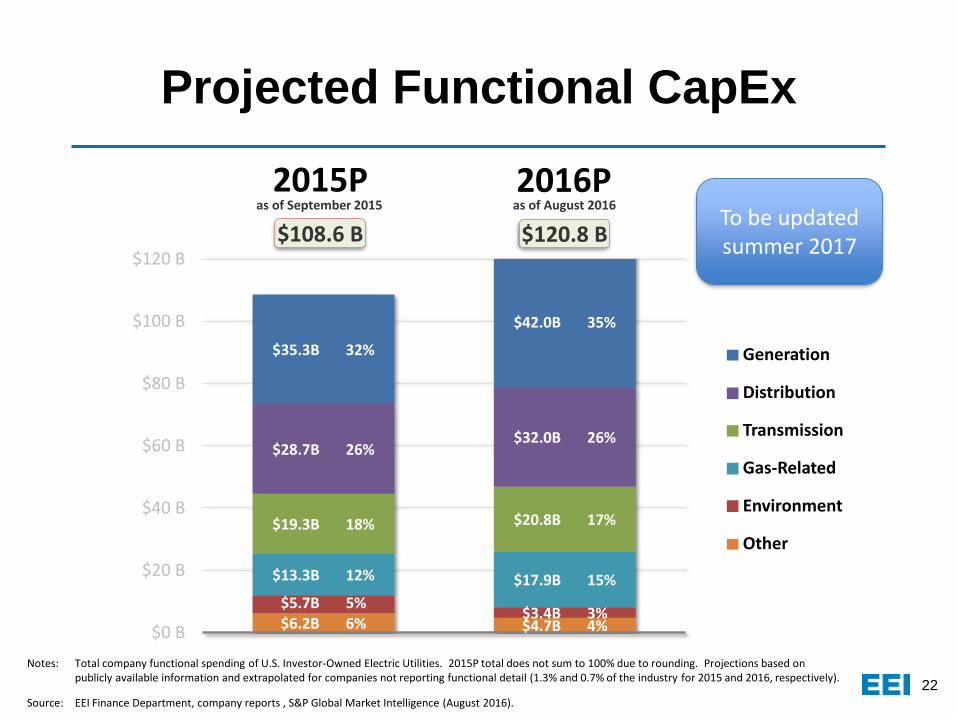
$6.2B 6% $4.7B 4%
$5.7B 5%$3.4B 3%
$13.3B 12% $17.9B 15%
$19.3B 18% $20.8B 17%
$28.7B 26%$32.0B 26%
$35.3B 32%
$42.0B 35%
$0 B
$20 B
$40 B
$60 B
$80 B
$100 B
$120 B
Projected Functional CapEx
$108.6 B
as of September 2015 as of August 2016
$120.8 B
Generation
Distribution
Transmission
Gas-Related
Environment
Other
2015P 2016P
Notes: Total company functional spending of U.S. Investor-Owned Electric Utilities. 2015P total does not sum to 100% due to rounding. Projections based on publicly available information and extrapolated for companies not reporting functional detail (1.3% and 0.7% of the industry for 2015 and 2016, respectively).
Source: EEI Finance Department, company reports , S&P Global Market Intelligence (August 2016).
To be updated summer 2017
23
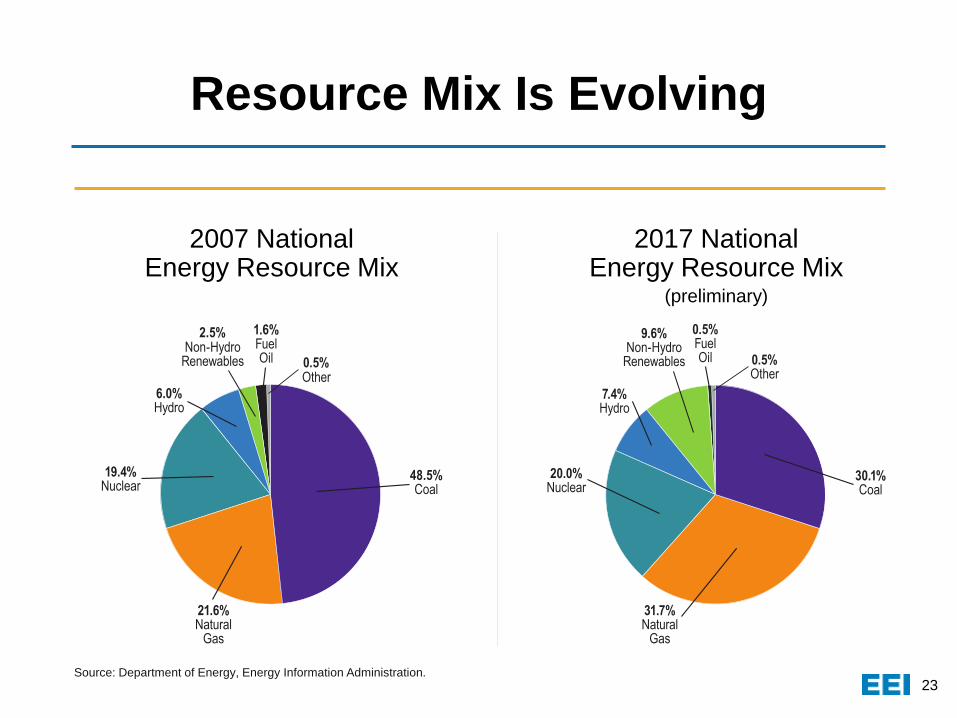
Resource Mix Is Evolving
2007 National Energy Resource Mix
2017 National Energy Resource Mix
(preliminary)
21.6%Natural
Gas
19.4%Nuclear
2.5%Non-Hydro
Renewables
6.0%Hydro
48.5%Coal
0.5%Other
1.6%FuelOil
31.7%Natural
Gas
20.0%Nuclear
9.6%Non-Hydro
Renewables
7.4%Hydro
30.1%Coal
0.5%Other
0.5%FuelOil
Source: Department of Energy, Energy Information Administration.
24
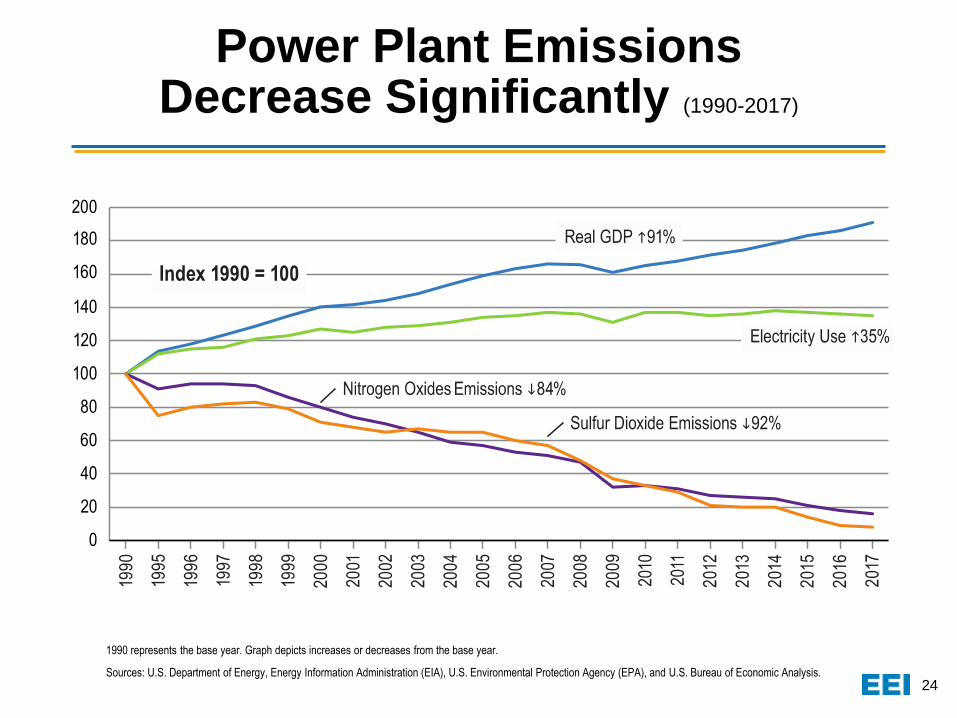
Power Plant Emissions Decrease Significantly (1990-2017)
1990 represents the base year. Graph depicts increases or decreases from the base year.
Sources: U.S. Department of Energy, Energy Information Administration (EIA), U.S. Environmental Protection Agency (EPA), and U.S. Bureau of Economic Analysis.
25
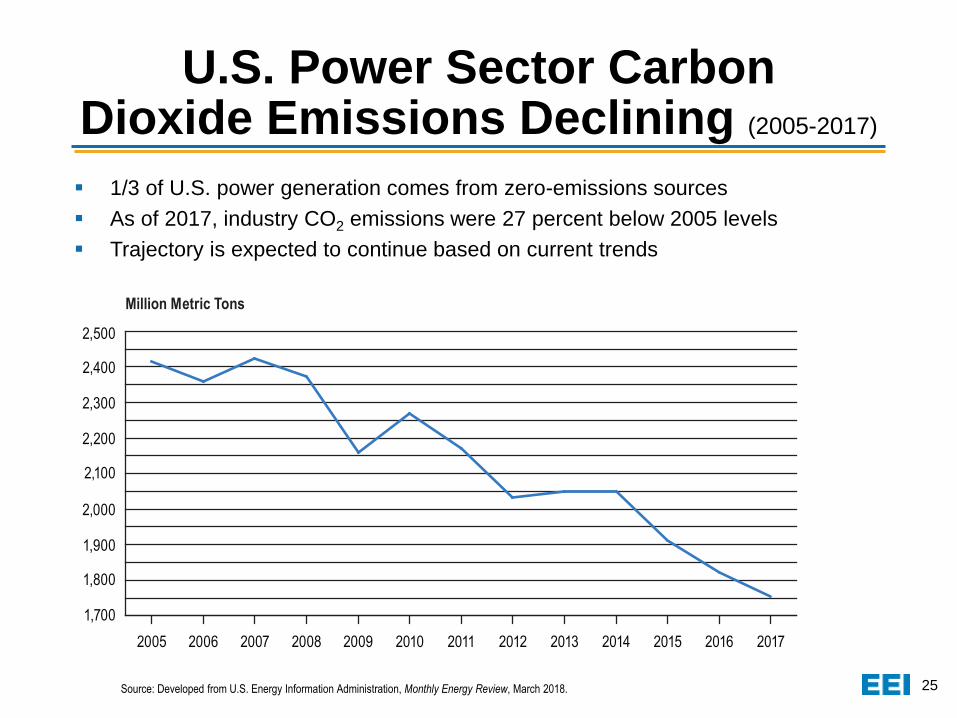
▪ 1/3 of U.S. power generation comes from zero-emissions sources
▪ As of 2017, industry CO2 emissions were 27 percent below 2005 levels
▪ Trajectory is expected to continue based on current trends
U.S. Power Sector Carbon Dioxide Emissions Declining (2005-2017)
Source: Developed from U.S. Energy Information Administration, Monthly Energy Review, March 2018.
Source: Developed from U.S. Energy Information Administration, Monthly Energy Review, March 2018.
April 2018 © 2018 by the Edison Electric Institute. All rights reserved.
Million Metric Tons
1,700
1,800
1,900
2,000
2,100
2,200
2,300
2,400
2,500
2017201620152014201320122011201020092008200720062005
26
▪ Transmission rate policy
▪ Role of Storage and Distributed Energy
Resources
▪ Resilience
▪ Natural Gas Pipeline
▪ PURPA
▪ Reliability
▪ State Activity and Wholesale Markets
Emerging FERC Issues
The Edison Electric Institute (EEI) is the association
that represents all U.S. investor-owned electric companies.
Our members provide electricity for 220 million Americans,
operate in all 50 states and the District of Columbia, and
directly employ more than 500,000 workers.
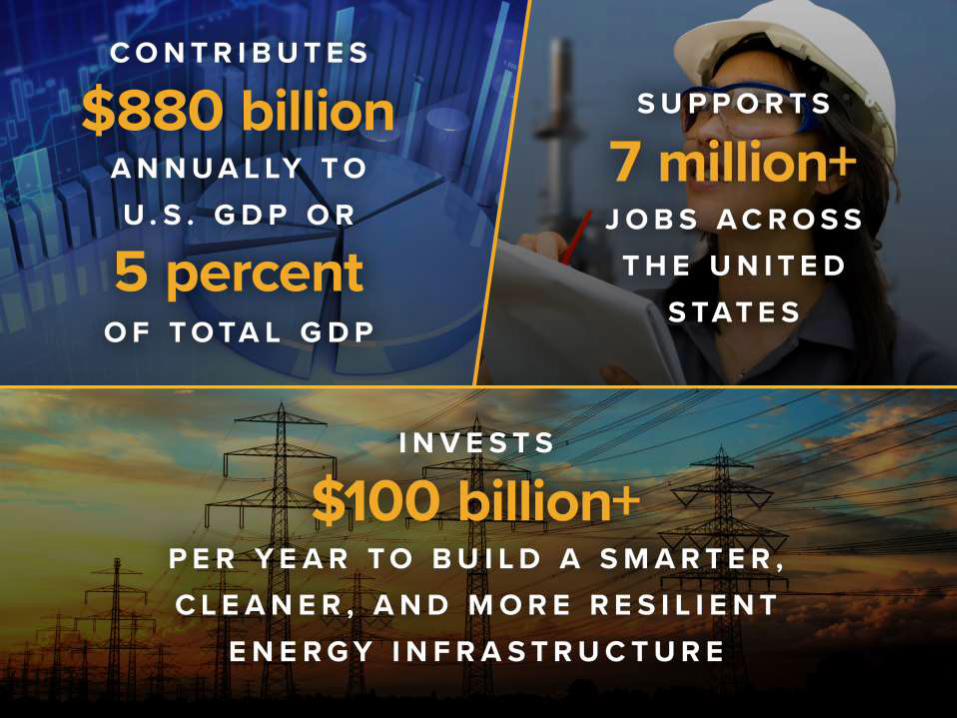
With $100 billion in annual capital expenditures, the electric
power industry is responsible for millions of additional jobs.
Reliable, affordable, and sustainable electricity powers the
economy and enhances the lives of all Americans.
EEI has 70 international electric companies as Affiliate
Members, and 270 industry suppliers and related
organizations as Associate Members.
Organized in 1933, EEI provides public policy leadership,
strategic business intelligence, and essential conferences
and forums.
For more information, visit our Web site at www.eei.org.
Lopa Parikh
Senior Director
Federal Regulatory Affairs
Edison Electric Institute
Recommended