JUNE 2016
ENERGY IN PERSPECTIVE Monthly Update
INSIDE THIS ISSUE:
Recent Simmons Transactions
Select M&A Transactions
Energy Industry Statistics and Forecasts
Public Markets - Key Trading Statistics
Table Of Contents
Page 2 Energy In Perspective Monthly Update - As of May 31, 2016
Recent Simmons Transactions ........................................................................................................................................................................................................................................................................................ 3
Select M&A Transactions .................................................................................................................................................................................................................................................................................................... 4
Energy Industry Statistics and Forecasts .................................................................................................................................................................................................................................... 5 - 6
Public Markets - Key Trading Statistics ...................................................................................................................................................................................................................................... 7 - 15
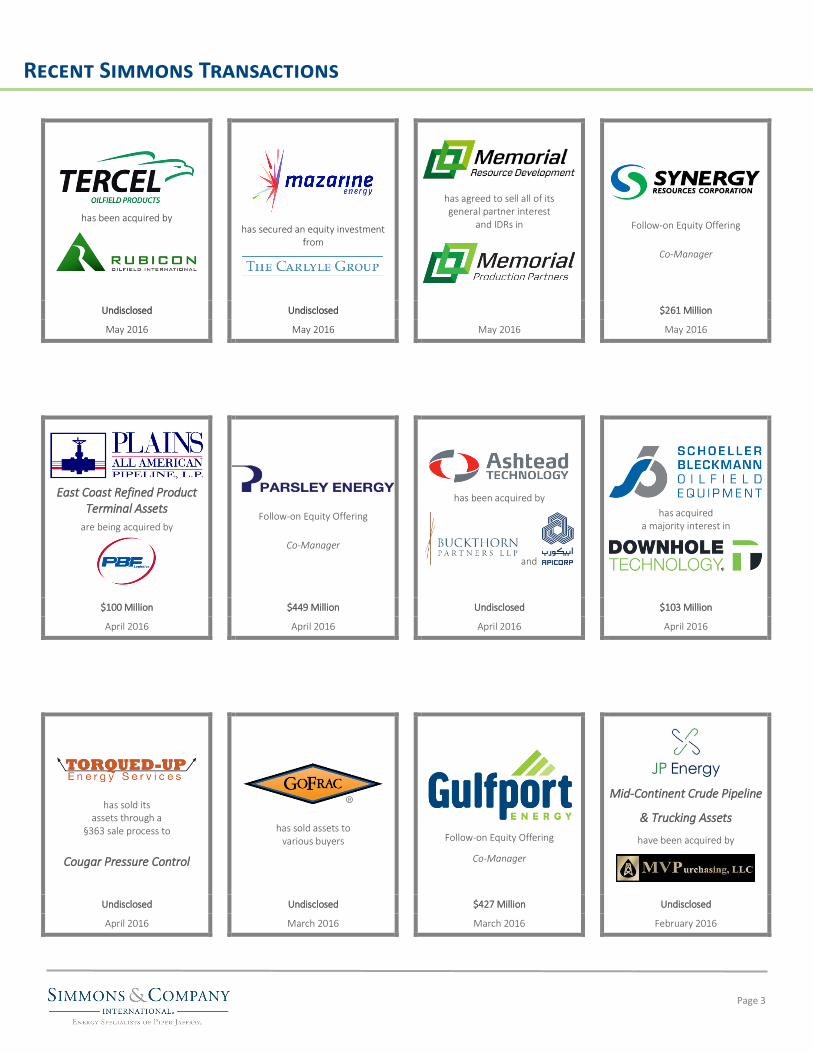
Recent Simmons Transactions
Page 3
has been acquired by
has secured an equity investment from
has agreed to sell all of its general partner interest
and IDRs in
Follow-on Equity Offering
Co-Manager
Undisclosed Undisclosed $261 Million
May 2016 May 2016 May 2016 May 2016
East Coast Refined Product Terminal Assets
are being acquired by
Follow-on Equity Offering
Co-Manager
has been acquired by
and
has acquired a majority interest in
$100 Million $449 Million Undisclosed $103 Million
April 2016 April 2016 April 2016 April 2016
has sold its assets through a
§363 sale process to
Cougar Pressure Control
has sold assets to various buyers
Follow-on Equity Offering
Co-Manager
Mid-Continent Crude Pipeline & Trucking Assets
have been acquired by
Undisclosed Undisclosed $427 Million Undisclosed
April 2016 March 2016 March 2016 February 2016
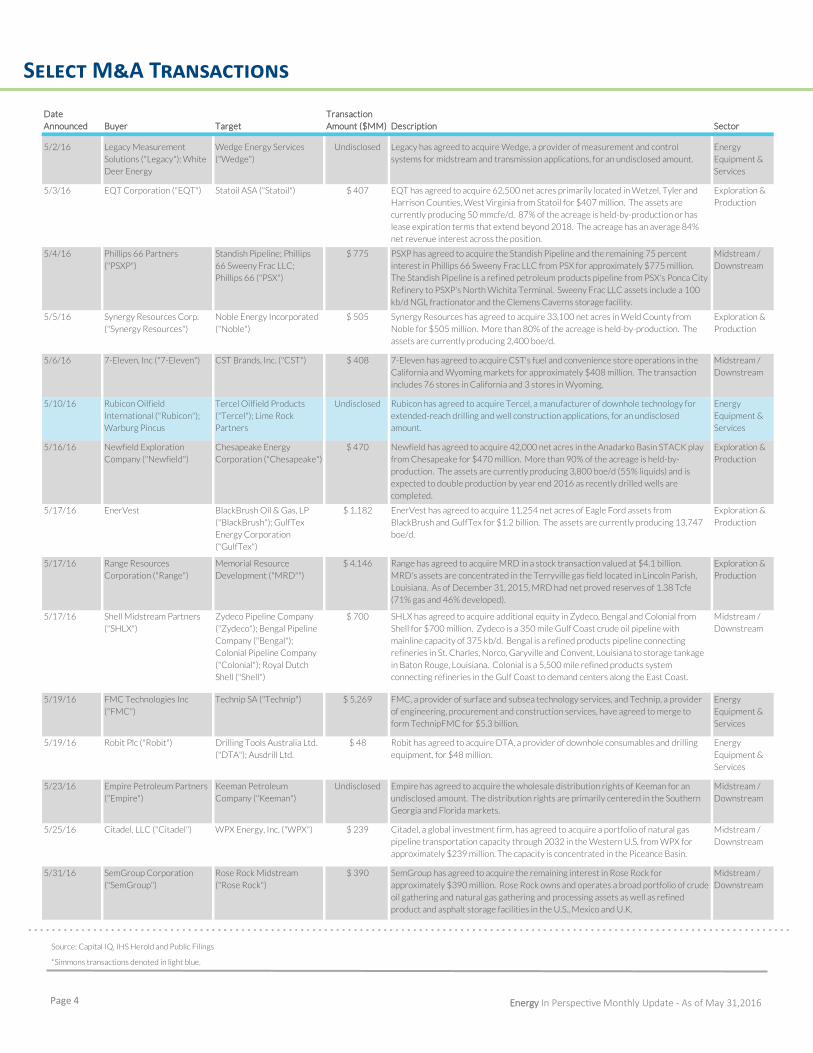
Select M&A Transactions
Page 4 Energy In Perspective Monthly Update - As of May 31,2016
Source: Capital IQ, IHS Herold and Public Filings
*Simmons transactions denoted in light blue.
Date
Announced Buyer Target
Transaction
Amount ($MM) Description Sector
5/2/16 Legacy Measurement
Solutions ("Legacy"); White
Deer Energy
Wedge Energy Services
("Wedge")
Undisclosed Legacy has agreed to acquire Wedge, a provider of measurement and control
systems for midstream and transmission applications, for an undisclosed amount.
Energy
Equipment &
Services
5/3/16 EQT Corporation ("EQT") Statoil ASA ("Statoil") $ 407 EQT has agreed to acquire 62,500 net acres primarily located in Wetzel, Tyler and
Harrison Counties, West Virginia from Statoil for $407 million. The assets are
currently producing 50 mmcfe/d. 87% of the acreage is held-by-production or has
lease expiration terms that extend beyond 2018. The acreage has an average 84%
net revenue interest across the position.
Exploration &
Production
5/4/16 Phillips 66 Partners
("PSXP")
Standish Pipeline; Phillips
66 Sweeny Frac LLC;
Phillips 66 ("PSX")
$ 775 PSXP has agreed to acquire the Standish Pipeline and the remaining 75 percent
interest in Phillips 66 Sweeny Frac LLC from PSX for approximately $775 million.
The Standish Pipeline is a refined petroleum products pipeline from PSX's Ponca City
Refinery to PSXP's North Wichita Terminal. Sweeny Frac LLC assets include a 100
kb/d NGL fractionator and the Clemens Caverns storage facility.
Midstream /
Downstream
5/5/16 Synergy Resources Corp.
("Synergy Resources")
Noble Energy Incorporated
("Noble")
$ 505 Synergy Resources has agreed to acquire 33,100 net acres in Weld County from
Noble for $505 million. More than 80% of the acreage is held-by-production. The
assets are currently producing 2,400 boe/d.
Exploration &
Production
5/6/16 7-Eleven, Inc ("7-Eleven") CST Brands, Inc. ("CST") $ 408 7-Eleven has agreed to acquire CST's fuel and convenience store operations in the
California and Wyoming markets for approximately $408 million. The transaction
includes 76 stores in California and 3 stores in Wyoming.
Midstream /
Downstream
5/10/16 Rubicon Oilfield
International ("Rubicon");
Warburg Pincus
Tercel Oilfield Products
("Tercel"); Lime Rock
Partners
Undisclosed Rubicon has agreed to acquire Tercel, a manufacturer of downhole technology for
extended-reach drilling and well construction applications, for an undisclosed
amount.
Energy
Equipment &
Services
5/16/16 Newfield Exploration
Company ("Newfield")
Chesapeake Energy
Corporation ("Chesapeake")
$ 470 Newfield has agreed to acquire 42,000 net acres in the Anadarko Basin STACK play
from Chesapeake for $470 million. More than 90% of the acreage is held-by-
production. The assets are currently producing 3,800 boe/d (55% liquids) and is
expected to double production by year end 2016 as recently drilled wells are
completed.
Exploration &
Production
5/17/16 EnerVest BlackBrush Oil & Gas, LP
("BlackBrush"); GulfTex
Energy Corporation
("GulfTex")
$ 1,182 EnerVest has agreed to acquire 11,254 net acres of Eagle Ford assets from
BlackBrush and GulfTex for $1.2 billion. The assets are currently producing 13,747
boe/d.
Exploration &
Production
5/17/16 Range Resources
Corporation ("Range")
Memorial Resource
Development ("MRD"")
$ 4,146 Range has agreed to acquire MRD in a stock transaction valued at $4.1 billion.
MRD's assets are concentrated in the Terryville gas field located in Lincoln Parish,
Louisiana. As of December 31, 2015, MRD had net proved reserves of 1.38 Tcfe
(71% gas and 46% developed).
Exploration &
Production
5/17/16 Shell Midstream Partners
("SHLX")
Zydeco Pipeline Company
("Zydeco"); Bengal Pipeline
Company ("Bengal");
Colonial Pipeline Company
("Colonial"); Royal Dutch
Shell ("Shell")
$ 700 SHLX has agreed to acquire additional equity in Zydeco, Bengal and Colonial from
Shell for $700 million. Zydeco is a 350 mile Gulf Coast crude oil pipeline with
mainline capacity of 375 kb/d. Bengal is a refined products pipeline connecting
refineries in St. Charles, Norco, Garyville and Convent, Louisiana to storage tankage
in Baton Rouge, Louisiana. Colonial is a 5,500 mile refined products system
connecting refineries in the Gulf Coast to demand centers along the East Coast.
Midstream /
Downstream
5/19/16 FMC Technologies Inc
("FMC")
Technip SA ("Technip") $ 5,269 FMC, a provider of surface and subsea technology services, and Technip, a provider
of engineering, procurement and construction services, have agreed to merge to
form TechnipFMC for $5.3 billion.
Energy
Equipment &
Services
5/19/16 Robit Plc ("Robit") Drilling Tools Australia Ltd.
("DTA"); Ausdrill Ltd.
$ 48 Robit has agreed to acquire DTA, a provider of downhole consumables and drilling
equipment, for $48 million.
Energy
Equipment &
Services
5/23/16 Empire Petroleum Partners
("Empire")
Keeman Petroleum
Company ("Keeman")
Undisclosed Empire has agreed to acquire the wholesale distribution rights of Keeman for an
undisclosed amount. The distribution rights are primarily centered in the Southern
Georgia and Florida markets.
Midstream /
Downstream
5/25/16 Citadel, LLC ("Citadel") WPX Energy, Inc. ("WPX") $ 239 Citadel, a global investment firm, has agreed to acquire a portfolio of natural gas
pipeline transportation capacity through 2032 in the Western U.S. from WPX for
approximately $239 million. The capacity is concentrated in the Piceance Basin.
Midstream /
Downstream
5/31/16 SemGroup Corporation
("SemGroup")
Rose Rock Midstream
("Rose Rock")
$ 390 SemGroup has agreed to acquire the remaining interest in Rose Rock for
approximately $390 million. Rose Rock owns and operates a broad portfolio of crude
oil gathering and natural gas gathering and processing assets as well as refined
product and asphalt storage facilities in the U.S., Mexico and U.K.
Midstream /
Downstream
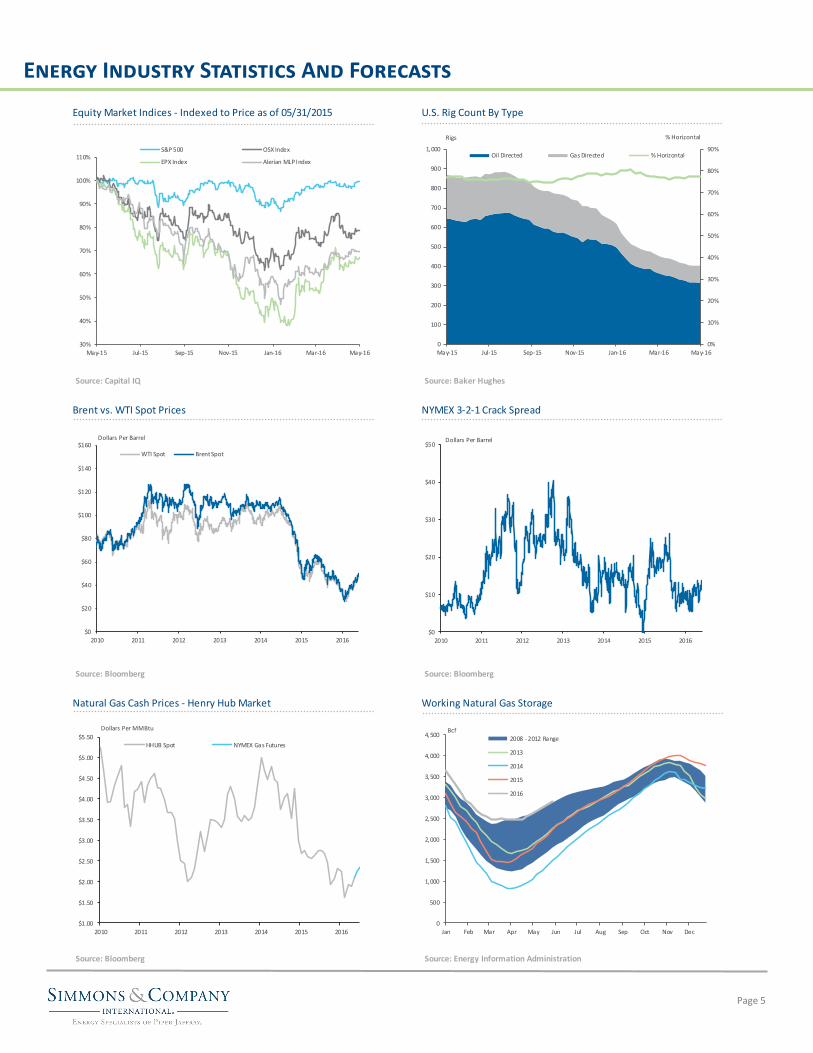
Energy Industry Statistics And Forecasts
Page 5
Equity Market Indices - Indexed to Price as of 05/31/2015 U.S. Rig Count By Type
Source: Capital IQ Source: Baker Hughes
Brent vs. WTI Spot Prices NYMEX 3-2-1 Crack Spread
Source: Bloomberg Source: Bloomberg
Natural Gas Cash Prices - Henry Hub Market Working Natural Gas Storage
Source: Bloomberg Source: Energy Information Administration
30%
40%
50%
60%
70%
80%
90%
100%
110%
May-15 Jul-15 Sep-15 Nov-15 Jan-16 Mar-16 May-16
S&P 500 OSX Index
EPX Index Alerian MLP Index
0%
10%
20%
30%
40%
50%
60%
70%
80%
90%
0
100
200
300
400
500
600
700
800
900
1,000
May-15 Jul-15 Sep-15 Nov-15 Jan-16 Mar-16 May-16
Oil Directed Gas Directed % Horizontal
Rigs % Horizontal
$0
$20
$40
$60
$80
$100
$120
$140
$160
2010 2011 2012 2013 2014 2015 2016
WTI Spot Brent Spot
Dollars Per Barrel
$0
$10
$20
$30
$40
$50
2010 2011 2012 2013 2014 2015 2016
Dollars Per Barrel
$1.00
$1.50
$2.00
$2.50
$3.00
$3.50
$4.00
$4.50
$5.00
$5.50
2010 2011 2012 2013 2014 2015 2016
HHUB Spot NYMEX Gas Futures
Dollars Per MMBtu
0
500
1,000
1,500
2,000
2,500
3,000
3,500
4,000
4,500
Jan Feb Mar Apr May Jun Jul Aug Sep Oct Nov Dec
2008 - 2012 Range
2013
2014
2015
2016
Bcf
Energy Industry Statistics And Forecasts
Page 6 Energy In Perspective Monthly Update - As of May 31, 2016
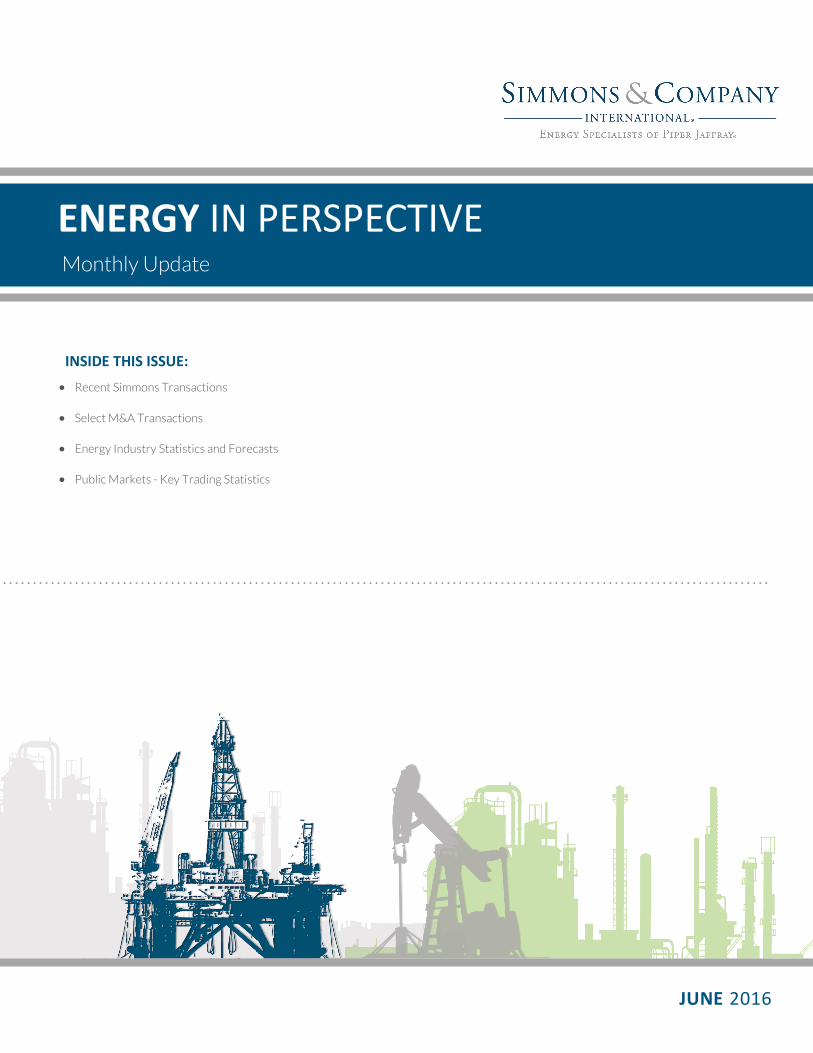
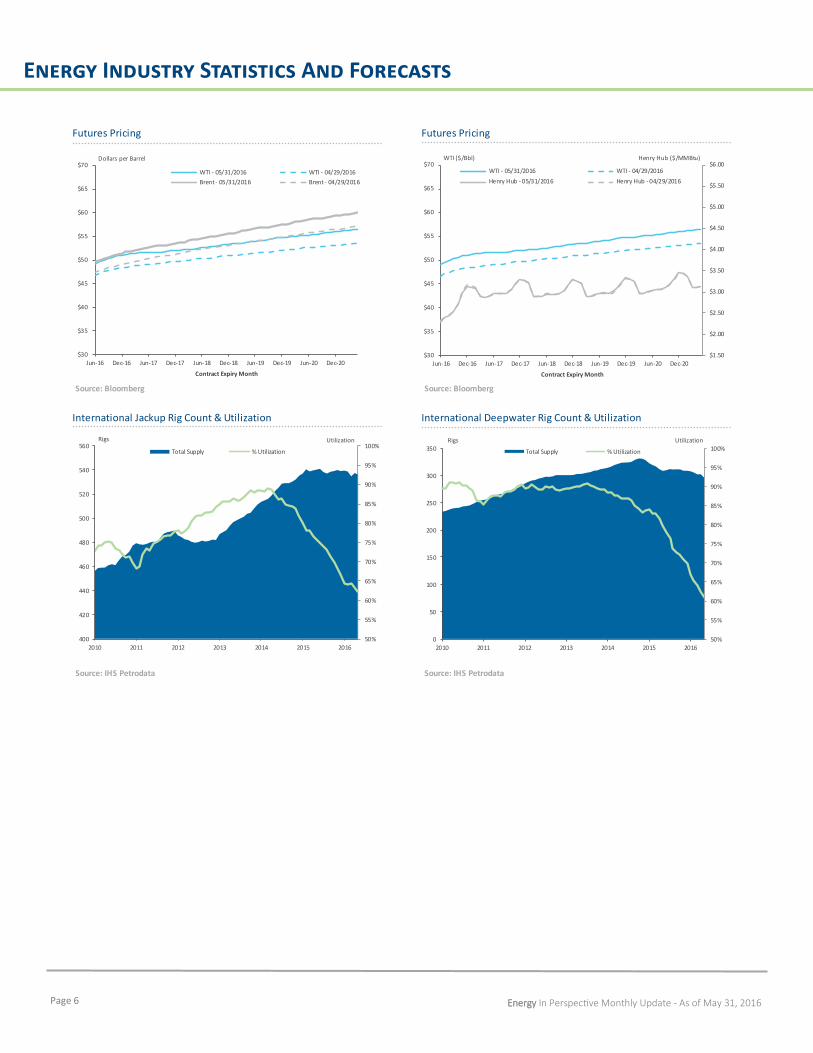
Futures Pricing Futures Pricing
Source: Bloomberg Source: Bloomberg
International Jackup Rig Count & Utilization International Deepwater Rig Count & Utilization
Source: IHS Petrodata Source: IHS Petrodata
$30
$35
$40
$45
$50
$55
$60
$65
$70
Jun-16 Dec-16 Jun-17 Dec-17 Jun-18 Dec-18 Jun-19 Dec-19 Jun-20 Dec-20
Contract Expiry Month
WTI - 05/31/2016 WTI - 04/29/2016
Brent - 05/31/2016 Brent - 04/29/2016
Dollars per Barrel
50%
55%
60%
65%
70%
75%
80%
85%
90%
95%
100%
400
420
440
460
480
500
520
540
560
2010 2011 2012 2013 2014 2015 2016
Total Supply % Utilization
Rigs Utilization
50%
55%
60%
65%
70%
75%
80%
85%
90%
95%
100%
0
50
100
150
200
250
300
350
2010 2011 2012 2013 2014 2015 2016
Total Supply % Utilization
Rigs Utilization
$1.50
$2.00
$2.50
$3.00
$3.50
$4.00
$4.50
$5.00
$5.50
$6.00
$30
$35
$40
$45
$50
$55
$60
$65
$70
Jun-16 Dec-16 Jun-17 Dec-17 Jun-18 Dec-18 Jun-19 Dec-19 Jun-20 Dec-20
Contract Expiry Month
WTI - 05/31/2016 WTI - 04/29/2016
Henry Hub - 05/31/2016 Henry Hub - 04/29/2016
WTI ($/Bbl) Henry Hub ($/MMBtu)
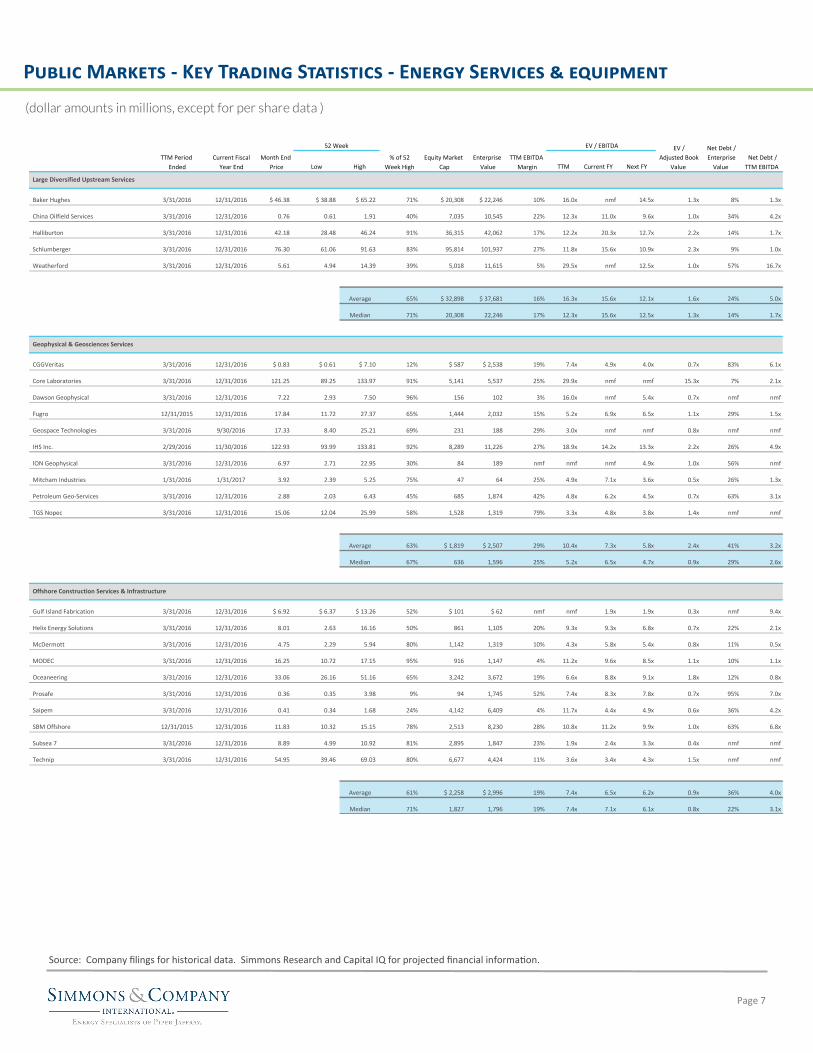
Public Markets - Key Trading Statistics - Energy Services & equipment
(dollar amounts in millions, except for per share data )
Page 7
Source: Company filings for historical data. Simmons Research and Capital IQ for projected financial information.
Low High TTM Current FY Next FY
Baker Hughes 3/31/2016 12/31/2016 $ 46.38 $ 38.88 $ 65.22 71% $ 20,308 $ 22,246 10% 16.0x nmf 14.5x 1.3x 8% 1.3x
China Oilfield Services 3/31/2016 12/31/2016 0.76 0.61 1.91 40% 7,035 10,545 22% 12.3x 11.0x 9.6x 1.0x 34% 4.2x
Halliburton 3/31/2016 12/31/2016 42.18 28.48 46.24 91% 36,315 42,062 17% 12.2x 20.3x 12.7x 2.2x 14% 1.7x
Schlumberger 3/31/2016 12/31/2016 76.30 61.06 91.63 83% 95,814 101,937 27% 11.8x 15.6x 10.9x 2.3x 9% 1.0x
Weatherford 3/31/2016 12/31/2016 5.61 4.94 14.39 39% 5,018 11,615 5% 29.5x nmf 12.5x 1.0x 57% 16.7x
Average 65% $ 32,898 $ 37,681 16% 16.3x 15.6x 12.1x 1.6x 24% 5.0x
Median 71% 20,308 22,246 17% 12.3x 15.6x 12.5x 1.3x 14% 1.7x
CGGVeritas 3/31/2016 12/31/2016 $ 0.83 $ 0.61 $ 7.10 12% $ 587 $ 2,538 19% 7.4x 4.9x 4.0x 0.7x 83% 6.1x
Core Laboratories 3/31/2016 12/31/2016 121.25 89.25 133.97 91% 5,141 5,537 25% 29.9x nmf nmf 15.3x 7% 2.1x
Dawson Geophysical 3/31/2016 12/31/2016 7.22 2.93 7.50 96% 156 102 3% 16.0x nmf 5.4x 0.7x nmf nmf
Fugro 12/31/2015 12/31/2016 17.84 11.72 27.37 65% 1,444 2,032 15% 5.2x 6.9x 6.5x 1.1x 29% 1.5x
Geospace Technologies 3/31/2016 9/30/2016 17.33 8.40 25.21 69% 231 188 29% 3.0x nmf nmf 0.8x nmf nmf
IHS Inc. 2/29/2016 11/30/2016 122.93 93.99 133.81 92% 8,289 11,226 27% 18.9x 14.2x 13.3x 2.2x 26% 4.9x
ION Geophysical 3/31/2016 12/31/2016 6.97 2.71 22.95 30% 84 189 nmf nmf nmf 4.9x 1.0x 56% nmf
Mitcham Industries 1/31/2016 1/31/2017 3.92 2.39 5.25 75% 47 64 25% 4.9x 7.1x 3.6x 0.5x 26% 1.3x
Petroleum Geo-Services 3/31/2016 12/31/2016 2.88 2.03 6.43 45% 685 1,874 42% 4.8x 6.2x 4.5x 0.7x 63% 3.1x
TGS Nopec 3/31/2016 12/31/2016 15.06 12.04 25.99 58% 1,528 1,319 79% 3.3x 4.8x 3.8x 1.4x nmf nmf
Average 63% $ 1,819 $ 2,507 29% 10.4x 7.3x 5.8x 2.4x 41% 3.2x
Median 67% 636 1,596 25% 5.2x 6.5x 4.7x 0.9x 29% 2.6x
Gulf Island Fabrication 3/31/2016 12/31/2016 $ 6.92 $ 6.37 $ 13.26 52% $ 101 $ 62 nmf nmf 1.9x 1.9x 0.3x nmf 9.4x
Helix Energy Solutions 3/31/2016 12/31/2016 8.01 2.63 16.16 50% 861 1,105 20% 9.3x 9.3x 6.8x 0.7x 22% 2.1x
McDermott 3/31/2016 12/31/2016 4.75 2.29 5.94 80% 1,142 1,319 10% 4.3x 5.8x 5.4x 0.8x 11% 0.5x
MODEC 3/31/2016 12/31/2016 16.25 10.72 17.15 95% 916 1,147 4% 11.2x 9.6x 8.5x 1.1x 10% 1.1x
Oceaneering 3/31/2016 12/31/2016 33.06 26.16 51.16 65% 3,242 3,672 19% 6.6x 8.8x 9.1x 1.8x 12% 0.8x
Prosafe 3/31/2016 12/31/2016 0.36 0.35 3.98 9% 94 1,745 52% 7.4x 8.3x 7.8x 0.7x 95% 7.0x
Saipem 3/31/2016 12/31/2016 0.41 0.34 1.68 24% 4,142 6,409 4% 11.7x 4.4x 4.9x 0.6x 36% 4.2x
SBM Offshore 12/31/2015 12/31/2016 11.83 10.32 15.15 78% 2,513 8,230 28% 10.8x 11.2x 9.9x 1.0x 63% 6.8x
Subsea 7 3/31/2016 12/31/2016 8.89 4.99 10.92 81% 2,895 1,847 23% 1.9x 2.4x 3.3x 0.4x nmf nmf
Technip 3/31/2016 12/31/2016 54.95 39.46 69.03 80% 6,677 4,424 11% 3.6x 3.4x 4.3x 1.5x nmf nmf
Average 61% $ 2,258 $ 2,996 19% 7.4x 6.5x 6.2x 0.9x 36% 4.0x
Median 71% 1,827 1,796 19% 7.4x 7.1x 6.1x 0.8x 22% 3.1x
TTM Period
Ended
% of 52
Week High
Net Debt /
TTM EBITDA
Net Debt /
Enterprise
Value
Current Fiscal
Year End
Month End
Price
Enterprise
Value
TTM EBITDA
Margin
Equity Market
Cap
EV /
Adjusted Book
Value
52 Week EV / EBITDA
Offshore Construction Services & Infrastructure
Large Diversified Upstream Services
Geophysical & Geosciences Services
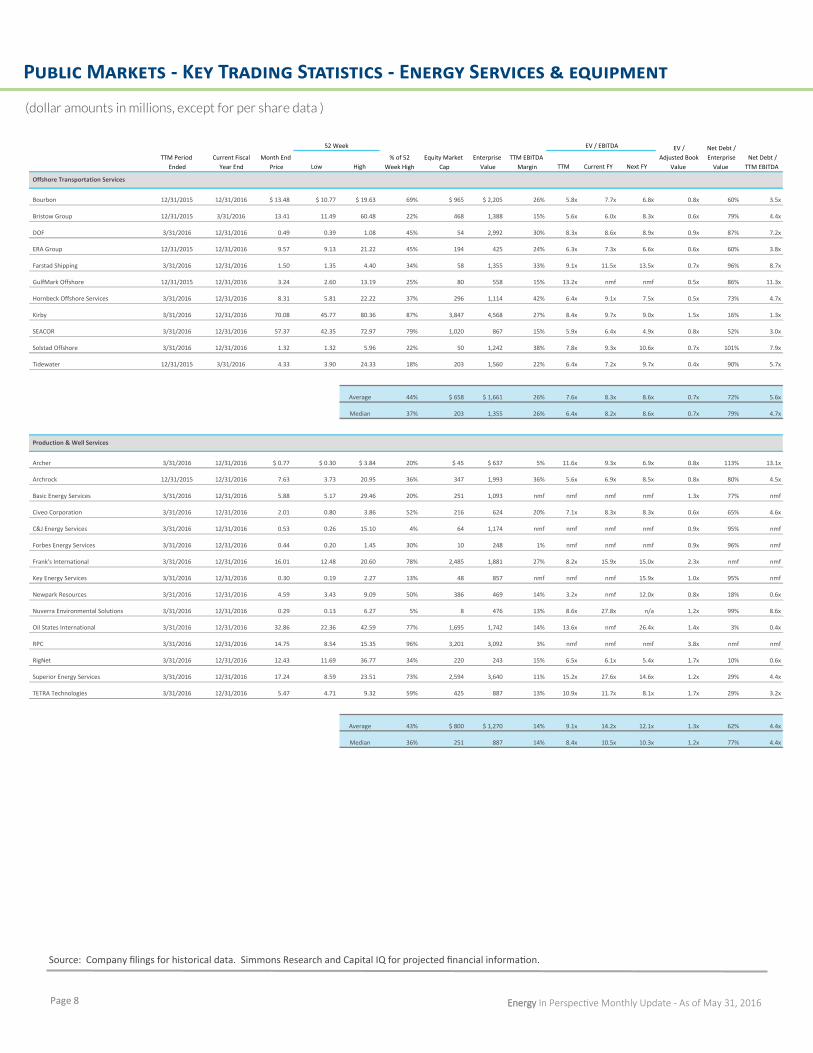
Public Markets - Key Trading Statistics - Energy Services & equipment
(dollar amounts in millions, except for per share data )
Page 8 Energy In Perspective Monthly Update - As of May 31, 2016
Source: Company filings for historical data. Simmons Research and Capital IQ for projected financial information.
Low High TTM Current FY Next FY
Bourbon 12/31/2015 12/31/2016 $ 13.48 $ 10.77 $ 19.63 69% $ 965 $ 2,205 26% 5.8x 7.7x 6.8x 0.8x 60% 3.5x
Bristow Group 12/31/2015 3/31/2016 13.41 11.49 60.48 22% 468 1,388 15% 5.6x 6.0x 8.3x 0.6x 79% 4.4x
DOF 3/31/2016 12/31/2016 0.49 0.39 1.08 45% 54 2,992 30% 8.3x 8.6x 8.9x 0.9x 87% 7.2x
ERA Group 12/31/2015 12/31/2016 9.57 9.13 21.22 45% 194 425 24% 6.3x 7.3x 6.6x 0.6x 60% 3.8x
Farstad Shipping 3/31/2016 12/31/2016 1.50 1.35 4.40 34% 58 1,355 33% 9.1x 11.5x 13.5x 0.7x 96% 8.7x
GulfMark Offshore 12/31/2015 12/31/2016 3.24 2.60 13.19 25% 80 558 15% 13.2x nmf nmf 0.5x 86% 11.3x
Hornbeck Offshore Services 3/31/2016 12/31/2016 8.31 5.81 22.22 37% 296 1,114 42% 6.4x 9.1x 7.5x 0.5x 73% 4.7x
Kirby 3/31/2016 12/31/2016 70.08 45.77 80.36 87% 3,847 4,568 27% 8.4x 9.7x 9.0x 1.5x 16% 1.3x
SEACOR 3/31/2016 12/31/2016 57.37 42.35 72.97 79% 1,020 867 15% 5.9x 6.4x 4.9x 0.8x 52% 3.0x
Solstad Offshore 3/31/2016 12/31/2016 1.32 1.32 5.96 22% 50 1,242 38% 7.8x 9.3x 10.6x 0.7x 101% 7.9x
Tidewater 12/31/2015 3/31/2016 4.33 3.90 24.33 18% 203 1,560 22% 6.4x 7.2x 9.7x 0.4x 90% 5.7x
Average 44% $ 658 $ 1,661 26% 7.6x 8.3x 8.6x 0.7x 72% 5.6x
Median 37% 203 1,355 26% 6.4x 8.2x 8.6x 0.7x 79% 4.7x
Archer 3/31/2016 12/31/2016 $ 0.77 $ 0.30 $ 3.84 20% $ 45 $ 637 5% 11.6x 9.3x 6.9x 0.8x 113% 13.1x
Archrock 12/31/2015 12/31/2016 7.63 3.73 20.95 36% 347 1,993 36% 5.6x 6.9x 8.5x 0.8x 80% 4.5x
Basic Energy Services 3/31/2016 12/31/2016 5.88 5.17 29.46 20% 251 1,093 nmf nmf nmf nmf 1.3x 77% nmf
Civeo Corporation 3/31/2016 12/31/2016 2.01 0.80 3.86 52% 216 624 20% 7.1x 8.3x 8.3x 0.6x 65% 4.6x
C&J Energy Services 3/31/2016 12/31/2016 0.53 0.26 15.10 4% 64 1,174 nmf nmf nmf nmf 0.9x 95% nmf
Forbes Energy Services 3/31/2016 12/31/2016 0.44 0.20 1.45 30% 10 248 1% nmf nmf nmf 0.9x 96% nmf
Frank's International 3/31/2016 12/31/2016 16.01 12.48 20.60 78% 2,485 1,881 27% 8.2x 15.9x 15.0x 2.3x nmf nmf
Key Energy Services 3/31/2016 12/31/2016 0.30 0.19 2.27 13% 48 857 nmf nmf nmf 15.9x 1.0x 95% nmf
Newpark Resources 3/31/2016 12/31/2016 4.59 3.43 9.09 50% 386 469 14% 3.2x nmf 12.0x 0.8x 18% 0.6x
Nuverra Environmental Solutions 3/31/2016 12/31/2016 0.29 0.13 6.27 5% 8 476 13% 8.6x 27.8x n/a 1.2x 99% 8.6x
Oil States International 3/31/2016 12/31/2016 32.86 22.36 42.59 77% 1,695 1,742 14% 13.6x nmf 26.4x 1.4x 3% 0.4x
RPC 3/31/2016 12/31/2016 14.75 8.54 15.35 96% 3,201 3,092 3% nmf nmf nmf 3.8x nmf nmf
RigNet 3/31/2016 12/31/2016 12.43 11.69 36.77 34% 220 243 15% 6.5x 6.1x 5.4x 1.7x 10% 0.6x
Superior Energy Services 3/31/2016 12/31/2016 17.24 8.59 23.51 73% 2,594 3,640 11% 15.2x 27.6x 14.6x 1.2x 29% 4.4x
TETRA Technologies 3/31/2016 12/31/2016 5.47 4.71 9.32 59% 425 887 13% 10.9x 11.7x 8.1x 1.7x 29% 3.2x
Average 43% $ 800 $ 1,270 14% 9.1x 14.2x 12.1x 1.3x 62% 4.4x
Median 36% 251 887 14% 8.4x 10.5x 10.3x 1.2x 77% 4.4x
Offshore Transportation Services
Production & Well Services
TTM Period
Ended
Current Fiscal
Year End
Month End
Price
52 Week
% of 52
Week High
Equity Market
Cap
Enterprise
Value
TTM EBITDA
Margin
EV / EBITDA EV /
Adjusted Book
Value
Net Debt /
Enterprise
Value
Net Debt /
TTM EBITDA
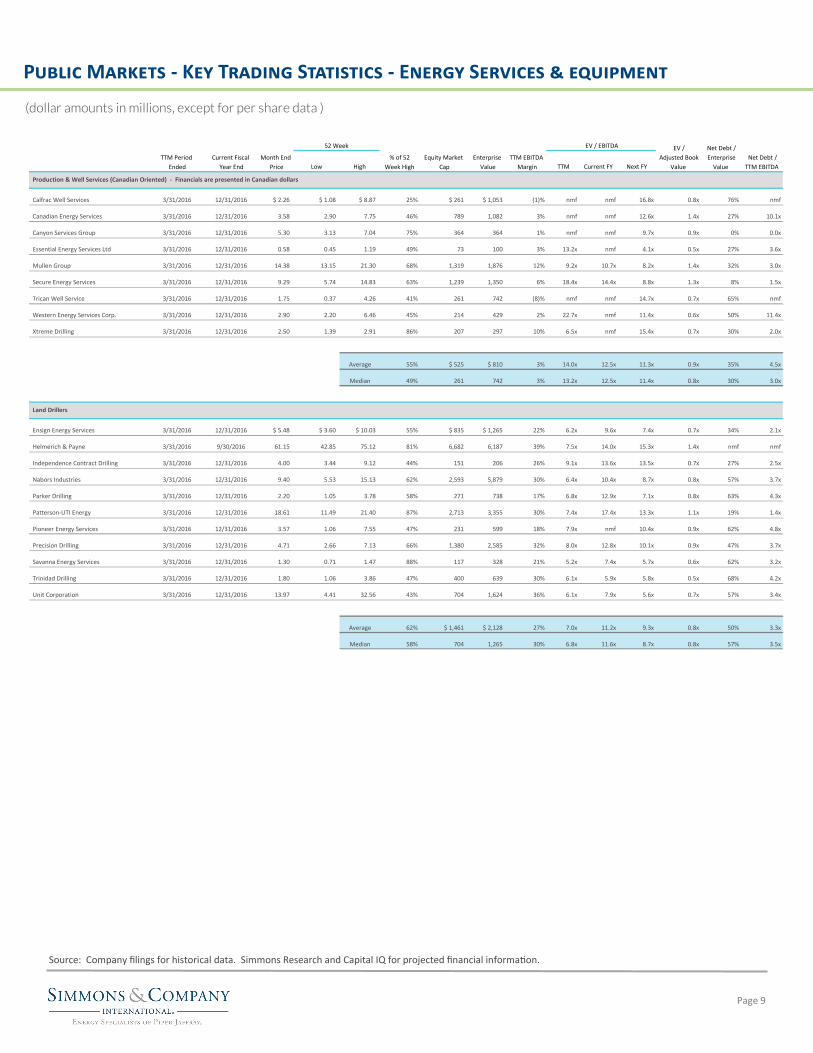
Public Markets - Key Trading Statistics - Energy Services & equipment
(dollar amounts in millions, except for per share data )
Page 9
Source: Company filings for historical data. Simmons Research and Capital IQ for projected financial information.
Low High TTM Current FY Next FY
Calfrac Well Services 3/31/2016 12/31/2016 $ 2.26 $ 1.08 $ 8.87 25% $ 261 $ 1,053 (1)% nmf nmf 16.8x 0.8x 76% nmf
Canadian Energy Services 3/31/2016 12/31/2016 3.58 2.90 7.75 46% 789 1,082 3% nmf nmf 12.6x 1.4x 27% 10.1x
Canyon Services Group 3/31/2016 12/31/2016 5.30 3.13 7.04 75% 364 364 1% nmf nmf 9.7x 0.9x 0% 0.0x
Essential Energy Services Ltd 3/31/2016 12/31/2016 0.58 0.45 1.19 49% 73 100 3% 13.2x nmf 4.1x 0.5x 27% 3.6x
Mullen Group 3/31/2016 12/31/2016 14.38 13.15 21.30 68% 1,319 1,876 12% 9.2x 10.7x 8.2x 1.4x 32% 3.0x
Secure Energy Services 3/31/2016 12/31/2016 9.29 5.74 14.83 63% 1,239 1,350 6% 18.4x 14.4x 8.8x 1.3x 8% 1.5x
Trican Well Service 3/31/2016 12/31/2016 1.75 0.37 4.26 41% 261 742 (8)% nmf nmf 14.7x 0.7x 65% nmf
Western Energy Services Corp. 3/31/2016 12/31/2016 2.90 2.20 6.46 45% 214 429 2% 22.7x nmf 11.4x 0.6x 50% 11.4x
Xtreme Drilling 3/31/2016 12/31/2016 2.50 1.39 2.91 86% 207 297 10% 6.5x nmf 15.4x 0.7x 30% 2.0x
Average 55% $ 525 $ 810 3% 14.0x 12.5x 11.3x 0.9x 35% 4.5x
Median 49% 261 742 3% 13.2x 12.5x 11.4x 0.8x 30% 3.0x
Ensign Energy Services 3/31/2016 12/31/2016 $ 5.48 $ 3.60 $ 10.03 55% $ 835 $ 1,265 22% 6.2x 9.6x 7.4x 0.7x 34% 2.1x
Helmerich & Payne 3/31/2016 9/30/2016 61.15 42.85 75.12 81% 6,682 6,187 39% 7.5x 14.0x 15.3x 1.4x nmf nmf
Independence Contract Drilling 3/31/2016 12/31/2016 4.00 3.44 9.12 44% 151 206 26% 9.1x 13.6x 13.5x 0.7x 27% 2.5x
Nabors Industries 3/31/2016 12/31/2016 9.40 5.53 15.13 62% 2,593 5,879 30% 6.4x 10.4x 8.7x 0.8x 57% 3.7x
Parker Drilling 3/31/2016 12/31/2016 2.20 1.05 3.78 58% 271 738 17% 6.8x 12.9x 7.1x 0.8x 63% 4.3x
Patterson-UTI Energy 3/31/2016 12/31/2016 18.61 11.49 21.40 87% 2,713 3,355 30% 7.4x 17.4x 13.3x 1.1x 19% 1.4x
Pioneer Energy Services 3/31/2016 12/31/2016 3.57 1.06 7.55 47% 231 599 18% 7.9x nmf 10.4x 0.9x 62% 4.8x
Precision Drilling 3/31/2016 12/31/2016 4.71 2.66 7.13 66% 1,380 2,585 32% 8.0x 12.8x 10.1x 0.9x 47% 3.7x
Savanna Energy Services 3/31/2016 12/31/2016 1.30 0.71 1.47 88% 117 328 21% 5.2x 7.4x 5.7x 0.6x 62% 3.2x
Trinidad Drilling 3/31/2016 12/31/2016 1.80 1.06 3.86 47% 400 639 30% 6.1x 5.9x 5.8x 0.5x 68% 4.2x
Unit Corporation 3/31/2016 12/31/2016 13.97 4.41 32.56 43% 704 1,624 36% 6.1x 7.9x 5.6x 0.7x 57% 3.4x
Average 62% $ 1,461 $ 2,128 27% 7.0x 11.2x 9.3x 0.8x 50% 3.3x
Median 58% 704 1,265 30% 6.8x 11.6x 8.7x 0.8x 57% 3.5x
Production & Well Services (Canadian Oriented) - Financials are presented in Canadian dollars
Land Drillers
TTM Period
Ended
Current Fiscal
Year End
Month End
Price
52 Week
% of 52
Week High
Equity Market
Cap
Enterprise
Value
TTM EBITDA
Margin
EV / EBITDA EV /
Adjusted Book
Value
Net Debt /
Enterprise
Value
Net Debt /
TTM EBITDA

Public Markets - Key Trading Statistics - Energy Services & equipment
(dollar amounts in millions, except for per share data )
Page 10 Energy In Perspective Monthly Update - As of May 31, 2016
Source: Company filings for historical data. Simmons Research and Capital IQ for projected financial information.
Low High TTM Current FY Next FY
Atwood Oceanics 3/31/2016 9/30/2016 $ 10.67 $ 5.32 $ 31.30 34% $ 691 $ 2,060 57% 2.8x 3.7x 10.3x 0.5x 66% 1.8x
Diamond Offshore Drilling 3/31/2016 12/31/2016 25.82 15.55 31.35 82% 3,542 5,674 48% 5.4x 8.0x 8.4x 0.9x 38% 2.0x
ENSCO 3/31/2016 12/31/2016 9.89 7.88 24.67 40% 2,977 6,595 51% 3.5x 4.7x 6.5x 0.6x 55% 1.9x
Fred Olsen 3/31/2016 12/31/2016 3.88 2.67 7.94 49% 257 1,288 58% 2.1x 2.6x 6.9x 0.6x 80% 1.7x
Noble Corp. 3/31/2016 12/31/2016 8.34 6.91 17.30 48% 2,025 6,673 61% 3.6x 5.8x 8.2x 0.6x 59% 2.1x
North Atlantic Drilling Limited 3/31/2016 12/31/2016 3.64 1.45 15.40 24% 88 2,560 58% 6.5x 11.8x nmf 0.9x 95% 6.2x
Ocean Rig 3/31/2016 12/31/2016 2.38 0.71 8.09 29% 197 3,440 64% 2.9x 4.1x 6.3x 0.5x 94% 2.7x
Pacific Drilling 3/31/2016 12/31/2016 5.62 3.02 38.40 15% 1,202 3,886 56% 6.9x 10.0x nmf 0.7x 69% 4.8x
Rowan 3/31/2016 12/31/2016 16.93 11.23 22.21 76% 2,113 4,173 49% 4.0x 4.6x 6.9x 0.6x 49% 2.0x
Seadrill 3/31/2016 12/31/2016 3.33 1.63 12.71 26% 1,641 9,505 52% 4.8x 5.7x 7.7x 0.5x 103% 5.0x
Songa Offshore 3/31/2016 12/31/2016 0.04 0.02 0.13 31% 33 2,565 55% 8.7x 6.9x 6.8x 0.8x 99% 8.6x
Transocean 3/31/2016 12/31/2016 9.79 8.20 19.28 51% 3,559 9,162 42% 3.6x 6.4x 9.1x 0.4x 58% 2.1x
Average 42% $ 1,527 $ 4,798 54% 4.6x 6.2x 7.7x 0.6x 72% 3.4x
Median 37% 1,421 4,029 55% 3.8x 5.8x 7.3x 0.6x 68% 2.1x
Aker Solutions 12/31/2015 12/31/2016 $ 3.49 $ 2.63 $ 6.05 58% $ 947 $ 955 9% 2.8x 4.1x 5.0x 1.3x nmf nmf
CARBO Ceramics 3/31/2016 12/31/2016 12.33 10.63 46.00 27% 290 313 nmf nmf nmf nmf 0.5x 8% nmf
Chart Industries 3/31/2016 12/31/2016 25.96 14.25 37.01 70% 794 874 14% 6.5x 9.5x 8.7x 1.1x 9% 0.6x
Dril-Quip 3/31/2016 12/31/2016 61.03 49.90 79.06 77% 2,319 1,908 32% 7.5x 11.9x 17.8x 2.0x nmf nmf
Enerflex Industries 3/31/2016 12/31/2016 8.30 6.80 11.26 74% 657 951 13% 6.8x 6.8x 6.0x 0.9x 31% 2.1x
Fairmount Santrol 3/31/2016 12/31/2016 5.38 1.23 9.10 59% 869 1,881 10% 27.3x nmf 18.1x 2.0x 54% 14.7x
Flotek Industries 3/31/2016 12/31/2016 11.76 5.52 20.98 56% 656 715 1% nmf nmf 12.9x 2.2x 8% nmf
FMC Technologies 3/31/2016 12/31/2016 27.23 22.77 43.25 63% 6,182 6,378 13% 8.3x 10.4x 10.9x 2.3x 3% 0.3x
Forum Energy Technologies 3/31/2016 12/31/2016 16.78 8.54 22.03 76% 1,522 1,729 0% nmf nmf nmf 1.2x 15% nmf
Hunting 12/31/2015 12/31/2016 4.50 3.40 10.44 43% 677 838 8% 13.4x nmf 8.2x 0.6x 16% 2.1x
MRC Global 3/31/2016 12/31/2016 14.19 8.71 16.01 89% 1,438 2,190 5% 10.0x nmf 16.2x 1.3x 34% 3.4x
NOW, Inc. 3/31/2016 12/31/2016 17.34 12.48 23.39 74% 1,861 1,785 nmf nmf nmf nmf 1.4x nmf 0.6x
National Oilwell Varco 3/31/2016 12/31/2016 32.95 26.34 50.20 66% 12,384 14,082 11% 10.9x nmf 18.5x 0.8x 12% 1.3x
Pason Systems 3/31/2016 12/31/2016 13.74 10.47 18.37 75% 1,171 1,035 24% 24.3x nmf 14.7x 5.1x nmf nmf
Schoeller-Bleckmann 3/31/2016 12/31/2016 61.03 45.71 74.57 82% 975 948 nmf nmf 18.4x 9.5x 2.1x nmf 4.5x
ShawCor 3/31/2016 12/31/2016 24.03 18.06 31.75 76% 1,552 1,667 11% 11.6x 11.4x 8.9x 1.8x 8% 0.9x
Tenaris 3/31/2016 12/31/2016 13.27 9.58 15.08 88% 15,662 14,251 14% 16.6x 16.9x 11.1x 1.4x nmf nmf
Tesco 3/31/2016 12/31/2016 7.32 5.53 12.32 59% 286 228 (15)% nmf nmf 17.8x 0.9x nmf 1.7x
U.S. Silica Holdings, Inc. 3/31/2016 12/31/2016 28.53 13.59 32.95 87% 1,527 1,547 8% nmf nmf 19.6x 2.7x 1% 0.4x
Vallourec 3/31/2016 12/31/2016 3.89 2.30 15.86 25% 513 2,765 (6)% nmf nmf 7.2x 0.6x 74% nmf
Average 66% $ 2,614 $ 2,852 9% 12.2x 11.2x 12.4x 1.6x 21% 2.7x
Median 72% 1,073 1,607 10% 10.5x 10.9x 11.1x 1.3x 12% 1.5x
Offshore Drillers
Upstream Equipment Manufacturing & Distribution
TTM Period
Ended
Current Fiscal
Year End
Month End
Price
52 Week
% of 52
Week High
Equity Market
Cap
Enterprise
Value
TTM EBITDA
Margin
EV / EBITDA EV /
Adjusted Book
Value
Net Debt /
Enterprise
Value
Net Debt /
TTM EBITDA
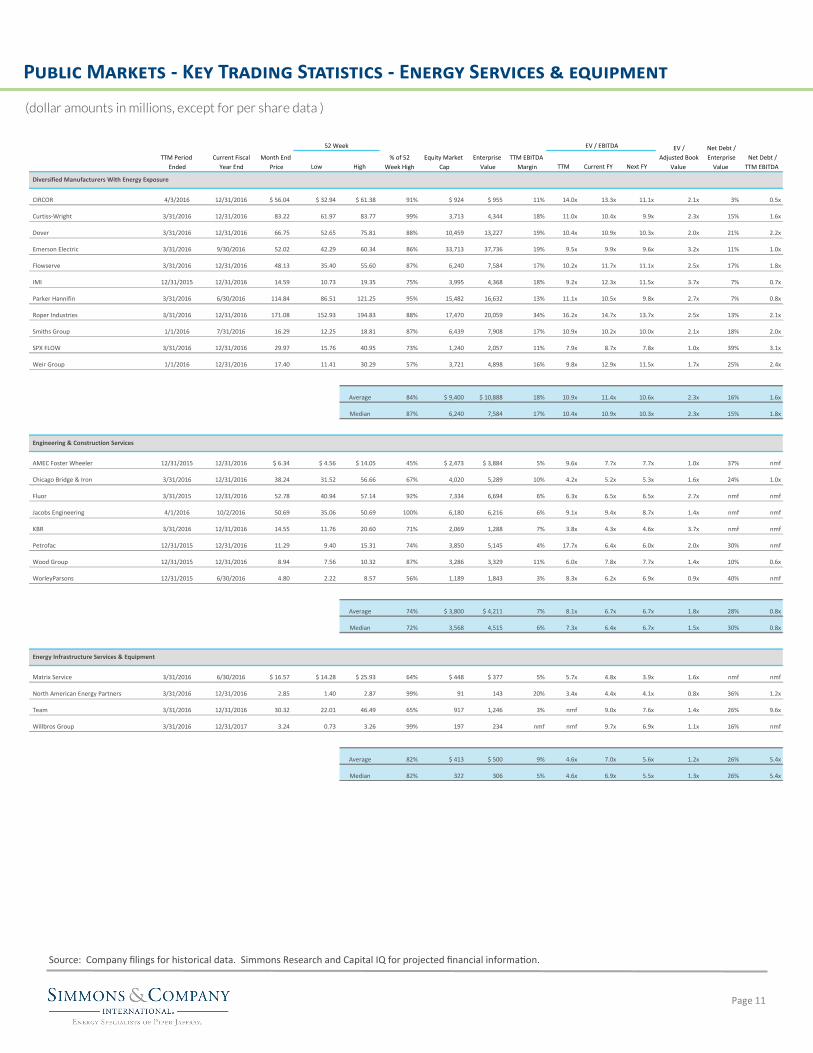
Public Markets - Key Trading Statistics - Energy Services & equipment
(dollar amounts in millions, except for per share data )
Page 11
Source: Company filings for historical data. Simmons Research and Capital IQ for projected financial information.
Low High TTM Current FY Next FY
CIRCOR 4/3/2016 12/31/2016 $ 56.04 $ 32.94 $ 61.38 91% $ 924 $ 955 11% 14.0x 13.3x 11.1x 2.1x 3% 0.5x
Curtiss-Wright 3/31/2016 12/31/2016 83.22 61.97 83.77 99% 3,713 4,344 18% 11.0x 10.4x 9.9x 2.3x 15% 1.6x
Dover 3/31/2016 12/31/2016 66.75 52.65 75.81 88% 10,459 13,227 19% 10.4x 10.9x 10.3x 2.0x 21% 2.2x
Emerson Electric 3/31/2016 9/30/2016 52.02 42.29 60.34 86% 33,713 37,736 19% 9.5x 9.9x 9.6x 3.2x 11% 1.0x
Flowserve 3/31/2016 12/31/2016 48.13 35.40 55.60 87% 6,240 7,584 17% 10.2x 11.7x 11.1x 2.5x 17% 1.8x
IMI 12/31/2015 12/31/2016 14.59 10.73 19.35 75% 3,995 4,368 18% 9.2x 12.3x 11.5x 3.7x 7% 0.7x
Parker Hannifin 3/31/2016 6/30/2016 114.84 86.51 121.25 95% 15,482 16,632 13% 11.1x 10.5x 9.8x 2.7x 7% 0.8x
Roper Industries 3/31/2016 12/31/2016 171.08 152.93 194.83 88% 17,470 20,059 34% 16.2x 14.7x 13.7x 2.5x 13% 2.1x
Smiths Group 1/1/2016 7/31/2016 16.29 12.25 18.81 87% 6,439 7,908 17% 10.9x 10.2x 10.0x 2.1x 18% 2.0x
SPX FLOW 3/31/2016 12/31/2016 29.97 15.76 40.95 73% 1,240 2,057 11% 7.9x 8.7x 7.8x 1.0x 39% 3.1x
Weir Group 1/1/2016 12/31/2016 17.40 11.41 30.29 57% 3,721 4,898 16% 9.8x 12.9x 11.5x 1.7x 25% 2.4x
Average 84% $ 9,400 $ 10,888 18% 10.9x 11.4x 10.6x 2.3x 16% 1.6x
Median 87% 6,240 7,584 17% 10.4x 10.9x 10.3x 2.3x 15% 1.8x
AMEC Foster Wheeler 12/31/2015 12/31/2016 $ 6.34 $ 4.56 $ 14.05 45% $ 2,473 $ 3,884 5% 9.6x 7.7x 7.7x 1.0x 37% nmf
Chicago Bridge & Iron 3/31/2016 12/31/2016 38.24 31.52 56.66 67% 4,020 5,289 10% 4.2x 5.2x 5.3x 1.6x 24% 1.0x
Fluor 3/31/2015 12/31/2016 52.78 40.94 57.14 92% 7,334 6,694 6% 6.3x 6.5x 6.5x 2.7x nmf nmf
Jacobs Engineering 4/1/2016 10/2/2016 50.69 35.06 50.69 100% 6,180 6,216 6% 9.1x 9.4x 8.7x 1.4x nmf nmf
KBR 3/31/2016 12/31/2016 14.55 11.76 20.60 71% 2,069 1,288 7% 3.8x 4.3x 4.6x 3.7x nmf nmf
Petrofac 12/31/2015 12/31/2016 11.29 9.40 15.31 74% 3,850 5,145 4% 17.7x 6.4x 6.0x 2.0x 30% nmf
Wood Group 12/31/2015 12/31/2016 8.94 7.56 10.32 87% 3,286 3,329 11% 6.0x 7.8x 7.7x 1.4x 10% 0.6x
WorleyParsons 12/31/2015 6/30/2016 4.80 2.22 8.57 56% 1,189 1,843 3% 8.3x 6.2x 6.9x 0.9x 40% nmf
Average 74% $ 3,800 $ 4,211 7% 8.1x 6.7x 6.7x 1.8x 28% 0.8x
Median 72% 3,568 4,515 6% 7.3x 6.4x 6.7x 1.5x 30% 0.8x
Matrix Service 3/31/2016 6/30/2016 $ 16.57 $ 14.28 $ 25.93 64% $ 448 $ 377 5% 5.7x 4.8x 3.9x 1.6x nmf nmf
North American Energy Partners 3/31/2016 12/31/2016 2.85 1.40 2.87 99% 91 143 20% 3.4x 4.4x 4.1x 0.8x 36% 1.2x
Team 3/31/2016 12/31/2016 30.32 22.01 46.49 65% 917 1,246 3% nmf 9.0x 7.6x 1.4x 26% 9.6x
Willbros Group 3/31/2016 12/31/2017 3.24 0.73 3.26 99% 197 234 nmf nmf 9.7x 6.9x 1.1x 16% nmf
Average 82% $ 413 $ 500 9% 4.6x 7.0x 5.6x 1.2x 26% 5.4x
Median 82% 322 306 5% 4.6x 6.9x 5.5x 1.3x 26% 5.4x
Engineering & Construction Services
Energy Infrastructure Services & Equipment
Diversified Manufacturers With Energy Exposure
TTM EBITDA
Margin
EV / EBITDA EV /
Adjusted Book
Value
TTM Period
Ended
Current Fiscal
Year End
Month End
Price
52 Week
% of 52
Week High
Net Debt /
Enterprise
Value
Net Debt /
TTM EBITDA
Equity Market
Cap
Enterprise
Value
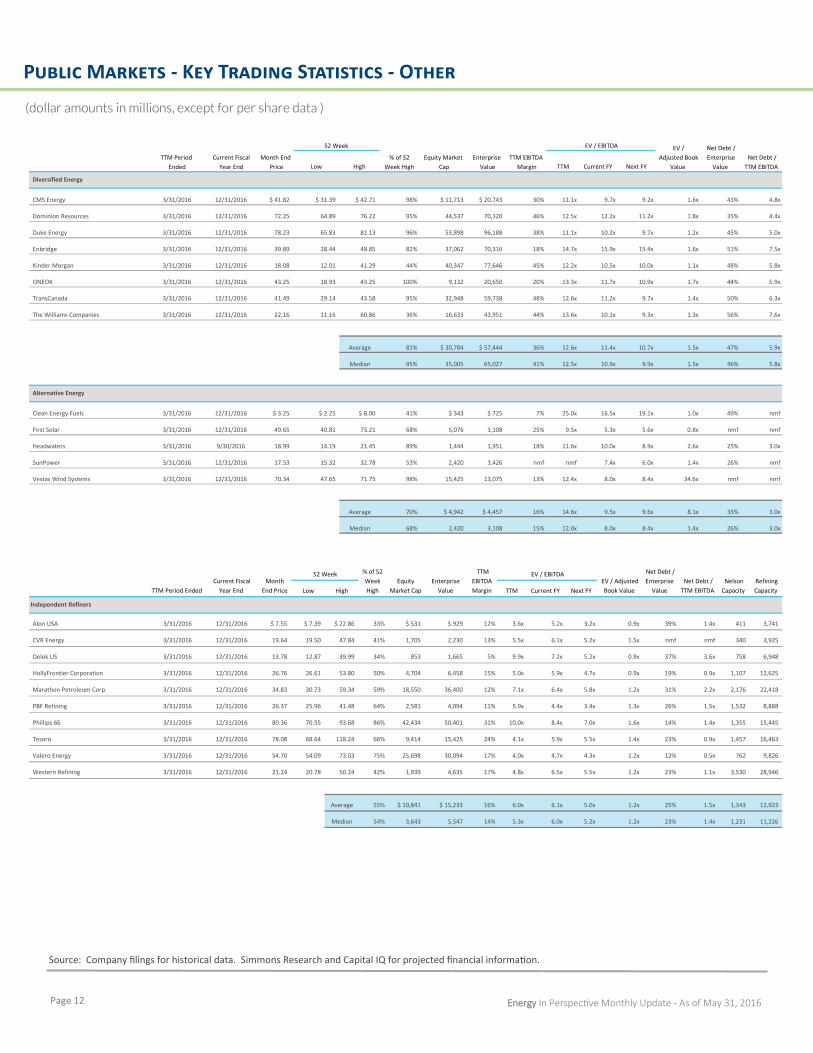
Public Markets - Key Trading Statistics - Other
(dollar amounts in millions, except for per share data )
Page 12 Energy In Perspective Monthly Update - As of May 31, 2016
Source: Company filings for historical data. Simmons Research and Capital IQ for projected financial information.
Low High TTM Current FY Next FY
CMS Energy 3/31/2016 12/31/2016 $ 41.82 $ 31.39 $ 42.71 98% $ 11,713 $ 20,743 30% 11.1x 9.7x 9.2x 1.6x 43% 4.8x
Dominion Resources 3/31/2016 12/31/2016 72.25 64.89 76.22 95% 44,537 70,320 46% 12.5x 12.2x 11.2x 1.8x 35% 4.4x
Duke Energy 3/31/2016 12/31/2016 78.23 65.83 81.13 96% 53,898 96,188 38% 11.1x 10.2x 9.7x 1.2x 45% 5.0x
Enbridge 3/31/2016 12/31/2016 39.89 28.44 48.85 82% 37,062 70,316 18% 14.7x 15.9x 15.4x 1.6x 51% 7.5x
Kinder Morgan 3/31/2016 12/31/2016 18.08 12.01 41.29 44% 40,347 77,646 45% 12.2x 10.5x 10.0x 1.1x 48% 5.8x
ONEOK 3/31/2016 12/31/2016 43.25 18.93 43.25 100% 9,132 20,650 20% 13.3x 11.7x 10.9x 1.7x 44% 5.9x
TransCanada 3/31/2016 12/31/2016 41.49 29.14 43.58 95% 32,948 59,738 48% 12.6x 11.2x 9.7x 1.4x 50% 6.3x
The Williams Companies 3/31/2016 12/31/2016 22.16 11.16 60.86 36% 16,633 43,951 44% 13.6x 10.1x 9.3x 1.3x 56% 7.6x
Average 81% $ 30,784 $ 57,444 36% 12.6x 11.4x 10.7x 1.5x 47% 5.9x
Median 95% 35,005 65,027 41% 12.5x 10.9x 9.9x 1.5x 46% 5.8x
Clean Energy Fuels 3/31/2016 12/31/2016 $ 3.25 $ 2.25 $ 8.00 41% $ 343 $ 725 7% 25.0x 16.5x 19.1x 1.0x 49% nmf
First Solar 3/31/2016 12/31/2016 49.65 40.81 73.21 68% 5,076 3,108 25% 9.5x 5.3x 5.6x 0.8x nmf nmf
Headwaters 3/31/2016 9/30/2016 18.99 14.19 21.45 89% 1,444 1,951 18% 11.6x 10.0x 8.9x 2.6x 25% 3.0x
SunPower 3/31/2016 12/31/2016 17.53 15.32 32.78 53% 2,420 3,426 nmf nmf 7.4x 6.0x 1.4x 26% nmf
Vestas Wind Systems 3/31/2016 12/31/2016 70.34 47.65 71.75 98% 15,425 13,075 13% 12.4x 8.0x 8.4x 34.6x nmf nmf
Average 70% $ 4,942 $ 4,457 16% 14.6x 9.5x 9.6x 8.1x 33% 3.0x
Median 68% 2,420 3,108 15% 12.0x 8.0x 8.4x 1.4x 26% 3.0x
Diversified Energy
Alternative Energy
TTM Period
Ended
Current Fiscal
Year End
Month End
Price
52 Week
% of 52
Week High
Equity Market
Cap
Enterprise
Value
TTM EBITDA
Margin
EV / EBITDA EV /
Adjusted Book
Value
Net Debt /
Enterprise
Value
Net Debt /
TTM EBITDA
Low High TTM Current FY Next FY
Alon USA 3/31/2016 12/31/2016 $ 7.55 $ 7.39 $ 22.86 33% $ 531 $ 929 12% 3.6x 5.2x 3.2x 0.9x 39% 1.4x 411 3,741
CVR Energy 3/31/2016 12/31/2016 19.64 19.50 47.84 41% 1,705 2,230 13% 5.5x 6.1x 5.2x 1.5x nmf nmf 340 3,925
Delek US 3/31/2016 12/31/2016 13.78 12.87 39.99 34% 853 1,665 5% 9.9x 7.2x 5.2x 0.9x 37% 3.6x 758 6,948
HollyFrontier Corporation 3/31/2016 12/31/2016 26.76 26.61 53.80 50% 4,704 6,458 15% 5.0x 5.9x 4.7x 0.9x 19% 0.9x 1,107 12,625
Marathon Petroleum Corp. 3/31/2016 12/31/2016 34.83 30.73 59.34 59% 18,550 36,400 12% 7.1x 6.4x 5.8x 1.2x 31% 2.2x 2,176 22,418
PBF Refining 3/31/2016 12/31/2016 26.37 25.96 41.48 64% 2,581 4,094 11% 5.9x 4.4x 3.4x 1.3x 26% 1.5x 1,532 8,888
Phillips 66 3/31/2016 12/31/2016 80.36 70.55 93.68 86% 42,434 50,401 31% 10.0x 8.4x 7.0x 1.6x 14% 1.4x 1,355 15,445
Tesoro 3/31/2016 12/31/2016 78.08 68.64 118.24 66% 9,414 15,425 24% 4.1x 5.9x 5.5x 1.4x 23% 0.9x 1,457 16,463
Valero Energy 3/31/2016 12/31/2016 54.70 54.09 73.03 75% 25,698 30,094 17% 4.0x 4.7x 4.3x 1.2x 12% 0.5x 762 9,826
Western Refining 3/31/2016 12/31/2016 21.24 20.78 50.24 42% 1,939 4,635 17% 4.8x 6.5x 5.5x 1.2x 23% 1.1x 3,530 28,946
Average 55% $ 10,841 $ 15,233 16% 6.0x 6.1x 5.0x 1.2x 25% 1.5x 1,343 12,923
Median 54% 3,643 5,547 14% 5.3x 6.0x 5.2x 1.2x 23% 1.4x 1,231 11,226
Nelson
Capacity
Refining
Capacity
Independent Refiners
Enterprise
Value
TTM
EBITDA
Margin
EV / EBITDA EV / Adjusted
Book Value
Net Debt /
Enterprise
Value
Net Debt /
TTM EBITDA TTM Period Ended
Current Fiscal
Year End
Month
End Price
52 Week % of 52
Week
High
Equity
Market Cap
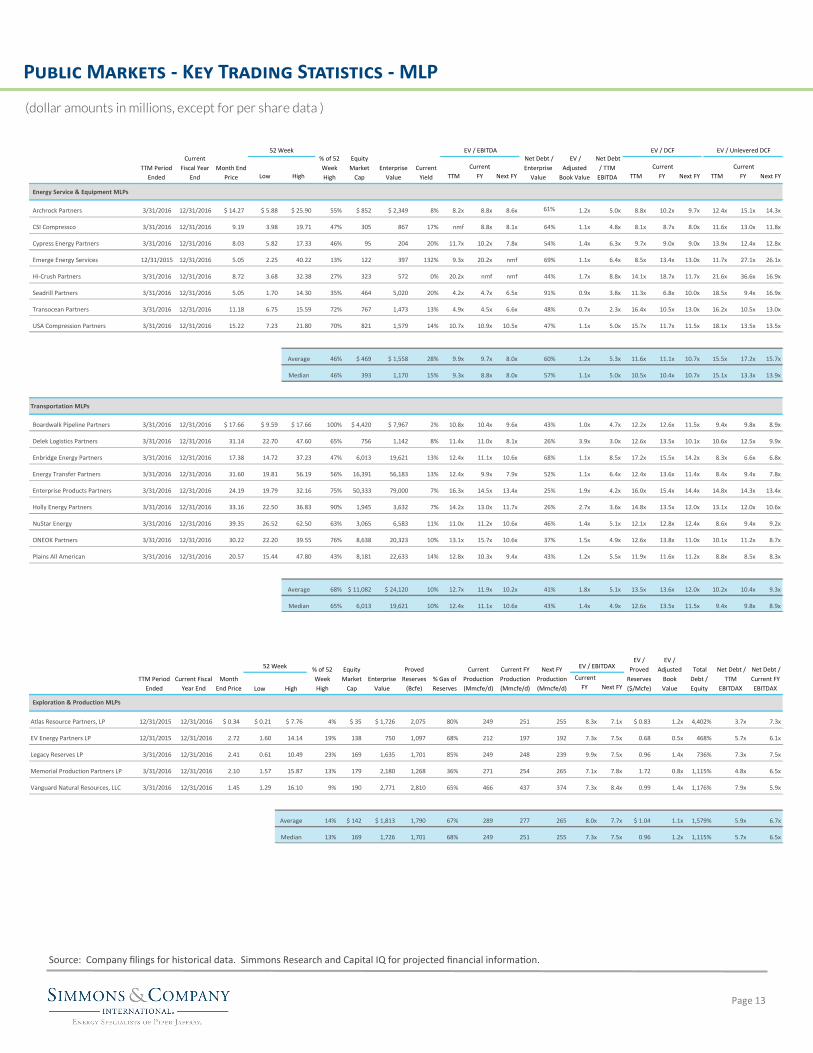
Public Markets - Key Trading Statistics - MLP
(dollar amounts in millions, except for per share data )
Page 13
Source: Company filings for historical data. Simmons Research and Capital IQ for projected financial information.
Low High TTM
Current
FY Next FY TTM
Current
FY Next FY TTM
Current
FY Next FY
Energy Service & Equipment MLPs
Archrock Partners 3/31/2016 12/31/2016 $ 14.27 $ 5.88 $ 25.90 55% $ 852 $ 2,349 8% 8.2x 8.8x 8.6x 61% 1.2x 5.0x 8.8x 10.2x 9.7x 12.4x 15.1x 14.3x
CSI Compressco 3/31/2016 12/31/2016 9.19 3.98 19.71 47% 305 867 17% nmf 8.8x 8.1x 64% 1.1x 4.8x 8.1x 8.7x 8.0x 11.6x 13.0x 11.8x
Cypress Energy Partners 3/31/2016 12/31/2016 8.03 5.82 17.33 46% 95 204 20% 11.7x 10.2x 7.8x 54% 1.4x 6.3x 9.7x 9.0x 9.0x 13.9x 12.4x 12.8x
Emerge Energy Services 12/31/2015 12/31/2016 5.05 2.25 40.22 13% 122 397 132% 9.3x 20.2x nmf 69% 1.1x 6.4x 8.5x 13.4x 13.0x 11.7x 27.1x 26.1x
Hi-Crush Partners 3/31/2016 12/31/2016 8.72 3.68 32.38 27% 323 572 0% 20.2x nmf nmf 44% 1.7x 8.8x 14.1x 18.7x 11.7x 21.6x 36.6x 16.9x
Seadrill Partners 3/31/2016 12/31/2016 5.05 1.70 14.30 35% 464 5,020 20% 4.2x 4.7x 6.5x 91% 0.9x 3.8x 11.3x 6.8x 10.0x 18.5x 9.4x 16.9x
Transocean Partners 3/31/2016 12/31/2016 11.18 6.75 15.59 72% 767 1,473 13% 4.9x 4.5x 6.6x 48% 0.7x 2.3x 16.4x 10.5x 13.0x 16.2x 10.5x 13.0x
USA Compression Partners 3/31/2016 12/31/2016 15.22 7.23 21.80 70% 821 1,579 14% 10.7x 10.9x 10.5x 47% 1.1x 5.0x 15.7x 11.7x 11.5x 18.1x 13.5x 13.5x
Average 46% $ 469 $ 1,558 28% 9.9x 9.7x 8.0x 60% 1.2x 5.3x 11.6x 11.1x 10.7x 15.5x 17.2x 15.7x
Median 46% 393 1,170 15% 9.3x 8.8x 8.0x 57% 1.1x 5.0x 10.5x 10.4x 10.7x 15.1x 13.3x 13.9x
Transportation MLPs
Boardwalk Pipeline Partners 3/31/2016 12/31/2016 $ 17.66 $ 9.59 $ 17.66 100% $ 4,420 $ 7,967 2% 10.8x 10.4x 9.6x 43% 1.0x 4.7x 12.2x 12.6x 11.5x 9.4x 9.8x 8.9x
Delek Logistics Partners 3/31/2016 12/31/2016 31.14 22.70 47.60 65% 756 1,142 8% 11.4x 11.0x 8.1x 26% 3.9x 3.0x 12.6x 13.5x 10.1x 10.6x 12.5x 9.9x
Enbridge Energy Partners 3/31/2016 12/31/2016 17.38 14.72 37.23 47% 6,013 19,621 13% 12.4x 11.1x 10.6x 68% 1.1x 8.5x 17.2x 15.5x 14.2x 8.3x 6.6x 6.8x
Energy Transfer Partners 3/31/2016 12/31/2016 31.60 19.81 56.19 56% 16,391 56,183 13% 12.4x 9.9x 7.9x 52% 1.1x 6.4x 12.4x 13.6x 11.4x 8.4x 9.4x 7.8x
Enterprise Products Partners 3/31/2016 12/31/2016 24.19 19.79 32.16 75% 50,333 79,000 7% 16.3x 14.5x 13.4x 25% 1.9x 4.2x 16.0x 15.4x 14.4x 14.8x 14.3x 13.4x
Holly Energy Partners 3/31/2016 12/31/2016 33.16 22.50 36.83 90% 1,945 3,632 7% 14.2x 13.0x 11.7x 26% 2.7x 3.6x 14.8x 13.5x 12.0x 13.1x 12.0x 10.6x
NuStar Energy 3/31/2016 12/31/2016 39.35 26.52 62.50 63% 3,065 6,583 11% 11.0x 11.2x 10.6x 46% 1.4x 5.1x 12.1x 12.8x 12.4x 8.6x 9.4x 9.2x
ONEOK Partners 3/31/2016 12/31/2016 30.22 22.20 39.55 76% 8,638 20,323 10% 13.1x 15.7x 10.6x 37% 1.5x 4.9x 12.6x 13.8x 11.0x 10.1x 11.2x 8.7x
Plains All American 3/31/2016 12/31/2016 20.57 15.44 47.80 43% 8,181 22,633 14% 12.8x 10.3x 9.4x 43% 1.2x 5.5x 11.9x 11.6x 11.2x 8.8x 8.5x 8.3x
Average 68% $ 11,082 $ 24,120 10% 12.7x 11.9x 10.2x 41% 1.8x 5.1x 13.5x 13.6x 12.0x 10.2x 10.4x 9.3x
Median 65% 6,013 19,621 10% 12.4x 11.1x 10.6x 43% 1.4x 4.9x 12.6x 13.5x 11.5x 9.4x 9.8x 8.9x
TTM Period
Ended
Current
Fiscal Year
End
Month End
Price
52 Week% of 52
Week
High
Equity
Market
Cap
EV / DCF EV / Unlevered DCF
Enterprise
Value
Current
Yield
EV / EBITDA Net Debt /
Enterprise
Value
EV /
Adjusted
Book Value
Net Debt
/ TTM
EBITDA
Low High
Current
FY Next FY
Atlas Resource Partners, LP 12/31/2015 12/31/2016 $ 0.34 $ 0.21 $ 7.76 4% $ 35 $ 1,726 2,075 80% 249 251 255 8.3x 7.1x $ 0.83 1.2x 4,402% 3.7x 7.3x
EV Energy Partners LP 12/31/2015 12/31/2016 2.72 1.60 14.14 19% 138 750 1,097 68% 212 197 192 7.3x 7.5x 0.68 0.5x 468% 5.7x 6.1x
Legacy Reserves LP 3/31/2016 12/31/2016 2.41 0.61 10.49 23% 169 1,635 1,701 85% 249 248 239 9.9x 7.5x 0.96 1.4x 736% 7.3x 7.5x
Memorial Production Partners LP 3/31/2016 12/31/2016 2.10 1.57 15.87 13% 179 2,180 1,268 36% 271 254 265 7.1x 7.8x 1.72 0.8x 1,115% 4.8x 6.5x
Vanguard Natural Resources, LLC 3/31/2016 12/31/2016 1.45 1.29 16.10 9% 190 2,771 2,810 65% 466 437 374 7.3x 8.4x 0.99 1.4x 1,176% 7.9x 5.9x
Average 14% $ 142 $ 1,813 1,790 67% 289 277 265 8.0x 7.7x $ 1.04 1.1x 1,579% 5.9x 6.7x
Median 13% 169 1,726 1,701 68% 249 251 255 7.3x 7.5x 0.96 1.2x 1,115% 5.7x 6.5x
Next FY
Production
(Mmcfe/d)
TTM Period
Ended
Current Fiscal
Year End
Exploration & Production MLPs
Month
End Price
52 Week % of 52
Week
High
Equity
Market
Cap
EV / EBITDAXEV /
Proved
Reserves
($/Mcfe)
EV /
Adjusted
Book
Value
Total
Debt /
Equity
Net Debt /
TTM
EBITDAX
Net Debt /
Current FY
EBITDAX
Enterprise
Value
Proved
Reserves
(Bcfe)
% Gas of
Reserves
Current
Production
(Mmcfe/d)
Current FY
Production
(Mmcfe/d)
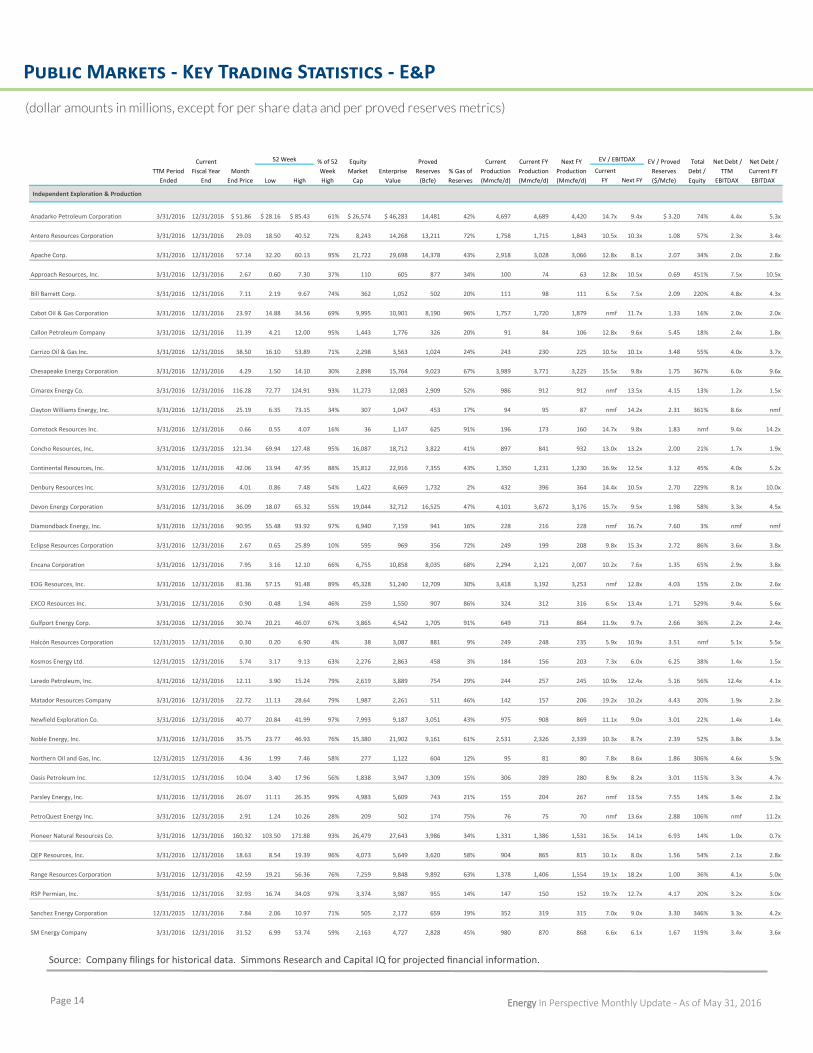
Public Markets - Key Trading Statistics - E&P
(dollar amounts in millions, except for per share data and per proved reserves metrics)
Page 14 Energy In Perspective Monthly Update - As of May 31, 2016
Source: Company filings for historical data. Simmons Research and Capital IQ for projected financial information.
Low High
Current
FY Next FY
Independent Exploration & Production
Anadarko Petroleum Corporation 3/31/2016 12/31/2016 $ 51.86 $ 28.16 $ 85.43 61% $ 26,574 $ 46,283 14,481 42% 4,697 4,689 4,420 14.7x 9.4x $ 3.20 74% 4.4x 5.3x
Antero Resources Corporation 3/31/2016 12/31/2016 29.03 18.50 40.52 72% 8,243 14,268 13,211 72% 1,758 1,715 1,843 10.5x 10.3x 1.08 57% 2.3x 3.4x
Apache Corp. 3/31/2016 12/31/2016 57.14 32.20 60.13 95% 21,722 29,698 14,378 43% 2,918 3,028 3,066 12.8x 8.1x 2.07 34% 2.0x 2.8x
Approach Resources, Inc. 3/31/2016 12/31/2016 2.67 0.60 7.30 37% 110 605 877 34% 100 74 63 12.8x 10.5x 0.69 451% 7.5x 10.5x
Bill Barrett Corp. 3/31/2016 12/31/2016 7.11 2.19 9.67 74% 362 1,052 502 20% 111 98 111 6.5x 7.5x 2.09 220% 4.8x 4.3x
Cabot Oil & Gas Corporation 3/31/2016 12/31/2016 23.97 14.88 34.56 69% 9,995 10,901 8,190 96% 1,757 1,720 1,879 nmf 11.7x 1.33 16% 2.0x 2.0x
Callon Petroleum Company 3/31/2016 12/31/2016 11.39 4.21 12.00 95% 1,443 1,776 326 20% 91 84 106 12.8x 9.6x 5.45 18% 2.4x 1.8x
Carrizo Oil & Gas Inc. 3/31/2016 12/31/2016 38.50 16.10 53.89 71% 2,298 3,563 1,024 24% 243 230 225 10.5x 10.1x 3.48 55% 4.0x 3.7x
Chesapeake Energy Corporation 3/31/2016 12/31/2016 4.29 1.50 14.10 30% 2,898 15,764 9,023 67% 3,989 3,771 3,225 15.5x 9.8x 1.75 367% 6.0x 9.6x
Cimarex Energy Co. 3/31/2016 12/31/2016 116.28 72.77 124.91 93% 11,273 12,083 2,909 52% 986 912 912 nmf 13.5x 4.15 13% 1.2x 1.5x
Clayton Williams Energy, Inc. 3/31/2016 12/31/2016 25.19 6.35 73.15 34% 307 1,047 453 17% 94 95 87 nmf 14.2x 2.31 361% 8.6x nmf
Comstock Resources Inc. 3/31/2016 12/31/2016 0.66 0.55 4.07 16% 36 1,147 625 91% 196 173 160 14.7x 9.8x 1.83 nmf 9.4x 14.2x
Concho Resources, Inc. 3/31/2016 12/31/2016 121.34 69.94 127.48 95% 16,087 18,712 3,822 41% 897 841 932 13.0x 13.2x 2.00 21% 1.7x 1.9x
Continental Resources, Inc. 3/31/2016 12/31/2016 42.06 13.94 47.95 88% 15,812 22,916 7,355 43% 1,350 1,231 1,230 16.9x 12.5x 3.12 45% 4.0x 5.2x
Denbury Resources Inc. 3/31/2016 12/31/2016 4.01 0.86 7.48 54% 1,422 4,669 1,732 2% 432 396 364 14.4x 10.5x 2.70 229% 8.1x 10.0x
Devon Energy Corporation 3/31/2016 12/31/2016 36.09 18.07 65.32 55% 19,044 32,712 16,525 47% 4,101 3,672 3,176 15.7x 9.5x 1.98 58% 3.3x 4.5x
Diamondback Energy, Inc. 3/31/2016 12/31/2016 90.95 55.48 93.92 97% 6,940 7,159 941 16% 228 216 228 nmf 16.7x 7.60 3% nmf nmf
Eclipse Resources Corporation 3/31/2016 12/31/2016 2.67 0.65 25.89 10% 595 969 356 72% 249 199 208 9.8x 15.3x 2.72 86% 3.6x 3.8x
Encana Corporation 3/31/2016 12/31/2016 7.95 3.16 12.10 66% 6,755 10,858 8,035 68% 2,294 2,121 2,007 10.2x 7.6x 1.35 65% 2.9x 3.8x
EOG Resources, Inc. 3/31/2016 12/31/2016 81.36 57.15 91.48 89% 45,328 51,240 12,709 30% 3,418 3,192 3,253 nmf 12.8x 4.03 15% 2.0x 2.6x
EXCO Resources Inc. 3/31/2016 12/31/2016 0.90 0.48 1.94 46% 259 1,550 907 86% 324 312 316 6.5x 13.4x 1.71 529% 9.4x 5.6x
Gulfport Energy Corp. 3/31/2016 12/31/2016 30.74 20.21 46.07 67% 3,865 4,542 1,705 91% 649 713 864 11.9x 9.7x 2.66 36% 2.2x 2.4x
Halcón Resources Corporation 12/31/2015 12/31/2016 0.30 0.20 6.90 4% 38 3,087 881 9% 249 248 235 5.9x 10.9x 3.51 nmf 5.1x 5.5x
Kosmos Energy Ltd. 12/31/2015 12/31/2016 5.74 3.17 9.13 63% 2,276 2,863 458 3% 184 156 203 7.3x 6.0x 6.25 38% 1.4x 1.5x
Laredo Petroleum, Inc. 3/31/2016 12/31/2016 12.11 3.90 15.24 79% 2,619 3,889 754 29% 244 257 245 10.9x 12.4x 5.16 56% 12.4x 4.1x
Matador Resources Company 3/31/2016 12/31/2016 22.72 11.13 28.64 79% 1,987 2,261 511 46% 142 157 206 19.2x 10.2x 4.43 20% 1.9x 2.3x
Newfield Exploration Co. 3/31/2016 12/31/2016 40.77 20.84 41.99 97% 7,993 9,187 3,051 43% 975 908 869 11.1x 9.0x 3.01 22% 1.4x 1.4x
Noble Energy, Inc. 3/31/2016 12/31/2016 35.75 23.77 46.93 76% 15,380 21,902 9,161 61% 2,531 2,326 2,339 10.3x 8.7x 2.39 52% 3.8x 3.3x
Northern Oil and Gas, Inc. 12/31/2015 12/31/2016 4.36 1.99 7.46 58% 277 1,122 604 12% 95 81 80 7.8x 8.6x 1.86 306% 4.6x 5.9x
Oasis Petroleum Inc. 12/31/2015 12/31/2016 10.04 3.40 17.96 56% 1,838 3,947 1,309 15% 306 289 280 8.9x 8.2x 3.01 115% 3.3x 4.7x
Parsley Energy, Inc. 3/31/2016 12/31/2016 26.07 11.11 26.35 99% 4,983 5,609 743 21% 155 204 267 nmf 13.5x 7.55 14% 3.4x 2.3x
PetroQuest Energy Inc. 3/31/2016 12/31/2016 2.91 1.24 10.26 28% 209 502 174 75% 76 75 70 nmf 13.6x 2.88 106% nmf 11.2x
Pioneer Natural Resources Co. 3/31/2016 12/31/2016 160.32 103.50 171.88 93% 26,479 27,643 3,986 34% 1,331 1,386 1,531 16.5x 14.1x 6.93 14% 1.0x 0.7x
QEP Resources, Inc. 3/31/2016 12/31/2016 18.63 8.54 19.39 96% 4,073 5,649 3,620 58% 904 865 815 10.1x 8.0x 1.56 54% 2.1x 2.8x
Range Resources Corporation 3/31/2016 12/31/2016 42.59 19.21 56.36 76% 7,259 9,848 9,892 63% 1,378 1,406 1,554 19.1x 18.2x 1.00 36% 4.1x 5.0x
RSP Permian, Inc. 3/31/2016 12/31/2016 32.93 16.74 34.03 97% 3,374 3,987 955 14% 147 150 152 19.7x 12.7x 4.17 20% 3.2x 3.0x
Sanchez Energy Corporation 12/31/2015 12/31/2016 7.84 2.06 10.97 71% 505 2,172 659 19% 352 319 315 7.0x 9.0x 3.30 346% 3.3x 4.2x
SM Energy Company 3/31/2016 12/31/2016 31.52 6.99 53.74 59% 2,163 4,727 2,828 45% 980 870 868 6.6x 6.1x 1.67 119% 3.4x 3.6x
TTM Period
Ended
Current
Fiscal Year
End
Month
End Price
52 Week % of 52
Week
High
EV / Proved
Reserves
($/Mcfe)
Total
Debt /
Equity
Net Debt /
TTM
EBITDAX
Equity
Market
Cap
% Gas of
Reserves
Current
Production
(Mmcfe/d)
Current FY
Production
(Mmcfe/d)
Next FY
Production
(Mmcfe/d)
EV / EBITDAX Net Debt /
Current FY
EBITDAX
Enterprise
Value
Proved
Reserves
(Bcfe)
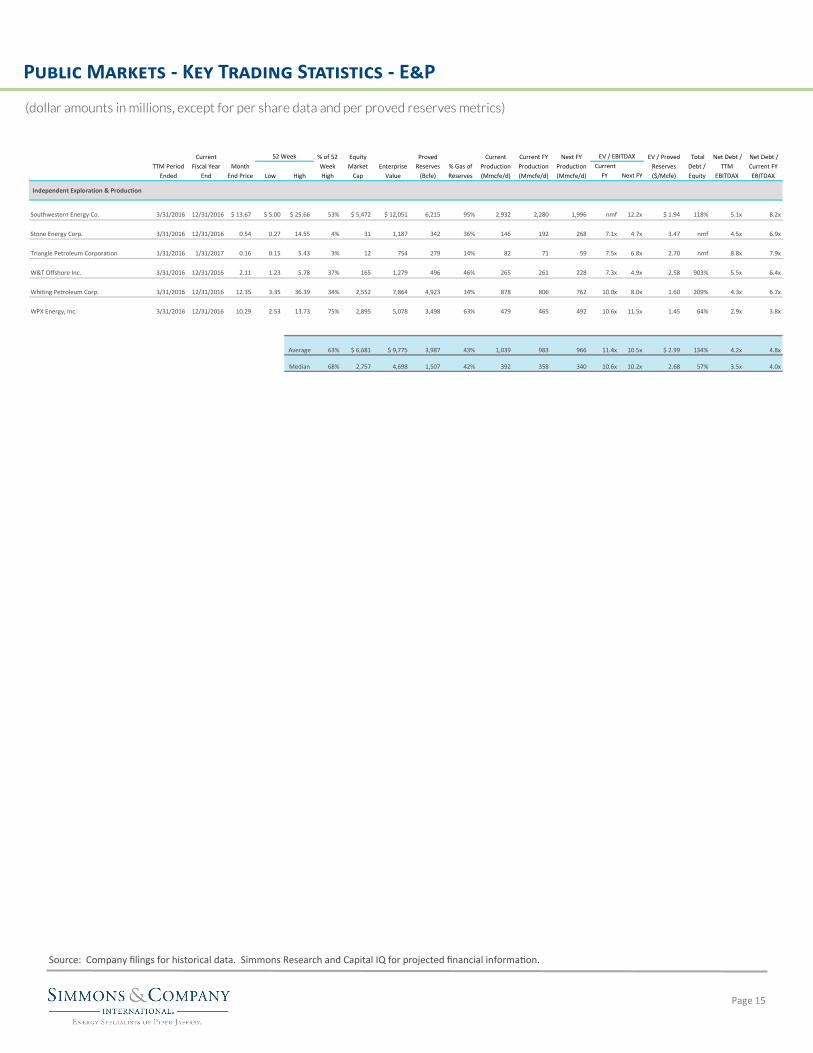
Public Markets - Key Trading Statistics - E&P
(dollar amounts in millions, except for per share data and per proved reserves metrics)
Page 15
Source: Company filings for historical data. Simmons Research and Capital IQ for projected financial information.
Low High
Current
FY Next FY
Independent Exploration & Production
Southwestern Energy Co. 3/31/2016 12/31/2016 $ 13.67 $ 5.00 $ 25.66 53% $ 5,472 $ 12,051 6,215 95% 2,932 2,280 1,996 nmf 12.2x $ 1.94 118% 5.1x 8.2x
Stone Energy Corp. 3/31/2016 12/31/2016 0.54 0.27 14.55 4% 31 1,187 342 36% 146 192 268 7.1x 4.7x 3.47 nmf 4.5x 6.9x
Triangle Petroleum Corporation 1/31/2016 1/31/2017 0.16 0.15 5.43 3% 12 754 279 14% 82 71 59 7.5x 6.8x 2.70 nmf 8.8x 7.9x
W&T Offshore Inc. 3/31/2016 12/31/2016 2.11 1.23 5.78 37% 165 1,279 496 46% 265 261 228 7.3x 4.9x 2.58 903% 5.5x 6.4x
Whiting Petroleum Corp. 3/31/2016 12/31/2016 12.35 3.35 36.39 34% 2,552 7,864 4,923 14% 878 806 762 10.0x 8.0x 1.60 209% 4.3x 6.7x
WPX Energy, Inc. 3/31/2016 12/31/2016 10.29 2.53 13.73 75% 2,895 5,078 3,498 63% 479 465 492 10.6x 11.5x 1.45 64% 2.9x 3.8x
Average 63% $ 6,681 $ 9,775 3,987 43% 1,039 983 966 11.4x 10.5x $ 2.99 134% 4.2x 4.8x
Median 68% 2,757 4,698 1,507 42% 392 358 340 10.6x 10.2x 2.68 57% 3.5x 4.0x
TTM Period
Ended
Current
Fiscal Year
End
Month
End Price
52 Week % of 52
Week
High
Equity
Market
Cap
Enterprise
Value
Proved
Reserves
(Bcfe)
% Gas of
Reserves
Current
Production
(Mmcfe/d)
Current FY
Production
(Mmcfe/d)
Next FY
Production
(Mmcfe/d)
EV / EBITDAX EV / Proved
Reserves
($/Mcfe)
Total
Debt /
Equity
Net Debt /
TTM
EBITDAX
Net Debt /
Current FY
EBITDAX
ENERGY IN PERSPECTIVE
www.simmonspjc.com
INVESTMENT BANKING
Houston
James P. Baker
Managing Director,
Co-head of Energy Investment Banking
Ira H. Green, Jr.
Managing Director,
Head of Energy Capital Markets
Sanjiv Shah
Managing Director,
Energy Services & Equipment
Jay B. Boudreaux
Managing Director,
Exploration & Production [email protected]
Matthew G. Pilon
Managing Director,
Energy Services & Equipment
Paul R. Steier
Managing Director,
Energy Services & Equipment
Damon Box
Managing Director,
Exploration & Production
Spencer W. Rippstein
Managing Director,
Midstream & Downstream
Michael S. Sulton
Managing Director,
Midstream & Downstream
Frederick W. Charlton
Managing Director, Chairman and
Co-Head of Energy Investment Banking
Andrew C. Schroeder
Managing Director,
Energy Services & Equipment
David A. Watson
Managing Director,
Energy Services & Equipment
Aberdeen
Colin I. Welsh
Head of International Energy
Investment Banking
Mike Beveridge Managing Director [email protected]
Nick Dalgarno
Managing Director
Eddie Leigh
Managing Director
© 2016 Piper Jaffray & Co. Since 1895. Simmons & Company International Energy Specialists of Piper Jaffray is a brand name used by certain broker/dealer affiliates of Piper Jaffray Companies.
Piper Jaffray Companies (NYSE: PJC) is a leading investment bank and asset management firm. Securities brokerage and investment banking services are offered in the United States through Piper Jaffray & Co., member SIPC and FINRA; in Europe through two separate U.K.-based broker/dealers - Piper Jaffray Ltd., authorized and regulated by the Financial Conduct Authority and Simmons & Company International Limited, authorized and regulated by the Financial Conduct Authority and the Dubai Financial Services Authority as a representative office; and in Hong Kong through Piper Jaffray Hong Kong, registered with the Securities and Futures Commission. Asset management prod-ucts and services are offered through four separate investment advisory affiliates―three registered with the U.S. Securities and Exchange Commission (Advisory Research, Inc.; Piper Jaffray Investment Management LLC; and PJC Capital Partners LLC), and one international asset management firm registered with the Guernsey Financial Services Commission (Parallel General Partner Limited).
Recommended