ENERGY EFFICIENT CONTROL FOR COMPRESSED AIR WITH STEP
MODULATION TECHNIQUE
JANARTHANAN RAMASAMY
A project report submitted in partial fulfilment
of the requirements for the award of degree of
Master of Engineering (Electrical-Power)
Faculty of Electrical Engineering
Universiti Teknologi Malaysia
JANUARY 2014

ii
Dedication to my beloved Mother, HEE AH FONG, and my wife, Rajeswari
Supramanian whom support me, physically, mentally and emotionally, throughout
my Master’s study.
For my siblings and friends, appreciate your encouragement and help. To all
my lecturers, you are my inspiration for today and future time. Thank you everyone
and only the universal supreme can bestow just reward to all of you.

iii
ACKNOWLEDGEMENT
First of all, I would like to expressed my gratitude to universal supreme for
giving me a faith and strength to complete this project. My next highest appreciation
goes to my project supervisor,. Dr. Md. Pauzi Bin Abdullah, who had continuously
giving me guidance, ideas, support for this project. His support and understanding
had facilitate me to complete the project and my thesis writting.
Last but not least, I would like to express my gratitude to all my families
member, friends and people that involve directly or indirectly in the process to
complete this project.

iv
ABSTRACT
The compressed air system is not only an energy intensive utility but also one
of the least energy efficient. Over a period of time, both performance of compressors
and compressed air system reduces drastically. The causes are many such as poor
maintenance, wear and tear of equipment. The thesis presents the Energy efficient
control for compressed air by using step modulating technique, which would
optimize the energy consumption for the compressed air. The proposed technique has
been tested on actual industrial consumer site. By adding the VSD “Variable Speed
Drive” to the conventional control compressed air and by regulation the prime mover
speeds on unloading cycle with step modulation technique it is discovered that the
electrical energy consumption of the compressed air system has been optimized. This
will give a prominent saving to the consumer in term of utility bill. From the analysis
results, it showed that the saving of 22% can be achieved.

v
ABSTRAK
Pemampat angain adalah sebuah jentera yang mengunakan tenaga elektrik
yang amat tinggi pada kecekapan yang terlalu rendah. Jika ia dinilai dari segi operasi
peralatan pada satu jangka masa tertentu, dari segi kecekapan peralatan dan sistem
pemampat angain akan berkurang secara mendadak. Ini adalah disebabkan kerana
penyelenggaraan yang tidak teratur serta kehausan pada bahagian peranti mekanikal.
Thesis ini membentangkan kecekapan pegawalan tenaga untuk pemampat angain
dengan mengunakan pendekatan pengurangan beperingkat, ia secara terus akan
meningkatkan kecekapan pemampat serta mengurangkan pengunaan tenaga. Cara
yang dicadangkan ini telah diuji disalah sebuah industri pegguna pemampat angain.
Dengan pemasangan sebuah pemacu pengawal kelajuan “Variable Speed Drive”
secara terus kedalam pemampat angain yang mengunakan pengawal biasa, dimana
kelajuan pemacu utama dikurangkan pada waktu pemampatan tidak berbeban,
dengan cara pengurangan yang dicadangkan didapati pengunaan tenaga elektrik
dapat dikurangkan secara terus. Ini bukan sahaja memberikan manafaat kepada
pengunaa dari segi peningkatan kecekapaan peralatan tetapi juga tenaga elektrik.
Daripada analisis keputusan didapati pegurangan tenaga sebanyak 22% telah dicapai.

vi
TABLE OF CONTENTS
CHAPTER TITLE PAGE
DECLARATION i
DEDICATION ii
ACKNOWLEDGEMENT iii
ABSTRACT iv
ABSTRAK v
TABLE OF CONTENT vi
LIST OF TABLES ix
LIST OF FIGURES x
LIST OF ABBREVIATIONS xiii
LIST OF APPENDICES xiv
1 INTRODUCTION
1.1 Compressor Overview 2
1.2 Compressor System Overview 4
1.3 Type of Air Compressor 7
1.4 Compressed Air Control Overview 10
1.5 Estimation of Energy cost 10
1.6 Problem Statement 12
1.7 Objectives 15
1.8 Project Scope 15
1.9 Significance of Project 16
1.10 Organization of Report 17

vii
2 LITERATURE REVIEW
2.0 Introduction 18
2.1 Compressor Control Method 19
2.1.1 On / Off Control 19
2.1.2 Load / Unload Control 20
2.1.3 Modulating Control 21
2.1.4 Variable Speed Drive 22
2.1.5 L-SR drive Method control 22
3 METHODOLGY
3.0 Introduction 25
3.1 Flowchart of the project 26
3.2 Selection of Compressed Air 28
3.3 Selection of Unload period Compressed Air 28
3.4 Load Profile Study on 15 H.P. Compressed Air 29
“AIRMAN”
3.5 KEW6310 analysis Software 2.04 30
3.6 Load Profile analysis 31
3.7 Cost Base optimization 32
3.8 Step modulation technique Overview 38
3.9 Project Implementation 48
4 RESULT AND DISCUSSION
4.1 Payback Period and Economic analysis 52
4.2 Logged data of “AIRMAN” Load / Unload 54

viii
Method control compressor
4.3 Logged data of AIRMAN compressor with 56
step modulation technique.
4.4 Summary of Result 58
5 CONCLUSION AND FUTURE WORK
5.1 Conclusion 61
5.2 Recommendation Of Future work 62
REFERENCES 63
APPENDIX 66

ix
LIST OF TABLES
TABLE NO. TITLE PAGE
3.1 Price list of Electrical Component 37
4.1 Energy Result consumption comparison Table 59

x
LIST OF FIGURES
FIGURE NO. TITLE PAGE
1.0 Conversion of Atmospheric Air into Compressed Air 2
1.1 Compressed Air Energy Input and Useful Energy Output 3
(Adapted from Northwest Energy Alliance)
1.2 Common Air Compressor System Components 5
1.3 Shown twin screw air compressor general layout 9
1.4 Shown Compressed Air process in twin screw compressor 9
1.5 Typical Lifetime Ownership Cost of Compressed Air 11
Systems.
1.6 Load Graph Cutout view on real data 13
1.7 Load graph and Air pressure combination 14
1.8 15H.P Air compressor brand ‘AIRMAN” 16
2.1 Motor energy consumption comparisons 21
2.2 Required air system pressure 100 psig minimum 23
2.3 Graphical comparisons of L-SR and conventional Control 24
method vs. Air demand
3.1 Flowchart of Energy Optimization 27
3.2 Power Quality Analyzer KEW 6310 29
3.3 KEW 6310 Analysis Software V2.04 30
3.4 Load graph profile from 15H.P. AIRMAN compressor 32 3.5 Ideal Load graph 33
3.6 Energy cost calculation by the KEW6310 software 34
3.7 Ideal load profile graph on unload period 35
3.8 Air Pressure data pattern logged with HMI unit through 40

xi
SIEMENS S7-300 PLC unit.
3.9 Liner Air pressure descending gradient graph 40
3.10 Compressor controller Function Block develops in 41
SIMATIC MANAGER Step 7 Software.
3.11 Unscaling Values to convert real value to Controller 42
output resolution.
3.12 Pressure input value Scaling block to real number 43
3.13 sampling clock patterns 43
3.14 Flow chart of Preset setpoint Accumulation 45
3.15 Step accumulation source code 46
3.16 Function block of Step accumulation control 46
3.17 Source code of speed trimming 47
3.18 process of step modulation the compressor motor 48
power in ideal mode
3.19 SIEMENS S7-300 PLC control Logic 49
3.20 VSD Hitachi SJ700 49
3.21 Pressure transducer AP-C33W 50
4.1 Shown System integration of Step modulation Technique 53
4.2 Prime Mover Load Profile graph AIRMAN Load / Unload 54
4.3 Energy calculators Data Input windows 55
4.4 Energy Reports for AIRMAN with load / Unload 55
4.5 Prime Mover load profile graph with Step modulation 56
Technique
4.6 Energy calculators Data Input windows 57
4.7 Energy Reports for AIRMAN with step modulation 57
technique

xii
4.8 Comparison Load profile graph with (a) step modulation 58
and (b) Load / unload
4.9 Comparison of Energy consumption in kWh before and 60
after implementation.
4.10 Comparison of Electricity Bill in RM before and after 60
implementation

xiii
LIST OF ABBREVIATION
R.O.I Return Of Investment
D.O.E Department Of Energy U.S
bhp Load Horsepower
H.P. Horse Power
Pmin - Minimum Power
Pmax - Maximum Power
VSD Variable Speed Drive
R.P.M Revolution Per Minutes
Sr Synchronous Slip factor
Bar Pressure Unit
Psig pressure unit in per square inch gauge
Kwatt Electric unit kilo watt

xiv
LIST OF APPENDIX
APPENDIX TITLE PAGE
A Electrical Diagram 66
B LS-R Method Manual 68

CHAPTER 1
INTRODUCTION
Generally the Air compressor is a mechanical energy producer, it was power
by electric Motor to generate, store and distribute energy in the form of compressed
air for use throughout a plant. In a compressed air system, a single set of
compressors can supply power to machines all over the plant, thus eliminating the
need for numerous and dispersed electric motors. This advantage must be balanced
against the relative poor energy efficiency of compressed air systems, which can be
as low as 20% [1], when leaks and part-load control losses are taken into account. A
recent survey by the U.S. Department of Energy showed that for a typical industrial
facility, approximately 10% of the electricity consumed is for generating compressed
air. For some facilities, compressed air generation may account for 30% or more of
the electricity consumed [2]. Compressed air is an on-site generated utility. Very
often, the cost of generation is not known; however, some companies use a value of
18-30 cents per 1,000 cubic feet of air.
On a national scale, air compressors rank only behind pumps in terms of
industrial motor drive electricity consumption. Thus, increasing the efficiency of
compressed air systems can result in significant energy savings.

2
1.1 Compressor Overview
Compressed air is a form of stored energy that is used to operate machinery,
equipment, or processes. Compressed air is used in most manufacturing and some
service industries, often where it is impractical or hazardous to use electrical energy
directly to supply power to tools and equipment. Powered by electricity, a typical air
compressor takes approximately 7 volumes of air at atmospheric conditions, and
squeezes it into 1 volume at elevated pressure (about 100 psig, [7 bars]). The
resulting high pressure air is distributed to equipment or tools where it releases useful
energy to the operating tool or equipment as it is expanded back to atmospheric
pressure [1], In the compression process 1 bar atmospheric conversion to 7 bars with
excessive heat and through the subsequent cooling of the air back to ambient
temperatures, heat and moisture, are released as illustrated in Figure 1.0.
Figure 1.0 Conversion of Atmospheric Air into Compressed Air

3
Recovered heat from the air compressor can potentially be used as an energy
efficiency measure for other processes, such as space and water heating. Depending
on the application, excessive moisture in compressed air needs to be managed as it
can cause problems with piping (corrosion) and end use equipment.
Figure 1.1 illustrates the typical losses associated with producing and
distributing compressed air [1]. Assuming 100 HP energy input, approximately 91
HP ends up as losses, and only 9 HP as useful work. In other words, about 90% of
the energy to produce and distribute compressed air is typically lost.
Figure 1.1 Compressed Air Energy Input and Useful Energy Output (Adapted
from Northwest Energy Alliance)

4
1.2 Compressor System Overview
Compressed air systems consist of a number of major subsystems and
components. Compressed air systems can be subdivided into the Supply and Demand
side.
The Supply side includes compressors, air treatment and primary storage. A
properly managed supply side will result in clean, dry, stable air being delivered at
the appropriate pressure in a dependable, cost effective manner. Major compressed
air supply subsystems typically include the air intake, air compressor (fixed speed
and/or variable speed), after cooler, motor, controls, treatment equipment and
accessories.
Controls serve to adjust the amount of compressed air being produced to
maintain constant system pressure and manage the interaction between system
components. Air filters and Air dryers remove moisture, oil and contaminants from
the compressed air. Compressed air storage (wet and dry receivers) can also be used
to improve system efficiency and stability. Accumulated water is manually or
automatically discharged through drains. Optional pressure controllers are used to
maintain a constant pressure at an end use device.
The Demand side includes distribution piping, secondary storage and end use
equipment. A properly managed demand side minimizes pressure differentials,
reduces wasted air from leakage and drainage and utilizes compressed air for
appropriate applications. Distribution piping systems transport compressed air from
the air compressor to the end use point where it is required. Compressed air storage
receivers on the demand side can also be used to improve system pressure stability.
As a rule of thumb, for every horsepower (HP) in the nameplate capacity, the
air compressor will produce approximately 4 standard cubic feet per minute (scfm).
A simplified diagram illustrating how some of the major components are
connected is shown in Figure 1.2.

5
Figure 1.2 Common Air Compressor System Components

6
Compressed air is used for a diverse range of commercial and industrial
applications. As it is widely employed throughout industry, it is sometimes
considered to be the ‘‘fourth utility’’ at many facilities.
It has been common practice in the past to make decisions about compressed
air equipment and the end uses based on a first cost notion. Ongoing energy,
productivity and maintenance costs need to be considered for optimal systems. In
other words, best practice calls for decisions to be based on the life cycle cost of the
compressed air system and components.
Improving and maintaining peak compressed air system optimization requires
addressing both the supply and demand sides of the system and understanding how
the two interact.
Optimal performance can be ensured by properly specifying and sizing
equipment, operating the system at the lowest possible pressure, shutting down
unnecessary equipment, and managing compressor controls and air storage. In
addition, the repair of chronic air leaks will further reduce costs.
For a typical compressed air end use, like an air motor or diaphragm pump, it
takes about 10 units of electrical energy input to the compressor to produce about
one unit of actual mechanical output to the work.
For this reason other methods of power output, such as direct drive electrical
motors, should be considered first before using compressed air powered equipment.
If compressed air is used for an application, the amount of air used should be the
minimum quantity and pressure necessary, and should only be used for the shortest
possible duration. Compressed air use should also be constantly monitored and
reevaluated.

7
1.3 Type of Air compressor
There are two basic types of air compressors:
i) Positive displacement, and
ii) Dynamic.
i) Positive Displacement.
In the positive displacement type, a specified quantity of air is trapped in
a compression chamber and the volume which it occupies is mechanically
reduced, causing a corresponding rise in pressure prior to discharge.
Rotary screw, vane and reciprocating air compressors are the three most
common types of air positive displacement compressors found in small
and medium sized industries.
ii) Dynamic.
Dynamic air compressors include centrifugal and axial machines, and are
used in very large manufacturing facilities. These units are beyond the
scope of this document.
Here will discuss only for positive displacement compressor, the dynamic unit is not
popular or common equipment use throughout industries in Malaysia.

8
1.3.1 Positive Displacement Compressor
A bicycle pump is the simplest form of a positive displacement compressor,
where air is drawn into a cylinder and is compressed by a moving piston. The piston
compressor has the same operating principle and uses a piston whose forward and
backward movement is accomplished by a connecting rod and a rotating crankshaft.
If only one side of the piston is used for compression this is called a single-acting
compressor. If both the piston’s top and undersides are used, the compressor is
double acting.
The pressure ratio is the relationship between absolute pressure on the inlet
and outlet sides. Accordingly, a machine that draws in air at atmospheric pressure 1
bar (a) and compresses it to 7 bar overpressure works at a pressure ratio of (7 + 1)/1
= 8. Sample positive displacement compressed air illustrated in Figure 1.3 Twin
rotary screw compressor layout [3]. It is a most common compressor which has in
service throughout Malaysia manufacturing industries in present day.
The principle for a rotating displacement compressor in twin screw form was
developed during the 1930s, when a rotating compressor with high flow rate and
stable flow under varying pressure conditions was required.
The twin screw element’s main parts are the male and female rotors, which
rotate in opposite directions while the volume between them and the housing
decreases. Each screw element has a fixed, build-in pressure ratio that is dependent
on its length, the pitch of the screw and the form of the discharge port. To attain
maximum efficiency, the build-in pressure ratio must be adapted to the required
working pressure.
The screw compressor is generally not equipped with valves and has no
mechanical forces that cause unbalance. This means it can work at a high shaft speed
and can combine a large flow rate with small exterior dimensions. An axial acting
force, dependent on the pressure difference between the inlet and outlet, must be

overcome
1.4 [4].
Fi
by the bea
Figure 1
igure 1.4 Sh
arings. The
.3 Shown tw
hown Comp
process of
win screw a
pressed Air
air compre
air compres
process in t
ession has i
sor general
twin screw c
illustrated in
layout
compressor
9
n Figure
r

10
1.4 Compressed Air control overview
As air systems seldom operate at full load all of the time, the ability to
efficiently control flow at part loads is essential. Consideration should be placed to
both compressor and system control selection as they are important factors affecting
system performance and energy efficiency. For the positive displacement
compressed air the most common method to control was load/unload, this control
mode is sometimes called online/offline control.
It keeps the motor running continuously, but unloads the compressor when
the discharge pressure is adequate by closing the inlet air suction valve. Unloaded
rotary screw compressors typically consume 50% - 75% of their full load power
demand, while producing no useful compressed air output. The detail compression
about the control method will discuss in literature review.
1.5 Estimation of energy cost
Compressed air is one of the most expensive sources of energy in a plant. The
over-all efficiency of a typical compressed air system can be as low as 10%-15%.
For example, to operate a 1-horsepower (hp) air motor at 100 pounds per square inch
gauge (psig), approximately 7-8 hp of electrical power is supplied to the air
compressor. To calculate the cost of compressed air in your facility, use the formula
shown below [2]:
Cost ($) = (bhp) x (0.746) x (# of operating hours) x ($/kWh) x (% time) x (% full-load bhp)
Motor Efficiency

11
Where:
bhp—Motor full-load horsepower (frequently higher than the motor nameplate
horsepower—check equipment specification)
0.746—conversion between hp and kW
Percent time—percentage of time running at this operating level
Percent full-load bhp—bhp as percentage of full-load bhp at this operating level
Motor efficiency—motor efficiency at this operating level.
Assumes the compressor average loading is 65% of full load, over the first
ten years of life of a typical air cooled compressor as shown in figure 1.5, with two
shift operation, the operating cost (electricity and maintenance) will equal about 88%
of the total lifetime cost. The cost of the original equipment and installation will
account for the remaining 12% [5].
Figure 1.5 Typical Lifetime Ownership Cost of Compressed Air Systems.

12
1.6 Problem Statement
The discussion on problem statement will base on load graph analysis as
illustrated in Figure 1.6. This load graph has been logged at one of the customer
(Jayaplastic Industries (M) Sdn. Bhd.), 100 H.P (75Kwatt) Compressed air. To start
to analysis load profile graph, should have a good understanding on the behavior of
compressed air prime mover (Electric Motor). Naturally the asynchronous motor is
non liner torque characteristic due to rotor construction [6]. It has differences
compare to DC electric motor, where this motor proportionally liner to current versus
torque. On the asynchronous motor the stator rotating magnetic field speed and rotor
speed had differentiate by slip factor (Sr)[7]. Where the slight drop on slip (Sr) factor
of synchronous speed from rated the current will increased tremendously [6]. The
motor not only became inefficient on power consumption, but as speed decreases it
will proportionally affects the compressed air performance. For the compression
process speed will determined the loading cycle time period, slower the speed the
longer the time will consume to generated 7 bars air pressure. Usually the pressure
high and low setpoint differentiated by 1 Bar. For unloading cycle time period, will
base on setting of lowest point to start compression process versus demanded air
volume discharge. This has illustrated at the same load graph by overlapping of
pressure graph on to compare the affect lowest set point and electric motor
performance and energy wastage area. The detail discussion will illustrate in further
discussion.
1.6.1 Load graph analysis
This power data has logged from 75Kwatt power electric motor for Sullair
compressed Air by using KEW6310 power quality analyzer. The logged data has
converter by KEW PQA MASTER Ver2.04 software to graph form for further
analysis. The motor detail has listed:
13
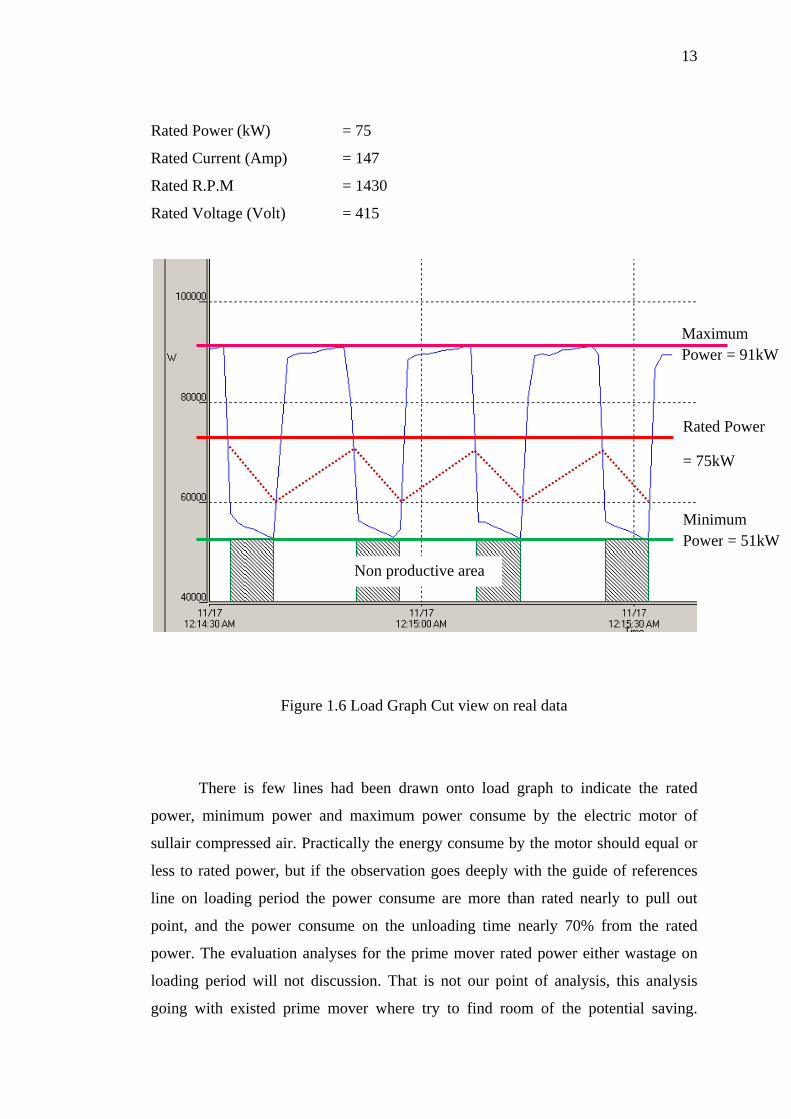
Rated Power (kW) = 75
Rated Current (Amp) = 147
Rated R.P.M = 1430
Rated Voltage (Volt) = 415
Figure 1.6 Load Graph Cut view on real data
There is few lines had been drawn onto load graph to indicate the rated
power, minimum power and maximum power consume by the electric motor of
sullair compressed air. Practically the energy consume by the motor should equal or
less to rated power, but if the observation goes deeply with the guide of references
line on loading period the power consume are more than rated nearly to pull out
point, and the power consume on the unloading time nearly 70% from the rated
power. The evaluation analyses for the prime mover rated power either wastage on
loading period will not discussion. That is not our point of analysis, this analysis
going with existed prime mover where try to find room of the potential saving.
Maximum Power = 91kW
Rated Power
= 75kW
Minimum Power = 51kW
Non productive area

14
Obviously there are existences of non productive area, with some amount power was
consume. From this consumption point of power, we could pull down to optimum
point by regulating the speed. The power consumption for entire system will reduce
proportionally.
This is not only given energy saving, if it has compared to existing system it
has also increased the compressor efficiency. To do so there is device call VSD
(Variable speed Drive) need to be employ into existing system. The next step is to
choose appropriate of technique to regulate the speed, with the following question
rise “how to regulate the speed?”. To answered the question is a challenge where
need to have a proper analysis to sure the control does not fail on the system reliable
operation. This will further discussed in chapter 2.
Figure 1.7 Load graph and Air pressure combination

15
1.7 Objective
The objective of this project:
a) To Study Air compressor control system, unload cycle and Electrical load
characteristics. To identify the potential energy saving in air compressor
system.
b) To propose and implemented the Low cost control strategy for Air
compressor to minimize energy consumption for existing conventional
method control air compressor.
c) To analysis the impact of the propose energy efficient control on energy
saving as well as the Return of Investment (ROI).
1.8 Project scope
The proposed energy solution going too implemented at one of our customer
place located at Kota kemuning Shah Alam, PPR extrusion pipe manufacture
(George Fisher (M) Sdn. Bhd). The 15H.P compressed air, brand Airman going to
emphasis the propose method to review practical result on the energy consumption.
The detail result will discuss on chapter 4. As show in the figure 1.8 was the chosen
compressed air. As discussed early we are going to regulate the prime mover speed
to achieve the energy saving. This project focus is not going to refurbish or redesign
the existing system we just want to add in the VSD and pressure sensor to regulate
the prime mover speed on unloading period with chosen appropriate control method
through the initial analysis. The final control method will discuss in chapter 3.

16
Figure 1.8 15H.P Air compressor brand ‘AIRMAN”
1.9 Significance of the project
This project is not only will focus on saving but throughout the analysis
process, consumers have a chance of awareness on compressed air operation
efficiency and system arrangement. For most case those already have awareness they
may need little idea to make the system became slightly efficient compare to present
in operation. Even the saving may not significant to low demanded manufacture
process, but it significant for those manufacturing process use the compressed air
energy 100%.

17
1.10 Organization of the reports
In general, this report mainly consists of five main chapters; introduction,
literature review, methodology and implementation of new control method to
compressed air, finally other two chapters will cover on Final results and conclusion
and future work of improvement.
The chapter one discussed the research project in collectively. This chapter
explained the crucial aspect of the research work such as background studies,
objectives, research scopes and methodology as well the thesis outline will also be
discussed finally.
The chapter two completely dedicated to literature review, which will review
about available control methodology and energy consumption from point of
electrical aspect, on point mechanical aspect restructure of storage tank redesign this
will discussed briefly the complete theory will attach in appendix, problem on the
existing system of prime mover, and implementation step modulation technique with
consequent problem. To have more reliable control more study required to ensure the
objective of project able to meet.
The chapter three has dedicated to review on implementation technique and
step modulating method. In this chapter discussion will completely on control
equipment, speed regulation technique, sampling time and data analysis by the
controller.
The chapter four was dedicated to analysis the result of the implementation
technique, this is too sure give significant improvement on energy saving, this
chapter will enclosed with conclusion.
The final chapter fully dedicated to brief to the future work and improvement
to this project, to sure it has can useable for all type compressor with more reliable
control.

REFERENCES
[1] http://oee.nrcan.gc.ca/sites/oee.nrcan.gc.ca/files/pdf/industrial/equipment/co
mpressed-air-ref/pdf/compressed-air-ref-eng.pdf
[2] http://www.eere.energy.gov/informationcenter/, Department of Energy’s
office of Energy Efficiency and Renewable Energy.
[3] Energy Efficiency Best practice guide Compressed Air System
www.sustainability.vic.gov.au.
[4] www.atlascopco.com/.../Compressed_Air_Manual_tcm44-1249312.pdf
compressed air references manual.
[5] www.mntap.umn.edu/greenbusiness/energy/82-CompAir.pdf Technical
assistance program.
[6] Application Manual for NEMA motor SIEMENS
www.industry.usa.siemens.com.
[7] Electric machinery Fundamental, Third Edition Stephen J.Chapman
McGRAW-HILL.
[8] General Air compressor L-SR drive system manual www.genaircomp.com/ .

64
[9] Abels, B. and Kissock, K, Optimizing Compressed Air Storage for Energy
Efficiency by University of Dayton ;11 SDP-0056 .
[10] Customer portfolio www.cairoengineering.com.my.
[11] Hitachi price list www.Hitachi.us.
[12] TNB Tariff rate manual www.tnb.com.my/.../Tariff%20Rate%20Final%20
%201%20June%202011.pdf. .
[13] Kaesser Compressor operational manual.
[14] Good practice guide for Energy Efficicent compressed air system
www.thecarbontrust.co.uk/energy.
[15] Compressed Air Case study IRISH Energy Center www.irish-energy.ie .
[16] Jianjun Xu+ and Yupeng Tang Electrical Engineering School of Beijing
Jiaotong University, Beijing Jiaotong University Beijing, The Automatic
Control System of Air Compressor for Saving Energy ICCEE 2010 :
10.7763/IPCSIT.2012.V53.No.2.62.
[17] Selection Guide for energy saving product manual
http://energysaving.smc.au.
[18] Energy Efficiceny Policy Opportunites for Electric Motor-Driven System
www.iea.org.
[19] Energy Efficiency Guide for Industry in Asia –
www.energyefficiencyasia.org.

65
[20] Code and Standard Enhancement Initiative (CASE) Compressed Air, by
California Utilities Statewide Codes and Standards Team November 2011.
[21] Dealing with High volume Intermitten Demands, By Ron Marshall and Bill
Scales Compressed Air best practice www.airbestpractice.com.
[22] Jonathan B. Maxwell, PE, Energy Resource Solutions, Inc. Compressed Air
Data logger Onset Computer cooperation http://www.onsetcomp.com.
Recommended