Empowering Developers to Estimate App EnergyConsumption
Radhika Mittal‡, Aman Kansal†, Ranveer Chandra†
‡IIT Kharagpur, Kharagpur, India †Microsoft Research, Redmond, [email protected] {kansal,ranveer}@microsoft.com
ABSTRACTBattery life is a critical performance and user experience metric onmobile devices. However, it is difficult for app developers to mea-sure the energy used by their apps, and to explore how energy usemight change with conditions that vary outside of the developer’scontrol such as network congestion, choice of mobile operator, anduser settings for screen brightness. We present an energy emula-tion tool that allows developers to estimate the energy use for theirmobile apps on their development workstation itself. The proposedtechniques scale the emulated resources including the processingspeed and network characteristics to match the app behavior to thaton a real mobile device. We also enable exploring multiple op-erating conditions that the developers cannot easily reproduce intheir lab. The estimation of energy relies on power models for var-ious components, and we also add new power models for compo-nents not modeled in prior works such as AMOLED displays. Wealso present a prototype implementation of this tool and evaluate itthrough comparisons with real device energy measurements.
Categories and Subject DescriptorsC.4 [Computer Systems Organization]: Performance of Systems;D.2.2 [Software]: Software Engineering—Design Tools and Tech-niques
General TermsAlgorithms, Experimentation, Measurement, Performance, Design
Keywordsenergy efficiency, display power, developer tools
1. INTRODUCTIONPoorly written apps can sap 30 to 40% of a phone’s battery [10].
Battery lifetime is a common cause of frustration in smartphoneusers. Several efforts in research and industry are investigatingtechniques to improve the battery life, such as through use of higherbattery density, dedicated low power processors for offloading com-putations from the application processor, or even off-loading to the
Permission to make digital or hard copies of all or part of this work forpersonal or classroom use is granted without fee provided that copies arenot made or distributed for profit or commercial advantage and that copiesbear this notice and the full citation on the first page. To copy otherwise, torepublish, to post on servers or to redistribute to lists, requires prior specificpermission and/or a fee.MobiCom’12, August 22–26, 2012, Istanbul, Turkey.Copyright 2012 ACM 978-1-4503-1159-5/12/08 ...$15.00.
cloud. However, such platform layer improvements do not sufficeby themselves since poorly written software can callously eat intothe resultant extra battery juice.
A significant portion of the battery is used when the phone isactively used in interactive foreground apps. While OS designersspend significant effort in optimizing the battery impact of back-ground OS services, the foreground apps are largely controlled byapp developers. Very few tools are available for developers to im-prove the energy efficiency of their apps. In fact, most developersare not even aware of the amount of energy their app consumes un-der a typical usage pattern. While they could use a power meterto measure the energy draw for their app during test runs, such anapproach is not used in practice because it is tedious and expensive.It is very difficult to perform these measurements for multiple de-vices, network conditions, user settings for screen brightness, andso on. Even if measurements are performed, they are biased to thenetwork conditions at the developer’s location. Measurements bythemselves do not give any insight into how much each component(CPU, network, or display) contributed to battery drain, making itharder to focus the optimization effort.
One alternative for developers is to use the “battery use” tool onAndroid phones, the Nokia Energy Profiler (NEP) or power mod-eling tools such as eProf [15]. While these tools can circumventthe need for power metering equipment, they are still limited inexploring multiple configurations, user settings, or network con-ditions. The profiled behavior remains biased to conditions at thedeveloper’s location.
In this paper we present WattsOn, a system that allows a devel-oper to estimate the energy consumed by her app in the develop-ment environment itself. WattsOn can (i) identify energy hungrysegments during the app run, and (ii) determine which component(display, network or CPU) consumes the most energy. For instance,an developer may determine if the battery drain is dominated by thedownload of a high resolution image is consuming more energy, theapp display using a white background, or the computation that theapp is doing. The developer may compare the energy impact ofdesign choices such as developing a portable browser based appthat downloads most content on the fly or a native app that onlydownloads incremental updates.
Furthermore, WattsOn allows what-if analyses, to answer ques-tions, such as: How much energy is consumed on a different phonemodel? How does energy consumption change if the user has a 2Gor a 3G network? What if the brightness is set to high? or, What ifthe app is used under a low signal strength area?
Our current WattsOn prototype emulates the power consumptionfor the display, network, and CPU, since these are the dominantenergy consumers on a smartphone, consuming between 800mWto 1500mW in their highest power states. Other components such
as the GPU (peaking to 250mW - 350mW) and A-GPS (160mW- 350mW, across various chip sets), while significant, account fora smaller fraction of the total power consumption for interactiveforeground apps. These components can be added to our frame-work provided appropriate resource consumption counters, relevantpower models, and emulation strategies are available.
Specifically, we make the following contributions.First, we present the first system that can estimate an appŠs en-
ergy consumption in different operating conditions (carrier, signalstrength, brightness) without requiring expensive lab equipmentand explicit measurements with repeated runs for each operatingcondition.
Second, we enable energy to be profiled within the developmentenvironment without requiring a specific mobile device. To achievethis, we scale the development machine’s resources including theCPU and the network to match the characteristics of a real phone.The app thus behaves as if on a real phone and its energy impact onall components, such as idle display power-on time while waitingfor a download, is correctly emulated. The combination of powermodeling and resource scaling required for WattsOn design impliesthat only those power models and scaling techniques can be ap-plied that are mutually compatible. WattsOn allows the app to useexternal resources such as web services from the Internet. These re-quirements are in contrast to other energy emulators, such as PowerTOSSIM [22], based on event driven simulation, where all com-municating nodes are within the simulator. Hence techniques suchas virtual clocks cannot be applied in WattsOn for resource scal-ing. Processor power models based on architecture specific perfor-mance counters are also not amenable to use with scaled resources.
Third, we expand the catalogue of power models available formobile devices. Power models for many components have beenestablished previously in [2,4,6,8,17,20] at varying levels of com-plexity and accuracy. We use previously proposed models for CPUand WiFi. For displays, while LCD and OLED displays have beenmodeled in detail [5, 25], prior work did not provide a model forAMOLED displays. Hence we develop a new power model forAMOLED. For cellular networks, while the power model exists [18],measurements for model parameters with varying signal strengthsand operators were not available in published literature. We per-form new measurements to fill in some of the missing data.
Finally, we have validated WattsOn with multiple applications,devices, network conditions, and carrier networks. Average energyerror varied from 4% to 9% across the apps tested. The accuracyof energy estimation when compared with the variability in hard-ware energy measurement for the same task over multiple runs indi-cates that WattsOn can offer a better energy estimate by eliminatingseveral variable factors such as background activity on the mobiledevice. We also show how the component energy break-down pro-duced by WattsOn can help application designers.
While the concepts of power modeling and resource scaling havebeen developed before, to the best of our knowledge, this is thefirst work that investigates the suitable selection of modeling andscaling techniques for development-time mobile app energy emu-lation, and validates their use through fine grained hardware mea-surements.
2. WattsOn SYSTEM DESIGNMost mobile development toolchains provide an emulator to as-
sist in app development such as the Android Emulator, the iOS Sim-ulator, or the Windows Phone Emulator. While the emulators donot accurately reproduce all mobile device characteristics, the lowoverhead of their use makes them very beneficial for a variety of
tests. WattsOn extends existing emulators to estimate app batteryconsumption.
The two major techniques used in WattsOn design are powermodeling and resource scaling.
Power Modeling: One way to measure app energy is to usepower metering equipment [7]. However, requiring every app de-veloper to install such equipment is an arduous ask. Also, measure-ments have variability due to differences in network conditions,background activities running on the phone, not all of which candisabled by the developer. For instance, the measured energy afteran energy reducing change made by the developer may turn out tobe higher than before the change, due to degraded network qualityat the time of the new measurement. Further, the measurement doesnot separate out the impact of display, network, and CPU that canbe important for the developer to make their optimization decisions.To overcome these limitations, WattsOn computes energy from theresource utilization counters using power models [2, 4, 6, 8, 17, 20].
Resource Scaling: Resources consumed by the app on the de-veloper’s workstation are very different from those on the phone.This leads to two challenges. First, the resource counters measuredon the developer workstation cannot be fed directly into the phonepower models. Second, timing of events might be different whenrunning the app on the emulator than on the phone. Network pack-ets may arrive much faster on the development machine, causingthe user clicks for the subsequent tasks to be occur sooner, drasti-cally changing the time spent on application tasks. Resource scal-ing addresses these challenges.
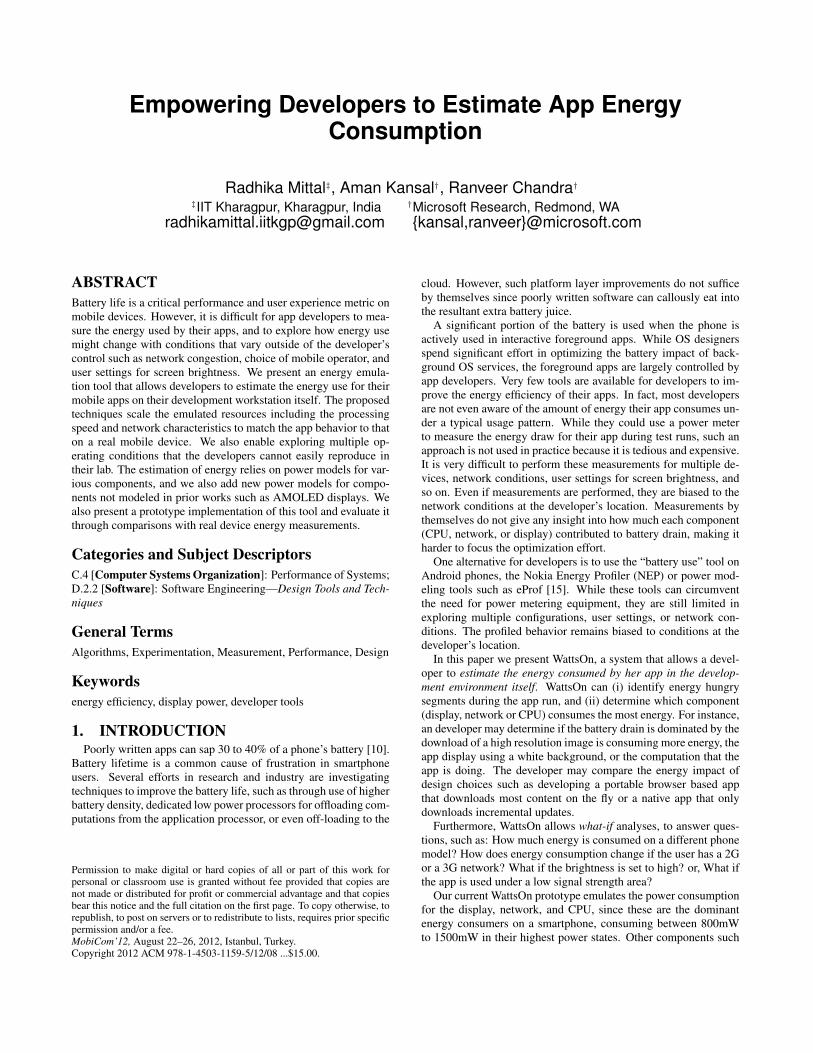
2.1 Design OverviewA block diagram of WattsOn is shown in Figure 1. The leftmost
blocks represent the measurement of real device power character-istics required for power model generation1. These measurementsmay be performed by the smartphone manufacturers, mobile OSplatform developers, or even volunteers using automated modelingmethods [6]. The mobile app developer simply downloads the ap-propriate models.
On the developer machine, the app code for the mobile deviceruns in a mobile device emulator. We insert resource scaling tech-niques between the emulator and the actual hardware. As the appis executed on the emulator, we monitor its resource consump-tion using resource profiling methods available on the developmentworkstation. The resource consumption monitored on the scaledresources is used in the energy calculation block to estimate theapp energy using power models.
We describe resource scaling and power modeling methods foreach of the modeled components below.
2.2 Cellular Network (3G)The cellular network interface [17] consumes significant energy
and we emulate it as follows.
2.2.1 Resource ScalingThe goal of resource scaling is to obtain the network resource
consumption of the app as if executed on a real cellular data link.Multiple scaling options may be considered:
Virtual Clock: Event driven simulators such as ns-3 and PowerTOSSIM [22] simply record time in ticks and the ticks can bemapped to the real time for the network nodes of interest while theymay run much faster (or slower) on the simulation workstation.
1Power models may be developed for all mobile devices of interest;the number of models required may be reduced by considering rep-resentative devices in various device classes with different screensizes and cellular network types.
Mobile Phone Emulator
Hardware Resources
Resource Scaling
Test Application
Developer Workstation
Resource Profiling
Resource Profiling
Power Profiling
Target Mobile Device
Power Model Generation
Energy Calculation App Energy use
Device Manufacturer, or OS Provider Labs
Developer Workstation
Figure 1: Block diagram of WattsOn components. Blocksshaded gray are used in existing systems; WattsOn adds theother blocks for energy emulation.
This technique is not suitable for WattsOn because the emulatedapp uses external resources such as web services on the Internetthat are not operating on simulated tick time.
Trace Stretching: Another possibility is to capture the packetactivity over the high speed network connection of the developer’smachine and then stretch the timing characteristics to match thoseon a lower speed link. For example, suppose a 10 second tracewould take 30 seconds over the cellular interface, one could multi-ply all time intervals in the Ethernet packet trace by 3. One couldeven replay the trace from the high speed interface on a lower speedinterface simulated using a fine grained packet level simulator, suchas QualNet or ns-3 and get more accurate stretching. However,this technique has several drawbacks. A slower interface will af-fect other parameters of the network flow, such as the TCP windowsize, which are not captured by stretching the high speed packettrace. Also, stretching the network trace alone will not produce thecorresponding impact on other resources such as the timing of userclicks or other tasks in the app that depends on network activity.
Link Shaping: The approach we have taken is to shape the net-work link bandwidth and latency such that the emulated networkactivity in terms of packets sent and received is similar to the activ-ity that would be observed on a cellular data link for the same task.We introduce our resource scaling code at layer 2.5 in the networkstack, that is, between IP and the MAC layer. The delay, loss andbandwidth parameters are chosen to mimic different network con-ditions. The other components of the network remain the same asused by the app on a real device.
The latency, bandwidth and loss parameters for cellular networkshave been studied in several prior works in wireless communica-tions, and we rely on the existing literature to guide our choiceof these parameters. Using measured distribution based models,rather than physical measurements, has the advantage that the esti-mate is much more representative for a wide population of users.It is not biased to the developer’s specific phone location, and doesnot show uncontrolled fluctuations from measurement to measure-ment. Parameter values may be updates as technology evolves. Inour prototype, we selected the parameter values as follows.
Latency: The measurement and modeling work in [9, 12] hascharacterized the cellular data link latency for 3G networks using anormal distribution (with mean = 200ms, and standard deviation =100ms) and we use this characterization.
Bandwidth: We use the measurements from [23] that have ex-perimentally characterized 3G HSDPA download and upload band-widths. The bandwidth varies due to various reasons includingchanges in network congestion, wireless channel quality at the phone
location, and other factors. To keep the number of varying condi-tions manageable, we bin the network quality into three levels, de-noted good, average, and poor, and based on [23], set the parametervalues as shown in Table 1.
Network quality Download (kbps) Upload (kbps)Good 2500 1600
Average 1500 900Poor 500 200
Table 1: Network scaling parameters for bandwidth.
Loss: We model losses using the well known Gilbert Elliot Chan-nel Model and the corresponding parameters measured for 3G linksfrom [26]. According to this model, the network is assumed to be inone of two states, denoted good and bad, each with a different lossrate. The model also describes the transition probabilities betweenthe two states, that allows simulating the losses over time during anemulation run.
In certain instances, when the developer is using a slow Inter-net connection for their developer machine, such as a home Inter-net connection, then the underlying network may itself have non-negligible latency and losses. In this case, WattsOn should firstprobe and estimate the network latency using known methods [11]and then add on any additional resource scaling to the measuredcharacteristics.
2.2.2 Power ModelingThe power model for the 3G network must model not only the
active energy consumption when communicating data but also the“tail” time, or the time for which the radio interface remains in ahigher power state after finishing the communication activity. Partof the tail time is spent in the active state (DCH) itself, and part inan intermediate state (FACH), where the radio power consumptionis reduced but any further communication requires a small channelacquisition overhead. Some radios may have a second lower pow-ered intermediate state (PCH). This model, called ARO model, wasstudied in depth in [17, 18], and allows back-calculating the radiopower state from a network packet trace.
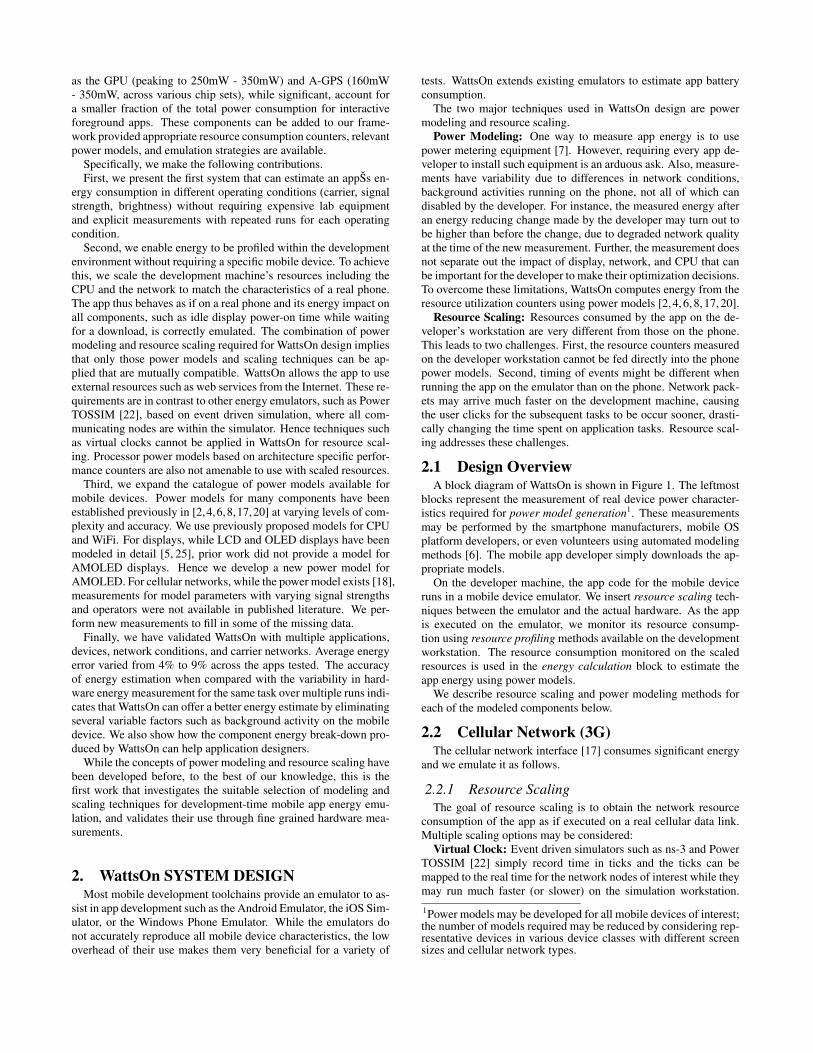
However, the number of mobile operators for which the modelparameters have been measured is limited [18]. Second, the en-ergy consumed at varying received signal strengths has not beenreported for the ARO model, though dependence on signal strengthis well known [21]. To fill in the above gaps, we set up two experi-ments (Figure 2).
Figure 2: Experimental setups for the network power measure-ments.
Signal Strength. We used an Ericsson cellular data develop-ment board that exposes the antenna ports and allows controllingthe received signal strength via an RF signal strength attenuator.The setup was located where we typically observed good signalstrength. Measurements were performed on a weekend when the
network was lightly loaded. We varied the amount of data down-loaded and uploaded at different signal strengths and measuredthe DCH and FACH power and tail times. Since a developer willlikely only emulate their application with a small number of signalstrength variations, we discretize the signal strength to three levels(Table 2). These power measurements are taken using a radio in-terface board and not a phone, implying that the idle power of theboard can be different from that of the phone. However, the differ-ences between the power levels at different signal strengths comesprimarily from the radio and can be used to adapt the power modelfor varying signal strengths. The tail times for DCH and FACH didnot vary with signal strength.
Signal Strength DCH (mW) FACH (mW)High 600 300
Medium 800 300Low 1500 400
Table 2: Cellular interface power variation with signal strengthfor the AT&T network.
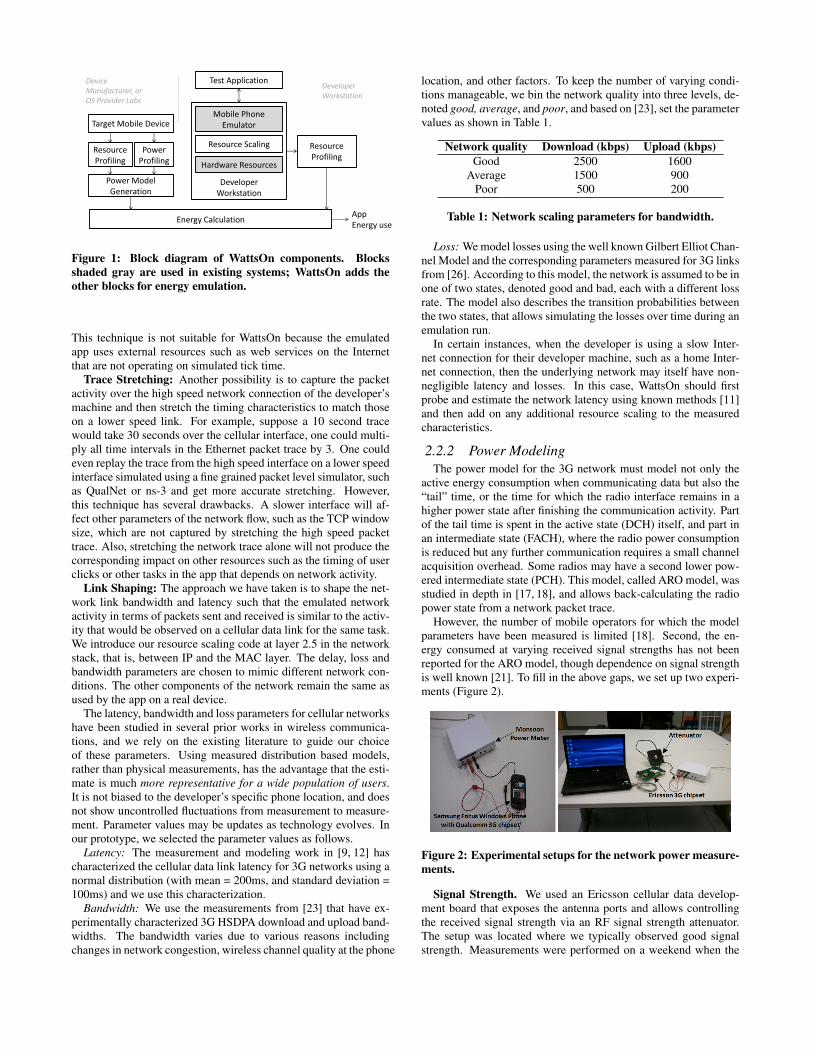
Mobile Operators. The second setup uses a power meter at-tached to the battery terminals of a smartphone to measure power.We connected multiple devices from different mobile operators avail-able in our region: AT&T (Samsung Focus), T-Mobile (HTC HD7),Verizon (HTC Trophy), and Sprint (HTC Arrive). T-Mobile andAT&T use GSM based networks with the UMTS standard from3GPP for data. Verizon and Sprint use the Evolution-Data Op-timized (EVDO) standard from the CDMA2000 family providedby 3GPP2. A sample power trace for a download using Sprint’snetwork is shown in Figure 3. As expected, the radio stays in ahigh power state long after the data communication has completed.Similar measurements were performed for other operators and allmeasured tail times are listed in Table 3.
0 5 10 15 20 250
500
1000
1500
2000
2500
Time (s)
Po
we
r (m
W)
Figure 3: Network tail energy measurement for Sprint. Thedata communication ends near time = 7s along the x-axis butthe radio stays in a higher power state for an additional 10 sec-onds after that.
2.3 WiFi NetworkThe resource scaling and power model methods for WiFi used
are as follows.Resource Scaling: For cases where the developer machine is
connected to the Internet using WiFi (as is common for laptops),resource scaling is not needed. Otherwise, resource scaling is per-formed using the same layer 2.5 approach as for the cellular net-work. The scaling parameters are based on well-studied WiFi char-acteristics [1].
Operator DCH FACH PCHAT&T (3G) 5s 12s 0
T-Mobile (3G) 5s 1s 1sT-Mobile (4G HSPA) 4s 2s 1s
Verizon (3G) 6s 0 0Sprint (3G) 10s 0 0
Table 3: Tail state times for different operators. SOme opera-tors do not use all intermediate states resulting in zero tail timesin those states.
Power Model: The WiFi power model uses the PSM state modeldescribed in [13]. The model uses four states - Deep Sleep (10mW),Light Sleep (120mW), Idle (400mW), and High (600mW). Thepower consumption is slightly different for transmit vs. receive butsince the difference is small and switching between these states isvery frequent, we use a common power value, denoted as the highstate.
When not communicating, the interface remains in Deep Sleep.Brief power spikes of 250mW at intervals of 100ms are observedin this state, corresponding to reception of beacons from an asso-ciated AP. When a packet is to be transmitted, the interface movesto the High state immediately. If a packet is to be received, the ra-dio learns about it at the next beacon, and moves to the High powerstate. Once the transfer is completed, the radio moves to Idle. FromIdle it can immediately move to High in case of a transmit or re-ceive. If no network activity occurs in Idle state for 1s the radiomoves to the Light Sleep. The Light Sleep tail time is 500ms, afterwhich, if no network activity occurs, it falls back to Deep Sleep. Ifnetwork activity does occur in either the Idle or Light Sleep state,the state changes to High. Both Idle and Light Sleep states alsohave regular spikes of additional 250mW of power spaced at 100msto receive beacons.
The above power state transitions can be re-created, and energycan hence be computed, using the (scaled) network packet tracecaptured using a network sniffing library.
2.4 DisplayAs for other components we need to resource scale the display
and model its power consumption. Fortunately, existing mobile de-vice emulators already perform resource scaling for the display:the emulated app is provided only a small screen area representingthe mobile device display. The only scaling needed is that the em-ulator window may be re-sized to a larger view by the developer,changing the number of pixels in the display and to overcome this,one may simply multiply the number of pixels by the appropriatescaling ratio.
While the peak power of the display is similar to that of the CPUand the network, the fraction of energy consumed by the displaycan be much larger than the other components since the display isconstantly active throughout an application’s use. An accurate esti-mation is thus important for this most dominant energy consumer.The power model for the display depends on the display technologyused. Prior work has provided power models for LCD and OLEDdisplays [5, 25]. However, several modern mobile devices use Ac-tive Matrix OLED (AMOLED) displays, that do not fit existingmodels.
The OLED power model shows linear and additive properties:the energy consumption of the display as a whole is the sum of theenergy consumption of the R,G, and B components of the individ-ual pixels. Further, the power model for the R,G, and B compo-nents is linear, provided the colors are converted from the standardRGB (sRGB) color space to linear RGB. This does not hold for
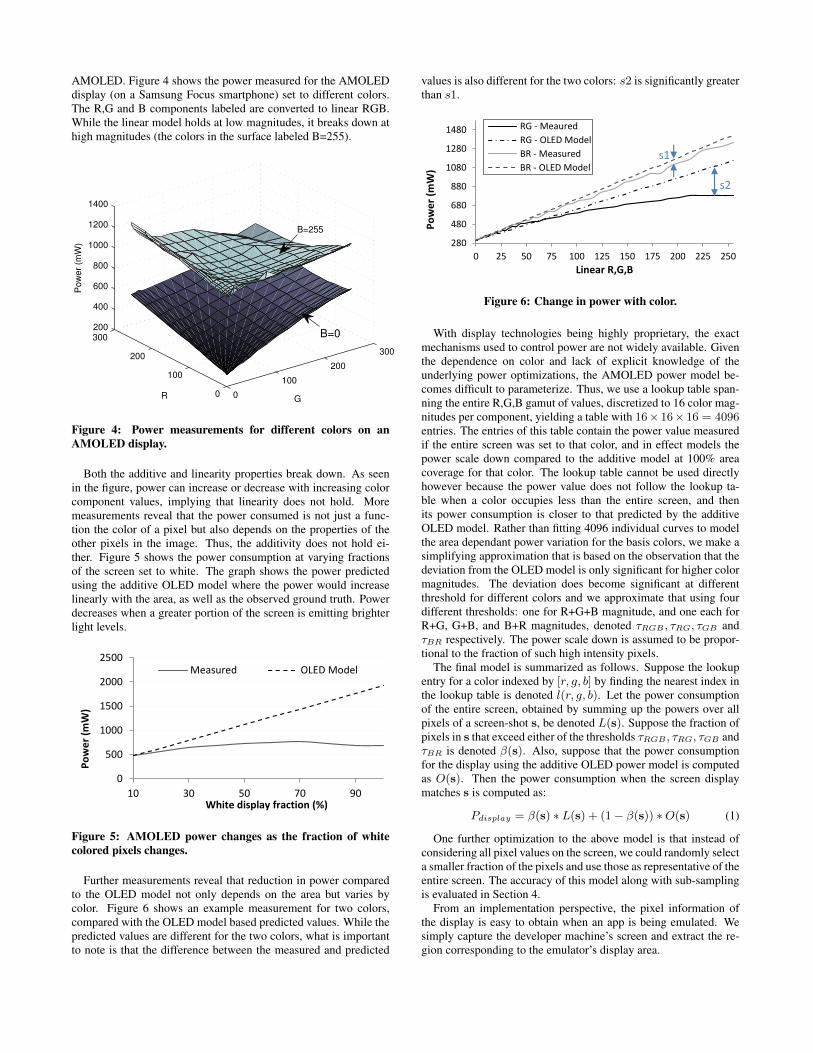
AMOLED. Figure 4 shows the power measured for the AMOLEDdisplay (on a Samsung Focus smartphone) set to different colors.The R,G and B components labeled are converted to linear RGB.While the linear model holds at low magnitudes, it breaks down athigh magnitudes (the colors in the surface labeled B=255).
0
100
200
300
0
100
200
300200
400
600
800
1000
1200
1400
GR
Pow
er
(mW
)
B=255
B=0
Figure 4: Power measurements for different colors on anAMOLED display.
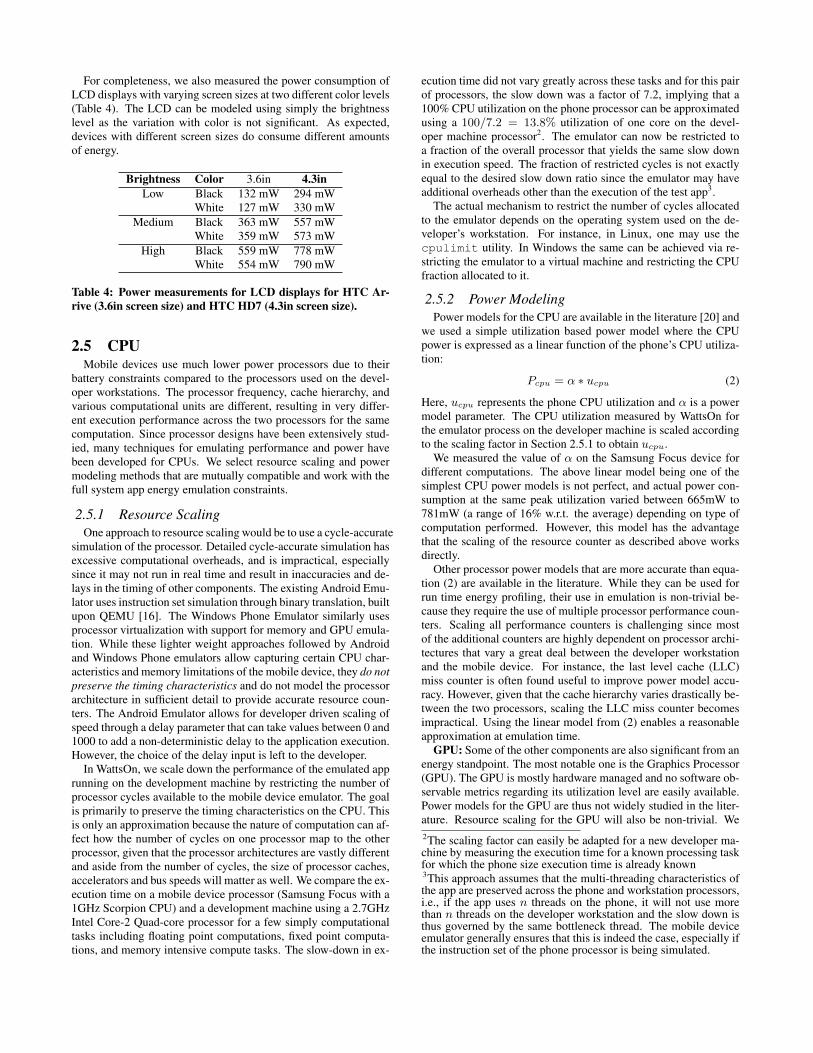
Both the additive and linearity properties break down. As seenin the figure, power can increase or decrease with increasing colorcomponent values, implying that linearity does not hold. Moremeasurements reveal that the power consumed is not just a func-tion the color of a pixel but also depends on the properties of theother pixels in the image. Thus, the additivity does not hold ei-ther. Figure 5 shows the power consumption at varying fractionsof the screen set to white. The graph shows the power predictedusing the additive OLED model where the power would increaselinearly with the area, as well as the observed ground truth. Powerdecreases when a greater portion of the screen is emitting brighterlight levels.
0
500
1000
1500
2000
2500
10 30 50 70 90
Po
we
r (m
W)
White display fraction (%)
Measured OLED Model
Figure 5: AMOLED power changes as the fraction of whitecolored pixels changes.
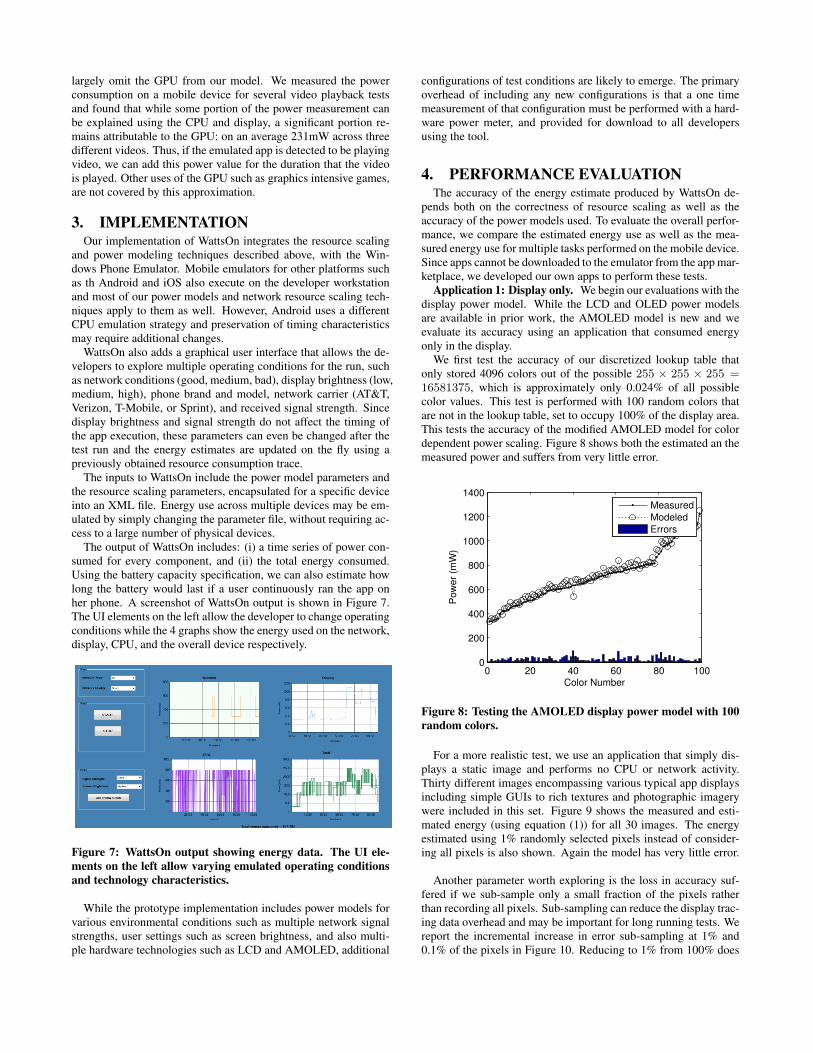
Further measurements reveal that reduction in power comparedto the OLED model not only depends on the area but varies bycolor. Figure 6 shows an example measurement for two colors,compared with the OLED model based predicted values. While thepredicted values are different for the two colors, what is importantto note is that the difference between the measured and predicted
values is also different for the two colors: s2 is significantly greaterthan s1.
280
480
680
880
1080
1280
1480
0 25 50 75 100 125 150 175 200 225 250
Po
we
r (m
W)
Linear R,G,B
RG - Meaured
RG - OLED Model
BR - Measured
BR - OLED Models1
s2
Figure 6: Change in power with color.
With display technologies being highly proprietary, the exactmechanisms used to control power are not widely available. Giventhe dependence on color and lack of explicit knowledge of theunderlying power optimizations, the AMOLED power model be-comes difficult to parameterize. Thus, we use a lookup table span-ning the entire R,G,B gamut of values, discretized to 16 color mag-nitudes per component, yielding a table with 16× 16× 16 = 4096entries. The entries of this table contain the power value measuredif the entire screen was set to that color, and in effect models thepower scale down compared to the additive model at 100% areacoverage for that color. The lookup table cannot be used directlyhowever because the power value does not follow the lookup ta-ble when a color occupies less than the entire screen, and thenits power consumption is closer to that predicted by the additiveOLED model. Rather than fitting 4096 individual curves to modelthe area dependant power variation for the basis colors, we make asimplifying approximation that is based on the observation that thedeviation from the OLED model is only significant for higher colormagnitudes. The deviation does become significant at differentthreshold for different colors and we approximate that using fourdifferent thresholds: one for R+G+B magnitude, and one each forR+G, G+B, and B+R magnitudes, denoted τRGB , τRG, τGB andτBR respectively. The power scale down is assumed to be propor-tional to the fraction of such high intensity pixels.
The final model is summarized as follows. Suppose the lookupentry for a color indexed by [r, g, b] by finding the nearest index inthe lookup table is denoted l(r, g, b). Let the power consumptionof the entire screen, obtained by summing up the powers over allpixels of a screen-shot s, be denoted L(s). Suppose the fraction ofpixels in s that exceed either of the thresholds τRGB , τRG, τGB andτBR is denoted β(s). Also, suppose that the power consumptionfor the display using the additive OLED power model is computedas O(s). Then the power consumption when the screen displaymatches s is computed as:
Pdisplay = β(s) ∗ L(s) + (1− β(s)) ∗O(s) (1)
One further optimization to the above model is that instead ofconsidering all pixel values on the screen, we could randomly selecta smaller fraction of the pixels and use those as representative of theentire screen. The accuracy of this model along with sub-samplingis evaluated in Section 4.
From an implementation perspective, the pixel information ofthe display is easy to obtain when an app is being emulated. Wesimply capture the developer machine’s screen and extract the re-gion corresponding to the emulator’s display area.
For completeness, we also measured the power consumption ofLCD displays with varying screen sizes at two different color levels(Table 4). The LCD can be modeled using simply the brightnesslevel as the variation with color is not significant. As expected,devices with different screen sizes do consume different amountsof energy.
Brightness Color 3.6in 4.3inLow Black 132 mW 294 mW
White 127 mW 330 mWMedium Black 363 mW 557 mW
White 359 mW 573 mWHigh Black 559 mW 778 mW
White 554 mW 790 mW
Table 4: Power measurements for LCD displays for HTC Ar-rive (3.6in screen size) and HTC HD7 (4.3in screen size).
2.5 CPUMobile devices use much lower power processors due to their
battery constraints compared to the processors used on the devel-oper workstations. The processor frequency, cache hierarchy, andvarious computational units are different, resulting in very differ-ent execution performance across the two processors for the samecomputation. Since processor designs have been extensively stud-ied, many techniques for emulating performance and power havebeen developed for CPUs. We select resource scaling and powermodeling methods that are mutually compatible and work with thefull system app energy emulation constraints.
2.5.1 Resource ScalingOne approach to resource scaling would be to use a cycle-accurate
simulation of the processor. Detailed cycle-accurate simulation hasexcessive computational overheads, and is impractical, especiallysince it may not run in real time and result in inaccuracies and de-lays in the timing of other components. The existing Android Emu-lator uses instruction set simulation through binary translation, builtupon QEMU [16]. The Windows Phone Emulator similarly usesprocessor virtualization with support for memory and GPU emula-tion. While these lighter weight approaches followed by Androidand Windows Phone emulators allow capturing certain CPU char-acteristics and memory limitations of the mobile device, they do notpreserve the timing characteristics and do not model the processorarchitecture in sufficient detail to provide accurate resource coun-ters. The Android Emulator allows for developer driven scaling ofspeed through a delay parameter that can take values between 0 and1000 to add a non-deterministic delay to the application execution.However, the choice of the delay input is left to the developer.
In WattsOn, we scale down the performance of the emulated apprunning on the development machine by restricting the number ofprocessor cycles available to the mobile device emulator. The goalis primarily to preserve the timing characteristics on the CPU. Thisis only an approximation because the nature of computation can af-fect how the number of cycles on one processor map to the otherprocessor, given that the processor architectures are vastly differentand aside from the number of cycles, the size of processor caches,accelerators and bus speeds will matter as well. We compare the ex-ecution time on a mobile device processor (Samsung Focus with a1GHz Scorpion CPU) and a development machine using a 2.7GHzIntel Core-2 Quad-core processor for a few simply computationaltasks including floating point computations, fixed point computa-tions, and memory intensive compute tasks. The slow-down in ex-
ecution time did not vary greatly across these tasks and for this pairof processors, the slow down was a factor of 7.2, implying that a100% CPU utilization on the phone processor can be approximatedusing a 100/7.2 = 13.8% utilization of one core on the devel-oper machine processor2. The emulator can now be restricted toa fraction of the overall processor that yields the same slow downin execution speed. The fraction of restricted cycles is not exactlyequal to the desired slow down ratio since the emulator may haveadditional overheads other than the execution of the test app3.
The actual mechanism to restrict the number of cycles allocatedto the emulator depends on the operating system used on the de-veloper’s workstation. For instance, in Linux, one may use thecpulimit utility. In Windows the same can be achieved via re-stricting the emulator to a virtual machine and restricting the CPUfraction allocated to it.
2.5.2 Power ModelingPower models for the CPU are available in the literature [20] and
we used a simple utilization based power model where the CPUpower is expressed as a linear function of the phone’s CPU utiliza-tion:
Pcpu = α ∗ ucpu (2)
Here, ucpu represents the phone CPU utilization and α is a powermodel parameter. The CPU utilization measured by WattsOn forthe emulator process on the developer machine is scaled accordingto the scaling factor in Section 2.5.1 to obtain ucpu.
We measured the value of α on the Samsung Focus device fordifferent computations. The above linear model being one of thesimplest CPU power models is not perfect, and actual power con-sumption at the same peak utilization varied between 665mW to781mW (a range of 16% w.r.t. the average) depending on type ofcomputation performed. However, this model has the advantagethat the scaling of the resource counter as described above worksdirectly.
Other processor power models that are more accurate than equa-tion (2) are available in the literature. While they can be used forrun time energy profiling, their use in emulation is non-trivial be-cause they require the use of multiple processor performance coun-ters. Scaling all performance counters is challenging since mostof the additional counters are highly dependent on processor archi-tectures that vary a great deal between the developer workstationand the mobile device. For instance, the last level cache (LLC)miss counter is often found useful to improve power model accu-racy. However, given that the cache hierarchy varies drastically be-tween the two processors, scaling the LLC miss counter becomesimpractical. Using the linear model from (2) enables a reasonableapproximation at emulation time.
GPU: Some of the other components are also significant from anenergy standpoint. The most notable one is the Graphics Processor(GPU). The GPU is mostly hardware managed and no software ob-servable metrics regarding its utilization level are easily available.Power models for the GPU are thus not widely studied in the liter-ature. Resource scaling for the GPU will also be non-trivial. We2The scaling factor can easily be adapted for a new developer ma-chine by measuring the execution time for a known processing taskfor which the phone size execution time is already known3This approach assumes that the multi-threading characteristics ofthe app are preserved across the phone and workstation processors,i.e., if the app uses n threads on the phone, it will not use morethan n threads on the developer workstation and the slow down isthus governed by the same bottleneck thread. The mobile deviceemulator generally ensures that this is indeed the case, especially ifthe instruction set of the phone processor is being simulated.
largely omit the GPU from our model. We measured the powerconsumption on a mobile device for several video playback testsand found that while some portion of the power measurement canbe explained using the CPU and display, a significant portion re-mains attributable to the GPU: on an average 231mW across threedifferent videos. Thus, if the emulated app is detected to be playingvideo, we can add this power value for the duration that the videois played. Other uses of the GPU such as graphics intensive games,are not covered by this approximation.
3. IMPLEMENTATIONOur implementation of WattsOn integrates the resource scaling
and power modeling techniques described above, with the Win-dows Phone Emulator. Mobile emulators for other platforms suchas th Android and iOS also execute on the developer workstationand most of our power models and network resource scaling tech-niques apply to them as well. However, Android uses a differentCPU emulation strategy and preservation of timing characteristicsmay require additional changes.
WattsOn also adds a graphical user interface that allows the de-velopers to explore multiple operating conditions for the run, suchas network conditions (good, medium, bad), display brightness (low,medium, high), phone brand and model, network carrier (AT&T,Verizon, T-Mobile, or Sprint), and received signal strength. Sincedisplay brightness and signal strength do not affect the timing ofthe app execution, these parameters can even be changed after thetest run and the energy estimates are updated on the fly using apreviously obtained resource consumption trace.
The inputs to WattsOn include the power model parameters andthe resource scaling parameters, encapsulated for a specific deviceinto an XML file. Energy use across multiple devices may be em-ulated by simply changing the parameter file, without requiring ac-cess to a large number of physical devices.
The output of WattsOn includes: (i) a time series of power con-sumed for every component, and (ii) the total energy consumed.Using the battery capacity specification, we can also estimate howlong the battery would last if a user continuously ran the app onher phone. A screenshot of WattsOn output is shown in Figure 7.The UI elements on the left allow the developer to change operatingconditions while the 4 graphs show the energy used on the network,display, CPU, and the overall device respectively.
Figure 7: WattsOn output showing energy data. The UI ele-ments on the left allow varying emulated operating conditionsand technology characteristics.
While the prototype implementation includes power models forvarious environmental conditions such as multiple network signalstrengths, user settings such as screen brightness, and also multi-ple hardware technologies such as LCD and AMOLED, additional
configurations of test conditions are likely to emerge. The primaryoverhead of including any new configurations is that a one timemeasurement of that configuration must be performed with a hard-ware power meter, and provided for download to all developersusing the tool.
4. PERFORMANCE EVALUATIONThe accuracy of the energy estimate produced by WattsOn de-
pends both on the correctness of resource scaling as well as theaccuracy of the power models used. To evaluate the overall perfor-mance, we compare the estimated energy use as well as the mea-sured energy use for multiple tasks performed on the mobile device.Since apps cannot be downloaded to the emulator from the app mar-ketplace, we developed our own apps to perform these tests.
Application 1: Display only. We begin our evaluations with thedisplay power model. While the LCD and OLED power modelsare available in prior work, the AMOLED model is new and weevaluate its accuracy using an application that consumed energyonly in the display.
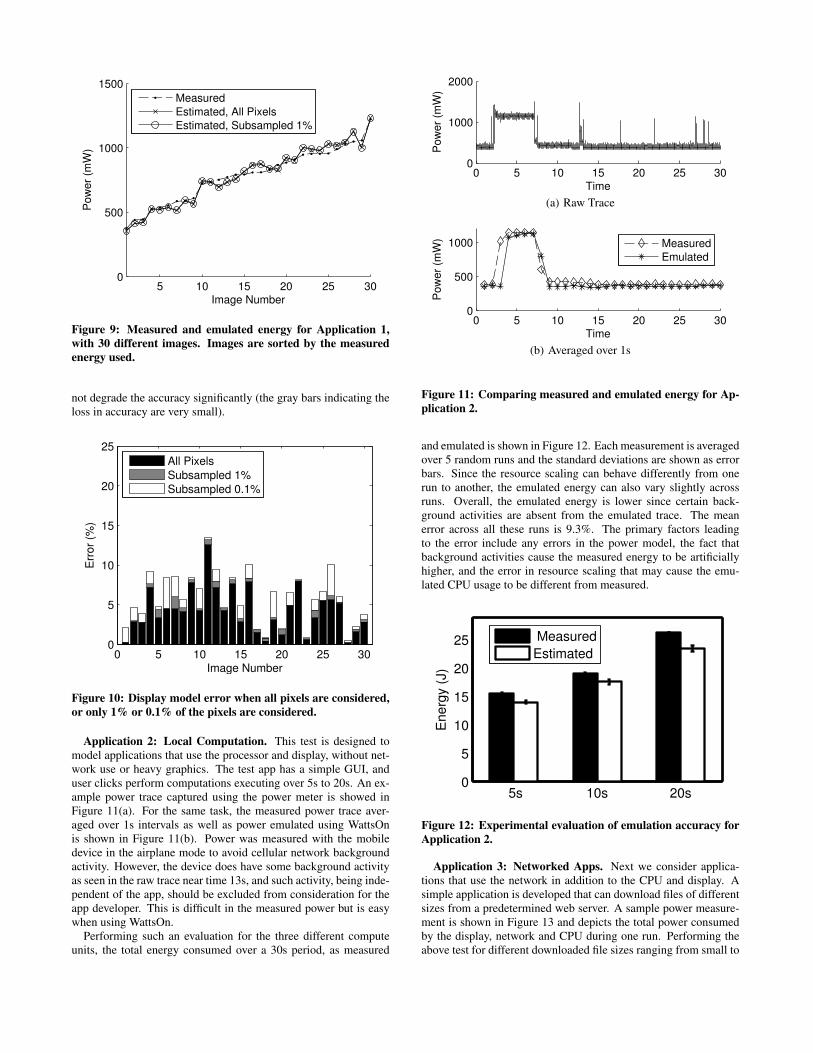
We first test the accuracy of our discretized lookup table thatonly stored 4096 colors out of the possible 255 × 255 × 255 =16581375, which is approximately only 0.024% of all possiblecolor values. This test is performed with 100 random colors thatare not in the lookup table, set to occupy 100% of the display area.This tests the accuracy of the modified AMOLED model for colordependent power scaling. Figure 8 shows both the estimated an themeasured power and suffers from very little error.
0 20 40 60 80 1000
200
400
600
800
1000
1200
1400
Color Number
Po
we
r (m
W)
Measured
Modeled
Errors
Figure 8: Testing the AMOLED display power model with 100random colors.
For a more realistic test, we use an application that simply dis-plays a static image and performs no CPU or network activity.Thirty different images encompassing various typical app displaysincluding simple GUIs to rich textures and photographic imagerywere included in this set. Figure 9 shows the measured and esti-mated energy (using equation (1)) for all 30 images. The energyestimated using 1% randomly selected pixels instead of consider-ing all pixels is also shown. Again the model has very little error.
Another parameter worth exploring is the loss in accuracy suf-fered if we sub-sample only a small fraction of the pixels ratherthan recording all pixels. Sub-sampling can reduce the display trac-ing data overhead and may be important for long running tests. Wereport the incremental increase in error sub-sampling at 1% and0.1% of the pixels in Figure 10. Reducing to 1% from 100% does
5 10 15 20 25 300
500
1000
1500
Image Number
Po
we
r (m
W)
Measured
Estimated, All Pixels
Estimated, Subsampled 1%
Figure 9: Measured and emulated energy for Application 1,with 30 different images. Images are sorted by the measuredenergy used.
not degrade the accuracy significantly (the gray bars indicating theloss in accuracy are very small).
0 5 10 15 20 25 300
5
10
15
20
25
Image Number
Err
or
(%)
All Pixels
Subsampled 1%
Subsampled 0.1%
Figure 10: Display model error when all pixels are considered,or only 1% or 0.1% of the pixels are considered.
Application 2: Local Computation. This test is designed tomodel applications that use the processor and display, without net-work use or heavy graphics. The test app has a simple GUI, anduser clicks perform computations executing over 5s to 20s. An ex-ample power trace captured using the power meter is showed inFigure 11(a). For the same task, the measured power trace aver-aged over 1s intervals as well as power emulated using WattsOnis shown in Figure 11(b). Power was measured with the mobiledevice in the airplane mode to avoid cellular network backgroundactivity. However, the device does have some background activityas seen in the raw trace near time 13s, and such activity, being inde-pendent of the app, should be excluded from consideration for theapp developer. This is difficult in the measured power but is easywhen using WattsOn.
Performing such an evaluation for the three different computeunits, the total energy consumed over a 30s period, as measured
0 5 10 15 20 25 300
1000
2000
Time
Po
we
r (m
W)
(a) Raw Trace
0 5 10 15 20 25 300
500
1000
Time
Po
we
r (m
W)
Measured
Emulated
(b) Averaged over 1s
Figure 11: Comparing measured and emulated energy for Ap-plication 2.
and emulated is shown in Figure 12. Each measurement is averagedover 5 random runs and the standard deviations are shown as errorbars. Since the resource scaling can behave differently from onerun to another, the emulated energy can also vary slightly acrossruns. Overall, the emulated energy is lower since certain back-ground activities are absent from the emulated trace. The meanerror across all these runs is 9.3%. The primary factors leadingto the error include any errors in the power model, the fact thatbackground activities cause the measured energy to be artificiallyhigher, and the error in resource scaling that may cause the emu-lated CPU usage to be different from measured.
5s 10s 20s0
5
10
15
20
25
En
erg
y (
J)
Measured
Estimated
Figure 12: Experimental evaluation of emulation accuracy forApplication 2.
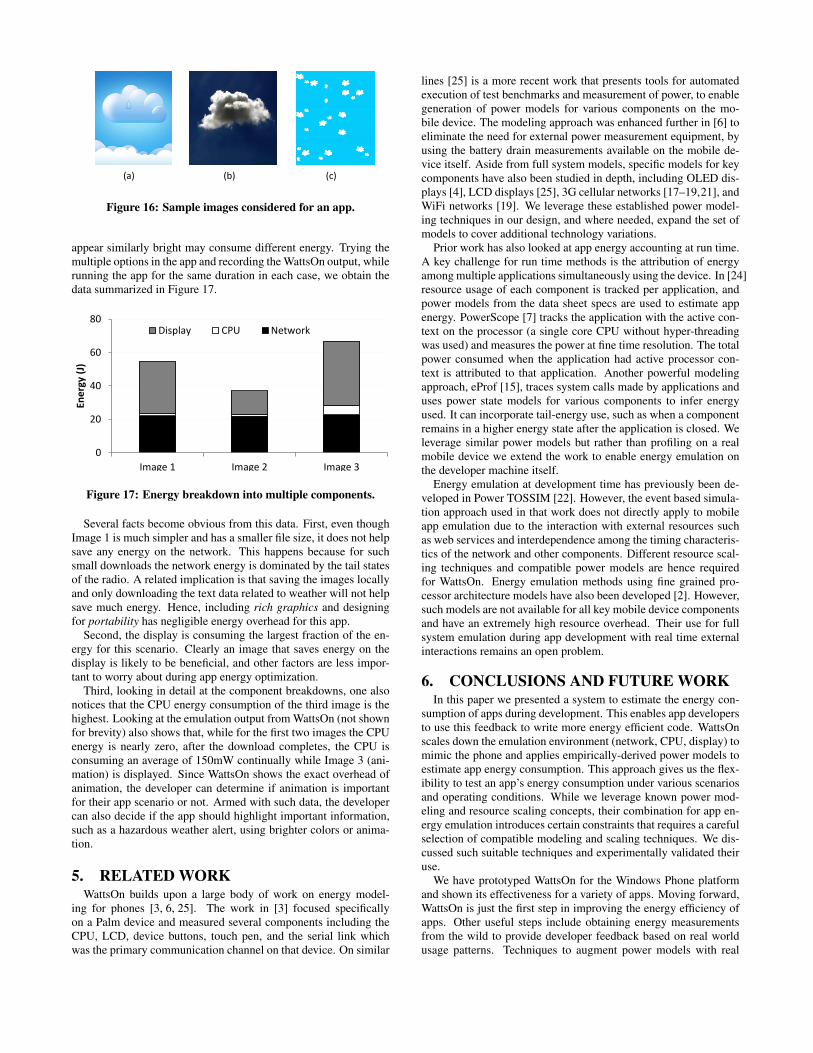
Application 3: Networked Apps. Next we consider applica-tions that use the network in addition to the CPU and display. Asimple application is developed that can download files of differentsizes from a predetermined web server. A sample power measure-ment is shown in Figure 13 and depicts the total power consumedby the display, network and CPU during one run. Performing theabove test for different downloaded file sizes ranging from small to
0 5 10 15 20 25 300
1000
2000
Time
Pow
er
(mW
)
Figure 13: Example data capture for Application 3.
large, and repeating each test 5 times, the measured and estimatedenergy use is shown in Figure 14. The emulation energy is closeenough for the developer to make the correct design choices basedon the estimates provided by WattsOn. Average error is 4.73%across all tests.
1kB 100kB 1MB0
5
10
15
20
25
30
En
erg
y (
J)
Measured
Estimated
Figure 14: Estimated and measured energy for Application 3with varying download sizes.
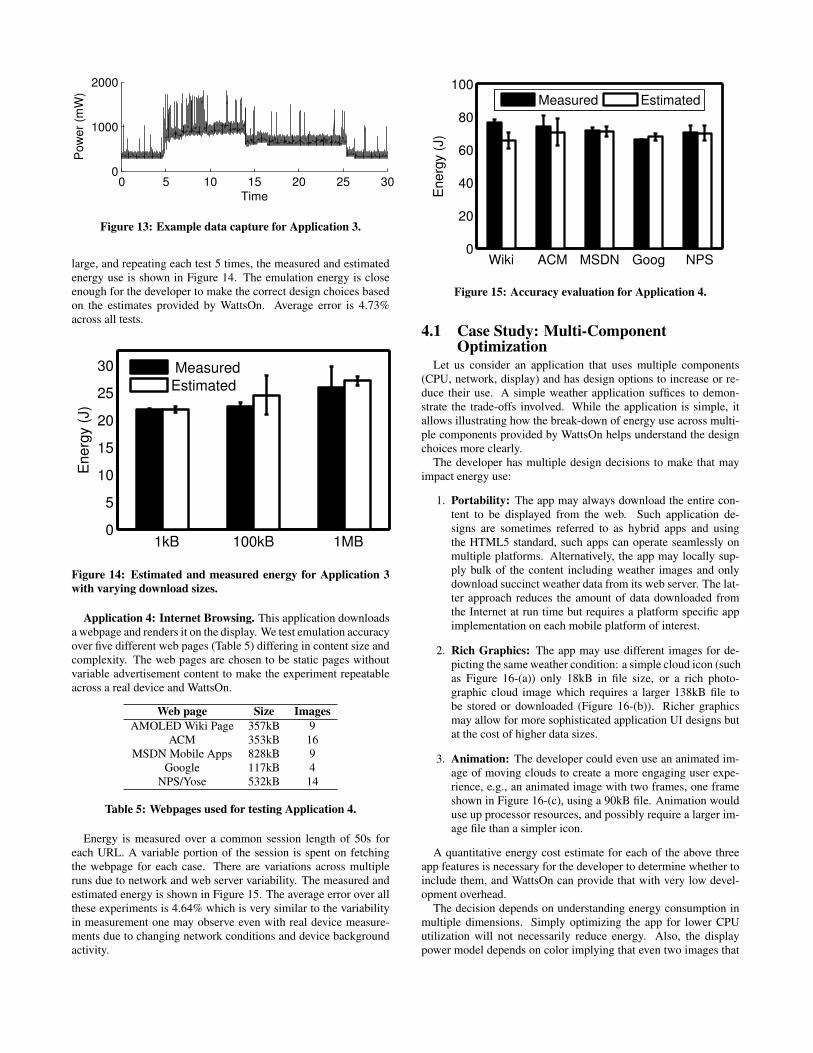
Application 4: Internet Browsing. This application downloadsa webpage and renders it on the display. We test emulation accuracyover five different web pages (Table 5) differing in content size andcomplexity. The web pages are chosen to be static pages withoutvariable advertisement content to make the experiment repeatableacross a real device and WattsOn.
Web page Size ImagesAMOLED Wiki Page 357kB 9
ACM 353kB 16MSDN Mobile Apps 828kB 9
Google 117kB 4NPS/Yose 532kB 14
Table 5: Webpages used for testing Application 4.
Energy is measured over a common session length of 50s foreach URL. A variable portion of the session is spent on fetchingthe webpage for each case. There are variations across multipleruns due to network and web server variability. The measured andestimated energy is shown in Figure 15. The average error over allthese experiments is 4.64% which is very similar to the variabilityin measurement one may observe even with real device measure-ments due to changing network conditions and device backgroundactivity.
Wiki ACM MSDN Goog NPS0
20
40
60
80
100
En
erg
y (
J)
Measured Estimated
Figure 15: Accuracy evaluation for Application 4.
4.1 Case Study: Multi-ComponentOptimization
Let us consider an application that uses multiple components(CPU, network, display) and has design options to increase or re-duce their use. A simple weather application suffices to demon-strate the trade-offs involved. While the application is simple, itallows illustrating how the break-down of energy use across multi-ple components provided by WattsOn helps understand the designchoices more clearly.
The developer has multiple design decisions to make that mayimpact energy use:
1. Portability: The app may always download the entire con-tent to be displayed from the web. Such application de-signs are sometimes referred to as hybrid apps and usingthe HTML5 standard, such apps can operate seamlessly onmultiple platforms. Alternatively, the app may locally sup-ply bulk of the content including weather images and onlydownload succinct weather data from its web server. The lat-ter approach reduces the amount of data downloaded fromthe Internet at run time but requires a platform specific appimplementation on each mobile platform of interest.
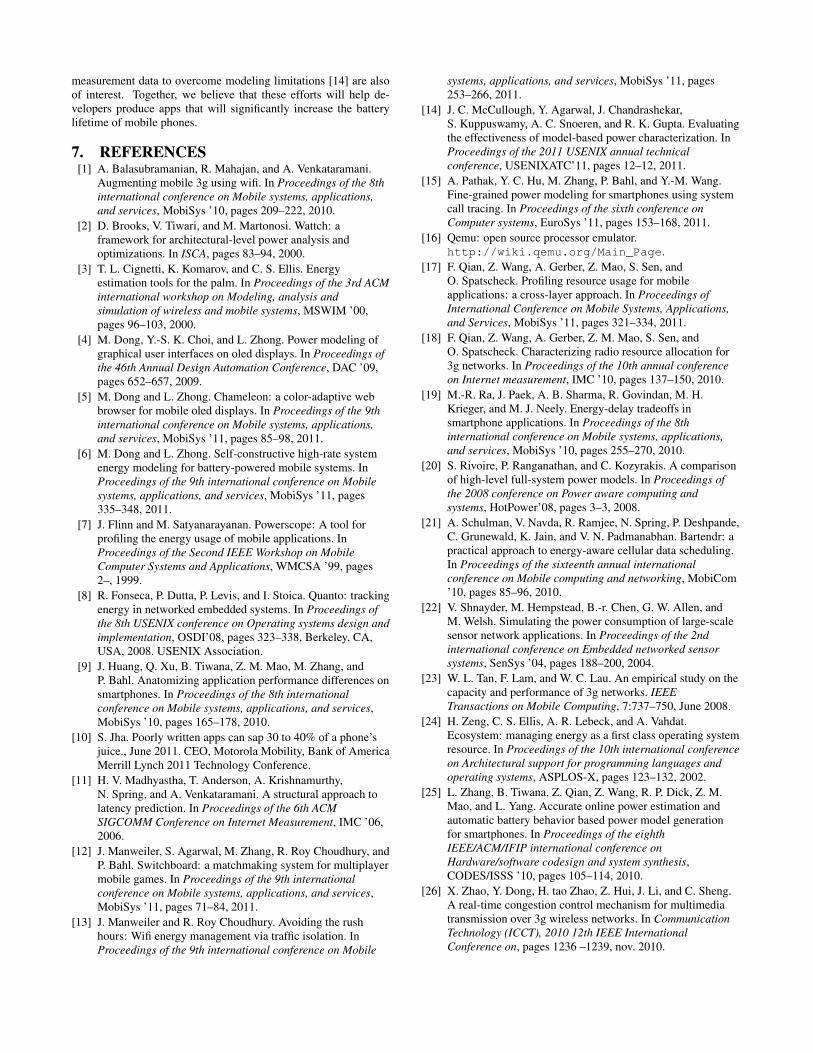
2. Rich Graphics: The app may use different images for de-picting the same weather condition: a simple cloud icon (suchas Figure 16-(a)) only 18kB in file size, or a rich photo-graphic cloud image which requires a larger 138kB file tobe stored or downloaded (Figure 16-(b)). Richer graphicsmay allow for more sophisticated application UI designs butat the cost of higher data sizes.
3. Animation: The developer could even use an animated im-age of moving clouds to create a more engaging user expe-rience, e.g., an animated image with two frames, one frameshown in Figure 16-(c), using a 90kB file. Animation woulduse up processor resources, and possibly require a larger im-age file than a simpler icon.
A quantitative energy cost estimate for each of the above threeapp features is necessary for the developer to determine whether toinclude them, and WattsOn can provide that with very low devel-opment overhead.
The decision depends on understanding energy consumption inmultiple dimensions. Simply optimizing the app for lower CPUutilization will not necessarily reduce energy. Also, the displaypower model depends on color implying that even two images that
(a) (b) (c)
Figure 16: Sample images considered for an app.
appear similarly bright may consume different energy. Trying themultiple options in the app and recording the WattsOn output, whilerunning the app for the same duration in each case, we obtain thedata summarized in Figure 17.
0
20
40
60
80
Image 1 Image 2 Image 3
Ene
rgy
(J)
Display CPU Network
Figure 17: Energy breakdown into multiple components.
Several facts become obvious from this data. First, even thoughImage 1 is much simpler and has a smaller file size, it does not helpsave any energy on the network. This happens because for suchsmall downloads the network energy is dominated by the tail statesof the radio. A related implication is that saving the images locallyand only downloading the text data related to weather will not helpsave much energy. Hence, including rich graphics and designingfor portability has negligible energy overhead for this app.
Second, the display is consuming the largest fraction of the en-ergy for this scenario. Clearly an image that saves energy on thedisplay is likely to be beneficial, and other factors are less impor-tant to worry about during app energy optimization.
Third, looking in detail at the component breakdowns, one alsonotices that the CPU energy consumption of the third image is thehighest. Looking at the emulation output from WattsOn (not shownfor brevity) also shows that, while for the first two images the CPUenergy is nearly zero, after the download completes, the CPU isconsuming an average of 150mW continually while Image 3 (ani-mation) is displayed. Since WattsOn shows the exact overhead ofanimation, the developer can determine if animation is importantfor their app scenario or not. Armed with such data, the developercan also decide if the app should highlight important information,such as a hazardous weather alert, using brighter colors or anima-tion.
5. RELATED WORKWattsOn builds upon a large body of work on energy model-
ing for phones [3, 6, 25]. The work in [3] focused specificallyon a Palm device and measured several components including theCPU, LCD, device buttons, touch pen, and the serial link whichwas the primary communication channel on that device. On similar
lines [25] is a more recent work that presents tools for automatedexecution of test benchmarks and measurement of power, to enablegeneration of power models for various components on the mo-bile device. The modeling approach was enhanced further in [6] toeliminate the need for external power measurement equipment, byusing the battery drain measurements available on the mobile de-vice itself. Aside from full system models, specific models for keycomponents have also been studied in depth, including OLED dis-plays [4], LCD displays [25], 3G cellular networks [17–19,21], andWiFi networks [19]. We leverage these established power model-ing techniques in our design, and where needed, expand the set ofmodels to cover additional technology variations.
Prior work has also looked at app energy accounting at run time.A key challenge for run time methods is the attribution of energyamong multiple applications simultaneously using the device. In [24]resource usage of each component is tracked per application, andpower models from the data sheet specs are used to estimate appenergy. PowerScope [7] tracks the application with the active con-text on the processor (a single core CPU without hyper-threadingwas used) and measures the power at fine time resolution. The totalpower consumed when the application had active processor con-text is attributed to that application. Another powerful modelingapproach, eProf [15], traces system calls made by applications anduses power state models for various components to infer energyused. It can incorporate tail-energy use, such as when a componentremains in a higher energy state after the application is closed. Weleverage similar power models but rather than profiling on a realmobile device we extend the work to enable energy emulation onthe developer machine itself.
Energy emulation at development time has previously been de-veloped in Power TOSSIM [22]. However, the event based simula-tion approach used in that work does not directly apply to mobileapp emulation due to the interaction with external resources suchas web services and interdependence among the timing characteris-tics of the network and other components. Different resource scal-ing techniques and compatible power models are hence requiredfor WattsOn. Energy emulation methods using fine grained pro-cessor architecture models have also been developed [2]. However,such models are not available for all key mobile device componentsand have an extremely high resource overhead. Their use for fullsystem emulation during app development with real time externalinteractions remains an open problem.
6. CONCLUSIONS AND FUTURE WORKIn this paper we presented a system to estimate the energy con-
sumption of apps during development. This enables app developersto use this feedback to write more energy efficient code. WattsOnscales down the emulation environment (network, CPU, display) tomimic the phone and applies empirically-derived power models toestimate app energy consumption. This approach gives us the flex-ibility to test an app’s energy consumption under various scenariosand operating conditions. While we leverage known power mod-eling and resource scaling concepts, their combination for app en-ergy emulation introduces certain constraints that requires a carefulselection of compatible modeling and scaling techniques. We dis-cussed such suitable techniques and experimentally validated theiruse.
We have prototyped WattsOn for the Windows Phone platformand shown its effectiveness for a variety of apps. Moving forward,WattsOn is just the first step in improving the energy efficiency ofapps. Other useful steps include obtaining energy measurementsfrom the wild to provide developer feedback based on real worldusage patterns. Techniques to augment power models with real
measurement data to overcome modeling limitations [14] are alsoof interest. Together, we believe that these efforts will help de-velopers produce apps that will significantly increase the batterylifetime of mobile phones.
7. REFERENCES[1] A. Balasubramanian, R. Mahajan, and A. Venkataramani.
Augmenting mobile 3g using wifi. In Proceedings of the 8thinternational conference on Mobile systems, applications,and services, MobiSys ’10, pages 209–222, 2010.
[2] D. Brooks, V. Tiwari, and M. Martonosi. Wattch: aframework for architectural-level power analysis andoptimizations. In ISCA, pages 83–94, 2000.
[3] T. L. Cignetti, K. Komarov, and C. S. Ellis. Energyestimation tools for the palm. In Proceedings of the 3rd ACMinternational workshop on Modeling, analysis andsimulation of wireless and mobile systems, MSWIM ’00,pages 96–103, 2000.
[4] M. Dong, Y.-S. K. Choi, and L. Zhong. Power modeling ofgraphical user interfaces on oled displays. In Proceedings ofthe 46th Annual Design Automation Conference, DAC ’09,pages 652–657, 2009.
[5] M. Dong and L. Zhong. Chameleon: a color-adaptive webbrowser for mobile oled displays. In Proceedings of the 9thinternational conference on Mobile systems, applications,and services, MobiSys ’11, pages 85–98, 2011.
[6] M. Dong and L. Zhong. Self-constructive high-rate systemenergy modeling for battery-powered mobile systems. InProceedings of the 9th international conference on Mobilesystems, applications, and services, MobiSys ’11, pages335–348, 2011.
[7] J. Flinn and M. Satyanarayanan. Powerscope: A tool forprofiling the energy usage of mobile applications. InProceedings of the Second IEEE Workshop on MobileComputer Systems and Applications, WMCSA ’99, pages2–, 1999.
[8] R. Fonseca, P. Dutta, P. Levis, and I. Stoica. Quanto: trackingenergy in networked embedded systems. In Proceedings ofthe 8th USENIX conference on Operating systems design andimplementation, OSDI’08, pages 323–338, Berkeley, CA,USA, 2008. USENIX Association.
[9] J. Huang, Q. Xu, B. Tiwana, Z. M. Mao, M. Zhang, andP. Bahl. Anatomizing application performance differences onsmartphones. In Proceedings of the 8th internationalconference on Mobile systems, applications, and services,MobiSys ’10, pages 165–178, 2010.
[10] S. Jha. Poorly written apps can sap 30 to 40% of a phone’sjuice., June 2011. CEO, Motorola Mobility, Bank of AmericaMerrill Lynch 2011 Technology Conference.
[11] H. V. Madhyastha, T. Anderson, A. Krishnamurthy,N. Spring, and A. Venkataramani. A structural approach tolatency prediction. In Proceedings of the 6th ACMSIGCOMM Conference on Internet Measurement, IMC ’06,2006.
[12] J. Manweiler, S. Agarwal, M. Zhang, R. Roy Choudhury, andP. Bahl. Switchboard: a matchmaking system for multiplayermobile games. In Proceedings of the 9th internationalconference on Mobile systems, applications, and services,MobiSys ’11, pages 71–84, 2011.
[13] J. Manweiler and R. Roy Choudhury. Avoiding the rushhours: Wifi energy management via traffic isolation. InProceedings of the 9th international conference on Mobile
systems, applications, and services, MobiSys ’11, pages253–266, 2011.
[14] J. C. McCullough, Y. Agarwal, J. Chandrashekar,S. Kuppuswamy, A. C. Snoeren, and R. K. Gupta. Evaluatingthe effectiveness of model-based power characterization. InProceedings of the 2011 USENIX annual technicalconference, USENIXATC’11, pages 12–12, 2011.
[15] A. Pathak, Y. C. Hu, M. Zhang, P. Bahl, and Y.-M. Wang.Fine-grained power modeling for smartphones using systemcall tracing. In Proceedings of the sixth conference onComputer systems, EuroSys ’11, pages 153–168, 2011.
[16] Qemu: open source processor emulator.http://wiki.qemu.org/Main_Page.
[17] F. Qian, Z. Wang, A. Gerber, Z. Mao, S. Sen, andO. Spatscheck. Profiling resource usage for mobileapplications: a cross-layer approach. In Proceedings ofInternational Conference on Mobile Systems, Applications,and Services, MobiSys ’11, pages 321–334, 2011.
[18] F. Qian, Z. Wang, A. Gerber, Z. M. Mao, S. Sen, andO. Spatscheck. Characterizing radio resource allocation for3g networks. In Proceedings of the 10th annual conferenceon Internet measurement, IMC ’10, pages 137–150, 2010.
[19] M.-R. Ra, J. Paek, A. B. Sharma, R. Govindan, M. H.Krieger, and M. J. Neely. Energy-delay tradeoffs insmartphone applications. In Proceedings of the 8thinternational conference on Mobile systems, applications,and services, MobiSys ’10, pages 255–270, 2010.
[20] S. Rivoire, P. Ranganathan, and C. Kozyrakis. A comparisonof high-level full-system power models. In Proceedings ofthe 2008 conference on Power aware computing andsystems, HotPower’08, pages 3–3, 2008.
[21] A. Schulman, V. Navda, R. Ramjee, N. Spring, P. Deshpande,C. Grunewald, K. Jain, and V. N. Padmanabhan. Bartendr: apractical approach to energy-aware cellular data scheduling.In Proceedings of the sixteenth annual internationalconference on Mobile computing and networking, MobiCom’10, pages 85–96, 2010.
[22] V. Shnayder, M. Hempstead, B.-r. Chen, G. W. Allen, andM. Welsh. Simulating the power consumption of large-scalesensor network applications. In Proceedings of the 2ndinternational conference on Embedded networked sensorsystems, SenSys ’04, pages 188–200, 2004.
[23] W. L. Tan, F. Lam, and W. C. Lau. An empirical study on thecapacity and performance of 3g networks. IEEETransactions on Mobile Computing, 7:737–750, June 2008.
[24] H. Zeng, C. S. Ellis, A. R. Lebeck, and A. Vahdat.Ecosystem: managing energy as a first class operating systemresource. In Proceedings of the 10th international conferenceon Architectural support for programming languages andoperating systems, ASPLOS-X, pages 123–132, 2002.
[25] L. Zhang, B. Tiwana, Z. Qian, Z. Wang, R. P. Dick, Z. M.Mao, and L. Yang. Accurate online power estimation andautomatic battery behavior based power model generationfor smartphones. In Proceedings of the eighthIEEE/ACM/IFIP international conference onHardware/software codesign and system synthesis,CODES/ISSS ’10, pages 105–114, 2010.
[26] X. Zhao, Y. Dong, H. tao Zhao, Z. Hui, J. Li, and C. Sheng.A real-time congestion control mechanism for multimediatransmission over 3g wireless networks. In CommunicationTechnology (ICCT), 2010 12th IEEE InternationalConference on, pages 1236 –1239, nov. 2010.
Recommended