HAL Id: hal-01082259https://hal.archives-ouvertes.fr/hal-01082259
Submitted on 13 Nov 2014
HAL is a multi-disciplinary open accessarchive for the deposit and dissemination of sci-entific research documents, whether they are pub-lished or not. The documents may come fromteaching and research institutions in France orabroad, or from public or private research centers.
L’archive ouverte pluridisciplinaire HAL, estdestinée au dépôt et à la diffusion de documentsscientifiques de niveau recherche, publiés ou non,émanant des établissements d’enseignement et derecherche français ou étrangers, des laboratoirespublics ou privés.
Empirical Analysis of the EKC Hypothesis for SO2Emissions in Selected Middle East and North African
CountriesAdel Ben Youssef, Mohamed El Hedi Arouri, Hatem M’Henni, Christophe
Rault
To cite this version:Adel Ben Youssef, Mohamed El Hedi Arouri, Hatem M’Henni, Christophe Rault. Empirical Analysis ofthe EKC Hypothesis for SO2 Emissions in Selected Middle East and North African Countries. Journalof Energy and Development, International Research Center for Energy and Economic Development,2012, 37, 37 (1 & 2), pp.207-226. �hal-01082259�

1
Empirical Analysis of the EKC Hypothesis for SO2
Emissions in Selected Middle East and North African
Countries
Mohamed El Hedi AROURI EDHEC Business School – France
Adel BEN YOUSSEF
GREDEG-CNRS & University of Nice Sophia-Antipolis – France
Hatem M'HENNI University of Manouba & CEFI-ESSEC – Tunisia
Christophe RAULT
LEO (University of Orléans), and Toulouse Business School, France
ABSTRACT
Studying the impact of economic growth on the environment in the context of developing countries has become
of increasing economic importance in recent years. Alarming international reports show that pollutants
emissions are growing at their highest level ever, particularly in the South countries. This paper implements
recent bootstrap panel unit root tests and cointegration techniques to investigate the relationship between Sulfur
dioxide emissions and real GDP for 12 MENA countries over the period 1981–2005. Our investigations lead to
the result that no evidence is found for the EKC hypothesis for 10 country of the region. However, the EKC
hypothesis is valid for the case of Egypt and Tunisia; the two most industrialised and diversified economies in
our sample. At the same time, our findings show that EKC is not valid for the region when considered as a
whole.
JEL Classification: C23, O11, Q25, Q28
Key words: Environmental Kuznets Curve, Sulfur Dioxide emissions, Economic Growth, panel data, MENA
countries
Authors acknowledge the funding of the Economic Research (ERF) for the project « INCOME LEVEL AND
ENVIRONMENTAL QUALITY IN THE MENA COUNTRIES: DISCUSSING THE ENVIRONMENTAL
KUZNETS CURVE HYPOTHESIS».
2
1. INTRODUCTION
Environmental Sustainability Index (ESI) report of 20051 suggests that
most Middle East and North African (MENA) countries perform badly in
environmental quality management. The same conclusion is found by the new
version of the ESI called the Environmental Performance Index (EPI)2 in 2010.
According to this index, the MENA region can be divided into two distinct groups. The first
one is composed of Algeria, Egypt, Iran, Jordan, Lebanon, Morocco, Syria and Tunisia. These
countries perform relatively well in terms of environmental burden of disease and indoor air
pollution. They also have roughly average results on most other indicators, but poor air
pollution performance. Their scores on urban particulates and industrial carbon dioxide
performance scores fall far below other clusters. The second group is composed of Bahrain,
Libya, Kuwait, Oman, Qatar, Saudi Arabia, United Arab Emirates, Sudan and Yemen. This
cluster is comprised of mainly fossil fuel producing and processing nations and too low-
income countries. They perform well on the environmental burden of disease but poorly on
outdoor air pollution. Their scores are among the lowest in some of the water indicators, but
most notably, they have the worst greenhouse gas per capita performance of all the clusters.
Therefore, the question of sustainability of growth in MENA Countries is becoming
central. On the one hand, environmental constraints may lead to lower the growth for the
region in a context of a demographic boom associated with a high rate of unemployment. On
the other hand, new opportunities and benefits from technological transfer may lead to better
trend of growth and sustainability. One of the most important questions that arise in this
context is to understand the nature of the relationship between economic growth and
environmental quality in MENA countries.
According to the Environmental Kuznets Curve (EKC) hypothesis, as income
increases, environmental degradation (emissions) increases as well until some threshold level
of income is reached after which the environmental degradation begin to decline. An
extensive literature has shown that the EKC hypothesis is validated for different local
1 Between 1999 and 2005, the Yale and Columbia team published four Environmental Sustainability Index
reports (http://sedac.ciesin.columbia.edu/es/esi/) aimed at gauging countries‟ overall progress towards
“environmental sustainability”. 2 The 2010 EPI ranks 163 countries on 25 performance indicators tracked across ten well-established policy
categories covering both environmental public health and ecosystem vitality. These indicators provide a gauge at
a national government scale of how close countries are to established environmental policy goals. A pilot
exercise was conducted in 2006 and a complete report was published in 2008.

3
pollutants in Organisation for Economic Cooperation and Development (OECD) countries.
Thanks to their income per capita levels, most of OECD countries have shifted from the first
branch of the curve to the second one in pollutants especially for local pollutants like Sulphur
dioxide, PMP10, NOx and River pollutants. An extensive literature has discussed the
theoretical foundation of such findings. The picture seems quite different for developing
countries, especially Middle East and North African (MENA) countries, where findings are
often inconclusive (see Arouri et al. (2012) and references therein).
Our article investigates the MENA countries as a region as well as at a country level
by taking advantage of recent advances in the econometrics of non-stationary panel data
econometric techniques and seemingly unrelated regression (SUR) methods. We choose to
use sulphur dioxide (SO2) emissions as the environmental quality proxy in order to test the
existence of the Kuznets curve in the studied MENA countries. At least, three main arguments
justify this choice. First, emissions of SO2 are among the most important forms of energy-
related pollution in the region. They originate primarily from stationary sources in the
industrial and power-generating sector, and SO2 emissions are known for their adverse effects
on human health and the natural environment (EPA 2007). Second, although global sulphur
emissions have increased over much of the last century, levels have begun to decline in recent
decades. By 2000, global emission was approximately 25 percent lower than the peak level
observed in the 1980s. Nevertheless, this decline was not homogenous across world regions.
Whereas emissions are still rising in many developing countries, industrialized countries
experienced an especially strong decline with emission reductions of more than 50 percent
from 1970 to 2000. Obviously, it is important to understand if this decline is also observed in
MENA Countries. Finally, SO2 is produced by burning fossil fuels and is primarily emitted
from stationary sources in the industrial generating sector (Olivier et al. 2005). Specifically,
lignite and hard coal have high Sulphur contents so that their combustion is responsible for a
large part of global SO2 emissions. Yet, since the beginning of the 1970‟s, more end-of-pipe
technologies, such as flue-gas desulfurization have been adopted to filter Sulphur dioxide.
The existence of an EKC can reveals the extent to which MENA countries are adopting these
new technologies.
Thus, the aims of our article are threefold. First, we check for the existence of EKC in
the 12 countries belonging to MENA countries in matter of SO2. Second, we assess the
theoretical values of the turning points from which the economic growth improves the

4
environmental quality in these countries. Third, we investigate the nature of the causality
relationship between economic growth and emissions of SO2.
The rest of paper is organised as follows. Section 2 surveys the theoretical foundation of
the EKC and offers a synthesis of empirical studies on this topic. Section 3 presents the data,
introduces the econometric methodology and discusses the empirical results. Section 4
recommends the appropriate policies and concludes.
2. LITTERATURE REVIEW
2.1. Theoretical explanations of the nature of the SO2-economic growth relationship
Generally the impacts of economic development on environment are disaggregated into
three macro determinants: scale effect, technique effect, and composition effect (Grossman
1995; Copeland and Taylor 2004; Brock and Taylor 2006). The scale effect refers to the fact
that increases in output require more inputs, and, as a by-product, imply more emissions.
Economic growth therefore exhibits a scale effect that has a negative impact on the
environment (Arrow, 1995). The technique effect refers to the invention of new technologies
which are environmental friendly and to the application of these new technologies in
production which in turn lead to the reduction of the pollution of the environment (Andreoni
and Levinson, 2001). The impact of the technique effect is theoretically positive (de Bruyn
1997, Han and Chatterjie, 1997). The composition effect stems from changes in production of
an economy caused by specialization (from agriculture or/and basic industries to high-tech
services). All else equal, if the sectors with high emission intensities grow faster than sectors
with low emission intensities, than composition changes will result in an upward pressure
upon emission (Dasgupta, Mody, Roy, and Wheeler, 1995). The expected impact of the
composition effect is positive deriving from the Rostow evolution postulate. Due to the
different nature of these individual effects, the overall impact of growth on the environment is
ambiguous (Grossman and Krueger (1991), Panayotou, (1997), and Cole (2004)).
Taking into account the nature of the Sulfur Dioxide as specific pollutant, several
explanatory factors were proposed in order to explain the nature of the relationship between
economic growth and SO2 emissions: (i) the decomposition of the economy structure, (ii)
adoption of new technologies and innovation, (iii) demographic factors like the structure of
population or population density, (iv) environmental regulation, institutions and control
system, and, (v) energy consumption structure.
5
According to De Bruyen (1997) change in industrial structure is the main factor
affecting trends in SO2 emissions. Stern (2004, 2005) asserts that changes in technology can
lead with time to reductions in pollution-lowering of EKC- in both developing and developed
countries. Case studies, particularly in China, show that pollution-reducing innovation and
standards may be adopted with relatively short time lags in some developing countries. “Stern
(2004) proposes that at middle-income levels, rapid growth can overwhelm these clean-up
efforts, which have more effect in slower-growing higher income countries”. Several articles
show that population density is negatively correlated with sulfur dioxide emissions (Selden
and Song, 1994, Cole and Neumayer, 2004 and Farzin and Bond, 2006). The main
explanations are lower transportation requirements and higher environmental preferences in
populated areas. Population compositional change has also considerable environmental policy
implication. Recently, Menz and Kühling (2011) show that “societies with a low population
and young and high proportion of senior citizens emit more Sulfur Dioxide”. They verified
these facts for 25 OECD countries from 1970 to 2000. In the same study, Menz and Kühling
argue that three factors actually determine national SO2 emissions: total national energy
consumption, importance of fossil fuels with high Sulfur contents in the process of energy
generation (energy mix), and usage of en-of-pipe technologies.
2.2. Empirical validation of the EKC hypothesis for sulfur dioxyde emissions
Sulfur emissions show the most typical environmental Kuznets curve among the air
pollutants. A wide range of publications shows that SO2 EKC is empirically validated for
most OECD countries. Since the findings of Selden and Song (1994) and Grossman and
Krueger (1995) a plethoric literature has examined the EKC hypothesis for SO2 at both
regional and country levels. Stern (1998) claims that, in most OECD countries, the evidence
for the inverted-U relationship is found only for a subset of environmental measures, e.g. air
pollutants such SO2 or suspended particulates. These findings are supported by those by Cole
et al. (1997), Selden and Song (1994), Stern and Common (2001), Halkos (2003) and
Markandya et al. (2006). Finally, Wang (2010) confirm the existence of Long-run Sulfur-
income relationship for 19 OECD countries during the period 1870-2001.
Understanding past emission patterns in OECD countries has numerous insights for future
emission projection especially in developing countries. One of the most important case
studies is China. China has experienced rapid economic growth during last two decades and
one can ask if this rapid growth has led to the validation of EKC for SO2. Recent works find
that even in developing countries like China, SO2 emissions and GDP per capita are following

6
an EKC. For instance, Gao et al. (2011) found that EKC is valid for SO2 emissions for 29
Chinese provinces during the period between 2000 and 2008. Mou et al. (2011) establish for
the same period that the relationship between economic growth and SO2 emissions in the
biggest city in China (Chongqing) is following an EKC. In contrast, Vincent (1997) shows
that there is no confirmation of SO2 EKC for Malaysia.
As for MENA countries, using cointegration analysis Chebbi et al. (2009) reveal a
positive linkage between trade openness and per capita SO2 emissions and a negative linkage
between economic growth and per capita SO2 emissions in the long-run. Fodha and
Zaghdoudi (2010) provide support for a long-run N-shape relationship between per capita
SO2 emissions and per capita GDP. The authors confirm the EKC hypothesis. Akbostanci et
al. (2009) study the relationship between SO2 emissions, energy consumption and economic
growth in Turkey at two levels: the national level and for the 58 Turkish provinces. The
authors found a monotonic and increasing relationship at the national level. However, they
found an N shaped curve at provinces level. Their findings do not support the EKC.
Regarding the turning point values, the results show a large dispersion across different
studies. According to Lieb (2003) the reported turning points for SO2 range from USD 2 900
to USD 98 200 (in PPP USD 1985). The calculations are very sensitive to the estimation
methods and the econometrics used. Recent studies show that turning points for most OECD
countries range from US$ 5 000 to US$ 10 000. Stern and Common (2001) show that the
turning point in OCCD countries is US$ 9 000. Markandya et al. (2006) found a turning point
at US$ 11 900 in 1990 PPP dollars. The turning points in non-OECD countries are extremely
high and show unilateral increase for most of them.
Our work extends the finding of this literature by examining the situation in MENA
countries at two levels: the whole region and the country level. Stern (2004) asserts that a
large portion of EKC literature is statistically weak and when these statistical problems are
taken into account and appropriate techniques are used, EKC cannot exist. We challenge this
view in our paper and we show that using recent and appropriate econometrics leads to the
existence of EKC for SO2 in MENA Countries3.
3 Another concern is related to the environmental indicators‟ measurements. The “measures of the environmental
degradation fall in two general categories: emission of the pollutants and environmental concentrations of
pollutants” (Kaufman et al., 1998, p210). These two measurements illustrate different aspects of the
environmental degradation situation and neither of them can offer a comprehensive description. “Emission
directly measures the amount of pollutants generated by economic activities during a period without regarding to
the size of the area into which the pollutants are emitted”. It is actually a flow measurement for the polluting

7
3. DATA AND EMPIRICAL RESULTS
In what follows, after introducing the series of our data set we start by testing for unit
roots in our variables. If the variables are non-stationary in our country panel, we test for the
existence of long-run cointegration relationships and investigate their magnitude. Finally, we
estimate panel error correction models (ECM) in order to examine the interactions between
short- and long-run dynamics of our environmental variables.
3.1. Data set and panel unit root tests
We investigate the relationship between SO2 emissions and GDP in MENA region
using recent panel econometric methods. As several MENA countries have signed Kyoto
protocol, there are still concerns regarding the environmental problems. To conduct our
empirical analysis, we need the following variables for all studied MENA countries:
- the SO2 emissions (S);
- the per capita real GDP (Y).
We collect data form World Bank Development Indicators (WDI). Our data are annual
and cover the period 1981-2005 for the following MENA countries: Algeria, Bahrain, Egypt,
Jordan, Kuwait, Lebanon, Morocco, Oman, Qatar, Saudi Arabia, Tunisia and UAE. The
variables S and Y are measured in metric tons per capita and constant 2005 international
dollar, respectively.
At first, we empirically investigate the following model based on variables in natural
logarithms:
ititiitiiit YcYbaS 2 (1)
The coefficients b and c represent the long-run elasticity estimates of SO2 emissions
with respect to real GDP and squared real GDP, respectively. According to the discussion
above, under the EKC hypothesis an increase in income is associated with an increase in SO2
emissions(b>0) and there is an inverted U-shape pattern at which point an increase in income
leads to lower SO2 emissions (c<0).
capacity of economic activities. “The concentration measures the quality of pollutants per unit area without
regarding to the activity that emitted them”, it is more like a stock measurement describing the final result of the
encounter between emission, abatement efforts and the self-purification capacities of nature. As concentration is
a more direct environmental quality indicator and has more direct impact on productivity and public health,
Selden and Song (1994) believe it should be easier to obtain an inverted-U curve for concentration than for
emission indicators.

8
The first step of the analysis is to look at the data properties. Two classes of tests allow
investigating the presence of a unit root: The first generation panel unit-root tests (including
Hadri, 2000; Im, Pesaran and Shin, 2003), were developed on the assumption of the cross-
sectional independence among panel units (except for common time effects), and may be at
odds with economic theory and empirical results. On the other hand, second generation tests
(for instance, Choi, 2006; Moon and Perron, 2004) relax the assumption of cross-sectional
independence, allowing for a variety of dependence across the different units. To test for the
presence of such cross-sectional dependence in our data, we have implemented the simple test
of Pesaran (2004) and have computed the CD statistic. This test is based on the average of
pair-wise correlation coefficients of the OLS residuals obtained from standard augmented
Dickey-Fuller regressions for each individual. Its null hypothesis is cross-sectional
independence and is asymptotically distributed as a two-tailed standard normal distribution.
Results available upon request indicate that the null hypothesis is always rejected regardless
of the number of lags included in the augmented DF auxiliary regression (up to five lags) at
the five percent level of significance. This confirms that the MENA countries are, as
expected, cross-sectionally correlated, which can indeed reflect here the presence of similar
regulations in various fields such as environmental policies, trade, customs, tourism,
legislation, business administration, and increasing financial and economic corporation.
To determine the degree of integration of our series of interest (S, Y, and Y2) in our
panel of 12 MENA countries, we employ the bootstrap tests of Smith et al. (2004), which use
a sieve-sampling scheme to account for both the time series and cross-sectional dependencies
of the data through bootstrap blocks. The specific tests that we consider are denoted t , LM ,
max , and min . t is the bootstrap version of the well known panel unit root test of Im et al.
(2003), 1
1
N
i
i
LM N LM
is a mean of the individual Lagrange Multiplier (LMi) test statistics,
originally introduced by Solo (1984), max is the test of Leybourne (1995), and
min =1
1
N
i
i
N min
is a (more powerful) variant of the individual Lagrange Multiplier (LMi),
with min min( , )i fi riLM LM , where fi riLM and LM are based on forward and backward
regressions (see Smith et al., 2004 for further details). We use bootstrap blocks of m=20.4 All
four tests are constructed with a unit root under the null hypothesis and heterogeneous
4 The results are not very sensitive to the size of the bootstrap blocks.

9
autoregressive roots under the alternative, which indicates that a rejection should be taken as
evidence in favour of stationarity for at least one country.
The results, shown in Table 1 suggest that for all the series (taken in logarithms) the unit root
null cannot be rejected at the five percent level of significance in our country panel for the
four tests.5 We therefore conclude that the variables are non-stationary in our country panel.
6
Table 1a – Panel unit root tests of Smith et al. (2004) for S and Y, Y2 (1981-2005)
*
Sulfur Dioxide Emissions (S)
Test Statistic
(a)
Bootstrap
P-value*
Statistic
(b)
Bootstrap
P-value*
t -1.309 0.738 -2.021 0.685
LM 3.197 0.287 4.456 0.617
max -0.537 0.952 -1.610 0.750
min 1.650 0.518 3.264 0.670
Per Capita Real GDP (Y) Square of Per Capita Real GDP (Y2)
Test Statistic
(a)
Bootstrap
P-value*
Statistic
(b)
Bootstrap
P-value*
Statistic
(a)
Bootstrap
P-value*
Statistic
(b)
Bootstrap
P-value*
t -1.521 0.492 -2.446 3 0.152 -2.393 0.187 -2.157 0.198
LM 3.891 0.123 5.841 0.133 4.692 0.264 3.504 0.384
max 0.216 0.865 -0.685 0.974 0.327 0.846 -0.687 0.784
min 2.177 0.224 1.954 0.993 2.161 0.237 1.972 0.814
Notes: (a) Model includes a constant. (b) Model includes both a constant and a time trend.
* Test based on Smith et al. (2004). Rejection of the null hypothesis indicates stationarity at least in
one country. All tests are based on 2,000 bootstrap replications to compute the p-values.
Null hypothesis: unit root (heterogeneous roots under the alternative).
3.2. Panel long-run relationship
Given that all the series under investigation are integrated of order one, we now proceed
with the two following steps. First, we perform 2nd
generation panel data cointegration tests
(that allow for cross-sectional dependence among countries) to test for the existence of
cointegration between S and Y, Y2 contained in X. Second, if a cointegrating relationship
5 The order of the sieve is permitted to increase with the number of time series observations at the rate T
1/3 while
the lag length of the individual unit root test regressions are determined using the Campbell and Perron (1991)
procedure. 6 The lag order in the individual ADF type regressions is selected for each series using the AIC model selection
criterion. Another crucial issue is the selection of the order of the deterministic component. In particular, since
the cross-sectional dimension is rather large here, it may seem restrictive not to allow at least some of the units
to be trending, suggesting that the model should be fitted with both a constant and trend. However, since the
trending turned out not to be very pronounced, we have considered that a constant is enough in our analysis.
Actually, the results of the bootstrap tests of Smith et al. (2004) are not very sensitive to the inclusion of a trend
in addition to a constant in the estimated equation (see Statistic b in Tables 1). We have of course also checked
using the bootstrap tests of Smith et al. (2004) that the first difference of the series are stationary, hence
confirming that the series expressed in level are integrated of order one.
10
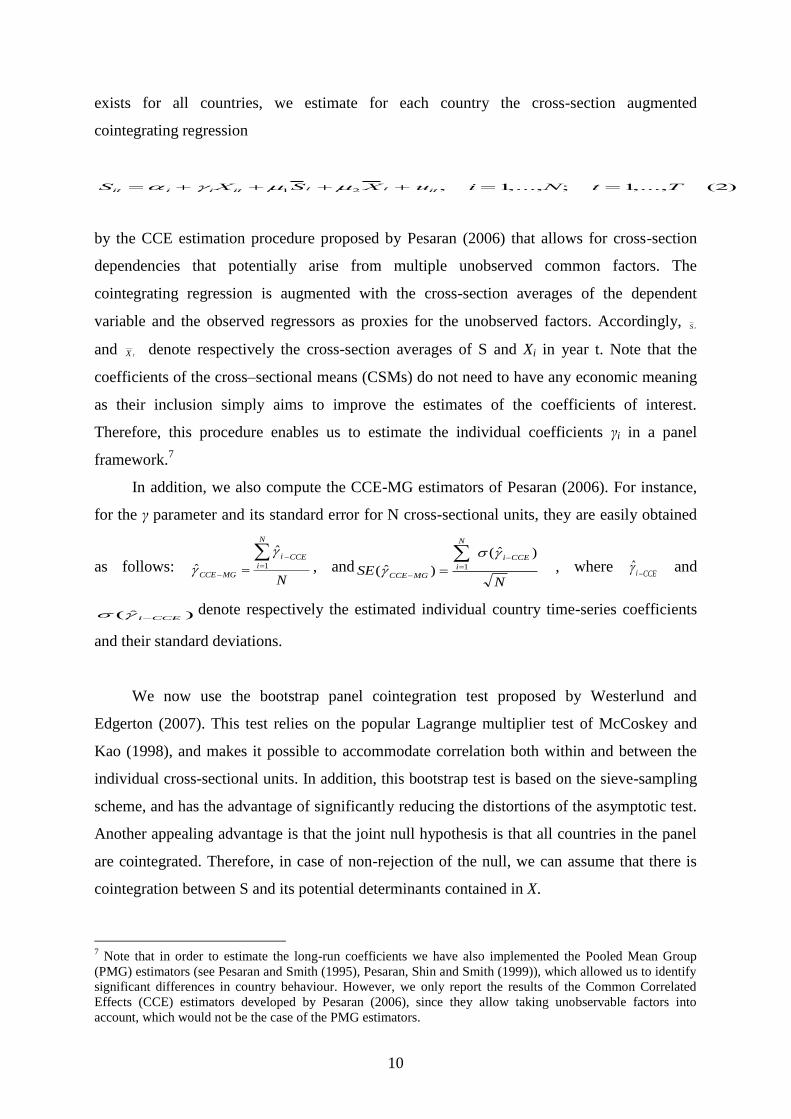
exists for all countries, we estimate for each country the cross-section augmented
cointegrating regression
Sit i iXit 1S t 2X t uit , i 1,...,N; t 1,...,T (2)
by the CCE estimation procedure proposed by Pesaran (2006) that allows for cross-section
dependencies that potentially arise from multiple unobserved common factors. The
cointegrating regression is augmented with the cross-section averages of the dependent
variable and the observed regressors as proxies for the unobserved factors. Accordingly, tS
and tX denote respectively the cross-section averages of S and Xi in year t. Note that the
coefficients of the cross–sectional means (CSMs) do not need to have any economic meaning
as their inclusion simply aims to improve the estimates of the coefficients of interest.
Therefore, this procedure enables us to estimate the individual coefficients γi in a panel
framework.7
In addition, we also compute the CCE-MG estimators of Pesaran (2006). For instance,
for the γ parameter and its standard error for N cross-sectional units, they are easily obtained
as follows: N
N
iCCEi
MGCCE
1
ˆ
ˆ
, andN
SECCEi
N
i
MGCCE
)ˆ(
)ˆ( 1
, where CCEi
and
)ˆ( CCEi denote respectively the estimated individual country time-series coefficients
and their standard deviations.
We now use the bootstrap panel cointegration test proposed by Westerlund and
Edgerton (2007). This test relies on the popular Lagrange multiplier test of McCoskey and
Kao (1998), and makes it possible to accommodate correlation both within and between the
individual cross-sectional units. In addition, this bootstrap test is based on the sieve-sampling
scheme, and has the advantage of significantly reducing the distortions of the asymptotic test.
Another appealing advantage is that the joint null hypothesis is that all countries in the panel
are cointegrated. Therefore, in case of non-rejection of the null, we can assume that there is
cointegration between S and its potential determinants contained in X.
7 Note that in order to estimate the long-run coefficients we have also implemented the Pooled Mean Group
(PMG) estimators (see Pesaran and Smith (1995), Pesaran, Shin and Smith (1999)), which allowed us to identify
significant differences in country behaviour. However, we only report the results of the Common Correlated
Effects (CCE) estimators developed by Pesaran (2006), since they allow taking unobservable factors into
account, which would not be the case of the PMG estimators.
11
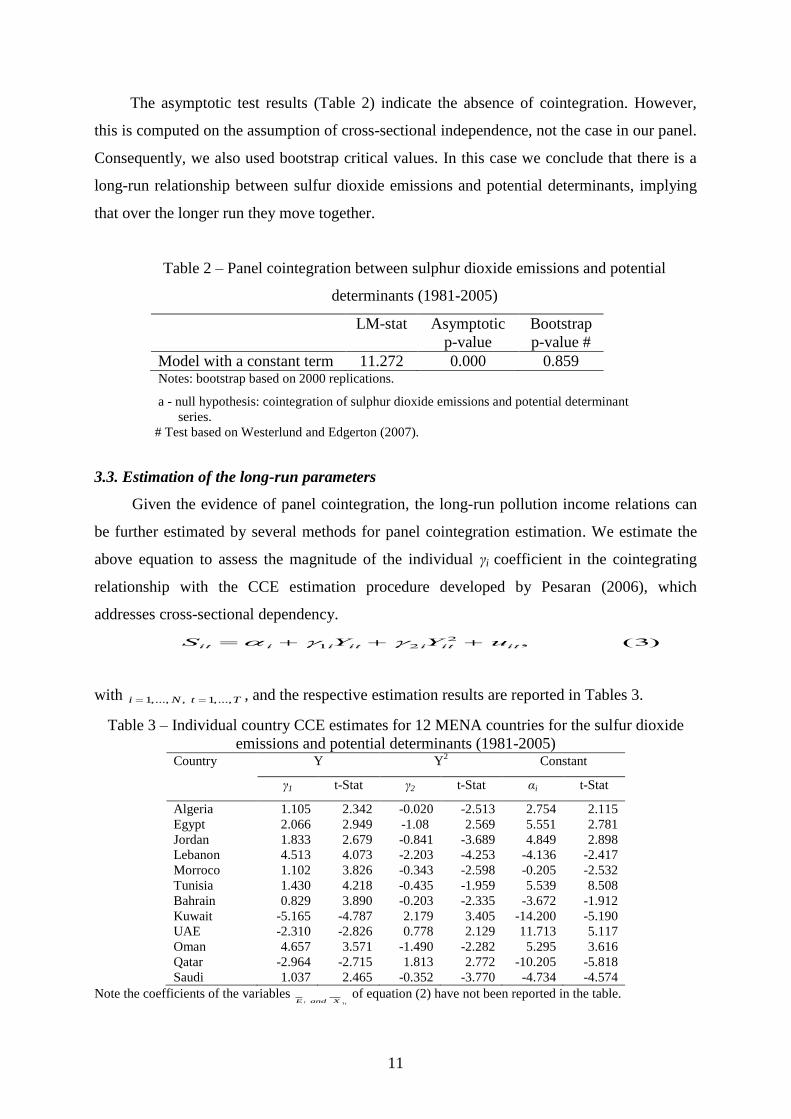
The asymptotic test results (Table 2) indicate the absence of cointegration. However,
this is computed on the assumption of cross-sectional independence, not the case in our panel.
Consequently, we also used bootstrap critical values. In this case we conclude that there is a
long-run relationship between sulfur dioxide emissions and potential determinants, implying
that over the longer run they move together.
Table 2 – Panel cointegration between sulphur dioxide emissions and potential
determinants (1981-2005)
LM-stat Asymptotic
p-value
Bootstrap
p-value #
Model with a constant term 11.272 0.000 0.859 Notes: bootstrap based on 2000 replications.
a - null hypothesis: cointegration of sulphur dioxide emissions and potential determinant
series.
# Test based on Westerlund and Edgerton (2007).
3.3. Estimation of the long-run parameters
Given the evidence of panel cointegration, the long-run pollution income relations can
be further estimated by several methods for panel cointegration estimation. We estimate the
above equation to assess the magnitude of the individual γi coefficient in the cointegrating
relationship with the CCE estimation procedure developed by Pesaran (2006), which
addresses cross-sectional dependency.
Sit i 1iYit 2iYit2 uit, (3)
with 1,..., , 1,...,i N t T , and the respective estimation results are reported in Tables 3.
Table 3 – Individual country CCE estimates for 12 MENA countries for the sulfur dioxide
emissions and potential determinants (1981-2005) Country Y Y
2 Constant
γ1 t-Stat γ2 t-Stat αi t-Stat
Algeria 1.105 2.342 -0.020 -2.513 2.754 2.115
Egypt 2.066 2.949 -1.08 2.569 5.551 2.781
Jordan 1.833 2.679 -0.841 -3.689 4.849 2.898
Lebanon 4.513 4.073 -2.203 -4.253 -4.136 -2.417
Morroco 1.102 3.826 -0.343 -2.598 -0.205 -2.532
Tunisia 1.430 4.218 -0.435 -1.959 5.539 8.508
Bahrain 0.829 3.890 -0.203 -2.335 -3.672 -1.912
Kuwait -5.165 -4.787 2.179 3.405 -14.200 -5.190
UAE -2.310 -2.826 0.778 2.129 11.713 5.117
Oman 4.657 3.571 -1.490 -2.282 5.295 3.616
Qatar -2.964 -2.715 1.813 2.772 -10.205 -5.818
Saudi 1.037 2.465 -0.352 -3.770 -4.734 -4.574
Note the coefficients of the variables tt XandE
1
of equation (2) have not been reported in the table.

12
The results show that there are an inverse U-shaped relationships between per capita
pollution and per capita GDP for all studied MENA countries, expect Kuwait, UAE and
Qatar. For Tunisia, the elasticity is 1.430-0.870Y with the threshold income of 1.644 (in
logarithms). EKC hypothesis seems to hold in this case. We reach the same conclusion in the
case of Egypt. However, for Algeria the elasticity of SO2 emissions per capita with respect to
real GDP per capita in the long-run is 1.105-0.04Y with the threshold income of 27.625 (in
logarithms) which is very high (when transformed in dollars) compared to its level of real
GDP in that period. In contrast, for Saudi Arabia, the elasticity of SO2 emissions with respect
to real GDP is 1.037-0.704Y, implying a threshold income of only 1.473 (in logarithms),
which is very low compared to the Saudi real GDP.
Therefore, we have to point out that for most countries where we found an EKC, we
are confronted to the problem of the position of the threshold compared to the level of real
GDP reached by each country during the period. Our calculations lead us to conclude that
none of the studied cases verified this particular EKC hypothesis except Egypt and Tunisia.
Egypt noticed a remarkable improvement in sulfur dioxide concentrations during the
first years of the 2000, whereas daily average concentrations were ranged between 20-40
μg/m3 which is lower than the limit stated in the Executive Regulation of Environment Law 4
/1994 (150 μg/m3). This improvement is due to the efficient use of fuel in power stations and
industrial sector, reducing diesel fuel usage in these sectors and expands in natural gas usage.
The actions related to rationalisation of energy use in Tunisia were mainly focused on
stepping up the actions of mandatory and periodic energy audits and signing performance
contracts in the industry, transport and services sectors. Since the end of the nineties, pilot
projects in the field of energy conservation were implemented in the housing and services
sectors, and encouraging the use of energy saving equipments, appliances and materials.
Besides, several programmes were pursued in relation to cogeneration in the industry sector,
energy efficiency in street lighting networks, and rationalisation of energy use in the
administration and public facilities. Also, as part of implementing the State policy in the field
of energy substitution and directing consumption towards less costly energy, effort was
invested in pursuing the programme of promoting the use of natural gas as a fuel in the
transport sector and fostering the use of natural gas powered air conditioning in the services
sector.
Finally, the results from the common correlated effects mean group (CCE-MG)
method are reported in Table 4.

13
Table 4 – Results for common correlated effects mean group (CCE-MG) estimations,
12 MENA countries (1981-2005) for SO2 emissions
(1) X= (Y, Y2)
Constant -3.42
(-2.76)
Y 0.250
(5.28)
Y2 -0.027
(-4.37) Note: t-statistics are in parentheses.
The last table shows that the elasticity of SO2 emissions per capita with respect to real
GDP per capita in the long-run is 0.250–0.054Y with the threshold income of 4.630 (in
logarithms), which is not supportive of the EKC hypothesis in the MENA region. This result
was expected given the number of countries producing oil and gas in our sample8.
3.4. Estimation of a panel error-correction model
In the previous sub-section, we have estimated the long-run relationships between S and
Y, Y2 for our panel of 12 MENA countries, using the common correlated effects mean group
(CCE-MG) estimates (see Tables 4). Having established the long-run structure of the
underlying data and given that there exists a long-run relationship for all countries in our four
panel sets, we turn to the estimation of the complete panel error-correction model (PECM)
described by equations (5):
)5(,0
11
1
bXSXSS it
p
j
ititijitj
p
j
jitjit
We use the Pooled Mean Group (PMG) approach of Pesaran, Shin and Smith (1999),
with long-run parameters obtained with CCE techniques, in order to obtain the estimates of
the loading factors λi (weights or error correction parameters, or speed of adjustment to the
equilibrium values), as well as of the short-run parameters βj and θj for each country of our
panel. Consequently, the loading factors and short-run coefficients are allowed to differ across
countries.9
8 The burning of fossil fuels is the most significant source of air pollutants such as SO2, CO, certain nitrous
oxides such as NO and NO2 (known collectively as NOx), SPM, volatile organic compounds (VOCs) and some
heavy metals. It is also the major anthropogenic source of carbon dioxide (CO2), one of the important
greenhouse gases. 9 Note that before considering equation (3), we first used a Wald statistic to test for common parameters across
countries (i.e λi= λ, and γi=γ, for i=1,...,N) with the CCE techniques of Pesaran, (2006), that allow common
factors in the cross-equation covariances to be removed. We found that only the null hypothesis γi=γ, for
i=1,…,N was not rejected by data, whereas the speeds of adjustment λi vary considerably across countries
(results are available upon request).
14
The lag length structure p is chosen using the Schwarz (SC) and Hannan-Quinn (HQ)
selection criteria, and by carrying out a standard likelihood ratio testing-down type procedure
to examine the lag significance from a long-lag structure (started with p=4) to a more
parsimonious one. Afterwards, in order to improve the statistical specification of the model,
we implemented systematically Wald tests of exclusion of lagged variables from the short-run
dynamic (they are not reported here) to eliminate insignificant short-run estimates at the 5%
level. We tested the residuals from each PECM model for the absence of heteroscedasticity,
autocorrelation, and we can report that they are not subject to misspecification. The results of
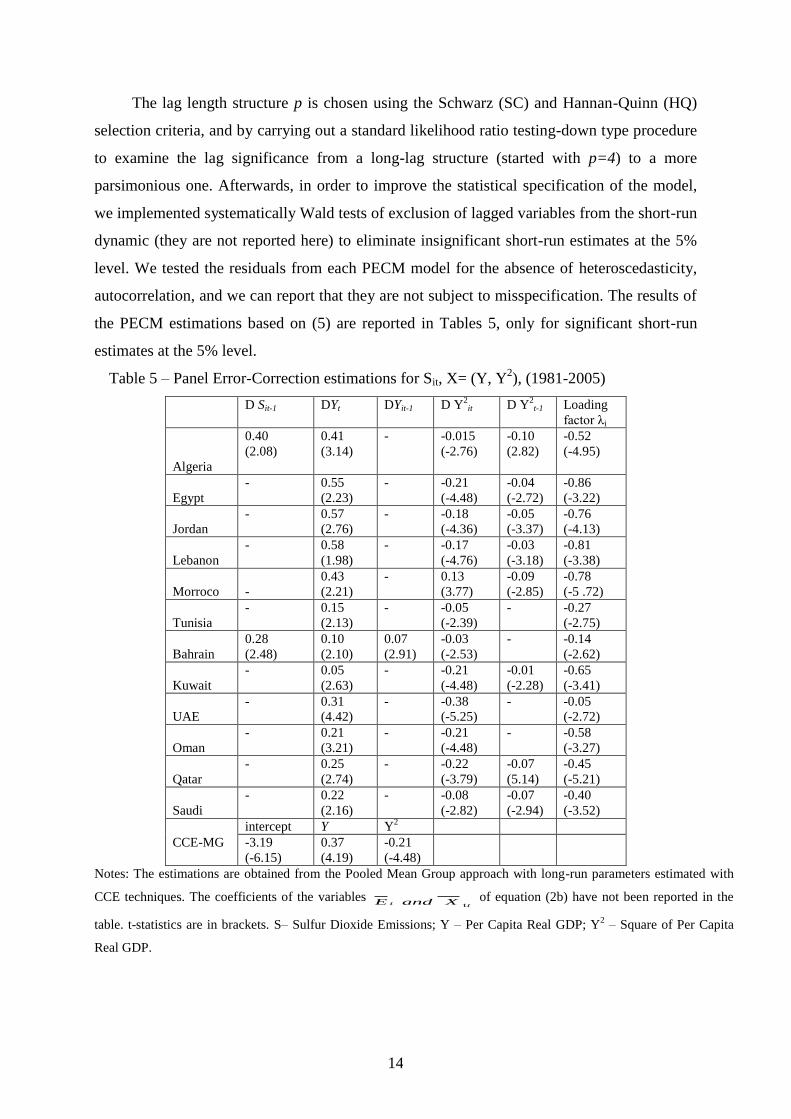
the PECM estimations based on (5) are reported in Tables 5, only for significant short-run
estimates at the 5% level.
Table 5 – Panel Error-Correction estimations for Sit, X= (Y, Y2), (1981-2005)
D Sit-1 DYt DYit-1 D Y2
it D Y2
t-1 Loading
factor λi
Algeria
0.40
(2.08)
0.41
(3.14)
- -0.015
(-2.76)
-0.10
(2.82)
-0.52
(-4.95)
Egypt
- 0.55
(2.23)
- -0.21
(-4.48)
-0.04
(-2.72)
-0.86
(-3.22)
Jordan
- 0.57
(2.76)
- -0.18
(-4.36)
-0.05
(-3.37)
-0.76
(-4.13)
Lebanon
- 0.58
(1.98)
- -0.17
(-4.76)
-0.03
(-3.18)
-0.81
(-3.38)
Morroco
-
0.43
(2.21)
- 0.13
(3.77)
-0.09
(-2.85)
-0.78
(-5 .72)
Tunisia
- 0.15
(2.13)
- -0.05
(-2.39)
- -0.27
(-2.75)
Bahrain
0.28
(2.48)
0.10
(2.10)
0.07
(2.91)
-0.03
(-2.53)
- -0.14
(-2.62)
Kuwait
- 0.05
(2.63)
- -0.21
(-4.48)
-0.01
(-2.28)
-0.65
(-3.41)
UAE
- 0.31
(4.42)
- -0.38
(-5.25)
- -0.05
(-2.72)
Oman
- 0.21
(3.21)
- -0.21
(-4.48)
- -0.58
(-3.27)
Qatar
- 0.25
(2.74)
- -0.22
(-3.79)
-0.07
(5.14)
-0.45
(-5.21)
Saudi
- 0.22
(2.16)
- -0.08
(-2.82)
-0.07
(-2.94)
-0.40
(-3.52)
CCE-MG
intercept Y Y2
-3.19
(-6.15)
0.37
(4.19)
-0.21
(-4.48)
Notes: The estimations are obtained from the Pooled Mean Group approach with long-run parameters estimated with
CCE techniques. The coefficients of the variables tt XandE
1
of equation (2b) have not been reported in the
table. t-statistics are in brackets. S– Sulfur Dioxide Emissions; Y – Per Capita Real GDP; Y2 – Square of Per Capita
Real GDP.

15
Results from Table 5, allow checking for two sources of causation: (1) the lagged difference
terms (short-run causality) and/or (2) the error correction terms (long-run causality). The
causality from GDP to SO2 emissions depend on the level of economic growth. As for the
long-run dynamics, the loading factor, which measures the speed of adjustment back to the
long-run equilibrium value, is significantly negative in all cases confirming that all the
variables of our model move together over the long run. Thus, the long-run equilibrium
deviation has a significant impact on the growth of SO2 emissions.
Table 6 - EKC for SO2 in the MENA region (1981-2005)
Country Intercept Inverted U
shape curve
Turning
point Ymin Ymax EKC
Algeria 1.105 - 0.040 Y Yes Very high 5 530 7 176 No
Egypt 2.066 - 2.160 Y Yes 2 651 2 460 4 318 Yes
Jordan 1.833 - 1.682 Y Yes 2 971 3 032 4 360 No
Lebanon 4.513 - 4.406 Y Yes 2 784 6 565 20 368 No
Morocco 1.102 - 0.686 Y Yes 4 983 2 254 3 588 No
Tunisia 1.430 - 0.870 Y Yes 5 175 3 602 6 444 Yes
Bahrain 0.829 - 0.406 Y Yes 7 706 16 648 28 069 No
Kuwait -5.165 + 4.358 Y No - 22 873 44 354 No
UAE -2.310 + 1.556 Y No - 41 862 90 478 No
Oman 4.657 - 2.980 Y Yes 4 773 10 269 19 544 No
Qatar -2.964 + 3.626 Y No - 43 705 77 232 No
Saudi 1.037 - 0.704 Y Yes 4 362 18 243 34 116 No
12 countries 0.250 - 0.054 Y Yes 102 514 2 254 90 478 No
4. CONCLUSION AND POLICY IMPLICATIONS
Our article had three aims. First, we investigated the existence of EKC for the MENA
region taken as a whole in the matter of Sulfur dioxide. Second, we tested for the existence of
EKC for each country. Finally, we explored the nature of the causality relationship between
economic growth and emissions of SO2. Compared to previous works, we took advantage of
implementing more robust and recent bootstrap unit root tests and panel cointegration
techniques to investigate the relationship between economic growth and SO2 emissions in
MENA countries.
Departing from the hypothesis that the 12 countries are homogenous and looking at the
regional-level, our results reject the EKC hypothesis for the MENA region. This finding can
be explained by at least three complementary arguments. First, although most of MENA

16
countries have built recently a capacity to manage environmental problems and, especially, air
pollution, the non-decline of SO2 emissions as GDP increases may be explained by
corruption (Leitao, 2010). In his study, Leitao found an inverted U-shaped curve between
Sulfur dioxide and economic growth. However, the author suggests that different income-
pollution paths across countries are found due to corruption. Most of the considered countries
perform badly in matter of corruption. While laws in matter of Air pollution exist, the
enforcement of laws and control are ineffective due to corruption.
Second, contrary to CO2 emissions that are more linked to consumer behaviour and are
non-source pollution, SO2 emissions are more closed to producers‟ behaviour and are local
pollutant. The non-decline of SO2 in MENA countries can be explained also by little or
absence of change in matter of adoption of new technologies (end-of-pipe technologies).
While, in OECD countries there is a fall in SO2 emissions due to massive adoption of new
technologies in matter of desulfurization, this is not the case in most of MENA countries.
Changes in the technological behaviour may lead in the near future to a change in the relation
between economic growth and SO2 emissions.
Moreover, the rapid growth of energy demand and especially for electricity generation may
explain poor performances in matter of SO2 reduction in MENA countries. It is well known
that electricity generation plants emit high levels of Sulfur dioxide. MENA countries are
facing or will face shortage in this domain. As Krane (2010) states “for the six states of Golf
Cooperation Council (GCC)…are unable to meet their own fast rising demand for domestic
energy, mainly natural gas feedstock for electricity generation.” These countries are going to
face shortage in the near future due to their fast demand in matter of energy10
. Energy
conservation options are envisaged. Some GCC countries are investing in nuclear power to
generate energy and other MENA countries are investing in renewable energy generation
(Ghaddar, 2010).
Third, most of the considered countries are based on primary sector (Rentier States11
) and
their move toward a service economy is low. They have not yet reached a positive regime
where the effect of growth on SO2 emissions is environmental improving. The economic
composition of these economies is changing slowly. Some non-oil countries like Egypt and
Tunisia are changing their structural economic composition and are performing better than the
other countries in the sample.
10
Qatar is an exception among these countries. 11
The term Rentier States connotes a country that derives most of its national income from the external sale of
natural resources.
17
At the country-level, our results show that EKC is not verified for the studied countries
except Egypt and Tunisia. Our results confirm those by Fodha and Zaghdoudi (2010) using a
different methodology. The authors show an evidence for Sulfur Dioxide EKC for Tunisia.
Their main explanation relies on the enforcement of laws and the effectiveness of the control
of plants, which are responsible of SO2 emissions. The Economic structure of Tunisia
dominated by services may also explain this result. In the case of Egypt, the result is
explained by technological change and adoption of new technologies. In fact, Egypt has
shifted to cleaner technology in matter of electricity generation. Generation plants are more
using gas and less burning oil. This shift and more effective regulation lead to an
improvement of the situation. Our results show that for these two countries the values of the
turning points are very close to those found for OECD countries.
In the case of Gulf Cooperation Council countries (GCC), the shift towards more energy
efficiency could improve their performance (Doukas et al., 2006). These countries are
exploring new policies, but this reorientation has not yet resulted in the development of
consistent strategies and policies (Reiche, 2010). At the same time, one must mention that
several initiatives of renewable energy were taken in Algeria, the kingdom of Saudi Arabia
and other MENA countries like the pioneering project of Masdar Sustainable City12
. These
initiatives are expected to improve the situation in the next years. Actual efforts and policies
changes are not captured by actual statistics and, the EKC is not verified at the country level
in most cases. However, we think that all these initiatives are improving the situation.
REFERENCES.
Akbostancı E. , Turut-Asık S. and Tunç G. (2009): “The relationship between income and
environment in Turkey: Is there an environmental Kuznets curve?”. Energy Policy 37,
861–867.
Arouri M., Ben Youssef A., M‟Henni H. and C. Rault (2012), “Energy Consumption,
Economic Growth and CO2 Emissions in Middle East and North African Countries”, Energy
Policy, Forthcoming.
Arrow K., Bolin B, Costanza R, Dasgupta P, Folke C, Holling C, Jansson B, Levin S, Maler
K, C.Perrings and D.Pimentel (1995),„Economic Growth, Carrying Capacity, and the
Environment, Ecological Economics 15(2), 91–95.
Bai, J., Ng, S. (2004). “A PANIC Attack on Unit Roots and Cointegration”, Econometrica, 72
(4), 127-1177.
12
MENA countries are estimated to have a potential to generate 630,000,000 megawatts of solar power and also
75000 megawatts of wind power potential (Ghaddar, 2009).
18
Campbell, J. and Perron, P. (1991). “Pitfalls and Opportunities: What Macroeconomists
should know about Unit Roots,” in Blanchard, O. and Fisher, S. (eds.), NBER
Macroeconomics Annual. Cambridge, MA: MIT Press.
Caviglia-Harris Jill L., Chambers D. and Kahn James R. (2009): “Taking the “U” out of
Kuznets a comprehensive analysis of the EKC and environmental degradation”.
Ecological Economics 68, 1149-1159.
Chebbi H., Olarreaga M. and Zitouna H. (2009): “Trade openness and CO2 emissions in
Tunisia”. ERF 16th Annual Conference, November 7-9, 2009.
Choi, I. (2006): “Combination Unit Root Tests for Cross-Sectionally Correlated Panels”. In:
Corbae, D., Durlauf, S. and Hansen, B. (eds.), Econometric Theory and Practice:
Frontiers of Analysis and Applied Research: Essays in Honor of Peter C. B. Phillips.
Cambridge University Press, Chap. 11, pp. 311-333.
Dinda, S. (2004): “Environmental Kuznets Curve Hypothesis: A Survey”. Ecological
Economics, 49, 431– 455.
Fodha M. and Zaghdoudi O. (2010): “Economic growth and environmental degradation in
Tunisia: An empirical analysis of the environmental Kuznets curve”. Energy Policy 38
(2010) 1150–1156.
Grossman, G. and Krueger A (1995):„Economic Growth and the Environment, The Quarterly
Journal of Economics, 110(2), 353–377.
Im K., Pesaran M. and Shin, Y. (2003): “Testing for unit roots in heterogeneous panels”,
Journal of Econometrics”, 115, 53-74.
Karshenas, M. (1992): “Environment, development and employment: Some conceptual
issues”. in A. S. Bhalla (ed.), Environment, Employment and Development, 11-10.
Geneva: International Labour Office, World Employment Programme.
Kaufmann R K , Davidsdottir B , Garnham S, Pauly P (1998) . “The determinants of
atmospheric SO2 concentrations: reconsidering the environmental Kuznets curve”,
Ecological Economics 25 , 209–220
Levin, A., Lin, C.-F. and Chu, C.-S. (2002). “Unit Root Tests in Panel Data: Asymptotic and
Finite Sample Properties”, Journal of Econometrics, 108 (1), 1-24.
Leybourne, S. (1995). “Testing for unit roots using forward and reverse Dickey–Fuller
regressions”, Oxford Bulletin of Economics and Statistics 57 (4), 559–571.
Markandya A, Golub A and Pedroso-Galinato S. (2006) “Empirical Analysis of National
Income and SO2 Emissions in Selected European Countries”, Environmental & Resource
Economics, 35:221–257.
Maddala, G. and Wu, S. (1999): “A Comparative Study of Unit Root Tests and a New Simple
Test”. Oxford Bulletin of Economics and Statistics, 61 (1), 631-652.
M‟henni H. (2005): “Economic development, adjustment and environmental quality: the case
of Tunisia for a Contingent Valuation Study”. Mediterranean Journal of Economics,
Agriculture and Environment. Vol.IV-N.2/2005.
McCoskey, S. and Kao, C. (1998): “A Residual-Based Test of the Null of Cointegration in
Panel Data”, Econometric Reviews, 17 (1), 57-84.
Moon, H. and Perron, B. (2004): “Testing for a Unit Root in Panels with Dynamic Factors”,
Journal of Econometrics, 122 (1), 8-126.
19
Muawya Ahmed Hussein, (2008) : "Costs of environmental degradation: An analysis in the
Middle East and North Africa region", Management of Environmental Quality: An
International Journal, Vol. 19 Iss: 3, pp.305 - 317
Müller-Fürstenberger G. and Wagner M. (2007): “Exploring the environmental Kuznets
hypothesis: Theoretical and econometric problems”. Ecological Economics, 62, 648-660.
Panayotou, T. (1997):„Demystifying the Environmental Kuznets Curve: Turning a Black Box
into a Policy Tool‟, Environment and Development Economics 2, 465–484.
Pesaran, M.H. and R. Smith (1995): “Estimating long-run relationships from dynamic
heterogeneous panels”, Journal of Econometrics, 68, 79-113.
Pesaran, M.H., Shin Y.C., and R. Smith (1999): “Pooled mean group estimation of
dynamic heterogeneous panels,” Journal of the American Statistical Association, 94
(446): 621-634.
Pesaran, M. (2004) : “General Diagnostic Tests for Cross Section Dependence in Panels”.
Cambridge Working Papers in Economics 435, and CESifo Working Paper Series 1229.
Pesaran, M.H. (2006): “Estimation and inference in large heterogenous panels with
multifactor error structure”, Econometrica, 74, 967-1012.
Pesaran, M. (2007): “A Simple Panel Unit Root Test in the Presence of Cross-Section
Dependence”. Journal of Applied Econometrics, 22, 265-312.
Sari, R. and Soytas, U. (2009): “Are global warming and economic growth combatable?
evidence from five OPEC countries”. Applied Energy, 86, 1887-1893.
Selden T. and Song D. (1994): “Economic growth and environmental quality: is there a
«Kuznets» curve for air pollution emissions?”. Journal of Environmental Economics and
Management. N°27. 147-162.
Shafik N. and S. Bandyopadhyay (1992):„Economic Growth and Environmental Quality,
Background Paper for the 1992 World Development Report and World Bank Policy
Research Working Paper No. 904. Washington, DC: The World Bank.
Stern D. (1998): Progress on the Environmental Kuznets Curve?, Environment and
Development Economics 3, 173–196.
Stern, D. and M.Common (2001), „Is there an Environmental Kuznets Curve for Sulfur?,
Journal of Environmental Economics and Management 41, 162–178.
Smith V., Leybourne, S. and Kim T.-H. (2004): “More Powerful Panel Unit Root Tests with
an Application to the Mean Reversion in Real Exchange Rates”, Journal of Applied
Econometrics, 19, 147–170.
Solo, V. (1984): “The order of differencing in ARIMA models”, Journal of the American
Statistical Association, 79, 916-921.
Stern D.I. (2004): “The Rise and fall of the Environmental Kuznets Curve”. World
Development, Vol. 32, No. 8, 1419–1439.
Westerlund, J. and Edgerton, D. (2007). “A Panel Bootstrap Cointegration Test”, Economics
Letters 97, 185-190.
Recommended