Electronic copy available at: http://ssrn.com/abstract=2049658Electronic copy available at: http://ssrn.com/abstract=2049658
EMPIRICAL ANALYSIS OF RACE AND THE
PROCESS OF CAPITAL PUNISHMENT IN NORTH
CAROLINA
Isaac Unah†
2011 MICH. ST. L. REV. __
TABLE OF CONTENTS
ABSTRACT ...................................................................................................... 2 INTRODUCTION ............................................................................................... 2 I. THE PREMISE OF THIS STUDY .................................................................... 3 II. RACIAL DISCRIMINATION AND THE DEATH PENALTY IN NORTH
CAROLINA ................................................................................................ 6 A. Why Study North Carolina? ............................................................ 9
III. A PROCESS THEORY OF CAPITAL PUNISHMENT .................................... 10 A. Racial Threat, Class Struggle, and Other Socio-Structural
Explanations of Capital Punishment .............................................. 12 B. Formal Legal Factors ..................................................................... 19 C. Institutional Factors ....................................................................... 23
IV. RESEARCH DESIGN ............................................................................... 26 V. RESULTS .................................................................................................. 28
A. Categorical Analysis ...................................................................... 29 B. Heckman Probit Analysis .............................................................. 32
1. Race and Prosecutorial Decision to “Go for Death.” ............. 32 2. The Decision to Impose Capital Punishment ........................... 42
A. The Effects of Race and Other Socio-structural Factors on Capital
Punishment .................................................................................... 42 B. Effects of Institutional Factors on Capital Punishment .................. 44 C. The Effects of Legal Factors on Capital Punishment ...................... 45
CONCLUSIONS .............................................................................................. 47
† Associate Professor, Department of Political Science, University of North Caro-
lina, Chapel Hill; [email protected]. I am deeply grateful to several individuals who contributed
to this project. Jack Boger, Dean of the UNC School of Law, contributed mightily, and I am
grateful for his sage advice throughout this project. The late David Baldus was an inspiration.
I am grateful for his encouragement and for his willingness to share his extensive data collec-
tion instrument with me and to comment on various aspects of this project. I received useful
feedback from George Rabinowitz, Christopher Zorn, Stuart Macdonald, and Virginia Gray
and colloquium participants at the Social, Behavioral, and Economic Sciences Division of
the National Science Foundation and at the UNC Chapel Hill School of Law. I thank Mere-
dith Nicholson (project manager) and several other graduates of UNC-Chapel Hill School of
Law for assisting with the data collection. Finally, I thank Sarah Primrose for superb editorial
assistance.
Electronic copy available at: http://ssrn.com/abstract=2049658Electronic copy available at: http://ssrn.com/abstract=2049658
2 Michigan State Law Review
APPENDIX A: DATA SOURCES AND MEASUREMENTS .................................. 48 APPENDIX B: MULTI-STAGE STATISTICAL SAMPLING ................................. 51
ABSTRACT
The process of determining recipients of capital punishment in the
United States involves sequential stages of decision making by the prosecu-
tor and jury. In this Article, I argue in favor of modeling capital punishment
as a process rather than simply as an outcome by decomposing the various
stages of decision making. Using a Heckman procedure along with a rich
criminal prosecution and sentencing dataset from North Carolina, I analyze
the potential influence of race in the application of the death penalty. The
results indicate that despite structural reforms designed to minimize its poli-
cy effects, race still plays a crucial role in determining capital punishment.
This key result was obtained even after controlling for numerous legal fac-
tors sanctioned by the North Carolina General Assembly, institutional fac-
tors connected to the political process, and structural factors involving vic-
tims, defendants, and their backgrounds. More importantly, the analysis
points to the jury stage as the place where racial discrimination in capital
punishment is most acute.
INTRODUCTION
The question of whether people should be put to death by the state is
of great social and political consequence and is sharply debated in both
scholarly and public arenas.1 Yet no serious proponent of capital punish-
ment argues that its application should be racially biased. Indeed, persistent
racial bias in capital prosecution and sentencing would devalue the death
penalty as a just form of social control, not only in the United States, but
worldwide. As Justice Anthony Kennedy stated in Edmonson v. Leesville
Concrete Company, “Racial bias mars the integrity of the judicial system
and prevents the idea of democratic government from becoming a reality.”2
Whereas scholars have traditionally examined capital punishment as
an outcome by focusing on its incidence on various social and ethnic
groups,3 I think that this distributive strategy is unproductive. It undermines
1. DEBATING THE DEATH PENALTY (Hugo Adam Bedau & Paul G. Cassell eds.,
2004); William C. Bailey & Ruth D. Peterson, Murder, Capital Punishment, and Deterrence:
A Review of the Evidence and an Examination of Police Killings, 50 J. SOC. ISSUES 53
(1994); Thomas J. Keil & Gennaro F. Vito, Race, Homicide Severity, and Application of the
Death Penalty: A Consideration of the Barnett Scale, 27 CRIMINOLOGY 511 (1989).
2. 500 U.S. 614, 628 (1991).
3. Raymond Paternoster, Prosecutorial Discretion in Requesting the Death Penal-
ty: A Case of Victim-Based Racial Discrimination, 18 LAW & SOC’Y REV. 437 (1984); Shel-

Article Title 3
our ability to gain a better understanding of the dynamics of race as an im-
portant and controversial factor in the disposition of death penalty cases,
and it stifles public discourse surrounding crime policy and punishment. By
focusing narrowly on outcomes rather than on process, scholars very often
ignore important decisional events of low visibility that take place at earlier
stages of capital prosecution but are connected to later stages within a much
broader and complex process. Events such as the prosecutor’s decision to
“go for death” may well hold information that can advance our understand-
ing about the contours of discrimination in modern criminal punishment and
help us to pinpoint where discrimination largely resides in the capital prose-
cution process. Ultimately, this can both inform and guide how social scien-
tists and legal scholars can provide valuable counsel to policy makers and
help them to improve social justice.
I. THE PREMISE OF THIS STUDY
As American states have become more multiracial and multiethnic
conglomerations over the last twenty years, the significance of investigating
the linkages between racial and ethnic membership, political ideology, and
death penalty processing is increasingly being recognized in criminologi-
cal,4 political science,5 sociological,6 and legal communities.7 One common
theoretical dimension of these analyses is the recognition of juridical pun-
ishment as a political construction. Criminological theorist Michel Foucault
calls it “a political tactic,”8 and David Garland describes it as an “apparatus
of power and control,”9 which is situated within an interconnected field of
power relations aimed at achieving social solidarity and order. Within this
understanding of punishment, the role of electoral ideology in shaping death
don Eckland-Olson, Structured Discretion, Racial Bias, and the Death Penalty: The First
Decade after Furman in Texas, 69 SOC. SCI. Q. 853 (1988).
4. John K. Cochran & Mitchell B. Chamlin, The Enduring Racial Divide in Death
Penalty Support, 34 J. CRIM. JUST. 85 (2006); DAVID GARLAND, THE CULTURE OF CONTROL:
CRIME AND SOCIAL ORDER IN CONTEMPORARY SOCIETY (2001).
5. David C. Nice, The States and the Death Penalty, 45 W. POL. Q. 1037 (1992).
6. David Jacobs et al., Vigilantism, Current Racial Threat, and Death Sentences,
70 AM. SOC. REV. 656 (2005); Jonathan Simon & Christina Spaulding, Tokens of Our Es-
teem: Aggravating Factors in the Era of Deregulated Death Penalties, in THE KILLING
STATE: CAPITAL PUNISHMENT IN LAW, POLITICS, AND CULTURE 81 (Austin Sarat ed., 1999).
7. DAVID C. BALDUS ET AL., EQUAL JUSTICE AND THE DEATH PENALTY: A LEGAL
AND EMPIRICAL ANALYSIS (1990); SAMUEL R. GROSS & ROBERT MAURO, DEATH AND
DISCRIMINATION: RACIAL DISPARITIES IN CAPITAL SENTENCING (1989); Michael J. Songer &
Isaac Unah, The Effect of Race, Gender, and Location on Prosecutorial Decision to Seek the
Death Penalty in South Carolina, 58 S.C. L. REV. 161 (2006).
8. MICHEL FOUCAULT, DISCIPLINE AND PUNISH: THE BIRTH OF THE PRISON 23 (Alan
Sheridan trans., Vintage Books 2d ed. 1995) (1977).
9. DAVID GARLAND, PUNISHMENT AND MODERN SOCIETY 2 (1990).
4 Michigan State Law Review
penalty decision making is enhanced by the visibility and salience of crime
since the 1970s. Empirical evidence shows that when an issue gains in polit-
ical salience, public and elected officials are likely to cultivate an accurate
perception of public desires and develop incentives to respond even if for
the sake of political self-preservation.10
Another important theoretical dimension of the literature on judicial
punishment focuses on race as a symbol of social class conflict in which
economic inequality that is usually associated with African Americans and
other racial minorities threatens the interest of the powerful and politically
well-connected, leading to escalation in punishment in order to control these
members of the lower socioeconomic class.11 Further linkage between race
and the death penalty is provided by the controversy over whether racial
diversity enhances the appeal of capital punishment. For example, the inci-
dence of capital punishment is found disproportionately in southern states,
which are more racially heterogeneous than in northern states, which are
more racially homogeneous.12 Although early research reported that black
defendants were excessively more likely to be discriminated against in capi-
tal prosecution and punishment than their white counterparts,13 more con-
temporary evidence suggests something different.
One of the earliest examples is the Baldus Study,14 which used Geor-
gia death penalty data from 1973 through 1978 to examine the impact of
race in capital sentencing.15 Relying upon several independent models to
evaluate specific stages of capital prosecution, the study reported strong
race-of-victim discrimination in the application of capital punishment.16
Race-of-defendant effects were anemic. These outcomes were specifically
attributed to the discretionary choices exercised by district attorneys in
10. Robert Erikson et al., Knowing One’s District: How Legislators Predict Refer-
endum Voting, 19 AM. J. POL. SCI. 231 (1975).
11. HUBERT M. BLALOCK, JR., TOWARD A THEORY OF MINORITY GROUP RELATIONS,
(1967); AUSTIN TURK, CRIMINALITY AND LEGAL ORDER (1969); Allen E. Liska & Mitchell B.
Chamlin, Social Structure and Crime Control Among Macrosocial Units, 90 AM. J. SOC. 383
(1984).
12. Thomas J. Keil & Gennaro F. Vito, The Effects of the Furman and Gregg Deci-
sions on Black-White Execution Ratios in the South, 20 J. CRIM. JUST. 217 (1992); Marian R.
Williams & Jefferson E. Holcomb, Racial Disparity and Death Sentences in Ohio, 29 J.
CRIM. JUST. 207 (2001); Ernie Thomson, Discrimination and the Death Penalty in Arizona.
22 CRIM. JUST. REV. 65 (1997).
13. Marvin E. Wolfgang & Marc Riedel, Race, Judicial Discretion, and the Death
Penalty, 407 ANNALS AM. ACAD. POL. & SOC. SCI. 119 (1973).
14. BALDUS ET AL., supra note 7.
15. Id. at 2; see also id. ch. 5-7.
16. Id. at 154 (“[T]he odds of receiving a death sentence for the average defendant
whose victim was white were 4.3 times greater than those of a similarly situated defendant
whose victim was black, a disparity that was statistically significant at the .001 level.”).

Article Title 5
Georgia in both the early and later stages of the death penalty process.17 But
while the Baldus Study is truly seminal in its contributions, the analytical
method employed failed to capture the truly sequential character of the
death penalty process. In this Article, I present an alternative conceptualiza-
tion of capital punishment not as an outcome but as a process.
With more than thirty years since the time period examined by Baldus
and his colleagues, there are impressive signs throughout American society
that racial attitudes are changing fundamentally. Surprisingly, no large-scale
empirical reexamination of the death penalty in the South based on first-
hand data exists, except in Maryland,18 where the prevailing political culture
is actually more consistent with northern liberalism than with southern con-
servatism. This study is, therefore, important not only because it fills that
void by focusing on North Carolina, but because geographic and cultural
differences among states introduce the possibility that the conclusions of the
Baldus Study may not transfer to states outside Georgia. Furthermore, the
changing political and cultural climates in the United States suggest that the
findings may no longer hold. Only through careful and detailed study em-
ploying data from a more contemporary period can we reevaluate the race-
and-death-penalty linkage. Indeed, my study provides reasons to believe
that prosecutors are more race-neutral in the 1990s than they were when
Baldus and his colleagues first conducted their study. Adaptation to a new
political landscape that includes politically attuned and active minority vot-
ing populations makes this insight plausible.
I analyze capital punishment as a political process consisting of se-
quential decisions by the prosecutor and jury. By decomposing the process
into several interconnecting, rather than independent, stages of analysis, I
move the literature beyond distributive results to distinguish a more com-
plex and nuanced decision-making outcome within the capital prosecution
process. This will allow social scientists and legal scholars to determine
whether racial discrimination, the most politically controversial and multi-
faceted aspect of the death penalty, continues to play an illegitimate role.
While researchers continue to debate the intensity of racism in American
society, particularly in the South,19 widespread agreement exists that genera-
tional change as well as legal and social pressures have calmed the once
overtly racist tendencies of southern whites. That prevailing sentiment
17. Id. at 328 (“The overall conclusion suggested by the data, therefore, was that the
race-of-victim effects in death sentencing observed among defendants indicted for murder
were attributable principally to prosecutorial decisions made both before and after trial.”).
18. Raymond Paternoster et al., Justice by Geography and Race: The Administration
of the Death Penalty in Maryland, 1978-1999, 4 U MD. L.J. ON RACE, RELIGION, GENDER, &
CLASS 1 (2004).
19. Glenn Firebaugh & Kenneth Davis, Trends in Antiblack Prejudice, 1972-1984:
Region and Cohort Effects, 94 AM. J. SOC. 251 (1988); James H. Kuklinski et al., Racial
Attitudes and the ‘New South,’ 59 J. POL. 323 (1997).

6 Michigan State Law Review
across the South is captured by the descriptive title of an empirical study of
racial discrimination in Panola County, Mississippi, which proclaims: “WE
AIN’T WHAT WE WAS.”20
In the research reported here, I address three important questions that I
think can shed new light on the debate surrounding the role of race in capi-
tal punishment. First, does race still contribute significantly to the decision
to prosecute and impose the death penalty in a southern state such as North
Carolina? Second, looking beyond race, what are the most important struc-
tural, institutional, and legal factors that account for the observed variation
in capital prosecution and sentencing? Finally, to what extent do statutory
mitigating factors actually mitigate death sentences?
To address these questions, I collected data from eighty of the one
hundred counties in North Carolina principally involving murders with
known defendants committed between January 1, 1993, and December 31,
1997. Currently thirty-six other states and the federal government also im-
pose death sentences for murder.21 Thus, while my findings are most ger-
mane to North Carolina, they may very well have implications for how we
understand the influence of race in modern prosecutorial strategy and in
capital jury decision making nationwide.
II. RACIAL DISCRIMINATION AND THE DEATH PENALTY IN NORTH
CAROLINA
North Carolina is among several states that maintain hegemony in the
use of capital punishment in the United States. According to the state de-
partment of public safety, between 1910 and 2008, North Carolina executed
391 individuals in Central Prison.22 Figure 1 presents the breakdown of the-
se executions by period, coupled with the racial differentiation of the cur-
rent death row population. Although African Americans comprise twenty-
three percent of the state’s total civilian population, they make up fifty-two
percent of inmates on death row.23 There are four women currently on death
20. FREDERICK M. WIRT, “WE AIN’T WHAT WE WAS”: CIVIL RIGHTS IN THE NEW
SOUTH (1997).
21. Tracy L. Snell, Capital Punishment, 2010-Statistical Tables, U.S. DEP’T JUSTICE,
BUREAU OF JUSTICE STATISTICS, Table 2 (Dec. 2011), http://www.bjs.gov/content/pub/pdf/
cp10st.pdf.
22. N.C. DEP’T OF PUB. SAFETY, http://www.doc.state.nc.us/dop/deathpenalty/
personsexecuted.htm (last visited Mar. 23, 2012).
23. As of March 20, 2012, there are 157 offenders on death row. Offenders on Death
Row, N.C. DEP’T OF PUB. SAFETY, http://www.doc.state.nc.us/dop/deathpenalty/
deathrow.htm (last visited Mar. 23, 2012). Of these, eight-two are black (fifty-two percent),
according to the N.C. Department of Public Safety. Id.
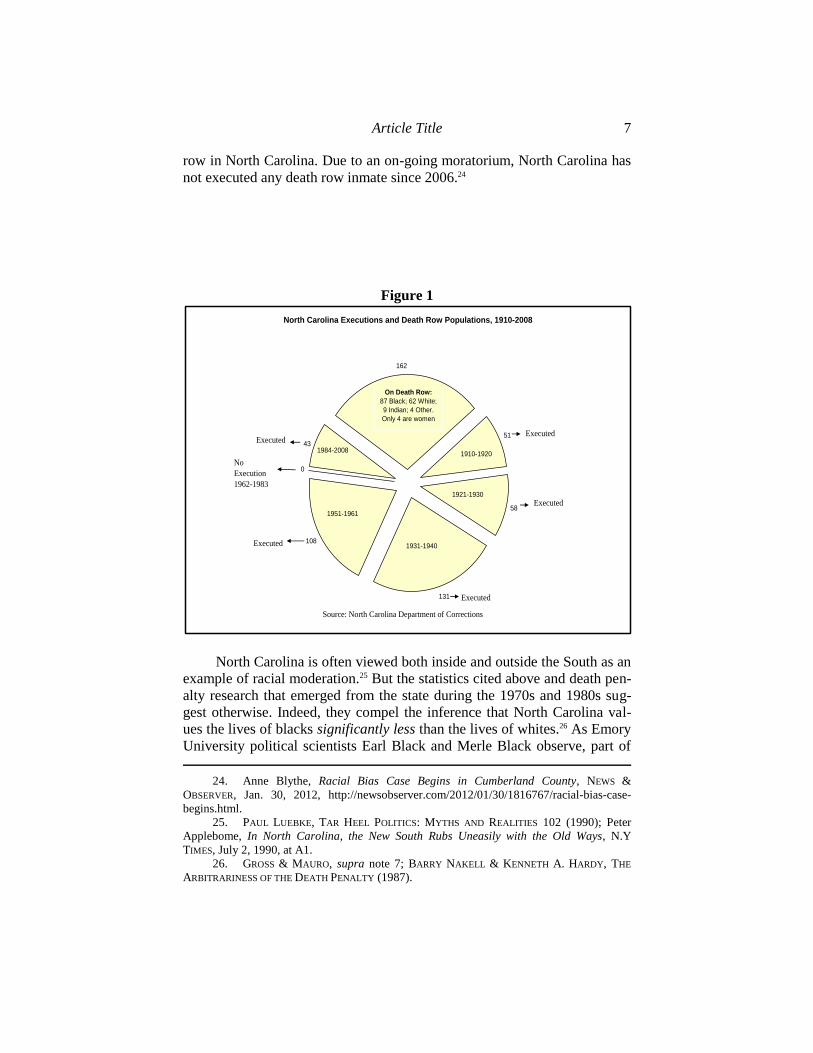
Article Title 7
row in North Carolina. Due to an on-going moratorium, North Carolina has
not executed any death row inmate since 2006.24
Figure 1
North Carolina Executions and Death Row Populations, 1910-2008
51
58
131
108
0
162
43
On Death Row:
87 Black; 62 White;
9 Indian; 4 Other.
Only 4 are women
1910-1920
Executed
Executed
Executed
1931-1940
1951-1961
1984-2008
No
Execution
1962-1983
Executed
Executed
1921-1930
Source: North Carolina Department of Corrections
North Carolina is often viewed both inside and outside the South as an
example of racial moderation.25 But the statistics cited above and death pen-
alty research that emerged from the state during the 1970s and 1980s sug-
gest otherwise. Indeed, they compel the inference that North Carolina val-
ues the lives of blacks significantly less than the lives of whites.26 As Emory
University political scientists Earl Black and Merle Black observe, part of
24. Anne Blythe, Racial Bias Case Begins in Cumberland County, NEWS &
OBSERVER, Jan. 30, 2012, http://newsobserver.com/2012/01/30/1816767/racial-bias-case-
begins.html.
25. PAUL LUEBKE, TAR HEEL POLITICS: MYTHS AND REALITIES 102 (1990); Peter
Applebome, In North Carolina, the New South Rubs Uneasily with the Old Ways, N.Y
TIMES, July 2, 1990, at A1.
26. GROSS & MAURO, supra note 7; BARRY NAKELL & KENNETH A. HARDY, THE
ARBITRARINESS OF THE DEATH PENALTY (1987).

8 Michigan State Law Review
the explanation is regional: “[O]ld southern politics was transparently un-
democratic and thoroughly racist.”27 Overt racism is, at the very least, partly
responsible for the sentencing disparities reported among whites and
nonwhites throughout North Carolina before 1980. For example, two UNC-
Chapel Hill professors Barry Nakell and Kenneth Hardy reported that the
death penalty was imposed on black defendants with significantly higher
frequency than on whites charged with comparable offenses and that the
death penalty was used as a policy instrument for controlling the behavior
of blacks.28
Institutional reforms prompted by the civil rights movement, including
the Civil Rights Act of 1964, the Voting Rights Act of 1965, and Supreme
Court decisions such as Furman v. Georgia,29 were intended to challenge
racial injustices and to require fundamental change in racial attitudes in
government, including the introduction of structured sentencing that ac-
counts for aggravating and mitigating circumstances in death sentencing.
Indications are that these reforms have yielded results, showing a transfor-
mation in the contours of North Carolina politics.30
And so, despite the vitriolic cast of North Carolina’s race politics ex-
emplified by the late Senator Jesse Helms, a significant upswing in race
relations is manifested in the election of several African Americans to the
state legislature and to various judgeships, including the chief justice of the
state supreme court.31 But disagreement remains about the degree to which
racial attitudes have been transformed at the individual level, which is
where important jury decisions are made.32 Whereas some scholars have
27. EARL BLACK & MERLE BLACK, THE RISE OF SOUTHERN REPUBLICANS 3 (2002).
28. NAKELL & HARDY, supra note 26; Wolfgang & Riedel, supra note 13.
29. 408 U.S. 238 (1972).
30. Charles Prysby, North Carolina: Two-Party Competition Continues into the
Twenty-first Century, in THE NEW POLITICS OF THE OLD SOUTH: AN INTRODUCTION TO
SOUTHERN POLITICS 170 (Charles S. Bullock III & Mark J. Rozell, eds., 3d ed. 2007).
31. In 1995, twelve percent of judges in North Carolina were African American or
Native American. Jack Betts, The Debate over Merit Selection of Judges, in NORTH
CAROLINA FOCUS: AN ANTHOLOGY ON STATE GOVERNMENT, POLITICS, AND POLICY 322
(Mebane Rash Witman & Ran Coble eds., 2006) [hereinafter NORTH CAROLINA FOCUS]. In
1999, Henry Frye became the first African American chief justice of the N.C. Supreme
Court. Tom Lawrence, Frye Sworn in as First Black N.C. Chief Justice, WRAL.COM, Sept.
6, 1999, http://www.wral.com/news/local/story/136109/. Between 1900 and 1968 no African
American was elected to the N.C. legislature. Milton C. Jordan, African American Legisla-
tors: From Political Novelty to Political Force, in NORTH CAROLINA FOCUS, supra, at 211.
This changed in 1969 when one African American was elected and served in the legislature.
Id. In 1979, that number increased to six. Id. In 1989, nineteen African Americans served in
the state legislature and in 1999, twenty-four African Americans served in the state legisla-
ture. Id.; TYSON KING-MEADOWS & THOMAS F. SCHALLER, DEVOLUTION AND BLACK STATE
LEGISLATORS: CHALLENGES AND CHOICES IN THE TWENTY-FIRST CENTURY 13 (2006).
32. For example, as early as the 1980s, researchers reporting significant positive
change in racial attitudes in the South include Firebaugh & Davis, supra note 19. Research-
Article Title 9
proclaimed the emergence of a “New South,” characterized by a progressive
attitude toward race relations,33 skeptics maintain that through unobtrusive
measures of racial attitude, in which white respondents are persuaded “that
they can express hostility toward blacks without anyone’s being aware that
they have done so,” racism remains high in North Carolina and in other
southern states, especially among white southern men.34
A. Why Study North Carolina?
North Carolina provides an excellent setting for studying the linkages
between race and capital punishment. For one thing, North Carolina is one
of the leading death penalty states.35 According to Blume, Eisenberg, and
Wells, North Carolina has the fourth largest number of death row inmates
and ranks among the top ten in the number of blacks sentenced to death.36
Second, over ninety-five percent of prosecutors in North Carolina are whites
who were elected through district-level elections.37 These are characteristics
shared by most other prosecutors nationwide.38 Finally, V.O. Key’s pene-
trating analysis of southern cultures and politics in 1949 revealed the im-
portance of intra-regional variation in the intensity of racism among South-
ern states.39 Key singled out North Carolina as the most presentable “pro-
gressive plutocracy,”40 a state that held promise to be “something of a living
ers finding little evidence of regional convergence of racial attitude between southern and
northern whites include Charlotte Steeh & Howard Schuman, Young White Adults: Did Ra-
cial Attitudes Change in the 1980s?, 98 AM. J. SOC. 340 (1992).
33. Firebaugh & Davis, supra note 19.
34. Kuklinski et al., supra note 19, at 327.
35. From the first known execution in North Carolina on August 26, 1726, to Octo-
ber 27, 1961, there were 784 executions, which ranks North Carolina as fifth nationwide,
behind Virginia, New York, Pennsylvania, and Georgia. Michael L. Radelet & Glenn L.
Pierce, Race and Death Sentencing in North Carolina, 1980-2007, 89 N.C. L. REV. 2119,
2124 (2011) (citing Executions in the United States, 1608-1976, By State, DEATH PENALTY
INFO. CENTER, http://www.deathpenaltyinfo.org/executions-united-states-1608-1976-state
(last visited Jan. 23, 2012)).
36. John Blume, Theodore Eisenberg & Martin T. Wells, Explaining Death Row’s
Population and Racial Composition, 1 J. EMPIRICAL LEGAL STUD. 165, 172 tbl. 1, 188 tbl. 5
(2004).
37. Matthew Robinson, Face Up to the Facts and End the Death Penalty, NEWS &
OBSERVER, Mar. 16, 2011, http://www.newsobserver.com/2011/03/16/1056240/face-up-to-
the-facts-and-end-the.html.
38. A Federal Bureau of Justice Statistics Report in 1994 found that ninety-five
percent of chief prosecutors nation-wide are elected locally. CAROL J. DEFRANCIS, STEVEN K.
SMITH & LOUISE VAN DER DOES, BUREAU OF JUSTICE STATISTICS, BULLETIN: PROSECUTORS IN
STATE COURTS, 1994, NCJ-151656, 1, http://bjs.ojp.usdoj.gov/content/pub/pdf/Pisc94.pdf.
39. V.O. KEY, JR., SOUTHERN POLITICS IN STATE AND NATION (1949).
40. Id. at 205.
10 Michigan State Law Review
answer to the riddle of race.”41 I think Key’s insight remains relevant as I
seek to gauge the state’s racial progress in the prosecution of society’s most
heinous offenses. While North Carolina does not represent the entire South
in all cultural dimensions, I think that the state’s inclination toward racial
moderation might serve as a harbinger of good things to come in the region
regarding the interconnections between race and criminal justice policy. For
these reasons, I think my findings are generalizable to other death penalty
jurisdictions across the nation.
Does race still contribute substantially to the application of capital
punishment in North Carolina? Answering this question is the centerpiece
of my study. Criminal prosecutions in North Carolina follow a judicially
mandated bifurcated trial scheme, requiring the weighing of aggravating
and mitigating circumstances before imposition of a death sentence.42 In the
next section, I detail my theoretical framework through which I hope to
make a contribution to the discussion of criminal punishment.
III. A PROCESS THEORY OF CAPITAL PUNISHMENT
My theoretical argument is that capital punishment is properly under-
stood as a process that encompasses three sets of decision-theoretic factors.
Socio-structural factors underscore the racial threat argument and so em-
phasize personal socio-demographic attributes, such as race and socioeco-
nomic status (SES) of victims, defendants, and the local communities in
which a death-worthy crime may have been committed. Formal legal fac-
tors are alternative systemic mechanisms of control that focus on rules es-
tablished by the state to communicate the preferences and values of the
people through their elected representatives. These legal factors usually
target the severity of the crime and past criminal history of defendants. Fi-
nally, institutional factors emphasize the extent to which capital punishment
is embedded within the political process. The factors include political incen-
tives, electoral ideology, and process-oriented characteristics of pivotal ac-
tors within the criminal justice system, such as prosecutors and defense at-
torneys.
I assert that, to varying degrees, these theoretical factors operate sim-
ultaneously at each of the various stages of criminal prosecution from in-
dictment to sentencing. Specifically, I identify two main sequential stages of
capital prosecution. The first is the pretrial/discovery stage, which features
the local criminal prosecutor who exercises untrammeled authority to de-
termine what charges to bring and what prosecutorial strategy to adopt. The
second, trial/post-trial, stage features the petit jury, which determines guilt
41. Jack Bass & Walter DeVries, North Carolina: The Progressive Myth 1976, in
NORTH CAROLINA FOCUS, supra note 31, at 25, 39.
42. N. C. GEN.STAT. § 15A-2000 (2011).

Article Title 11
and pronounces the sentence. In each of these two stages of criminal proce-
dure, I analyze the interconnected decisions of the respective judicial offic-
ers as reflected in the actual flow of cases within the judicial system.
In my theoretical framework, I take as given two important truisms.
The first is that all homicide suspects processed through the justice system
have been formally indicted. The second is that the prosecutor is confronted
with multiple alternative choices at each stage of the process. Therefore, I
begin my analysis with the plea-bargaining decision, which the prosecutor
can make under the assumption that, on balance, the defendant will seek a
plea arrangement to avoid the uncertainty of trial and a possible death sen-
tence. Here, the prosecutor’s choice option is either to accept or reject a plea
deal. Thus, the dependent variable for the initial selection model is the re-
jection or acceptance (1/0) of a plea agreement by the prosecutor, given the
presence of an indictment (). This choice option will determine the out-
come of the last important pretrial decision the prosecutor has to make,
namely, whether to seek the death penalty or not (1/0), given rejection of a
plea agreement and presence of a formal indictment. Thus, I shall estimate
the following conditional probabilities for an indicted suspect:
(1a) P( =1|) → selection model
(1b) P( =1| =1, ) → outcome model,
where = rejection of plea agreement, = indicted suspect, = prosecutor
seeks death.
The second set of models focus on trial/post-trial decision making.
This time the actor in focus is not the prosecutor but the jury. The dependent
variable for the selection model at this stage is whether the defendant was
found guilty at the criminal trial or not (1/0), assuming that the prosecutor
sought the death penalty, rejected a plea agreement, and an indictment was
announced. For the outcome model the dependent variable is whether the
defendant was sentenced to death or life in prison without parole, assuming
a conviction was obtained. I shall estimate the following corresponding
conditional probabilities:
(2a) P(=1 | =1, =1, ) → selection model
(2b) P(=1 | =1) → outcome model,
where = conviction, = prosecutor seeks death, = rejection of plea
agreement, = death penalty.
No previous studies have modeled capital prosecution and punishment
in such a process-oriented framework. Its main advantage is that it accounts
for built-in conditionality in the decisions that prosecutor and jury must
make. I think that my framework represents an improvement over previous

12 Michigan State Law Review
studies because my models closely reflect the complex sequential process
actually used in capital prosecution and sentencing in the United States.43
My theoretical framework permits us to employ a large set of independent
variables to test competing relational explanations about the linkages be-
tween race and the death penalty, and to pinpoint the location of any dis-
crimination that may exist in the system and where it might be most acute. I
now discuss my independent variables and hypotheses.
A. Racial Threat, Class Struggle, and Other Socio-Structural Explanations
of Capital Punishment
The classic racial threat perspective proposes that criminal punishment
will escalate as racially marginal populations increase in a state because of
the potential threat these populations represent to the white majority, and to
existing social, economic, and political arrangements that align with the
majority’s interests.44 Indeed, a sizeable literature finds an association be-
tween the size of the nonwhite population in a state and escalation in overall
punishment severity.45 Accordingly, I would expect black or nonwhite of-
fenders to receive harsher punishment than white offenders, especially when
the victim is white. Furthermore, as the nonwhite population increases in a
community, I expect overall death sentences to rise.
Race-based explanations of criminal punishment further maintain that
criminal justice outcomes are significantly influenced by racial discrimina-
tion among authorities formally entrusted with administering justice, includ-
ing police officers who investigate crimes, district attorneys who prosecute
crimes, and jurors who convict and impose sentences.46 Empirical research
that relied on death penalty outcome data from before 1970 emphasized the
criminal defendant’s race as the key correlate of capital punishment because
43. Contra BALDUS ET AL., supra note 7; GROSS & MAURO, supra note 7; Paternoster
et al., supra note 18.
44. BLALOCK, JR., supra note 11, at 29-31.
45. Jeff Yates & Richard Fording, Politics and State Punitiveness in Black and
White, 67 J. POL. 1099 (2005); Stewart E. Tolnay & E.M. Beck, Toward a Threat Model of
Southern Black Lynchings, in SOCIAL THREAT AND SOCIAL CONTROL 36 (Allen E. Liska ed.,
1992); David Jacobs & Jason T. Carmichael, The Political Sociology of the Death Penalty: A
Pooled Time-Series Analysis, 67 AM. SOC. REV. 109 (2002); BRUCE WESTERN, PUNISHMENT
AND INEQUALITY IN AMERICA (2006).
46. William J. Bowers & Glenn L. Pierce, Arbitrariness and Discrimination under
Post-Furman Capital Statutes, 26 CRIME & DELINQUENCY 563 (1980); Michael L. Radelet &
Glenn L. Pierce, Race and Prosecutorial Discretion in Homicide Cases, 19 L. & SOC’Y REV.
587 (1985); GROSS & MAURO, supra note 7, at 110-15; Paternoster, supra note 3; James D.
Unnever, Two Worlds Far Apart: Black-White Differences in Beliefs About Why African-
American Men are Disproportionately Imprisoned, 46 CRIMINOLOGY 511, 511-37 (2008)
(finding that the views held by African Americans about criminal punishment are shaped by
“their personal experiences with racial discrimination” in the criminal justice system).

Article Title 13
state officials used the death penalty as the premiere instrument of social
control over blacks.47 In North Carolina, research conducted during the Jim
Crow era indicated that racial discrimination played a regular and illegiti-
mate role.48 Harold Garfinkel used data on more than 800 homicide cases
that took place in ten North Carolina counties from 1930-1940.49 Garfinkel
reported that white defendants in first degree murder cases were somewhat
more likely to receive the death penalty than black defendants.50 Moreover,
this difference remained when he compared ratios using both first and se-
cond degree homicide cases.51 On the other hand, Garfinkel reported strong
racial disparities when he examined defendant and victim configurations: In
both black victim and white victim cases, black defendants were more likely
to receive the death penalty than white defendants.52 The general pattern of
death sentences by race of defendant shown in Garfinkel’s data reflect the
fact that murder is a highly intra-racial event53 and that defendants of what-
ever race who kill whites tend to face a higher probability of a death sen-
tence.54
Consistent with the racial threat formulation, race-based sentencing
patterns persisted even after the Supreme Court reinstated the death penalty
in Gregg v. Georgia55 and voiced optimism that two key reforms: (1) bifur-
cating the trial process and (2) giving juries structured sentencing guidelines
will reduce the incidence of racial discrimination in capital sentencing.56
47. Charles David Phillips, Exploring Relations Among Forms of Social Control:
The Lynching and Execution of Blacks in North Carolina, 1889-1918, 21 LAW & SOC’Y REV.
361 (1987).
48. Id.
49. The ten counties are Alamance, Caswell, Chatham, Durham, Granville, Guil-
ford, Orange, Person, Rockingham, and Wake. Harold Garfinkel, Research Note on Inter-
and Intra-Racial Homicides, 27 SOC. FORCES 369, 370 tbl. 1 (1949).
50. Out of 112 first-degree murder charges against white defendants, eleven (ap-
proximately ten percent) resulted in death sentences. See id. at 374 tbl. 6. Out 413 first-
degree murder charges against black defendants, thirty (approximately seven percent) result-
ed in death sentences. Id.
51. Out of 258 offense charges against black defendants (regardless of victim’s
race), thirty received a death sentence (11.6%) and out of sixty-six offense charges against
white defendants (regardless of victim’s race), eleven received a death sentence (16.7%).
See id. at 374 tbl. 7.
52. Id.
53. In the sociology of crime, the fact that blacks tend to kill blacks and whites tend
to kill whites has remained a consistent finding in death penalty research. See Guy Johnson,
The Negro and Crime, 217 ANNALS AM. ACAD. POL. & SOC. SCI. 93, 99 tbl. 1 (1941); see
GROSS & MAURO, supra note 7, at 237 tbl. A7.
54. GROSS & MAURO, supra note 7, at 18.
55. 428 U.S.153 (1976).
56. Isaac Unah, Choosing Those Who Will Die: The Effect of Race, Gender, and
Law in Prosecutorial Decision to Seek the Death Penalty in Durham County, North Caroli-
na, 15 MICH. J. RACE & L. 135, 143 (2009) (quoting the majority opinion of Gregg v. Geor-
gia, 428 U.S. 153 (1976), which held that “‘[t]he concerns expressed in Furman that the
14 Michigan State Law Review
The Court expressed further optimism toward fairness in death sentencing
through its rejection of North Carolina’s mandatory death penalty statute for
first degree murder in Woodson v. North Carolina because of “the problem
of unguided and unchecked jury discretion.”57 Given this, one would expect
the Court to favor statistical evidence showing disparate application of the
death penalty. But in McCleskey v. Kemp58 the Court rejected strong statisti-
cal evidence of continued group-based racial discrimination in sentencing,
placing the burden on defendants such as McCleskey to prove that they per-
sonally suffered discrimination during their capital trial.59
Data from the post-Gregg era suggest that the Court’s optimism is
misguided,60 and this further bolsters my racial threat argument. Barry
Nakell and Kenneth Hardy’s analysis of North Carolina data during 1977-
1978,61 for example, found a pattern of racial discrimination whereby de-
fendants of whatever race who killed whites were “six times more likely to
be found guilty of first degree murder than defendants in cases with
nonwhite victims.”62 In addition, nonwhite defendants were more likely to
receive the death penalty compared to whites.63 But the short temporal dis-
tance between this study and the Gregg decision made it difficult for these
authors to assess the decision’s true impact. Gross and Mauro in 1989 also
examined the post-Gregg environment,64 focusing part of their analysis on
the role of race in 126 death sentences imposed in Arkansas, Mississippi,
Oklahoma, North Carolina, and Virginia between 1976 and 1980.65 In each
of these states “white-victim homicides were more likely to result in death
death penalty not be imposed arbitrarily or capriciously can be met by a carefully drafted
statute that ensures that the sentencing authority is given adequate information and guid-
ance’”).
57. 428 U.S. 280, 302 (1976). The court also stated that “the North Carolina Statute
provides no standards to guide the jury in determining which murderers shall live and which
shall die.” Id. at 281.
58. 481 U.S. 279 (1987).
59. The McCleskey and Woodson decisions test the limits and usefulness of statistics
in judicial proceedings. Although the justices have accepted the use of statistics in employ-
ment discrimination cases (see for example, Johnson v. Trans. Agency, Santa Clara Cnty,
480 U.S. 616 (1987)), they remain unwilling to permit the same in death penalty cases. Ac-
cording to the McCleskey decision, the death penalty is by nature “fundamentally different”
from cases invoking Title VII of the Civil Rights Act. McCleskey, 481 U.S. at 294. The
decision to impose death is made by a properly constituted jury, unique in its composition,
whose decisions rest upon numerous factors pertinent to the case. However, the decision
maker in Title VII cases is a single entity that considers numerous cases, thus making group-
based statistics appropriate for showing racial disparities under Title VII.
60. NAKELL & HARDY, supra note 26, at 146-48.
61. NAKELL & HARDY, supra note 26.
62. Id. at 146-48.
63. Id. at 94.
64. GROSS & MAURO, supra note 7.
65. See id. at 88-94.
Article Title 15
sentences than black-victim homicides.”66 Unfortunately, the small sample
and lack of controls for extra-legal influences other than the victim’s race
rendered the findings inconclusive.67
Perhaps the most wide-ranging post-Gregg study in the Deep South
was the Baldus Study.68 Using several empirical models, including one
comprised of more than 230 independent variables, the study generally con-
firmed previous findings regarding the significance of race but with greater
specificity.69 Although the incredibly large number of independent variables
raises specification concerns, Baldus et al. concluded that the application of
capital punishment favors white victims compared to black victims.70 The
odds of receiving capital punishment were 4.3 times higher for white victim
cases than for black victim cases.71 Similar findings have been reported in
other studies.72 One study commissioned in 2000 by Governor Parris N.
Glendening of Maryland utilized data from 1978 to 1999 and similarly re-
ported strong race-of-victim effects: “Those who kill whites, particularly if
they happen to be nonwhite, are at an increased risk of being charged with
a capital offense, of having that capital charge not withdrawn, and ultimate-
ly of being sentenced to death.”73 In all these studies, researchers attributed
victim-based effects to unchecked prosecutorial discretion and choice exer-
cised at the earliest stages of case processing.74 The defendant’s race gener-
ally reached statistically insignificant impact.75
Unfortunately, while Baldus and his colleagues and Paternoster and his
colleagues made truly valuable contributions to the race and death penalty
debate, both studies are not without problems. First, the theory guiding their
selection of independent variables is not fully explicated, raising questions
of possible excluded variable bias.76 For example, in both Georgia and Mar-
66. Id. at 92.
67. Gross and Mauro cautioned that “[c]onsidered in isolation, such small numbers
make any sentencing patterns hard to discern: only very strong effects can be seen clearly
with so few observations.” Id. at 88 (footnote omitted).
68. BALDUS ET AL., supra note 7.
69. Id. at 620-29.
70. Id. at 401.
71. Id.
72. Keil & Vito, supra note 1.
73. Paternoster et al., supra note 18, at 41 (emphasis in original).
74. Id. at 45; BALDUS ET AL., supra note 7, at 328.
75. BALDUS ET AL., supra note 7; Keil & Vito, supra note 1; Paternoster et al., supra
note 18, at 34 (noting that across various decision points, “there is no evidence that the race
of the defendant matters at any stage once case characteristics and jurisdiction are con-
trolled”).
76. As explained by Paternoster et al., under the multiple stage approach, they:
[F]irst examined each case characteristic . . . separately to see if it was related to
the [county] or race variable of interest. . . . [T]hose factors that were significantly
related at the .05 . . . level were retained for further analysis, those not meeting that
16 Michigan State Law Review
yland where state prosecutors are popularly elected, electoral incentives are
potentially influential considerations for prosecutors, especially in inter-
racial homicides. Yet neither study controlled for possible electoral pressure
on prosecutors.77 Second, neither study accounted for possible case selection
bias in any direct way.78
The studies I have reviewed here are all valuable. But many suffer
from methodological problems ranging from too few cases and weak statis-
tical tests79 to possible selection bias.80 But overall, analyses of race and the
death penalty are fairly consistent in reporting race-of-victim effects and
criterion were dropped . . . . The variables that were retained at [the] first screening
were then entered into a full logistic regression model . . . .
Paternoster et al., supra note 18, at 23. From this description, I can conclude that the analysis
was not entirely theoretically grounded.
77. Because elected officials, including prosecutors, judges, and legislators, must
periodically face voters and defend their record, there is every incentive for elected leaders to
behave “as if” an election is looming. Melinda Gann Hall has furnished evidence that for
State Supreme Court justices in Texas, North Carolina, Louisiana, and Kentucky, “district-
based elections, close margins of victory, approaching the end of a term, and certain types of
electoral experiences increase the probability that justices will uphold death sentences initial-
ly imposed by trial courts.” Melinda Gann Hall, Justices as Representatives: Elections and
Judicial Politics in the American States, 23 AM. POL. Q. 485, 497-98 (1995). As elected
officers of the Court, prosecutors may face a similar tendency. Although most prosecutorial
elections are uncompetitive (as ninety-five percent of incumbent prosecutors who run are
reelected), there is a real possibility that the mere prospect of a challenger emerging will
create a shadow effect on prosecutor’s behavior, much like the shadow effect of a trial on
plea bargaining. Ronald F. Wright, How Prosecutor Elections Fail Us, 6 OHIO ST. J. CRIM.
L., 581, 596 (2009).
78. Both Baldus and Paternoster expressed genuine concern for selection issues and
attempted to address them through their careful consideration of which cases are death eligi-
ble. See, e.g., Paternoster et al., supra note 18, at 18 (“We proceed with caution, however,
because the issue as to whether or not a murder case is death eligible involves a great deal of
ambiguity and inevitable controversy.”); BALDUS ET AL., supra note 7, at 427 (“How likely,
therefore, is it that our research methodology may have artificially enhanced or suppressed
the observed levels of arbitrariness or discrimination in either the pre- or post-Furman peri-
ods?”). But their estimation methods (logistic regression) cannot account for the possibility
that selection problems from one stage of analysis, say the prosecutor’s decision to refuse or
accept a plea deal, can have an effect on outcomes obtained at the next decision stage of
analytical interest, namely the decision to file a notice of intention to seek death. The method
proposed by economist James Heckman in 1979, called two-step correction, is often used to
address selection bias. See generally Shawn Bushway, Brian D. Johnson & Lee Ann Slocum,
Is the Magic Still There? The Use of the Heckman Two-Step Correction for Selection Bias in
Criminology, 23 J. QUANTITATIVE CRIMINOLOGY 151 (2007). Failure to consider Heckman
correction is by no means a fatal flaw in the analyses presented by Baldus or Paternoster, but
it simply raises concerns as to the resiliency or robustness of their estimates. Id. at 153.
79. GROSS & MAURO, supra note 7, at 88-93.
80. BALDUS ET AL., supra note 7, at 435; NAKELL & HARDY, supra note 26; Pater-
noster et al., supra note 18, at 23.

Article Title 17
absence of defendant’s race effects.81 The question is whether that reported
pattern of racial disparities still holds in North Carolina. While my study
focuses on race as a condition of criminal punishment, I account for alterna-
tive explanations regarding legal, structural, and institutional conditions to
assess death penalty decision making.
Among these alternative explanations in the socio-structural landscape
is class conflict. Class-based explanation of criminal prosecution and sen-
tencing harkens back to Karl Marx. These explanations assert that punish-
ment is conditioned by where an individual is placed on the social ladder.
They predict that intensity of punishment that would befall those with pow-
er and social value will be less severe compared to individuals with less
power and less social value.82 Thus the class-based explanation views death
penalty prosecution metaphorically as a card game with a deck stacked
against low SES players because they lack both affluence and influence
with the politically powerful. By contrast, high SES players are advantaged
in their capacity to exploit the rules of the game to their benefit. According
to this social class argument, high SES defendants can use legal institutions
to reduce or altogether escape punishment for criminal transgressions
through their social networks and their ability to hire superior lawyers and
insiders. Similarly, high SES victims hold greater social and economic val-
ue than low SES victims.83 The antecedent of this differential treatment is
social inequality, especially ascriptive inequality. Based upon this logic,
high SES victims can be expected to command severe punishment for their
killers commensurate with their high social class standing. I test these social
81. An etiology of capital sentencing studies by the General Accounting Office
confirms this conclusion: “In 82 percent of the studies, . . . those who murdered whites were
found to be more likely to be sentenced to death than those who murdered blacks. [The]
finding was remarkably consistent across data sets, states, data collection methods, and ana-
lytic techniques.” U.S. GEN. ACCOUNTING OFFICE, GGD-90-57 DEATH PENALTY
SENTENCING: RESEARCH INDICATES PATTERN OF RACIAL DISPARITIES 5 (1990), available at
http://archive.gao.gov/t2pbat11/140845.pdf (footnotes omitted).
82. GARLAND, supra note 9; Joachim J. Savelsberg, Knowledge, Domination, and
Criminal Punishment, 99 AM. J. SOC. 911 (1994) (suggesting that “sociological models de-
picts humans as products of society whose behaviors and chances are not based on free will
but depend on their socialization and position in systems of social inequality”); Michael
Mitchell & Jim Sidanius, Social Hierarchy and the Death Penalty: A Social Dominance
Perspective, 16 POL. PSYCHOL., 591, 592 (1995) (citing earlier work by Sidanius testing the
“out-of-place principle” which “posits that acts of violence directed at members of domi-
nance groups by members of subordinate groups are likely to face very severe, negative
sanctions”).
83. Ronald A. Farrell & Victoria Lynn Swigert, Legal Disposition of Inter-Group
and Intra-Group Homicides, 19 SOC. Q., 565, 573-74 (1978) (examining the punishment of
offenders based on occupational prestige and finding that “[f]inal convictions are most severe
for low status defendants alleged to have murdered high status victims,” a finding they at-
tribute to the criminal imagery of low status individuals); see also Savelsberg, supra note 82;
DEBATING THE DEATH PENALTY, supra note 1.

18 Michigan State Law Review
class arguments using educational attainment of the defendant and victim. I
expect that crimes involving well-educated defendants will be less likely to
result in capital prosecution and punishment, whereas those involving well-
educated victims will be more likely to result in capital prosecution and
punishment (Appendix A gives the operationalization of all my variables).
Prosecutors and juries may be more sympathetic to a certain class of
defendants and victims than to others. Unfortunately, I have little infor-
mation to assess which defendants or victims will elicit such sentiment.
Two social background factors that seem especially appropriate are age and
sex. Age has been associated with both prosecutorial and sentencing deci-
sion making in capital cases.84 Society views older defendants as being more
responsible and set in their own ways than younger defendants, who are
seen as being more impulsive and immature, but more easily rehabilitated.85
Also, younger defendants are less likely to carry a criminal history than
older offenders. Therefore, I expect older defendants to be more likely to
face capital prosecution and sentencing than younger defendants.86
Graddy’s study of jury decision making in product liability awards
shows that at the extremes, age has an exculpatory quality in the justice
system.87 Because of physical and mental infirmities associated with age,
much older defendants (especially those over seventy-five for example) and
much younger defendants (under twenty) may be perceived as being cogni-
tively weak and, consequently, likely to invite leniency compared to mid-
dle-aged offenders.88 This possibility suggests a curvilinear relationship
between defendant’s age and the probability of criminal prosecution and
sentencing. I construct the exponential variable “Age” as a way to test this
relationship. Similarly, society views very young and very old victims as
“helpless” and, therefore, especially vulnerable to crime. On this basis, one
would expect crimes against very old and very young victims to command
84. Radelet & Pierce, supra note 46, at 608 tbl. 6 (examining 1017 homicide cases
in Florida and finding that older defendants are less likely to have their charges upgraded by
prosecutors compared to younger offenders); Songer & Unah, supra note 7, at 204 tbl. 7
(reporting that in South Carolina, the odds are 0.34 times lower that prosecutors will seek the
death penalty against someone accused of murdering an elderly citizen compared to a young-
er citizen); Williams & Holcomb, supra note 12, at 214 (finding that the odds are 2.2 time
higher that homicides with older offenders would lead to a death sentence in Ohio compared
to homicides with younger offenders).
85. Elizabeth S. Scott & Laurence Steinberg, Adolescent Development and the
Regulation of Youth Crime, 18 JUV. JUST. 15 (2008).
86. See Williams & Holcomb, supra note 12, at 214.
87. Elizabeth Graddy, Juries and Unpredictability in Products Liability Damage
Awards, 23 LAW & POL’Y (2001).
88. Indeed, North Carolina and many other states exempted from capital punishment
criminal defendants under eighteen, well before the Supreme Court outlawed the execution
of individuals under eighteen in the case of Roper v. Simmons, 543 U.S. 551 (2005).
Article Title 19
more severe punishment than those committed against middle-aged victims,
leading us to expect a curvilinear relationship as well.
A mountain of empirical evidence points to a gender-gap in the crimi-
nal justice system.89 While men are universally overrepresented in the death
penalty system, women are underrepresented partly because of the arrange-
ment of gender roles in society, but mostly because women commit fewer
crimes (especially violent crimes) than men.90 Moreover, studies suggest
that women are treated more leniently than men not just in capital prosecu-
tion and sentencing, but in most other aspect of the criminal justice system.
In Spohn and Spears’ 199791 study of male and female felony defendants,
females were sentenced less harshly than males for similar offenses. Evi-
dence also suggests that violent offences against women are more likely to
elicit the death penalty than offenses against men.92 Thus, I expect less se-
vere treatment of female offenders and more severe treatment for those who
attack women.
B. Formal Legal Factors
Legal factors designated by a state’s criminal statutes and judicial de-
cisions are designed to constrain prosecutorial discretion and jury decision
making. Presumably, this should lead to evenhandedness in prosecution and
sentencing. Indeed, sociolegal theorists, such as Donald Black, recognize
that society is based on a social contract and have conceptualized law as a
89. Jon Hurwitz & Shannon Smithey, Gender Differences on Crime and Punish-
ment, 51 POL. RES. Q. 89 (1998); see also Kathleen, Daly & Michael Tonry, Gender, Race,
and Sentencing, 22 CRIME & JUST. 201 (1997); Ilene H. Nagel & Barry L. Johnson, The Role
of Gender in a Structured Sentencing System: Equal Treatment, Policy Choices, and the
Sentencing of Female Offenders Under the United States Sentencing Guidelines, 85 J. CRIM.
L. & CRIMINOLOGY 181 (1994).
90. Darrell Steffensmeier & Emilie Allan, Gender and Crime: Toward a Gendered
Theory of Female Offending, 22 ANN. REV. SOC. 459 (1996).
91. Cassie C. Spohn & Jeffrey W. Spears, Gender and Case Processing Decisions:
A Comparison of Case Outcomes for Male and Female Defendants Charged with Violent
Felonies, 8 WOMEN & CRIM. JUST. 29 (1997).
92. BALDUS ET AL., supra note 7, at 73; see also Songer & Unah, supra note 7, at
194 tbl. 4. A woman facing execution is a particularly rare event, inasmuch as it is relatively
rare for a woman to receive the death penalty. See e.g., id. at 183-84; Andrea Shapiro, Une-
qual Before the Law: Men, Women and the Death Penalty, 8 AM. U. J. GENDER, SOC. POL’Y
& L. 427 (2000); Victor L. Streib, Gendering the Death Penalty: Countering Sex Bias in a
Masculine Sanctuary, 63 OHIO ST. L.J. 433 (2002). In 2000, pre-execution media frenzy
swirled around Texas death row inmate Karla Faye Tucker mostly over her sex, not over her
claim of total rehabilitation or conversion to Christianity while in prison. Karla Faye Tucker,
OFFICE OF THE CLARK COUNTY PROSECUTING ATTORNEY,
http://www.clarkprosecutor.org/html/death/US/tucker437.htm (last visited Jan 20, 2012).

20 Michigan State Law Review
form of social control,93 formulated to explain society’s response to deviant
behavior. Savelsberg94 also recognizes the weight of penal law, maintaining
that legal factors represent a neoclassical return to formal rationality in
prosecution and punishment where the chief objective is simply to do the
right thing and “be just.”
Decision making based upon formal legal factors therefore functions
in the Weberian sense, meaning that it reflects a systematic or analytically
derived mode, whereby rational judicial officials reject extrinsic elements,
such as race or ethnicity, and instead strictly adhere to criminal codes in an
objective, logical, and dispassionate manner to arrive at their decisions.95
Under this rationale, I would expect legally identified variables to emerge as
a major determinant of criminal prosecution and punishment in North Caro-
lina. Indeed studies examining unwarranted disparity in capital prosecution
have shown that legal factors, including offense characteristics, have power-
ful effects.96 Because punishment is predicated on offense severity, formal
legal factors predict that prosecutors will likely proceed capitally and juries
will likely convict and impose a death sentence if the offense surpasses a
certain threshold of heinousness and if the offender has prior history of vio-
lence such as a felony conviction.97
North Carolina criminal statutes and those in other southern states, in-
cluding Florida, Louisiana, and Tennessee, contain three elements that con-
trol whether a homicide defendant can be prosecuted for a capital crime.98
These murder elements speak to the mental condition of the accused (mens
rea) during the offense (i.e., the extent of premeditation involved). The first
element involves one of five circumstances that have historically been seen
as especially heinous when they lead to murder: poisoning, lying-in-wait,
93. DONALD BLACK, THE BEHAVIOR OF LAW (1976); John Hagan, The Science of
Social Control, 14 CONTEMP. SOC. 667, 667 (1985) (reviewing Black’s seminal work, To-
ward a General Theory of Social Control, and noting that a basic premise of Black’s theory
of social control “is that law represents one form of social control”).
94. Savelsberg, supra note 82, at 914.
95. Max Weber on Law in Economy and Society (Max Rheinstein, ed.), in LAW &
SOCIETY: READINGS ON THE SOCIAL STUDY OF LAW 185 (Stewart Macaulay, Lawrence M.
Friedman & John Stookey eds., 1995).
96. Isaac Unah, Choosing Those Who Will Die: The Effect of Race, Gender, and
Law in Prosecutorial Decision to Seek the Death Penalty in Durham County, North Caroli-
na, 15 MICH. J. RACE & L. 135 (2009). Michael L. Radelet & Glenn L. Pierce, Race and
Death Sentencing in North Carolina, 1980-2007, 89 N.C. L. REV. 2119, 2144 (2010-2011).
97. Shawn D. Bushway & Anne Morrison Piehl, Judging Judicial Discretion: Legal
Factors and Racial Discrimination in Sentencing, 35 LAW & SOC’Y REV. 733 (2001); see
also, LYNN MATHER, PLEA BARGAINING OR TRIAL? (1979); Simon & Spaulding, supra note 6.
98. For example, in North Carolina, these murder elements are described in the
General Statute, N.C. GEN STAT. 15A-2000(b)(1)-(3). See also FLA. STAT. § 921.141(2)(a)-
(c) (2011); LA. REV. STAT. ANN. § 905.3 (2011); TENN. CODE ANN. § 39-13-204 (2011).

Article Title 21
imprisonment, torture, or starvation.99 The second element designates crimes
that reflect a “willful, deliberate, or premeditated killing.”100 The third in-
volves felony murders, those committed irrespective of the defendant’s
mental state while in the commission of another felony such as rape or
armed robbery.101 My hypothesis regarding these murder elements is in-
formed by Justice Byron White’s logic in Gregg v. Georgia, “Unless prose-
cutors are incompetent in their judgments the standards by which they de-
cide whether to charge a capital felony will be the same as those by which
the jury will decide the questions of guilt and sentence.”102 Thus, I expect
these three enumerated legal elements to have a significant positive effect
on capital prosecution and punishment.
Complicating the analysis, a North Carolina criminal statute requires
that beyond conviction for first-degree murder, no defendant can be capital-
ly sentenced unless the jury, at a separate sentencing proceeding, finds at
least one aggravating circumstance described by statute.103 The statute lists
several aggravating circumstances, including killing a law enforcement or
corrections officer and killing anyone while incarcerated.104 The jury must
99. NC CRIMES: A GUIDEBOOK ON THE ELEMENTS OF CRIME 61 (Thomas H. Thorn-
burg ed., 4th ed. 1995) [hereinafter NC CRIMES].
100. Id.
101. Id. The district attorney must designate either at indictment or soon thereafter
which permissible legal theory of first-degree homicide he or she will attempt to prove. Then
if the defendant is found guilty, a penalty phase will ensue.
102. Gregg v. Georgia, 428 U.S.153, 225 (1976).
103. NC CRIMES, supra note 99, at 62.
104. The full list of aggravating circumstances in N.C. GEN. STAT. § 15A-2000(e)
(2011) is as follows:
(1) The capital felony was committed by a person lawfully incarcerated.
(2) The defendant had been previously convicted of another capital felony or had
been previously adjudicated delinquent in a juvenile proceeding for committing an
offense that would be a capital felony if committed by an adult.
(3) The defendant had been previously convicted of a felony involving the use or
threat of violence to the person or had been previously adjudicated delinquent in a
juvenile proceeding for committing an offense that would be a Class A, B1, B2, C,
D, or E felony involving the use or threat of violence to the person if the offense
had been committed by an adult.
(4) The capital felony was committed for the purpose of avoiding or preventing a
lawful arrest or effecting an escape from custody.
(5) The capital felony was committed while the defendant was engaged, or was an
aider or abettor, in the commission of, or an attempt to commit, or flight after
committing or attempting to commit, any homicide, robbery, rape or a sex offense,
arson, burglary, kidnapping, or aircraft piracy or the unlawful throwing, placing, or
discharging of a destructive device or bomb.
(6) The capital felony was committed for pecuniary gain.
(7) The capital felony was committed to disrupt or hinder the lawful exercise of
any governmental function or the enforcement of laws.
(8) The capital felony was committed against a law-enforcement officer, employee
of the Division of Adult Correction of the Department of Public Safety, jailer,

22 Michigan State Law Review
weigh the aggravating circumstances found against a list of mitigating cir-
cumstances, factors that presumably make the defendant less culpable for
the offense, such as killing under duress or under domination of another
person.105 Only when aggravating circumstances outweigh mitigating cir-
cumstances can a jury impose a death sentence.106 I expect the presence of
aggravating circumstances to increase the likelihood of capital prosecution
and sentence, and I expect the presence of mitigating factors to decrease that
likelihood. I also included the killing of multiple victims as a possible corre-
late of capital prosecution and sentencing. Premeditated killing of one vic-
tim is a clear enough indicator of depraved indifference to human life; both
society and the law view killing multiple victims as a stronger indicator.
Analyses of community responses to crime indicate that criminal mo-
tives are related to punishment severity.107 Yet, a number of studies that rely
on official government data typically overlook the importance of motive
and, thus, fail to explicitly account for it.108 Part of the reason is that the data
fireman, judge or justice, former judge or justice, prosecutor or former prosecutor,
juror or former juror, or witness or former witness against the defendant, while en-
gaged in the performance of his official duties or because of the exercise of his of-
ficial duty.
(9) The capital felony was especially heinous, atrocious, or cruel.
(10) The defendant knowingly created a great risk of death to more than one person
by means of a weapon or device which would normally be hazardous to the lives of
more than one person.
(11) The murder for which the defendant stands convicted was part of a course of
conduct in which the defendant engaged and which included the commission by
the defendant of other crimes of violence against another person or persons.
105. Id. § 15A-2000(f) lists the mitigating circumstances that can be considered as
follows:
(1) The defendant has no significant history of prior criminal activity.
(2) The capital felony was committed while the defendant was under the influence
of mental or emotional disturbance.
(3) The victim was a voluntary participant in the defendant’s homicidal conduct or
consented to the homicidal act.
(4) The defendant was an accomplice in or accessory to the capital felony commit-
ted by another person and his participation was relatively minor.
(5) The defendant acted under duress or under the domination of another person.
(6) The capacity of the defendant to appreciate the criminality of his conduct or to
conform his conduct to the requirements of law was impaired.
(7) The age of the defendant at the time of the crime.
(8) The defendant aided in the apprehension of another capital felon or testified
truthfully on behalf of the prosecution in another prosecution of a felony.
(9) Any other circumstance arising from the evidence which the jury deems to
have mitigating value.
106. Id. § 15A-2000(b)(1)-(3).
107. Simon & Spaulding, supra note 6.
108. For example, Radelet and Pierce relied on data from the Uniform Crime Report
consisting of 15,281 homicide suspects and supplemented these with death row data from the
NC Department of Corrections. Radelet & Pierce, supra note 35, at 2138-39. These data do

Article Title 23
gathering authority thinks that motive is already integrated into the sentenc-
ing guidelines. But because of the fluidity of human motivations, prosecu-
tors and the jury can assign greater severity to a particular offense based
upon the assailant’s motive. In the politics of law enforcement, where crim-
inal intent determines perceptions of culpability and punishment assign-
ment, I think that taking account of various criminal motives can help us
explain the behavior of prosecutors and juries. I examine five motives typi-
cally associated with homicide: hatred, rage, sex, money, and involvement
in collateral crimes. I use rage as my comparison category. I expect the
presence of these motives to enhance the probability of prosecution and
sentencing.
C. Institutional Factors
Early studies of criminal punishment reached mixed findings when re-
searchers relied on either the Durkheim intensity of punishment formulation
or the Marxist linkage of unemployment, crime, and punishment severity.
Since then, a growing literature on criminal punishment has turned to poli-
tics, conceptualizing punishment straightforwardly as a political response to
social problems.109 Indeed Candidate Richard M. Nixon’s 1968 promise to
return the nation to “law and order,” his eventual appointment to the Su-
preme Court of law and order conservatives Warren Burger and William
Rehnquist, and George H. W. Bush’s 1988 use of prison furlough in a cam-
paign advertisement featuring Willie Horton to accuse Michael Dukakis of
being “soft on crime,” all underscore the strong connection that exists be-
tween politics and criminal punishment, with central emphasis being placed
on political processes.110
Within that description, institutional factors concern the manner in
which the prosecutorial practice is embedded within the political process.
Linking prosecutorial practice and the political process are process-oriented
not contain explicit information on the motive for the crime. Such information is difficult to
obtain without a case-by-case examination of the court records.
109. JAMES Q. WILSON, THINKING ABOUT CRIME (Vintage Books, 1985); see also
GARLAND, supra note 9; KATHERINE BECKETT, MAKING CRIME PAY (1997); Thomas D.
Stucky, Karen Heimer & Joseph B. Lang, Partisan Politics, Electoral Competition, and
Imprisonment: An Analysis of States Over Time, 43 CRIMINOLOGY 211 (2005); Jacobs &
Carmichael, supra note 45.
110. Candidate Nixon’s campaign speech on law and order was reported in The Nixon
Record, U.S. NEWS & WORLD REP., July 15, 1968, at 48, 51. Nixon’s appointment of law and
order justices Burger and Rehnquist is chronicled by Nixon White House insider John Dean
in his book, The Rehnquist Choice. JOHN DEAN, THE REHNQUIST CHOICE 1-28 (2001).
The effect of the Horton commercial has been used as a template for much policy analysis by
political scientists with many showing evidence that the spot was effective in Bush’s win
over Dukakis in 1988. See, e.g., Tali Mendelberg, Executing Hortons: Racial Crime in the
1988 Presidential Campaign, 61 PUB. OPINION Q. 134, 137 (1997).
24 Michigan State Law Review
variables such as the temporal proximity of the case in the prosecutor’s
election cycle, party competition, and political ideology of the prosecutor
and the county.
Research on judicial accountability suggests that elections provide an
incentive structure that controls the behavior of state Supreme Court justic-
es.111 In controversial issues such as the death penalty, Melinda Gann Hall
found that state supreme court justices act strategically by casting votes that
conform to constituency preferences.112 Fred Burnside reported that an Ala-
bama trial judge up for reelection upgraded a jury’s life sentence to a death
sentence to improve his chances for reelection.113 There is theoretical reason
to believe that North Carolina prosecutors who are subject to electoral ac-
countability will also respond to political pressure. As Sanford Gordon and
Gregory Huber suggest, electoral incentives serve as instruments of political
accountability.114 Yet, elections can lead to perverse strategies including
malicious prosecution. Strategic prosecutors will consider their future elec-
toral prospects in their charging and prosecuting decisions. Evidence prof-
fered by William Bowers and Glenn Pierce supports the contention that
prosecutors facing electoral competition do succumb to political pressure to
cultivate an aggressive posture by disingenuously upgrading the crimes of,
and vigorously prosecuting, accused offenders deemed easily convictable.115
These soft targets are typically the poor or minorities.116 The payoff for
prosecutors includes a high conviction rate, which they can use to win sup-
port from crime-conscious voters. I expect electoral proximity to influence
prosecutorial decisions, especially in the context of electoral competition.
Another institutional factor connected to the structure of prosecutorial
practice is the prosecutor’s ideology, an antecedent of attitude toward capi-
111. Carol Ann Traut & Craig F. Emmert, Expanding the Integrated Model of Judi-
cial Decision Making: The California Justices and Capital Punishment, 60 J. POL. 1166
(1998).
112. Hall, supra note 77.
113. Fred B. Burnside, Comment, Dying to Get Elected: A Challenge to the Jury
Override, 1999 WIS. L. REV. 1017.
114. Sanford C. Gordon & Gregory A. Huber, Citizen Oversight and the Electoral
Incentives of Criminal Prosecutors, 46 AM. J. POL. SCI. 334 (2002).
115. Bowers & Pierce, Arbitrariness and Discrimination under Post-Furman Capital
Statutes, 26 CRIME & DELINQ. 563 (1980). In capital trials, all jurors must be death qualified.
In addition to routine attitudinal and experiential questions, prospective capital jurors are
usually asked about their capacity and willingness to impose death if the defendant is found
guilty. The Supreme Court ruled in Witherspoon v. Illinois that potential jurors whose beliefs
substantially impair their ability to impose the death sentence may be excused from jury
service in capital cases. 391 U.S. 510 (1968).
116. Anne Schneider & Helen Ingram, Social Construction of Target Populations:
Implications for Politics and Policy, 87 AM. POL. SCI. REV. 334, 336 (1993) (“[P]ublic offi-
cials commonly inflict punishment on negatively constructed groups who have little or no
power, because they need fear no electoral retaliation from the group itself and the general
public approves of punishment for groups that it has constructed negatively.”).
Article Title 25
tal punishment. Opinion polls consistently indicate that conservatives sup-
port the death penalty considerably more than do liberals.117 Conservatives
believe that severe punishment is needed to deter crime, an act of individual
choice.118 Liberals believe that crimes are often the result of forces beyond
the individual’s direct control.119 As Stuart A. Scheingold noted, “Whereas
liberals favor the carrot, conservatives prefer the stick.”120 Studies of deci-
sion making in Congress show that ideology is the most fundamental of all
the political assets that government officials possess and routinely depend
upon for decisions.121 As Jeffrey Segal, Harold Spaeth,122 and Melinda
Hall123 have convincingly documented, ideology also operates in the judicial
system, even at the state level. I use party identification of the prosecutor to
capture ideological influences on prosecutorial decisions. Because con-
servatives have a greater orientation toward law and order and are more
prone to employing punitive measures than liberals, I would expect con-
servative prosecutors to pursue more severe punishment than do liberal
prosecutors.
Defense counsel status is another process-oriented variable. In the ad-
versarial setting of a criminal proceeding, the experience of the defense
lawyer is an important predictor of the probability of prosecution as well as
sentence severity.124 I focus on the defense counsel by using two variables:
(1) expertise and (2) whether the defense attorney is retained by the accused
or an assigned public defender. I use hourly rate of pay that defense attor-
neys receive as a measure of expertise.125 Other institutional factors linking
117. Paul Brace & Brent D. Boyea, State Public Opinion, the Death Penalty, and the
Practice of Electing Judges, 52 AM. J. POL. SCI. 360, 362 (2008); Phoebe C. Ellsworth &
Samuel R. Gross, Hardening of the Attitudes: Americans’ Views on the Death Penalty, 50 J.
SOC. ISSUES 19, 21 (1994).
118. STUART A. SCHEINGOLD, THE POLITICS OF LAW AND ORDER: STREET CRIME AND
PUBLIC POLICY 9 (1984).
119. Id. at 4.
120. Id.
121. MELVIN J. HINICH & MICHAEL C. MUNGER, IDEOLOGY AND THE THEORY OF
POLITICAL CHOICE 9 (1st ed. 1996) (noting that in day-to-day politics, the existence and
maintenance of an ideology is by far the most fundamental of all political assets).
122. JEFFREY A. SEGAL & HAROLD J. SPAETH, THE SUPREME COURT AND THE
ATTITUDINAL MODEL (1993).
123. See Hall, supra note 77.
124. Stephen B. Bright, Counsel for the Poor: The Death Sentence Not for the Worst
Crime but for the Worst Lawyer, in THE DEATH PENALTY IN AMERICA (Hugo Adam Bedau
ed., 1997).
125. My data do not distinguish between different subdimensions of expertise identi-
fied by Herbert Kritzer, for example, substantive expertise (substance of the law, regulation,
etc. governing decision making in an issue area) versus process expertise (ability to utilize
knowledge of legal process, for example, hearings/advocacy to earn the trust of judges/jury
through persuasion). See HERBERT M. KRITZER, LEGAL ADVOCACY: LAWYERS AND
NONLAWYERS AT WORK 15 (1998). However, my measure reasonably approximates these

26 Michigan State Law Review
prosecutorial practice to capital prosecution, but which are not necessarily
process-oriented, exist, including the racial composition of the local com-
munity, where the case was tried, and the race and gender of the prosecutor.
I use race and gender of the prosecutor to attempt to generalize the gender-
and racial-gap hypotheses that females and nonwhites are “softer” on crime
than males and whites.126 Finally, I include a measure of the racial composi-
tion of the county of conviction. Because prosecutors have an electoral in-
centive to be race-neutral, I hypothesize that prosecutors are less likely to
seek the death penalty if the county nonwhite population is large rather than
small. However, I expect jurors who face no electoral accountability to be
more likely to convict and sentence defendants to death if the nonwhite
population is large rather than small. Finally, I explore a number of interac-
tions to tease out the complex relationships between these political variables
and prosecutorial and sentencing decisions.
IV. RESEARCH DESIGN
During the 1993 to 1997 period, 3990 known defendants were prose-
cuted for different homicides in North Carolina.127 My data capture homi-
cides resulting in a murder or first-degree murder charge.128 In addition, my
data include a random sample of second-degree murder cases to account for
the very real possibility that, for extra-legal motivations, prosecutors may
forms of expertise because in North Carolina during the period I examine, the hourly rate of
pay is determined by the trial judge based upon the lawyer’s professional experience in capi-
tal cases and sometimes upon the perceived complexity of the matter in light of case law.
Telephone Conversation with Rick Kane, Administrator, Administrative Office of the
Courts, in Raleigh, N.C.
126. Carol J. Mills & Wayne E. Bohannon, Juror Characteristics: To What Extent
Are they Related to Jury Verdicts, 64 JUDICATURE 22 (1980); Susan Welch, Michael Combs
& John Gruhl, Do Black Judges Make a Difference?, 32 AM. J. POL. SCI. 126 (1988); cf.
Darrell Steffensmeier & Chris Hebert, Women and Men Policymakers: Does the Judge’s
Gender Affect the Sentencing of Criminal Defendants?, 77 SOC. FORCES 1163 (1999).
127. This number was determined based on a general file of homicides with known
offenders generated for this project. Analyst Patrick Tamer of the Administrative Office of
the Courts in Raleigh N.C. generated a data file of all homicides that occurred during the
time of study.
128. In North Carolina, homicides are charged as murder, first-degree murder, se-
cond-degree murder, and manslaughter (voluntary and involuntary). A nonspecific charge of
“murder” is an all-inclusive category used if the prosecutor has insufficient evidence to clas-
sify the homicide as first or second-degree murder or manslaughter. It further gives the pros-
ecutor flexibility should a plea agreement be negotiated down the line. For detailed defini-
tions and information about these homicide categories, see NC CRIMES, supra note 99, ch. 6.
Also, the all inclusive “murder” category was included in the data I received from the Ad-
ministrative Office of the Courts in Raleigh. Telephone Conversation with Rick Kane, Ad-
ministrator, Administrative Office of the Courts, in Raleigh, N.C.

Article Title 27
undercharge an otherwise death-eligible offense.129 My data then consisted
of the entire population of first-degree murder cases in which the defendant
received a death sentence (99 cases) or life in prison without parole (303
cases). I used multistage statistical sampling to select a random sample from
the remaining homicide cases designated with a “murder” charge but receiv-
ing a life sentence, a term of years in prison, or an acquittal/dismissal (118
cases). In this way my data reflect the entire population of homicides com-
mitted in North Carolina during the period examined.
Under multistage sampling, cases are selected in stages to arrive at an
overall nonzero probability of inclusion in the analysis (see Appendix B).
To check the representativeness of my sample, I constructed a sampling
weight that reflects the probabilities of the two sampling stages used.130 I
limit my regressions to the un-weighted sample, N=520. However, I use the
weighted data for reporting death-sentencing rates for various racial groups
and configurations as this method imposes few demands on the data.
I decompose the capital prosecution process by estimating the two sets
of models outlined in my theoretical framework, using Heckman probit131 as
a way to truly capture the sequential process of capital prosecution and pun-
ishment.132 I added exclusion restrictions into the selection models to reduce
129. Because of prosecutorial discretion, prosecutors can decline to file a capital
charge even if a case is death eligible. Bolstering my claim is Paternoster et al., who found
that in Maryland, “[k]illings involving a black offender and a black victim make up .49 of the
total number of death eligible cases, but only .28 of the death notifications.” Paternoster et
al., supra note 18, at 26. In my North Carolina data, there were thirty-four death-eligible
cases where the prosecutor failed to seek the death penalty; most of these had black victims.
Therefore, I define a death-eligible offense as one in which the prosecutor files notice to seek
the death penalty or, as stipulated under the criminal code, at least one statutory aggravating
circumstance is present, and the defendant is at least eighteen years of age, the statutory
minimum age for invoking the death penalty in North Carolina during the time of my study.
130. Because North Carolina counties are grouped into judicial districts with each
being controlled by a single prosecutor, I first selected a random sample of judicial districts; I
then derived my randomly selected cases from these judicial districts. My sampling weight,
calculated to be 31.7, reflects these two sampling stages. To check the accuracy of this
weight, I mapped my 520 cases back to the entire population of 3990 and received a ninety-
nine percent accuracy rate (N=3956). Due to rounding of decimal fractions, such mapping
hardly ever yields the exact population figure. But I think my sample weight is almost per-
fect.
131. James J. Heckman, Sample Selection Bias as Specification Error, 47
ECONOMETRICA 153 (1979).
132. Heckman probit (“Heckprob”) models are suitable for analyzing the death penal-
ty as a process because my dependent variables are binary and because cases that reach any
given stage of the process are a nonrandom selection of all cases that enter the courthouse.
Heckman procedure corrects for selection bias by using probit to predict selection into the
sample as a function of independent variables Z, then corrects for selection bias by calculat-
ing a nonlinear selectivity index or hazard rate, i. That quantity is then included in the se-
cond stage regression to compensate for the selection bias: yi=X+i + i, where X is the
set of independent variables that predicted the outcome. Note that because the hazard rate

28 Michigan State Law Review
any collinearity problems that might be associated with the Heckman cor-
rection index.
V. RESULTS
Does race still contribute substantially toward capital prosecution in
North Carolina during the 1990s? If progressive changes in Southern racial
attitude in recent decades are reflected in the application of criminal pun-
ishment in North Carolina, then little evidence of racial bias in prosecution
and death sentencing should emerge. By racial bias, I mean a predictable
inequity in the treatment of a racial group. Figure 2 reports simple death-
sentencing rates grouped by racial category. Overall, the death-sentencing
rate for homicides in North Carolina from 1993-1997 is 2.5 percent. Coinci-
dentally, this rate is right in line with the national average of 2.2% reported
by Blume, Eisenberg, and Wells.133 Beyond the aggregate death sentencing
rate that I report, three interesting findings emerge once I disaggregate the
data and apply a weight index.
Figure 2
depends on normally distributed errors, i must be nonlinear. If i is linear, the outcome
equation will be unidentified. In order to achieve analytical convergence in Heckman mod-
els, the selection equation requires an “instrumental” variable or exclusion restriction that
explains the dependent variable in the selection equation but not in the outcome equation.
Without such identifying variable, one is relying solely on the functional form to identify the
model. This would be problematic since the functional form assumption has no firm basis in
theory. See generally CHRISTOPHER H. ACHEN, THE STATISTICAL ANALYSIS OF QUASI-
EXPERIMENTS 97-100 (1986).
133. Blume et al., supra note 36, at 171.
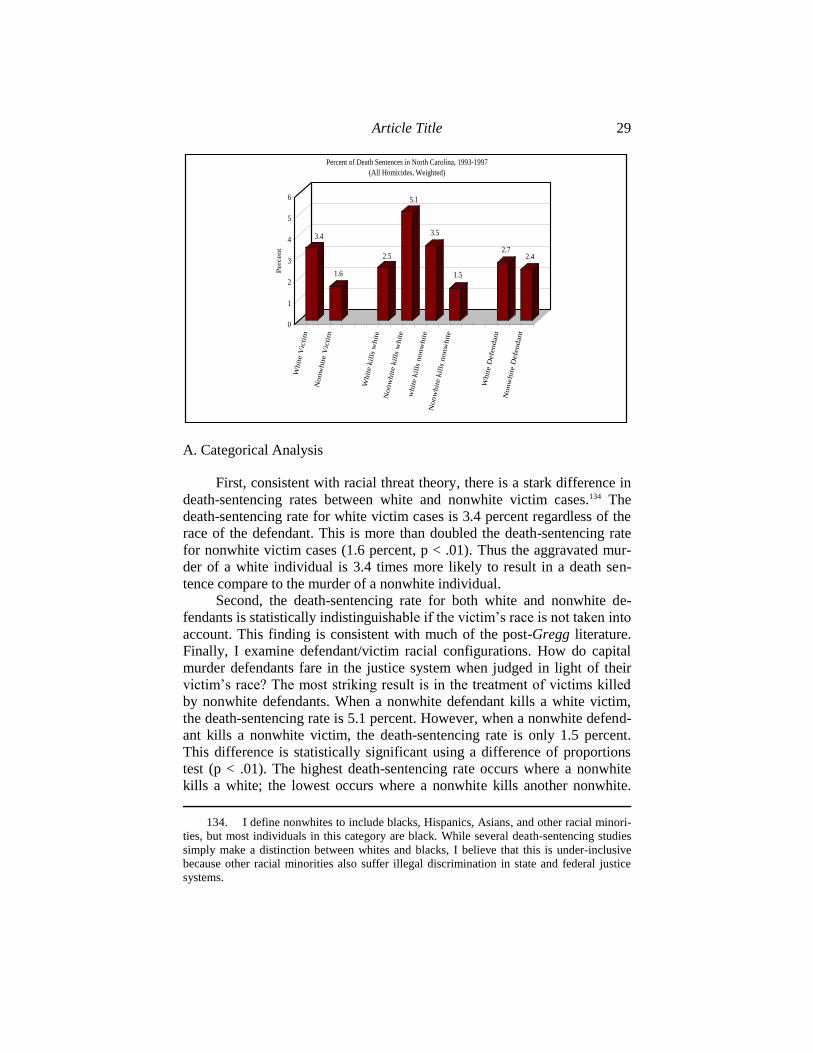
Article Title 29
3.4
1.6
2.5
5.1
3.5
1.5
2.72.4
0
1
2
3
4
5
6
Perc
en
t
Whit
e V
icti
m
Nonw
hit
e V
icti
m
Whit
e k
ills
whit
e
Nonw
hit
e k
ills
whit
e
whit
e k
ills
nonw
hit
eN
onw
hit
e k
ills
nonw
hit
e
Whit
e D
efe
ndant
Nonw
hit
e D
efe
ndant
Percent of Death Sentences in North Carolina, 1993-1997
(All Homicides, Weighted)
A. Categorical Analysis
First, consistent with racial threat theory, there is a stark difference in
death-sentencing rates between white and nonwhite victim cases.134 The
death-sentencing rate for white victim cases is 3.4 percent regardless of the
race of the defendant. This is more than doubled the death-sentencing rate
for nonwhite victim cases (1.6 percent, p < .01). Thus the aggravated mur-
der of a white individual is 3.4 times more likely to result in a death sen-
tence compare to the murder of a nonwhite individual.
Second, the death-sentencing rate for both white and nonwhite de-
fendants is statistically indistinguishable if the victim’s race is not taken into
account. This finding is consistent with much of the post-Gregg literature.
Finally, I examine defendant/victim racial configurations. How do capital
murder defendants fare in the justice system when judged in light of their
victim’s race? The most striking result is in the treatment of victims killed
by nonwhite defendants. When a nonwhite defendant kills a white victim,
the death-sentencing rate is 5.1 percent. However, when a nonwhite defend-
ant kills a nonwhite victim, the death-sentencing rate is only 1.5 percent.
This difference is statistically significant using a difference of proportions
test (p < .01). The highest death-sentencing rate occurs where a nonwhite
kills a white; the lowest occurs where a nonwhite kills another nonwhite.
134. I define nonwhites to include blacks, Hispanics, Asians, and other racial minori-
ties, but most individuals in this category are black. While several death-sentencing studies
simply make a distinction between whites and blacks, I believe that this is under-inclusive
because other racial minorities also suffer illegal discrimination in state and federal justice
systems.

30 Michigan State Law Review
The sentencing of white defendants does not differ significantly in terms of
their victim’s race. However, as in the case of nonwhite defendants being
significantly worse off when they commit interracial murders, white de-
fendants who commit interracial murders also appear worse off, but the
number of cases in that category is too small, rendering the ratio statistically
meaningless.
Generally speaking, inter-racial homicides command higher death-
sentencing rates than intra-racial homicides. This pattern fits in with previ-
ous findings based upon 1970s data from Florida135 and Georgia136 and
1990s data from Maryland.137 One explanation is that intra-racial homicides
tend to involve primary relations such as relatives, acquaintances, or friends.
These kinds of homicides are generally thought to carry lower levels of ag-
gravation than inter-racial homicides, which typically involve strangers and
thus pack higher levels of aggravation. My data support that explanation. In
cases where a nonwhite kills another nonwhite, twenty-one percent of those
receiving death sentences involve strangers. But in cases where a nonwhite
kills a white, the rate more than doubles: forty-four percent of those receiv-
ing death involve strangers.
On the basis of this descriptive analysis, I can surmise that a discerni-
ble pattern exists. On account of race alone, death penalty sentencing in
North Carolina is not evenhanded. Nonwhite killers of whites are over-
whelmingly more likely to receive the death penalty than any other racial
configuration. The full percentages are reported in Table 1. My analysis
thus far cannot fully account for the differential treatment of murder de-
fendants and victims since I have not yet controlled for legal and political
influences.
135. Radelet & Pierce, supra note 46.
136. BALDUS ET AL., supra note 7.
137. Paternoster et al., supra note 18, at 26.

Article Title 31
Table 1
Percentage of Death Sentences Imposed, Grouped by Racial Charac-
teristics and Configuration (Weighted)
ALL MURDER
CASES
DEATH ELIGIBLE
CASES
Death sentences imposed 2.5 percent
(99/3958)
5.8 percent
(99/1717)
Defendant
White defendant 2.7 percent
(38/1408)
5.9 percent
(38/647)
Nonwhite defendant 2.4 percent
(61/2550)
5.7 percent
(61/1070)
Victim
White victim 3.4 percent
(67/1945)***
7.1 percent
(67/938)**
Nonwhite victim 1.6 percent
(32/1982)***
4.3 percent
(32/747)**
Defendant/Victim Con-
figuration
White kills white 2.5 percent
(34/1333)
5.9 percent
(34/572)
Nonwhite kills white 5.1 percent
(33/644)***
9.0 percent
(33/365)***
White kills nonwhite 3.5 percent (5/141) 11.0 percent (5/45)

32 Michigan State Law Review
Nonwhite kills nonwhite 1.5 percent
(29/1974)***
3.9 percent
(29/738)***
Note: Death eligible cases are first-degree murder cases where at least one
statutory aggravating circumstance was found or the prosecutor seeks the
death penalty, and the defendant is more than seventeen years of age.
* p < .10 (two-tailed test); ** p < .05 (two-tailed test); *** p < .01 (two-
tailed test)
Will the lack of evenhandedness disappear in my results once I subject
the data to more rigorous statistical testing that accounts for linear depend-
encies and control for factors other than race, such as institutional rules sur-
rounding case facts and structural conditions pertaining to case processing?
B. Heckman Probit Analysis
1. Race and Prosecutorial Decision to “Go for Death.”
At the prosecutorial decision stage, the most important question I seek
to answer is: Does race still affect the prosecutor’s decision to seek the
death penalty in North Carolina? Table 2 reports Heckman probit estimates
explaining prosecutorial decision to reject a plea deal and to seek the death
penalty. Due to space constraints, I limit my discussion to the prosecutor’s
decision to seek death (Model 2). Overall, the models perform quite well as
indicated by the chi square test, which suggests that the results did not occur
by chance. Moreover, the reported rho of .66 indicates the level of associa-
tion between rejection of a plea agreement by the prosecutor and the deci-
sion to seek the death penalty. It lends credence to my analytical method,
which is capable of correcting for collinearities between the different prose-
cuting stages. To address any variability that may not be captured by my
aggregate-level predictors, standard errors are corrected for clustering on
county of offense. Generally speaking, the probability that North Carolina
prosecutors would seek the death penalty, conditional upon all variables
being held at their mean, is twenty-eight percent. Since interpretation of
probit estimates is less straightforward, I have calculated the marginal im-
pact of each statistically significant variable based upon the conditional
event probability. What do the results mean?
Using white defendants who kill white victims as the comparison cat-
egory throughout, I find that North Carolina prosecutors are ten percent less
likely to seek the death penalty when a nonwhite individual kills a white
individual than when a white kills a white, holding all other variables con-
stant at their mean. As I indicated earlier, white defendant/nonwhite victim
cases are too few to be successfully analyzed in the regression models. The
category of nonwhites-who-kill-other-nonwhites fails to reach statistical
significance in this model. My key finding that racial disparity does not

Article Title 33
reside in the prosecutorial stage would surely seem counter-intuitive to
many because it contradicts the old-style racism thesis, and it contradicts
conclusions reached by the Baldus Study in Georgia. However, I think my
finding makes theoretical sense. The historical understanding of racial dis-
crimination in criminal punishment in the South conjures up images of a
white prosecutor vigorously pursuing capital justice against a black defend-
ant when the victim is white. From that standpoint, my finding here indi-
cates that North Carolina is changing fundamentally and that this is a har-
binger of positive developments to come throughout the South. But further
elaboration is in order.
There is both a statistical and a substantive explanation for this find-
ing. Statistically speaking, my rigorous analytical method places more de-
mands on the data and it uses a two-step estimation procedure designed to
address the underlying issues of case selection bias and conditionality that
are common in capital prosecution data. Substantively, there is a logical
political explanation for my finding. As Edward Carmines, James Stim-
son,138Earl Black, and Merle Black139 have demonstrated, electoral politics in
American society, and particularly in the South, have indeed undergone
fundamental change since the 1970s due to the increasing importance of
race in election outcomes. Democratically elected district attorneys in the
North Carolina of the 1990s must respond to a broader electoral constituen-
cy than district attorneys who served before and during the 1980s when
nonwhites faced demoralizing obstacles of disenfranchisement.140 Owing to
legal and political reforms of the civil rights era, most notably the Voting
Rights Act of 1965 and Supreme Court decisions invalidating discriminato-
ry practices,141 nonwhites have gained substantial political clout and inde-
pendence, which prosecutors now ignore only at their own electoral peril.
As I further explain below, a strong electoral connection exists between
prosecutorial choices and voter ideology.
Table 2
Explaining Prosecutorial Decision Making in Murder Cases in
North Carolina, 1993-1997
138. EDWARD G. CARMINES & JAMES A. STIMSON, ISSUE EVOLUTION: RACE AND THE
TRANSFORMATION OF AMERICAN POLITICS (1989).
139. BLACK & BLACK, supra note 27.
140. Techniques at the polls that the General Assembly of North Carolina employed
to minimize black political participation and therefore black political power include poll
taxes and literacy tests. LUEBKE, supra note 25, at 117.
141. Id.

34 Michigan State Law Review
(1)
Prose-
cutor
Rejects
Plea
Deal
(2)
Prosecu-
tor Seeks
Death
Penalty
Independent Variable Coeffi-
cient
(Stnd.
error)
Mar-
ginal
Im-
pact
Coeffi-
cient
(Stnd.
error)
Mar-
ginal
Impact
Socio-Structural Factors
Nonwhite defendant/white
victim
.750**
(.444)
.75 -.359**
(.155)
.10
Nonwhite defend-
ant/nonwhite victim
-.025
(.279)
-.057
(.309)
Defendant age -.101
(.045)
.101***
(.015)
.03
Defendant age2 .002***
(.0006)
.0019 -.001***
(.0002)
.00028
Defendant education .227
(.258)
-.005
(.207)
Defendant sex -.143
(.409)
.325
(.281)
Victim age .005
(.024)
-.088*
(.060)
.02
Victim age2 -.00004
(.0002)
.0008*
(.0005)
.002
Victim education -.234***
(.043)
.22 .233*
(.164)
.07
Victim sex .151
(.143)
.0008*
(.0005)
.002
Institutional Factors
Electoral proximity * Coun-
ty ideology (Republican)
-.874***
(.282)
.84 2.275***
(.374)
.64
Electoral proximity .340*
(.231)
.33 -.905***
(.081)
.25
County ideology 2.289*
(1.627)
2.20 -
18.049**
*
(1.934)
5.05
Electoral proximity * Party
competition
.0007
(.005)
.009***
(.002)
.003

Article Title 35
Party competition .046***
(.008)
.04 .033***
(.013)
.009
County ideology * Party
competition
-.099***
(.016)
.09 -.132***
(.030)
.04
Republican district attorney
(D.A.) * County nonwhite
population
10.445**
*
(2.073)
2.92
Republican D.A. -.499
(.798)
-5.233***
(1.095)
1.47
County nonwhite popula-
tion
1.137**
(.645)
1.09 -4.337***
(1.347)
1.21
Republican D.A.* county
ideology * proximity
.057
(.066)
-.468***
(.103)
.13
Republican D.A. * proximi-
ty * county ideology *
county nonwhite population
-.313**
(.171)
.30 .206**
(.156)
.06
Male D.A. .645***
(.068)
.62 .942***
(.276)
.26
Black D.A. -.461
(.362)
.44 .885**
(.399)
.25
Public defender .545***
(.110)
.52 .791***
(.106)
.22
Defense attorney expertise
(Log)
.542***
(.087)
.52 1.300***
(.241)
.36
North Carolina Piedmont -.102
(.152)
North Carolina Coast -.291
(.195)
Legal Factors
First degree murder theory
2 (willful, deliberate, pre-
meditated killing)
.067
(.177)
First degree murder theory
3 (arson, rape or sex of-
fense, robbery, kidnapping,
burglary, etc.)
.951***
(.177)
.27
Prior homicide record of
defendant
.187
(.344)
1.085***
(.243)
.30
Multiple victims .665***
(.201)
.64 1.238***
(.412)
.35
Infliction of severe physical
pain on victim
-.031
(.030)
-.057
(.092)

36 Michigan State Law Review
Nonstatutory aggravating
circumstance (victim sup-
porting children)
1.526**
*
(.298)
1.46
Post mortem abuse -.355***
(.072)
.34 .017
(.102)
Barroom fight .239
(.628)
-1.674***
(.547)
.47
Offense heinousness index .248***
(.036)
.23 .023
(.131)
Motives
Sex .106***
(.032)
.10 .020
(.056)
Money -.164***
(.026)
.16 .026
(.118)
Hatred .121*
(.075)
.12 -.100
(.079)
Collateral crime -.082
(.071)
.279*
(.184)
.08
Heckman’s Lambda (λ) -- -- .790***
(.201)
--
Constant -
4.382**
*
(.464)
-- -6.923***
(1.309)
--
Number of observations
Censored observations
Uncensored observations
498
118
380
Chi square 15.40***
Conditional event probability
(π)
.96 .28
* indicates variable is statistically significant at p < .10 (one-tailed test);
** indicates statistical significance at p < .05 (one-tailed test);
*** indicates statistical significance at p < .01 (one-tailed test).
Table 3
Explaining Murder Trial Verdicts and Death Sentencing Outcomes in
North Carolina, 1993-1997
(3)
Trial Out-
come:
Con-
vict/Acquit
(4)
Penalty
Phase Out-
come:
Death/Life

Article Title 37
Independent Variable Coefficient
(Std. error) Mar-
ginal
Im-
pact
Coefficient
(Std. error) Mar-
ginal
Impact
Socio-Structural Fac-
tors
Nonwhite defend-
ant/white victim
.377
(.742)
.138***
(.028)
.08
Nonwhite defend-
ant/nonwhite victim
-.238
(.200)
-.059***
(.023)
.03
Defendant age .059
(.162)
.039**
(.018)
.02
Defendant age2 -.0007
(.002)
-.0005**
(.00002)
.0003
Defendant education
.453**
(.240)
.42 -.190**
(.083)
.11
Defendant sex 2.411***
(.861)
2.22 .035
(.184)
Victim age -.025
(.024)
-.014**
(.006)
.008
Victim age2 .0001
(.0002)
.0001***
(.00003)
.00006
Victim education .463
(.683)
.014
(.031)
Victim sex -.485
(.829)
-.113**
(.068)
.07
Institutional Factors
Electoral proximity -.008
(.031)
County ideology x
County nonwhite popu-
lation
-2.542**
(1.371)
1.47
County ideology 4.759**
(2.089)
4.38 .015
(.995)
County nonwhite popu-
lation
4.329***
(1.369)
3.98 .552
(.875)
Republican district at-
torney
.485**
(.209)
.45 -.042**
(.019)
.02
Male district attorney -.401***
(.103)
.23
Public defender 1.658***
(.303)
1.53 -.175
(.161)
North Carolina Pied-
mont
-.347
(.653)
.082***
(.012)
.05
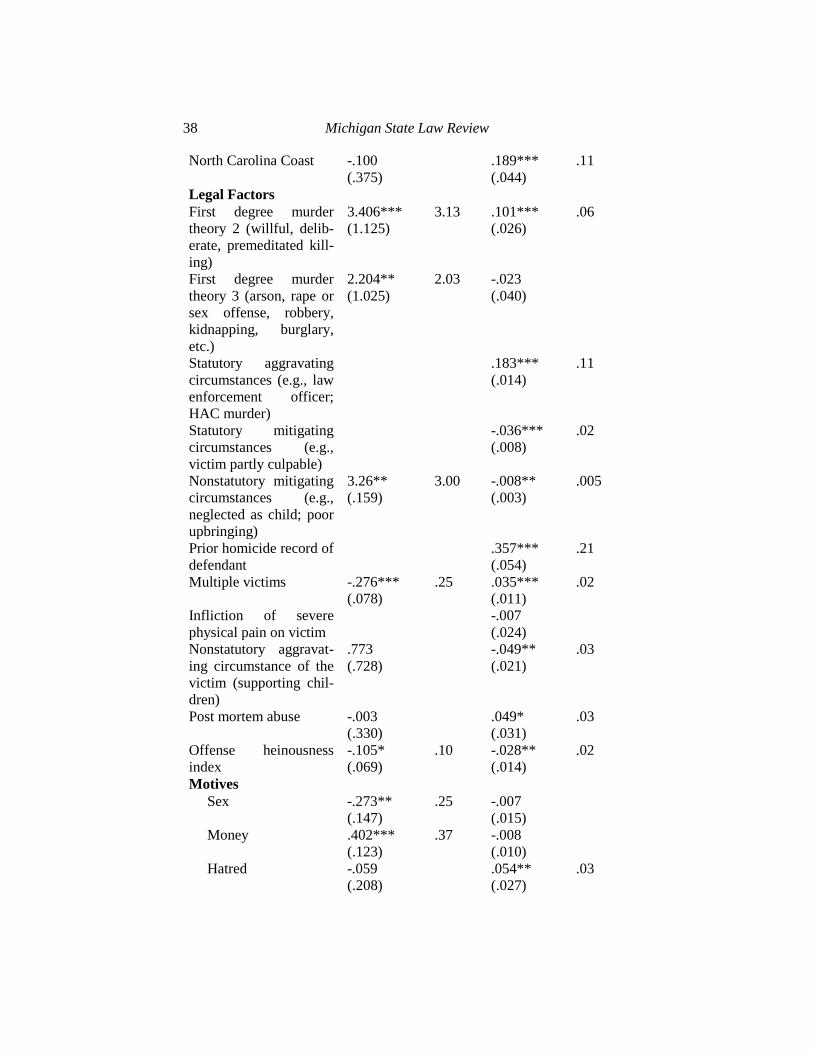
38 Michigan State Law Review
North Carolina Coast -.100
(.375)
.189***
(.044)
.11
Legal Factors
First degree murder
theory 2 (willful, delib-
erate, premeditated kill-
ing)
3.406***
(1.125)
3.13 .101***
(.026)
.06
First degree murder
theory 3 (arson, rape or
sex offense, robbery,
kidnapping, burglary,
etc.)
2.204**
(1.025)
2.03 -.023
(.040)
Statutory aggravating
circumstances (e.g., law
enforcement officer;
HAC murder)
.183***
(.014)
.11
Statutory mitigating
circumstances (e.g.,
victim partly culpable)
-.036***
(.008)
.02
Nonstatutory mitigating
circumstances (e.g.,
neglected as child; poor
upbringing)
3.26**
(.159)
3.00 -.008**
(.003)
.005
Prior homicide record of
defendant
.357***
(.054)
.21
Multiple victims -.276***
(.078)
.25 .035***
(.011)
.02
Infliction of severe
physical pain on victim
-.007
(.024)
Nonstatutory aggravat-
ing circumstance of the
victim (supporting chil-
dren)
.773
(.728)
-.049**
(.021)
.03
Post mortem abuse -.003
(.330)
.049*
(.031)
.03
Offense heinousness
index
-.105*
(.069)
.10 -.028**
(.014)
.02
Motives
Sex -.273**
(.147)
.25 -.007
(.015)
Money .402***
(.123)
.37 -.008
(.010)
Hatred -.059
(.208)
.054**
(.027)
.03

Article Title 39
Collateral crime -.249
(.221)
-.003
(.010)
Heckman’s Lambda (λ) -- -.351***
(.006)
--
Constant -10.602***
(2.090)
-10.602***
(2.090)
--
Number of observations
Censored observations
Uncensored observa-
tions
250
17
233
Chi Square 7.67***
Conditional Event Prob-
ability
.92 .58
* indicates variable is statistically significant at p < .10 (one-tailed test);
** indicates statistical significance at p < .05 (one-tailed test);
*** indicates statistical significance at p < .01 (one-tailed test).
Other factors beside race are important in explaining prosecutorial de-
cision to seek the death penalty. Among these are socio-structural factors
such as age and social class status. As expected, the age of both the defend-
ant and victim have a statistically significant impact in prosecutorial deci-
sion making. However, the effect is less than five percent in both instances.
Theoretically more interesting, though, is the curvilinear nature of the age
effects. These indicate that North Carolina prosecutors favor very old and
very young defendants and victims for more lenient treatment compared to
middle-aged individuals. My social class argument receives mixed support.
Whereas the defendant’s social class status, represented here by educational
attainment, fails to achieve statistical significance, the victim’s class status
is statistically significant. Prosecutors are seven percent more likely to seek
the death penalty when the victim is more educated rather than less. This
finding is consistent with my social threat argument that individuals with
“value” would typically command more severe punishment for their assail-
ants.
Strategic political behavior is always an option for political actors, in-
cluding those in the judiciary, who may seek to advance public policy or
even their own narrow political objectives.142 It is well known that in the
United States politicians including local prosecutors often resort to aggres-
sive anti-crime appeals in order to improve their chances for electoral suc-
cess.143 Accordingly, I include in my analysis variables designed to capture
the importance of the political process in prosecutorial choices. Tapping
142. LEE EPSTEIN & JACK KNIGHT, THE CHOICES JUSTICES MAKE (1998).
143. Isaac Unah & K. Elizabeth Coggins, Punishment Politics: Gubernatorial Rheto-
ric, Political Conflict, and the Instrumental Explanation of Mass Incarceration in the Ameri-
can States (June 22, 2011), available at SSRN: http://ssrn.com/abstract=1870385.

40 Michigan State Law Review
into potential electoral and constituency connections in prosecutorial deci-
sion making are variables such as electoral proximity, partisan competition,
and political ideology. Hall’s144 study of capital punishment decision mak-
ing by judges in four states, including North Carolina, shows that justices
who face electoral competition and accountability are strongly influenced in
their decision making by their prospect for reelection.
I find that electoral incentives do strongly shape prosecutorial strategy
in the decision to seek the death penalty. North Carolina prosecutors are
sixty-four percent more likely to seek the death penalty if their election is
only a year away and the district is Republican. I further examine the sensi-
tivity of this conditional relationship by exploring interaction with addition-
al predictors, including the partisanship of the district attorney (D.A.).
I find that this conditional probability attenuates by thirteen percent if
the D.A. is Republican as indicated by the three-way interaction of Republi-
can D.A., county ideology, and electoral proximity. Furthermore, the proba-
bility is increased by six percent if the county has a high population of
nonwhite residents. The main effects of county nonwhite population and
Republican D.A. suggest that these predictors are negatively associated with
the probability of seeking the death penalty. But of all the political predic-
tors analyzed, the prosecutor is most likely to seek the death penalty when
the county nonwhite population is high and the prosecutor is Republican.
Under these conditions, the probability is 292% higher that a North Carolina
Rule 24 hearing would be held, formally signaling prosecutorial intent to
pursue the death penalty.
My analysis further shows that electoral proximity and the intensity of
two-party competition in the prosecuting counties also evince codependent
explanations. On average, the probability is slightly higher (three percent)
that a prosecutor facing a competitive election in the next year will seek the
death penalty than one who is not facing electoral pressure in the near fu-
ture. Overall, this analysis demonstrates the importance of the political pro-
cess in the low visibility decisions that criminal prosecutors must make.
I examine the extent to which there is a racial or gender gap among
prosecutors themselves in seeking the death penalty. This is important in
light of research showing that woman and minorities exhibit “softer” or
more compassionate attitudes toward crime and punishment than white
males.145 I find that white male prosecutors are twenty-six percent more
likely to seek the death penalty than female prosecutors. This finding should
be understood in the general context of gender identity among North Caro-
lina prosecutors. For the period covered in my study, over ninety-five per-
144. Hall, supra note 77.
145. Nagel & Johnson, supra note 89; Hurwitz & Smithey, supra note 89.
Article Title 41
cent of district attorneys in the state were men. Only two women were serv-
ing as district attorneys statewide.
Black prosecutors are also rare in North Carolina; there are only two
prosecutors statewide during the period I study. Interestingly, black prose-
cutors are actually twenty-five percent more likely to seek the death penalty
than white prosecutors, even after controlling for electoral proximity. I think
this is because black prosecutors must be particularly and credibly tough on
crime and enjoy cross-racial appeal in order to win popular local elections,
especially in majority white districts such as Orange and Chatham Counties
in North Carolina, where a “tough as nails” black prosecutor, Carl Fox,
served for twenty-five years (including the years of this study) before being
appointed a superior court judge by Governor Mike Easley in 2005.146
Resource asymmetry is an endemic problem in local criminal prosecu-
tion. The state’s attorney typically commands greater financial resources
than the defendant’s attorney, especially if the defendant is indigent and
requires a public defender. Meanwhile, rich defendants are able to hire pri-
vate lawyers for their own defense. Does resource asymmetry have a mate-
rial impact on prosecutorial choices? I find that it does. Defendants repre-
sented by public defenders are twenty-two percent more likely to face capi-
tal prosecution than those who retain their own private criminal defense
lawyer. Contrary to expectation, the prosecutor is significantly more likely
to seek the death penalty when the defendant’s attorney is experienced. This
finding is perhaps an artifact of the measure itself, which is the log of how
much money was paid to the attorney for this service. Under this measure,
truly complicated murder cases, such as serial murders, will command high-
er payout and therefore indicate greater attorney experience. But such cases
are highly likely to be prosecuted capitally in the first place. The Heckman
selection index is statistically significant, giving credence to my analytical
method, which accounts for all cases “expected” to be prosecuted capitally
but may not have been because of an existing plea arrangement.
Deciding whether to seek the death penalty is a difficult choice for
most prosecutors and likely one of the most agonizing. Because it is a sol-
emn choice of obvious and overwhelming finality, legal requirements exist
to guide and constrain that choice. I find that at the death-seeking stage of
the process, legal factors do play an important role as I expected. In particu-
lar, felony murders are twenty-seven percent more likely to precipitate a
capital prosecution. Also, the prosecutor is thirty percent more likely to seek
the death penalty if the defendant has a prior homicide conviction and thir-
ty-five percent more likely to seek the death penalty if the defendant mur-
dered multiple victims. Most of the motives I examine fail to reach statisti-
146. Superior Court Judges for District 15B, THE NORTH CAROLINA COURT SYSTEM,
http://www.nccourts.org/County/Orange/Staff/SCJudges/crfox.asp (last visited Jan. 16,
2012).

42 Michigan State Law Review
cal significance in this model with the only exception being the motive re-
lated to involvement in a collateral offense. In the next section of the article,
I focus on the penalty phase.
2. The Decision to Impose Capital Punishment
For crime victims and defendants along with their families, the most
important part of the criminal process is sentencing because it carries the
most vivid material consequences for the crime. Table 3 reports the results
for the jury verdict on guilt or innocence. However, I focus my discussion
on the results for the penalty phase (Model 4). The results strongly support
my theoretical framework, showing that socio-structural factors, including
racial threat, carry important weight in the decision to impose the death
penalty once a conviction has been obtained.
A. The Effects of Race and Other Socio-structural Factors on Capital Pun-
ishment
I find a strong linkage between race and the capital punishment in
North Carolina. The configuration of nonwhite defendant and white victim
is particularly strong and it authenticates my earlier reported finding in Fig-
ure 2. Nonwhite defendants who murder white victims fare particularly
poorly; they are eight percent more likely to receive the death penalty than
white defendants who murder white victims, even after controlling for ag-
gravating and mitigating circumstances sanctioned by the North Carolina
General Assembly. Conversely, nonwhite defendants who murder nonwhite
victims are three percent less likely to receive the death penalty than white
defendants who murder white victims. Thus, nonwhite victims suffer a race
penalty, while nonwhite defendants receive a race-based leniency in the
punishment for this category of intra-racial homicides. Putting these find-
ings into proper perspective is the fact that in theory, race is not supposed to
matter at all in capital sentencing. Insufficient cases in the white defend-
ant/nonwhite victim configuration preclude us from including that variable
in the regression analysis.
How do my findings compare with other death sentencing studies? I
can transform the probit coefficient of .138 for the nonwhite defendant
white victim configuration into a logistic estimate and then derive an odds
ratio, which I can then use to compare my findings to the Baldus Study.
Such a comparison is crude, but useful because it allows us to derive sug-
gestive indications of either change or continuity in criminal punishment
over time and across space. The transformation leads to an odds ratio of

Article Title 43
1.28.147 Thus, race effects on sentencing are less pronounced in North Caro-
lina than in Georgia, where based upon data from the 1970s, the Baldus
Study placed the odds of receiving death at 4.3 for black defendants con-
victed of killing whites. In Maryland, Paternoster and his colleagues report-
ed their findings in terms of probability rather than odds ratio.148 They find
that the probability of a death sentence for black-on-white killings is .14,
which is higher than the probability of .08 that I report for North Carolina.149
I conclude that despite reforms designed to purge race from capital sentenc-
ing, race continues to endure as an illegitimate factor in capital sentencing
even in the 1990s.
Numerous other structural factors associated with both defendants and
victims also prove important in capital sentencing in North Carolina. In
particular, very old defendants tend to receive the benefit of the doubt,
whereas very young victims are slightly more likely to produce death sen-
tences for their assailants. Whereas I find that males are more likely to be
convicted at the trial level, being a convicted male offender actually fails to
evince a statistically significant relationship with capital sentencing. But the
story is slightly different for male victims whose killing I find is seven per-
cent less likely to lead to a death sentence than female victims.
A recurrent sociopolitical question regarding the death penalty is the
extent to which outcomes in capital cases are explained by race versus class.
One thesis expressed by Carl Degler is that “[r]ace in the South, as in the
nation, has always overwhelmed class.”150 Opponents of the racial impact
thesis, however, insist that the linkage between race and capital punishment
is preposterous, reasoning that insofar as there is any racial effect, such ef-
fect is actually social class bias masquerading as a racial effect.151 My test of
this claim reveals no evidence that social class status of the victim as meas-
ured by educational attainment plays a statistically significant role in capital
sentencing. However, I do find strong evidence that the defendant’s social
class status plays a sizeable role. More educated convicts are eleven percent
less likely to be sentenced to death even after controlling for legal and insti-
147. The Heckman probit coefficient .138 can be easily transformed into a logistic
coefficient by simply multiplying it by a normalization factor of 1.8138. JOHN H. ALDRICH &
FORREST D. NELSON, LINEAR PROBABILITY, LOGIT, AND PROBIT MODELS 44 (Sage Publica-
tions Ser. No. 07-045, 1984). The result is a logistic coefficient of .250. The odds ratio of this
logistic coefficient is simply its exponent, i.e., e.250 = 1.28. See generally id.; see also
ALFRED DEMARIS, LOGIT MODELING: PRACTICAL APPLICATIONS 45 (1992).
148. Paternoster et al., supra note 18, at 27.
149. Id., at 27-28.
150. Carl N. Degler, Racism in the United States: An Essay Review, 38 J. S. HIST.
101, 102 (1972).
151. Gary Kleck, Racial Discrimination in Criminal Sentencing: A Critical Evalua-
tion of the Evidence with Additional Evidence on the Death Penalty, 46 AM. SOC. REV. 783
(1981).
44 Michigan State Law Review
tutional factors. Therefore, on the question of race versus class, Degler’s
observation is only partially confirmed. Race definitely matters in capital
sentencing. But while the defendant’s social class status also matters, the
victim’s does not.
In the late 1990s, media coverage of several bias-motivated killings
brought the issue of hate-crime to the national agenda. The dragging death
of a black man, James Byrd Jr., by three white supremacists in Jasper, Texas
in 1998 and the killing of a gay college student, Matthew Shepard, in Wyo-
ming the same year are just two of many examples of hate crimes in the
United States. To demonstrate society’s revulsion toward such crimes, Con-
gress and states such as North Carolina and Wisconsin responded by enact-
ing punishment enhancement laws for hate-motivated crimes. I tested the
importance of hatred and other criminal motives in death sentencing. Of the
five motives examined, only hate-motivated killings evinced statistically
significant impact, suggesting an expression of low tolerance among North
Carolinians for hate-motivated offenses during the 1990s.
Finally, I consider the importance of multiple killings in capital sen-
tencing. A convict who kills multiple victims is two percent more likely to
receive the death penalty than one who kills a single victim. But surprising-
ly, killing multiple victims is relatively less important than one might sus-
pect. The analysis suggests that the effect on capital sentencing for a convict
killing multiple victims is far less than that for the situation in which a
nonwhite kills one white victim. In North Carolina, it appears that killing
multiple victims is less important in capital sentencing than when a
nonwhite kills one white person.
B. Effects of Institutional Factors on Capital Punishment
Because the decision to impose capital punishment is carried out by an
unelected jury, institutional variables associated with the political process
are not expected to play a particularly strong role, except where community
ideology and values are concerned. According to the results, only a few
mainstream institutional factors are important in explaining death sentenc-
ing decisions, including predictors associated with the district attorney and
the local community where the crime occurred. I find that Republican pros-
ecutors are two percent less likely to win a death sentence than Democratic
prosecutors. In other words, during the sentencing phase, convicts are actu-
ally better off facing a Republican prosecutor than a Democratic one. Ap-
parently, Democratic prosecutors are more convincing in terms of their ad-
vocacy than Republican ones. Male prosecutors are even less successful
compared to their female counterparts, again indicating that juries find fe-
male advocates more convincing at the sentencing phase. Male prosecutors
are twenty-three percent less likely to win a death sentence compare to fe-
male prosecutors. In highly conservative counties, an increase in the

Article Title 45
nonwhite population reduces the chances of a death sentence by 1.47 times
as indicated by the interaction of county ideology and county nonwhite
population. This finding conflicts with the racial threat hypothesis, but con-
forms to the political change explanation. I created three dummy variables
to represent the mountain, piedmont, and coastal regions of North Carolina
to test for differences in political attitude toward capital punishment across
the state. The mountain region serves as the comparison category. It appears
that V.O. Key is correct when he posited significant cultural variation with-
in different sections of North Carolina. Region does make an important dif-
ference in the sentencing phase. Convicts in the piedmont, the most urban-
ized region of the state, including large cities such as Charlotte, Durham,
and Raleigh, are five percent more likely to receive the death penalty com-
pared to convicts in the mountain region. Importantly, the effects more than
double in the coastal sand hills, traditionally the most conservative region of
the state.
C. The Effects of Legal Factors on Capital Punishment
Is the capital sentencing system functioning as intended? According to
legal theory, homicide prosecution and sentencing should follow exacting
standards prescribed by statute. Therefore, only legal factors associated with
the case should have statistically significant impact on the disposition of
capital cases. Unfortunately, the empirical literature and my results here
suggest otherwise; the system is far from ideal. Nevertheless, I do highlight
several legal factors that emerge as important correlates of capital sentenc-
ing.
Statutory aggravating and mitigating circumstances constitute the cor-
nerstone of capital punishment in North Carolina. Thus, it comes as no sur-
prise that statutory aggravating factors, such as the killing of a peace officer,
increase the probability of a death sentence by eleven percent after control-
ling for other legal, institutional, and structural conditions. Statutory miti-
gating circumstances decrease a defendant’s criminal culpability and the
risk of a death sentence. I find that the effect of statutory mitigating factors
is also consistent with my theoretical expectation. But this raises an im-
portant question.
How truly mitigating are statutory mitigating circumstances? Mitigat-
ing evidence is not intended to excuse or justify the crime for which a de-
fendant stands convicted, but to help explain it in order to avoid a death
sentence. Thus, mitigation is not a matter of equivalence with statutory ag-
gravating factors, but a matter of impact. The impact of three statutory miti-
gating factors in lessening the probability of a death sentence need not be
equivalent to the impact of three statutory aggravating factors in increasing
the likelihood of a death sentence, but as the Supreme Court stated in
Eddings v. Oklahoma, the importance of mitigating circumstances should

46 Michigan State Law Review
“be duly considered in sentencing.”152 How much credence do juries place
on mitigating evidence? My findings indicate that statutory mitigating fac-
tors (such as killing under duress or deplorable childhood) do attenuate the
likelihood of being sentenced to death, but there is significant discounting
of mitigating evidence by the jury, making its effect quite anemic indeed
(only two percent) compared to the effect of aggravating factors on the
death sentencing decision (eleven percent).
Figure 3 presents a comparative assessment of the effects of aggravat-
ing and mitigating circumstances on the probability of receiving a death
sentence. It shows that mitigating factors are only weakly associated with
lowering the chances of receiving a death sentence. Whereas the slope for
the effects of aggravating circumstances is fairly steep, the slope for the
effects of mitigating circumstances is virtually flat, raising concerns about
the efficacy of mitigating factors. I conclude that mitigating factors are not
very mitigating. Aggravating factors have a far more dramatic effect in
leading to a death sentence than do mitigating factors in lessening the
chances of a death sentence. A jury would need to find six mitigating fac-
tors present in a case to effectively counteract the effect of a single aggra-
vating factor in capital sentencing.
Figure 3
Effects of Aggravating and Mitigating Circumstances on the Probability
of Receiving a Death Sentence
0.84
0.51
0.58
0.64
0.69
0.79
0.75
0.57
0.520.540.540.55
0.59
0.58
0
0.1
0.2
0.3
0.4
0.5
0.6
0.7
0.8
0.9
1 2 3 4 5 6 7
Number of Aggravating or Mitigating Circumstances
Prob
ab
ilit
y o
f D
eath
Sen
ten
ce
Aggr. Circumstances
Mitg. Circumtstances
152. 455 U.S. 104, 116 (1982).
Article Title 47
Of all the legal predictors examined, none has stronger effect on the
probability of a death sentence than prior homicide record. Defendants with
a history of violence, such as parolees or fugitives who commit another
murder, are twenty-one percent more likely to receive the death penalty than
convicts without a prior felony record. First-degree murder involving will-
ful, deliberate, or premeditated killing is six percent more likely to lead to a
death sentence. However, felony murders which typically lack a strong ele-
ment of premeditation fail to achieve statistical significance. I conclude that
legal factors are a strong component of the application of capital punish-
ment.
CONCLUSIONS
Justice Anthony Kennedy and other members of the Supreme Court
agree that racial bias undermines the integrity of the United States justice
system. Under the United States Constitution and under several state death
penalty statutes, only legal factors associated with a crime should influence
capital prosecution and sentencing. After analyzing a rich set of capital
prosecution and sentencing data from North Carolina, the inescapable con-
clusion is that this ideal is far from reality. Beyond legitimate aggravating
and mitigating circumstances, several illegitimate factors do indeed influ-
ence the decision to sentence defendants to death. Among these illegitimate
factors is race.
The central question of this Article was straightforward: To what ex-
tent does race still matter in capital prosecution and sentencing in North
Carolina, a state that prides itself, in the words of V.O. Key, as a “progres-
sive plutocracy”? It is inadequate to address this important question simply
by examining distributive outcomes as many previous researchers have
done. Instead, I have argued in favor of analyzing capital punishment as a
process, a political process that is infused with highly conditional decision-
making procedures. I formulated a theoretical model encompassing legal,
institutional, and socio-structural conditions. My analytical framework and
data suggest that the answer to the above question is more nuanced and that
it depends upon which aspect of the capital prosecution process I examine.
If we focus on the jury’s decision at the penalty phase, we find evidence of
continuity in that race remains in essence a non-statutory aggravating factor
for the death penalty. The impact of race in sentencing is present and non-
trivial. In particular, the race of the victim still exerts a significant amount
of influence in determining which homicide defendant lives or dies.
If, on the other hand, we turn our attention to earlier stages of prosecu-
torial decision making as cases are funneled through the system, my core
findings contradict the prevailing empirical literature.
In that vein, the most surprising finding is that prosecutors are not ex-
hibiting racially conscious tendencies in their decision to seek the death
48 Michigan State Law Review
penalty. This represents a change from the traditional view of North Caroli-
na prosecutors. Of course individual districts might not exhibit the same
tendencies as I report, but overall, I am confident that North Carolina prose-
cutors as a whole are exhibiting signs of change. My decomposition of the
death penalty system permits me to account for the inter-linkages between
different stages of the capital punishment decision-making process, and to
arrive at an important new insight toward our understanding of prosecutorial
decision making in the processing of society’s most violent offenders.
I think my findings reflect the latent effects of decades of aggressive
political action involving institutional reforms such as the Voting Rights
Act of 1965 and numerous Supreme Court decisions in cases such as Fur-
man v. Georgia,153 Woodson v. North Carolina,154 and Reynolds v. Sims,155
which substantially expanded defendants’ rights and political representation
for formerly disenfranchised citizens. It appears that the political effects of
these reforms have matured among government officials. Elected politicians
are responding to the presence of a significantly diversified and attentive
electoral constituency of nonwhites to safeguard public policy and to pre-
serve their jobs.
This conclusion comes into sharper focus when contrasted with the
behavior of jurors who are not politically accountable. While elected prose-
cutors have become race-neutral in their decision to seek the death penalty,
sentencing jurors remain race-conscious in determining which convicts will
live and which will die, thus confirming the racial threat theory. The prob-
lem of racial disparity in capital sentencing is therefore most acute at the
sentencing stage, where ordinary citizens are the key deciders. It suggests
that racial attitudes are hard to change at the individual level and judicial
officials must be proactive in educating jurors about hidden sources of bias
in their decision making.
APPENDIX A: DATA SOURCES AND MEASUREMENTS
In Appendixes A and B, I provide detailed information about my re-
search design and measurements for purposes of future replication. I will
also make my data available to all interested parties after this paper is pub-
lished.
My data came from numerous sources. I list these sources below,
along with the variable coding scheme. For most variables, I relied on mul-
tiple sources to gather my information. This allows us to cross check the
validity of official records. For example, I use briefs filed by defendants and
prosecutors to construct case facts. But I also relied on the medical examin-
153. 408 U.S. 238 (1972).
154. 428 U.S. 280 (1976).
155. 377 U.S. 533 (1964).
Article Title 49
er’s autopsy notes to verify crime facts for consistency. I reconcile any dif-
ferences through police reports of the offense.
Legal Factors
North Carolina criminal statutes list both aggravating and mitigating
circumstances, which I coded as follows:
Statutory aggravating circumstances = count of statutory aggravating
factors found by jury
Statutory mitigating circumstances = count of statutory mitigating
factors found by jury
Poisoning, lying-in-wait, imprisonment, torture, starvation = 1 if
present; 0 otherwise
Willful, deliberate, and premeditated killing = 1 if present; 0 other-
wise
Felony murder (homicide accompanied by another felony) = 1 if pre-
sent; 0 otherwise
Multiple victims = 1 if 2 or more victims; 0 if 1 victim
Motives I used trial briefs, police reports, arrest warrants, and oral interviews
with prosecutors and defense attorneys to determine criminal motive. Each
of the following motives: hatred, financial, sexual, rage, and motive “related
to other crimes” was measured as follows:
0 = no evidence of this item exists
1 = some evidence of this item exists
2 = evidence of this item exist beyond reasonable doubt
3 = strong evidence of this item exists
Hatred involves long-term hatred of victim; retaliation or revenge for
prior harm done to defendant or another; avenging the role played by judi-
cial officer in the exercise of his/her duty; avenging the role played by po-
lice officer; racial animosity; animosity toward victim because of victim’s
sexual orientation. Money involves killing to obtain money or item of mon-
etary value; contract killing for money; collecting insurance proceeds; ob-
taining inheritance or property transfer as a result of the victim’s death.
Rage involves immediate rage or frustration (e.g., over victim’s conduct
during an illegal activity); killing to experience gratification or thrill;
demonstrating physical or psychological prowess; no rage apparent indicat-
ing complete indifference to value of human life. Sex involves desire for
sexual gratification, retaliation for sexual refusal, and retaliation for sexual
rivalry (jealousy). Collateral and other crimes involve facilitating commis-
sion of another crime; panic (e.g., defendant became frightened when sur-
prised by crime victim in the course of a burglary); shootout with crime
victim; crime victim resisted (e.g., pushed silent alarm); silencing a witness

50 Michigan State Law Review
to another crime; escaping apprehension, trial, or punishment; retaliation for
unpaid drug debt or dispute related to drug trade.
Sources include: North Carolina Office of the Chief Medical Examin-
er (OCME). Files from these offices contain useful information about the
victim, including demographic factors such as race, sex, and age and infor-
mation about probable cause of death and a narrative summary of the cir-
cumstances surrounding the death and the nature of the wounds sustained by
the victim. Each victim has an OCME case number, which makes it rela-
tively easy to track information throughout the data collection process. The
Department of Corrections website was used to verify defendant demo-
graphic characteristics and prior criminal record.
Race: 1 = white; 0 = nonwhite
Age: actual chronological age
Sex: 1 = male; 0 = female
Education: 0 = high school dropout or currently in
grade school
1 = high school graduate or some higher
education
2 = college graduate or higher
Stranger: 1; 0 otherwise
Post-mortem abuse: 1; 0 otherwise
Defendant’s Criminal History
I examined court records, including indictments sheets; records on ap-
peal; superior court files; jury instructions and verdict sheets for both guilt
and penalty phases; defendants’ briefs; state’s briefs; trial court issues and
recommendations forms; and opinions from the North Carolina Court of
Appeals and the North Carolina Supreme Court. I also examined police
information network records of previous arrests and convictions; newspa-
per/journalistic accounts of the homicide; and North Carolina Department of
Corrections’ website. Finally, I interviewed prosecuting and defense attor-
neys to obtain more information about their cases.
Prior criminal record = actual number of prior felony convictions
Institutional Factors
Electoral proximity: 0 = four years before prosecutor’s next election
1 = three years before prosecutor’s next election
2 = two years before prosecutor’s next election
3 = one year before prosecutor’s next election.
Electoral competition: 100%-[% vote for winner + % margin of victo-
ry + 1 (if uncontested seat, 0 otherwise) + 1 (if safe seat, 0 otherwise)]/4. A
Article Title 51
safe seat is one where the winner won by at least 30% of the vote. By this
measure electoral competition is zero if there is absolutely no competition in
the district.
County ideology: Percent vote for Republican candidate for Senate in
1992 and 1996
Prosecutor’s party affiliation: 1 = Republican; 0 = Democrat
Prosecutor’s race: 1 = black; 0 = white
Prosecutor’s sex: 1 = male; 0 = female
Public defender: 1 if public defender or court appointed attorney; 0 =
attorney retained privately
Defense lawyer expertise: Ratio of total dollar amount paid to total
hours billed
County nonwhite population: Proportion of county of offense that is
nonwhite
Location: Dummy variables representing Mountain, Piedmont, and
Coastal regions of the state.
APPENDIX B: MULTI-STAGE STATISTICAL SAMPLING
Stage 1: selecting judicial districts. There are forty-four judicial dis-
tricts in North Carolina representing a total of one hundred counties. Each
judicial district is headed by one district attorney who manages the prosecu-
tion of cases in the counties within that district. This explains why I selected
cases by judicial districts. In order to obtain a broad geographic representa-
tion of the state, I randomly selected twenty-six judicial districts.
Stage 2: selecting cases from selected districts. Overall, 3990 known
defendants were charged with homicide from January 1, 1993, to December
31, 1997. Cases from unselected districts were removed to meet budgetary
constraints, leaving 2504 cases from which I generated my analytical sam-
ple. In it, ninety-nine defendants were sentenced to death and 303 were sen-
tenced to life in prison based upon a first-degree murder conviction. De-
fendants in 181 second-degree murder cases also received life sentences. I
randomly selected 10% of these for analysis (eighteen cases) because prose-
cutors have been known to undercharge otherwise death eligible offenses
(see note 11). Similarly, I randomly selected an additional one hundred cas-
es (5.2%) from the remaining 1921 cases with acquittals and term sentences
of less than life in prison. My core analysis is, therefore, based upon 520
cases, representing 520 individual defendants who form my unit of analysis.
Overall, the cases represent eighty of the one hundred counties of North
Carolina. I created sampling weights to reflect the differing sampling prob-
abilities in the two sampling stages and were able to map the sample back to
the population. Since regression analysis assumes the use of observed rather
than weighted data, I restricted my use of weighted data to descriptive anal-
yses.
Recommended