Emmanuel Faber
The Premium Review Conference
Paris – December 1st, 2011
2
Disclaimer
This document contains certain forward-looking statements concerning DANONE. Although
DANONE believes its expectations are based on reasonable assumptions, these forward-looking
statements are subject to numerous risks and uncertainties, which could cause actual results to
differ materially from those anticipated in these forward-looking statements. For a detailed
description of these risks and uncertainties, please refer to the section “Risk Factors” in
DANONE’s Annual Report (which is available on www.danone.com). DANONE undertakes no
obligation to publicly update or revise any of these forward-looking statements. This document
does not constitute an offer to sell, or a solicitation of an offer to buy, Danone shares.
3 3
Danone Model in Motion
Strong year-to-date performance

4
Sales up +7.7% like-for-like in the first 9 months
€ 12,711 mln
3,2%
6,9%
7.7%
FY 2009 FY 2010 9M 2011
Like-for-like sales growth
+ 3.2% volume
+4.5% value
7.7%
9M 2011

9M 2011 - Broad based growth
5
9,2%
10,4%
13,6%
5,2%
Medical
Baby
Waters
Dairy
12,9%
19,5%
2,6%
ROW
Asia
Europe
Like-for-like sales growth by division and by region
986 1 183
1 427
1 713
2 000
2007 2008 2009 2010 2011 2012
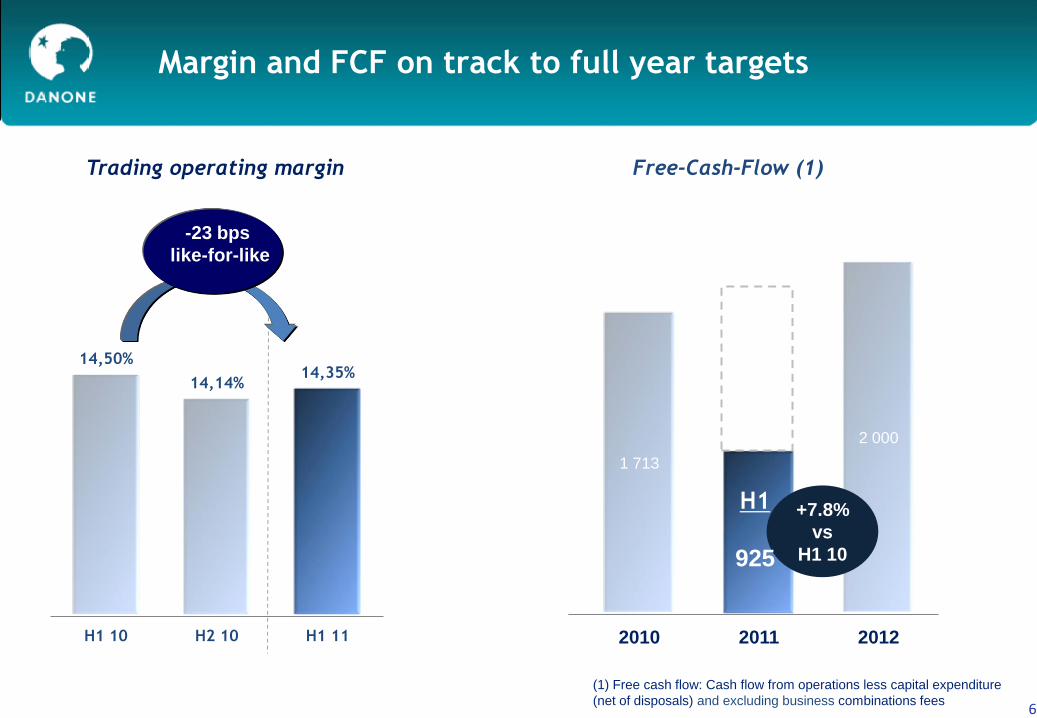
Margin and FCF on track to full year targets
6
Trading operating margin
-23 bps
like-for-like
14,50%
14,14% 14,35%
H1 10 H2 10 H1 11
+7.8%
vs
H1 10
H1
925
Free-Cash-Flow (1)
(1) Free cash flow: Cash flow from operations less capital expenditure
(net of disposals) and excluding business combinations fees

7 7
Danone Model in Motion
Solid growth platforms
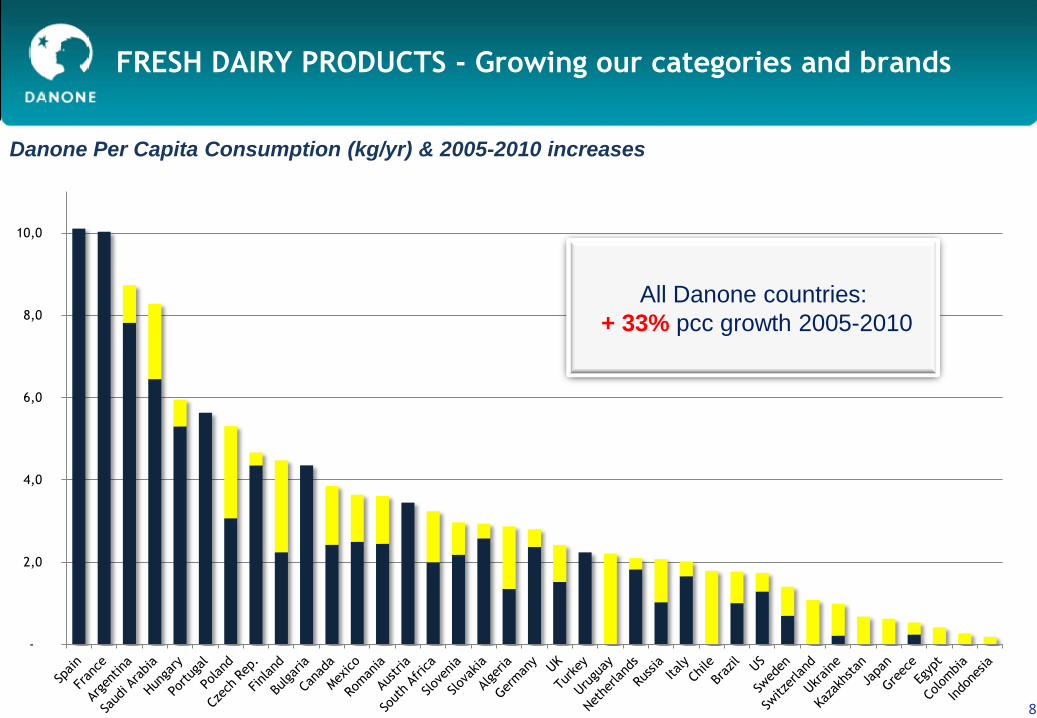
FRESH DAIRY PRODUCTS - Growing our categories and brands
8
Danone Per Capita Consumption (kg/yr) & 2005-2010 increases
8
-
2,0
4,0
6,0
8,0
10,0
All Danone countries:
+ 33% pcc growth 2005-2010

FRESH DAIRY – Continuous outstanding growth in Latam
70 % Market share
(volume – YTD)
+0.7 pts vs LY
22 % Market share
(volume – YTD)
+1.2 pts vs LY
44 % Market share
(volume – YTD)
+1.5 pts vs LY
28 % Market share
(volume – YTD)
+1.6 pts vs LY
Source : Nielsen 9

Sales – Danone Fresh Dairy Products*
FRESH DAIRY US : adjusting the model
– 10 –
CAGR
+10 %
*Includes Danone US [Ex-Frusion & LaCreme] & Stonyfield
Danone Oikos preffered to competitor
Source: IRI
Market Share by Segment
10

Deal announcement
Collaboration initiatives
Deal approval
12/2010
Joint Sales Team Pilot
Joint Company
2012
Strategic Plan &
Operating Models
announced
SAP Pilot
10/2011
Joint HQ, &
Joint Managem
ent
11
Unimilk – Integration proceeding as planned
Segment the portfolio
Drive efficiency to invest
behind brands
Integration
Integration milestones
Integration plans on-track : One merged Danone-Unimilk company on 1 January 2012
Unimilk performing as expected, with focus on profitability improvement
9/2011 7/2011
3/2011
9/2010
6/2010
2011 priorities
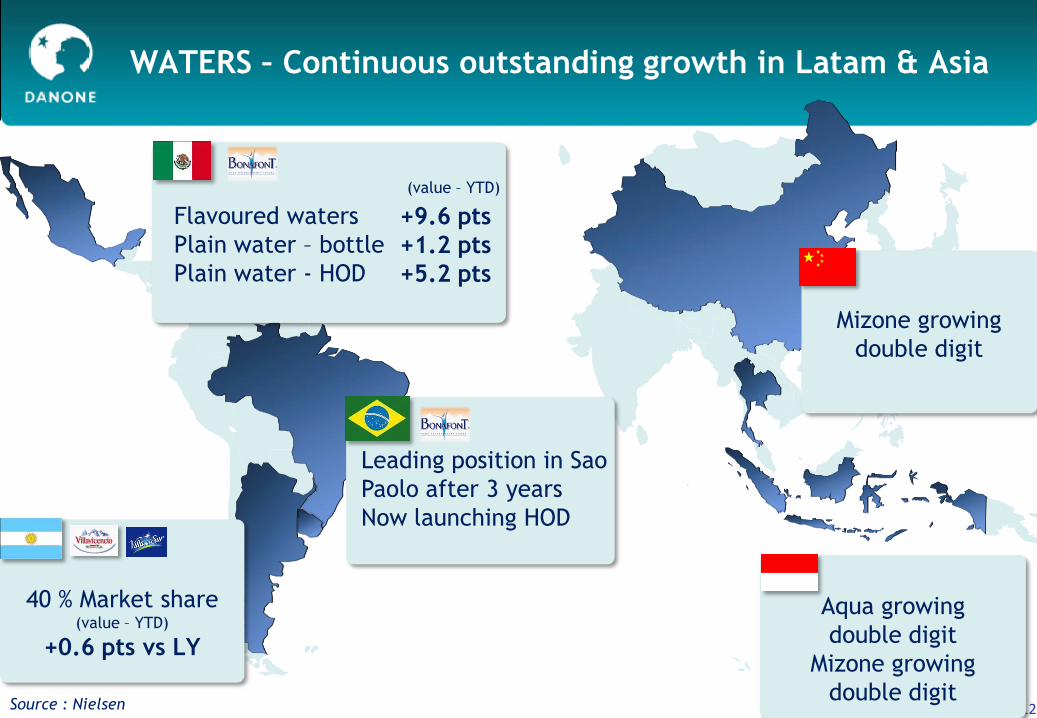
WATERS – Continuous outstanding growth in Latam & Asia
12
Aqua growing
double digit
Mizone growing
double digit
Mizone growing
double digit
Flavoured waters
Plain water – bottle
Plain water - HOD
+9.6 pts
+1.2 pts
+5.2 pts
40 % Market share (value – YTD)
+0.6 pts vs LY
Leading position in Sao
Paolo after 3 years
Now launching HOD
(value – YTD)
Source : Nielsen
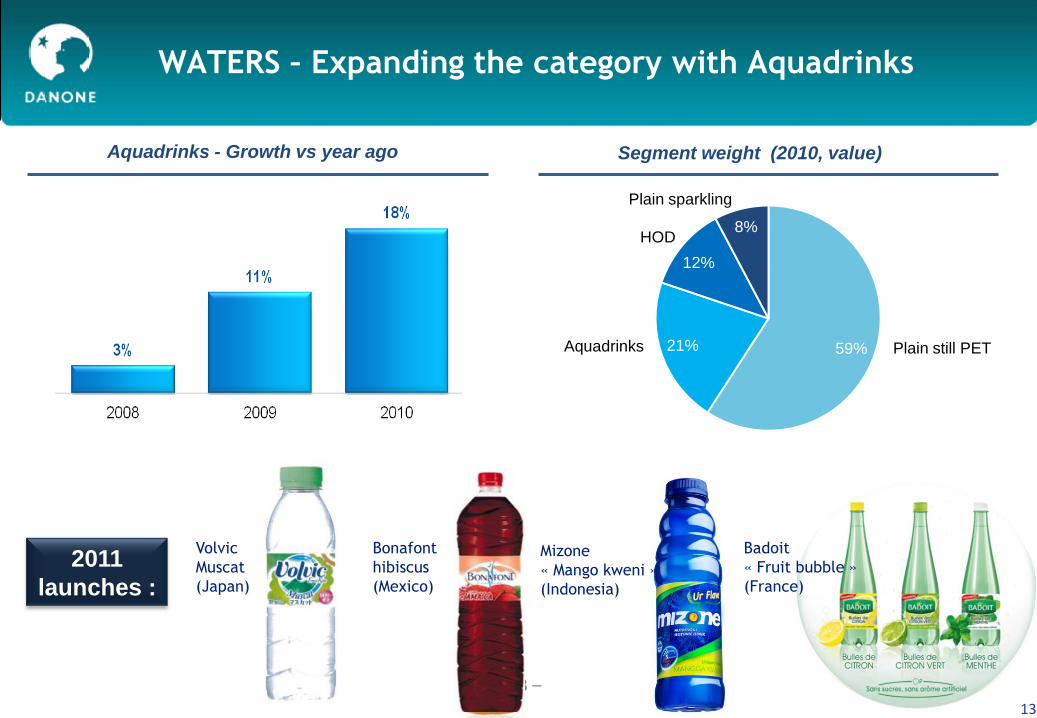
WATERS – Expanding the category with Aquadrinks
– 13 –
Aquadrinks - Growth vs year ago
59% 21%
12%
8%
Segment weight (2010, value)
Plain still PET
Plain sparkling
HOD
Aquadrinks
2011
launches :
Bonafont
hibiscus
(Mexico)
Badoit
« Fruit bubble »
(France)
Mizone
« Mango kweni »
(Indonesia)
Volvic
Muscat
(Japan)
13
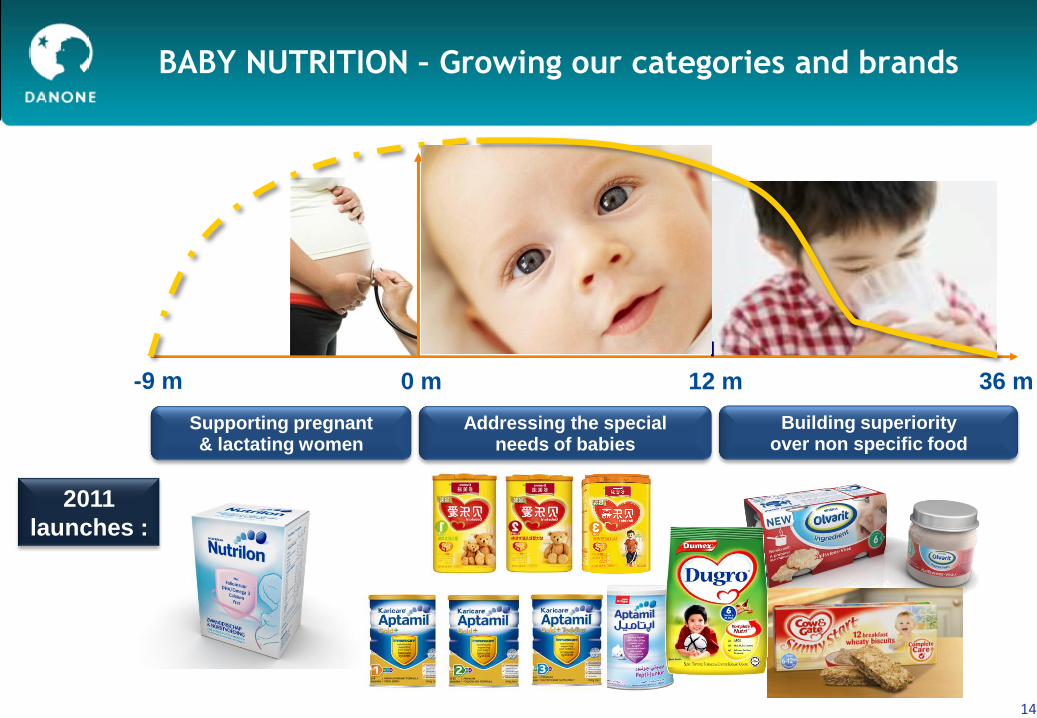
-9 m 0 m 12 m 36 m
Supporting pregnant & lactating women
Addressing the special needs of babies
Building superiority over non specific food
BABY NUTRITION – Growing our categories and brands
14
2011
launches :
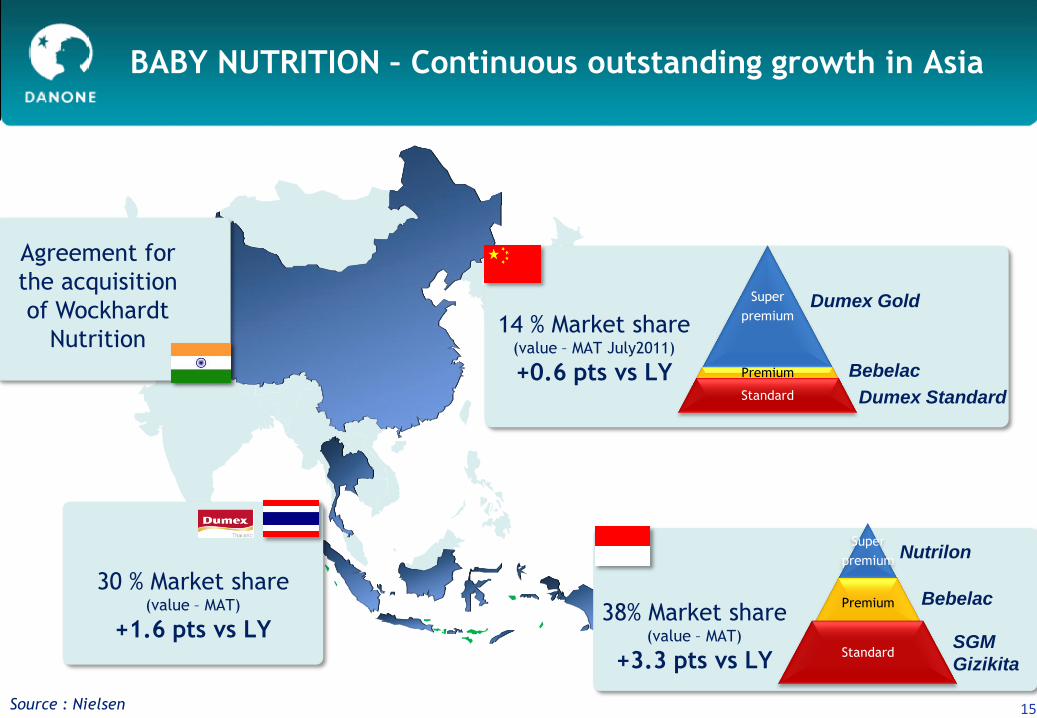
BABY NUTRITION – Continuous outstanding growth in Asia
15
30 % Market share (value – MAT)
+1.6 pts vs LY
Agreement for
the acquisition
of Wockhardt
Nutrition 14 % Market share
(value – MAT July2011)
+0.6 pts vs LY
38% Market share (value – MAT)
+3.3 pts vs LY
Super
premium
Premium
Standard
Super
premium
Premium
Standard
Dumex Gold
Bebelac
Dumex Standard
SGM
Gizikita
Nutrilon
Bebelac
Source : Nielsen

16
1. Knowledge
•Immunity book to
build basic knowledge
•Stage health
assessment to guide
mom with right
nutrition knowledge
•DM & SMS to provide
tailor-made service and
solution
2. Interactive experience
•Hotline & Mom class
to provide one-on-one
consulting service
•Social media platform
to help moms to
connect with each
other
•Baby show programs
to demonstrate baby
progress
Mom’s needs
EXAMPLE IN CHINA: 1000day Program offers mom unconditional service they need along
the feeding journey
BABY NUTRITION – Continuous outstanding growth in Asia

MEDICAL NUTRITION - Growing our categories and brands
17
2011
launches :
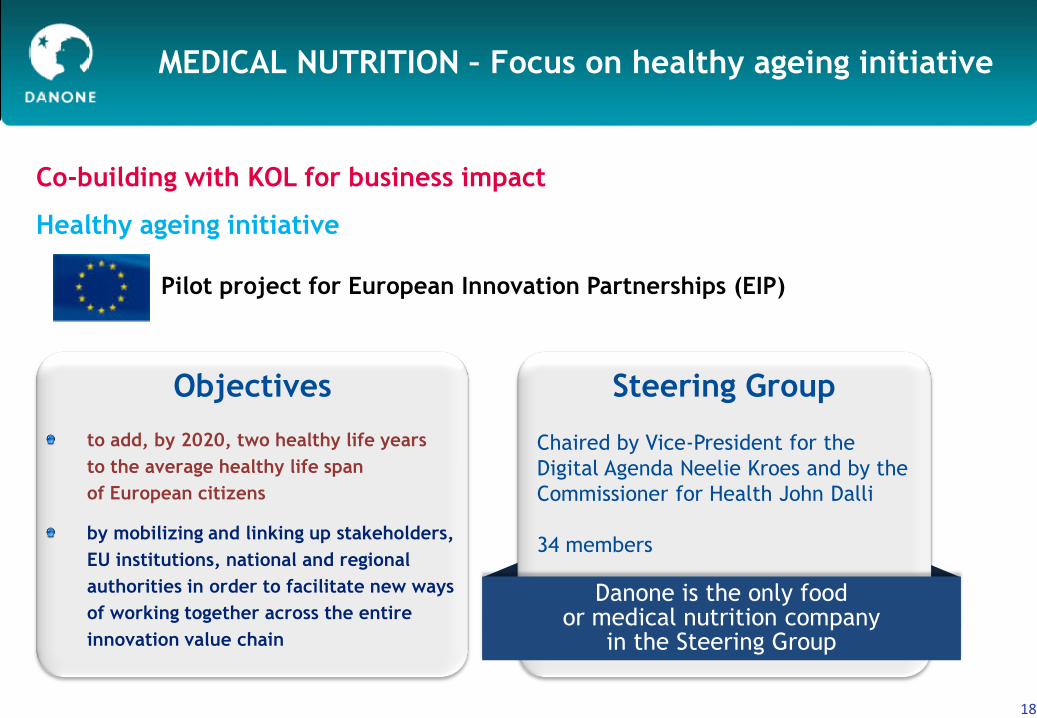
MEDICAL NUTRITION – Focus on healthy ageing initiative
18
Objectives
Co-building with KOL for business impact
Pilot project for European Innovation Partnerships (EIP)
Chaired by Vice-President for the
Digital Agenda Neelie Kroes and by the
Commissioner for Health John Dalli
34 members
Healthy ageing initiative
to add, by 2020, two healthy life years
to the average healthy life span
of European citizens
by mobilizing and linking up stakeholders,
EU institutions, national and regional
authorities in order to facilitate new ways
of working together across the entire
innovation value chain
Danone is the only food or medical nutrition company
in the Steering Group
Steering Group

19 19
Danone Model in Motion
Managing profitable growth
in a challenging environment

Input cost at high level and volatile
20 Source : Bloomberg
0
100
200
300
400
500
600
700
800
900
1000
S&P GSCI Commodity Index
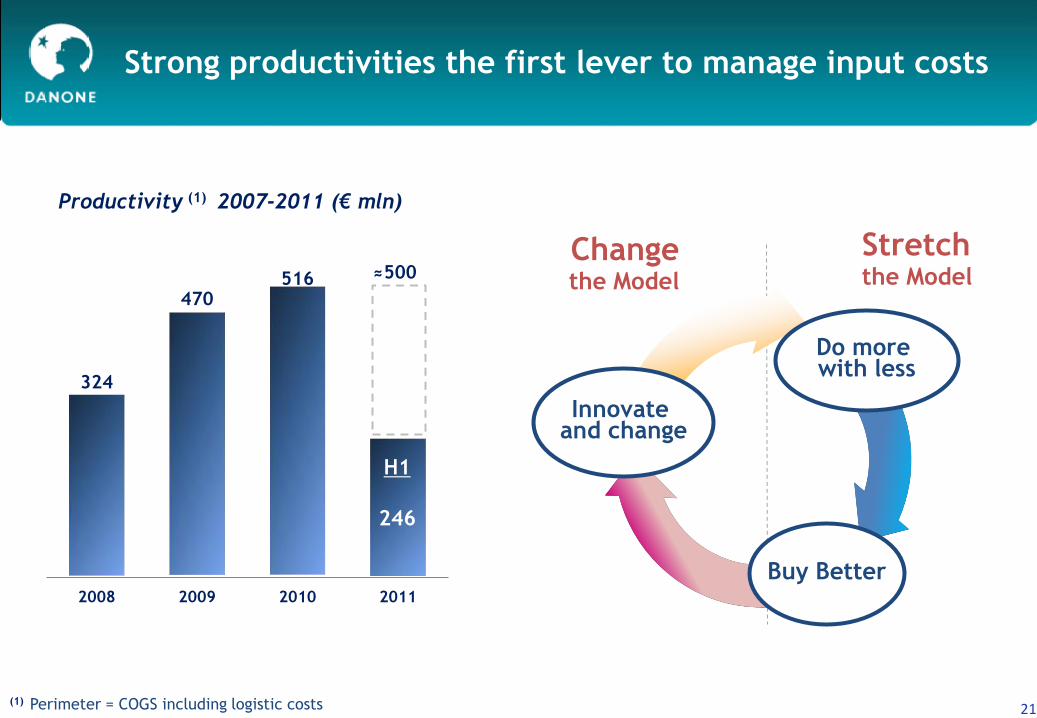
Strong productivities the first lever to manage input costs
(1) Perimeter = COGS including logistic costs 21
Stretch
the Model Change the Model
Do more with less
Innovate and change
Buy Better
324
470 516
2008 2009 2010 2011
Productivity (1) 2007-2011 (€ mln)
H1
246
≈500

Competitive management of pricing
Reset
• Price index in Fresh Dairy
Products from 126 to 120
2011 & beyond
• Selected competitive
price increases
• Balanced portfolio across
the pyramid => more
resilient
22
Volume and price/mix growth – Total Group without Unimilk
Danone stand-alone before Unimilk
7,6%
4,6%
-0,8%
3,2%
FY 2010 9M 2011
Price / Mix
Volume growth

23 23
Building distribution Building new business models
Building categories
Reach >7 mln babies
Invest behind growth drivers

24
FCF remains a core focus
24
986 1 183
1 427
1 713
2 000
2007 2008 2009 2010 2011 2012
+7.8%
vs
H1 10
H1
925
Free-Cash-Flow (1)
(1) Free cash flow: Cash flow from operations less capital expenditure (net of disposals) and excluding business combinations fees

25 25
Danone Model in Motion
Outlook

26
2011 targets confirmed
26
(1) Like-for-like : Based on constant scope of consolidation (including 12 months Unimilk) and constant exchange rates)
6-8%
Objectives 2011
Sales growth (1)
Towards € 2 bn in 2012
Free Cash Flow (2)
around +20 bps (1)
Trading Operating
Margin
(2) Free Cash Flow: Cash flow from operations less capital expenditure (net of disposals) and excluding business combinations fees
Recommended