Elsevier Editorial System(tm) for Materials
Science & Engineering A
Manuscript Draft
Manuscript Number: MSEA-D-15-02283R2
Title: STRESS-STRAIN RESPONSE AND MICROSTRUCTURAL EVOLUTION OF A FeMnCAl
TWIP STEEL DURING TENSION-COMPRESSION TESTS
Article Type: Research Paper
Keywords: TWIP steels, Bauschinger effect, mechanical twinning,
dislocation structure
Corresponding Author: Dr. J.A. Benito,
Corresponding Author's Institution: UPC
First Author: J.A. Benito
Order of Authors: J.A. Benito; Raul Cobo; Wang Lei; Jessica Calvo; Jose
Maria Cabrera
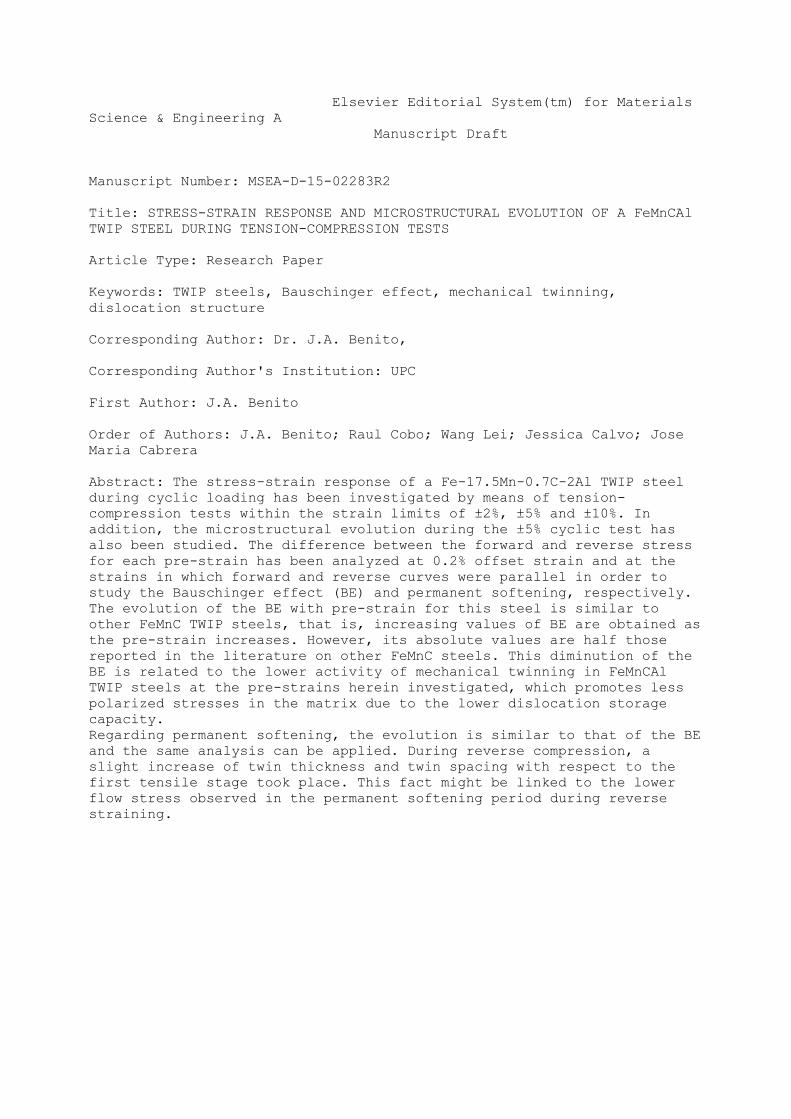
Abstract: The stress-strain response of a Fe-17.5Mn-0.7C-2Al TWIP steel
during cyclic loading has been investigated by means of tension-
compression tests within the strain limits of ±2%, ±5% and ±10%. In
addition, the microstructural evolution during the ±5% cyclic test has
also been studied. The difference between the forward and reverse stress
for each pre-strain has been analyzed at 0.2% offset strain and at the
strains in which forward and reverse curves were parallel in order to
study the Bauschinger effect (BE) and permanent softening, respectively.
The evolution of the BE with pre-strain for this steel is similar to
other FeMnC TWIP steels, that is, increasing values of BE are obtained as
the pre-strain increases. However, its absolute values are half those
reported in the literature on other FeMnC steels. This diminution of the
BE is related to the lower activity of mechanical twinning in FeMnCAl
TWIP steels at the pre-strains herein investigated, which promotes less
polarized stresses in the matrix due to the lower dislocation storage
capacity.
Regarding permanent softening, the evolution is similar to that of the BE
and the same analysis can be applied. During reverse compression, a
slight increase of twin thickness and twin spacing with respect to the
first tensile stage took place. This fact might be linked to the lower
flow stress observed in the permanent softening period during reverse
straining.

Editor of Materials Science and Engineering A. Electronic submission
Barcelona, December 15th 2015
Dear Editor:
Please find enclosed the revised manuscript entitled “Stress-strain response and microstructural evolution of a FeMnCAl TWIP steel during tension-compresion tests” with reference MSEA-D-15-02283R2. Moreover, in the next pages of this letter the “response to reviewers” is included. We hope that you find the paper suitable for publication in your Journal.
Looking forward to hearing from you soon, Yours sincerely
Dr. José Antonio Benito Páramo
Departamento de Ciencia de Materiales e Ingeniería Metalúrgica
ETSEIB – Universidad Politécnica de Catalunya
Av. Diagonal 647, 08028 – Barcelona, Spain
Phone: (34)-93-401-0946, Fax: (34)-93-4016706
E-mail: [email protected]
Detailed Response to Reviewers

Detailed response to reviewer’s comments:
Reviewers' comments:
All the new text in the marked up manuscript is in red font.
Reviewer #1: The article is interesting one and provides new information on TWIP steels cyclic
behaviour. The authors have addressed the majority of questions raised in the previous review. However,
it is still no clear explanations why "At the strains studied there are no major differences between both
stages in the evolution of mechanical twinning and dislocation structure, except for the twin thickness and
twin spacing, which appeared slightly larger in the compressive stage." It would be expected that due to
the change in deformation path, there will be annihilation of dislocations and possibly de-twinning. Thus,
evolution should be different.
We agree that the first part of this statement is not clear. If we consider the whole tensile and compressive
stages there are many effects that should be considered. This part of the sentence has been then eliminated
and we have focused on the differences found between tensile and compressive stages in twin thickness
and twin spacing.
Standard deviations/errors should be given for all experimentally obtained values- for example, they are
missing for the aspect ratio values.
We have included standard deviations/error bars in some experimental values in which they were
missing: for the back stress values for FeMnCAl TWIP steel using the two described methods, for the
aspect ratio values, for the stress hardening exponent and the contributions of the back stress to the total
hardening.
Another comment is regarding the standard of English. There are too many typos and incorrectly
structured sentences/words usage. For example,
p. 10 - it is written " which suggests that make sense the comparison between data obtained from tension-
compression and shear test." Change to "which suggests that the comparison between the data obtained
from tension-compression and shear test makes sense".
p.11 - BE grows/ keep growing, etc. It should be increase not growth.
p.20 "In has been reported in these steels that planar slip is favored during the early stages of deformation
and dislocations are created and pushed causing many pile-ups and stacking faults [36]. Under load
reversal conditions some of the dislocations can go back causing a source of back stress" First, the
sentence should start with It. Second, better terms than pushed should be used. Third, dislocations could
glide or move not go.
There are many more such examples. It is strongly recommended a careful proof reading and editing by
the native English speaker.
Following this recommendation an English native speaker has revised the whole text. We have tried to
eliminate all the mistakes. In the marked up manuscript all the changes made in the text can be observed.

1
1
STRESS-STRAIN RESPONSE AND MICROSTRUCTURAL EVOLUTION OF
A FeMnCAl TWIP STEEL DURING TENSION-COMPRESSION TESTS
J. A. BENITO1,2*
, R. COBO1, W. LEI
3, J. CALVO
1,3 and J. M. CABRERA
1,3
1 Fundació CTM Centre Tecnològic de Manresa, Plaça de la Ciència 2, 08243, Manresa,
Spain.
2 Department of Materials Science and Metallurgical Engineering, EUETIB, Universitat
Politècnica de Catalunya, Comte d'Urgell 187, 08036 Barcelona, Spain,
3 Department of Materials Science and Metallurgical Engineering, ETSEIB, Universitat
Politècnica de Catalunya, Av. Diagonal 647, 08028 Barcelona, Spain.
*Corresponding author.
E-mail address: [email protected]
Tel. +34-934010946, Fax.+34-934010706
Materials Science Department, Pavelló E. ETSEIB.
Av. Diagonal, 647.
08028 Barcelona
Spain
ManuscriptClick here to view linked References

2
2
Abstract.
The stress-strain response of a Fe-17.5Mn-0.7C-2Al TWIP steel during cyclic loading
has been investigated by means of tension-compression tests within the strain limits of
±2%, ±5% and ±10%. In addition, the microstructural evolution during the ±5% cyclic
test has also been studied. The difference between the forward and reverse stress for
each pre-strain has been analyzed at 0.2% offset strain and at the strains in which
forward and reverse curves were parallel in order to study the Bauschinger effect (BE)
and permanent softening, respectively. The evolution of the BE with pre-strain for this
steel is similar to other FeMnC TWIP steels, that is, increasing values of BE are
obtained as the pre-strain increases. However, its absolute values are half those reported
in the literature on other FeMnC steels. This diminution of the BE is related to the lower
activity of mechanical twinning in FeMnCAl TWIP steels at the pre-strains herein
investigated, which promotes less polarized stresses in the matrix due to the lower
dislocation storage capacity.
Regarding permanent softening, the evolution is similar to that of the BE and the same
analysis can be applied. During reverse compression, a slight increase of twin thickness
and twin spacing with respect to the first tensile stage took place. This fact might be
linked to the lower flow stress observed in the permanent softening period during
reverse straining.
Keywords: TWIP steels, Bauschinger effect, mechanical twinning, dislocation
structure.
3
3
1. Introduction
Twinning-induced plasticity (TWIP) steels are being extensively studied because of
their excellent combination of high-tensile strength and large ductility. One of the most
promising applications is the manufacture of car components where energy absorption
is a determining factor. It is well-known that one of the problems during sheet forming
of high strength steels is the large amount of springback.
In the control of springback, numerical methods (such as the finite element method) are
used to predict the differences between the final obtainable forms and the designed
forms. With this knowledge, die modifications can be carried out and springback can be
controlled (and minimized) following an iterative process. In order to obtain accurate
forming simulations and therefore diminish the number of iterations, it is necessary to
use good plasticity models that can give accurate stress predictions. The hardening law
to be introduced in the these models must be able to predict the cyclic stress-strain
behavior of the given material, especially when bending-unbending operations are
involved, such as the ones taking place in industrial forming processes. It is particularly
important to model the reverse loading flow curve, which should include the
Bauschinger effect, the transient behavior and the permanent softening [1].
The hardening models that have shown better accuracy in predicting the magnitudes of
the forward and reverse stresses are based on mixed isotropic-kinematic hardening laws
[2,3]. Kinematic hardening is added to isotropic hardening by the so-called “back
stress” that reflects the anisotropy of the yield strength. This back stress causes an
increase of stress during forward straining but helps to decrease the flow stress in the
opposite direction. This back stress can be determined by different tests: three-point
bending tests [1], shear tests [4] and tension-compression tests [5].

4
4
Various studies on the cyclic behavior of TWIP steels [6] and on reverse loading [7,8]
have been carried out in recent years. In these studies, a Fe-22Mn-0.6C steel was
selected, and it was observed a large contribution of the kinematic hardening to the
overall hardening. This large contribution was related to the combined effect of
mechanical twins formed during deformation and the glide of dislocations, which are
pinned at twin boundaries [9]. The storage of dislocations in the matrix by the action of
twin boundaries is in the basis of the stress-strain response of TWIP steels; some
hardening models have been proposed to relate these mechanisms to the pronounced
work-hardening observed in these steels [10,11].
Despite the excellent tensile properties of FeMnC TWIP steels, it has to be mentioned
that some problems have been reported in the literature. Among these problems we can
find low yield strength, delayed fracture and heterogeneous deformation. The addition
of Al can solve some of these problems since it suppresses the precipitation of
cementite [12], promotes solid solution hardening, reduces H-embrittlement related to
the delayed fracture and reduces Dynamic Strain Aging (DSA) [13]. On the other hand,
FeMnCAl TWIP steels show less mechanical twinning activity and lower strain
hardening rates than FeMnC TWIP steels [13-15]. As already mentioned, the
development of back stresses in TWIP steels has been related to the combined
mechanism between mechanical twins and dislocations glide, so the lower twinning
activity of FeMnCAl steels should reflect in lower values of back stress with pre-strain
in cyclic tests.
Although the tensile properties and strain hardening of FeMnCAl TWIP steels have
been widely studied [13-16] there is very little information about its response in reverse
loading. The present study, therefore, investigates the stress-strain behavior and the
microstructural evolution of a FeMnCAl TWIP steels during cyclic tests. The possible

5
5
differences in the evolution of the back stress with increasing strain and its relationship
with mechanical twinning could indirectly help to understand the important contribution
of kinematic hardening in TWIP steels.
2. Materials and Methods.
The studied material was a hot rolled TWIP steel sheet provided by POSCO with a
thickness of 2.6 mm. The chemical composition in mass percentage is listed in Table 1
and the initial average grain size was 4 µm, although the grain size varied within from
0.6 to 18 µm. The microstructure and the local texture of the initial and deformed
material during the 5% strain cycle were characterized by Electron Back Scattered
Diffraction (EBSD) on the longitudinal plane, at approximately half thickness. The
samples were mechanically polished with 2500 grit SiC paper until down to 0.02 µm
colloidal silica suspension following standard metallographic procedures. EBSD
measurements were performed using a JEOL JSM-7001 F Field Emission Scanning
Electron Microscope (FE SEM) using the Oxford Instruments HKL channel 5 software
package. A step size of 0.1 µm was used and misorentations below 3º were not
considered in the post processing data procedure. Additional analysis of the
microstructure was performed using the Kikuchi pattern quality (KPQ) maps from
EBSD scans and standard FE SEM micrographs. Transmission Electron Microscopy
(TEM) was carried out to investigate twin thickness and twin spacing as well as the
evolution of the dislocation arrangement in the deformed samples. The specimens were
analyzed in a Philips CM30 microscope operating at 300 kV. Samples for TEM
observation were thinned by jet-polishing in an electrolyte solution of 94 vol% acetic
acid and 6% percloric acid. Finally, X-ray diffraction studies (XRD) were done to verify
the absence of ε-martensite in the deformed stages during tensile or cyclic tests (not

6
6
shown here). The measurements were carried out in a Siemens D-500 equipment using
CuKα radiation with wavelength λ=0.1506 nm.
The tensile and cyclic tests were carried out at room temperature in a MTS 250 kN
testing machine. Tensile samples were machined from the initial sheet according to EN
10002-1 standard, with the tensile axis (TA) parallel to the rolling direction (RD) and a
gauge length of 50 mm. For the cyclic tests, the geometry of the samples was designed
to minimize buckling during reversal tests. Again, the tensile and compression axis
were parallel to the rolling direction. The dimensions of the cyclic samples are
illustrated in Figure 1. In both tests, the strain rate was controlled at 8·10-4
s-1
.
In the case of the cyclic tests, an anti-buckling device inspired by the apparatus used by
Boger et al. [5] was designed. Flat plates were used for buckling constraint, covering
nearly all the free surface of the samples. The clamping system applied a constant force
of 10 kN that corresponded to a stress of 5 MPa in both sides of the samples. A Teflon
film with a thickness of 0.10 mm was inserted between the clamping system and the
sample in order to reduce friction. The displacement was measured in the flank of the
specimens using a Real time strain sensor (RTSS) video extensometer from Limess
GmbH. The clamping and the measurement systems can be observed in Figure 2. As
described by Lee et al.[17] the constraint in the thickness direction during compression
tests requires corrections to eliminate the effect of the friction and the biaxial effects.
The friction coefficient was calculated by comparing the values of tensile tests without
the clamping system with the first tensile period of the cyclic tests in which the
clamping system was installed. With regard to biaxial effects, the value of the effective
stress in the thickness direction (-5 MPa) is very small compared with the value of the
initial yield stress of the TWIP steel used in this study, 480 MPa. Therefore, the

7
7
variation of the effective stress was well below 0.5% and no additional correction was
added [5].
3. Results.
3.1.Tensile tests.
The true stress-true strain curve for the TWIP Fe-17.5-0.7C-2Al steel is shown in Fig. 3.
The values of yield strength (YS) and Ultimate Tensile strength (UTS) were 480 MPa
and 1530 MPa, respectively. The total elongation was nearly 50%, which shows the
good combination of high strength and ductility for this steel. The high strength of the
present TWIP steel can also be related to the fine grain size (4 µm). Similar mechanical
properties have been reported for other Fe-Mn-C TWIP steels of similar grain size
[8,18]. Moreover, some contribution to strength is expected from carbon atoms
dissolved in the austenite matrix, since the addition of 2% wt. of Al prevents cementite
precipitation [12]. The analysis of the curve shows some micro-serrations from a strain
of 0.3 up to the necking point. The addition of Al is also reported to decrease the
number and the height of these micro-serrations, and in this case they appear at larger
strain intervals and with lower step heights than in the case of Fe-Mn-C TWIP steels
with no Al [12]. The plastic regime of the tensile curve was fitted to a Swift type
hardening law and good correlation was observed, as also shown in Figure 3. The stress
hardening exponent n was as high as 0.69 ± 0.02, in consonance with other values found
in literature [19].
The evolution of the strain hardening rate (dσ/dε) of the present Fe-17.5Mn-0.7C-2Al
steel is also plotted in Fig. 3. The general trend is very similar to that of Fe-19Mn-0.6C-
2Al reported by Jin et al.[12] since no increase of strain hardening or even relatively
constant values of hardening are observed during most of the deformation period. It is

8
8
worth noting that the present steel has a higher strain-hardening rate than the one
reported by Jin et al., the difference being around 300 MPa. This effect could be related
to small differences in mechanical twinning rate or to the high activity of C atoms
dissolved in the austenite matrix, since the present steel has a marked larger C content.
3.2.Tension-compression tests.
The tension-compression curves for cycles with strains of 2, 5 and 10% are displayed in
Fig.4. While for strains of 2% and 5% the cycles were completed satisfactorily, for a
strain of 10% samples showed buckling in the unsupported gap when the compression
step was close to finishing. Although the cycle with a strain of 10% was not fully
characterized then, the compressive strain achieved was considered to be enough to
reveal the Bauschinger effect and permanent softening at a pre-strain of 10%.
Regarding cycles with strains of 2% and 5%, cyclic hardening was observed and the
increase of the stress at the end of the cycle was directly related to the strain of the cycle
(60 MPa for a strain of 2% and 220 MPa for a strain of 5%). This behavior is in
accordance with other studies in which the low-cycle fatigue of TWIP steels was
investigated [6].
The evolution of the forward stress (σfor) and reverse stresses (σrev) for each cycle is
displayed in Fig. 5. For a better comparison, the reverse stage has been moved to the
upper part by rotating 180º. As described elsewhere and pointed out for some TWIP
steel compositions [7,20], in the reverse stage an early re-yielding can be observed at
any forward strain applied, which is commonly referred to as Bauschinger effect (BE).
All the curves in the reverse stage end up practically parallel to the forward curve after a
“transient strain hardening” period, but they do not reach the values of the forward
stress. Therefore, a “permanent softening” is observed in all cases. The difference
9
9
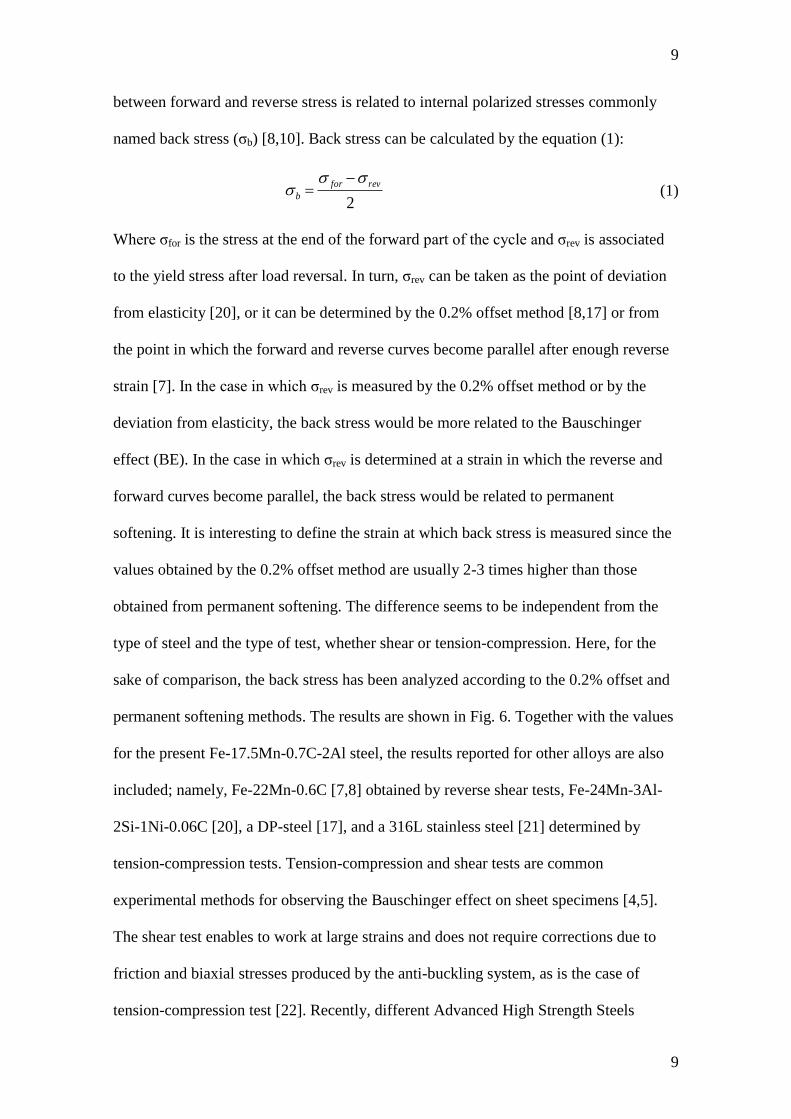
between forward and reverse stress is related to internal polarized stresses commonly
named back stress (σb) [8,10]. Back stress can be calculated by the equation (1):
2
revfor
b
(1)
Where σfor is the stress at the end of the forward part of the cycle and σrev is associated
to the yield stress after load reversal. In turn, σrev can be taken as the point of deviation
from elasticity [20], or it can be determined by the 0.2% offset method [8,17] or from
the point in which the forward and reverse curves become parallel after enough reverse
strain [7]. In the case in which σrev is measured by the 0.2% offset method or by the
deviation from elasticity, the back stress would be more related to the Bauschinger
effect (BE). In the case in which σrev is determined at a strain in which the reverse and
forward curves become parallel, the back stress would be related to permanent
softening. It is interesting to define the strain at which back stress is measured since the
values obtained by the 0.2% offset method are usually 2-3 times higher than those
obtained from permanent softening. The difference seems to be independent from the
type of steel and the type of test, whether shear or tension-compression. Here, for the
sake of comparison, the back stress has been analyzed according to the 0.2% offset and
permanent softening methods. The results are shown in Fig. 6. Together with the values
for the present Fe-17.5Mn-0.7C-2Al steel, the results reported for other alloys are also
included; namely, Fe-22Mn-0.6C [7,8] obtained by reverse shear tests, Fe-24Mn-3Al-
2Si-1Ni-0.06C [20], a DP-steel [17], and a 316L stainless steel [21] determined by
tension-compression tests. Tension-compression and shear tests are common
experimental methods for observing the Bauschinger effect on sheet specimens [4,5].
The shear test enables to work at large strains and does not require corrections due to
friction and biaxial stresses produced by the anti-buckling system, as is the case of
tension-compression test [22]. Recently, different Advanced High Strength Steels

10
10
including a TWIP steel were tested with both methods and the coefficients extracted
from both test procedures were introduced into a hardening model [23]. The predicted
flow curves in both cases were in reasonably good agreement, which suggests that the
comparison between the data obtained from tension-compression and shear test makes
sense. Therefore, the current research considers that no significant differences exist in
the twinning activity of TWIP steels in both loading modes and that the mechanisms
involved in the asymmetry of flow stress after load reversal are no significantly
affected.
As already pointed out, the back stresses calculated with the 0.2% offset method were 2-
3 times higher than the ones determined when the reverse curve is parallel to the
forward curve. The difference seems to be independent from the type of steel and the
kind of equipment used, shear or tension-compression test.
Back stress from the 0.2% offset method.
As already stated, the back stress obtained with the 0.2% offset method focuses more on
early re-yielding or BE. In Fig. 6a it can be observed that the BE increases rapidly in all
cases as the forward strain is increased. At a strain of 2%, the increasing rate of the BE
seems to be quite similar for all analyzed steels, independently of the composition, grain
size and type of procedure used. From a strain of 5% forwards, although the BE
maintains its growing behavior in all cases, some differences can be observed in the
different steels. In the case of the DP-steel tested under tension-compression conditions
the rate of increase tends to diminish as the strain increases, and from a strain of 10%
the BE remains constant. For the 316L austenitic stainless steel there is also a clear
decrease in the rate of increase, and it seems that the behavior at larger strains could be
similar to DP-steel. In the case of TWIP steels, although there is a drop in the rate of

11
11
increase with respect to the rate at low strains, the BE keeps growing as the deformation
increases. Nevertheless, the total amount of the BE is different depending on the type of
TWIP steel analyzed. Thus, for the two FeMnC TWIP steels, a large increase is
observed and the BE values are above 250 MPa at a strain of 10%, whereas for the
present FeMnCAl TWIP steel the increment is smaller and at a strain of 10% the BE is
around 150 MPa.
It is interesting to note that for FeMnC steels a constant increase of the BE is observed
at larger strains up to 20-25%, and this trend coincides well with another study of a Fe-
22Mn-0.6C with results very close to the present ones [24]. Although there is no data
for FeMnCAl steel at these large strains, from the observation of the evolution of the
BE with strain in Fig.6a it is reasonable to think that the growing trend also appears for
this steel at large strains, but with lower values than for FeMnC steels.
Back stress from the permanent softening method.
The evolution of the back stress with pre-strain calculated by permanent softening is
shown in Fig. 6b. The back stress for the present Fe-17.5Mn-0.7C-2Al steel behaves the
same way as the others steels studied, i.e. an increase during the first period of plastic
strain and stabilization as the deformation proceeds. For this Fe-17.5Mn-0.7C-2Al alloy
the back stress is 19 ± 4 MPa at a strain of 2%, 32 ± 4 MPa at 5% and the maximum
value obtained is 40 MPa ± 4 at a strain of 10%. Comparing with the DP-steel or with
the Fe-22Mn-0.6C TWIP steel with coarse grain, the values are close but slightly lower.
However, with respect to the Fe-22Mn-0.6C steel with a fine grain size of 3 µm [8] the
back stress of the present steel is clearly lower, the difference being, at a strain of 10%,
around 100 MPa.

12
12
As pointed out by Gutierrez et al. [7] the experimental values of σb obtained from the
permanent softening method and X-ray diffraction techniques are in better agreement,
and therefore more consistent, when the strain needed to become parallel (εrev) in the
reverse curve is of only around 50% of the previous forward strain (εfor). In the case of
reverse shear tests for the Fe-22Mn-0.6C TWIP steel, the ratio εrev/ εfor seems to be
clearly below 1 in any case [7,8]. In order to verify if the present calculations fulfill this
condition, the results of the calculations between forward and reverse stages in the
tension-compression tests for the present TWIP steel are listed in Table 2. The ratio
between εrev and εfor needed to get parallel curves is calculated for the three pre-strain
cases and it decreases as the amount of pre-strain increases, ranging from 1.6 for a pre-
strain of 2% to 0.52 for a pre-strain of 10%. This behavior is similar to the case of the
DP-steel, in which the ratio εrev/ εfor is nearly 2 for a strain of 2.1%, decreasing to 0.7 at
a pre-strain of 6.8%. In both cases, tension-compression tests were used. The analysis of
the evolution of εrev/εfor with pre-strain shows that only in the case of a strain of 2% the
back stress from permanent softening could be affected and the values obtained
inaccurate. Consequently, this effect could explain the difference between the back
stress of the Fe-17.5Mn-0.7C-2Al steel at a strain of 2% (19 MPa) and the low value for
the Fe-22Mn-0.6C alloy, 5 MPa at the most. For the rest of the pre-strains conditions,
the obtained back stress values with the permanent softening method would be well
estimated.
Finally it has to be mentioned that for the Al-added TWIP steel, the calculated
contribution of back stress to the total work hardening is less than the calculated value
reported for the other TWIP steels mentioned. For the Fe-17.5Mn-0.7C-2Al steel this
contribution is 8% at a pre-strain of 2% and increases only to 10% with pre-strains of

13
13
5% and 10%, whereas for Fe-22Mn-0.6C steels it was slightly below 20% [7] and
around 40% [8].
3.3.Evolution of dislocation and twin structure during a cycle with a pre-strain of
5%.
To analyse the evolution of the microstructure during cycles with a strain of 5%, one
sample was stopped at the end of the first tensile stage at a strain of 5% (sample named
T5), another one was stopped at the end of the compressive stage at a strain of -5%
(sample named T5C5), and one sample was studied at the end of the complete cycle
(sample named T5C5T5). The evolution of the microstructure was first observed by
EBSD, but since the twin thickness was smaller than 100 nm (as will be reported in the
TEM analysis), which is in the order of magnitude of the step size used, the presence of
mechanical twins by automated EBSD analysis was hardly noticeable. However, their
presence was easily observed in the Kikuchi Pattern quality (KPQ) map. For this reason,
the KPQ maps in the longitudinal plane for the initial material and the stages T5, T5C5
and T5C5T5 are presented in Fig. 7. In all the images, the tensile direction (TD)
coincides with the original longitudinal hot rolling direction. In the as-received material
(Fig.7a) the aspect ratio of the grain taking into account the annealing twins is 2.18 ±
0.10, as a consequence of the rolling process. Some annealing twins can be observed
distributed homogeneously over the grains.
After the first tensile stage, the aspect ratio of the grain increased to 2.39 ± 0.10 as a
result of tensile deformation, but in the KPQ for T5 sample (Fig.7b) mechanical twins
were hardly noticeable. The small presence of mechanical twins at low strains has been
reported before for different types of TWIP steel as, for instance, in the Fe-22Mn-0-6C
steel with a tensile strain of 5% [25,26]. Moreover, as already stated, the addition of Al

14
14
is referred to decrease the rate of mechanical twinning in Fe-22Mn-0.6C [12] so in the
present Fe-17.5Mn-0.7C-2Al steel or in the Fe-22Mn-0.6C-1.5Al alloy [15] this slight
presence of mechanical twins can be justified. At increasing strains, see Figs. 7c and 7d,
mechanical twins are readily apparent. Regarding the dislocation structure observed by
TEM (Fig.8a), no planar arrangement of dislocations is noticed, although long
dislocation lines can be observed in many grains. However, these long segments of
dislocations are prone to be entangled so the structure seems to be closer to a dislocation
forest. This structure is more similar to the one described for fine-grained Fe-22Mn-
0.6C steels with an average grain size around 3 µm [26,27] than to the one of the Fe-
22Mn-0.6C steel with an average grain size of 50 µm [25], since no dislocation cells
were detected after a tensile strain of 5%. Regarding the mechanical twins, following
the evolution of the calculated twinning fraction for a similar composition to the present
Fe-17.5Mn-0.7C-2 Al steel, at a tensile strain of 5% a very small twinning fraction
would be expected [13]. Fig.8b shows one of the scant bundles of twins and it is worth
noting the higher dislocation density in the space between twins compared to the
untwinned grain in Fig.8a. The average twin thickness calculated from the small
number of twinned grains is 40 ± 15 nm, whereas the average twin spacing is about 180
± 50 nm.
The microstructure in Fig. 7c for the sample after the compressive stage (T5C5) shows
how the grains have been now compressed due to reverse straining in the former TD
and consequently the aspect ratio decreased to 2.09 ± 0.10. In fact, this sample has
undergone a compressive strain very close to 10%, and the accumulate strain is around
15%. Therefore, it is understandable that many grains show thick bundles of mechanical
twins after the compressive stage. The analysis of dislocation structure by TEM in
Fig.8c shows that many dislocation cells have appeared with very low dislocation

15
15
density inside of them. The average diameter of these cells was 450 ± 100 nm. The
analysis of the twins by TEM (Fig.8d) showed that generally only one twin system is
active and very rarely a secondary system is observed. The diminution of active systems
in Al-added TWIP or Hadfield steels is reported in the literature [12,15,28]. In this case,
the twin thickness, 60 ±15 nm, was larger than in the first tensile stage. The twin
spacing was also calculated and it was 220 nm ± 60 nm.
The microstructure after the second tensile stage (T5C5T5) is displayed in Fig.7d. The
aspect ratio of the grains increases again up to 2.25 ± 0.10, which indicates the new
elongation of grains following TD. The tensile strain in this stage was 10%, so the total
accumulated strain at the end of the cycle for the T5C5T5 sample was 25%. The
analysis of the microstructure shows a great number of twinned grains but without a
clear increase in dense bundles of twins, as compared to T5C5 condition. Moreover,
secondary twinning is a little more active than in the case of T5C5. With regard to
dislocation activity, a refinement of cell structures is observed, since they have an
average value of 300 ± 100 nm, smaller than in the case of T5C5 (Fig.8e). This process
has been well documented for other TWIP steels [6,26,27]. The twin thickness shows a
very wide distribution ranging from 20 to 150 nm. Grains with bundles of twins with
average thickness around 120 nm are easy to find (Fig.8f), but some small grains with
narrow twins with a thickness of 20-30 nm have also been observed. Twin spacing also
depends on the type of bundle, being 300 nm for the thicker twins and around 100 nm
for the narrow ones.
3.4.Texture evolution during a cycle with a pre-strain of 5%.
Fig. 9 shows the evolution of texture represented by the Orientation Distribution
Function (ODF) at φ2=45º section in the Euler space and the inverse pole figure (IPF)

16
16
along the tensile direction (TD) for the initial material and the final steps of the cycle
with a strain of 5%. The initial texture of the as-received material is displayed in Fig.
9a; shows the presence of Brass 110<112> and Goss 110<001> texture
components, although the latter with a weak signal. These orientations are commonly
associated with hot rolled fcc metals [29]. On the other hand, the presence of cube
component 001<100> must be noted, which may be related to the compressive
behavior in the center of the sheet during hot rolling [30]. These components are
reflected in the IPF, since poles <111> and <001> are the strongest components.
After the first tensile stage up to a strain of 5% (T5), there is an increase of the signal
for rotated Brass 110<111> and Goss orientations, both of them typical texture
components during tensile deformation of TWIP steels [12,31]. At the same time, the
cube texture component is also clearly visible. The presence of these orientations is
reflected in the increase of the intensity in poles <111> and <100> of the IPF, which has
also been described for other TWIP steels deformed by tensile tests [13,25].
When the samples are deformed in compression to a strain of -5%, some changes are
observed in the φ2=45º ODF section in fig.9c. There is a clear increase of cube
component 001<100>, with a maximum orientation density of 3.15 and the
appearance of rotated-Cube component 001<101>, with values of orientation density
around 1.5. The growing cube and rotated-Cube components during compression were
not reported as predominant orientations in high-manganese steels [32]. However, there
are some coincidences in the evolution of grain orientations. First, and according to the
evaluation of Schmid factors for twinning and dislocation slip in compression [14,33]
twinning is favored in <001>oriented grains. This fact was observed in the work of
Meng et al. and the same result has been observed in the present Fe-17.5Mn-0.7C-2Al
steel since most of the grains that contain mechanical twins in the KPM in Fig. 8c are

17
17
oriented in direction <001>. At the same time, looking at the IPF in Fig. 9c, there is an
increase of grains in direction <101>. This increase is related to the grain rotation due to
slip [32] and could explain the increase of some components such as rotated-cube
001<101> or even rotated-Cu 112<101>. As shown by the present TEM studies,
during the compression stage both the twinning and dislocation slip have proceed
normally and the evolution of grain orientations can be considered consistent with the
compressive behavior of TWIP steels.
After the second tensile stage at a strain of +5%, the resulting texture in the φ2=45º ODF
section of Fig. 9d shows the strengthening of the components related to tensile
deformation in TWIP steels [13,31] indicated by an increase in the orientation density
around Brass and rotated-Brass components. Although the predominant component at
high strains is rotated-Brass, at low strains the maximum densities are clearly not close
to the exact Euler angles [13]. Additionally, there is a slight increase of Goss
component and an especially clear development of Cu component 112<111>. The
aspect of the IPF in this T5C5T5 stage in Fig. 9d shows a clear development of
orientations in poles <001> and <111> that coincide with the usual description for the
tensile deformation of TWIP FeMnC and FeMnCAl steels [13,25]. However, in this
case fiber <111> appears with an intensity lower than <001>, as opposed to what is
usually observed in TWIP steels [13,25,31]. There may be several reasons for this
behavior: on the one hand, a 10% tensile deformation can be considered low for
developing a well-defined texture comparing with other studies in which the strain was
at least over 20% [13,25,31], particularly in this case, in which in addition, there are
changes in the deformation path. On the other hand, although cube component
001<100> has been observed in the tensile texture of FeMnC TWIP steels [31], its

18
18
intensity in the present case is higher than expected and it can be related to its strong
presence in the initial texture (Fig. 9a).
4. Discussion.
Following the same procedure used in the section above, it is necessary to divide the
discussion on back stress in two parts: firstly, concerning early re-yielding during
reverse stress, i.e. what here is defined as the Bauschinger effect (BE), and secondly,
taking into consideration the difference between forward and reverse stresses when both
curves become parallel when permanent softening (PS) is noticed.
Bauschinger effect.
Looking at the evolution of the BE with pre-strain in Fig. 6a, it is clear that at low
strains, the BE is quite similar for all the materials studied, including a Fe-24Mn-3Al-
2Si-0.06C TWIP steel in which only the BE at a pre-strain of 1% using the 0.2% offset
method has been determined [20]. At a pre-strain of 2%, the most common feature is
that the BE increases rapidly for all the materials studied. At these low strains, a very
limited effect of twinning is expected in TWIP steels due to the small number of
twinned grains detected in the present steel and others TWIP steels [25,27,34]. Under
these conditions, as pointed out by Saleh et al. [20], there must be other contributions to
the back stress of TWIP steels at these low strains. In this point is interesting to revisit
some results of 316L and 317 austenitic steels that do not twin [21,35]. It has been
reported that in the case of these steels planar slip is favored during the early stages of
deformation. The generated dislocations move under the applied stress causing many
pile-ups and stacking faults [36]. Under load reversal conditions some of the
dislocations can move back causing a source of back stress [21,35,36] for 316L

19
19
austenitic steel, as shown in Fig.6b. It is interesting to note that stacking faults also
interact with dislocations and this have been considered as another source of back
stresses [20,35].
When the pre-strain attains to 5%, the differences between the various materials start to
increase. The differences in the amount and rate of increase of the BE with strain must
be related to the strengthening mechanisms acting in every particular case.
Firstly, there is a Dual-Phase steel in which the microstructure consists of hard
martensite (12%) and a soft ferrite matrix [17]. Although DP-steels have shown fairly
good strength and ductility, the strengthening mechanism is different from that of TWIP
steels. In the absence of twinning and precipitates in the ferrite matrix, the slip of
dislocations and their storage by intersections is the main hardening mechanism, helped
by the presence of hard martensite plates. In bcc metals, the dislocations generated in
the early stages of deformation tend to be stored in high density dislocation walls
forming cell boundaries [37]. After a certain amount of monotonic deformation, it is
accepted that these dislocation structures evolve towards steady-state configurations.
Once the cell structure is formed, the polarization reaches a maximum and further strain
can refine the cell diameters slightly but, in essence, the back stresses generated remain
constant. This depletion in the source of back stress with strain in DP-steels is shown
clearly in Fig. 6a since from a strain of 10% the BE values remain constant, although
some isotropic hardening is still present at these strains levels [17].
A similar situation can be observed in the case of 316L austenitic steel. After the first
stage of deformation (≈1.5%), a transition from planar slip to wavy slip has been
described; it has also been observed that the number of grains presenting different
dislocation interactions due to cross-slip increases [36]. Therefore, as in the case of DP-
steels, at larger strains the hardening tends to be isotropic, which causes a clear

20
20
diminution of the back stress increase rate. This effect can be observed in Fig. 6a since
from a strain of 2% to 5% the back stress for 316L steel shows a very small increase.
Compared to DP and 316L steels, TWIP steels show no signs of reduction in the rate of
increase of the BE at the pre-strains analyzed in Fig. 6a. This continuous increase of the
BE has been related to the interaction of the twin lamellae with dislocations. This
mechanism has been defined as a strong source of back stresses in TWIP steels and acts
over larger strain periods [7,8,10,25,27].
In particular, models for the increment of back-stress [8,10], make it possible to link the
kinematic hardening created by the accumulation of dislocations in the matrix at twin
boundaries with twin volume fraction and thickness. Accordingly, an equation for the
back stress (σb) used by Bouaziz et al. and proposed by [38] is used here:
nL
bMb
· (2)
where M is the average Taylor factor, µ is the shear modulus, b is the burgers vector, n
the number of dislocations stopped at the boundary and L the mean intercept length. In
turn, the dependence of L with strain can be expressed by the following relation:
v
v
f
ftL
12 (3)
where t is the twin thickness and fv is the twin volume fraction.
The continuous increase of the BE for TWIP steels up to 20% strain observed in Fig. 6a
can be explained by Eqs.(2) and (3). It has been shown that twinning in TWIP steels can
be active for larger strains up to 0.50 [14,25]. Therefore, fv is expected to grow
continuously during all this period giving smaller values of L. Moreover, as TWIP steels
are deformed, there is an increase of the dislocation density that enhances the
interactions between dislocations and twin boundaries, rendering a continuous increase
of n in Eq. (2). Both contributions promote an increase in σb. This increase in

21
21
dislocation activity around twin boundaries can be observed in the TEM micrographs
for the material strained to 5% (T5). In the grains with no twinning activity (Fig. 8a),
long dislocations lines are observed, whereas in the grains with twin bundles (Fig. 8b)
the dislocation lines are shorter and the intersections more frequent.
Firstly, the validity of this mechanism in TWIP steels at low strains due to the low
twinning activity must be discussed. There is some variability between different works
in the literature about the twinning activity at a pre-strain of 5% in TWIP steels. In some
cases, it has been found that the number of grains with mechanical twins is moderate,
with a fv≈0.05 [31]. In addition, the presence of twinning activity has a clear influence
in the work hardening rate since it starts to increase at these low strains [31]. In other
cases, the fv at this pre-strain is smaller, and the twinned grains are more difficult to be
seen [12,15,25,34]. Consequently, the typical increase of the work hardening rate due to
twinning activity is not observed, although in some cases the hardening rate is already
almost constant [25]. In this situation, at a pre-strain of 5% it is reasonable to think that
although twinning has a growing role in the overall mechanical response of TWIP steels
and its influence in the development of back stress is large, other sources of back stress
could still play a significant role.
As mentioned above, stacking faults can act as a source of back stress. Here it is
interesting to note that at low strains, the presence of overlapped stacking faults has
been described in FeMnC steels and other fcc metals [39]. In addition, they have been
considered as a previous step in twin formation [39-41]. This suggests that a significant
presence of stacking faults is feasible and consequently some contribution from them to
the overall back stress on TWIP steels at a pre-strain of 5% could be expected.
In the case of a pre-strain of 10%, it can be considered that the effect of twinning
activity on the mechanical behavior of TWIP steels is even more important. This strain

22
22
marks approximately the beginning of the high work hardening stage and the fraction of
primary twinned grains is between 20 and 30% [12,15,25,34]. In addition, in FeMnC
TWIP steels there is a clear increase of the secondary twinned grains [15,34]. In this
scenario, twinning activity affects the overall behavior of the material and the
interaction of twin lamellae with dislocations can be considered as the main source of
back stress in TWIP steels. Therefore, it might be concluded that the mechanism for the
increment of the back stress proposed above could be applied from this strain for the
TWIP steels studied here.
Secondly, although this mechanism can be applied to all TWIP steels in Fig. 6a, there
are marked differences in the total amount of the BE between the Fe-22Mn-0.6C steels
and the Fe-17.5Mn-0.7C-2Al steel presented here. At 5% and 10% strain, the BE of Fe-
22Mn-0.6C steels is nearly twice the value of the Fe-17.5Mn-0.7C-2Al steel. Here it is
important to point out that the forward stress (σfor) at pre-strains of 5% and 10% are
quite similar for the three steels, around 600 MPa and 700 MPa respectively. It means
that the contribution of back stress to the total stress in the case of Fe-22Mn-0.6C steels
doubles the one of the Fe-17.5Mn-0.7C-2Al steel. While in Fe-22Mn-0.6C steels the
contribution of BE is slightly less than half the total stress [7,8,10], for the present
TWIP steel this value is around 20%. This effect can be attributed to the role played by
aluminum in TWIP steels.
As pointed out in the work by Jin et al. [12], the presence of aluminum hinders the
precipitation of (Mn,Fe)C in the Fe-18Mn-0.6C steel and decreases the activity of C
atoms in the austenite matrix, weakening the pinning force of these atoms on mobile
dislocations. The latter effect leads to a reduction in the Dynamic Strain Aging (DSA)
phenomenon [42], which is reflected in the delay and the diminution in the step height
of the serrations in the tensile curve of Al-added TWIP steels [13]. Moreover, the

23
23
addition of aluminum to FeMnC TWIP steels increases the Stacking Fault Energy
(SFE), which promotes a decrease in the activity of mechanical twinning and a certain
increase of the dynamic recovery effect [43]. The extent of the decrease in primary
mechanical twinning varies depending on the authors, but in the case of secondary
mechanical twinning a large reduction has been reported [12,15,28]. This decrease in
the activity of mechanical twinning and the increase in dynamic recovery means that the
strain hardening of FeMnCAl TWIP steels is clearly lower than the one for FeMnC
TWIP steels of similar composition [14,15,43] and similar grain size [27].
This decrease of twinning activity for Al-added TWIP steels can then be related to the
lower values of the BE as derived from Eqs. (2) and (3). According to several works
[12,14,15], the value of fv for the present Fe-17.5Mn-0.7C-2Al steel would be lower
than for the Fe-22Mn-0.6C steel. Concerning twin thickness t, the average value
observed in the present samples at a tensile strain of 5% (T5) was 40 ± 15 nm, which
can be considered slightly low and mainly influenced by the fine grain size [25]. In
FeMnCAl TWIP steels tested at similar strain rate and with a grain size of 40 µm, a
wide range of average twin thickness has been reported, from 15 nm to 120 nm [15,16].
For the Fe-22Mn-0.6C TWIP steels tested at similar strain rates, lower values of t,
between 10 and 40 nm, were reported when studying fine-grained materials [26],
whereas the t average values were 17 ± 5 and 16 ± 8 nm when considering coarse
grained (40 µm) materials [15,16]. These results might suggest that the twin thickness in
the present FeMnCAl steel can be larger than in the case of the fine-grained Fe-22Mn-
0.6C steel studied by Bouaziz et al. [8] and similar to the coarse-grained Fe-22Mn-0.6C
Steel studied by Gutierrez et al. [7], since they estimated twin thicknesses between 30
and 60 nm. Therefore, it can be concluded that in Eq. (3) the mean intercept length L for
the present FeMnCAl TWIP steel should be larger than for the FeMnC TWIP steels.
24
24
In the Eq. (2), apart from L, the term n accounts for the dislocations stopped at the grain
and twin boundaries. As shown in Fig. 8a, there is a big difference in the dislocation
density between twinned and untwinned grains, since in the former ones there are a
great number of dislocations which are trapped in the twin spacing. At the strains levels
studied here, little twinning activity is generally reported, although it is not null, and in
some cases, at low strains (i.e., 2%) a direct effect of twinning has been related to an
increase of the strain hardening [15,25,26]. Again, as exposed before, FeMnCAl TWIP
steels tend to generate less number of twinned grains than FeMnC TWIP steels
[12,15,28], so it is expected that n should be lower for the present FeMnCAl steel than
for the FeMnC steels.
Therefore, Eq. (2) can offer a reasonable explanation for the lower values of the BE
observed in the present Fe-17.5Mn-0.6C-1.5Al steel, as compared with the Fe-22Mn-
0.6C steel, mainly based in the slower rate of mechanical twins in the Al-added TWIP
steels.
Permanent softening
It must be borne in mind that the back stress is measured by Eq. (1), but at strains in
which the forward and reverse curves are nearly parallel; this means that the back stress
is measured after the “transient hardening” period during which most of the dislocations
initially piled-up in twin boundaries and grain boundaries have moved backward.
Moreover, as the strain increases in the reverse direction the combination of dislocation
and twinning activity hardens the material.
Before analyzing the differences between the different materials, the fact that very
similar strain hardening behavior is observed during the tensile and compression periods
in Fig. 5, should be mentioned. It should be noted that the same behavior was observed

25
25
in other cyclic tests on TWIP steel [7,8]. The study of the microstructure after the
compression period in the 5% cyclic test (T5C5 samples) shows that there is an
evolution in dislocation and twinning activity. On the one hand, the dislocations tend to
create a cell structure (Fig. 8c), which has been also observed in Fe-22Mn-0.6 C steels
[6,25]. On the other hand, as observed in Fig.7c there is a clear increase of the amount
of grains in which bundles of mechanical twins are observed. Although it has been
shown that in cyclic tests with low strain amplitude (up to 1%) twinning has limited
activity in the compression half of deformation cycles [6,20]; in the present case for the
deformation cycle of 5% the strain in the compression half is 10%, which seems to be
large enough to promote twinning activity. At the same time, the compression strain
intervals studied here do not seem to be large enough to observe the decrease of
twinning activity that is associated to the rotation of most of the twinned grains from
orientations <100> to <110> as the compressive strain increases. This decrease in
twinning activity would lead to a decrease in strain hardening [32]. Therefore, after
“transient hardening” period, no microstructural changes that could lead to significant
differences in the strain hardening between tensile and compressive periods have been
found.
With regard to the back stress values obtained by permanent softening for the different
type of steels, it seems that in general, increase stops at large strains. This was more or
less expected for the DP-steel since the same situation was found in analyzing the BE,
due to the dislocations slip and creation of dislocations cells. In the case of TWIP steels,
the values for the present Al-added TWIP steel are slightly lower than the ones for the
Fe-22Mn-0.6C steel with a large grain size [7,25]; both are more or less half of the fine
grain size Fe-22Mn-0.6C steel [8]. It must be taken into account that the contribution of
back stress to the total stress in the Al-added TWIP steel is around 10-12%, whereas for

26
26
the large grain-sized FeMnC steel it is around 18% and near 40% for the low grain-
sized FeMnC. The lower twinning activity in the Al-added TWIP steel could again
explain, by using Eqs. (2) and (3), the relative low values of back stress for this steel
with regards FeMnC TWIP steels.
In order to understand the reason for the permanent softening during reverse stage in the
present FeMnCAl steel, one factor that could play a role would be the twin thickness t,
since in the compressive stage this parameter appeared to be slightly higher than for the
first tensile stage, 60 ± 15 nm and 40 ± 15 nm, respectively. At the same time, twin
spacing has grown a little, i.e. from 180 ± 50 nm to 220 ± 60 nm. According to Eq. (3),
the increase of t would lead to a larger L. In addition, this bigger twin spacing could be
related to a smaller increase of the amount of dislocations stopped at twin boundaries,
which would mean lower values of n. Therefore, the increase of twin thickness and twin
spacing would be the two microstructural features that might explain the decrease of the
flow stress during the compressive stage for the present Al-added TWIP steel.
5. Conclusions.
The FeMnCAl TWIP steel studied shows a continuous increase of the back stress during
reverse loading in the compression stage as the pre-strain is increased to 10%. This
trend coincides with the behavior of some FeMnC TWIP steels reported in literature and
is consistent with existing hardening models for TWIP steels. When the back stress is
analyzed using the 0.2% offset method and related to the Bauschinger effect, the value
of the back stress for the FeMnCAl TWIP steel and its contribution to the total
hardening is half the one reported for FeMnC TWIP steels. This behavior can be related
to the decrease of mechanical twinning activity in Al-added FeMnC TWIP steels, since

27
27
it has been reported that the primary source of polarized internal stresses in these steels
consists on the dislocations pinned in the matrix by twin boundaries.
When the back stress is analyzed by permanent softening measurements, the values are
in all cases much smaller than in the case of the Bauschinger effect. The FeMnCAl steel
shows again lower values than FeMnC steels, which can once more be related to the
lower twinning activity of FeMnCAl steels.
For the present FeMnCAl steel the strain hardening in tensile and compressive stages is
very similar. It has been found that the twin thickness and twin spacing appeared
slightly larger in the compressive stage. Since the increase of both parameters is related
to a diminution of the kinematic hardening, they could explain the differences between
the tensile and compressive strengths after the transient hardening period for the
FeMnCAl TWIP steel.
ACKNOWLEDGMENTS
The authors would like to thank the Spanish Ministerio de Economia y Competitividad
(project ref. MAT2014-59419-C3-1-R) and the Agència de Gestió d’Ajuts Universitaris
i de Recerca de la Generalitat de Catalunya (project 2010 CONE3 42) for the economic
support and Posco (South Korea) for supplying the steel studied.

28
28
REFERENCES
[1] Eggertsen P.A. and Mattiason K., Inter. J. of Mech. Sci. 51 (2009) 547-563.
[2] Yoshida F. and Uemori T. Inter. J. of Mech. Sci. 45 (2003) 1687-1702.
[3] Geng L. and Wagoner R.H., SAE paper No. 2000-01-0768 (2000), SAE, Inc.
[4] Bouvier S., Haddadi H., Levée P.and Teodosiu C. 172 (2006) 96.
[5] Boger, R. K., Wagoner, R.H., Barlat, F., Lee, M.G. and Chung, K. Inter. J. of Plas.
21 (2005) 2319-2343.
[6] Lambers, H.-G. Rüsing C.J., Niendorf, T., Geissler D, Freudenberger, J and Maier
H.J., Int. J, of Fatigue 40. (2012). 51-60.
[7] Gutierrez-Urrutia I., Del valle J.A., Zaefferer S. And Raabe D. J. of Mat. Sci. 45
(2010) 6604-6610.
[8] Bouaziz O, Allain S and Scott C., Scripta Mater. 58 (2008) 484-487.
[9] Karaman I., Sehitoglu H., Chumlyakov Y.I., Maier H.J and Kireeva IV. Metall
Mater Trans A 32 (2001) 695.
[10] Gil Sevillano J. Scripta Mater. 60 (2009) 336-339.
[11] Bouaziz O., Allain. S, Scott C.P. Cugy P and Barbier D. Curr. Opin. In Sol. State
and Mat. Sci. 15 (2011) 141-168.
[12] Jin J-E. And Y-K. Lee. Acta Mater. 60 (2012) 1680-1688.
[13] De Cooman B.C., Kim J. and Lee S., Scripta Mater. 66 (2012) 986-991.
[14] Lee Y-K., Scripta Mater 66 (2012) 1002-1006.
[15] Yang H. K., Zhang Z. J. and Zhang Z. F. Scripta Mater 68 (2013) 992-995.
[16] Yang H. K., Zhang Z. J., Dong F. Y., Duan Q. Q. and Zhang Z. F. Mat. Sci. and
Eng. A607 (2014) 551-558.
[17] Lee M-G., Kim D., Kim C., Wenner M.L., Wagoner R.H. and Chung K. Inter. J of
Plast. 21 (2005) 883-914.

29
29
[18] Jin J-E and Y-K. Lee. Mater.Sci and Eng A, 527 (2009) 157.
[19] Ahn H., Yoo D., Seo M.H. Park S-H and Chung K., Met. Mater. Int., 15 (2009)
637-647.
[20] Saleh A.A., Pereloma E.V., Clause B., Brown D.W., Tomé C.N. and Gazedr A.A.
Acta Mater. 61 (2013) 5247-5262.
[21] Choteau M., Quaegebeur P and Degallaix S. Mech. of Mater. 37 (2005) 1143-1152.
[22] Kubawara T, Morita Y, Miyashita Y and Takahashi S. Proceedings in the Int. J. of
Plas. 233-236 (2003) 287-292.
[23] Choi J. S., Lee J. W., Kim J-H., Barlat. F, Lee M.G. and Kim. D. Int. J. of Mech.
Sci. 98 (2015) 144-156.
[24] Gil Sevillano J. and De las Cuevas F. Scripta Mater. 66 (2012) 978-981.
[25] Gutierrez-Urrutia I. And Raabe D., Acta Mater. 59 (2011) 6449-6462.
[26] Barbier D., Gey N., Allain S., Bozzolo N and Humbert M. Mater. Sci and Eng A.
500 (2009) 196-206.
[27] Gutierrez-Urrutia I. And Raabe D., Scripta Mater. 66 (2012) 992-996.
[28] Canadinc D., Sehitoglu H., Maier H.J. and Chumlyakov Y.I., Acta Mater. 53
(2005) 1831.
[29] Raabe D. Steel Res. 74 (2003) 327-337.
[30] Su Y., Li Lin.and Fu R. J. of Iron ans Steel Res. Inter. 20 (2013) 46-53.
[31] Barbier D., Favier V. And Bolle B. Mater. Sci and Eng A. 540 (2012) 212-225.
[32] Meng L., Yang P., Xie Q., Ding h. And Tang Z., Scripta Mater 56 (2007) 931-934.
[33] Ueji R., Tsuchida N., Terada D., Tsiju N and Tanaka Y. et al. Scripta Mater. 59
(2008) 963.
[34] Renard K. and Jacques P.J. Mater. Sci and Eng A, 542 (2012) 8-14.

30
30
[35] Wollmershauser J. A., Clausen B. and Agnew S.R. Int J. of Fatigue, 36 (2012) 181-
193.
[36] Feaugas X. Acta Mater. 47 (1999) 3617-3632.
[37] Peeters B., Kalidindi S.R., Van Houtte P. And Aernoudt E. Acta Mater. 48 (2000)
2123-2133.
[38] Estrin Y. And Mecking H. Acta Metall. 32 (1984) 57.
[39] Idrissi H., Renard K, Ryelandt L., Schryvers D. and Jacques P.J. Acta Mater. 58
(2010) 2464-2476.
[40] Xu Z., Li N., Jiang H and Liu L. Mater. Sci and Eng. A. 621 (2015) 272-276.
[41] Liao X.Z. Zhao Y. H. Srinivasan S.G., Zhou F., Zhu Y.T., Valiev R.Z. and
Gunderov D.V. Appl. Phys. Lett. 100 (2004) 592-594.
[42] Chen L., Kim H.S., Kim S.K. and De Cooman B. C., ISIJ Inter.47 (2007) 1804.
[43] Rohatgi A., Vecchio K. S. and Grey G. T. Met. and Mater. Trans. A. 32 (2001)
135-168.

31
31
LIST OF CAPTIONS.
Figure 1. Dimensions of the samples used for cyclic tests in mm.
Figure 2. Assembly of the anti-buckling device and the video-extensomenter for the
cyclic test of sheet samples.
Figure 3. Tensile stress-strain curve for the Fe-17Mn-0.7C-2Al TWIP steel together
with the fitting curve using Swift’s hardening law. The strain hardening evolution with
strain is also displayed.
Figure 4. Cyclic tests al different pre-strains together with the original tensile curve for
the Fe-17Mn-0.7C-2Al TWIP steel
Figure 5. Forward and reverse curves for the three pre-strains tested. Reverse curves are
plotting with positive stress values for better comparison.
Figure 6. Evolution of back stress with strain in reverse tests. A) Bauschinger effect
(BE): Values extracted with the 0.2% offset method. B) Permanent Softening (PS):
Values obtained from the point in which forward and reverse curves become parallel.
Figure 7. Evolution of the microstructure of Fe-17Mn-0.7C-2Al TWIP steel during the
cyclic test at 5% pre-strain. Image Quality maps obtained by EBSD. A) Initial material;
B) First tensile stage at 5% strain (T5); C) Compressive stage at -5% strain (T5C5); D)
Second tensile stage at 5% strain (T5C5T5). TD: Tensile direction.
Figure 8. TEM micrographs showing the evolution of dislocation structure and
mechanical twins for the cyclic test at 5% pre-strain. A and B) After first tensile stage at
5% strain (T5); C and D) After compressive stage at -5% strain (T5C5); E and F) After
the second tensile stage at 5% strain
Figure 9. ODF in φ2 = 45º sections and IPF for the as-received material and after
different strain levels. a) as-received material; b) after 5% tensile strain (T5) c) after

32
32
compressive stage to -5% strain (T5C5) and d) after second tensile stage at 5% strain
(T5C5T5).

33
33
Table 1
Chemical composition of the TWIP steel used in this study (in weight percent).
Material Mn C Si Al Ti Mo Fe
% 17,0 0,73 0,07 1,91 0,10 0,31 Bal.
Table 2.
Calculations of back stress by the permanent softening method. The contribution of σb
to hardening was calculated by σb/(σfor- σ0). σ0 = 390 ± 2 MPa
Pre-
strain
εrev εfor εrev/εfor σfor
(MPa)
σrev
(MPa)
σb (MPa) Contribution to
hardening (%)
0.02 0.032 0.02 1.6 623 ± 2 585 ± 5 19 ± 4 8 ± 2
0.05 0.045 0.05 0.9 725 ± 2 660 ± 5 32 ± 4 10 ± 2
0.10 0.052 0.10 0.52 860 ± 2 780 ± 5 40 ± 4 9 ± 2

34
34
Fig.1. Dimensions of the samples used for cyclic tests in mm.

35
35
Fig. 2. Assembly of the anti-buckling device and the video-extensomenter for the cyclic
test of sheet samples.

36
36
0,0 0,1 0,2 0,3 0,4 0,5
0
200
400
600
800
1000
1200
1400
1600
ST
RA
IN H
AR
DE
NIN
G (d
/d) (M
Pa
)
Exp.
Fitting
O Strain Hardening
TR
UE
ST
RE
SS
(M
Pa
)
TRUE STRAIN (MPa)
= 2153( + 0.11)0.69
1000
2000
3000
4000
5000
Fig.3. Tensile stress-strain curve for the Fe-17Mn-0.7C-2Al TWIP steel together with
the fitting curve using Swift’s hardening law. The strain hardening evolution with strain
is also displayed.

37
37
-1000
-800
-600
-400
-200
0
200
400
600
800
1000
-6 -4 -2 +10+8+6+4
Tru
e s
tre
ss
True strain (%)
+2
Fig.4. Cyclic tests al different pre-strains together with the original tensile curve for the
Fe-17Mn-0.7C-2Al TWIP steel.

38
38
0
100
200
300
400
500
600
700
800
900
1000
1100
25
Tru
e s
tre
ss (
MP
a)
True strain (%)
5 10 15 20
Fig.5. Forward and reverse curves for the three pre-strains tested. Reverse curves are
plotting with positive stress values for better comparison.

39
39
0
100
200
300
400
0
50
100
150
B
5 10 15 20TRUE STRAIN (%)
20
FeMnC[8]
FeMnC[7]
FeMnCAl
DP-steel[17]
FeMnCAlSi[20]
316L[21]
b (
MP
a)
BE
PS
5 10 15
A
FeMnC[8]
FeMnC[7]
FeMnCAl
DP-steel[18]
b (
MP
a)
Fig.6. Evolution of back stress with strain in reverse tests. A) Bauschinger effect (BE):
Values extracted with the 0.2% offset method. B) Permanent Softening (PS): Values
obtained from the point in which forward and reverse curves become parallel.

40
40
Fig.7. Evolution of the microstructure of Fe-17Mn-0.7C-2Al TWIP steel during the
cyclic test at 5% pre-strain. Image Quality maps obtained by EBSD with a step size of
0.1 µm. A) Initial material; B) First tensile stage at 5% strain (T5); C) Compressive
stage at -5% strain (T5C5); D) Second tensile stage at 5% strain (T5C5T5). TD: Tensile
direction.

41
41
Fig.8. TEM micrographs showing the evolution of dislocation structure and mechanical
twins for the cyclic test at 5% pre-strain. A and B) After first tensile stage at 5% strain
(T5); C and D) After compressive stage at -5% strain (T5C5); E and F) After the second
tensile stage at 5% strain.

42
42
Fig.9. ODF in φ2 = 45º sections and IPF for the as-received material and after different
strain levels. a) as-received material; b) after 5% tensile strain (T5) c) after compressive
stage to -5% strain (T5C5) and d) after second tensile stage at 5% strain (T5C5T5).
1
1
STRESS-STRAIN RESPONSE AND MICROSTRUCTURAL EVOLUTION OF
A FeMnCAl TWIP STEEL DURING TENSION-COMPRESSION TESTS
J. A. BENITO1,2*
, R. COBO1, W. LEI
3, J. CALVO
1,3 and J. M. CABRERA
1,3
1 Fundació CTM Centre Tecnològic de Manresa, Plaça de la Ciència 2, 08243, Manresa,
Spain.
2 Department of Materials Science and Metallurgical Engineering, EUETIB, Universitat
Politècnica de Catalunya, Comte d'Urgell 187, 08036 Barcelona, Spain,
3 Department of Materials Science and Metallurgical Engineering, ETSEIB, Universitat
Politècnica de Catalunya, Av. Diagonal 647, 08028 Barcelona, Spain.
*Corresponding author.
E-mail address: [email protected]
Tel. +34-934010946, Fax.+34-934010706
Materials Science Department, Pavelló E. ETSEIB.
Av. Diagonal, 647.
08028 Barcelona
Spain
*Marked-up Manuscript

2
2
Abstract.
The stress-strain response of a Fe-17.5Mn-0.7C-2Al TWIP steel during cyclic loading
has been investigated by means of tension-compression tests between within the strain
limits of ±2%, ±5% and ±10%. In addition, the microstructural evolution during the
±5% cyclic test has also been studied. The difference between the forward and reverse
stress for every each pre-strain has been analyzed at 0.2% offset strain and at the strains
in which forward and reverse curves were parallel in order to study the Bauschinger
effect (BE) and permanent softening, respectively. The evolution of the BE with pre-
strain for this steel is similar to other FeMnC TWIP steels, that is, increasing values of
BE are obtained as the pre-strain increases. However, the its absolute values are half of
those reported in the literature for on other FeMnC steels. This diminution of the BE is
related to the lower activity of the mechanical twinning in FeMnCAl TWIP steels at the
pre-strains herein being investigated here, which promotes less polarized stresses in the
matrix due to the lower dislocations storage capacity.
Regarding permanent softening, the evolution is similar to that of the BE and the same
analysis can be applied. During reverse compression, a slight increase of twin thickness
and twin spacing with respect to the first tensile stage took place., and this This fact
might be linked to the lower flow stress observed in the permanent softening period
during reverse straining.
Keywords: TWIP steels, Bauschinger effect, mechanical twinning, dislocation
structure.

3
3
1. Introduction
Twinning-induced plasticity (TWIP) steels are being extensively studied due to because
of their excellent combination of high-tensile strength and large ductility. One of the
most promising applications is the manufacture of car components where energy
absorption is a determinant determining factor. It is well-known that one of the
problems during sheet forming of high strength steels is the large amount of springback.
In the control of springback, numerical methods (such as the finite element method) are
used to predict the differences between the final obtainable forms and the designed
forms. With this knowledge, die modifications can be carried out and the springback
can be controlled (and minimized) following an iterative process. In order to obtain
accurate forming simulations and therefore diminish the number of iterations, it is
necessary to use good plasticity models that can give accurate stress predictions. The
hardening law to be introduced in the above these models must be able to predict the
cyclic stress-strain behavior of the given material, especially when bending-unbending
operations are involved, such as the ones taking place in industrial forming processes. It
is particularly important to model the reverse loading flow curve, which should include
the Bauschinger effect, the transient behavior and the permanent softening [1].
The hardening models that have shown better accuracy in predicting the magnitudes of
the forward and reverse stresses are based on mixed isotropic-kinematic hardening laws
[2,3]. The kinematic Kinematic hardening is added to the isotropic hardening by a the
so-called “back stress” that reflects the anisotropy of the yield strength. This back stress
causes an increase of stress during forward straining but helps decreasing to decrease
the flow stress in the opposite direction. This back stress can be determined by different
tests: three-point bending tests [1], shear tests [4] and tension-compression tests [5].

4
4
Some Various studies on the cyclic behavior of TWIP steels [6] and on reverse loading
[7,8] have been carried out in recent years. In these studies, a Fe-22Mn-0.6C steel was
selected, and it was observed a large contribution of the kinematic hardening to the
overall hardening was found. This large contribution was related to the combined effect
of mechanical twins formed during the deformation and the glide of dislocations, which
are pinned at twin boundaries [9]. The storage of dislocations in the matrix by the action
of twin boundaries is in the basis of the stress-strain response of TWIP steels; and some
hardening models have been proposed to relate these mechanisms to the pronounced
work-hardening observed in these steels [10,11].
Despite the excellent tensile properties of FeMnC TWIP steels, it has to be mentioned
that some problems have been reported in the literature. Among them, these problems
we can find low yield strength, delayed fracture and heterogeneous deformation. The
addition of Al can solve some of these problems since it suppresses the precipitation of
cementite [12], promotes solid solution hardening, reduces H-embrittlement related to
the delayed fracture and reduces Dynamic Strain Aging (DSA) [13]. On the other hand,
FeMnCAl TWIP steels show less mechanical twinning activity and lower strain
hardening rates than FeMnC TWIP steels [13-15]. As already mentioned, the
development of back stresses in TWIP steels has been related to the combined
mechanism between mechanical twins and dislocations glide, so the lower twinning
activity in of FeMnCAl steels should be reflected reflect in lower values of back stress
with pre-strain in cyclic tests.
Although the tensile properties and strain hardening of FeMnCAl TWIP steels have
been widely studied [13-16] there is scarce very little information about its response in
reverse loading. The present study, therefore, investigates the stress-strain behavior and
the microstructural evolution of a FeMnCAl TWIP steels during cyclic tests. The

5
5
possible differences in the evolution of the back stress with increasing strain and its
relationship with mechanical twinning could indirectly help to understand the important
contribution of kinematic hardening in TWIP steels.
2. Materials and Methods.
The studied material was a hot rolled TWIP steel sheet provided by POSCO with 2.6
mm in a thickness 0f 2.6 mm. The chemical composition in mass percentage is listed in
Table 1 and the initial average grain size was 4 µm, although the grain size varied
within from 0.6 to 18 µm. The microstructure and the local texture of the initial and
deformed material during the 5% strain cycle were characterized by Electron Back
Scattered Diffraction (EBSD) on the longitudinal plane, at approximately at half
thickness. The samples were mechanically polished with 2500 grit SiC paper until down
to 0.02 µm colloidal silica suspension following standard metallographic procedures.
The EBSD measurements were performed using a JEOL JSM-7001 F Field Emission
Scanning Electron Microscope (FE SEM) using the Oxford Instruments HKL channel 5
software package. A step size of 0.1 µm was used and misorentations below 3º were not
considered in the post processing data procedure. Additional analysis of the
microstructure was performed using the Kikuchi pattern quality (KPQ) maps from
EBSD scans and standard FE SEM micrographs. Transmission Electron Microscopy
(TEM) was carried out to investigate twin thickness and twin spacing as well as the
evolution of the dislocation arrangement in the deformed samples. The specimens were
analyzed in a Philips CM30 microscope operating at 300 kV. Samples for TEM
observation were thinned by jet-polishing in an electrolyte solution of 94 vol% acetic
acid and 6% percloric acid. Finally, X-ray diffraction studies (XRD) were done to verify
the absence of ε-martensite in the deformed stages during tensile or cyclic tests (not

6
6
shown here). The measurements were carried out in a Siemens D-500 equipment using
CuKα radiation with wavelength λ=0.1506 nm.
The tensile and cyclic tests were carried out at room temperature in a MTS 250 kN
testing machine. Tensile samples were machined from the initial sheet according to EN
10002-1 standard, with the tensile axis (TA) parallel to the rolling direction (RD) and a
gauge length of 50 mm. For the cyclic tests, the geometry of the samples was designed
to minimize buckling during reversal tests. Again, the tensile and compression axis
were parallel to the rolling direction. The dimensions of the cyclic samples are
illustrated in Figure 1. In both tests, the strain rate was controlled at 8·10-4
s-1
.
In the case of the cyclic tests, an anti-buckling device inspired by the apparatus used by
Boger et al. [5] was designed. Flat plates were used for buckling constraint, covering
nearly all the free surface of the samples. The clamping system applied a constant force
of 10 kN that corresponded to a stress of 5 MPa in both sides of the samples. A Teflon
film with a thickness of 0.10 mm was inserted between the clamping system and the
sample in order to reduce friction. The displacement was measured in the flank of the
specimens using a Real time strain sensor (RTSS) video extensometer from Limess
GmbH. The clamping system and the measurement systems can be observed in Figure
2. As described by Lee et al.[17] the constraint in the thickness direction during
compression tests requires corrections to eliminate the effect of the friction and the
biaxial effects. The friction coefficient was calculated by comparing the values of the
tensile tests without the clamping system with the first tensile period of the cyclic tests
in which the clamping system was installed. With regard to biaxial effects, the value of
the effective stress in the thickness direction (-5 MPa) is very small compared with the
value of the initial yield stress of the TWIP steel used in this study, 480 MPa. Therefore,

7
7
the variation of the effective stress was well below a 0.5% and no additional correction
was added [5].
3. Results.
3.1.Tensile tests.
The true stress-true strain curve for the TWIP Fe-17.5-0.7C-2Al steel is shown in Fig. 3.
The values of yield strength (YS) and Ultimate Tensile strength (UTS) were 480 MPa
and 1530 MPa, respectively. The total elongation was nearly 50%, which shows the
good combination of high strength and ductility for this steel. The high strength of the
present TWIP steel can also be related to the fine grain size (4 µm). Similar mechanical
properties have been reported for others Fe-Mn-C TWIP steels of similar grain size
[8,18]. Moreover, some contribution to strength is expected from carbon atoms
dissolved in the austenite matrix, since the addition of 2% wt. of Al prevents cementite
precipitation [12]. The analysis of the curve shows some micro-serrations from a strain
of 0.3 up to the necking point. The addition of Al is also reported to decrease the
number and the height of these micro-serrations, and in this case they appear at larger
strain intervals and with lower step heights than in the case of Fe-Mn-C TWIP steels
with no Al [12]. The plastic regime of the tensile curve was fitted to a Swift type
hardening law and good correlation was observed, as also shown in Figure 3. The stress
hardening exponent n was as high as 0.69 ± 0.02, in consonance with other values found
in literature [19].
The evolution of the strain hardening rate (dσ/dε) of the present Fe-17.5Mn-0.7C-2Al
steel is also plotted in Fig. 3. The general trend is very similar to the that of Fe-19Mn-
0.6C-2Al reported by Jin et al.[12] since no increase of strain hardening or even
relatively constant values of hardening are observed during most of the deformation

8
8
period. It is worth noting that the present steel has a higher strain-hardening rate than
the one reported by Jin et al., being the difference being around 300 MPa. This effect
could be related to small differences in mechanical twinning rate or to the high activity
of C atoms dissolved in the austenite matrix, since the present steel has a marked larger
C content.
3.2.Tension-compression tests.
The tension-compression curves for cycles with strains of 2, 5 and 10% strain are
displayed in Fig.4. While for strains of 2% and 5% strain the cycles were completed
satisfactorily, for a strain of 10% samples showed buckling in the unsupported gap
when the compression step was close to finishing. Although the cycle with a strain of
10% strain was then not fully characterized then, the compressive strain achieved was
considered to be enough to reveal the Bauschinger effect and permanent softening at a
pre-strain of 10% pre-strain.
Regarding the cycles at with strains of 2% and 5% strain, cyclic hardening was
observed, and the increase of the stress at the end of the cycle was directly related to the
strain of the cycle (60 MPa for a strain of 2% strain and 220 MPa for a strain of 5%
strain). This behavior agrees well is in accordance with other studies in which the low-
cycle fatigue of TWIP steels was investigated [6].
The evolution of the forward stress (σfor) and reverse stresses (σrev) for each cycle is
displayed in Fig. 5. For a better comparison, the reverse stage has been moved up to the
upper part by rotating 180º. As described elsewhere and pointed out for some TWIP
steel compositions [7,20], in the reverse stage an early re-yielding can be observed at
any forward strain applied, which is commonly referred to as Bauschinger effect (BE).
All the curves in the reverse stage finally become nearly end up practically parallel to

9
9
the forward curve after a “transient strain hardening” period, but they do not reach the
values of the forward stress. Therefore, a “permanent softening” is observed in all the
cases. The difference between forward and reverse stress is related to internal polarized
stresses commonly named back stress (σb) [8,10]. The Back stress can be calculated by
the equation (1):
2
revfor
b
(1)
Where σfor is the stress at the end of the forward part of the cycle and σrev is associated
to the yield stress after load reversal. In turn, σrev can be taken as the point of deviation
from elasticity [20], or it can be determined by the 0.2% offset method [8,17] or from
the point in which the forward and reverse curves become parallel after enough reverse
strain [7]. In the case in which σrev is measured by the 0.2% offset method or by the
deviation from elasticity, the back stress would be more related to the Bauschinger
effect (BE). In the case in which σrev is determined at a strain in which the reverse and
forward curves become parallel, the back stress would be related to permanent
softening. It is interesting to define the strain at which back stress is measured since the
values obtained by the 0.2% offset method are usually 2-3 times higher than those
obtained from permanent softening. The difference seems to be independent from the
type of steel and the type of test, whether shear or tension-compression. Here, for the
sake of comparison, the back stress has been analyzed according to the 0.2% offset and
permanent softening methods. The results are shown in Fig. 6. Together with the values
for the present Fe-17.5Mn-0.7C-2Al steel, the results reported for other alloys are also
included,; namely, Fe-22Mn-0.6C [7,8] obtained by reverse shear tests, Fe-24Mn-3Al-
2Si-1Ni-0.06C [20], a DP-steel [17], and a 316L stainless steel [21] determined by
tension-compression tests. Tension-compression and shear tests are common
experimental methods to observe for observing the Bauschinger effect on sheet
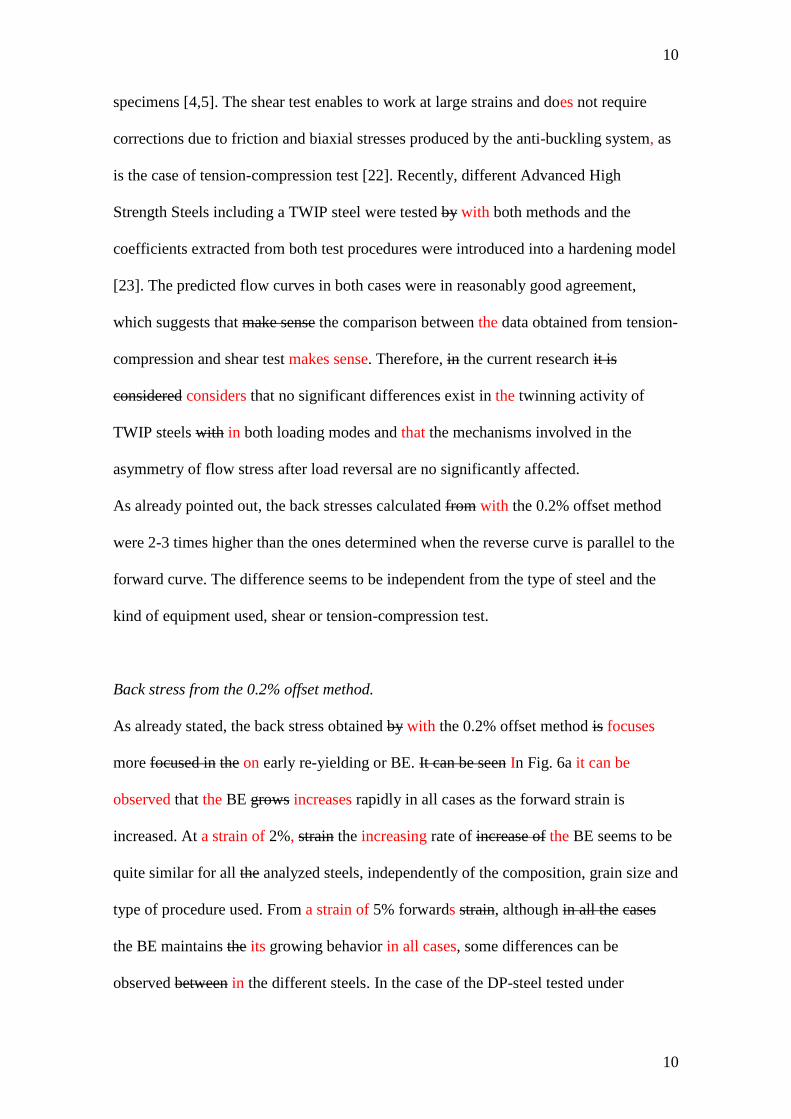
10
10
specimens [4,5]. The shear test enables to work at large strains and does not require
corrections due to friction and biaxial stresses produced by the anti-buckling system, as
is the case of tension-compression test [22]. Recently, different Advanced High
Strength Steels including a TWIP steel were tested by with both methods and the
coefficients extracted from both test procedures were introduced into a hardening model
[23]. The predicted flow curves in both cases were in reasonably good agreement,
which suggests that make sense the comparison between the data obtained from tension-
compression and shear test makes sense. Therefore, in the current research it is
considered considers that no significant differences exist in the twinning activity of
TWIP steels with in both loading modes and that the mechanisms involved in the
asymmetry of flow stress after load reversal are no significantly affected.
As already pointed out, the back stresses calculated from with the 0.2% offset method
were 2-3 times higher than the ones determined when the reverse curve is parallel to the
forward curve. The difference seems to be independent from the type of steel and the
kind of equipment used, shear or tension-compression test.
Back stress from the 0.2% offset method.
As already stated, the back stress obtained by with the 0.2% offset method is focuses
more focused in the on early re-yielding or BE. It can be seen In Fig. 6a it can be
observed that the BE grows increases rapidly in all cases as the forward strain is
increased. At a strain of 2%, strain the increasing rate of increase of the BE seems to be
quite similar for all the analyzed steels, independently of the composition, grain size and
type of procedure used. From a strain of 5% forwards strain, although in all the cases
the BE maintains the its growing behavior in all cases, some differences can be
observed between in the different steels. In the case of the DP-steel tested under

11
11
tension-compression conditions the rate of increase tends to diminish as the strain
increases, and from a strain of 10% strain the BE remains constant. For the 316L
austenitic stainless steel there is also a clear decrease of in the rate of increase, and it
seems that the behavior at larger strains could be similar to DP-steel. In the case of
TWIP steels, although there is a drop in the rate of increase with respect to the rate at
low strains, the BE keeps growing as the deformation increases. Nevertheless, the total
amount of the BE is different depending on the type of TWIP steel analyzed. Thus, for
the two FeMnC TWIP steels, a large increase is observed and the BE values are above
250 MPa at a strain of 10% strain, whereas for the present FeMnCAl TWIP steel the
increment is smaller and at a strain of 10% strain the BE is around 150 MPa.
It is interesting to note that for FeMnC steels a constant growthincrease of the BE is
observed at larger strains up to 20-25%, and this trend coincides well with another study
of a Fe-22Mn-0.6C with results very close to the present ones [24]. Although there is no
data for FeMnCAl steel at these large strains, from the observation of the evolution of
the BE with strain in Fig.6a it is reasonable to think that the growing trend also appears
for this steel at large strains, but with lower values than for FeMnC steels.
Back stress from the permanent softening method.
The evolution of the back stress with pre-strain calculated by permanent softening is
shown in Fig. 6b. The back stress for the present Fe-17.5Mn-0.7C-2Al steel behaves
follows the same behavior way as the others steels studied, that is, i.e. an increase
during the first period of plastic strain and stabilization as the deformation proceeds. For
this Fe-17.5Mn-0.7C-2Al alloy the back stress is 19 ± 4 MPa at a strain of 2% strain, 32
± 4 MPa at 5% and the maximum value obtained is 40 MPa ± 4 at a strain of 10%
strain. Comparing with the DP-steel or with the Fe-22Mn-0.6C TWIP steel with coarse

12
12
grain, the values are close but slightly lower. However, with respect to the Fe-22Mn-
0.6C steel with a fine grain size of 3 µm [8] the back stress of the present steel is clearly
lower, being the difference being, at a strain of 10%, strain around 100 MPa.
As pointed out by Gutierrez et al. [7] the experimental values of σb obtained from the
permanent softening method and X-ray diffraction techniques are in better agreement,
and therefore more consistent, when the strain needed to become parallel (εrev) in the
reverse curve is of only around only the 50% of the previous forward strain (εfor). In the
case of reverse shear tests for the Fe-22Mn-0.6C TWIP steel, the ratio εrev/ εfor seems to
be clearly below 1 in any case [7,8]. In order to verify if the present calculations fulfill
this condition, the results of the calculations between forward and reverse stages in the
tension-compression tests for the present TWIP steel are listed in Table 2. The ratio
between εrev and εfor needed to get parallel curves is calculated for the three pre-strain
cases and it decreases as the amount of pre-strain increases, ranging from 1.6 for the a
pre-strain of 2% pre-strain to 0.52 to for a pre-strain of 10% pre-strain. This behavior is
similar to the case of the DP-steel, in which the ratio εrev/ εfor is nearly 2 for a strain of
2.1% strain, decreasing to 0.7 at a pre-strain of 6.8% pre-strain. In both cases, tension-
compression tests were used. The analysis of the evolution of εrev/εfor with pre-strain
shows that only in the case of a strain of at 2% the back stress from permanent softening
could be affected and the values obtained could be inaccurate. Consequently, this effect
could explain the difference between the back stress of the Fe-17.5Mn-0.7C-2Al steel at
a strain of 2% strain (19 MPa) and the low value for the Fe-22Mn-0.6C alloy, 5 MPa at
the most. For the rest of the pre-strains conditions, the obtained back stress values from
with the permanent softening method would be well estimated.
Finally it has to be mentioned that for the Al-added TWIP steel, the calculated
contribution of back stress to the total work hardening is less than the calculated value

13
13
reported for the other mentioned TWIP steels mentioned. For the Fe-17.5Mn-0.7C-2Al
steel this contribution is 8% at a pre-strain of 2% pre-strain and increases only to 10%
with pre-strains of the 5% and 10% pre-strains studied, whereas for Fe-22Mn-0.6C
steels it was slightly below 20% [7] and around 40% [8].
3.3.Evolution of dislocation and twin structure during a cycle with a pre-strain of
5% pre-strain cycle.
To analyse the evolution of the microstructure during cycles with a strain of the 5%
strain cycle, one sample was stopped at the end of the first tensile stage at a strain of 5%
strain (sample named T5), another one was stopped at the end of the compressive stage
at a strain of -5% strain (sample named T5C5), and one sample was studied at the end
of the complete cycle (sample named T5C5T5). The evolution of the microstructure was
first observed by EBSD, but since the twin thickness was smaller than 100 nm (as will
be reported in the TEM analysis), which is in the order of magnitude of the step size
used, the presence of mechanical twins by automated EBSD analysis hardly was hardly
noticeable detected. However, their presence was easier more easily observed in the
Kikuchi Pattern quality (KPQ) map. For this reason, the KPQ maps in the longitudinal
plane for the initial material and the stages T5, T5C5 and T5C5T5 are presented in Fig.
7. In all the images, the tensile direction (TD) coincides with the original longitudinal
hot rolling direction. In the as-received material (Fig.7a) the aspect ratio of the grain
taking into account the annealing twins is 2.18 ± 0.10, as a consequence of the rolling
process. Some annealing twins can be observed distributed homogeneously over the
grains.

14
14
After the first tensile stage, the aspect ratio of the grain increased to 2.39 ± 0.10 as a
result of tensile deformation, but in the KPQ for T5 sample (Fig.7b) mechanical twins
were hardly noticeable observed. The small presence of mechanical twins at low strains
has been reported before for different types of TWIP steel as, for instance, in the Fe-
22Mn-0-6C steel with a tensile strain of 5% tensile strain [25,26]. Moreover, as already
stated, the addition of Al is referred to decrease the rate of mechanical twinning in Fe-
22Mn-0.6C [12] so in the present Fe-17.5Mn-0.7C-2Al steel or in the Fe-22Mn-0.6C-
1.5Al alloy [15] this small slight presence of mechanical twins can be justified. At
increasing strains, see Figs. 7c and 7d, mechanical twins are readily apparent. Regarding
the dislocation structure observed by TEM (Fig.8a), no planar arrangement of
dislocations is noticed, although long dislocation lines can be observed in many grains.
However, these long segments of dislocations are prone to be entangled so the structure
seems to be closer to a dislocation forest. This structure is more similar to the one
described for fine-grained Fe-22Mn-0.6C steels with an average grain size around 3 µm
[26,27] than to the one of the Fe-22Mn-0.6C steel with an average grain size of 50 µm
[25], since no dislocation cells were detected after a tensile strain of 5% tensile strain.
Regarding the mechanical twins, following the evolution of the calculated twinning
fraction for a similar composition to the present Fe-17.5Mn-0.7C-2 Al steel, at a tensile
strain of 5% tensile strain a very small twinning fraction would be expected [13]. Fig.8b
shows one of the scant bundles of twins and it is worth noting the higher dislocation
density in the space between twins compared to the untwinned grain in Fig.8a. The
average twin thickness calculated from the small number of twinned grains is 40 ± 15
nm, whereas the average twin spacing is about 180 ± 50 nm.
The microstructure in Fig. 7c for the sample after the compressive stage (T5C5) shows
how the grains have been now compressed due to reverse straining in the former TD
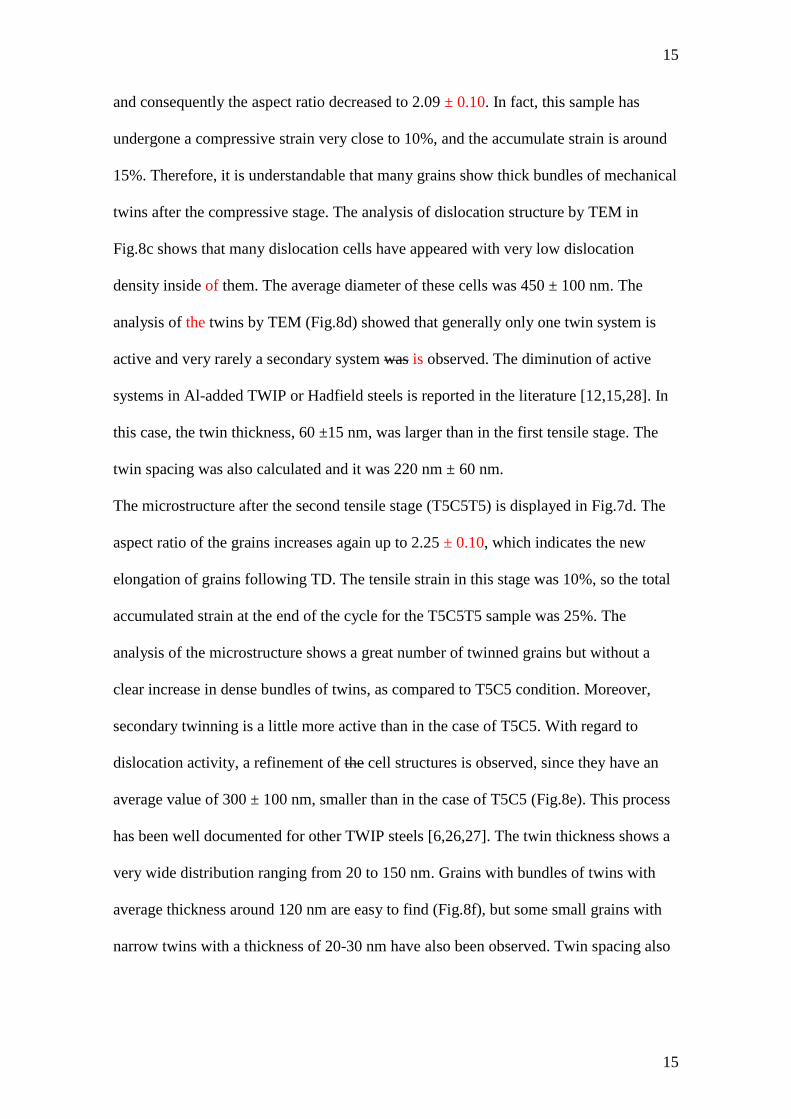
15
15
and consequently the aspect ratio decreased to 2.09 ± 0.10. In fact, this sample has
undergone a compressive strain very close to 10%, and the accumulate strain is around
15%. Therefore, it is understandable that many grains show thick bundles of mechanical
twins after the compressive stage. The analysis of dislocation structure by TEM in
Fig.8c shows that many dislocation cells have appeared with very low dislocation
density inside of them. The average diameter of these cells was 450 ± 100 nm. The
analysis of the twins by TEM (Fig.8d) showed that generally only one twin system is
active and very rarely a secondary system was is observed. The diminution of active
systems in Al-added TWIP or Hadfield steels is reported in the literature [12,15,28]. In
this case, the twin thickness, 60 ±15 nm, was larger than in the first tensile stage. The
twin spacing was also calculated and it was 220 nm ± 60 nm.
The microstructure after the second tensile stage (T5C5T5) is displayed in Fig.7d. The
aspect ratio of the grains increases again up to 2.25 ± 0.10, which indicates the new
elongation of grains following TD. The tensile strain in this stage was 10%, so the total
accumulated strain at the end of the cycle for the T5C5T5 sample was 25%. The
analysis of the microstructure shows a great number of twinned grains but without a
clear increase in dense bundles of twins, as compared to T5C5 condition. Moreover,
secondary twinning is a little more active than in the case of T5C5. With regard to
dislocation activity, a refinement of the cell structures is observed, since they have an
average value of 300 ± 100 nm, smaller than in the case of T5C5 (Fig.8e). This process
has been well documented for other TWIP steels [6,26,27]. The twin thickness shows a
very wide distribution ranging from 20 to 150 nm. Grains with bundles of twins with
average thickness around 120 nm are easy to find (Fig.8f), but some small grains with
narrow twins with a thickness of 20-30 nm have also been observed. Twin spacing also

16
16
depends on the type of bundle, being 300 nm for the thicker twins and around 100 nm
for the narrow ones.
3.4.Texture evolution during a cycle with a pre-strain of 5% prestrain cycle.
Fig. 9 shows the evolution of texture represented by the Orientation Distribution
Function (ODF) at φ2=45º section in the Euler space and the inverse pole figure (IPF)
along the tensile direction (TD) for the initial material and the final steps of every the
cycle with a strain of 5% strain cycle. The initial texture of the as-received material is
displayed in Fig. 9a; and it can be seen it shows the presence of Brass 110<112> and
Goss 110<001> texture components, although the latter with a weak signal. These
orientations are commonly associated with hot rolled fcc metals [29]. On the other hand,
the presence of the cube component 001<100> must be noted, which can may be
related to the compressive behavior in the center of the sheet during hot rolling [30].
These components are reflected in the IPF, since the poles <111> and <001> are the
strongest components.
After the first tensile stage up to a strain of 5% strain (T5), there is an increase of the
signal for rotated Brass 110<111> and Goss orientations, both of them typical texture
components during tensile deformation of TWIP steels [12,31]. At the same time, is
also clearly visible the cube texture component is also clearly visible. The presence of
these orientations is reflected in the increase of the intensity in the poles <111> and
<100> poles of the IPF, which has also been described for other TWIP steels deformed
by tensile tests [13,25].
When the samples are deformed in compression to a strain of -5% strain, some changes
are observed in the φ2=45º ODF section in fig.9c. There is a clear increase of cube
component 001<100>component, with a maximum orientation density of 3.15 and
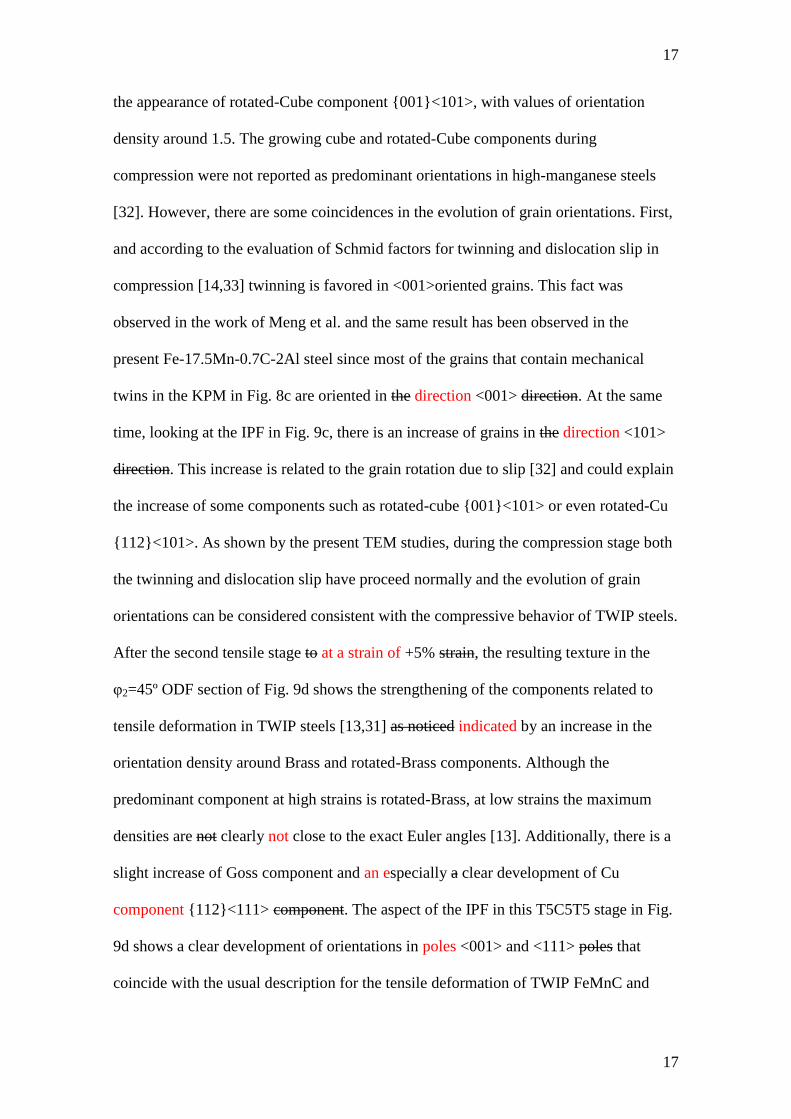
17
17
the appearance of rotated-Cube component 001<101>, with values of orientation
density around 1.5. The growing cube and rotated-Cube components during
compression were not reported as predominant orientations in high-manganese steels
[32]. However, there are some coincidences in the evolution of grain orientations. First,
and according to the evaluation of Schmid factors for twinning and dislocation slip in
compression [14,33] twinning is favored in <001>oriented grains. This fact was
observed in the work of Meng et al. and the same result has been observed in the
present Fe-17.5Mn-0.7C-2Al steel since most of the grains that contain mechanical
twins in the KPM in Fig. 8c are oriented in the direction <001> direction. At the same
time, looking at the IPF in Fig. 9c, there is an increase of grains in the direction <101>
direction. This increase is related to the grain rotation due to slip [32] and could explain
the increase of some components such as rotated-cube 001<101> or even rotated-Cu
112<101>. As shown by the present TEM studies, during the compression stage both
the twinning and dislocation slip have proceed normally and the evolution of grain
orientations can be considered consistent with the compressive behavior of TWIP steels.
After the second tensile stage to at a strain of +5% strain, the resulting texture in the
φ2=45º ODF section of Fig. 9d shows the strengthening of the components related to
tensile deformation in TWIP steels [13,31] as noticed indicated by an increase in the
orientation density around Brass and rotated-Brass components. Although the
predominant component at high strains is rotated-Brass, at low strains the maximum
densities are not clearly not close to the exact Euler angles [13]. Additionally, there is a
slight increase of Goss component and an especially a clear development of Cu
component 112<111> component. The aspect of the IPF in this T5C5T5 stage in Fig.
9d shows a clear development of orientations in poles <001> and <111> poles that
coincide with the usual description for the tensile deformation of TWIP FeMnC and

18
18
FeMnCAl steels [13,25]. However, in this case the fiber <111> fiber appears with an
intensity lower intensity than <001>, the opposite to the usual as opposed to what is
usually observed observation in TWIP steels [13,25,31]. The reasons for this behavior
may be several There may be several reasons for this behavior: on the one hand, a 10%
tensile deformation can be considered low to develop for developing a well-defined
texture comparing with other studies in which the strain was at least over 20%
[13,25,31], particularly in this case, in which in addition, there are changes in the
deformation path. On the other hand, although cube component 001<100> has been
observed in the tensile texture of FeMnC TWIP steels [31], its intensity in the present
case is higher than expected and it can be related to its strong presence in the initial
texture (Fig. 9a).
4. Discussion.
Following the same procedure used in the above section above, it is necessary to
separate divide the discussion on the back stress in two parts: the first one firstly,
concerning the early re-yielding during the reverse stress, i.e. what it is here is defined
as the Bauschinger effect (BE), and the second part secondly, considering taking into
consideration the difference between forward and reverse stresses when both curves
become parallel, when permanent softening (PS) is noticed.
Bauschinger effect.
Looking at the evolution of the BE with pre-strain in Fig. 6a, it is clear that at low
strains, the BE is quite similar for all the materials studied, including a Fe-24Mn-3Al-

19
19
2Si-0.06C TWIP steel in which only the BE at a pre-strain of 1% pre-strain by using
the 0.2% offset method has been determined [20]. At a pre-strain of 2% pre-strain, the
most common feature is that the BE increases rapidly for all the materials studied. At
these low strains, a very limited effect of twinning is expected in TWIP steels due to the
small number of twinned grains detected in the present steel and others TWIP steels
[25,27,34]. Under these conditions, as pointed out by Saleh et al. [20], there must be
other contributions to the back stress of TWIP steels at these low strains. In this point is
interesting to revisit some results of 316L and 317 austenitic steels that do not twin
[21,35]. It In has been reported in that in the case of these steels that planar slip is
favored during the early stages of deformation. The generated dislocations move under
the applied stress and dislocations are created and pushed causing many pile-ups and
stacking faults [36]. Under load reversal conditions some of the dislocations can go
move back causing a source of back stress [21,35,36] for 316L austenitic steel, as
shown in Fig.6b for the 316L austenitic steel. It is interesting to note that stacking faults
also interact with dislocations and this have been considered as another source of back
stresses [20,35].
When the pre-strain attains to 5%, the differences between the different various
materials start to increase grow. The differences in the amount and rate of increase of
the BE with strain must be related to the strengthening mechanisms acting in every
particular case
Firstly, there is a Dual-Phase steel in which the microstructure consists of hard
martensite (12%) and a soft ferrite matrix [17]. Although DP-steels have shown fairly
good strength and ductility, the strengthening mechanism is different from that of TWIP
steels. In the absence of twinning and precipitates in the ferrite matrix, the slip of
dislocations and their storage by intersections is the main hardening mechanism, helped

20
20
by the presence of hard martensite plates. In bcc metals, the dislocations generated in
the early stages of deformation tend to be stored in high density dislocation walls
forming cell boundaries [37]. After a certain amount of monotonic deformation, it is
accepted that these dislocation structures evolve towards steady-state configurations.
Once the cell structure is formed, the polarization reaches a maximum and further strain
can refine a little bit the cell diameters slightly but, in essence, the back stresses
generated remain constant. This depletion in the source of back stress with strain in DP-
steels is clearly shown clearly in Fig. 6a since from a strain of 10% strain the BE values
remain constant, although some isotropic hardening is still present at these strains levels
[17].
A similar situation can be found observed in the case of 316L austenitic steel. After the
first stage of deformation (≈1.5%), a transition from planar slip to wavy slip has been
described; and it has also been observed that the number of grains presenting different
dislocation interactions due to cross-slip increases [36]. Therefore, as in the case of DP-
steels, at larger strains the hardening tends to be isotropic, which causes a clear
diminution of the back stress rate of increase rate of back stress. This effect can be
observed in Fig. 6a since from a strain of 2% to 5% strain the back stress for 316L steel
shows a very small increase.
Compared to DP and 316L steels, TWIP steels show no signs of reduction in the rate of
increase of the BE at the pre-strains analyzed in Fig. 6a. This continuous increase of the
BE has been related to the interaction of the twin lamellae with dislocations. This
mechanism has been defined as a strong source of back stresses in TWIP steels and acts
over larger strain periods [7,8,10,25,27].
In particular, models for the increment of back-stress [8,10], make it possible to link the
kinematic hardening created by the accumulation of dislocations in the matrix at twin

21
21
boundaries with the twins volume fraction and thickness. Accordingly, an equation for
the back stress (σb) used by Bouaziz et al. and proposed by [38] is used here:
nL
bMb
· (2)
where M is the average Taylor factor, µ is the shear modulus, b is the burgers vector, n
the number of dislocations stopped at the boundary and L the mean intercept length. In
turn, the dependence of L with strain can be expressed by the following relation:
v
v
f
ftL
12 (3)
where t is the twin thickness and fv is the twin volume fraction.
The continuous increase of the BE for TWIP steels up to 20% strain observed in Fig. 6a
can be explained by Eqs.(2) and (3). It has been shown that twinning in TWIP steels can
be active for larger strains up to 0.50 [14,25]. Therefore, fv is expected to grow
continuously during all this period giving smaller values of L. Moreover, as TWIP steels
are deformed, there is an increase of the dislocation density that enhances the
interactions between dislocations and twin boundaries, rendering a continuous increase
of n in Eq. (2). Both contributions promote an increase in σb. This increase in
dislocation activity around twin boundaries can be observed in the TEM micrographs
for the material strained to 5% (T5). In the grains with no twinning activity (Fig. 8a),
long dislocations lines are observed, whereas in the grains with twin bundles (Fig. 8b)
the dislocation lines are shorter and the intersections more frequent.
Firstly, it must be discussed the validity of this mechanism in TWIP steels at low strains
due to the low twinning activity must be discussed. There is some variability between
different works in the literature about the twinning activity at a pre-strain of 5% pre-
train in TWIP steels. In some cases, it has been found that the number of grains with
mechanical twins is moderate, with a fv≈0.05 [31]. In addition, the presence of twinning

22
22
activity has a clear influence in the work hardening rate since it starts to increase at
these low strains [31]. In other cases, the fv at this pre-strain is smaller, and the twinned
grains are more difficult to be seen [12,15,25,34]. Consequently, the typical increase of
the work hardening rate due to twinning activity is not observed, although in some cases
the hardening rate is already almost constant [25]. In this situation, at a pre-strain of 5%
pre-strain it is reasonable to think that although twinning has a growing role in the
overall mechanical response of TWIP steels and its influence in the development of
back stress is large, other sources of back stress could still play a significant role.
As mentioned above, stacking faults can act as a source of back stress. Here it is
interesting to note that at low strains, the presence of overlapped stacking faults has
been described in FeMnC steels and other fcc metals [39]. In addition, they have been
considered as a previous step in twin formation [39-41]. This suggests that a significant
presence of stacking faults is feasible and consequently some contribution of from them
to the overall back stress on TWIP steels at a pre-strain of 5% pre-strain could be
expected.
In the case of a pre-strain of 10% pre-strain, it can be considered that the effect of
twinning activity on the mechanical behavior of TWIP steels is even more important.
This strain marks approximately marks the beginning of the high work hardening stage
and the fraction of primary twinned grains is between 20 and 30% [12,15,25,34]. In
addition, in FeMnC TWIP steels there is a clear increase of the secondary twinned
grains [15,34]. In this scenario, twinning activity is affecting affects the overall behavior
of the material and the interaction of twin lamellae with dislocations can be considered
as the main source of back stress in TWIP steels. Therefore, it might be concluded that
the mechanism for the increment of the back stress proposed above could be applied
from this strain for the TWIP steels studied here.

23
23
Secondly, although this mechanism can be applied to all the TWIP steels in Fig. 6a,
there are marked differences in the total amount of the BE between the Fe-22Mn-0.6C
steels and the Fe-17.5Mn-0.7C-2Al steel presented here. At 5% and 10% strain, the BE
of Fe-22Mn-0.6C steels is nearly twice the value of the Fe-17.5Mn-0.7C-2Al steel. Here
it is important to point out that the forward stress (σfor) at pre-strains of 5% and 10%
pre-strains are quite similar for the three steels, around 600 MPa and 700 MPa
respectively. It means that the contribution of back stress to the total stress in the case of
Fe-22Mn-0.6C steels doubles the one of the Fe-17.5Mn-0.7C-2Al steel. While in Fe-
22Mn-0.6C steels the contribution of BE is slightly less than half the total stress
[7,8,10], for the present TWIP steel this value is around 20%. This effect can be
attributed to the role played by aluminum in TWIP steels.
As pointed out in the work by Jin et al. [12], the presence of aluminum hinders the
precipitation of (Mn,Fe)C in the Fe-18Mn-0.6C steel and decreases the activity of C
atoms in the austenite matrix, weakening the pinning force of these atoms on mobile
dislocations. The latter effect leads to a reduction in the Dynamic Strain Aging (DSA)
phenomenon [42], which is reflected in the delay and the diminution in the step height
of the serrations in the tensile curve of Al-added TWIP steels [13]. Moreover, the
addition of aluminum to FeMnC TWIP steels increases the Stacking Fault Energy
(SFE), which promotes a decrease in the activity of mechanical twinning and a certain
increase of the dynamic recovery effect [43]. The extent of the decrease in primary
mechanical twinning varies depending on the authors, but in the case of secondary
mechanical twinning a large reduction has been reported [12,15,28]. This decrease in
the activity of mechanical twinning and the increase in dynamic recovery means that the
strain hardening of FeMnCAl TWIP steels is clearly lower than the one for FeMnC
TWIP steels of similar composition [14,15,43] and similar grain size [27].

24
24
This decrease of twinning activity for Al-added TWIP steels can then be related to the
lower values of the BE as derived from Eqs. (2) and (3). According to several works
[12,14,15], the value of fv for the present Fe-17.5Mn-0.7C-2Al steel would be lower
than for the Fe-22Mn-0.6C steel. Concerning the twin thickness t, the average value
observed in the present samples at a tensile strain of 5% tensile strain (T5) was 40 ± 15
nm, which can be considered slightly low and mainly influenced by the fine grain size
[25]. In FeMnCAl TWIP steels tested at similar strain rate and with a grain size of 40
µm, a wide range of average twin thickness has been reported, from 15 nm to 120 nm
[15,16]. For the Fe-22Mn-0.6C TWIP steels tested at similar strain rates, lower values
of t, between 10 and 40 nm, were reported in the case of a when studying fine-grained
materials [26], whereas the t average values were 17 ± 5 and 16 ± 8 nm when
considering coarse grained (40 µm) materials were considered [15,16]. These results
might suggest that the twin thickness in the present FeMnCAl steel can be larger than in
the case of the fine-grained Fe-22Mn-0.6C steel studied by Bouaziz et al. [8] and
similar to the coarse-grained Fe-22Mn-0.6C Steel studied by Gutierrez et al. [7], since
they estimated twin thicknesses between 30 and 60 nm. Therefore, it can be concluded
that in Eq. (3) the mean intercept length L for the present FeMnCAl TWIP steel should
be larger than for the FeMnC TWIP steels.
In the Eq. (2), apart from L, the term n accounts for the dislocations stopped at the grain
and twin boundaries. As it has been shown in Fig. 8a, there is a big difference in the
dislocation density between the twinned and untwinned grains, since in the former ones
there are a great number of dislocations which are trapped in the twin spacing. At the
strains levels studied here, little twinning activity is generally reported, although it is not
null, and, in some cases, at low strains (i.e., 2%) a direct effect of twinning has been
related to an increase of the strain hardening [15,25,26]. Again, as exposed before,

25
25
FeMnCAl TWIP steels tend to generate less number of twinned grains than FeMnC
TWIP steels [12,15,28], so it is expected that n should be lower for the present
FeMnCAl steel than for the FeMnC steels.
Therefore, Eq. (2) can offer a reasonable explanation for the lower values of the BE
observed in the present Fe-17.5Mn-0.6C-1.5Al steel, as compared with the Fe-22Mn-
0.6C steel, mainly based in the slower rate of mechanical twins in the Al-added TWIP
steels.
Permanent softening
It must be borne in mind that the back stress is measured by Eq. (1), but at strains in
which the forward and reverse curves are nearly parallel,; which this means that the
back stress is measured after the “transient hardening” period in during which most of
the dislocations initially piled-up in twin boundaries and grain boundaries have moved
backward. Moreover, as the strain increases in the reverse direction the combination of
dislocation activity and twinning activity hardens the material.
Before analyzing the differences between the different materials, the fact that very
similar strain hardening behavior is observed during the tensile and compression periods
in Fig. 5, should be mentioned. It should be noted that the same behavior was observed
in other cyclic tests of on TWIP steel [7,8]. The study of the microstructure after the
compression period in the 5% cyclic test (T5C5 samples) shows that there is an
evolution in dislocation and twinning activity. On the one hand, the dislocations tend to
create a cell structure (Fig. 8c), which has been also observed in Fe-22Mn-0.6 C steels
[6,25]. On the other hand, as observed in Fig.7c there is a clear increase of the amount
of grains in which bundles of mechanical twins are observed. Although it has been
shown that in cyclic tests with low strain amplitude (up to 1%) twinning has limited

26
26
activity in the compression half of the deformation cycles [6,20],; in the present case for
the 5% deformation cycle of 5% the strain in the compression half is 10%, which seems
to be large enough to promote twinning activity. At the same time, the compression
strain intervals studied here do not seem to be large enough to observe the decrease of
twinning activity that is associated to the rotation of most of the twinned grains from
orientations <100> orientations to <110> as the compressive strain increases. This
decrease in twinning activity would lead to a decrease in strain hardening [32].
Therefore, the evolution of the dislocation and twinning activity the compressive strain
periods studied in this work seems to be similar to the tensile ones and, consequently, a
similar strain hardening behavior could be expected. Therefore, after “transient
hardening” period, no microstructural changes that could lead to significant differences
in the strain hardening between tensile and compressive periods have been found.
With regard to the back stress values obtained by permanent softening for the different
type of steels, it seems that, in general, the increase growth stops at large strains. This
was more or less expected for the DP-steel since the same situation was found in
analyzing the BE, due to the dislocations slip and creation of dislocations cells. In the
case of TWIP steels, the values for the present Al-added TWIP steel are slightly lower
than the ones for the Fe-22Mn-0.6C steel with a large grain size [7,25]; and both are
more or less half of the fine grain size Fe-22Mn-0.6C steel [8]. It must be taken into
account that the contribution of back stress to the total stress in the Al-added TWIP steel
is around 10-12%, whereas for the large grain-sized FeMnC steel it is around 18% and
near 40% for the low grain-sized FeMnC. The lower twinning activity in the Al-added
TWIP steel could again explain, by using Eqs. (2) and (3), the relative low values of
back stress for this steel with respect to regards FeMnC TWIP steels.

27
27
In order to understand the reason for the permanent softening during reverse stage in the
present FeMnCAl steel, one factor that could play a role would be the twin thickness t,
since in the compressive stage this parameter appeared to be slightly higher than for the
first tensile stage, 60 ± 15 nm and 40 ± 15 nm, respectively. At the same time, twin
spacing has grown a little, i.e. from 180 ± 50 nm to 220 ± 60 nm. According to Eq. (3),
The the increase of t would lead to a larger L according to Eq. (3). In addition, this
bigger twin spacing could be related to a smaller increase of the amount of dislocations
stopped at twin boundaries, which would mean lower values of n. As a consequence,
smaller values of back stress would be expected. Therefore, the increase of twin
thickness and twin spacing would be the two microstructural features that might explain
the decrease of the flow stress during the compressive stage for the present Al-added
TWIP steel.
5. Conclusions.
The FeMnCAl TWIP steel studied shows a continuous increase of the back stress during
reverse loading in the compression stage as the pre-strain is increased up to 10%. This
trend coincides with the behavior of some FeMnC TWIP steels reported in literature and
is consistent with existing hardening models for TWIP steels. When the back stress is
analyzed by using the 0.2% offset method and related to the Bauschinger effect, the
value of the back stress for the FeMnCAl TWIP steel and its contribution to the total
hardening is half the one reported for FeMnC TWIP steels. This behavior can be related
to the decrease of mechanical twinning activity in Al-added FeMnC TWIP steels, since
it has been reported that the primary source of polarized internal stresses in these steels
consists on the dislocations pinned in the matrix by twin boundaries.

28
28
When the back stress is analyzed by permanent softening measurements, the values are
in all cases much smaller than in the case of the Bauschinger effect. The FeMnCAl steel
shows again lower values than FeMnC steels, which can be once more be related to the
lower twinning activity of FeMnCAl steels.
For the present FeMnCAl steel the strain hardening in tensile and compressive stages is
very similar. At the strains studied there are no major differences between both stages in
the evolution of mechanical twinning and dislocation structure, except for the twin
thickness and twin spacing, which appeared slightly larger in the compressive stage. It
has been found that the twin thickness and twin spacing appeared slightly larger in the
compressive stage. Since the increase of both parameters is related to a diminution of
the kinematic hardening, they could explain the differences between the tensile and
compressive strengths after the transient hardening period for the FeMnCAl TWIP steel.
ACKNOWLEDGMENTS
The authors would like to thank the Spanish Ministerio de Economia y Competitividad
(project ref. MAT2014-59419-C3-1-R) and the Agència de Gestió d’Ajuts Universitaris
i de Recerca de la Generalitat de Catalunya (project 2010 CONE3 42) for the economic
support and Posco (South Korea) for supplying the studied steel studied.

29
29
REFERENCES
[1] Eggertsen P.A. and Mattiason K., Inter. J. of Mech. Sci. 51 (2009) 547-563.
[2] Yoshida F. and Uemori T. Inter. J. of Mech. Sci. 45 (2003) 1687-1702.
[3] Geng L. and Wagoner R.H., SAE paper No. 2000-01-0768 (2000), SAE, Inc.
[4] Bouvier S., Haddadi H., Levée P.and Teodosiu C. 172 (2006) 96.
[5] Boger, R. K., Wagoner, R.H., Barlat, F., Lee, M.G. and Chung, K. Inter. J. of Plas.
21 (2005) 2319-2343.
[6] Lambers, H.-G. Rüsing C.J., Niendorf, T., Geissler D, Freudenberger, J and Maier
H.J., Int. J, of Fatigue 40. (2012). 51-60.
[7] Gutierrez-Urrutia I., Del valle J.A., Zaefferer S. And Raabe D. J. of Mat. Sci. 45
(2010) 6604-6610.
[8] Bouaziz O, Allain S and Scott C., Scripta Mater. 58 (2008) 484-487.
[9] Karaman I., Sehitoglu H., Chumlyakov Y.I., Maier H.J and Kireeva IV. Metall
Mater Trans A 32 (2001) 695.
[10] Gil Sevillano J. Scripta Mater. 60 (2009) 336-339.
[11] Bouaziz O., Allain. S, Scott C.P. Cugy P and Barbier D. Curr. Opin. In Sol. State
and Mat. Sci. 15 (2011) 141-168.
[12] Jin J-E. And Y-K. Lee. Acta Mater. 60 (2012) 1680-1688.
[13] De Cooman B.C., Kim J. and Lee S., Scripta Mater. 66 (2012) 986-991.
[14] Lee Y-K., Scripta Mater 66 (2012) 1002-1006.
[15] Yang H. K., Zhang Z. J. and Zhang Z. F. Scripta Mater 68 (2013) 992-995.
[16] Yang H. K., Zhang Z. J., Dong F. Y., Duan Q. Q. and Zhang Z. F. Mat. Sci. and
Eng. A607 (2014) 551-558.
[17] Lee M-G., Kim D., Kim C., Wenner M.L., Wagoner R.H. and Chung K. Inter. J of
Plast. 21 (2005) 883-914.

30
30
[18] Jin J-E and Y-K. Lee. Mater.Sci and Eng A, 527 (2009) 157.
[19] Ahn H., Yoo D., Seo M.H. Park S-H and Chung K., Met. Mater. Int., 15 (2009)
637-647.
[20] Saleh A.A., Pereloma E.V., Clause B., Brown D.W., Tomé C.N. and Gazedr A.A.
Acta Mater. 61 (2013) 5247-5262.
[21] Choteau M., Quaegebeur P and Degallaix S. Mech. of Mater. 37 (2005) 1143-1152.
[22] Kubawara T, Morita Y, Miyashita Y and Takahashi S. Proceedings in the Int. J. of
Plas. 233-236 (2003) 287-292.
[23] Choi J. S., Lee J. W., Kim J-H., Barlat. F, Lee M.G. and Kim. D. Int. J. of Mech.
Sci. 98 (2015) 144-156.
[24] Gil Sevillano J. and De las Cuevas F. Scripta Mater. 66 (2012) 978-981.
[25] Gutierrez-Urrutia I. And Raabe D., Acta Mater. 59 (2011) 6449-6462.
[26] Barbier D., Gey N., Allain S., Bozzolo N and Humbert M. Mater. Sci and Eng A.
500 (2009) 196-206.
[27] Gutierrez-Urrutia I. And Raabe D., Scripta Mater. 66 (2012) 992-996.
[28] Canadinc D., Sehitoglu H., Maier H.J. and Chumlyakov Y.I., Acta Mater. 53
(2005) 1831.
[29] Raabe D. Steel Res. 74 (2003) 327-337.
[30] Su Y., Li Lin.and Fu R. J. of Iron ans Steel Res. Inter. 20 (2013) 46-53.
[31] Barbier D., Favier V. And Bolle B. Mater. Sci and Eng A. 540 (2012) 212-225.
[32] Meng L., Yang P., Xie Q., Ding h. And Tang Z., Scripta Mater 56 (2007) 931-934.
[33] Ueji R., Tsuchida N., Terada D., Tsiju N and Tanaka Y. et al. Scripta Mater. 59
(2008) 963.
[34] Renard K. and Jacques P.J. Mater. Sci and Eng A, 542 (2012) 8-14.

31
31
[35] Wollmershauser J. A., Clausen B. and Agnew S.R. Int J. of Fatigue, 36 (2012) 181-
193.
[36] Feaugas X. Acta Mater. 47 (1999) 3617-3632.
[37] Peeters B., Kalidindi S.R., Van Houtte P. And Aernoudt E. Acta Mater. 48 (2000)
2123-2133.
[38] Estrin Y. And Mecking H. Acta Metall. 32 (1984) 57.
[39] Idrissi H., Renard K, Ryelandt L., Schryvers D. and Jacques P.J. Acta Mater. 58
(2010) 2464-2476.
[40] Xu Z., Li N., Jiang H and Liu L. Mater. Sci and Eng. A. 621 (2015) 272-276.
[41] Liao X.Z. Zhao Y. H. Srinivasan S.G., Zhou F., Zhu Y.T., Valiev R.Z. and
Gunderov D.V. Appl. Phys. Lett. 100 (2004) 592-594.
[42] Chen L., Kim H.S., Kim S.K. and De Cooman B. C., ISIJ Inter.47 (2007) 1804.
[43] Rohatgi A., Vecchio K. S. and Grey G. T. Met. and Mater. Trans. A. 32 (2001)
135-168.

32
32
LIST OF CAPTIONS.
Figure 1. Dimensions of the samples used for cyclic tests in mm.
Figure 2. Assembly of the anti-buckling device and the video-extensomenter for the
cyclic test of sheet samples.
Figure 3. Tensile stress-strain curve for the Fe-17Mn-0.7C-2Al TWIP steel together
with the fitting curve using Swift’s hardening law. The strain hardening evolution with
strain is also displayed.
Figure 4. Cyclic tests al different pre-strains together with the original tensile curve for
the Fe-17Mn-0.7C-2Al TWIP steel
Figure 5. Forward and reverse curves for the three pre-strains tested. Reverse curves are
plotting with positive stress values for better comparison.
Figure 6. Evolution of back stress with strain in reverse tests. A) Bauschinger effect
(BE): Values extracted with the 0.2% offset method. B) Permanent Softening (PS):
Values obtained from the point in which forward and reverse curves become parallel.
Figure 7. Evolution of the microstructure of Fe-17Mn-0.7C-2Al TWIP steel during the
cyclic test at 5% pre-strain. Image Quality maps obtained by EBSD. A) Initial material;
B) First tensile stage at 5% strain (T5); C) Compressive stage at -5% strain (T5C5); D)
Second tensile stage at 5% strain (T5C5T5). TD: Tensile direction.
Figure 8. TEM micrographs showing the evolution of dislocation structure and
mechanical twins for the cyclic test at 5% pre-strain. A and B) After first tensile stage at
5% strain (T5); C and D) After compressive stage at -5% strain (T5C5); E and F) After
the second tensile stage at 5% strain
Figure 9. ODF in φ2 = 45º sections and IPF for the as-received material and after
different strain levels. a) as-received material; b) after 5% tensile strain (T5) c) after

33
33
compressive stage to -5% strain (T5C5) and d) after second tensile stage at 5% strain
(T5C5T5).

34
34
Table 1
Chemical composition of the TWIP steel used in this study (in weight percent).
Material Mn C Si Al Ti Mo Fe
% 17,0 0,73 0,07 1,91 0,10 0,31 Bal.
Table 2.
Calculations of back stress by the permanent softening method. The contribution of σb
to hardening was calculated by σb/(σfor- σ0). σ0 = 390 ± 2 MPa
Pre-
strain
εrev εfor εrev/εfor σfor
(MPa)
σrev
(MPa)
σb (MPa) Contribution to
hardening (%)
0.02 0.032 0.02 1.6 623 585 19 0.08
0.05 0.045 0.05 0.9 725 660 32 0.10
0.10 0.052 0.10 0.52 860 780 40 0.09
Pre-
strain
εrev εfor εrev/εfor σfor
(MPa)
σrev
(MPa)
σb (MPa) Contribution to
hardening (%)
0.02 0.032 0.02 1.6 623 ± 2 585 ± 5 19 ± 4 8 ± 2
0.05 0.045 0.05 0.9 725 ± 2 660 ± 5 32 ± 4 10 ± 2
0.10 0.052 0.10 0.52 860 ± 2 780 ± 5 40 ± 4 9 ± 2

35
35
Fig.1. Dimensions of the samples used for cyclic tests in mm.

36
36
Fig. 2. Assembly of the anti-buckling device and the video-extensomenter for the cyclic
test of sheet samples.

37
37
0,0 0,1 0,2 0,3 0,4 0,5
0
200
400
600
800
1000
1200
1400
1600
ST
RA
IN H
AR
DE
NIN
G (d
/d) (M
Pa
)
Exp.
Fitting
O Strain Hardening
TR
UE
ST
RE
SS
(M
Pa
)
TRUE STRAIN (MPa)
= 2153( + 0.11)0.69
1000
2000
3000
4000
5000
Fig.3. Tensile stress-strain curve for the Fe-17Mn-0.7C-2Al TWIP steel together with
the fitting curve using Swift’s hardening law. The strain hardening evolution with strain
is also displayed.

38
38
-1000
-800
-600
-400
-200
0
200
400
600
800
1000
-6 -4 -2 +10+8+6+4
Tru
e s
tre
ss
True strain (%)
+2
Fig.4. Cyclic tests al different pre-strains together with the original tensile curve for the
Fe-17Mn-0.7C-2Al TWIP steel.

39
39
0
100
200
300
400
500
600
700
800
900
1000
1100
25
Tru
e s
tre
ss (
MP
a)
True strain (%)
5 10 15 20
Fig.5. Forward and reverse curves for the three pre-strains tested. Reverse curves are
plotting with positive stress values for better comparison.

40
40
0
100
200
300
400
0
50
100
150
B
5 10 15 20TRUE STRAIN (%)
20
FeMnC[8]
FeMnC[7]
FeMnCAl
DP-steel[17]
FeMnCAlSi[20]
316L[21]
b (
MP
a)
BE
PS
5 10 15
A
FeMnC[8]
FeMnC[7]
FeMnCAl
DP-steel[18]
b (
MP
a)
Fig.6. Evolution of back stress with strain in reverse tests. A) Bauschinger effect (BE):
Values extracted with the 0.2% offset method. B) Permanent Softening (PS): Values
obtained from the point in which forward and reverse curves become parallel.

41
41
0
100
200
300
400
0
50
100
150
B
5 10 15 20
TRUE STRAIN (%)
20
FeMnC[8]
FeMnC[7]
FeMnCAl
DP-steel[17]
FeMnCAlSi[20]
316L[21]
b (
MP
a)
BE
PS
5 10 15
A
FeMnC[8]
FeMnC[7]
FeMnCAl
DP-steel[18]
b (
MP
a)
Fig.6. Evolution of back stress with strain in reverse tests. A) Bauschinger effect (BE):
Values extracted with the 0.2% offset method. B) Permanent Softening (PS): Values
obtained from the point in which forward and reverse curves become parallel.

42
42
Fig.7. Evolution of the microstructure of Fe-17Mn-0.7C-2Al TWIP steel during the
cyclic test at 5% pre-strain. Image Quality maps obtained by EBSD with a step size of
0.1 µm. A) Initial material; B) First tensile stage at 5% strain (T5); C) Compressive
stage at -5% strain (T5C5); D) Second tensile stage at 5% strain (T5C5T5). TD: Tensile
direction.
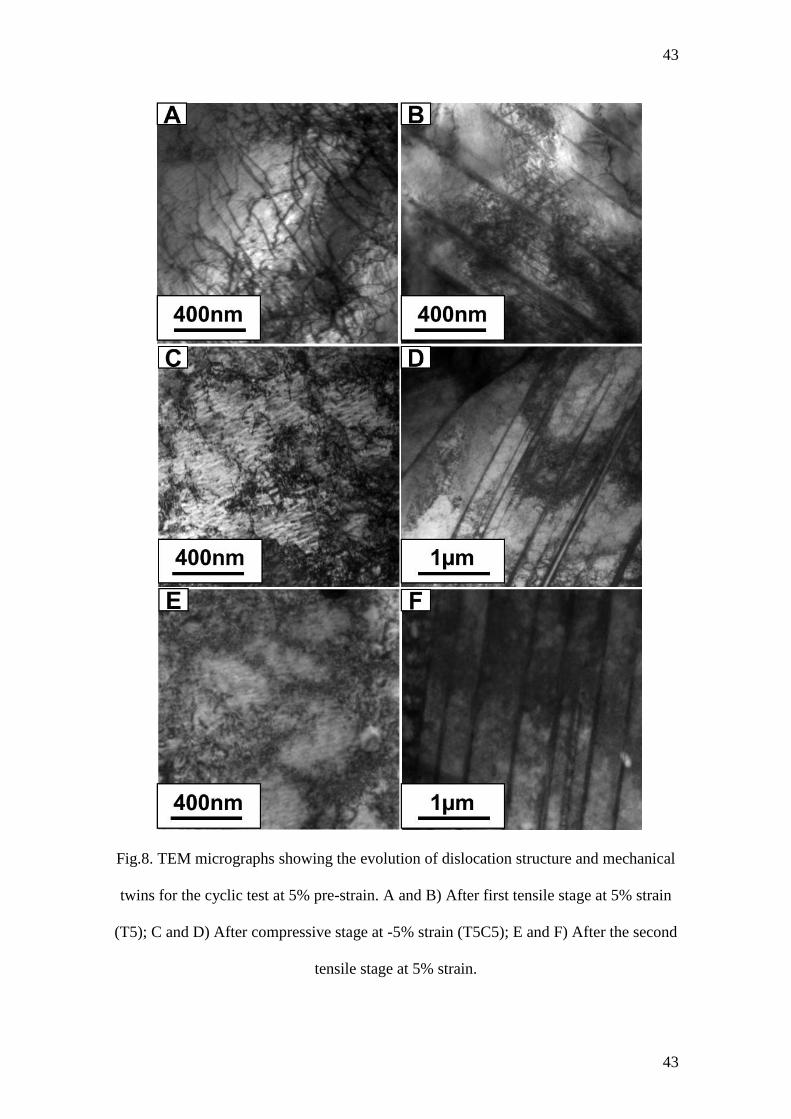
43
43
Fig.8. TEM micrographs showing the evolution of dislocation structure and mechanical
twins for the cyclic test at 5% pre-strain. A and B) After first tensile stage at 5% strain
(T5); C and D) After compressive stage at -5% strain (T5C5); E and F) After the second
tensile stage at 5% strain.

44
44
Fig.9. ODF in φ2 = 45º sections and IPF for the as-received material and after different
strain levels. a) as-received material; b) after 5% tensile strain (T5) c) after compressive
stage to -5% strain (T5C5) and d) after second tensile stage at 5% strain (T5C5T5).
Recommended