1
Elevated Expression of miR302-367 in Endothelial Cells Inhibits Developmental
Angiogenesis via CDC42/CCND1 Mediated Signaling Pathways
Jingjiang Pi1,8, Jie Liu1,8, Tao Zhuang1,8, Lin Zhang1, Huimin Sun1, Xiaoli Chen1, Qian Zhao1, Yashu Kuang1,
Sheng Peng1, Xiaohui Zhou1, Zuoren Yu1, Ting Tao2, Brian Tomlinson3, Paul Chan4, Ying Tian5, Huimin Fan1,
Zhongmin Liu1, Xiangjian Zheng6, Edward Morrisey7, YuZhen Zhang1,*
1 Key Laboratory of Arrhythmias of the Ministry of Education of China, Research Center for Translational
Medicine, Shanghai East Hospital, Tongji University School of Medicine, Shanghai, 200120, China. 2 Department of Geriatrics, Ruijin Hospital, Jiaotong University, School of Medicine, Shanghai, 200025, China. 3 Department of Medicine and Therapeutics, The Chinese University of Hong Kong, Hong Kong SAR, China 4 Division of Cardiology, Department of Internal Medicine, Wan Fang Hospital, Taipei Medical University,
Taipei, Taiwan 5 Department of Pharmacology, Center for Translational Medicine, Temple University School of Medicine,
Philadelphia, PA 19140, USA. 6 Lab of Cardiovascular Signaling, Centenary Institute, Camperdown, NSW 2050, Australia. 7 Department of Cell and Developmental Biology (R.W., E.E.M.), Department of Medicine (E.E.M.), Penn
Cardiovascular Institute (E.E.M.), and Penn Institute for Regenerative Medicine (E.E.M.), University of
Pennsylvania, Philadelphia, Pennsylvania 19104, USA.
8These authors contributed equally to this work
*Correspondence
Yuzhen Zhang, MD, PhD
Key Laboratory of Arrhythmias of the Ministry of Education of China
Research Center for Translational Medicine
Shanghai East Hospital, Tongji University School of Medicine,
150 Jimo Rd, Pudong New District, Shanghai, 200120, China
Tel:86-21-61569673, e-mail: [email protected]

2
List of Supplementary Materials:
Supplementary Methods
Supplementary Tables
Supplementary Table 1: Partial high throughput RNA sequencing results of lung endothelial cells from
miR302-367ECTg mutant comparing to littermate WT control mice.
Supplementary Table 2: Primers for qPCR, Ch-IP and Clone.
Supplementary Table 3: Antibodies for immunostaining, western blot and Co-IP.
Supplementary Figures
Supplementary Figure 1. MiR302-367ECTg mutant mice exhibit elevated expression of miR302-367 in retinal
ECs and reduced retinal angiogenesis via inhibition of cell proliferation.
Supplementary Figure 2. MiR302-367SMCTg mutant mice exhibit no significant change of hindbrain
developmental angiogenesis in vivo.
Supplementary Figure 3. Elevated miR302-367 expression HUVECs reduces the cell motility via observation
of cellular actin dynamic changes under live cell station.
Supplementary Figure 4. Endothelial cells from hindbrain of miR302-367ECTg mutant mice display reduced
Ccnd1 and Cdc42 expression but not significantly alters the cleaved caspase-3 expression.
Supplementary Figure 5. Constitutive active CDC42 reverses the reduced cell migration and tube formation
when miR302-367 expression was elevated in HUVECs under normal and hypoxia condition.
Supplementary Figure 6. MiR302-367 direct target genes CCND1 and CDC42 reverse the miR302-367-
mediated reduced cell proliferation.
Supplementary Figure 7. GRB2 promoter sequence analysis.
Supplementary Figure 8. The sequence of mouse and human immature stem-loop and mature miR302a-d and
validation of the mechanisms of Target Site Blockers for the pathways miR302 effects on.
Supplementary Figure 9. Target Site Blockers confirm the important role of miR302-Cdc42/Ccnd1 pathway
in EC migration and proliferation.
Supplementary video 1: Dynamic cell motility change of HUVECs with elevated miR302-367 expression
comparing to the lentiviral-GFP control.
Supplementary Methods
3
Vascular endothelial cell specific miR302-367 gain-of-function mouse models
Generation of vascular endothelial cell specific miR302-367 gain-of-function mouse R26R-miR302-
367Tg/+:Cdh5(PAC)-CreERT2 (miR302-367ECTg) was obtained by crossing a conditional gain-of-function R26R-
miR302-367Tg/+mouse line with VE-cadherin (Cdh5) promoter-driven Cre recombinase expression line(1).
Elevated expression of miRNA320-367 in HUVECs via Lentiviral gene transfer
Human umbilical vein endothelial cells (HUVECs, PromoCell) were cultured in endothelial cell growth
medium 2 (EGM2, PromoCell). At confluence, cells were harvested by 0.05% trypsin and 0.02% EDTA and
subcultured, medium was changed every other day. HUVECs within 8th passage were used, 85–95% confluence
for experiments.
Elevated expression of miR302-367 in HUVECs was achieved by lentiviral infection. Lentiviral miR302-
367 or control vectors were packaged in human embryonic kidney (HEK) 293T cells (American Type Culture
Collection, ATCC, CRL-1573) with X-tremeGENE9 (Roche) of 10 µg miR302-367 or control lentiviral vectors,
and package vectors 5 µg psPAX2 and 5 µg pMD2.G (Addgene plasmid 12259). Viral supernatant was collected
at 48 hours following transfection, concentrated and applied to HUVECs for infection.
Angiogenesis in vitro: fibrin gel bead assay and tube formation assay
Two in vitro angiogenesis assays were used to observe the effect of elevated miR320-367 expression in
HUVECs. For the fibrin gel bead assay(2), HUVECs with elevated expression of miR320-367 or control
lentiviral vector were mixed with Cytodex3 microbeads (Amersham Pharmacia Biotech) at a concentration of
400 HUVECs per bead in EGM-2 (Clonetics) overnight. Cell-coated beads were washed and re-suspended in
fibrinogen (Sigma, 2.5 mg/ml), aprotinin (Sigma, 0.15 units/ml) and thrombin (Sigma, 0.625 units/ml) and
allowed to clot in 24-well tissue culture plates. A feeder layer of fibroblasts was seeded on top of the fibrin gel
and the medium was changed every other day. The number of sprouts, branched sprouts and scattered cells was
counted for quantification. In the tube formation assay(3), lentivirus-infected HUVECs were seeded on
Matrigel-coated 96-well plates and incubated for 4 hr. Tube formation was quantified by counting the number
of branch points and calculating the total tube length in six randomly chosen fields from each well.
Cell migration assay
Boyden chamber and scratch wound healing assay was used to quantify cell migration. In boyden chamber
assay, ECs were placed on the upper layer of a cell permeable membrane and culture medium EGM2 containing
VEGF (1 ng/µl) below the cell permeable membrane of the transwell (Falcon 353097). Following 4 hours
incubation, the cells that have migrated through the membrane were stained by crystal violet staining solution
and counted. In scratch wound healing assay, equal numbers of ECs were plated in 6-well tissue culture plate to
achieve 90% confluence. A vertical wound was created by a 0.1 µl pipette tip. The cells were cultured with FBS-
reduced DMEM medium (0.1%–0.5% FBS) and images of the wound were captured at designated times to
assess wound closure rate.
Cell proliferation assay
Cell count, MTT assay (3-(4, 5-Dimethylthiazol-2-yl)-2, 5-diphenyltetrazolium bromide), Cell Cycle (PI
staining) and Ki67 immunostaining were used to quantify cell proliferation.
In Cell Count, HUVECs were seeded at an initial density of 7.5x10⁴ per well in a 12-well plate which
were counted at designated time-points for cell counting assay.
4
In MTT assay, HUVECs were seeded in a flat-bottom 96-well cell culture plate at an initial density of
5x10³ cells per well and allowed to grow for 48 hours, 10 l of MTT (5 mg/ml) solution (Sigma) was added to
each well followed by 4-hour incubation at 37°C, the media removed and 80 µl mixture of 40 ml isopropanol
plus 44 µl 37% HCl added to each well, then vibrated on a shaking table for 10 minutes to dissolve the formed
formazan. The plate was scanned with a microplate reader (Bio-Rad) at 570 nm for measuring the absorbance.
For propidium Iodide (PI) cell cycle analysis, HUVECs were starved in DMEM supplemented with 5%
charcoal-stripped serum or 0.5% regular FBS. After 24 hours, medium was changed to DMEM with 10% normal
FBS. Cells were harvested at designated time points, processed by standard methods by staining cell DNA with
propidium iodide (PI), 10,000 cells per sample were analyzed by a flow cytometer (BD Biosciences, Mansfield,
MA, USA).
For Ki67 immunofluorescence staining analysis, HUVECs were fixed in 4% neutral-buffered para-
formaldehyde non-specific binding sites were blocked with PBS containing 10% normal goat serum. The
HUVECs were further incubated with the primary antibodies against Ki-67 followed by an Alexa 488-
conjugated secondary antibody (Thermo Fisher Scientific, Danvers, Massachusetts, USA). The HUVECs were
mounted using Prolong Gold anti-fade mountant with DAPI (Thermo Fisher Scientific).
Dynamic cell motility measurement under live cell station
The viable HUVECs were planted at density of 1.5×10⁵ in 6-well plate and cultured for 12 hours, then
transfected with Life-act GFP plasmid. The cells were placed under live cell station microscopy and photographs
taken every two minutes to measure the dynamic change of cell mobility(4). Filopodia, lamellipodia, cortex and
stress fiber quantification methods were described previously(5-7).
Quantitation of G-actin, F-actin and GTPase activity assay
The amount of globular G-actin and filamentous F-actin was determined using the G-actin/F-actin in vivo
assay kit from Cytoskeleton (Denver, CO, USA), and the Cdc42 GTPase activity was measured using the G-
LISA activation assay biochem kits from Cytoskeleton Inc. (Denver, CO), following the manufacturer’s
instruction.
RNA purification, RT-qPCR and miRNA quantitation
Total RNA was isolated by Trizol from ECs of newborn mouse lung or HUVECs, reverse transcribed by
SuperScript First Strand Synthesis System (Invitrogen, Carlsbad, CA, USA). Expression of genes was quantified
by real time PCR analysis (RT-qPCR) with the primers listed in supplement table 1 (Table S1) of the
supplementary material. For miRNA quantification, total RNA was extracted from isolated ECs of lung
microvessels or HUVECs using a miRNeasy mini kit and the relative microRNA levels were measured by the
TaqMan miRNA reverse transcription kit and miRNA assay kit following the manufacturer’s instruction.
RNA high-throughput sequence of vascular endothelial cells isolated from mouse lung
Total RNA of the green ECs FACS sorting ECs from lung of R26R-tdTomato-EGFP mouse line (JaxMice,
stock number 007576) mated with miR302-367 gain-of-function or control mouse for high-throughput
sequencing. RNA samples extracted with Trizol were subjected to 100 bp x 2 non-strand-specific paired-end
RNA-sequence analyses by Genome Center of WuXi App Tec(8).
Western blot analysis
Total protein extracts (20-50 µg) from HUVECs were resolved on SDS-PAGE gels and transferred to
5
PVDF membranes for western blotting. Antibodies used in this article were listed in the supplementary table S3.
Co-immunoprecipitation (Co-IP)
For GRB2/PAK1 and CCND1/CDK4 immunoprecipitation, one 145 mm dish of cells was harvested by
trypsinization, washed with PBS twice, and lysed with RIPA buffer containing 1 x PIC by rotating for 1 hour at
4℃. Cell debris was removed by centrifugation, cell lysate was split into two parts (5% of lysate was saved as
input), and 8 µg anti-GRB2/PAK1/CCND1/CDK4 antibodies and 8µg IgG was used for immunoprecipitation
at 4℃ overnight. 30 µl protein G beads were used for pull-down at 4℃ for 1 hour. Beads were washed with
RIPA buffer three times, and bead-bound proteins were lysed with cell lysis buffer (50 mMTris-Cl, pH 6.8,
containing 2% SDS). Lysates and saved inputs were used for western blot detection of
PAK1/GRB2/CCND1/CDK4.
CDC42-GTP Pull-Down assay
Briefly, cells were lysed in RIPA buffer and centrifuged at 15,000 rpm for 10 min at 4 °C. Supernatants
were mixed with PAK-GST beads which binds specifically to GTP-bound, and not GDP-bound, CDC42 proteins
(Cytoskeleton). Levels of CDC42-GTP was detected by western immunoblotting using anti-CDC42 antibodies.
Chromatin Immunoprecipitation (ChIP)
3×10⁷ HUVECs were harvested for ChIP experiment. Cells were cross-linked with 1% formaldehyde at
room temperature for 10 min, and then neutralized with 125 mM glycine for 5 min. Cells were rinsed with ice-
cold PBS twice and scraped into 1 ml of ice-cold PBS. Cells were re-suspended in 0.3 ml of lysis buffer and
sonicated. After centrifugation, supernatants were collected and diluted in IP dilution buffer followed by
immunoclearing with protein A-sepharose for 2 hours at 4°C. 5 µg anti-KLF2 (Cat No: ab203591, Abcam); or
control IgG (Cat No: 2729S, CST) were used for immunoprecipitation. After immunoprecipitation, 45 µl protein
A-Sepharose was added and incubated for another hour. Precipitates were washed, and DNA was purified after
de-crosslinking for real-time PCR. Primers used are listed in Supplementary Tables 2.
3’-UTR Luciferase Reporter Assay
The 3’-UTR of CCND1 or CDC42 mRNA containing miR302-367 binding sequence was inserted into
pMIR-REPORT, a microRNA 3’-UTR Luciferase vector. Mutagenesis of the seed sequences from the miR302-
367 binding sites of CCND1 or CDC42 was generated by PCR-mediated site-directed mutagenesis. The final
sequence was validated by DNA sequencing. Luciferase activity was determined 48 hours after transfection
using Dual-Luciferase assay kits (Promega, Madison, WI, USA). Individual luciferase activity was normalized
to the corresponding Renilla-luciferase activity(9).
Plasmid construct of GRB2 promoter luciferase reporter.
pGRB2(1027) is the human GRB2 promoter-luciferase reporter construct which spans positions -820 to
+207 relative to the transcription start site and was amplified with PCR using genomic DNA isolated from
HUVECs as a template. Then, the digested PCR product was cloned into the HindIII-Xhol sites of pGL3-basic
reporter vector (Promega). The details of the primers are shown in Supplementary Table S2.
Promoter luciferase reporter assay
The promoter of GRB2 gene containing two KLF2 binding motifs was inserted into a pGL3 promoter
Luciferase vector. The final sequence was validated by DNA sequenceing. Luciferase activity was determined
6
48 hours after transfection using Dual-Luciferase assay kits (Promega). Individual luciferase activity was
normalized to the corresponding Renilla-Luciferase activity.
Target site blockers for validation of the pathway contributing to endothelial cell migration and
proliferation when elevated miR302 expression.
MicroRNAs usually regulate gene expression of multiple targets. Identification of these targets is
important to understanding the function of the microRNA. Target site blockers (TSB) are used to determine
which pathway contributes significantly to the phenotype observed upon microRNA expression. The custom-
designed TSBs with phosphorothioate backbone modifications from Exiqon (miRCURY LNATM microRNA
TSB) were used in vivo and in vitro to selectively silence the activity of miR-302 cluster on mouse and human
Ccnd1/CCND1 and Cdc42/CDC42, respectively, and the retinal in vivo developmental sprout angiogenesis and
cell proliferation, as well as cell migration and proliferation in culture HUVECs were observed to validate the
importance of these miR302 target genes in EC migration and proliferation. TSB sequences are designed with a
large arm that covers the miRNA binding site and a short arm outside the miRNA seed to ensure target specificity
of 3’UTR of Ccnd1/CCND1 or Cdc42/CDC42(10).
Intraocular injection was performed to observe the in vivo effects of TSB as previous described(11). In
brief, Buprenorphine (0.1 mg/kg) was injected in pups subcutaneously one hour prior to the procedure. The pups
were anesthetized by hypothermia and the skin over the eyelid was cleaned with Betadine followed by water
and 70% ethanol. Intraocular injections were performed under a dissecting microscope with a 301/2-gauge needle
attached to a 5 μl glass syringe (Hamilton, Reno, USA), the needle was positioned 1 mm posterior to the limbus
and 3 μl (Target site blockers, 0.4 mg/20 g) was slowly (3-5 seconds) injected into the vitreous chamber of the
eye. While in culture HUVECs, the concentration of the TSBs was 50 nM.
siRNA transfections
Cells were plated 24 hours before transfection at 50% confluence. KLF2 siRNA and control siRNA
transfections were performed with LipofectamineRNAiMAX (Invitrogen). The following siRNA
oligonucleotides from Sigma were used: KLF2 siRNA1: SASI_Hs01_00227239; KLF2 siRNA2:
SASI_Hs02_00349172, KLF2 siRNA3 SASI_Hs02_00349173. Control siRNA was purchased from Sigma. For
single KLF2 siRNA transfection, each individual siRNA was used at 60 nM concentration
Hypoxia experiment
For hypoxia treatment, HUVECs were maintained in glucose-free DMEM at 37 °C in an atmosphere of
5% CO2, 1% O2, and 94% N2. Transwell, tube formation and wound healing experiments were operated under
this hypoxia condition.
7
References
1. Wang Y, Nakayama M, Pitulescu ME, Schmidt TS, Bochenek ML, Sakakibara A, et al. Ephrin-B2 controls VEGF-
induced angiogenesis and lymphangiogenesis. Nature. 2010; 465: 483-6.
2. Nehls V, Drenckhahn D. A novel, microcarrier-based in vitro assay for rapid and reliable quantification of
three-dimensional cell migration and angiogenesis. Microvasc Res. 1995; 50: 311-22.
3. Arnaoutova I, Kleinman HK. In vitro angiogenesis: endothelial cell tube formation on gelled basement
membrane extract. Nat Protoc. 2010; 5: 628-35.
4. Zhao Y, Mao Q, Liu Y, Zhang Y, Zhang T, Jiang Z. Investigation of cytotoxicity of phosphoryl choline modified
single-walled carbon nanotubes under a live cell station. Biomed Res Int. 2014; 2014: 537091.
5. Barry DJ, Durkin CH, Abella JV, Way M. Open source software for quantification of cell migration, protrusions,
and fluorescence intensities. J Cell Biol. 2015; 209: 163-80.
6. Ryan GL, Petroccia HM, Watanabe N, Vavylonis D. Excitable actin dynamics in lamellipodial protrusion and
retraction. Biophys J. 2012; 102: 1493-502.
7. Deibler M, Spatz JP, Kemkemer R. Actin fusion proteins alter the dynamics of mechanically induced
cytoskeleton rearrangement. PLoS One. 2011; 6: e22941.
8. Guo R, Zheng L, Park JW, Lv R, Chen H, Jiao F, et al. BS69/ZMYND11 reads and connects histone H3.3 lysine
36 trimethylation-decorated chromatin to regulated pre-mRNA processing. Mol Cell. 2014; 56: 298-310.
9. Anokye-Danso F, Trivedi CM, Juhr D, Gupta M, Cui Z, Tian Y, et al. Highly efficient miRNA-mediated
reprogramming of mouse and human somatic cells to pluripotency. Cell Stem Cell. 2011; 8: 376-88.
10. Messina A, Langlet F, Chachlaki K, Roa J, Rasika S, Jouy N, et al. A microRNA switch regulates the rise in
hypothalamic GnRH production before puberty. Nat Neurosci. 2016; 19: 835-44.
11. Pi J, Tao T, Zhuang T, Sun H, Chen X, Liu J, et al. A MicroRNA302-367-Erk1/2-Klf2-S1pr1 Pathway Prevents
Tumor Growth via Restricting Angiogenesis and Improving Vascular Stability. Circ Res. 2017; 120: 85-98.

8
Supplement Table 1: Partial high throughput RNA sequencing results of lung endothelial cells
from miR302-367ECTg mutant comparing to littermate WT control mice
Symbol GeneID FPKM(4c) FPKM(3m) Log2.fold_change
CCND1 12443 7.69436 6.22739 -0.305175
CDC42 12540 380.511 189.806 -1.00341
GRB2 14784 72.6484 35.8417 -1.01929
KLF2 16598 121.611 235.352 0.952549
MAPK3 26417 172.712 117.893 -0.550896
MAPK1 26413 59.3909 41.3669 -0.521765
9
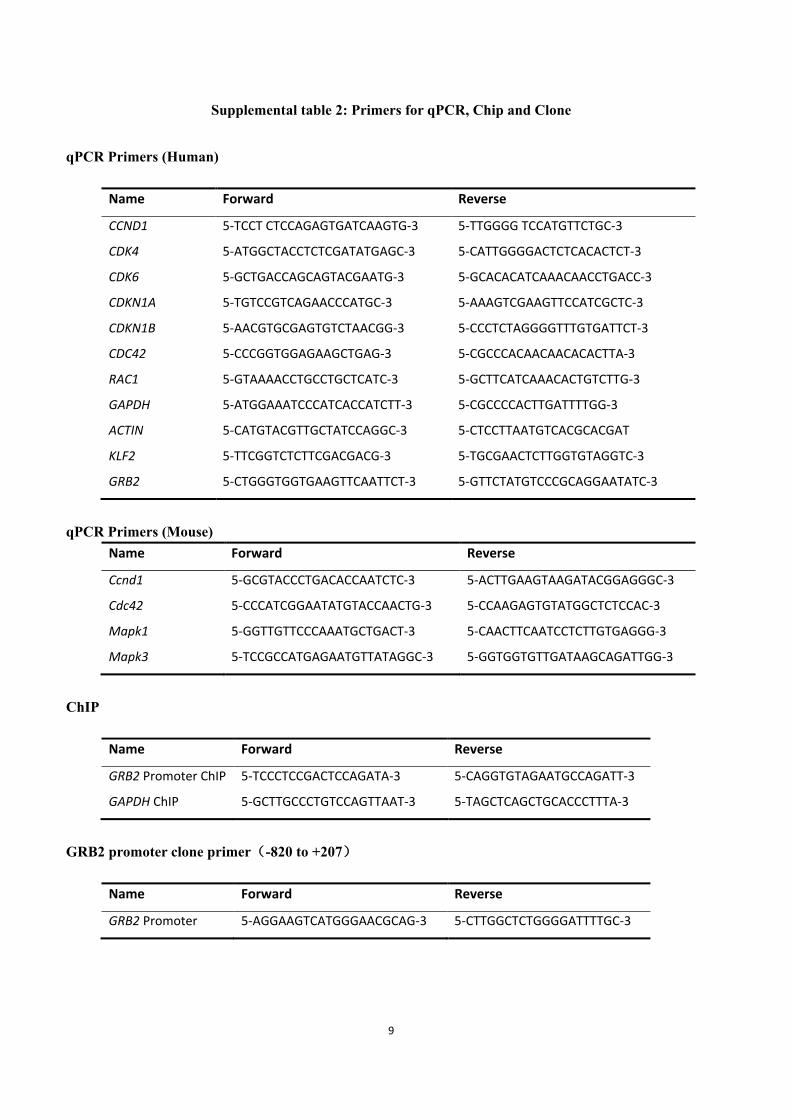
Supplemental table 2: Primers for qPCR, Chip and Clone
qPCR Primers (Human)
Name Forward Reverse
CCND1 5-TCCT CTCCAGAGTGATCAAGTG-3 5-TTGGGG TCCATGTTCTGC-3
CDK4 5-ATGGCTACCTCTCGATATGAGC-3 5-CATTGGGGACTCTCACACTCT-3
CDK6 5-GCTGACCAGCAGTACGAATG-3 5-GCACACATCAAACAACCTGACC-3
CDKN1A 5-TGTCCGTCAGAACCCATGC-3 5-AAAGTCGAAGTTCCATCGCTC-3
CDKN1B 5-AACGTGCGAGTGTCTAACGG-3 5-CCCTCTAGGGGTTTGTGATTCT-3
CDC42 5-CCCGGTGGAGAAGCTGAG-3 5-CGCCCACAACAACACACTTA-3
RAC1 5-GTAAAACCTGCCTGCTCATC-3 5-GCTTCATCAAACACTGTCTTG-3
GAPDH 5-ATGGAAATCCCATCACCATCTT-3 5-CGCCCCACTTGATTTTGG-3
ACTIN 5-CATGTACGTTGCTATCCAGGC-3 5-CTCCTTAATGTCACGCACGAT
KLF2 5-TTCGGTCTCTTCGACGACG-3 5-TGCGAACTCTTGGTGTAGGTC-3
GRB2 5-CTGGGTGGTGAAGTTCAATTCT-3 5-GTTCTATGTCCCGCAGGAATATC-3
qPCR Primers (Mouse)
Name Forward Reverse
Ccnd1 5-GCGTACCCTGACACCAATCTC-3 5-ACTTGAAGTAAGATACGGAGGGC-3
Cdc42 5-CCCATCGGAATATGTACCAACTG-3 5-CCAAGAGTGTATGGCTCTCCAC-3
Mapk1 5-GGTTGTTCCCAAATGCTGACT-3 5-CAACTTCAATCCTCTTGTGAGGG-3
Mapk3 5-TCCGCCATGAGAATGTTATAGGC-3 5-GGTGGTGTTGATAAGCAGATTGG-3
ChIP
Name Forward Reverse
GRB2 Promoter ChIP 5-TCCCTCCGACTCCAGATA-3 5-CAGGTGTAGAATGCCAGATT-3
GAPDH ChIP 5-GCTTGCCCTGTCCAGTTAAT-3 5-TAGCTCAGCTGCACCCTTTA-3
GRB2 promoter clone primer(-820 to +207)
Name Forward Reverse
GRB2 Promoter 5-AGGAAGTCATGGGAACGCAG-3 5-CTTGGCTCTGGGGATTTTGC-3
10
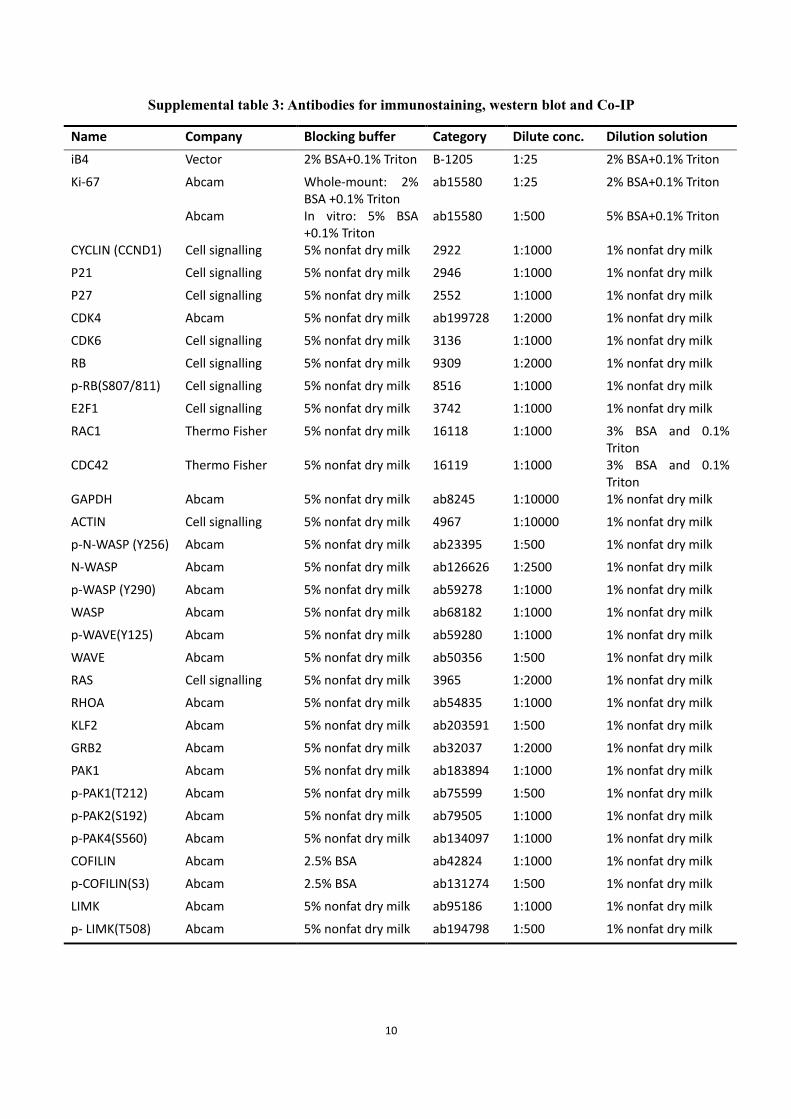
Supplemental table 3: Antibodies for immunostaining, western blot and Co-IP
Name Company Blocking buffer Category Dilute conc. Dilution solution
iB4 Vector 2% BSA+0.1% Triton B-1205 1:25 2% BSA+0.1% Triton
Ki-67 Abcam Whole-mount: 2% BSA +0.1% Triton
ab15580 1:25 2% BSA+0.1% Triton
Abcam In vitro: 5% BSA +0.1% Triton
ab15580 1:500 5% BSA+0.1% Triton
CYCLIN (CCND1) Cell signalling 5% nonfat dry milk 2922 1:1000 1% nonfat dry milk
P21 Cell signalling 5% nonfat dry milk 2946 1:1000 1% nonfat dry milk
P27 Cell signalling 5% nonfat dry milk 2552 1:1000 1% nonfat dry milk
CDK4 Abcam 5% nonfat dry milk ab199728 1:2000 1% nonfat dry milk
CDK6 Cell signalling 5% nonfat dry milk 3136 1:1000 1% nonfat dry milk
RB Cell signalling 5% nonfat dry milk 9309 1:2000 1% nonfat dry milk
p-RB(S807/811) Cell signalling 5% nonfat dry milk 8516 1:1000 1% nonfat dry milk
E2F1 Cell signalling 5% nonfat dry milk 3742 1:1000 1% nonfat dry milk
RAC1 Thermo Fisher 5% nonfat dry milk 16118 1:1000 3% BSA and 0.1% Triton
CDC42 Thermo Fisher 5% nonfat dry milk 16119 1:1000 3% BSA and 0.1% Triton
GAPDH Abcam 5% nonfat dry milk ab8245 1:10000 1% nonfat dry milk
ACTIN Cell signalling 5% nonfat dry milk 4967 1:10000 1% nonfat dry milk
p-N-WASP (Y256) Abcam 5% nonfat dry milk ab23395 1:500 1% nonfat dry milk
N-WASP Abcam 5% nonfat dry milk ab126626 1:2500 1% nonfat dry milk
p-WASP (Y290) Abcam 5% nonfat dry milk ab59278 1:1000 1% nonfat dry milk
WASP Abcam 5% nonfat dry milk ab68182 1:1000 1% nonfat dry milk
p-WAVE(Y125) Abcam 5% nonfat dry milk ab59280 1:1000 1% nonfat dry milk
WAVE Abcam 5% nonfat dry milk ab50356 1:500 1% nonfat dry milk
RAS Cell signalling 5% nonfat dry milk 3965 1:2000 1% nonfat dry milk
RHOA Abcam 5% nonfat dry milk ab54835 1:1000 1% nonfat dry milk
KLF2 Abcam 5% nonfat dry milk ab203591 1:500 1% nonfat dry milk
GRB2 Abcam 5% nonfat dry milk ab32037 1:2000 1% nonfat dry milk
PAK1 Abcam 5% nonfat dry milk ab183894 1:1000 1% nonfat dry milk
p-PAK1(T212) Abcam 5% nonfat dry milk ab75599 1:500 1% nonfat dry milk
p-PAK2(S192) Abcam 5% nonfat dry milk ab79505 1:1000 1% nonfat dry milk
p-PAK4(S560) Abcam 5% nonfat dry milk ab134097 1:1000 1% nonfat dry milk
COFILIN Abcam 2.5% BSA ab42824 1:1000 1% nonfat dry milk
p-COFILIN(S3) Abcam 2.5% BSA ab131274 1:500 1% nonfat dry milk
LIMK Abcam 5% nonfat dry milk ab95186 1:1000 1% nonfat dry milk
p- LIMK(T508) Abcam 5% nonfat dry milk ab194798 1:500 1% nonfat dry milk
11
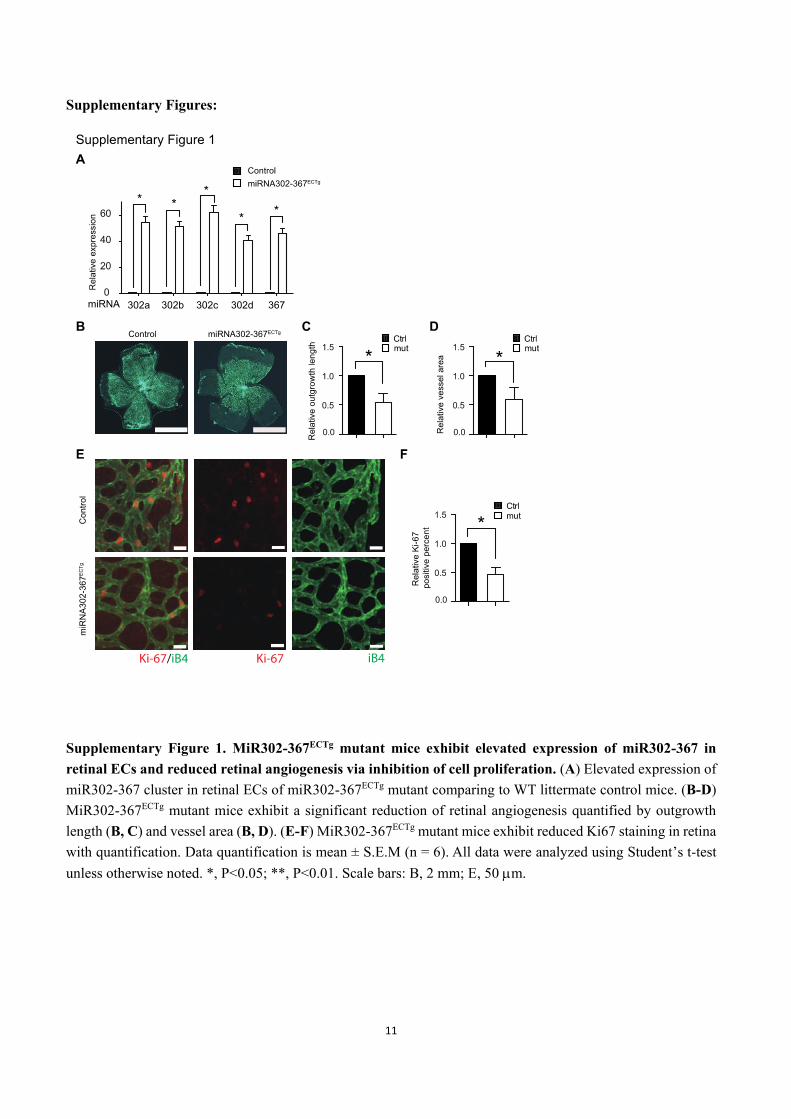
Supplementary Figures:
Supplementary Figure 1. MiR302-367ECTg mutant mice exhibit elevated expression of miR302-367 in
retinal ECs and reduced retinal angiogenesis via inhibition of cell proliferation. (A) Elevated expression of
miR302-367 cluster in retinal ECs of miR302-367ECTg mutant comparing to WT littermate control mice. (B-D)
MiR302-367ECTg mutant mice exhibit a significant reduction of retinal angiogenesis quantified by outgrowth
length (B, C) and vessel area (B, D). (E-F) MiR302-367ECTg mutant mice exhibit reduced Ki67 staining in retina
with quantification. Data quantification is mean ± S.E.M (n = 6). All data were analyzed using Student’s t-test
unless otherwise noted. *, P<0.05; **, P<0.01. Scale bars: B, 2 mm; E, 50 m.
12
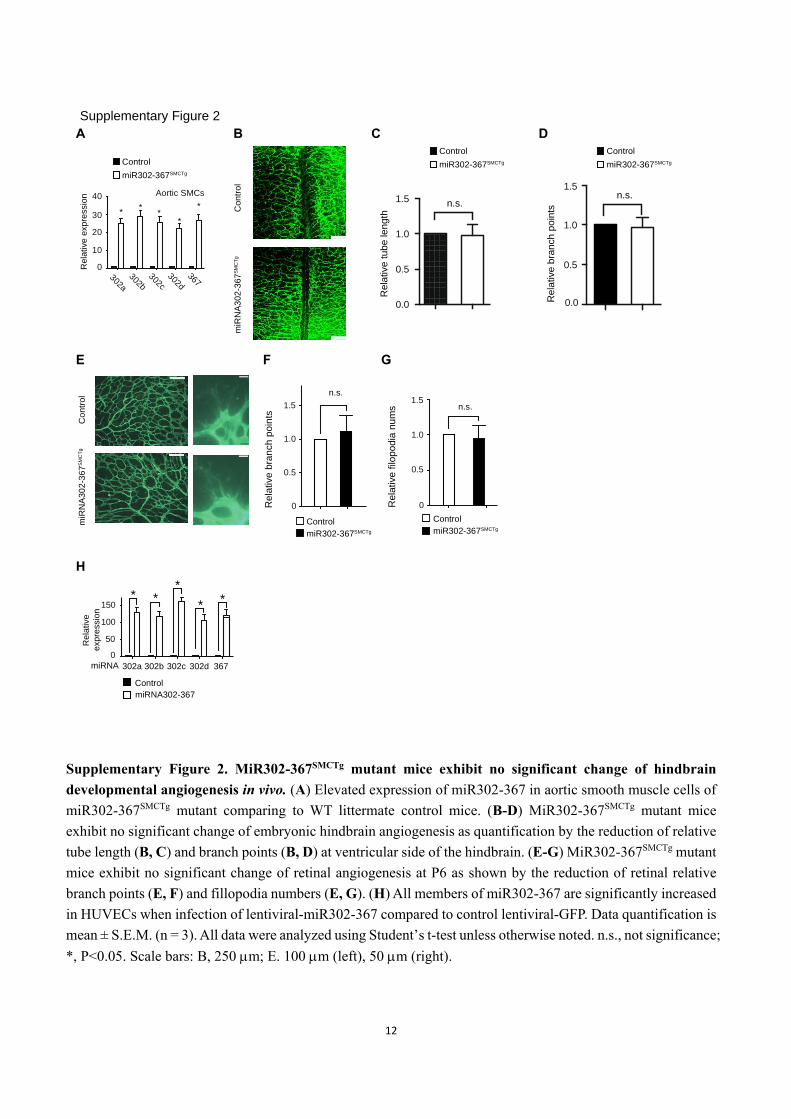
Supplementary Figure 2. MiR302-367SMCTg mutant mice exhibit no significant change of hindbrain
developmental angiogenesis in vivo. (A) Elevated expression of miR302-367 in aortic smooth muscle cells of
miR302-367SMCTg mutant comparing to WT littermate control mice. (B-D) MiR302-367SMCTg mutant mice
exhibit no significant change of embryonic hindbrain angiogenesis as quantification by the reduction of relative
tube length (B, C) and branch points (B, D) at ventricular side of the hindbrain. (E-G) MiR302-367SMCTg mutant
mice exhibit no significant change of retinal angiogenesis at P6 as shown by the reduction of retinal relative
branch points (E, F) and fillopodia numbers (E, G). (H) All members of miR302-367 are significantly increased
in HUVECs when infection of lentiviral-miR302-367 compared to control lentiviral-GFP. Data quantification is
mean ± S.E.M. (n = 3). All data were analyzed using Student’s t-test unless otherwise noted. n.s., not significance;
*, P<0.05. Scale bars: B, 250 m; E. 100 m (left), 50 m (right).
Co
ntr
ol
miR
NA
30
2-3
67
SM
CT
g
0
0.5
1.0
1.5
Re
lative b
r an
ch p
oin
ts
n.s.R
ela
tive f
ilopo
dia
nu
ms n.s.
Control
miR302-367SMCTg
Supplementary Figure 2
302a
302b
302c
302d
367
0
10
20
30
40
**
**
*
Rela
tive e
xp
ressio
n
miR302-367SMCTg
Control
Aortic SMCs
0
0.5
1.0
1.5
Control
miR302-367SMCTg
Contr
ol
miR
NA
302-3
67
SM
CT
g
0.0
0.5
1.0
1.5
Rela
tive
bra
nch
poin
ts
n.s.
0.0
0.5
1.0
1.5
Rela
tive t
ub
e le
ngth
n.s.
0
50
100
150
302a 302d302c302b 367miRNA
* **
**
R
ela
tive
exp
ressio
n
A B C D
E F G
H
miR302-367SMCTg
Control
miR302-367SMCTg
Control
Control
miRNA302-367
13
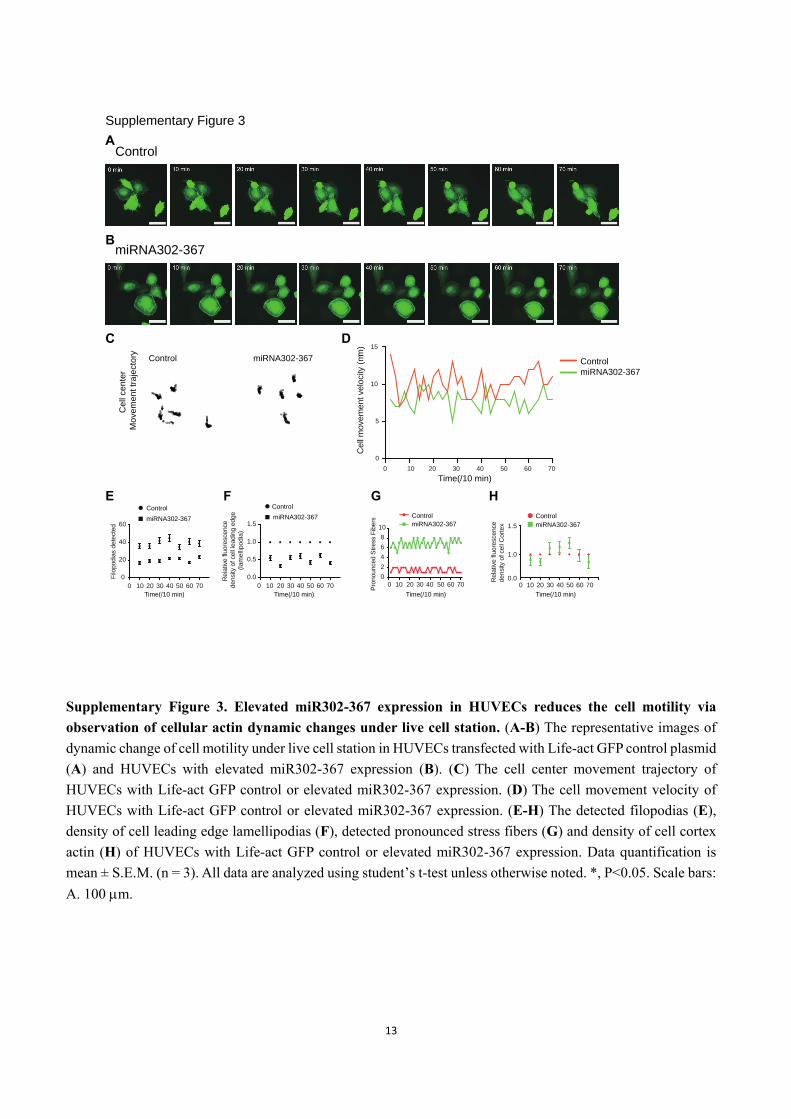
Supplementary Figure 3. Elevated miR302-367 expression in HUVECs reduces the cell motility via
observation of cellular actin dynamic changes under live cell station. (A-B) The representative images of
dynamic change of cell motility under live cell station in HUVECs transfected with Life-act GFP control plasmid
(A) and HUVECs with elevated miR302-367 expression (B). (C) The cell center movement trajectory of
HUVECs with Life-act GFP control or elevated miR302-367 expression. (D) The cell movement velocity of
HUVECs with Life-act GFP control or elevated miR302-367 expression. (E-H) The detected filopodias (E),
density of cell leading edge lamellipodias (F), detected pronounced stress fibers (G) and density of cell cortex
actin (H) of HUVECs with Life-act GFP control or elevated miR302-367 expression. Data quantification is
mean ± S.E.M. (n = 3). All data are analyzed using student’s t-test unless otherwise noted. *, P<0.05. Scale bars:
A. 100 m.
Control
miRNA302-367
Supplementary Figure 3
Control miRNA302-367
C
ell
cente
r
Mo
vem
en
t tr
aje
cto
ry
0 10 20 30 40 50 60 70
0
20
40
60
Filo
podia
s d
ete
cte
d
Control
miRNA302-367
Time(/10 min)
0.0
0.5
1.0
1.5
R
ela
tive flu
ore
scence
density o
f cell
leadin
g e
dge
(l
am
elli
po
dia
)
0 10 20 30 40 50 60 70
Time(/10 min)
0 10 20 30 40 50 60 70
0
5
10
15
Cell
movem
ent velo
city (
mm
)
Control
miRNA302-367
Control
miRNA302-367
Time(/10 min)
1.0
1.5
0.00 10 20 30 40 50 60 70
Time(/10 min)
Rela
tive flu
ore
scence
density o
f cell
Cort
ex
Control
miRNA302-367
0
2
4
6
8
10
0 10 20 30 40 50 60 70
Control
miRNA302-367
Pro
nounced S
tress F
ibers
Time(/10 min)
A
B
C D
E F G H
14
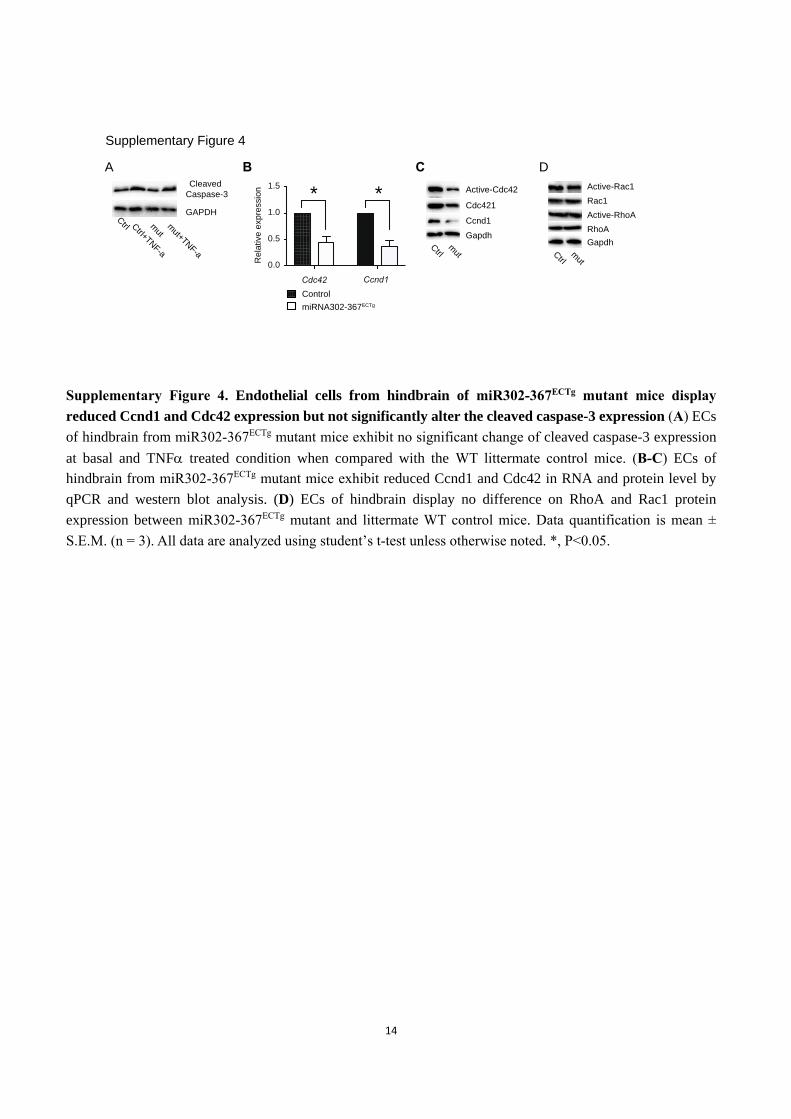
Supplementary Figure 4. Endothelial cells from hindbrain of miR302-367ECTg mutant mice display
reduced Ccnd1 and Cdc42 expression but not significantly alter the cleaved caspase-3 expression (A) ECs
of hindbrain from miR302-367ECTg mutant mice exhibit no significant change of cleaved caspase-3 expression
at basal and TNF treated condition when compared with the WT littermate control mice. (B-C) ECs of
hindbrain from miR302-367ECTg mutant mice exhibit reduced Ccnd1 and Cdc42 in RNA and protein level by
qPCR and western blot analysis. (D) ECs of hindbrain display no difference on RhoA and Rac1 protein
expression between miR302-367ECTg mutant and littermate WT control mice. Data quantification is mean ±
S.E.M. (n = 3). All data are analyzed using student’s t-test unless otherwise noted. *, P<0.05.
Supplementary Figure 4
Cleaved
Caspase-3
GAPDHCtrl C
trl+TNF-a
mut
mut+TN
F-a
A
Active-Rac1
Ctrl
mut
Gapdh
Rac1
D
RhoA
Active-RhoA
0.0
0.5
1.0
1.5
Cdc42 Ccnd1
Rela
tive e
xpre
ssio
n
Control
miRNA302-367ECTg
Ccnd1
Gapdh
Cdc421
Active-Cdc42
B C
* *
Ctrl
mut

15
Supplementary Figure 5. Constitutive active CDC42 reverses the reduced endothelial cell migration and
tube formation caused by elevated miR302-367 expression in normal and hypoxia condition (A-B)
Constitutive active CDC42 reverses the reduced cell migration in HUVECs when elevated miR302-367
expression by scratch wound healing assay, the representative images (A) and quantification (B). (C-D)
Constitutive active CDC42 reverses the tube formation in HUVECs when elevated miR302-367 expression, the
representative images (C) and quantification (D). (E-F) Constitutive active CDC42 reverses the cell migration
in HUVECs when elevated miR302-367 expression under hypoxia condition by Boyden chamber assay (E, top)
and tube formation (E, bottom) and scratch wound healing assay (F). Data quantification is mean ± S.E.M. (n =
3). All data were analyzed using Student’s t-test unless otherwise noted. *, P<0.05. Scale bars: A, 200 m; C,
100 m; E, 100 m (top), 100 m (bottom); F, 200 m.
16
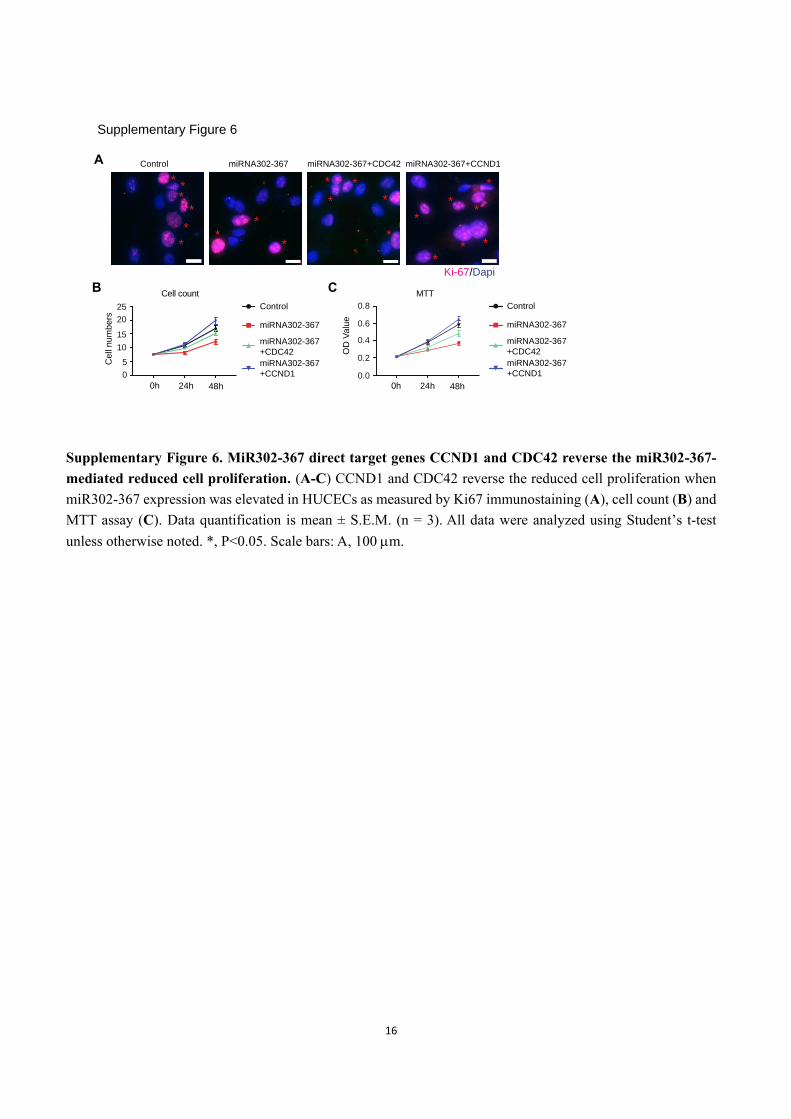
Supplementary Figure 6. MiR302-367 direct target genes CCND1 and CDC42 reverse the miR302-367-
mediated reduced cell proliferation. (A-C) CCND1 and CDC42 reverse the reduced cell proliferation when
miR302-367 expression was elevated in HUCECs as measured by Ki67 immunostaining (A), cell count (B) and
MTT assay (C). Data quantification is mean ± S.E.M. (n = 3). All data were analyzed using Student’s t-test
unless otherwise noted. *, P<0.05. Scale bars: A, 100 m.
Supplementary Figure 6
0
5
10
15
20
25 Control
miRNA302-367
miRNA302-367
+CCND1
miRNA302-367
+CDC42
Ce
ll n
um
bers
0h 24h 48h
0.0
0.2
0.4
0.6
0.8 Control
miRNA302-367
miRNA302-367
+CCND1
miRNA302-367
+CDC42
MTTCell count
OD
Va
lue
B C
Control miRNA302-367 miRNA302-367+CDC42 miRNA302-367+CCND1A
*
*
*
*
**
**
*
*
*
*
*
*
*
*
**
*
* *
Ki-67/Dapi
0h 24h 48h
17

18
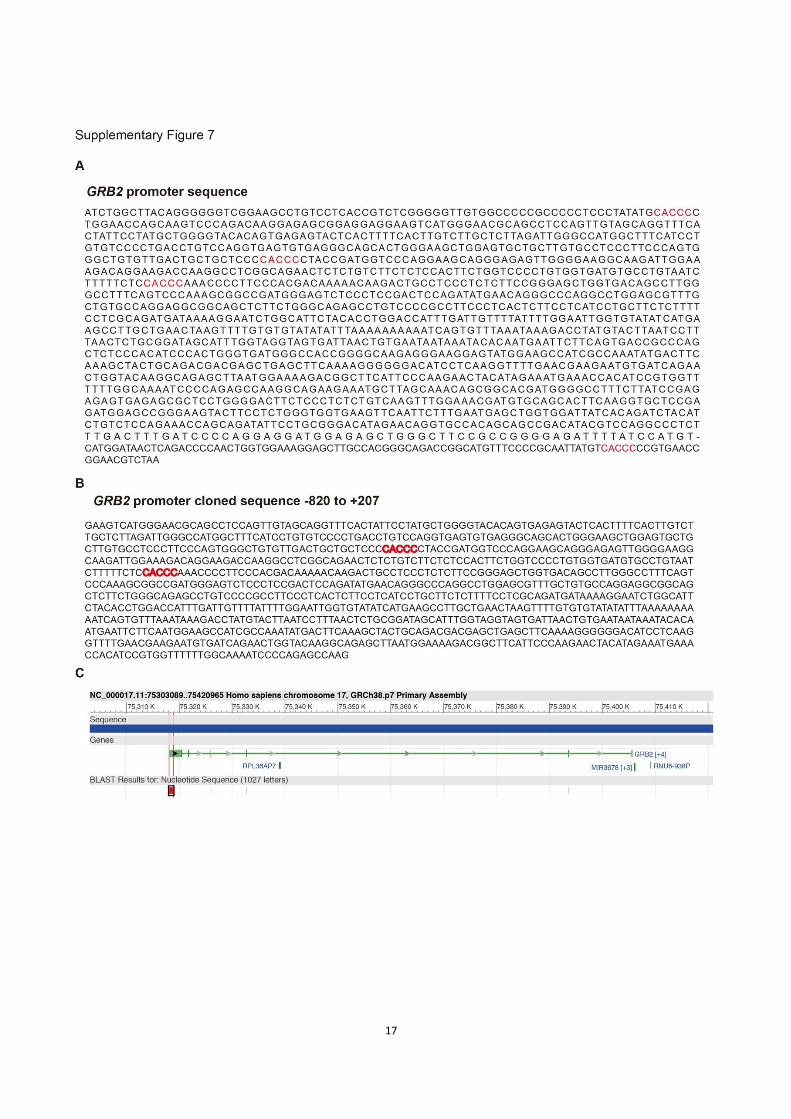
Supplementary Figure 7. GRB2 promoter sequence analysis. (A) GRB2 promoter sequence has four KLF2
binding sites. (B) Sequencing result shows that -820 - +207 segment of GRB2 promoter was successfully cloned
into the pGL3 basic vector. (C) PubMed blast result shows that the cloned -820 - +207 segment located in the
site of GRB2 promoter.
19
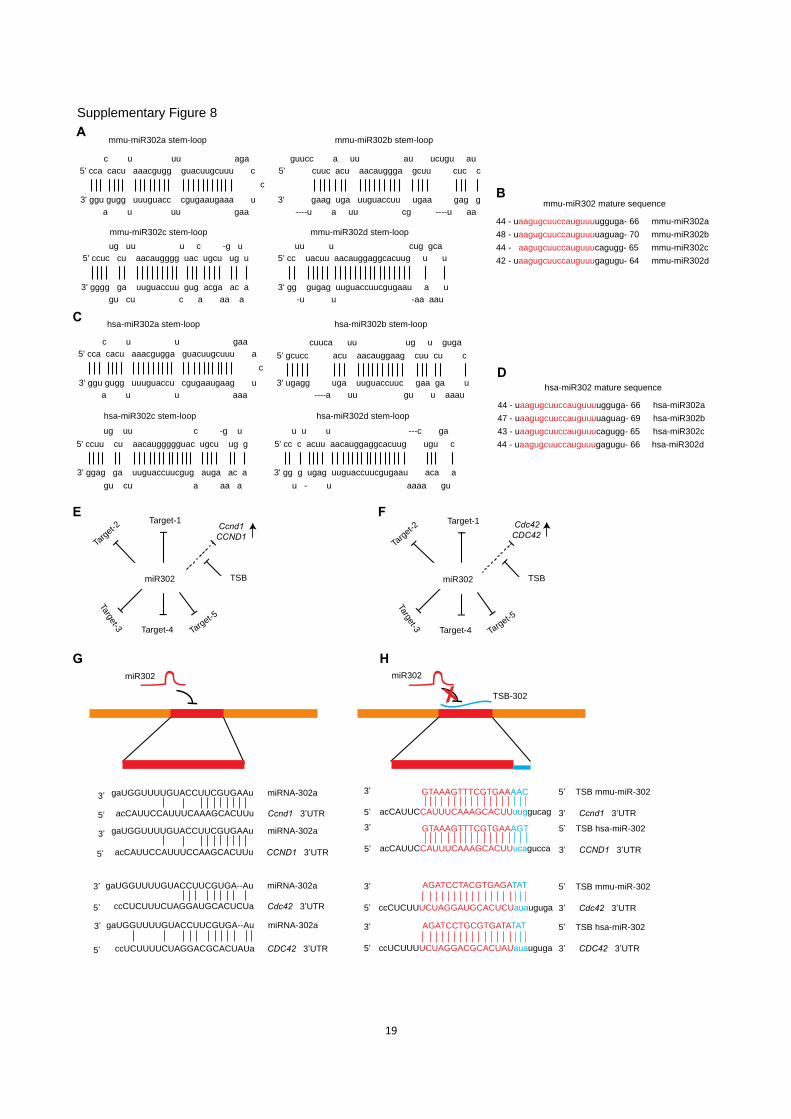
c u uu aga
5' cca cacu aaacgugg guacuugcuuu c
3' ggu gugg uuuguacc cgugaaugaaa u
a u uu gaa
c
gaUGGUUUUGUACCUUCGUGAAu miRNA-302a3’
5’ Ccnd1 3’UTRacCAUUCCAUUUCAAAGCACUUu
TSB-302
TSB mmu-miR-302
5’ Ccnd1 3’UTRacCAUUCCAUUUCAAAGCACUUuuggucag
GTAAAGTTTCGTGAAAAC 5’
3’
3’
X
miR302 miR302
mmu-miR302a stem-loop
uu u cug gca
5' cc uacuu aacauggaggcacuug u u
3' gg gugag uuguaccuucgugaau a u
-u u -aa aau
mmu-miR302d stem-loop
c u u gaa
5' cca cacu aaacgugga guacuugcuuu a
3' ggu gugg uuuguaccu cgugaaugaag u
a u u aaa
c
hsa-miR302a stem-loop
cuuca uu ug u guga
5' gcucc acu aacauggaag cuu cu c
3' ugagg uga uuguaccuuc gaa ga u
----a uu gu u aaau
hsa-miR302b stem-loop
ug uu u c -g u
5' ccuc cu aacaugggg uac ugcu ug u
3' gggg ga uuguaccuu gug acga ac a
gu cu c a aa a
mmu-miR302c stem-loop
guucc a uu au ucugu au
5' cuuc acu aacauggga gcuu cuc c
3' gaag uga uuguaccuu ugaa gag g
----u a uu cg ----u aa
mmu-miR302b stem-loop
44 - uaagugcuuccauguuuugguga- 66
48 - uaagugcuuccauguuuuaguag- 70
44 - aagugcuuccauguuucagugg- 65
42 - uaagugcuuccauguuugagugu- 64
mmu-miR302a
mmu-miR302b
mmu-miR302c
mmu-miR302d
mmu-miR302 mature sequence
ug uu c -g u
5' ccuu cu aacauggggguac ugcu ug g
3' ggag ga uuguaccuucgug auga ac a
gu cu a aa a
hsa-miR302c stem-loop
u u u ---c ga
5' cc c acuu aacauggaggcacuug ugu c
3' gg g ugag uuguaccuucgugaau aca a
u - u aaaa gu
hsa-miR302d stem-loop
44 - uaagugcuuccauguuuugguga- 66 hsa-miR302a
hsa-miR302 mature sequence
47 - uaagugcuuccauguuuuaguag- 69 hsa-miR302b
43 - uaagugcuuccauguuucagugg- 65 hsa-miR302c
44 - uaagugcuuccauguuugagugu- 66 hsa-miR302d
ccCUCUUUCUAGGAUGCACUCUauauguga
AGATCCTACGTGAGATAT TSB mmu-miR-302
Cdc42 3’UTR
5’
3’5’
3’ gaUGGUUUUGUACCUUCGUGA--Au miRNA-302a3’
5’ Cdc42 3’UTR ccCUCUUUCUAGGAUGCACUCUa
miR302 TSB
Target-1
Targ
et-2
Target-3 Target-4 Targ
et-5
Ccnd1
CCND1
miR302 TSB
Target-1
Targ
et-2
Target-3 Target-4 Targ
et-5
Cdc42
CDC42
5’ CCND1 3’UTRacCAUUCCAUUUCCAAGCACUUu
gaUGGUUUUGUACCUUCGUGAAu miRNA-302a3’TSB hsa-miR-302
5’ CCND1 3’UTRacCAUUCCAUUUCAAAGCACUUucagucca
GTAAAGTTTCGTGAAAGT 5’
3’
3’
5’ CDC42 3’UTR ccUCUUUUCUAGGACGCACUAUa
gaUGGUUUUGUACCUUCGUGA--Au miRNA-302a3’
ccUCUUUUCUAGGACGCACUAUauauguga
AGATCCTGCGTGATATAT TSB hsa-miR-302
CDC42 3’UTR
5’
3’5’
3’
Supplementary Figure 8
A
B
C
D
E F
G H

20
Supplementary Figure 8. The sequence of mouse and human immature stem-loop and mature miR302a-
d and validation of the mechanisms of Target Site Blockers for the pathways miR302 effects on. (A-D)
Mouse and human sequence of immature stem-loop (A, C) and mature miR302a-d (B, D). (E) Target Site
Blocker (TSB) blocks miR302 specific target gene CCND1/Ccnd1 among multiple target genes to determine
the pathway responsible for cell proliferation. (F) Target Site Blocker (TSB) blocks miR302 specific target gene
CDC42/Cdc42 among multiple target genes to determine the pathway responsible for cell migration. (G) The
predicted consequential pairing of miR-302 with the Cdc42/Ccnd1 target region. (H) The custom-design TSB
sequences to selective impair miR302 cluster-mediated inhibition of Cdc42/CDC42 or Ccnd1/CCND1.

21
Rela
tive e
xpre
ssio
n
R
ela
tive K
i-6
7
po
ditiv
r p
erc
en
t
0.0
0.5
1.0
1.5
2.0
2.5
0
10
20
30
0h 12h 24h
Cell count
Ce
ll nu
mbe
rs
0.0
0.2
0.4
0.6
0.8
1.0
0h 12h 24h
MTT
OD
Va
lue
0.0
0.5
1.0
1.5
2.0
2.5
Filo
po
dia
Re
tina
Ki-
67
0.0
0.5
1.0
1.5
2.0
2.5
R
ela
tive K
i-67
poditiv
r pe
rcen
t
R
ela
tive F
ilop
od
ia
num
bers
per
1 m
m
Tra
nsw
ell
Ki-
67
R
ela
tive K
i-67
po
ditiv
r p
erc
en
t
0.0
0.5
1.0
1.5
2.0
0.0
0.5
1.0
1.5
2.0
2.5
Cdc42
Ccnd1
Gapdh
CDC42
GAPDH
Active-Cdc42
Gapdh
Active-CDC42
GAPDH
R
ela
tive
Ki-
67
po
ditiv
r pe
rcen
t
0.0
0.5
1.0
1.5
2.0
2.5*
*
*
*
*
*
R
ela
tive
mig
ration
cells
CDC42
Dapi/Ki-67
Dapi/Ki-67
Ki-67/iB4
Re
tin
a K
i-67
Ki-6
7
Scramble TSB-302
M N O P
T
U V
CD
A
Q R
S
B
E F
JI
KL
G H
Supplementary Figure 9
Ki-67/iB4
**
Ccn
d1
Cdc
42
Map
k1
Map
k3
0
1
2
3 *
n.s.n.s.
n.s.
0
1
2
3
4
CCND1
CDC42
MAPK1
MAPK3
Rela
tive e
xpre
ssio
n *
n.s.n.s. n.s.
**
*
*
**
**
*
*
*
*
*
*
***
*
* * **
*
0.0
0.5
1.0
1.5
2.0
Ccn
d1
Cdc
42
Map
k1
Map
k3
n.s.
n.s. n.s.
*
Rela
tive e
xpre
ssio
n
0
1
2
3
Re
lative
expre
ssio
n
CCND1
CDC42
MAPK1
MAPK3
*
n.s. n.s.n.s.
TSB-302-CDC42
TSB-Scramble
TSB-Scramble
TSB-302-Cdc42
TSB-Scramble
TSB-302-CCND1
TSB-302-Ccnd1
TSB-Scramble
TSB-Scramble TSB-302-Ccnd1
TSB-S
cramble
TSB-302-C
cnd1TSB-Scramble TSB-302-CCND1
TSB-S
cramble
TSB-302-C
CND1
TSB-Scramble TSB-302-Cdc42
TSB-Scramble TSB-302-CDC42
TSB-Scramble TSB-302-CDC42
TSB-S
cramble
TSB-302-C
dc42
TSB-S
cramble
TSB-302-C
DC42
TSB-Scramble
TSB-302-CCND1
Active-CDC42
Active-Cdc42
*
Erk1/2
ERK1/2
ERK1/2
Erk1/2
CCND1
Cdc42
Ccnd1
CCND1
Scramble TSB-302
Scramble TSB-302
Scramble TSB-302
Scramble TSB-302
Scramble TSB-302
22
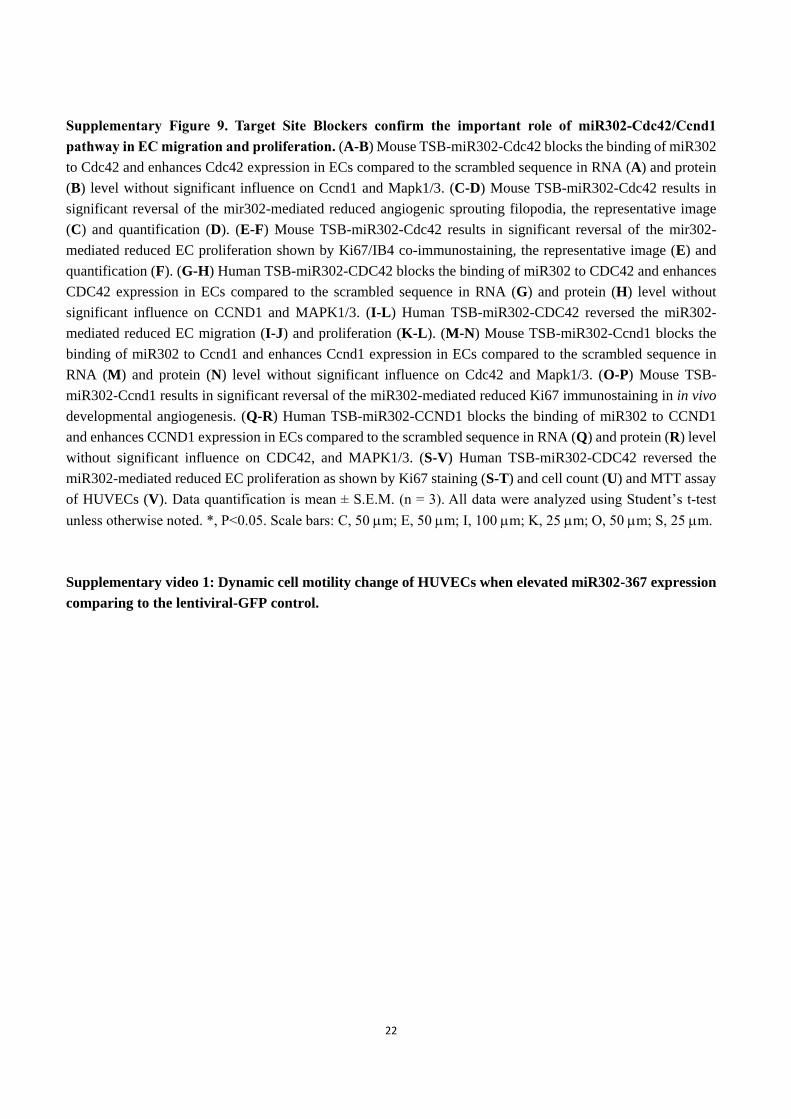
Supplementary Figure 9. Target Site Blockers confirm the important role of miR302-Cdc42/Ccnd1
pathway in EC migration and proliferation. (A-B) Mouse TSB-miR302-Cdc42 blocks the binding of miR302
to Cdc42 and enhances Cdc42 expression in ECs compared to the scrambled sequence in RNA (A) and protein
(B) level without significant influence on Ccnd1 and Mapk1/3. (C-D) Mouse TSB-miR302-Cdc42 results in
significant reversal of the mir302-mediated reduced angiogenic sprouting filopodia, the representative image
(C) and quantification (D). (E-F) Mouse TSB-miR302-Cdc42 results in significant reversal of the mir302-
mediated reduced EC proliferation shown by Ki67/IB4 co-immunostaining, the representative image (E) and
quantification (F). (G-H) Human TSB-miR302-CDC42 blocks the binding of miR302 to CDC42 and enhances
CDC42 expression in ECs compared to the scrambled sequence in RNA (G) and protein (H) level without
significant influence on CCND1 and MAPK1/3. (I-L) Human TSB-miR302-CDC42 reversed the miR302-
mediated reduced EC migration (I-J) and proliferation (K-L). (M-N) Mouse TSB-miR302-Ccnd1 blocks the
binding of miR302 to Ccnd1 and enhances Ccnd1 expression in ECs compared to the scrambled sequence in
RNA (M) and protein (N) level without significant influence on Cdc42 and Mapk1/3. (O-P) Mouse TSB-
miR302-Ccnd1 results in significant reversal of the miR302-mediated reduced Ki67 immunostaining in in vivo
developmental angiogenesis. (Q-R) Human TSB-miR302-CCND1 blocks the binding of miR302 to CCND1
and enhances CCND1 expression in ECs compared to the scrambled sequence in RNA (Q) and protein (R) level
without significant influence on CDC42, and MAPK1/3. (S-V) Human TSB-miR302-CDC42 reversed the
miR302-mediated reduced EC proliferation as shown by Ki67 staining (S-T) and cell count (U) and MTT assay
of HUVECs (V). Data quantification is mean ± S.E.M. (n = 3). All data were analyzed using Student’s t-test
unless otherwise noted. *, P<0.05. Scale bars: C, 50 m; E, 50 m; I, 100 m; K, 25 m; O, 50 m; S, 25 m.
Supplementary video 1: Dynamic cell motility change of HUVECs when elevated miR302-367 expression
comparing to the lentiviral-GFP control.
Recommended