290
DOI: 10.5395/JKACD.2011.36.4.290
INTRODUCTION
Patients with recently exposed root surfaces may
become susceptible to acidic environments, even
when other pertinent environmental factors remain
unchanged.1 The inorganic chemical events of the
root caries are similar to that of the enamel, howev-
er, the permeability and reactivity of the root surface
allows the demineralization process to occur at a
higher pH than in enamel.2 Therefore, clinicians
Elemental analysis of the fluoride varnish effects on root caries initiation
Se-Eun Park1, Keewook Yi2, Hae-Young Kim3, Ho-Hyun Son1, Juhea Chang4* 1Department of Conservative Dentistry, Seoul National University School of Dentistry and Dental Research Institute, Seoul,
2Geochronology Team, Korea Basic Science Institute, Daejeon, 3Department of Dental Laboratory Science and Engineering, Korea University College of Health Science, Seoul,
4Clinic for Persons with Disabilities, Seoul National University Dental Hospital, Dental Research Institute, Seoul National University School of Dentistry, Seoul, Korea
Objectives: The usage of fluoride varnish for a moderate to low caries-risk group has not been well validat-
ed. This study aimed to evaluate the preventive and therapeutic efficacies of fluoride varnish on the initiat-
ed root caries.
Materials and Methods: Ten premolars were sectioned into quarters, further divided into two windows, one
of which was painted with Fluor Protector (1,000 ppm fluoride, Ivoclar Vivadent). An initial lesion with a
well-preserved surface layer was produced by pH cycling. Scanned line analysis using energy dispersive
spectrometry determined the weight percentages of Ca and P in the demineralized layer. Scanning Electron
microscopy and confocal laser scanning microscopy (CLSM) evaluated the varnish-applied root surfaces.
Results: The mean lesion depth (SD) was 12.3 (2.6) μm (single cycling) and 19.6 (3.8) μm (double
cycling). Double cycling extended the lesion depth, but induced no more mineral loss than single cycling (p
< 0.05). The mean weight percentages of Ca and P between groups with and without varnish were not sig-
nificantly different (p < 0.05). A CLSM showed varnish remained within 15 μm of the surface layer.
Conclusions: When a mild acid challenge initiated root tissue demineralization, the application of low-con-
centration fluoride varnish did not influence the lesion depth or the mineral composition of the subsurface
lesion. [J Kor Acad Cons Dent 2011;36(4):290-299.]
Key words: Elemental analysis; Fluoride; Root caries; Varnish
-Received 16 April 2011; revised 17 June 2011; accepted 17 June 2011-
ABSTRACT
1Park SE, DDS, MSD, Graduate student; Son HH, DDS, MSD, PhD, Professor, Department of Conservative Dentistry, Seoul National UniversitySchool of Dentistry and Dental Research Institute, Seoul,
2Yi K, MS, PhD, Senior research scientist, Geochronology Team, Korea Basic Science Institute, Daejeon,3Kim HY, DDS, MSD, PhD, Assistant professor, Department of Dental Laboratory Science and Engineering, Korea University College of HealthScience, Seoul,
4Chang J, DDS, MSD, PhD, Clinical assistant professor, Clinic for Persons with Disabilities, Seoul National University Dental Hospital, DentalResearch Institute, Seoul National University School of Dentistry, Seoul, Korea *Correspondence to Juhea Chang, DDS, MSD, PhD.Clinical assistant professor, Clinic for Persons with Disabilities, Seoul National University Dental Hospital, Dental Research Institute, SeoulNational University School of Dentistry, Daehak-no 101, Jongro-gu, Seoul, Korea 110-768TEL, +82-2-2072-3831; FAX, +82-2-2072-2854; E-mail, [email protected]※This study was supported by grant No. 04-2009-0030 from the Seoul National University Dental Hospital Research Fund.
Basic Research
Park SE et al. JKACD Volume 36, Number 4, 2011
291
Basic research
JKACD Volume 36, Number 4, 2011 Fluoride varnish on initiated root caries
observe that many patients may appear resistant to
enamel caries but prone to root caries, after root sur-
faces become exposed by soft tissue recession, trau-
matic tooth brushing habits, periodontal treatment,
and etc. For exposed root surfaces, fluoride varnish
has been advocated both by serving as a desensitiz-
ing agent and an anticariogenic agent.3 Fluor
Protector (1,000 ppm F, Ivoclar Vivadent, Schaan,
Lichtenstein), 0.1% silane fluoride containing var-
nish is known not only to supplement additional fluo-
ride ions but also to block a porous structure by
building a polymerized barrier.4 Several studies have
demonstrated the prolonged caries inhibition effect of
Fluor Protector, even though it has a low fluoride
concentration (1,000 ppm F) relative to other var-
nishes containing 5% NaF (22,600 ppm F,
Duraphat, Colgate, New York, NY, USA; Duraflor,
Medicom, Tonawanda, NY, USA; CavityShield, 3M
ESPE, St Paul, MN, USA).3,5,6 However, it was
shown that dentin required higher levels of fluoride
to reach a level of inhibition comparable to that of
enamel.7,8 Ettinger et al. suggested that the depth of
artificial lesions on root surfaces are dose responsive
to the concentration of fluoride used, and that 10,000
ppm F was beneficial.9 For root dentin, polymer-
based varnishes may penetrate into dentinal tubules
and act as a type of sealant. But, Hong et al. evalu-
ated the efficacy of varnish with the consideration of
abrasive contact in the daily circumstance and
showed that preventive effect of varnish was dimin-
ished by tooth brushing.10
Most studies on the efficacy of fluoride varnish
have focused on high caries risk groups in clinical sit-
uations or induced severe acidic challenges in in vitro
experiments. It has been rarely addressed about
caries inhibition activity of varnish for a normal pop-
ulation who do not additionally require a preventive
intervention. However, a previously low to moderate
risk group, who practice regular tooth brushing and
preclude any drastic cariogenic challenges, may
become newly susceptible to the disease due to their
recently exposed root surfaces. And, the fluoride var-
nish can be applied in a preventive measure, even
before any clinical signs of caries development are
perceived.
Traditionally, the initial stages of carious lesions
are characterized by partial dissolution of the tissue,
leaving a 20 - 50 μm thick, rather well-mineralized
surface layer and a subsurface body of the lesion with
a mineral loss of up to 30 - 50%.11 Such a detectable
amount of disintegration is resulted from the preced-
ing continuum of reactive chemical events. To quan-
tify the beneficial effects of fluoride for the initiation
of the pathologic change, it may be useful to trace
the elemental redistribution with a fine resolution.12
In this study a scanning electron microscope (SEM,
JEOL JSM-6610LV, JEOL, Tokyo, Japan) and an
energy dispersive spectrometer (EDS, Oxford instru-
ments, Bucks, UK) were employed to measure quan-
titative changes in mineral composition and to locate
the demineralized layer. A confocal laser scanning
microscope (CLSM, Zeiss LSM-Pascal, Carl Zeiss,
Gottingen, Germany) was used to determine the
depth of varnish penetration into root tissue. We
hypothesized that low concentration fluoride varnish
applied to the root surface would influence the early
profile of subsurface demineralization under a mild
acid challenge.
MATERIALS AND METHODS
Specimen preparation
This study was approved by the Institutional
Review Board of Seoul National University Dental
Hospital. Ten human lower premolars extracted for
orthodontic treatment were used within 6 months of
extraction and disinfected in 0.5% chloramines-T
and stored in distilled water at 4℃. The teeth were
inspected to ensure that they were free of fractures
or other defects, and the periodontal ligament was
removed using a Gracey curette under microscopy.
The crowns of the teeth were removed at the cemen-
toenamel junction with a low-speed diamond saw
(Isomet, Buehler Ltd., Lake Bluff, IL, USA) and the
apical roots were removed leaving 4-mm-long root
segments. The segments were sectioned mesiodistally
and buccolingually into four parts (Figure 1). Each
quarter root was covered with a thin layer of acid-
resistant nail varnish, creating two 1 mm × 4 mm
windows on the outer root surface and randomly
assigned into one of four experimental groups (Table 1).
292
Basic research
Park SE et al. JKACD Volume 36, Number 4, 2011
Group A: no pH cycling
Group B: pH cycling before varnish application
Group C: pH cycling after varnish application
Group D: pH cycling before and after varnish appli-
cation
Each group was divided into two subgroups;
v (varnish application) or o (no varnish application).
Fluoride varnish application and pH cycling
Fluor Protector (1,000 ppm F) was applied on one
of the two windows of each specimen according to the
manufacturer’s directions and dried for 5 minutes.
After storage in 100% humidity for 24 hours at 37℃,
the thin varnish layer was pulled off using a No.15
surgical blade. The specimens were immersed in 2
mL of demineralizing solution (1.4 mM Ca, 0.9 mM
P, 0.05 M acetate buffer, 0.03 ppm F, pH 5.0) for 3
hours, followed by immersion in 2 mL of remineraliz-
ing solution (1.5 mM Ca, 0.9 mM P, 0.1 M Tris
buffer, 0.05 ppm F, pH 7.0) for 20 hours.13,14 After 5
days of cycling, specimens were immersed in rem-
ineralizing solution for 2 days. Solutions were
changed for each immersion and placed in a 37℃
incubator without agitation.
SEM/EDS analysis
Specimens were embedded in epoxy resin (Epofix,
Struers, Glasgow, UK) and horizontally cross-sec-
tioned along the midline (Figure 1). The exposed cut
surfaces were serially polished with 500, 1,300, and
2,400 grit Al2O3 abrasive papers, followed by 1 and
0.25 μm diamond and 0.1 and 0.05 μm alumina pol-
ishing suspensions (Struers, Copenhagen, Denmark).
The specimens were ultrasonically cleaned in deion-
ized water for 10 minutes, dried for 72 hours in a
desiccator and carbon sputter-coated. On the cross-
sectioned surfaces, the demineralization bands were
identified at ×600 magnifications in a phase contrast
of backscattered electron imaging (BSI) mode of
SEM. To identify variations in the amounts of ele-
ments from the outer surface throughout the inner
dentin, two line analyses with a 120-μm span were
performed perpendicular to the outer root surface
(Figure 2). The spot measurements at 1-μm-pixel
intervals were obtained from the observation areas
(surface layer, demineralized layer, and sound
dentin) which were identified in SEM images. Each
measurement within the observation area was
summed and averaged into a single value for analy-
sis. The unit of value was the intensity of the charac-
teristic x-ray per 200 msec, which indicated the rela-
tive weight of each element. A fluorapatite crystal
(3.38% fluoride) was used as a standard for Ca, P,
and F. Operating conditions for both the image and
elemental analyses of EDS were 15 kV of accelerat-
ing voltage and 50 nA of beam current.
CLSM analysis
Six premolars were de-coronated, and the root seg-
ments were mesiodistally sectioned into halves. Each
buccal segment had a window of 3 mm × 4 mm pro-
Table 1. Classification of experimental groups
Experimental Sequence
Group (treatment regimen) Subgroup pH cycling Varnish pH cycling
I application II
A (no acid challenge) Ao (no varnish) - - -
Av (varnish) - + -
B (acid challenge before varnish application) Bo (no varnish) + - -
Bv (varnish) + + -
C (acid challenge after varnish application) Co (no varnish) - - +
Cv (varnish) - + +
D (acid challenge before and after varnish application) Do (no varnish) + - +
Dv (varnish) + + +
293
Basic research
JKACD Volume 36, Number 4, 2011 Fluoride varnish on initiated root caries
duced via application of nail varnish. The windows
were coated with 0.4 mL of Fluor Protector mixed
with 10 ppm by weight of propidium iodide
(Calbiochem, San Diego, CA, USA). After storage in
100% humidity for 24 hours at 37℃, the varnish
layer was pulled off. The specimens were mounted,
sectioned, and polished in the same way as for the
SEM/EDS analysis. The polished surfaces were
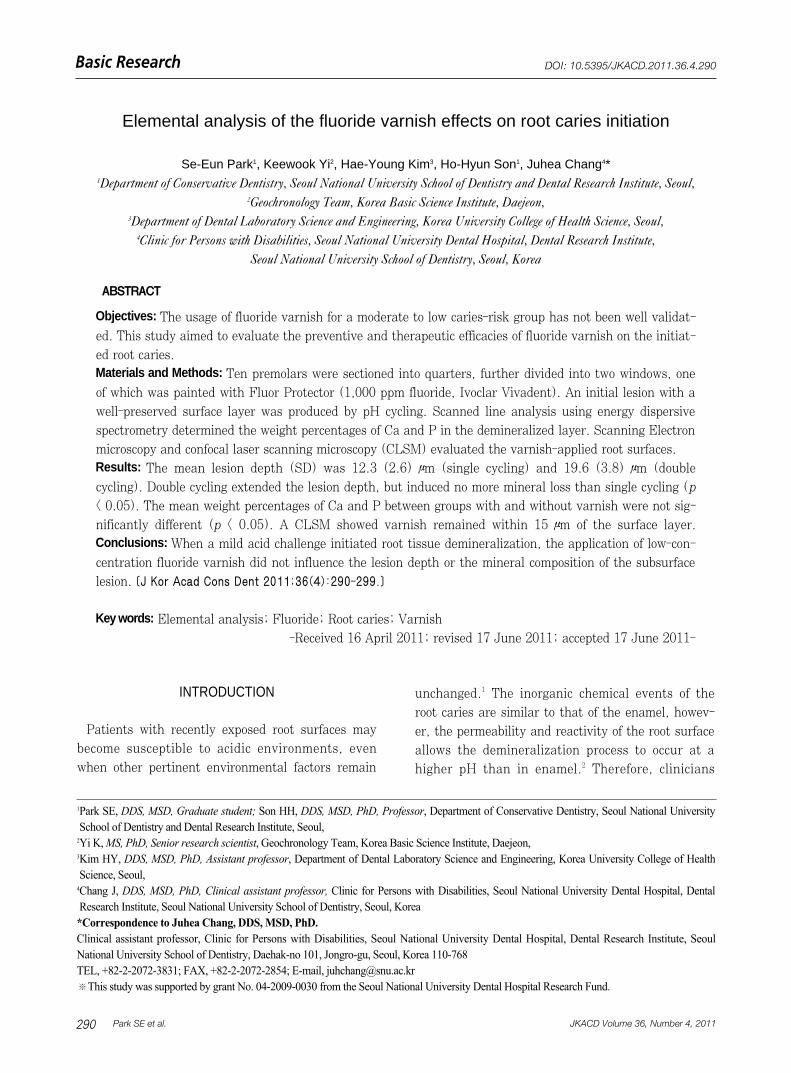
Figure 1. Specimen preparation. (a) The tooth was
embedded in acrylic resin followed by crown removal.
The coronal root was sectioned into quarters. (b) Two 4
mm × 1 mm windows were created by nail varnish
coating. Fluoride varnish was applied to one window (v),
while the other window (o) had no varnish application.
(c) Specimens were embedded in epoxy resin. (d) The
epoxy resin block was horizontally cross-sectioned in the
midline of specimens and polished to expose the
observation surface. The dark arrows were drawn on the
surface of the specimen to distinguish the varnish
applied windows (v) from the no-varnish applied
windows (o).
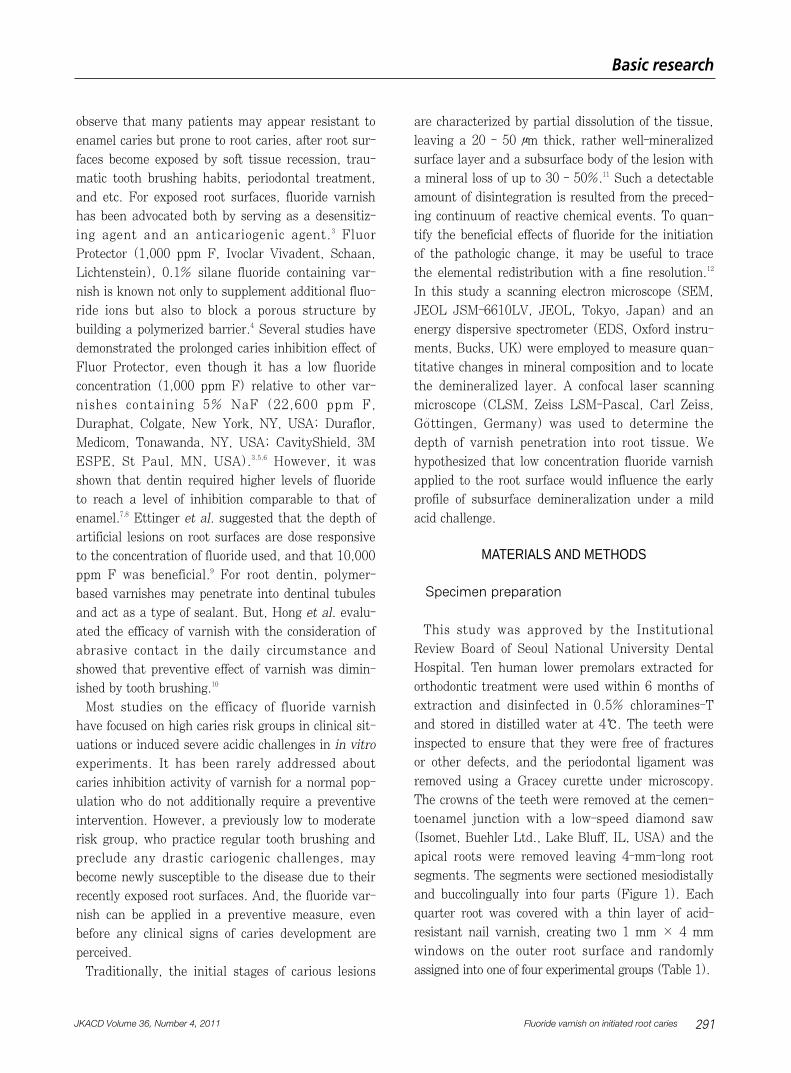
Figure 2. SEM images of 2 specimens produced from a single tooth (×600). Elemental analysis along the scan line illustrates
the differentiated elemental composition. (a) Group Ao. No demineralization band appeared. (b) Group Do. Repeated
demineralization bands were produced from a double pH cycling. Note that Ca and P levels dropped in the demineralized
layer. C (carbon) level was elevated at the same area. It was assumed that diamond particles of polishing paste were
impregnated in a porous structure. Other elements were detected by a small amount, which was at an insignificant level.
(a) (b)
(c) (d)
(a) (b)
294
Basic research
Park SE et al. JKACD Volume 36, Number 4, 2011
examined with CLSM using a C-Apochromal ×40
water lens with an additional ×40 objective lens and
×2 digital zoom (×800 total magnification). A
He/Ne G laser was used with an excitation band at
543 nm wavelength and a 560 nm-long pass filter.
Statistical analysis
The Ca and P contents in the sound dentin were
set to 100%, and the loss of the contents in the sur-
face layer and in the demineralized layer were calcu-
lated as a % (Table 3, Figure 2). The distribution of
caries lesion depth and weight loss of Ca and P in
percentages were found to be approximately normally
distributed using the Shapiro-Wilk test (p > 0.05).
To compare the mean lesion depth between single
and double pH cycling groups, the analysis of vari-
ance (ANOVA) with the Tukey’s multiple compari-
son method was used. The mean weight percentages
of Ca and P between the with and without varnish
groups were compared using the paired t-test. Based
on the evaluation of the SEM images of the speci-
mens in the Group Ao, five teeth were assigned to
the thick-cementum group and five teeth were
assigned to the thin-cementum group. The mean
weight percentages of Ca and P between thick- and
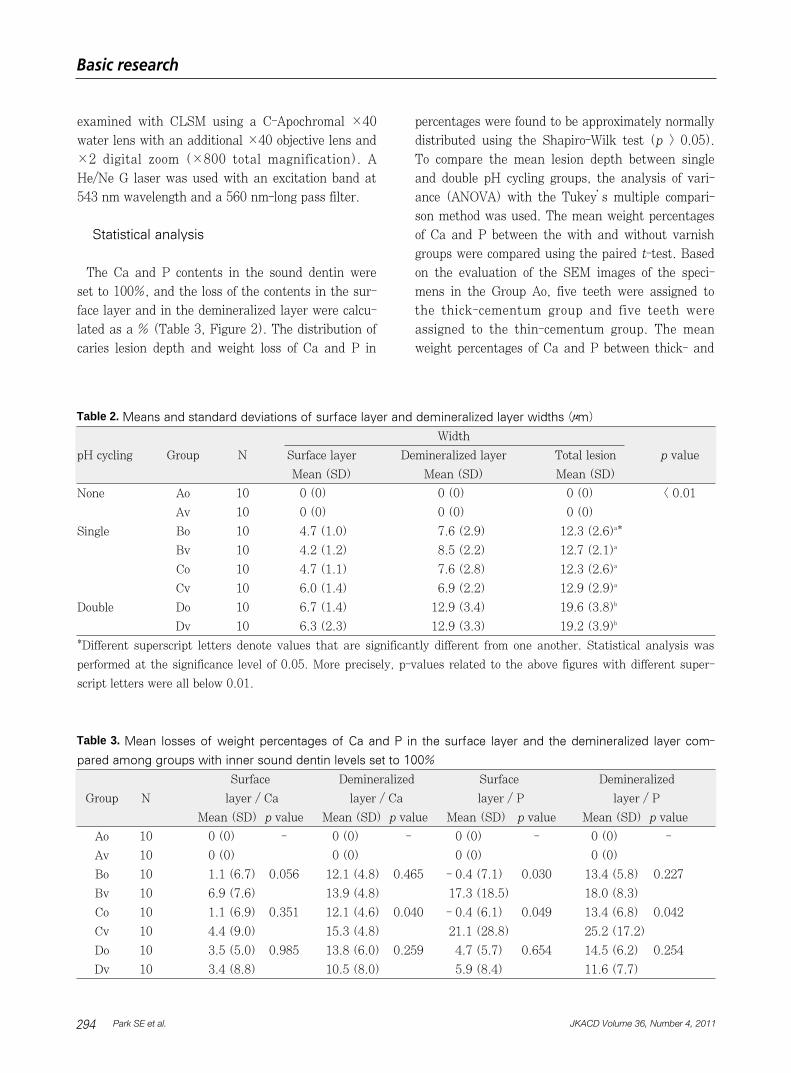
Table 2. Means and standard deviations of surface layer and demineralized layer widths (μm)
Width
pH cycling Group N Surface layer Demineralized layer Total lesion p value
Mean (SD) Mean (SD) Mean (SD)
None Ao 10 0 (0) 0 (0) 0 (0) < 0.01
Av 10 0 (0) 0 (0) 0 (0)
Single Bo 10 4.7 (1.0) 7.6 (2.9) 12.3 (2.6)a*
Bv 10 4.2 (1.2) 8.5 (2.2) 12.7 (2.1)a
Co 10 4.7 (1.1) 7.6 (2.8) 12.3 (2.6)a
Cv 10 6.0 (1.4) 6.9 (2.2) 12.9 (2.9)a
Double Do 10 6.7 (1.4) 12.9 (3.4) 19.6 (3.8)b
Dv 10 6.3 (2.3) 12.9 (3.3) 19.2 (3.9)b
*Different superscript letters denote values that are significantly different from one another. Statistical analysis was
performed at the significance level of 0.05. More precisely, p-values related to the above figures with different super-
script letters were all below 0.01.
Table 3. Mean losses of weight percentages of Ca and P in the surface layer and the demineralized layer com-
pared among groups with inner sound dentin levels set to 100%
Surface Demineralized Surface Demineralized
Group N layer / Ca layer / Ca layer / P layer / P
Mean (SD) p value Mean (SD) p value Mean (SD) p value Mean (SD) p value
Ao 10 0 (0) - 0 (0) - 0 (0) - 0 (0) -
Av 10 0 (0) 0 (0) 0 (0) 0 (0)
Bo 10 1.1 (6.7) 0.056 12.1 (4.8) 0.465 - 0.4 (7.1) 0.030 13.4 (5.8) 0.227
Bv 10 6.9 (7.6) 13.9 (4.8) 17.3 (18.5) 18.0 (8.3)
Co 10 1.1 (6.9) 0.351 12.1 (4.6) 0.040 - 0.4 (6.1) 0.049 13.4 (6.8) 0.042
Cv 10 4.4 (9.0) 15.3 (4.8) 21.1 (28.8) 25.2 (17.2)
Do 10 3.5 (5.0) 0.985 13.8 (6.0) 0.259 4.7 (5.7) 0.654 14.5 (6.2) 0.254
Dv 10 3.4 (8.8) 10.5 (8.0) 5.9 (8.4) 11.6 (7.7)
295
Basic research
JKACD Volume 36, Number 4, 2011 Fluoride varnish on initiated root caries
thin-cement groups were evaluated using an inde-
pendent t-test. A p value of 0.05 was selected as the
threshold for statistical significance. Analyses were
performed using SPSS version 12.0 statistical soft-
ware (SPSS Inc., Chicago, IL, USA).
RESULTS
SEM exhibited demineralization band formation
underneath root surfaces that had undergone pH
cycling (groups B, C and D), while such demineral-
ization was not observed in group A (Figure 2). The
average lesion depth (SD) in the single pH cycling
groups (groups B and C) was 12.5 (2.5) μm, signifi-
cantly smaller than the average lesion depth in the
double pH cycling group (group D), 19.4 (3.8) μm (p
< 0.05, Table 2). There were no significant differ-
ences in lesion depths between subgroups o (no var-
nish) and v (varnish) within each group (p < 0.05).
In group A, no changes in the Ca and P contents
from the outer surface to the inner dentin depth of
120 μm were distinguishable, and the loss was set to
0%. In the surface layer, between the varnish and no
varnish groups (Ao/Av, Bo/Bv, Co/Cv and Do/Dv),
there were no significant differences in Ca content (p
< 0.05). But, Bv and Cv had significantly higher P
loss, as compared with each counterpart (Bo and Co)
(p < 0.05). In the demineralized layer, the Ca and P
contents significantly decreased in all groups except
group A (p < 0.05). These patterns of elemental
change were concordant with the microscopic images
(Figure 2). The average Ca loss (SD) was 13.4
(4.8)% in the single pH cycling groups (groups B and
C) and 12.7 (7.1)% in the double pH cycling group
(group D). The average P loss (SD) was 17.5
(11.1)% in the single pH cycling group and 13.0
(7.0) % in the double pH cycling group. There were
no significant differences in Ca and P loss between
the single pH cycling and the double pH cycling
groups (p < 0.05). Between the varnish and no var-
nish groups, Ca and P loss were significantly higher
in Cv than in Co in the demineralized layer (p < 0.05).
The mean thickness (SD) of cementum was 38.4
(18.8) μm in the thick-cementum group and 2.8
(4.4) μm in the thin-cementum group. There were no
significant differences in lesion depth or in Ca and P
contents between the thick-cementum group and the
thin-cementum group (p < 0.05) (Table now shown).
The teeth from the thick-cementum group had a
demineralized layer within the cementum layer
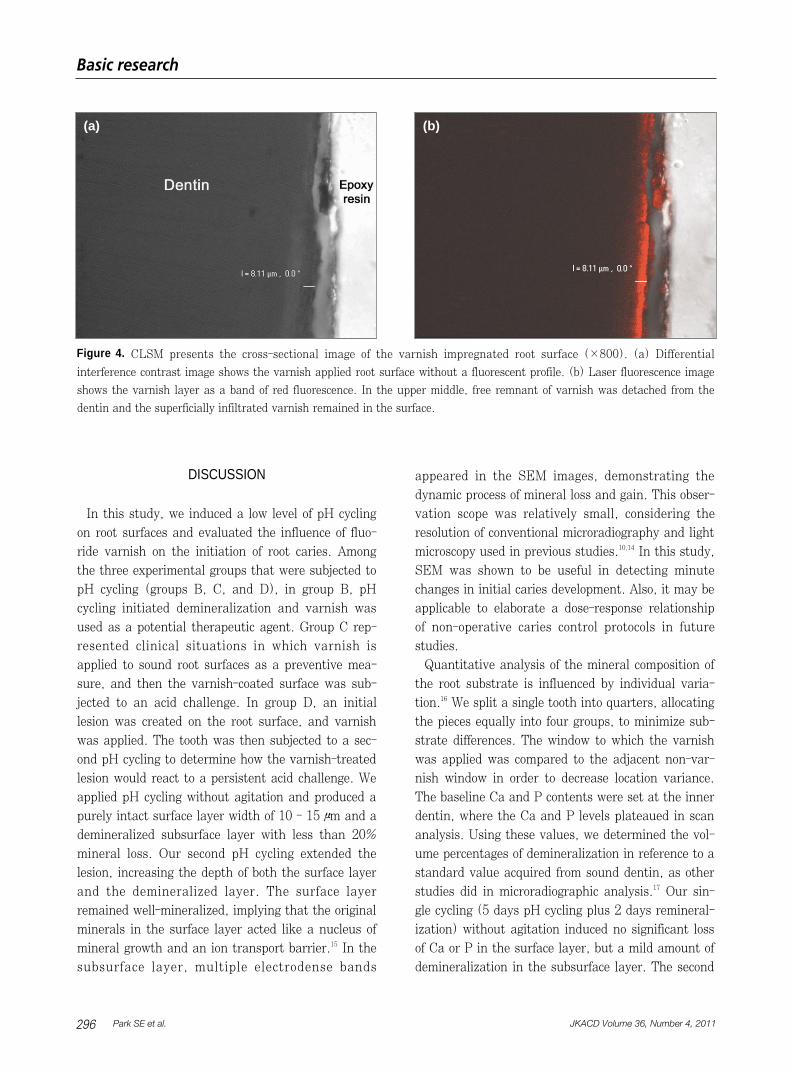
(Figure 3). An image of the varnish applied to the
root surface is shown in Figure 4. Varnish impregna-
tion into the root surface is represented by the red
fluorescent band. The depth of impregnation did not
exceed 15 μm in any specimen.
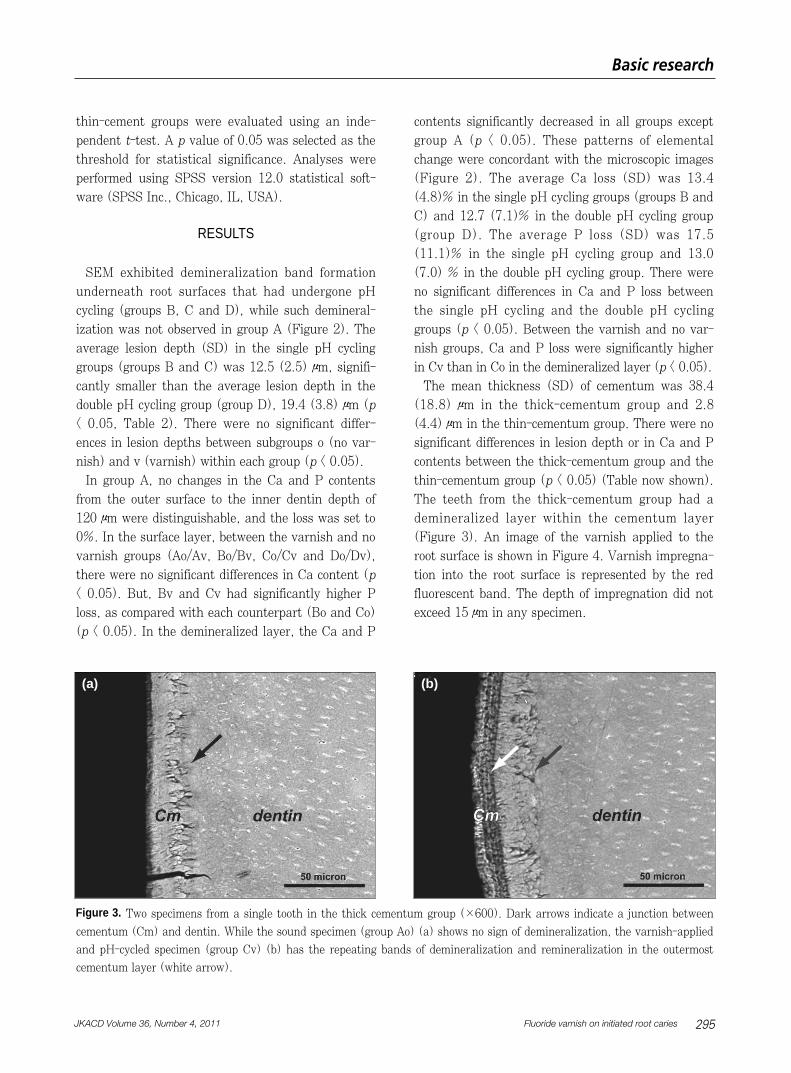
Figure 3. Two specimens from a single tooth in the thick cementum group (×600). Dark arrows indicate a junction between
cementum (Cm) and dentin. While the sound specimen (group Ao) (a) shows no sign of demineralization, the varnish-applied
and pH-cycled specimen (group Cv) (b) has the repeating bands of demineralization and remineralization in the outermost
cementum layer (white arrow).
(a) (b)
296
Basic research
Park SE et al. JKACD Volume 36, Number 4, 2011
DISCUSSION
In this study, we induced a low level of pH cycling
on root surfaces and evaluated the influence of fluo-
ride varnish on the initiation of root caries. Among
the three experimental groups that were subjected to
pH cycling (groups B, C, and D), in group B, pH
cycling initiated demineralization and varnish was
used as a potential therapeutic agent. Group C rep-
resented clinical situations in which varnish is
applied to sound root surfaces as a preventive mea-
sure, and then the varnish-coated surface was sub-
jected to an acid challenge. In group D, an initial
lesion was created on the root surface, and varnish
was applied. The tooth was then subjected to a sec-
ond pH cycling to determine how the varnish-treated
lesion would react to a persistent acid challenge. We
applied pH cycling without agitation and produced a
purely intact surface layer width of 10 - 15 μm and a
demineralized subsurface layer with less than 20%
mineral loss. Our second pH cycling extended the
lesion, increasing the depth of both the surface layer
and the demineralized layer. The surface layer
remained well-mineralized, implying that the original
minerals in the surface layer acted like a nucleus of
mineral growth and an ion transport barrier.15 In the
subsurface layer, multiple electrodense bands
appeared in the SEM images, demonstrating the
dynamic process of mineral loss and gain. This obser-
vation scope was relatively small, considering the
resolution of conventional microradiography and light
microscopy used in previous studies.10,14 In this study,
SEM was shown to be useful in detecting minute
changes in initial caries development. Also, it may be
applicable to elaborate a dose-response relationship
of non-operative caries control protocols in future
studies.
Quantitative analysis of the mineral composition of
the root substrate is influenced by individual varia-
tion.16 We split a single tooth into quarters, allocating
the pieces equally into four groups, to minimize sub-
strate differences. The window to which the varnish
was applied was compared to the adjacent non-var-
nish window in order to decrease location variance.
The baseline Ca and P contents were set at the inner
dentin, where the Ca and P levels plateaued in scan
analysis. Using these values, we determined the vol-
ume percentages of demineralization in reference to a
standard value acquired from sound dentin, as other
studies did in microradiographic analysis.17 Our sin-
gle cycling (5 days pH cycling plus 2 days remineral-
ization) without agitation induced no significant loss
of Ca or P in the surface layer, but a mild amount of
demineralization in the subsurface layer. The second
Figure 4. CLSM presents the cross-sectional image of the varnish impregnated root surface (×800). (a) Differential
interference contrast image shows the varnish applied root surface without a fluorescent profile. (b) Laser fluorescence image
shows the varnish layer as a band of red fluorescence. In the upper middle, free remnant of varnish was detached from the
dentin and the superficially infiltrated varnish remained in the surface.
(a) (b)
297
Basic research
JKACD Volume 36, Number 4, 2011 Fluoride varnish on initiated root caries
cycle only increased the total width of the reactive
zone, i.e. in both the surface layer and the subsur-
face demineralized layer. And Ca and P contents
were at levels similar to those following the first
cycling. We were interested in determining how fluo-
ride would affect the surface-preserved demineralized
lesion. On mineral-dissolved enamel and dentin, flu-
oride promotes the formation of fluoridated hydroxya-
patite. However, a well-preserved surface layer may
block ion transport to the deeper lesion, and the fluo-
ride-driven remineralization process may not occur as
readily as in lesions with a mineral-deficient surface
layer.15 In our study, no additional remineralizing
patterns were demonstrated in the varnish sub-
groups of all three experimental groups. In other
way, it was shown that varnish application dissolved
more P from the surface layer in groups B and C and
more Ca and P from the demineralized layer in group
C (p < 0.05). Acidulated fluoride solutions dissolve
enamel slightly and deposit substantial amounts of
calcium fluoride on the tooth surface.18 Similarly, the
acidic Fluor Protector (pH 2.5, measured in our
study) reacts with dentin which has half the mineral
content of enamel.19 The erosive changes from the
acidic nature seemed to be recovered by further pH
cycling. The levels of Ca and P were regained by the
second cycling, and the Dv group did not show a sig-
nificant difference from the Do group (p < 0.05).
SEM demonstrated the unique profiles of cementum
and dentin, although their elemental distribution did
not differ (Figure 3). Since cementum naturally has
the same mineral distribution as dentin, its deminer-
alization pattern may not be different.2,20 Our analy-
sis supported the claim that cemental caries under-
went a change in elemental composition similar to
that of dentin caries.
We intentionally removed the varnish layer to cre-
ate mechanical wearing that occurs after a certain
period of time in an oral environment, and to simu-
late the appropriately brushed root surfaces of a low
risk population. The peeled-off varnish layer may
still be effective if the varnish had penetrated into
porosities and remained as impregnated remnants.
Fluor Protector has a thin consistency and good wet-
ting effect on both dry and hydrated dentin sub-
strates.21 However, using CLSM, Arends et al.
showed that retention of Fluor Protector was limited
to the outer surface, which is similar to other varnish
products.21 They applied the varnish on the surface-
softened lesions and produced a barrier with a thick-
ness of 10 μm, which was consistent with our obser-
vations of the surface-preserved lesions. We attempt-
ed to detect any increased levels of fluoride in the
surface zone, but were unable to do so, likely due to
the low content level. Most studies using Fluor
Protector employed a relatively severe acid challenge,
resulting in some amount of surface disintegration,
which may be more relevant to a high caries risk
population.3,5,6 In a high risk situation, the physical
presence of the varnish enhances the redistribution
of ions in the body of the caries lesion by creating a
favorable gradient for inward fluoride diffusion and
reduces the porosity of the lesion.4 Under less severe
conditions, the surface layer is well preserved, and
an additional varnish barrier may not be advanta-
geous. Silane, a bifunctional coupling agent with
hydrophilic functional groups, is not stable in a
hydrous environment.22 A silane-based varnish may
be as permeable as other polymerizable dentin adhe-
sives and may provide an ion passage into the sub-
surface area. Our results were in accordance with
those of a previous study that demonstrated that
sound dentin with Fluor Protector applied was affect-
ed equally by pH cycling, relative to dentin without
varnish.23
Recently, the use of not only fluoride varnish but
also fluoride containing dentin adhesives and desen-
sitizing agents have been advocated to protect root
dentin from caries formation. The submicron level
elemental analyses may be applicable to the quantifi-
cation of anticarious activities afforded by physical
protection of a film barrier and by the chemicothera-
peutic effect of fluoride ions. Within the limits of this
in vitro study, silane-based fluoride varnish did not
affect demineralization patterns produced under a
mild acid challenge. Varnish was restricted to the
intact surface layer and did not penetrate into the
subsurface area where mineral loss occurred.
REFERENCES
1. Heijnsbroek M, Paraskevas S, Van der Weijden GA.
298
Basic research
Park SE et al. JKACD Volume 36, Number 4, 2011
Fluoride interventions for root caries: a review. OralHealth Prev Dent 2007;5:145-152.
2. Hoppenbrouwers PM, Driessens FC, Borggreven JM.The mineral solubility of human tooth roots. Arch OralBiol 1987;32:319-322.
3. Beltran-Aguilar ED, Goldstein JW, Lockwood SA.Fluoride varnishes. A review of their clinical use, car-iostatic mechanism, efficacy and safety. J Am DentAssoc 2000;131:589-596.
4. Strohmenger L, Brambilla E. The use of fluoride var-nishes in the prevention of dental caries: a shortreview. Oral Dis 2001;7:71-80.
5. Petersson LG, Twetman S, Dahlgren H, Norlund A,Holm AK, Nordenram G, Lagerlof F, Soder B, Kallesta�l C,Meja`re I, Axelsson S, Lingstrom P. Professional fluo-ride varnish treatment for caries control: a systematicreview of clinical trials. Acta Odontol Scand 2004;62:170-176.
6. Weintraub JA. Fluoride varnish for caries prevention:comparisons with other preventive agents and recom-mendations for a community-based protocol. Spec CareDentist 2003;23:180-186.
7. Damen JJ, Buijs MJ, ten Cate JM. Fluoride-dependentformation of mineralized layers in bovine dentin duringdemineralization in vitro. Caries Res 1998;32:435-440.
8. Herkstroter FM, Witjes M, Arends J. Demineralizationof human dentine compared with enamel in a pH-cycling apparatus with a constant composition duringde- and remineralization periods. Caries Res 1991;25:317-322.
9. Ettinger RL, Olson RJ, Wefel JS, Asmussen C. In vitroevaluation of topical fluorides for overdenture abut-ments. J Prosthet Dent 1997;78:309-314.
10.Hong L, Watkins CA, Ettinger RL, Wefel JS. Effect oftopical fluoride and fluoride varnish on in vitro rootsurface lesions. Am J Dent 2005;18:182-187.
11.Ole Fejerskov EK, Edwina Kidd, Benten Yvad, andVibeke Baelum. Dental caries: the disease and its clin-ical management. 2nd ed. Oxford, UK: Wiley-Blackwell; 2008.
12. Arnold WH, Cerman M, Neuhaus K, Gaengler P.
Volumetric assessment and quantitative elementanalysis of the effect of fluoridated milk on enameldemineralization. Arch Oral Biol 2003;48:467-473.
13. Rehder Neto FC, Maeda FA, Turssi CP, Serra MC.Potential agents to control enamel caries-like lesions. JDent 2009;37:786-790.
14.Hara AT, Queiroz CS, Freitas PM, Giannini M, SerraMC, Cury JA. Fluoride release and secondary cariesinhibition by adhesive systems on root dentine. Eur JOral Sci 2005;113:245-250.
15. Kawasaki K, Ruben J, Tsuda H, Huysmans MC,Takagi O. Relationship between mineral distributionsin dentine lesions and subsequent remineralization invitro. Caries Res 2000;34:395-403.
16. Rex T, Kharbanda OP, Petocz P, Darendeliler MA.Physical properties of root cementum: Part 4.Quantitative analysis of the mineral composition ofhuman premolar cementum. Am J Orthod DentofacialOrthop 2005;127:177-185.
17. Lee C, Darling CL, Fried D. Polarization-sensitiveoptical coherence tomographic imaging of artificialdemineralization on exposed surfaces of tooth roots.Dent Mater 2009;25:721-728.
18. Arends J, Christoffersen J. Nature and role of looselybound fluoride in dental caries. J Dent Res 1990;69Spec No:601-5;discussion 634-636.
19.Wefel JS. Root caries histopathology and chemistry.Am J Dent 1994; 7:261-265.
20. Smith PW, Preston KP, Higham SM. Development ofan in situ root caries model. A. In vitro investigations.J Dent 2005;33:253-267.
21. Arends J, Duschner H, Ruben JL. Penetration of var-nishes into demineralized root dentine in vitro. CariesRes 1997;31:201-205.
22.Monticelli F, Osorio R, Tay FR, Sadek FT, Ferrari M,Toledano M. Resistance to thermo-mechanical stress ofdifferent coupling agents used as intermediate layer inresin-fiber post bonds. Am J Dent 2007;20:416-420.
23. Scholtanus JD, Schuthof J, Arends J. Influence of fluo-ridating varnishes on dentine in vitro. Caries Res1986;20:65-70.
299299
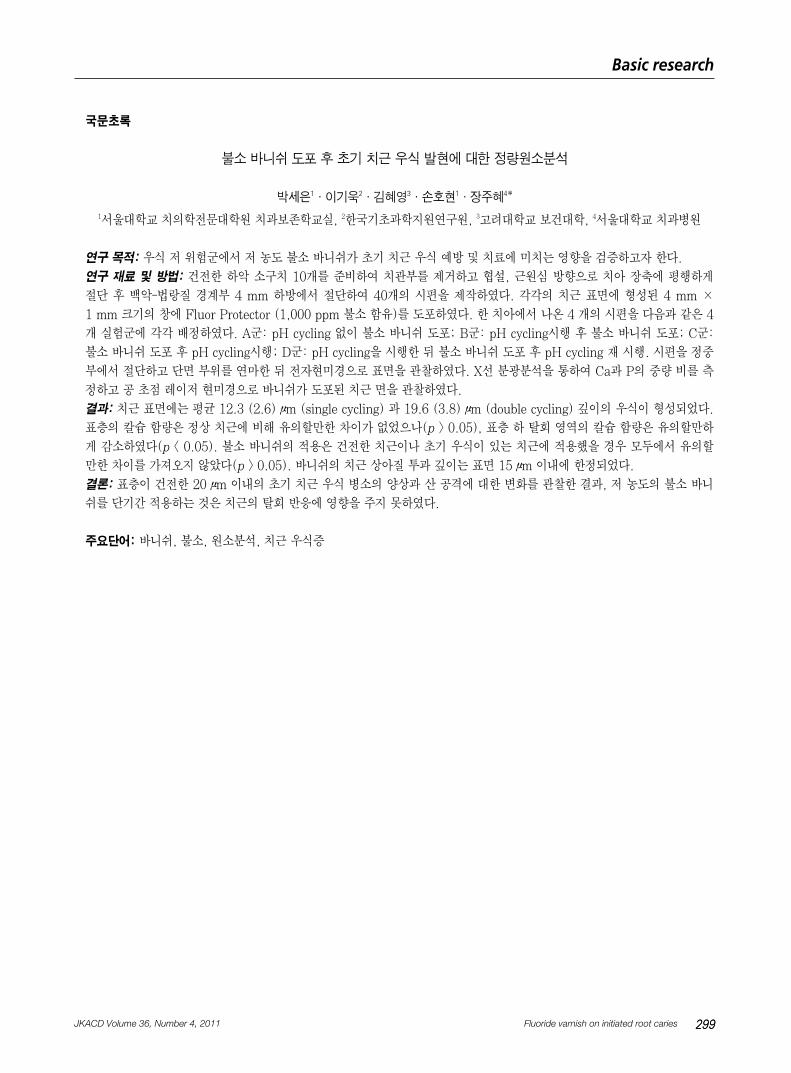
국문초록
불소 바니쉬 도포 후 초기 치근 우식 발현에 한 정량원소분석
박세은1∙이기욱2∙김혜 3∙손호현1∙장주혜4*
1서울 학교 치의학전문 학원 치과보존학교실, 2한국기초과학지원연구원, 3고려 학교 보건 학, 4서울 학교 치과병원
연구 목적: 우식 저 위험군에서 저 농도 불소 바니쉬가 초기 치근 우식 예방 및 치료에 미치는 향을 검증하고자 한다.
연구 재료 및 방법: 건전한 하악 소구치 10개를 준비하여 치관부를 제거하고 협설, 근원심 방향으로 치아 장축에 평행하게
절단 후 백악-법랑질 경계부 4 mm 하방에서 절단하여 40개의 시편을 제작하 다. 각각의 치근 표면에 형성된 4 mm ×
1 mm 크기의 창에 Fluor Protector (1,000 ppm 불소 함유)를 도포하 다. 한 치아에서 나온 4 개의 시편을 다음과 같은 4
개 실험군에 각각 배정하 다. A군: pH cycling 없이 불소 바니쉬 도포; B군: pH cycling시행 후 불소 바니쉬 도포; C군:
불소 바니쉬 도포 후 pH cycling시행; D군: pH cycling을 시행한 뒤 불소 바니쉬 도포 후 pH cycling 재 시행. 시편을 정중
부에서 절단하고 단면 부위를 연마한 뒤 전자현미경으로 표면을 관찰하 다. X선 분광분석을 통하여 Ca과 P의 중량 비를 측
정하고 공 초점 레이저 현미경으로 바니쉬가 도포된 치근 면을 관찰하 다.
결과: 치근 표면에는 평균 12.3 (2.6) μm (single cycling) 과 19.6 (3.8) μm (double cycling) 깊이의 우식이 형성되었다.
표층의 칼슘 함량은 정상 치근에 비해 유의할만한 차이가 없었으나(p > 0.05), 표층 하 탈회 역의 칼슘 함량은 유의할만하
게 감소하 다(p < 0.05). 불소 바니쉬의 적용은 건전한 치근이나 초기 우식이 있는 치근에 적용했을 경우 모두에서 유의할
만한 차이를 가져오지 않았다(p > 0.05). 바니쉬의 치근 상아질 투과 깊이는 표면 15 μm 이내에 한정되었다.
결론: 표층이 건전한 20 μm 이내의 초기 치근 우식 병소의 양상과 산 공격에 한 변화를 관찰한 결과, 저 농도의 불소 바니
쉬를 단기간 적용하는 것은 치근의 탈회 반응에 향을 주지 못하 다.
주요단어: 바니쉬, 불소, 원소분석, 치근 우식증
Basic research
JKACD Volume 36, Number 4, 2011 Fluoride varnish on initiated root caries
Recommended