S1
Electronic Supplementary Information (ESI)
Fluorescence sensing ADP over ATP and PPi in 100% aqueous solution
Feihu Huang, Gefei Hao, Fengxu Wu, Guoqiang Feng*
Key Laboratory of Pesticide and Chemical Biology of Ministry of Education, College of Chemistry,
Central China Normal University, Wuhan 430079, P.R. China,
Table of contents:
1. General Experimentals………………………………………………………………… Page S2
2. Synthesis of ZnL……………………………………………………………………………………… Page S3
3. Additional Spectra and Data…………………………………………………………………Page S9
4. Quantum Mechanical Calculations…………………………………………………………Page S17
Electronic Supplementary Material (ESI) for Analyst.This journal is © The Royal Society of Chemistry 2015
S2
1. General Experimentals.
Starting materials were purchased from commercial suppliers and were used
without further purification. 9,10-bisaminomethylanthracene (2) and
2-Bromomethyl-6-pivalamidopyridine (3) were prepared according the previously
published methods (see below). All solvents were purified by the most used methods
before use. Distilled water was used after passing through a Millipore-Q
ultrapurification system. NMR spectra were measured on Varian Mercury 400 and
600 instruments. HR-MS data were obtained with an LC/Q-TOF MS spectrometer.
UV-vis spectra and fluorescent spectra were recorded on an Agilent Cary 100 UV-vis
spectrophotometer and an Agilent Cary Eclipse fluorescence spectrophotometer,
respectively. Both UV-vis and fluorescence spectrophotometer are equipped with a
temperature controller. Standard quartz cuvettes with a 10 mm lightpath are used for
all UV-vis spectra and fluorescent spectra measurements. Cell imaging was
performed in an inverted fluorescence microscopy with a 20× objective lens.
Fluorescent Studies of ZnL upon Addition of Analytes. For a typical optical
measurements, 3.0 mL of ZnL (5 μM) in a HEPES buffer (10 mM, pH 7.2) was
placed in a quartz cell at 25 °C. The fluorescent spectra were then recorded
immediately after addition of analytes.
The fluorescence quantum yields of ZnL, ZnL-2ADP and ZnL-2ATP were
determined to be Ф = 0.02, 0.99, and 0.50 in HEPES buffer (10 mM, pH 7.2) at 25˚C,
using quinine sulfate (Фf = 0.58 in 1N H2SO4) as standard.
Cell Culture and Imaging. HeLa cells were cultured in Dulbecco’s Modified
Eagle’s Medium (DMEM) supplemented with 10% FBS (fetal bovine serum), 100
mg/mL penicillin and 100 μg/mL streptomycin in a 5% CO2, water saturated
incubator at 37 °C. Before cell imaging experiments, HeLa cells were seeded in
12-well culture plate for one night. For living cell imaging experiments, cells were
incubated with 25 μM of ZnL for 30 min at 37 °C and washed three times with
prewarmed PBS buffer, and then imaged immediately. For apyrase treated
experiments, HeLa cells were pretreated with 5 units apyrase for 30 min at 37 °C,

S3
washed three times with prewarmed PBS buffer, and then incubated with 25 μM of
ZnL (or incubated with 125 μM of ADP for 30 min prior to addition of probe 1 for a
control experiment) for 30 min at 37 °C. Cell imaging was then carried out after
washing cells with prewarmed PBS buffer.
2. Synthesis of ZnL
Synthesis of 1: To a solution of 2s1 (236 mg, 1.00 mmol) and 3s2 (1.14 g, 4.2 mmol)
in anhydrous CH3CN (30 mL) was added K2CO3 (621 mg, 4.50 mmol). The reaction
mixture was then heated to reflux for 12 hours, and the solvent was evaporated under
reduced pressure. To the residue was added dichloromethane (60 mL), and the organic
phase was washed with water and brine followed by drying over Na2SO4. After
removal of the solvent under reduced pressure, the crude product was purified by
silica gel column (eluent: dichloromethane /methanol = 50:1 (v/v)) to give a yellow
powder (800 mg, 80% yield). Mp 116-118 ºC. 1H NMR (400 MHz, CDCl3) δ
8.41-8.39 (dd, J = 6.8, 3.2 Hz, 4H), 8.08 (s, 4H), 8.01 (d, J = 8.0 Hz, 4H), 7.50 (t, J =
8.0 Hz, 4H), 7.43 (dd, J = 6.8, 3.2 Hz, 4H), 6.98 (d, J = 7.6 Hz, 4H), 4.57 (s, 4H),
3.74 (s, 8H), 1.31 (s, 36H). 13C NMR (100 MHz, CDCl3): δ 176.99, 157.59, 150.57,
138.35, 130.97, 130.31, 125.51, 124.83, 119.07, 111.82, 60.36, 51.16, 39.70, 27.42.
IR (KBr) νmax (cm-1): 3437, 2964, 1688, 1578, 1518, 1453, 1306, 1152. HR-MS Calc.
for C60H73N10O4+ (M + H+) 997.5811, found 997.5791.

S4
42.5
1
7.97
4.00
3.83
3.85
3.78
3.94
4.03
3.97
1.31
3.74
4.57
6.97
6.99
7.27
7.41
7.42
7.43
7.44
7.48
7.50
7.52
8.00
8.02
8.08
8.39
8.40
8.41
8.41
1H NMR spectrum of 1 in CDCl3.
13C NMR spectrum of 1 in CDCl3.
N N N
N
N
N
C4H9OCHN NHCOC4H9
NHCOC4H9 C4H9OCHN
1Chemical Formula: C60H72N10O4
N N N
N
N
N
C4H9OCHN NHCOC4H9
NHCOC4H9 C4H9OCHN
1Chemical Formula: C60H72N10O4

S5
HR-MS spectrum of 1
Synthesis of L: To 600 mg of 1 was added 50 ml of 4 M KOH and CH3CH2OH 50
mL. The mixture was heated to reflux for 16 hours, and the CH3CH2OH was
evaporated under reduced pressure. The aqueous solution was then extracted with
ethyl acetate (4 × 30 mL), dried over Na2SO4, and concentrated in vacuo to yield a
brown yellow solid, 330 mg (83%). Mp 254-256ºC. 1H NMR (400 MHz, DMSO-d6)
δ 8.52 (s, 4H), 7.48 (s, 4H), 7.30-7.31 (d, J = 4.0 Hz, 4H), 6.54-6.56 (d, J = 8.0 Hz,
4H), 6.26-6.28 (d, J = 8.0 Hz, 4H), 5.82 (s, 8H), 4.52 (s, 4H), 3.52 (s, 8H). 13C
NMR (100 MHz, DMSO-d6) δ 159.14, 157.40, 137.33, 130.73, 125.72, 125.16,
110.61, 106.05, 59.75, 50.09. IR (KBr) νmax (cm-1): 3446, 3360, 3223, 2929, 1639,
1572, 1484, 1384, 1293, 1170, 1011, 833, 803, 764, 710; ESI-MS: m/z found
661.4 (M + H+); HR-MS Calc. for C40H41N10+ (M + H+) 661.351, found 661.351.
Elemental analysis calcd for C40H40N10: C 72.70, H 6.10, N 21.20; found: C 72.71,
H 6.037, N 21.15.
10-4_140507210122 #350 RT: 5.59 AV: 1 NL: 1.64E7T: FTMS + p ESI Full ms [50.00-2000.00]
200 400 600 800 1000 1200 1400 1600 1800 2000m/z
0
10
20
30
40
50
60
70
80
90
100R
ela
tive
Abu
nda
nce
499.29272
338.25293997.57910
171.13757
995 1000 1005m/z
997.57910
998.58228
999.58575
1000.58954

S6
1H NMR spectrum of L in DMSO-d6.
13C NMR spectrum of L in DMSO-d6.

S7
HR-MS spectrum of L
Synthesis of ZnL: To a solution of L (33 mg, 0.05 mmol) in 5 mL of MeOH, was
added Zn(NO3)2·6H2O (33 mg, 0.11 mmol), and the mixture was stirred for 1 h at
rt. After concentrating under reduced pressure, the obtained solid was
recrystallized from MeOH to afford ZnL (41mg, 81%). Mp >300 ºC. 1H NMR
(400 MHz, DMSO): 8.08(s, 4H), 7.61(s, 4H), 7.54 (s, 4H), 6.93 (s, 8H), 6.72 (d, J
= 7.8 Hz, 4H), 6.28 (s, 4H), 4.93 (s, 4H), 3.51-3.26 (m, 8H). 13C NMR (100 MHz,
DMSO) δ 169.58, 161.69, 150.68, 142.06, 141.77, 136.35, 135.71, 122.00, 120.91,
66.88, 61.71. IR (KBr) νmax (cm-1): 3446, 3360, 1639, 1572, 1484, 1384, 1293,
1170, 1011, 833, 803, 764. HR-MS Calc. for C40H40N13O9Zn2+ [M-NO3
-]+
974.1649, found 974.1953. Elemental analysis calcd for C40H40N10Zn2(NO3)4·H2O:
C 45.43, H 4.00, N 18.54; found: C 45.52, H 3.91, N 18.75.

S8
1H NMR spectrum of ZnL in DMSO-d6.
13C NMR spectrum of ZnL in DMSO-d6.

S9
10-5-1 #47 RT: 0.21 AV: 1 NL: 2.41E7T: FTMS + p ESI Full ms [166.70-2500.00]
960 970 980 990 1000 1010 1020 1030 1040m/z
0
10
20
30
40
50
60
70
80
90
100
Rel
ativ
e A
bun
dan
ce
975.1871
973.1860
971.1884979.5048
954.3021
956.3022
981.5040
1007.53721020.2109958.2998 983.5020
1016.2151
1009.5373
968.21531022.2117
991.1947
960.3004
p [ ]
968 970 972 974 976 978m/z
975.1871
973.1860
971.1884
972.1957974.1953 977.1876
976.1974970.2146
979.1
978.1894968.2153
969.2185
N N N
N
N
N
H2N NH2
NH2 H2N
Zn2+ Zn2+
ZnL-NO3-
3NO3-
Chemical Formula: C40H40N13O9Zn2+
Exact Mass: 974.1649
HR-MS spectrum of ZnL
(S1) Gassensmith, J. J.; Arunkumar, E.; Barr, L.; Baumes, J. M.; DiVittorio, K. M.; Johnson, J.
R.; Noll, B. C.; Smith, B. D. J. Am. Chem. Soc. 2007, 129, 15054–15059.
(S2) Livieri, M.; Mancin, F.; Tonellato, U.; Chin, J.; Cowley, A. Chem. Commun. 2008,
392–394.
3. Additional Spectra and Data
ATP ADPZnL AMP PPi
Figure S1. Fluorescence colour (under 365 nm light) changes of ZnL (5 µM) in 10 mM aqueous
HEPES buffer solution (pH = 7.2) with 50 µM of different anions (from left to right: none, ATP, ADP,
AMP, PPi, Citrate, PO43−, HPO4
2−, H2PO4−, F−, Cl−, Br−, I−, ClO4
−, CO32−, HCO3
−, NO3−, NO2
−, AcO−,
N3−, SO4
2−, HSO4−, SCN−, S2O7
2−, S2−, S2O32−).

S10
5 6 7 8 9 100
200
400
600
800
1000
ZnL
ZnL + ATP
ZnL + ADP
Inte
nsi
ty (
416
nm
)pH
Figure S2. The effect of pH on the fluorescence intensity changes of ZnL (5 µM) in the absence and in
the presence of ATP (50 µM) or ADP (50 µM) at 25˚C. ex = 380 nm, dem = dex = 5 nm.
400 450 500 550 600 650 7000
200
400
600
800
1000
none, GMP, UMP, CMP
GDP, GTP, UTP, UDP, CTP, CDP
Flu
ore
sce
nt
Inte
nsi
ty
Wavelength(nm)
ADP
(a)
0
20
40
60
80
100
120
140
I/I
0 (41
6 n
m)
CM
P
CD
P
CTP
UM
P
UD
P
UTP
GM
P
GDP
GTP
AD
P
none
(b)
Figure S3. Left: Fluorescence emission spectra of ZnL(5 M) in the presence of various nucleotides
(50 M); Right: A plot of the relative fluorescent intensity (I/I0) of ZnL (5 µM) at 416 nm against
50 M of different nucleotides (from left to right: none, ADP, GTP, GDP, GMP, UTP, UDP, UMP, CTP,
CDP, CMP). ex = 380 nm, dem = dex = 5 nm.
Figure S4. Fluorescence colour (under a 365 nm light) changes of ZnL (5 µM) in 10 mM aqueous
HEPES buffer solution (pH = 7.2) with 50 µM of different anions (from left to right: none, ATP, ADP,
AMP, GTP, GDP, GMP, UTP, UDP, UMP, CTP, CDP, CMP).

S11
400 450 500 550 600 650 7000
30
60
90
120
150
180
[AMP]
1250 M
Inte
nsi
ty
Wavelength(nm)
0 M
0 200 400 600 800 1000 1200 1400
0
20
40
60
80
100
120
140
160
180
200
Inte
nsi
ty(4
30n
m)
[AMP] M
Figure S5. Left: Fluorescent titration of complex ZnL (5 M) upon the addition of AMP (0-1250 M)
in HEPES buffer (10 mM, pH = 7.2) solution at 25˚C; Right: The saturation curve of
fluorescent intensity changes at 430 nm. ex = 380 nm, dem = dex = 5 nm.
400 450 500 550 600 650 7000
20
40
60
80
100
120
140
Inte
ns
ity
Wavelength(nm)
[CTP]
50 M
0 M
0 10 20 30 40 50
0
20
40
60
80
100
120
Inte
nsi
ty(4
30
nm
)
[CTP] M
Figure S6. Left: Fluorescent titration of complex ZnL (5 M) upon the addition of CTP (0-50 M)
in HEPES buffer (10 mM, pH = 7.2) solution at 25˚C; Right: The saturation curve of
fluorescent intensity changes at 430 nm. ex = 380 nm, dem = dex = 5 nm.
400 450 500 550 600 650 7000
40
80
120
160
200
Inte
nsi
ty
Wavelength(nm)
[CDP]
50 M
0 M
0 10 20 30 40 50
0
20
40
60
80
100
120
140
160
Inte
nsi
ty(4
30
nm
)
[CDP] M
Figure S7. Left: Fluorescent titration of complex ZnL (5 M) upon the addition of CDP (0-50 M)
in pH = 7.2, 10 mM HEPES buffer solution at 25˚C; Right: The saturation curve of
fluorescent intensity changes at 430 nm. ex = 380 nm, dem = dex = 5 nm.

S12
400 450 500 550 600 650 7000
6
12
18
24
30
Inte
nsi
tyWavelength(nm)
CMP
Figure S8. Fluorescent titration of complex ZnL (5 M) upon the addition of CMP (0-150 M)
in HEPES buffer (10 mM, pH = 7.2) solution at 25˚C. ex = 380 nm, dem = dex = 5 nm.
400 450 500 550 600 650 7000
15
30
45
60
75
In
ten
sit
y
Wavelength(nm)
[GTP]
50 M
0 M
0 10 20 30 40 505
10
15
20
25
30
35
40
45
50
In
ten
sity
(430
nm
)
[GTP] M
Figure S9. Left: Fluorescent titration of complex ZnL (5 M) upon the addition of GTP (0-50 M)
in HEPES buffer (10 mM, pH = 7.2) solution at 25˚C; Right: The saturation curve of
fluorescent intensity changes at 430 nm. ex = 380 nm, dem = dex = 5 nm.
400 450 500 550 600 650 7000
30
60
90
120
150
Inte
ns
ity
Wavelength(nm)
[GDP]
50 M
0 M
0 10 20 30 40 500
20
40
60
80
100
120
In
ten
sity
(430
nm
)
[GDP] M
Figure S10. Left: Fluorescent titration of complex ZnL (5 M) upon the addition of GDP (0-50 M)
in HEPES buffer (10 mM, pH = 7.2) solution at 25˚C; Right: The saturation curve of
fluorescent intensity changes at 430 nm. ex = 380 nm, dem = dex = 5 nm.

S13
400 450 500 550 600 650 7000
10
20
30
40
50
Inte
nsi
tyWavelength(nm)
GMP
Figure S11. Fluorescent titration of complex ZnL (5 M) upon the addition of GMP (0-250 M)
in HEPES buffer (10 mM, pH = 7.2) solution at 25˚C. ex = 380 nm, dem = dex = 5 nm.
400 450 500 550 600 650 7000
30
60
90
120
150
Inte
nsi
ty
Wavelength(nm)
[UTP]
100 M
0 M
0 20 40 60 80 1000
20
40
60
80
100
120
Inte
ns
ity
(43
0 n
m)
[UTP] M
Figure S12. Left: Fluorescent titration of complex ZnL (5 M) upon the addition of UTP (0-100 M)
in HEPES buffer (10 mM, pH = 7.2) solution at 25˚C; Right: The saturation curve of
fluorescent intensity changes at 430 nm. ex = 380 nm, dem = dex = 5 nm.
400 450 500 550 600 650 7000
50
100
150
200
In
ten
sity
Wavelength(nm)
[UDP]
150 M
0 M
-20 0 20 40 60 80 100 120 140 160
0
20
40
60
80
100
120
140
160
In
ten
sit
y(4
30
nm
)
[UDP] M
Figure S13. Left: Fluorescent titration of complex ZnL (5 M) upon the addition of UDP (0-150 M)
in HEPES buffer (10 mM, pH = 7.2) solution at 25˚C; Right: The saturation curve of
fluorescent intensity changes at 430 nm. ex = 380 nm, dem = dex = 5 nm.
S14
400 450 500 550 600 650 7000
10
20
30
40
50
Inte
nsi
tyWavelength(nm)
UMP
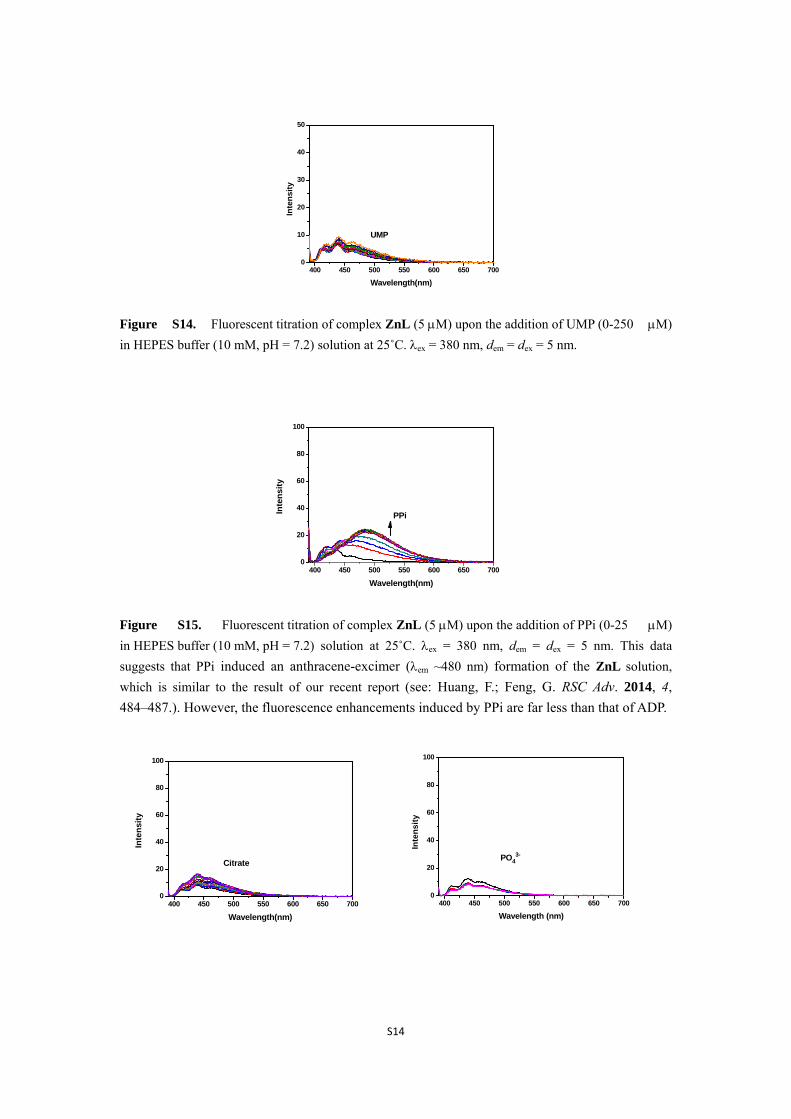
Figure S14. Fluorescent titration of complex ZnL (5 M) upon the addition of UMP (0-250 M)
in HEPES buffer (10 mM, pH = 7.2) solution at 25˚C. ex = 380 nm, dem = dex = 5 nm.
400 450 500 550 600 650 7000
20
40
60
80
100
Inte
nsi
ty
Wavelength(nm)
PPi
Figure S15. Fluorescent titration of complex ZnL (5 M) upon the addition of PPi (0-25 M)
in HEPES buffer (10 mM, pH = 7.2) solution at 25˚C. ex = 380 nm, dem = dex = 5 nm. This data
suggests that PPi induced an anthracene-excimer (em ~480 nm) formation of the ZnL solution,
which is similar to the result of our recent report (see: Huang, F.; Feng, G. RSC Adv. 2014, 4,
484–487.). However, the fluorescence enhancements induced by PPi are far less than that of ADP.
400 450 500 550 600 650 7000
20
40
60
80
100
Inte
nsi
ty
Wavelength(nm)
Citrate
400 450 500 550 600 650 7000
20
40
60
80
100
Inte
nsi
ty
PO43-
Wavelength (nm)

S15
400 450 500 550 600 650 7000
20
40
60
80
100
Inte
ns
ity
F-
Wavelength (nm)
400 450 500 550 600 650 7000
20
40
60
80
100
Inte
ns
ity
Wavelength (nm)
Cl-
Figure S16. Fluorescent titration of complex ZnL (5 M) upon the addition of citrate, PO43−, F− and
Cl− (0-500 M) as representative anionic analytes in HEPES buffer (10 mM, pH = 7.2) solution at 25˚C.
ex = 380 nm, dem = dex = 5 nm.
0.0 0.2 0.4 0.6 0.8 1.00
20
40
60
80
100
416 nm
I-I 0
[ATP]/([ATP]+[ZnL])
(a)ATP
0.0 0.2 0.4 0.6 0.8 1.0
0
30
60
90
120
150
180(b)
[ADP]/([ADP]+[ZnL])
416 nmI-
I 0ADP
Figure S17. Job's plot examined between (a) ZnL and ATP and (b) ZnL and ADP
in HEPES buffer (10 mM, pH = 7.2) solution at 25˚C. [ATP or ADP] + [ZnL] = 5 M, ex = 380 nm,
dex = dem = 5 nm.

S16
Figure S18. High resolution mass spectrum of a mixture of ZnL and ADP. The peak at m/z = 918.1172
corresponds to formula C60H76N20Na4O26P4Zn22+ (calculated mass 1836.2353 = 2 918.11765), which
can be assigned to ZnL4++2ADP3-+4Na++6H2O as shown in the mass spectrum.
Figure S19. High resolution mass spectrum of a mixture of ZnL and ATP. The peak at m/z =
1821.1535 corresponds to formula C60H68N20NaO26P6Zn2+ (ZnL+2ATP+Na+), which was calculated as
1821.15145. The peak at m/z = 1887.09481 corresponds to formula C60H65N20Na4O26P6Zn2+
(ZnL+2ATP-3H++4Na+), which was calculated as 1887.09728.

S17
Figure S20. (a) 1H NMR spectra change and (b) 31P NMR spectra change of ZnL upon addition of
ADP in DMSO-d6 at 25 °C. [ZnL] = 10 mM, [ADP] = 20 mM. Still, we cannot get very good NMR
spectra with high resolution due to the reason of low solubility, but it is clear that ZnL binds ADP and
a new complex was formed.
4. Quantum Mechanical Calculations
Quantum mechanical calculations based on the density functional theory (DFT)
were investigated to identify the configuration of ZnL-2ADP and ZnL-2ATP. The
calculations were performed by Gaussian09 suite. Both of the two structures were
optimized at the DFT level with the B3LYP functional. The 6-31G(d) basis set was
used for C, H, N, O, and P atoms, while the LANL2DZ basis set was used for Zn
atom. The charge values were set to 0 for ZnL-2ADP and -2 for ZnL-2ATP. The
optimized configurations of ZnL-2ADP and ZnL-2ATP are displayed below. For

S18
ZnL-2ADP, the two Zn2+ ions link L and ADP together via five coordination sites,
respectively. The Zn2+ forms coordination bonds with three nitrogen atoms (bond
lengths are 2.201Å, 2.171Å, and 2.292Å) of L and two oxygen atoms (bond lengths
are 2.028Å and 1.999Å) of ADP. Different from the configuration of ZnL-2ADP, the
Zn2+ ion in ZnL-2ATP join L and ATP together via six coordination sites, including
three bonds with nitrogen atoms (bond lengths are 2.312Å, 2.304Å, and 2.332Å) of L
and other three with oxygen atoms (bond lengths are 2.065Å, 2.042Å, and 2.082Å) of
ATP. The results suggest that both ZnL-2ADP and ZnL-2ATP configurations are
stable by forming coordination bonds via Zn2+ ions. Furthermore, the adenine
structure in ADP have π-π stacking interaction with anthracene of L in ZnL-2ADP,
however, the same interaction does not exist in the configuration of ZnL-2ATP.
OP
O
O
N
NN
N NH2
P
O-
-O
O
HO OH
O
P
O-
O
NN
N
NH2N
P
O-
OO
O-
O
OHHO
N
N
N
N
N
NZn2+
Zn2+
O
O-NH2
HN
HN
NH2
2.292o2.201
o
2.17
1o
OP
O
O
N
N
N
N
H2N
P
O-
-O
OHO
HO
O P
O-
O
N
N
N
N
NH2
P
O-
OO
O-
P
O
HO
HO
N
N
N
N
N
NZn2+
Zn2+
O
O-
NH2
HN
HN
NH2
2.332o2.304
o
2.31
2o
ZnL-2ADP
P
O
O-
O
O-
O O
ZnL-2ATP
1
2
3
1
2
3
H
H
H
H
Figure S21. DFT calculated bond lengths between Zn2+ and the coordinated three nitrogen atoms for
ADP and ATP, respectively.

S19
Figure S22. DFT calculated interactions between ZnL and ADP. Top: View with hydrogen atoms.
Bottom: Hydrogen atoms are omitted for clarity.

S20
Figure S23. DFT calculated interactions between ZnL and ATP. Top: View with hydrogen atoms.
Bottom: Hydrogen atoms are omitted for clarity.
Recommended