Electronic Government Adoption in Developing Countries:
The Case of the Indonesian Electronic Procurement System
RINO ARDHIAN NUGROHO
B.Soc.Sc (Public Administration), Universitas Sebelas Maret, Indonesia
Master of Information Technology, Universitas Indonesia, Indonesia
A thesis submitted for the degree of Doctor of Philosophy at
The University of Queensland in 2015
ii
Abstract
Studies conducted in the disciplines of public administration, sociology, psychology and
information systems have examined the factors supporting electronic government (e-Government)
adoption. Such research is vital because—no matter how technically sophisticated an e-Government
system—it will be useless if it is not adopted. For government procurement processes, electronic
procurement (e-Procurement) is believed to enhance efficiency and transparency as well as reduce
the incidence of corruption in these processes. Unfortunately, however, many developing countries
that face the problem of public sector corruption have failed to successfully adopt e-Government
systems, including e-Procurement. The lack of success in e-Government adoption has stimulated
the interest of scholars to identify the key predictors of e-Government adoption in developing
countries. As a contribution to this growing body of knowledge, the present study examines the
possible predictors of e-Government adoption by using Indonesia’s e-Procurement system as a case
study. Indonesia was chosen as the case study because it is a developing country facing the problem
of public sector corruption and because an e-Procurement system was introduced for use in
government agencies in 2005.
The literature presents several conceptual models that have been developed to understand the
predictors of e-Government use. Generally, these conceptual models apply to pre-adoption settings
(e.g. the technology acceptance model (TAM), unified theory of acceptance and use of technology
(UTAUT), and technology-organisation-environment model (TOE)) where they identify the factors
relating to the take-up of a new technology, or to continued use settings (e.g. the expectation
confirmation model for information technology (ECM-IT)) where they identify the factors relating
to the continued use of a technology. The predictors in these models have been validated by prior
studies in various settings. However, there is a growing concern about the use of model predictors
without adjusting them to take account of different contexts. At least two types of adjustment to
context should be considered: first, the models are often developed for business settings, but
government procedures and needs are different; second, the models have mostly been developed in
the context of developed rich nations, not poorer developing worlds, and with this come different
cultural attitudes to technology and educational and infrastructure levels. The present study is
significant in that it tests the use of a pre-existing e-Procurement system by government agencies in
a developing country. It not only assesses the continued intention to use, but also introduces a new
measure of the level of adoption.
In recognition of the need to adjust pre-existing adoption models, this study used a two-stage
research design. The first stage used interviews with expert informants to either confirm existing
iii
predictors from well-established adoption models or identify new predictors for the e-Procurement
and developing country context. The second stage sought to validate the resulting model using
statistical analysis of survey data.
In the first stage, qualitative data were gathered from interviews with eight expert informants who
were able to present a system or organisational view on the experience and policy of e-Procurement
adoption in Indonesia. After using thematic analysis, the data gathered in this stage confirmed that
some predictors from the adoption model literature are relevant to the Indonesian context, namely,
performance expectancy, effort expectancy, social influence, facilitating conditions and top
management support. The interviews also revealed three new predictors: external organisation
strategy, perceived risk of corruption, and trust in e-Procurement. In the second stage, quantitative
data were gathered through an online survey of over 500 relevant Indonesian public agencies, with
responses received from 144 agencies. A statistical analysis method, namely, structural equation
modelling (specifically PLS-SEM), was used to analyse the relationship between the predictors and
the outcome variables of level of adoption and continued use. The results indicated that facilitating
conditions, top management support and external organisation strategy were significant predictors
of the level of adoption, and that facilitating conditions, performance expectancy and trust in e-
Procurement were significant predictors of continued use of the e-Procurement system in Indonesia.
The study enriches the existing paradigms in the theory of technology adoption and use in several
ways. First, it validates that model predictors developed to study individuals’ use of new
technologies are appropriate for use in examining organisations’ use of new technologies. Second, it
adds a new dimension to the theory of technology adoption by explaining how risk in non-
electronic processing may be a driver of electronic system’s level of adoption.
iv
Declaration by author
This thesis is composed of my original work, and contains no material previously published or
written by another person except where due reference has been made in the text. I have clearly
stated the contribution by others to jointly-authored works that I have included in my thesis.
I have clearly stated the contribution of others to my thesis as a whole, including statistical
assistance, survey design, data analysis, significant technical procedures, professional editorial
advice, and any other original research work used or reported in my thesis. The content of my thesis
is the result of work I have carried out since the commencement of my research higher degree
candidature and does not include a substantial part of work that has been submitted to qualify for
the award of any other degree or diploma in any university or other tertiary institution. I have
clearly stated which parts of my thesis, if any, have been submitted to qualify for another award.
I acknowledge that an electronic copy of my thesis must be lodged with the University Library and,
subject to the policy and procedures of The University of Queensland, the thesis be made available
for research and study in accordance with the Copyright Act 1968 unless a period of embargo has
been approved by the Dean of the Graduate School.
I acknowledge that copyright of all material contained in my thesis resides with the copyright
holder(s) of that material. Where appropriate I have obtained copyright permission from the
copyright holder to reproduce material in this thesis.
v
Publications during candidature
Nugroho, R. (2014, December). Electronic Government Procurement Adoption in
Developing Economies: How Corruption Influence System’s Adoption. In Proceedings of
the 14th European Conference on e-Government: ECEG 2014 (p. 344 – 351). Academic
Conferences Limited.
Publications included in this thesis
Nugroho, R. (2014, December). Electronic Government Procurement Adoption in
Developing Economies: How Corruption Influence System’s Adoption. In Proceedings of
the 14th European Conference on e-Government: ECEG 2014 (p. 344 – 351). Academic
Conferences Limited.
Partially incorporated in Chapters 4 and 5.
Contributor Statement of contribution
Rino A Nugroho (Candidate) Designed experiments (100%)
Wrote the paper (100%)
Contributions by others to the thesis
No contributions by others.
Statement of parts of the thesis submitted to qualify for the award of another degree
None.

vi
Acknowledgements
I am thankful to Allah Almighty, for blessing me with the support of amazing individuals during
my PhD journey. First and foremost I would like to thank my principal supervisor Associate
Professor Paul Henman who has guided me throughout this endeavour. Without his expertise,
patience and professionalism I would not have been able to complete this thesis. Secondly, I would
like to thank Professor Peter Green for sharing his insights and expertise in information systems.
Many thanks to UQ internal readers for providing comments and corrections: Dr Rose Melville, Dr
Jon Heales, Dr Philip Gillingham, Associate Professor Peter Newcombe. I also thank the thesis
chairs: Associate Professor Michele Foster and Associate Professor Fiona Bogossian.
I acknowledge the financial support received through the Indonesian Directorate of Higher
Education Scholarship (DIKTI Scholarship). I thank the Dean of the Faculty of Social and Political
Science, Sebelas Maret University (UNS), Professor Pawito for his support. I also thank other UNS
staff Wisnu, Anis and Ikhsan for their assistance in the scholarship administration.
I greatly appreciate the feedback I received from prominent researchers in the e-Government field:
Dr Manal Abdel-Kader Abdel-Fattah (Helwan University, Egypt), Associate Professor Alexandru
Ionas (Spiru Haret University, Romania), Dr Daniel Gberevbie (Covenant University, Nigeria), Dan
Remenyi (Trinity College, Dublin) and Dr Ahmed Imran (UNSW, Australia). I am thankful for the
collegiality of fellow PhD students Tim and Muslimin. I am deeply thankful to the respondents in
the interview and survey stages of this research for sharing their insights into the use of e-
Procurement in Indonesia. I also thank Helen Whittle for her work in editing my thesis.
I would like to recognise the invaluable support from my family. To my lovely wife, Arny
Kartinawanty, thank you for your patience and sacrifice: after four years, I am home. To my son
Adnarangga and my daughter Adina Brisbenia, thank you for your cheerful smiles via Skype that
never fail to bring the light into my everyday life even though we are one thousand miles apart.
Last, but not least, to my parents: Bapak Soenarno and Ibu Soepanti, thank you for your inspiration.
vii
Keywords
Electronic government, electronic public procurement, information system adoption, information
system continuance, UTAUT, corruption in developing countries, public administration, Indonesia.
Australian and New Zealand Standard Research Classifications (ANZSRC)
ANZSRC code: 160509, Public Administration, 50%
ANZSRC code: 080609, Information System Management, 30%
ANZSRC code: 160808, Sociology and Social Studies of Science and Technology 20%
Fields of Research (FoR) Classification
FoR code: 1605, Policy and Administration, 50%
FoR code: 0806, Information Systems, 30%
FoR code: 1608, Sociology, 20%
viii
Table of Contents
Abstract ................................................................................................................................................ii
Acknowledgements ............................................................................................................................. vi
Table of Contents ............................................................................................................................. viii
List of Figures ..................................................................................................................................... xi
List of Tables .....................................................................................................................................xii
List of Abbreviations used in the Thesis .......................................................................................... xiii
Chapter 1. Research Introduction ......................................................................................................... 1
1.1. Background ............................................................................................................................... 1
1.2. Research Context: Indonesia’s e-Government .......................................................................... 2
1.3. Research Objectives .................................................................................................................. 3
1.4. Significance and Contribution ................................................................................................... 5
1.5. Organisation of the Thesis ......................................................................................................... 6
Chapter 2. Literature Review ............................................................................................................... 8
2.1. Electronic Government.............................................................................................................. 8
2.2. Public Procurement, Electronic Procurement and Corruption .................................................. 9
2.3. Conceptual Models of Technology Adoption ......................................................................... 11
2.3.1. Adoption Models .............................................................................................................. 12
2.3.2. Continuance Models ......................................................................................................... 16
2.3.3. Adoption and Continuance Literature .............................................................................. 18
2.3.4. Variables in Model of Use ................................................................................................ 18
2.4. Critical Success Factors for e-Government and e-Procurement Use ...................................... 20
Chapter 3. Methodology .................................................................................................................... 25
3.1. Case Study: E-Procurement in Indonesia ................................................................................ 25
3.2. Research Design and Research Framework ............................................................................ 27
3.3. Stage 1: Confirming and Identifying Models .......................................................................... 31
3.3.1. Interview Structure ............................................................................................................... 32
3.3.2. Sampling ............................................................................................................................... 32
3.3.3. Data Analysis ....................................................................................................................... 33
3.3.4. Trustworthiness .................................................................................................................... 33
3.4. Stage 2: Model Validation ....................................................................................................... 34
3.4.1. Data Collection ..................................................................................................................... 34
3.4.2. Sampling ............................................................................................................................... 34
ix
3.4.3. Survey Design and Development of the Constructs ............................................................. 35
3.4.4. Data Analysis ....................................................................................................................... 36
3.4.5. Reliability and Validity ........................................................................................................ 37
3.5. Ethics ....................................................................................................................................... 38
Chapter 4. Interview Results .............................................................................................................. 39
4.1. Introduction ............................................................................................................................. 39
4.2. External Organisational Factors .............................................................................................. 40
4.2.1. Social Influence ................................................................................................................ 40
4.2.2. External Organisation Strategy ......................................................................................... 47
4.3. Internal Organisation Factors .................................................................................................. 52
4.3.1. Facilitating Conditions...................................................................................................... 52
4.3.2. Top Management Support ................................................................................................ 59
4.3.3. Performance Expectancy .................................................................................................. 61
4.3.4. Effort Expectancy ............................................................................................................. 65
4.3.5. Perceived Risk of Corruption ........................................................................................... 66
4.4. System Use .............................................................................................................................. 68
4.5. Size .......................................................................................................................................... 70
4.6. Model Revision ....................................................................................................................... 71
Chapter 5. Survey Results .................................................................................................................. 84
5.2. Introduction ............................................................................................................................. 84
5.3. Survey Design ......................................................................................................................... 84
5.4. Data Preparation ...................................................................................................................... 85
5.5. Measurements .......................................................................................................................... 86
5.5.1. Existing Constructs ........................................................................................................... 86
5.5.2. New Constructs ................................................................................................................. 88
5.5.3. Outcome Variables ........................................................................................................... 89
5.5.4. Moderating Variables ....................................................................................................... 92
5.5.5. Mediating Variables .......................................................................................................... 93
5.5.6. Reflective Measurement Model ........................................................................................ 94
5.6. Data Representativeness ........................................................................................................ 102
5.7. Continuance Intention Model ................................................................................................ 103
5.7.1. Measurement Model ....................................................................................................... 103
5.7.2. Model Structuring ........................................................................................................... 105
5.7.3. Mediation Analysis ......................................................................................................... 108
5.7.4. Moderation Analysis ....................................................................................................... 111
5.7.5. CI Model Summary ........................................................................................................ 111
x
5.8. Level of Adoption Model ...................................................................................................... 112
5.8.1. Measurement Model ....................................................................................................... 112
5.8.2. Model Structuring ........................................................................................................... 114
5.8.3. Mediation Analysis ......................................................................................................... 115
5.8.4. Moderation Analysis ....................................................................................................... 117
5.8.5. LA Model Summary ....................................................................................................... 118
5.9. Discussion Overview ............................................................................................................. 119
Chapter 6. Conclusion ...................................................................................................................... 122
6.1. Introduction ........................................................................................................................... 122
6.2. Overview of the Findings ...................................................................................................... 122
6.2.1. Discussion of Results ...................................................................................................... 123
6.2.2. Limitations of the Study ................................................................................................. 128
6.3. Implications of the Research ................................................................................................. 129
6.3.1. Theoretical Contributions ............................................................................................... 129
6.3.2. Knowledge Contributions ............................................................................................... 131
6.3.3. Practical Contributions ................................................................................................... 133
6.3.4. Future Research .............................................................................................................. 134
References ........................................................................................................................................ 136
xi
List of Figures
Figure 1.1: Map of Indonesia .............................................................................................................. 2
Figure 2.1: Technology acceptance model (Davis et al., 1989) ......................................................... 14
Figure 2.2: UTAUT model (Venkatesh et al., 2003a) ....................................................................... 15
Figure 2.3: TOE framework (Tornatzky and Fleischer, 1990a) ........................................................ 16
Figure 2.4: ECM-IT model (Bhattacherjee, 2001) ............................................................................. 17
Figure 3.1: Relationship between the NPPA and LPSE .................................................................... 27
Figure 3.2: Initial research model ...................................................................................................... 28
Figure 4.1: Model revision ................................................................................................................. 72
Figure 5.1: Average of continuance intention items .......................................................................... 95
Figure 5.2: Year of adoption .............................................................................................................. 95
Figure 5.3. e-Procurement use percentage ......................................................................................... 96
Figure 5.4: Agency budget ................................................................................................................. 97
Figure 5.5: Number of employees ...................................................................................................... 98
Figure 5.6: Average of top management support items ..................................................................... 98
Figure 5.7: Average of Trust in e-Procurement items ....................................................................... 99
Figure 5.8: Model structuring – Continuance intention ................................................................... 104
Figure 5.9: Mediation effect – FCTMSCI ................................................................................ 106
Figure 5.10: Mediation effect – PRoCTiePCI .......................................................................... 107
Figure 5.11: Moderation – CI model ............................................................................................... 108
Figure 5.12: Model structuring – Level of adoption ........................................................................ 113
Figure 5.13: Mediation effect – FCTMSLA ........................................................................... 114
Figure 5.14: Mediation effect – PRoCTiePLA ........................................................................ 115
Figure 5.15: Moderation – Level of adoption model ....................................................................... 116
Figure 6.1: Final model .................................................................................................................... 126
xii
List of Tables
Table 2.1: Literature on technology use models ................................................................................ 13
Table 2.2: Predictors in the adoption and continuance model ........................................................... 18
Table 2.3: Critical success factors for e-Government and e-Procurement ........................................ 21
Table 4.1: External organisation strategy constructs ......................................................................... 40
Table 4.2: H1 – Social influence and e-Procurement use ................................................................. 47
Table 4.3: H2 – External organisation strategy and e-Procurement use ............................................ 52
Table 4.4: Internal organisation constructs ........................................................................................ 52
Table 4.5: Other dimensions of facilitating conditions construct ...................................................... 57
Table 4.6: H3 – Facilitating conditions and e-Procurement use ........................................................ 58
Table 4.7: H4 and H 5 – Top management support and e-Procurement use ..................................... 61
Table 4.8: H6 – Performance expectancy and e-Procurement use .................................................... 64
Table 4.9: H7 – Effort expectancy and e-Procurement use ............................................................... 66
Table 4.10: H8 – Perceived risk of corruption and e-Procurement use ............................................. 68
Table 4.11: H9 –Size and e-Procurement use .................................................................................... 71
Table 4.12: Summary of hypotheses .................................................................................................. 72
Table 5.1: H10 and 11 – Trust in e-Procurement and e-Procurement use ......................................... 86
Table 5.2: Item questions of existing and new measurements ........................................................... 89
Table 5.3: Agency type .................................................................................................................... 100
Table 5.4: Agency group by development purposes ........................................................................ 101
Table 5.5: Summary of reflective measurement models – Continuance intention .......................... 102
Table 5.6: Collinearity test – Continuance intention model ............................................................ 103
Table 5.7: Sobel test result – PRoCTiePCI .............................................................................. 107
Table 5.8: Summary of reflective measurement model – Level of adoption ................................... 110
Table 5.9: Collinearity test – Level of adoption .............................................................................. 112
Table 5.10: Sobel test result – FCTMSLA ............................................................................... 114
Table 5.11: Summary of hypotheses ................................................................................................ 119
xiii
List of Abbreviations used in the Thesis
CI : Continuance intention
EE : Effort Expectancy
e-Government : Electronic government
EOS : External Organisation Support
e-Procurement : Electronic procurement
FC : Facilitating conditions
LA : Level of adoption
LPSE : Electronic Procurement Body – Lembaga Pengadaan Secara Elektronis (LPSE)
NPPA : National Public Procurement Agency – Lembaga Kebijakan Pengadaan
Barang/Jasa Pemerintah (LKPP)
PE : Performance Expectancy
PRoC : Perceived Risk of Corruption
SI : Social influence
SPSE : Electronic Procurement System – Sistem Pengadaan Secara Elektronis (SPSE)
TieP : Trust in e-Procurement
TMS : Top Management Support
~ 1 ~
Chapter 1. Research Introduction
1.1. Background
Globally, the number of Internet users has grown rapidly from 361 million in 2000 to 3.0 billion in
2014 (MiniwattsMarketingGroup, 2015). By communicating and interacting with each other
through the Internet, people create a society within the Internet that has been called a network
society (Barney, 2004, Castells, 2010). This new society inspires governments to change their
approach to providing services to the public, as they turn their attention to digital era governance
(Dunleavy et al., 2006). In this era, services and relations among the government, the public and the
business sector are accelerated through the use of information and communication technologies
(ICTs); thus, reconfiguring the way in which government organisations operate (Henman, 2010).
The use of ICTs by government, hereafter referred to as “e-Government”, is linked to many positive
benefits, such as improving public service quality, obtaining efficiency and effectiveness in
government operations, and providing transparency (Bertot et al., 2010, Huang, 2010, Jang, 2010).
With those benefits, e-Government could assist the least economically developed countries to catch
up with more developed ones (Basu, 2004).
An important objective in using e-Government in developing countries is to reduce public sector
corruption. Corruption has been identified as a serious problem in less economically developed
countries (Dwivedi, 1967). Corruption reduces economic growth (Bayley, 1966; Mauro, 1998) and
increases income inequality and poverty (Gupta, Davoodi and Alonso-Terme, 2002) in developing
countries. When successfully implemented, e-Government is able to reduce corruption in
government operations in developing countries (Nugroho, 2003). Given this benefit, many
governments in developing countries seek to implement e-Government to reduce public sector
corruption and increase government efficiency and effectiveness.
Unfortunately, however, most developing country governments ultimately fail to successfully adopt
e-Government (Heeks, 2003). The failures of developing countries in e-Government adoption
indicate that the e-Government strategies designed in developed countries may not suit the
developing country environment (Chen et al., 2006). To overcome this problem, the adoption
strategies should be adjusted for different cultural contexts (Anandarajan, Igbaria and Anakwe,
2002). Nonetheless, this is difficult to achieve, given that recent literature has mostly focused on e-
Government in developed countries than in developing ones (Gupta et al., 2008). The lack of
understanding of the predictors of e-Government success in developing countries in turn affects the
~ 2 ~
effectiveness of e-Government adoption strategies. This research aims to identify the predictors of
successful e-Government adoption and use in a developing country environment. Indonesia was
chosen as the case study, considering its status as a developing country (IMF, 2012) and its
implementation of an e-Government strategy since 2010 (Hasibuan, 2010). One key aim is to
investigate (or examine) the influence of reducing corruption in the procurement process on
adoption and continued use of e-Government systems.
1.2. Research Context: Indonesia’s e-Government
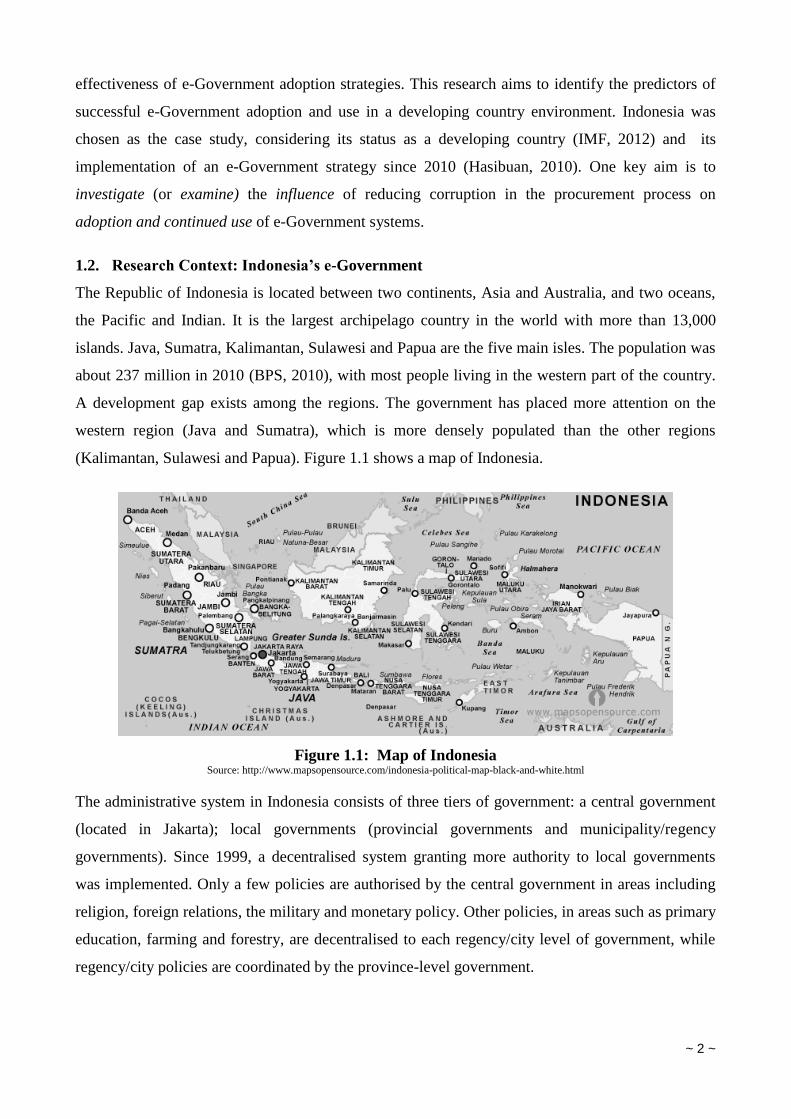
The Republic of Indonesia is located between two continents, Asia and Australia, and two oceans,
the Pacific and Indian. It is the largest archipelago country in the world with more than 13,000
islands. Java, Sumatra, Kalimantan, Sulawesi and Papua are the five main isles. The population was
about 237 million in 2010 (BPS, 2010), with most people living in the western part of the country.
A development gap exists among the regions. The government has placed more attention on the
western region (Java and Sumatra), which is more densely populated than the other regions
(Kalimantan, Sulawesi and Papua). Figure 1.1 shows a map of Indonesia.
Figure 1.1: Map of Indonesia Source: http://www.mapsopensource.com/indonesia-political-map-black-and-white.html
The administrative system in Indonesia consists of three tiers of government: a central government
(located in Jakarta); local governments (provincial governments and municipality/regency
governments). Since 1999, a decentralised system granting more authority to local governments
was implemented. Only a few policies are authorised by the central government in areas including
religion, foreign relations, the military and monetary policy. Other policies, in areas such as primary
education, farming and forestry, are decentralised to each regency/city level of government, while
regency/city policies are coordinated by the province-level government.
~ 3 ~
The widespread utilisation of ICTs in the Indonesian government commenced in 2001 following
Presidential Instruction No. 6/2001. This instruction required government agencies to use ICTs to
achieve the goals of good governance. In 2003, the fifth Indonesian president strengthened this
decision by endorsing Presidential Instruction No. 3/2003, a National Policy and Strategy on e-
Government Development. In 2006, a new presidential decree (No. 20/2006) formed a national-
level board for ICT. Ten national programs were implemented, one of which was electronic public
procurement (e-Procurement) to be coordinated by a national-level agency called the National
Public Procurement Agency (NPPA) (Hasibuan, 2010). The e-Procurement system in Indonesia is
discussed in detail in Chapter 2.
1.3. Research Objectives
Eliminating corruption in government agencies is an area of continual focus and concern in many
developing countries, including Indonesia. Despite Indonesia’s improved ranking in the
Transparency International corruption index following the fall of the New Order regime
(Transparency International, 2012), Indonesians continue to demand better governance and public
sector accountability (Boediono, 2011). The literature indicates that the opposite is occurring—
corruption continues to exist (Mietzner, 2007). According to the leading pollster in Indonesia,
Lembaga Survei Indonesia (LSI), corruption involving high-ranking government officials caused
public trust in the government to decrease from 52.3 per cent to 37.7 per cent within one year (cited
in Pramono, 2011).
The use of e-Government is seen by many to offer the ability to reduce corruption in government
agencies (Jang, 2010, Lio et al., 2011b, Nugroho, 2006), and subsequently boost public trust in the
government (Welch et al., 2005). Moreover, e-Government can serve as a tool for following good
governance principles, such as ensuring good public service quality, efficiency, effectiveness and
transparency (Bertot et al., 2010, Huang, 2010, Jang, 2010). As such, it is reasonable for e-
Government to be considered as an enabler for the improvement of Indonesian government
operations, such as accomplishing good governance and reducing corruption. Thus, a key aim of
this study is to contribute to the reduction of public sector corruption through the adoption and
continued use of e-Government, specifically in the area of public sector procurement.
The literature suggests that e-Government utilisation in Indonesia has not developed as expected
(Rokhman, 2008) and needs to be improved (Satriya, 2006). As with many other developing
economies, Indonesia has not attained as much economic advantage from e-Government
implementation as could be expected (Kuppusamy et al., 2008). In 2014, the biennial E-
Government Development Index issued by the United Nations ranked Indonesia at 106, below five
~ 4 ~
other South-East Asian countries, namely, Singapore (#3), Malaysia (#52), Philippines (#95),
Vietnam (#99) and Thailand (#102) (UN, 2014). According to the UN, limited infrastructure and
poor governmental online service quality were the factors causing Indonesia’s low ranking.
Government online service quality is divided into four categories (United Nations, 2012, p 120).
The first is “emerging presence” (Stage 1), which refers to a government Internet service that
provides only basic and limited information. The second category is “enhanced presence” (Stage 2),
in which the Internet service provides information about public policies and governance sources,
such as laws and regulations. The third category is “transactional presence” (Stage 3), which allows
two-way interactions between citizens and the government. The fourth category is “connected
presence” (Stage 4), which represents the interactions among government agencies (G2G) and
between citizens and government (C2G) (United Nations, 2012, p 120). In Indonesia, less than 10
per cent of government agencies have reached Stage 3, compared with 71 per cent in Singapore and
50 per cent in Malaysia (UN, 2014). This situation makes Indonesia less able to compete
economically with those two countries (Kuppusamy et al., 2008). Therefore, improving
transactional e-Government systems might be expected to advance economic development in
Indonesia as well as providing better governance. However, before this can occur, the causes of the
low adoption of electronic transactional systems in Indonesia must be understood. One way to
investigate the problem is by using model of technology use.
The end-user adoption rate is one of the many measurements used to understand the implementation
and adoption of technology in organisations. To predict this rate, scholars have developed an
archetype called the model of technology use. This model seeks to explain users’ acceptance of
technology by proposing the predictors of system use. Many researchers have used the model as a
means of understanding e-Government success and failure in their own countries (Arduini et al.,
2010, Chu et al., 2004, Lau et al., 2008, Rehman and Esichaikul, 2011). The technology adoption
model reveals both the implementation problems as well as the success factors in e-Government.
According to the Scopus database (2015), the literature on e-Government users predominantly
examines individual use either by citizens (84 studies) or by public officials (19 studies). Only a
few discuss e-Government use at the organisational level (7 studies). This demonstrates that most
research on technology use is not focused on the adoption of technology by government agencies,
but on the use of technology by individual government employees or by citizens.
To date, there has been no research that develops the technology use model in the context of e-
Government in Indonesia. In addition, not all of the government agencies in Indonesia have adopted
an e-Government system successfully (Nugroho, 2010, Rokhman, 2008, Rose, 2004). Among the
~ 5 ~
many e-Government systems in Indonesia, e-Procurement is one of the more successful systems. It
was adopted across most Indonesian government agencies within five years of its introduction in
2007.
This research is therefore conducted to identify the success and limiting factors in the adoption of e-
Government, using Indonesia’s e-Procurement as the case study in order to better understand e-
Government adoption in Indonesia and other developing countries. Based on this objective, the
overall research question addressed in this research is:
“What are the critical success factors that explain the adoption of pre-existing e-Government
solutions by government agencies within developing economies?”
1.4. Significance and Contribution
This study is innovative in its focus on the government agency as the unit of analysis for the
examination of the technology adoption. This contrasts with most e-Government adoption studies
that select the individual as the unit of analysis. In other words, most e-Government adoption
studies focus on citizens’ or government officials’ use of the e-Government services provided by
government agencies. Accordingly, the present research involves a different setting, that is, a
government agency and obtains high-level bureaucrats’ responses that represent the government
agency’s views. In addition, a unique aspect of this research is the mandatory nature of the e-
Government setting. Presidential decrees in 2011 and 2013 mandated the use of e-Procurement by
government agencies at all levels (discussed in detail in Chapter 3, Section 3.1). By issuing this, the
voluntary situation has become mandatory for all agencies in Indonesia. Hence, the contribution of
this study is its investigation of the e-Government system use at agency level in a mandatory
context, which to the best of the researcher’s knowledge is not addressed in the literature.
It is expected that the findings of the present research will contribute to several research fields,
including public sector management, information system (IS) management, psychology and
sociology, by identifying new critical success factors specific to developing countries that may not
be included in the existing models of technology adoption. This is because the existing models were
mostly devised in developed country settings where many conditions, such as corruption in
government, electronic literacy (e-literacy), the digital divide and other social and cultural
conditions relevant to developing countries, might be overlooked.

~ 6 ~
In summary, the study makes four key contributions. First, this study focuses on technology
adoption by an organisation in its interactions with external end-user organisations, and not on
technology adoption by an individual end-user which is the most common unit of analysis. Second,
this study involves government organisations, rather than private organisations which are the focus
of much technology acceptance research. Third, this study probes the use of an IS in a mandatory
setting which is a neglected area of enquiry in the literature. Fourth, the study analyses corruption
as a new construct affecting system use.
Empirically, this study fills the gap in the literature by designing a technology adoption model for
the Indonesian mandatory e-Government context. To date, most e-Government research in
Indonesia makes descriptive findings (Furuholt and Wahid, 2008, Junseok and Syamsuddin, 2008,
Kumorotomo, 2009, Rose, 2004, Mirchandani et al., 2008, Nariman and Yamamoto, 2008,
Rahardjo, 2007, Salahuddin and Rusli, 2005, Satriya, 2006). One study (Rokhman, 2011) did an
adoption study using pre-existing model that has been developed in developed country setting and
not in mandatory setting. By contrast, this research aims to expand the knowledge in this area and
improve the adoption rate of e-Government in Indonesia by proposing a model that considers a
developing country’s particular circumstances. This includes the formulation of new outcomes and
predictor variables based on the developing country context. In addition this study also analyses
system adoption in a mandatory context. The study of system adoption in mandatory contexts is
rare (Chan, et.al, 2010) as it is assumed that subjects do what is required. However, compliance is
more complicated. A number of previous studies of mandatory adoption has highlighted resistant
behaviour that can result in unnecessary cost and reduced productivity to the organization (Brown,
et.al, 2002; Markus, 1983; Kimberly, 1987; Leonard-Barton, 1988; Zuboff, 1988). It is therefore
necessary to better understand the conditions that facilitate adoption in a mandatory setting.
Regarding the contribution to practice, this research identifies the important factors that are relevant
to improving e-Government adoption in Indonesia. The identification of new factors will help
practitioners such as IS practitioners in the public and private sectors to better understand the
circumstances of IS adoption in developing countries.
1.5. Organisation of the Thesis
This thesis is divided into six chapters. This first chapter has presented the research background,
objectives and context, and discussed the significance and contributions of the study. Chapter 2
reviews the literature on e-Government, public procurement and e-Procurement, corruption in
public procurement, and model of technology use.
~ 7 ~
The methodology of this research is described in Chapter 3. This includes a discussion of the case
study, the research framework and the research design. This is followed by a description of the two
research methods used (expert interviews and online survey), and an explanation of the steps taken
in the research, including the data collection, data analysis, sampling, construct development,
questionnaire development, and trustworthiness/reliability and validity. As explained in the chapter,
the research was conducted in two stages. In the first stage, expert interviews were conducted to
validate the existing predictors of system use as identified in the literature review and to identify
any new predictors that were unique to the research context. At the conclusion of this stage, the
research framework was revised. In the second stage, online surveys were conducted to validate the
revised model among a broader sample.
Chapter 4 discusses the results of the first stage of the study, namely, the qualitative phase
involving the interviews. Thematic analysis was used to identify the shared themes that emerged in
the interviews about the drivers of e-Procurement adoption in Indonesia. First, the constructs that
appears consistently in both the interview data and in the literature are reported, followed by new
constructs that are not found in the literature. Chapter 4 ends by presenting a revised model based
on the interview findings.
The revised model was then tested using statistical analysis, as reported in Chapter 5. An online
survey was conducted to test the revised model in the second stage of the study, namely, the
quantitative phase. The statistical analysis was conducted using partial least square–structural
equation modelling (PLS-SEM). Chapter 5 ends with an overview of the survey results. Lastly,
Chapter 6 summarises and integrates the findings of the qualitative and quantitative phases of the
study. The theoretical, academic and practical contributions and the limitations of the study are
discussed, and directions for future research are recommended.
~ 8 ~
Chapter 2. Literature Review
This chapter reviews the academic literature that informs the research. The first section reviews the
concept of e-Government and focuses on what is known about the experience of developing
countries in implementing e-Government systems. The literature related to procurement, including
public procurement, electronic procurement and corruption in public procurement, is reviewed in
the second section. The various conceptual approaches or models for understanding the adoption of
new ICTs in general, and e-Government in particular, are explored in the third section. This chapter
ends with an overview of the critical success factors in e-Government and e-Procurement identified
in the literature.
2.1. Electronic Government
Electronic government (or “e-Government”) is defined as the use of the Internet and other digital
devices by governments to deliver information and services to the public (Young-Jin and Seang-
Tae, 2007, Bhatnagar, 2004). E-government typically involves using office automation and online
transactions to improve government services (Huang, 2010). It allows governments to be more
responsive and accountable to the public (Schelin, 2003) by transforming the nature of politics and
the relations between government and citizens (Dada, 2006). It provides two important advantages
to government operations: increased operational efficiency, and better quality service by
government agencies (Gil-Garcia and Pardo, 2005). Successful e-Government implementation
benefits all parties by providing easier access to citizens, communities, businesses, and non-profit
organisations to government, and vice versa (Tambouris and Wimmer, 2005).
The deployment of e-Government involves not only computerising an office by using IT tools, but
also involves modifying organisational processes and the workings of government (Liikanen, 2003).
Thus, e-Government is a socio-technical system that combines technology, information,
organisation and process (Heeks, 2006). As such, it involves human interaction with technology to
achieve goals which cannot be reached solely by the technology or by people alone (Damodaran et
al., 2005). Based on the literature, it can be concluded that e-Government is a socio-technical
system implemented to achieve better government services: its success depends not only on the
system itself, but also on the social environment around the system, including the people and
organisations that operate it.
~ 9 ~
Despite the potential benefits, many e-Government projects fail, especially in developing countries.
Heeks (2003) claims that 35% of projects are total failures because they are never implemented or
are implemented and immediately abandoned, 50% of projects are partial failures because they
don’t reach their goals and include undesirable outcomes: only the remaining 15% reach full
success. Such findings are supported by more recent research (Dada, 2006, Shajari and Ismail,
2010). Thus, e-Government implementation remains an ongoing problem in some developing
countries including Indonesia (Rose, 2004, Nugroho, 2005, Arduini et al., 2010).
Understanding the reasons for failure and the keys for successful e-Government implementation is
critical for achieving the benefits of e-Government. Such lessons are not only important for
Indonesia, but also transferrable to other similarly structured developing countries. There is a
substantive and growing literature seeking to understand the reasons for e-Government success and
failure. Many of those studies suggest that the success of e-Government might be triggered by
critical success factors that would support the implementation of e-Government applications
(Kamal, 2005; Schwester, 2009). The critical factors of e-Government success are discussed in
Section 2.4.
2.2. Public Procurement, Electronic Procurement and Corruption
Procurement is one of many vital activities in any organisation. It is the process of acquiring the
goods and services needed by an organisation that that organisation itself cannot provide (Kovács,
2004, Vaidya, 2009). By organisation type, procurement can be divided into private and public
procurement. In general, the procurement in public and private organisations is similar, with the
exception that public procurement usually involves strict statutory and regulatory compliance to
make the procurement process accountable to taxpayers (Kovács, 2004). The basic principle in
public procurement is to obtain the right goods or services at the right time at the right price
(Neupane et al., 2012c). Public procurement is a strategic issue for governments. According to
(Dimitri et al., 2006), government expenditure in the EU and the US accounted for at least 16 per
cent and 20 per cent of GDP, respectively.
Playing a strategic role in a public organisation, procurement has its own threats, namely, collusion
and corruption. Collusion occurs when suppliers form a cartel to deprive buyers of the best price by
price-fixing (or bid-rigging) and market-sharing agreements (Albano et al., 2006). In this situation,
buyers do not get the benefit from competition among suppliers. Public procurement is also a
government activity in which corruption can occur (Søreide, 2002, Williams-Elegbe, 2012). The
different forms of corruption that may occur in public procurement are price fixing, bid
orchestration and distortion of quality rankings (Lengwiler and Wolfstetter, 2006), and it might
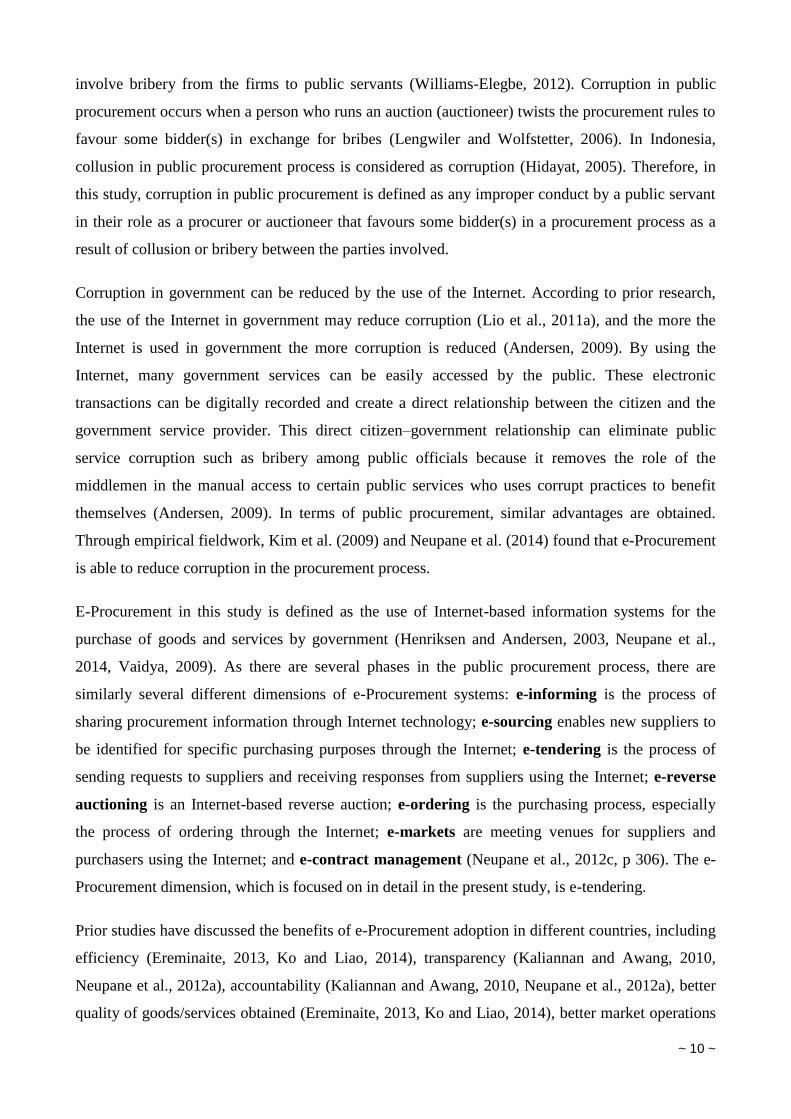
~ 10 ~
involve bribery from the firms to public servants (Williams-Elegbe, 2012). Corruption in public
procurement occurs when a person who runs an auction (auctioneer) twists the procurement rules to
favour some bidder(s) in exchange for bribes (Lengwiler and Wolfstetter, 2006). In Indonesia,
collusion in public procurement process is considered as corruption (Hidayat, 2005). Therefore, in
this study, corruption in public procurement is defined as any improper conduct by a public servant
in their role as a procurer or auctioneer that favours some bidder(s) in a procurement process as a
result of collusion or bribery between the parties involved.
Corruption in government can be reduced by the use of the Internet. According to prior research,
the use of the Internet in government may reduce corruption (Lio et al., 2011a), and the more the
Internet is used in government the more corruption is reduced (Andersen, 2009). By using the
Internet, many government services can be easily accessed by the public. These electronic
transactions can be digitally recorded and create a direct relationship between the citizen and the
government service provider. This direct citizen–government relationship can eliminate public
service corruption such as bribery among public officials because it removes the role of the
middlemen in the manual access to certain public services who uses corrupt practices to benefit
themselves (Andersen, 2009). In terms of public procurement, similar advantages are obtained.
Through empirical fieldwork, Kim et al. (2009) and Neupane et al. (2014) found that e-Procurement
is able to reduce corruption in the procurement process.
E-Procurement in this study is defined as the use of Internet-based information systems for the
purchase of goods and services by government (Henriksen and Andersen, 2003, Neupane et al.,
2014, Vaidya, 2009). As there are several phases in the public procurement process, there are
similarly several different dimensions of e-Procurement systems: e-informing is the process of
sharing procurement information through Internet technology; e-sourcing enables new suppliers to
be identified for specific purchasing purposes through the Internet; e-tendering is the process of
sending requests to suppliers and receiving responses from suppliers using the Internet; e-reverse
auctioning is an Internet-based reverse auction; e-ordering is the purchasing process, especially
the process of ordering through the Internet; e-markets are meeting venues for suppliers and
purchasers using the Internet; and e-contract management (Neupane et al., 2012c, p 306). The e-
Procurement dimension, which is focused on in detail in the present study, is e-tendering.
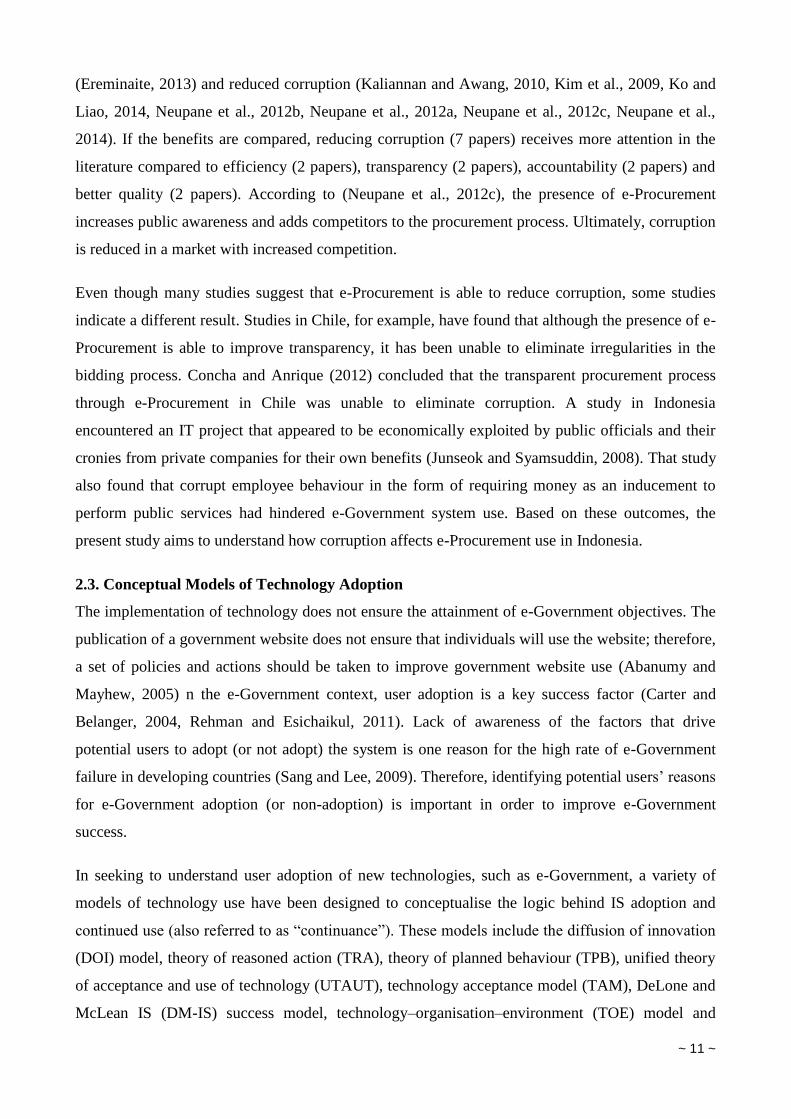
Prior studies have discussed the benefits of e-Procurement adoption in different countries, including
efficiency (Ereminaite, 2013, Ko and Liao, 2014), transparency (Kaliannan and Awang, 2010,
Neupane et al., 2012a), accountability (Kaliannan and Awang, 2010, Neupane et al., 2012a), better
quality of goods/services obtained (Ereminaite, 2013, Ko and Liao, 2014), better market operations
~ 11 ~
(Ereminaite, 2013) and reduced corruption (Kaliannan and Awang, 2010, Kim et al., 2009, Ko and
Liao, 2014, Neupane et al., 2012b, Neupane et al., 2012a, Neupane et al., 2012c, Neupane et al.,
2014). If the benefits are compared, reducing corruption (7 papers) receives more attention in the
literature compared to efficiency (2 papers), transparency (2 papers), accountability (2 papers) and
better quality (2 papers). According to (Neupane et al., 2012c), the presence of e-Procurement
increases public awareness and adds competitors to the procurement process. Ultimately, corruption
is reduced in a market with increased competition.
Even though many studies suggest that e-Procurement is able to reduce corruption, some studies
indicate a different result. Studies in Chile, for example, have found that although the presence of e-
Procurement is able to improve transparency, it has been unable to eliminate irregularities in the
bidding process. Concha and Anrique (2012) concluded that the transparent procurement process
through e-Procurement in Chile was unable to eliminate corruption. A study in Indonesia
encountered an IT project that appeared to be economically exploited by public officials and their
cronies from private companies for their own benefits (Junseok and Syamsuddin, 2008). That study
also found that corrupt employee behaviour in the form of requiring money as an inducement to
perform public services had hindered e-Government system use. Based on these outcomes, the
present study aims to understand how corruption affects e-Procurement use in Indonesia.
2.3. Conceptual Models of Technology Adoption
The implementation of technology does not ensure the attainment of e-Government objectives. The
publication of a government website does not ensure that individuals will use the website; therefore,
a set of policies and actions should be taken to improve government website use (Abanumy and
Mayhew, 2005) n the e-Government context, user adoption is a key success factor (Carter and
Belanger, 2004, Rehman and Esichaikul, 2011). Lack of awareness of the factors that drive
potential users to adopt (or not adopt) the system is one reason for the high rate of e-Government
failure in developing countries (Sang and Lee, 2009). Therefore, identifying potential users’ reasons
for e-Government adoption (or non-adoption) is important in order to improve e-Government
success.
In seeking to understand user adoption of new technologies, such as e-Government, a variety of
models of technology use have been designed to conceptualise the logic behind IS adoption and
continued use (also referred to as “continuance”). These models include the diffusion of innovation
(DOI) model, theory of reasoned action (TRA), theory of planned behaviour (TPB), unified theory
of acceptance and use of technology (UTAUT), technology acceptance model (TAM), DeLone and
McLean IS (DM-IS) success model, technology–organisation–environment (TOE) model and
~ 12 ~
expectation confirmation model for IT continuance (ECM-IT), to name a few. Based on the
situation, IS use models can be divided into two types: adoption models and continuance models.
Adoption models predict the organisational/individual decision on an electronic system’s initial use,
and continuance models predict the organisational/individual decision to continue using the
electronic system after its initial use. The following subsections describe both these types of
models.
2.3.1. Adoption Models
Technology adoption has been a major concern in IS research for more than 20 years (Chuttur,
2009). Scholars use various models of adoption in their research on e-Government. For example, in
understanding the critical success factors for government e-Procurement in Taiwan two different
models have been used. Chue, Hsiao, Lee and Chen (2004) used the TPB, while Jang (2010)
employed the DM-IS success model. In Kuwait, Alawadhi and Morris (2008) employed UTAUT to
identify the key factors in e-Government adoption. In order to minimise failures in the e-
Government adoption process, Carter and Belanger (2008) and Colesca (2009) recommend the
addition of trust and risk to the models. In addition, some researchers utilise more than one model.
The TAM, DOI and UTAUT were used by Shajari and Ismail (2010) when analysing e-Government
adoption in Iran. Sang and Lee (2009) combined the TAM, TAM2, DOI and DM-IS to develop
conceptual models for e-Government adoption in the public sector.
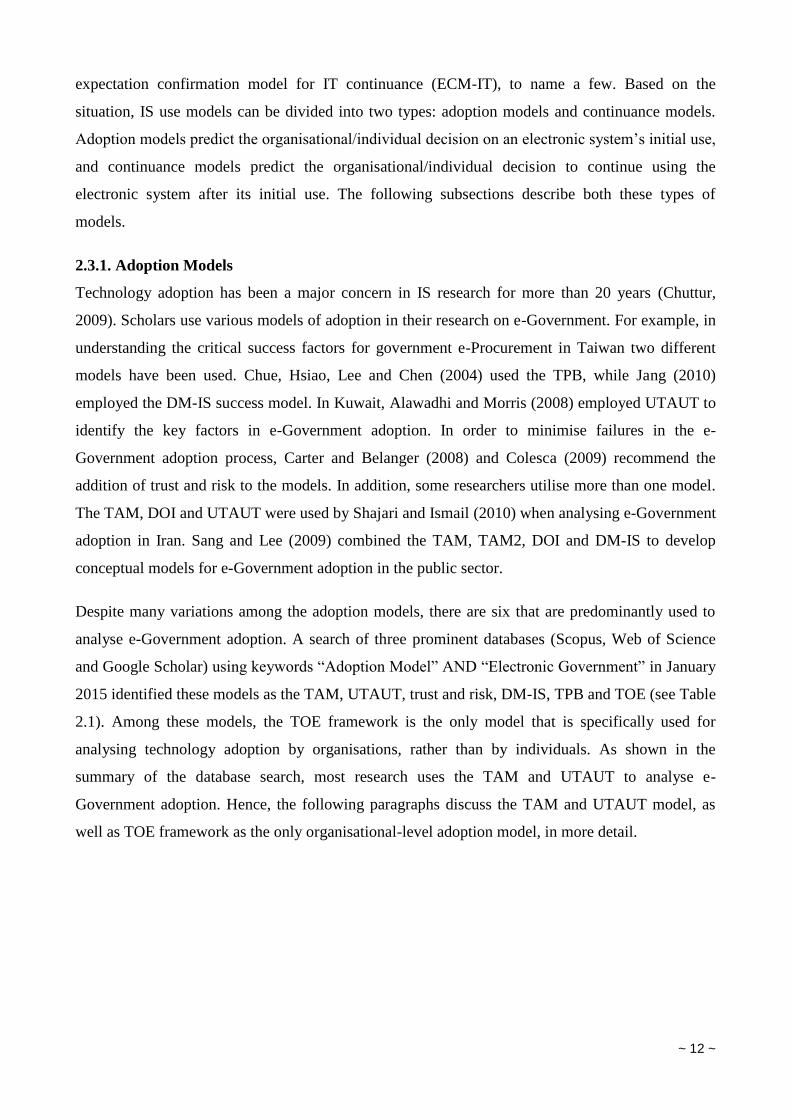
Despite many variations among the adoption models, there are six that are predominantly used to
analyse e-Government adoption. A search of three prominent databases (Scopus, Web of Science
and Google Scholar) using keywords “Adoption Model” AND “Electronic Government” in January
2015 identified these models as the TAM, UTAUT, trust and risk, DM-IS, TPB and TOE (see Table
2.1). Among these models, the TOE framework is the only model that is specifically used for
analysing technology adoption by organisations, rather than by individuals. As shown in the
summary of the database search, most research uses the TAM and UTAUT to analyse e-
Government adoption. Hence, the following paragraphs discuss the TAM and UTAUT model, as
well as TOE framework as the only organisational-level adoption model, in more detail.
~ 13 ~
Table 2.1: Literature on technology use models
Adoption Theory Literature Total
Individual Level
TAM (Al-Shafi and Weerakkody, 2009b, Cegarra-Navarro et
al., 2013, Chu et al., 2009, Detlor et al., 2009, Faaq et
al., 2009, Guzman and Kaarst-Brown, 2012, Hamner
and Al-Qahtani, 2009, Hsiao et al., 2012, Hussein et al.,
2010, Kromidha and Córdoba-Pachón, 2009, Lai and
Pires, 2009, Lin et al., 2011, Liu et al., 2010, Lopez-
Sisniega, 2009, Ntaliani et al., 2010, Rana et al., 2011,
Sebetci and Aksu, 2014, Shajari and Ismail, 2010,
Shareef et al., 2011, Shibly and Tadros, 2010, Venkatesh
et al., 2011, Vrček and Klačmer, 2014, Wang, 2014)
23
UTAUT (Afonso et al., 2012, Alryalat et al., 2013, Al-Shafi and
Weerakkody, 2009c, Al-Shafi and Weerakkody, 2009a,
Al-Shafi and Weerakkody, 2010, Al-Shafi et al., 2009,
Chan et al., 2010, Faaeq et al., 2015, Faaeq et al., 2013,
Joseph, 2010, Loo et al., 2009, Shajari and Ismail, 2010,
Venkatesh et al., 2011, Weerakkody et al., 2013, Yahya
et al., 2012, Zhan et al., 2011)
16
Risk and Trust (Belanger and Carter, 2008, Beldad et al., 2010, Carter
et al., 2012, Horst et al., 2007b, Hussein et al., 2010,
Mercuri, 2005, Rotchanakitumnuai, 2009, Sedaghat et
al., 2007, Selke et al., 2008, Sweeney, 2007)
10
DM-IS (Alruwaie et al., 2012, Floropoulos et al., 2010, Hussein
et al., 2007, Jang, 2010, Kim and Song, 2009, Rana et
al., 2013, Teo et al., 2008, Teo et al., 2009b, Wang and
Liao, 2008b, Wang and Liao, 2008a)
10
TPB (Chu et al., 2004, Hung et al., 2009, Lee and Rao, 2012,
Shareef et al., 2011)
4
Organisational Level
TOE (Al-Zoubi et al., 2011, Bigdeil et al., 2013, Pudjianto et
al., 2011, Pudjianto and Hangjung, 2009, Srivastava and
Teo, 2007, Srivastava and Teo, 2006, Srivastava and
Teo, 2010)
7
~ 14 ~
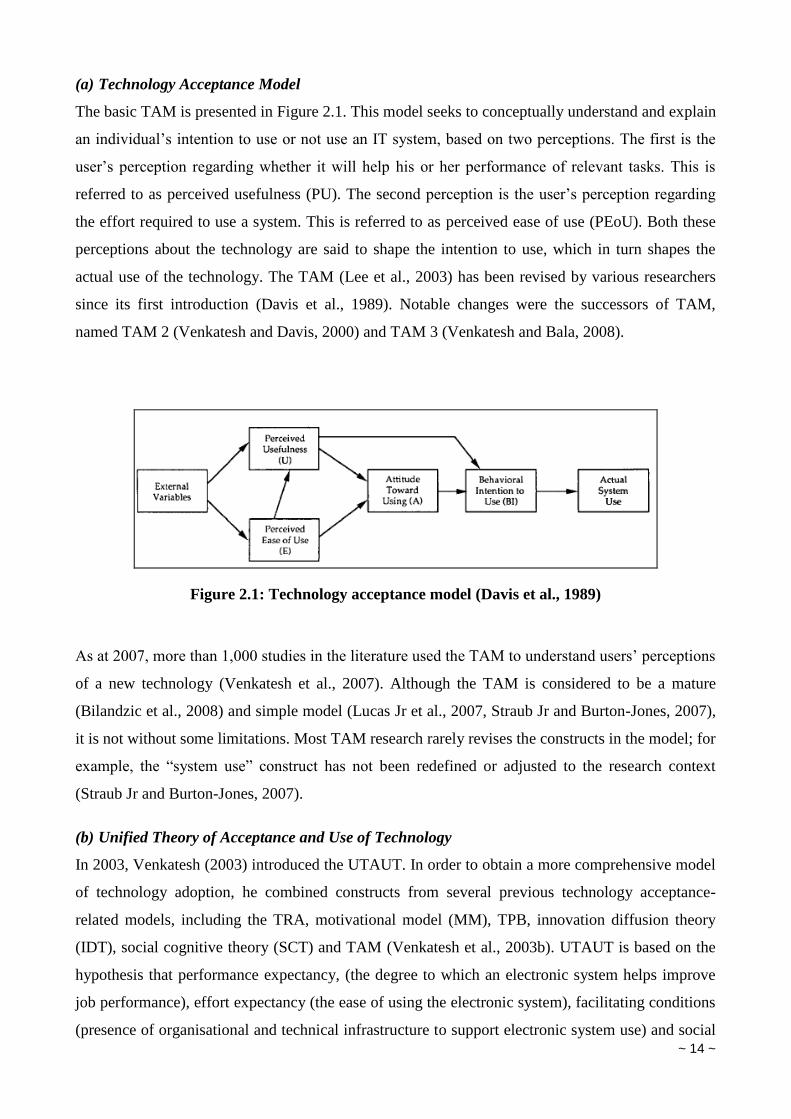
(a) Technology Acceptance Model
The basic TAM is presented in Figure 2.1. This model seeks to conceptually understand and explain
an individual’s intention to use or not use an IT system, based on two perceptions. The first is the
user’s perception regarding whether it will help his or her performance of relevant tasks. This is
referred to as perceived usefulness (PU). The second perception is the user’s perception regarding
the effort required to use a system. This is referred to as perceived ease of use (PEoU). Both these
perceptions about the technology are said to shape the intention to use, which in turn shapes the
actual use of the technology. The TAM (Lee et al., 2003) has been revised by various researchers
since its first introduction (Davis et al., 1989). Notable changes were the successors of TAM,
named TAM 2 (Venkatesh and Davis, 2000) and TAM 3 (Venkatesh and Bala, 2008).
Figure 2.1: Technology acceptance model (Davis et al., 1989)
As at 2007, more than 1,000 studies in the literature used the TAM to understand users’ perceptions
of a new technology (Venkatesh et al., 2007). Although the TAM is considered to be a mature
(Bilandzic et al., 2008) and simple model (Lucas Jr et al., 2007, Straub Jr and Burton-Jones, 2007),
it is not without some limitations. Most TAM research rarely revises the constructs in the model; for
example, the “system use” construct has not been redefined or adjusted to the research context
(Straub Jr and Burton-Jones, 2007).
(b) Unified Theory of Acceptance and Use of Technology
In 2003, Venkatesh (2003) introduced the UTAUT. In order to obtain a more comprehensive model
of technology adoption, he combined constructs from several previous technology acceptance-
related models, including the TRA, motivational model (MM), TPB, innovation diffusion theory
(IDT), social cognitive theory (SCT) and TAM (Venkatesh et al., 2003b). UTAUT is based on the
hypothesis that performance expectancy, (the degree to which an electronic system helps improve
job performance), effort expectancy (the ease of using the electronic system), facilitating conditions
(presence of organisational and technical infrastructure to support electronic system use) and social
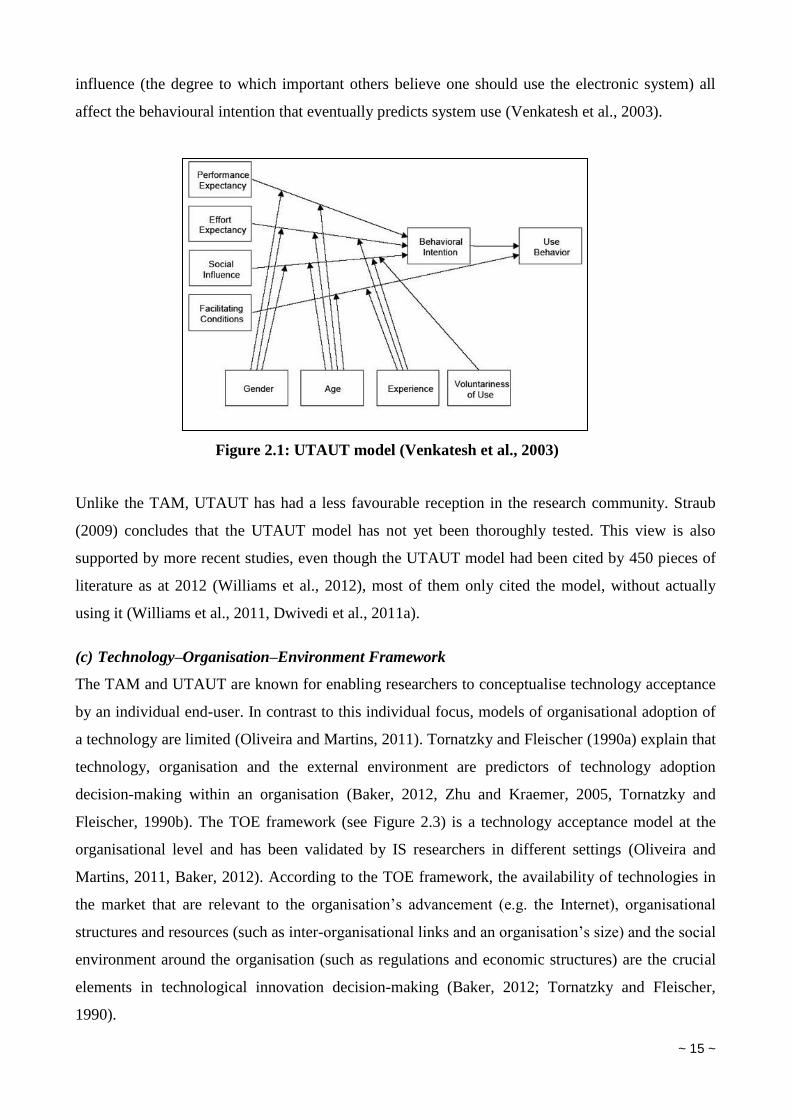
~ 15 ~
influence (the degree to which important others believe one should use the electronic system) all
affect the behavioural intention that eventually predicts system use (Venkatesh et al., 2003).
Unlike the TAM, UTAUT has had a less favourable reception in the research community. Straub
(2009) concludes that the UTAUT model has not yet been thoroughly tested. This view is also
supported by more recent studies, even though the UTAUT model had been cited by 450 pieces of
literature as at 2012 (Williams et al., 2012), most of them only cited the model, without actually
using it (Williams et al., 2011, Dwivedi et al., 2011a).
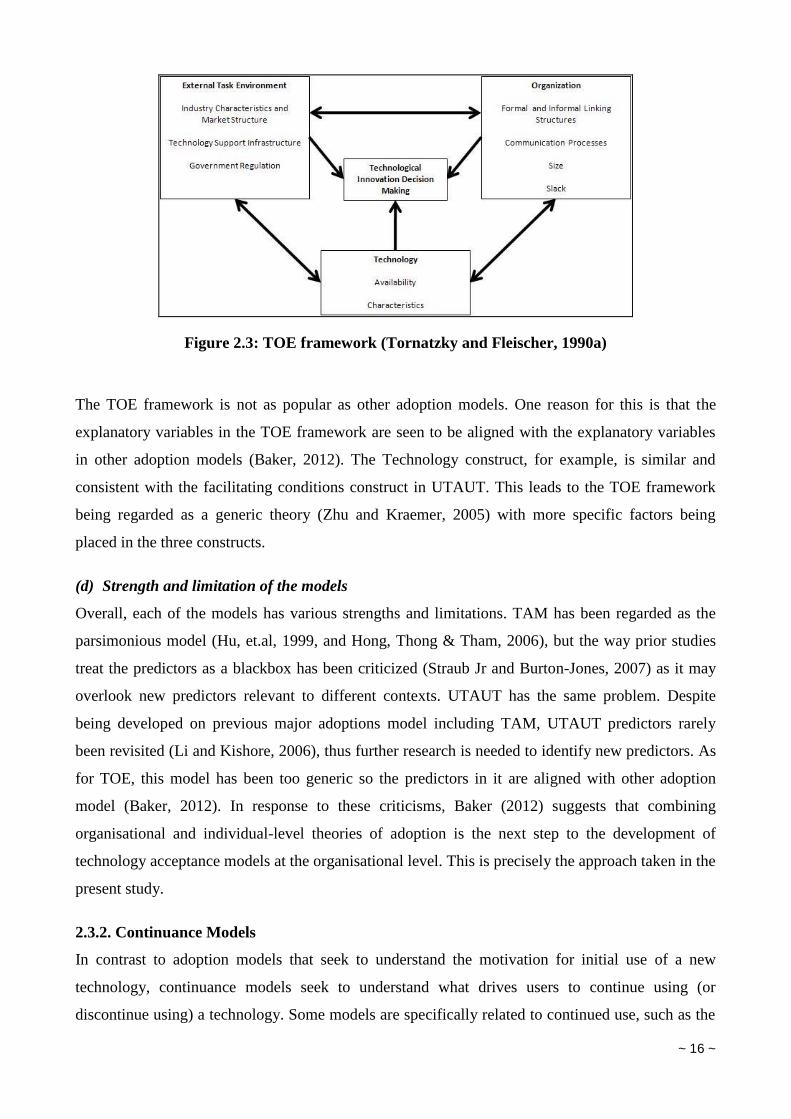
(c) Technology–Organisation–Environment Framework
The TAM and UTAUT are known for enabling researchers to conceptualise technology acceptance
by an individual end-user. In contrast to this individual focus, models of organisational adoption of
a technology are limited (Oliveira and Martins, 2011). Tornatzky and Fleischer (1990a) explain that
technology, organisation and the external environment are predictors of technology adoption
decision-making within an organisation (Baker, 2012, Zhu and Kraemer, 2005, Tornatzky and
Fleischer, 1990b). The TOE framework (see Figure 2.3) is a technology acceptance model at the
organisational level and has been validated by IS researchers in different settings (Oliveira and
Martins, 2011, Baker, 2012). According to the TOE framework, the availability of technologies in
the market that are relevant to the organisation’s advancement (e.g. the Internet), organisational
structures and resources (such as inter-organisational links and an organisation’s size) and the social
environment around the organisation (such as regulations and economic structures) are the crucial
elements in technological innovation decision-making (Baker, 2012; Tornatzky and Fleischer,
1990).
Figure 2.1: UTAUT model (Venkatesh et al., 2003)
~ 16 ~
Figure 2.3: TOE framework (Tornatzky and Fleischer, 1990a)
The TOE framework is not as popular as other adoption models. One reason for this is that the
explanatory variables in the TOE framework are seen to be aligned with the explanatory variables
in other adoption models (Baker, 2012). The Technology construct, for example, is similar and
consistent with the facilitating conditions construct in UTAUT. This leads to the TOE framework
being regarded as a generic theory (Zhu and Kraemer, 2005) with more specific factors being
placed in the three constructs.
(d) Strength and limitation of the models
Overall, each of the models has various strengths and limitations. TAM has been regarded as the
parsimonious model (Hu, et.al, 1999, and Hong, Thong & Tham, 2006), but the way prior studies
treat the predictors as a blackbox has been criticized (Straub Jr and Burton-Jones, 2007) as it may
overlook new predictors relevant to different contexts. UTAUT has the same problem. Despite
being developed on previous major adoptions model including TAM, UTAUT predictors rarely
been revisited (Li and Kishore, 2006), thus further research is needed to identify new predictors. As
for TOE, this model has been too generic so the predictors in it are aligned with other adoption
model (Baker, 2012). In response to these criticisms, Baker (2012) suggests that combining
organisational and individual-level theories of adoption is the next step to the development of
technology acceptance models at the organisational level. This is precisely the approach taken in the
present study.
2.3.2. Continuance Models
In contrast to adoption models that seek to understand the motivation for initial use of a new
technology, continuance models seek to understand what drives users to continue using (or
discontinue using) a technology. Some models are specifically related to continued use, such as the
~ 17 ~
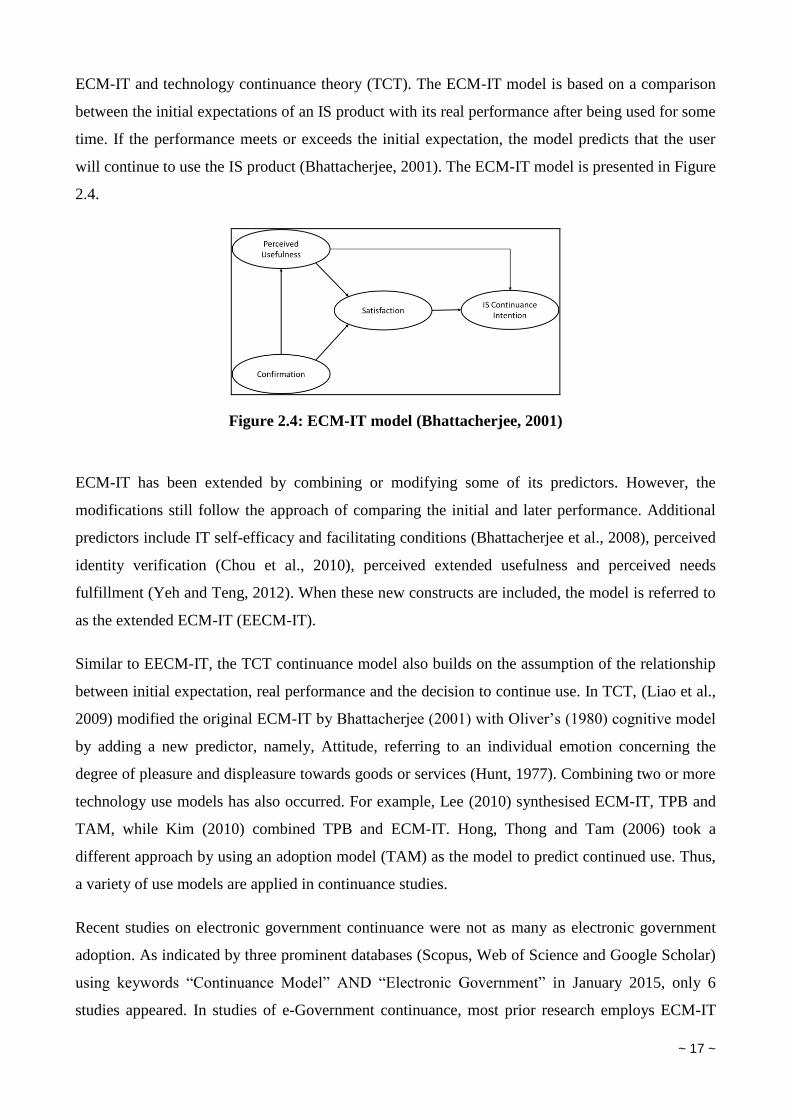
ECM-IT and technology continuance theory (TCT). The ECM-IT model is based on a comparison
between the initial expectations of an IS product with its real performance after being used for some
time. If the performance meets or exceeds the initial expectation, the model predicts that the user
will continue to use the IS product (Bhattacherjee, 2001). The ECM-IT model is presented in Figure
2.4.
Figure 2.4: ECM-IT model (Bhattacherjee, 2001)
ECM-IT has been extended by combining or modifying some of its predictors. However, the
modifications still follow the approach of comparing the initial and later performance. Additional
predictors include IT self-efficacy and facilitating conditions (Bhattacherjee et al., 2008), perceived
identity verification (Chou et al., 2010), perceived extended usefulness and perceived needs
fulfillment (Yeh and Teng, 2012). When these new constructs are included, the model is referred to
as the extended ECM-IT (EECM-IT).
Similar to EECM-IT, the TCT continuance model also builds on the assumption of the relationship
between initial expectation, real performance and the decision to continue use. In TCT, (Liao et al.,
2009) modified the original ECM-IT by Bhattacherjee (2001) with Oliver’s (1980) cognitive model
by adding a new predictor, namely, Attitude, referring to an individual emotion concerning the
degree of pleasure and displeasure towards goods or services (Hunt, 1977). Combining two or more
technology use models has also occurred. For example, Lee (2010) synthesised ECM-IT, TPB and
TAM, while Kim (2010) combined TPB and ECM-IT. Hong, Thong and Tam (2006) took a
different approach by using an adoption model (TAM) as the model to predict continued use. Thus,
a variety of use models are applied in continuance studies.
Recent studies on electronic government continuance were not as many as electronic government
adoption. As indicated by three prominent databases (Scopus, Web of Science and Google Scholar)
using keywords “Continuance Model” AND “Electronic Government” in January 2015, only 6
studies appeared. In studies of e-Government continuance, most prior research employs ECM-IT
~ 18 ~
model (Belanche et al., 2010, Kim and Zhang, 2010, Lim et al., 2013, Zhang et al., 2011). However,
some researchers combine ECM-IT with other models of IT use, such as DM-IS and ECM-IT
(Alruwaie et al., 2012) and social embeddedness and ECM-IT (Hossain et al., 2009).
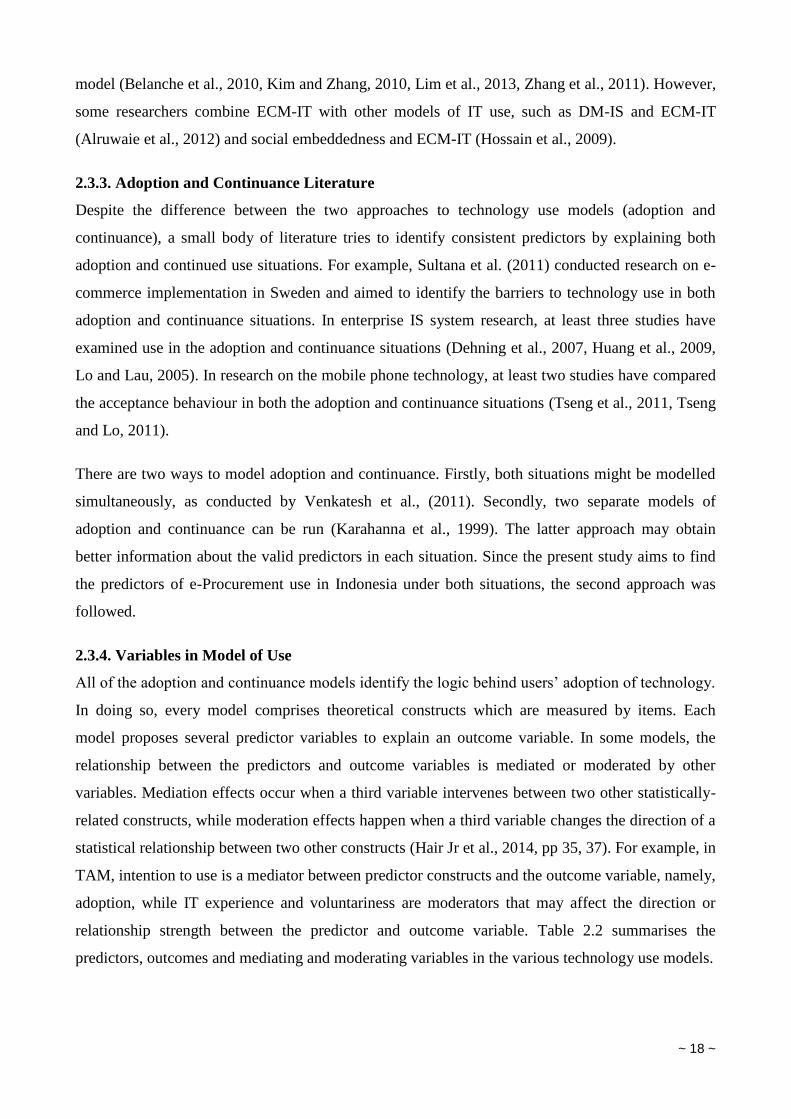
2.3.3. Adoption and Continuance Literature
Despite the difference between the two approaches to technology use models (adoption and
continuance), a small body of literature tries to identify consistent predictors by explaining both
adoption and continued use situations. For example, Sultana et al. (2011) conducted research on e-
commerce implementation in Sweden and aimed to identify the barriers to technology use in both
adoption and continuance situations. In enterprise IS system research, at least three studies have
examined use in the adoption and continuance situations (Dehning et al., 2007, Huang et al., 2009,
Lo and Lau, 2005). In research on the mobile phone technology, at least two studies have compared
the acceptance behaviour in both the adoption and continuance situations (Tseng et al., 2011, Tseng
and Lo, 2011).
There are two ways to model adoption and continuance. Firstly, both situations might be modelled
simultaneously, as conducted by Venkatesh et al., (2011). Secondly, two separate models of
adoption and continuance can be run (Karahanna et al., 1999). The latter approach may obtain
better information about the valid predictors in each situation. Since the present study aims to find
the predictors of e-Procurement use in Indonesia under both situations, the second approach was
followed.
2.3.4. Variables in Model of Use
All of the adoption and continuance models identify the logic behind users’ adoption of technology.
In doing so, every model comprises theoretical constructs which are measured by items. Each
model proposes several predictor variables to explain an outcome variable. In some models, the
relationship between the predictors and outcome variables is mediated or moderated by other
variables. Mediation effects occur when a third variable intervenes between two other statistically-
related constructs, while moderation effects happen when a third variable changes the direction of a
statistical relationship between two other constructs (Hair Jr et al., 2014, pp 35, 37). For example, in
TAM, intention to use is a mediator between predictor constructs and the outcome variable, namely,
adoption, while IT experience and voluntariness are moderators that may affect the direction or
relationship strength between the predictor and outcome variable. Table 2.2 summarises the
predictors, outcomes and mediating and moderating variables in the various technology use models.
~ 19 ~
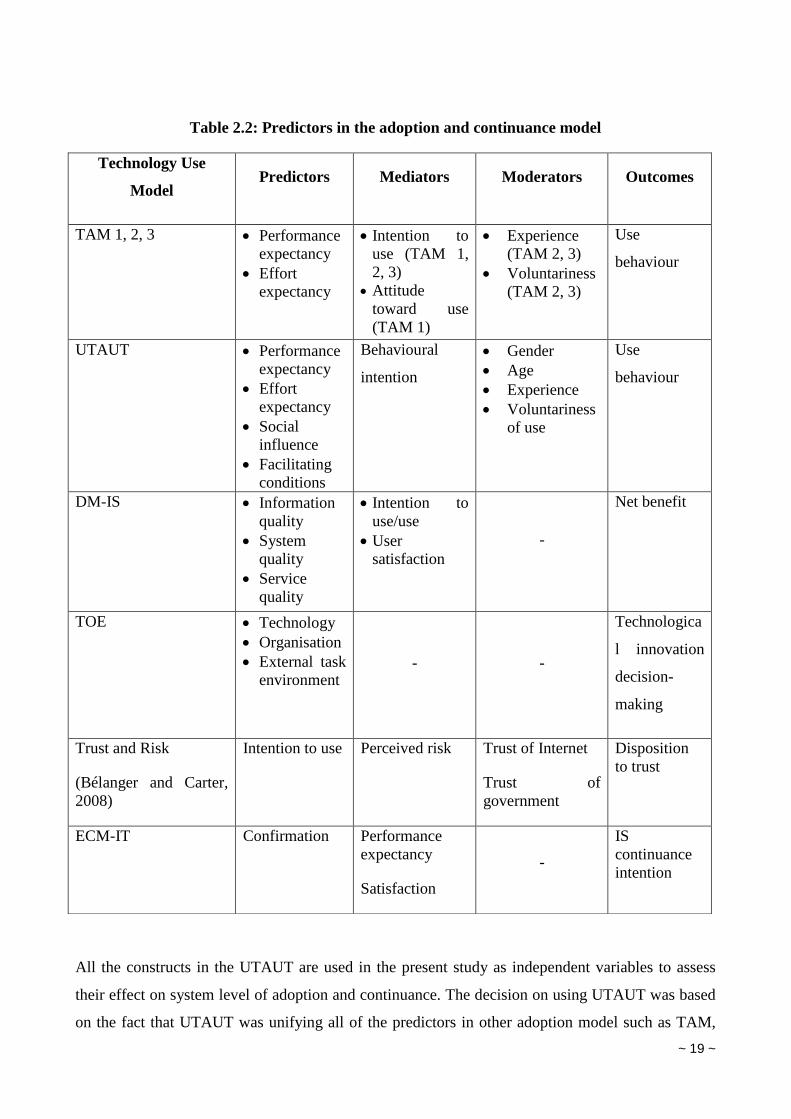
Table 2.2: Predictors in the adoption and continuance model
All the constructs in the UTAUT are used in the present study as independent variables to assess
their effect on system level of adoption and continuance. The decision on using UTAUT was based
on the fact that UTAUT was unifying all of the predictors in other adoption model such as TAM,
Technology Use
Model Predictors Mediators Moderators Outcomes
TAM 1, 2, 3 Performance
expectancy
Effort
expectancy
Intention to
use (TAM 1,
2, 3)
Attitude
toward use
(TAM 1)
Experience
(TAM 2, 3)
Voluntariness
(TAM 2, 3)
Use
behaviour
UTAUT Performance
expectancy
Effort
expectancy
Social
influence
Facilitating
conditions
Behavioural
intention
Gender
Age
Experience
Voluntariness
of use
Use
behaviour
DM-IS Information
quality
System
quality
Service
quality
Intention to
use/use
User
satisfaction
-
Net benefit
TOE Technology
Organisation
External task
environment
- -
Technologica
l innovation
decision-
making
Trust and Risk
(Bélanger and Carter,
2008)
Intention to use Perceived risk Trust of Internet
Trust of
government
Disposition
to trust
ECM-IT Confirmation Performance
expectancy
Satisfaction
-
IS
continuance
intention
~ 20 ~
TRA, TPB and DOI (Venkatesh, et. al, 2003), thus by having this model all predictors in most
adoption model has been accommodated in this study. In addition to that a study conducted by
Gupta (2008) indicated that the UTAUT is the most appropriate model for analysing e-Government
in developing countries. Moderating variables at the organisational level, specifically organisational
size, replace individual-level variables, such as gender, age and experience as in the existing
UTAUT model (see Figure 2.2). According to past research, a large organisation is more likely to
adopt IT tools and systems than a smaller one (Thong and Yap, 1995). In government organisations,
size also predisposes an organisation’s intention to adopt IT (Brudney and Selden, 1995): the larger
the government agency, the more likely it will use IT tools and systems. Voluntariness of use is not
relevant in the present study because the use of e-Procurement is mandatory for Indonesian
government agencies (see Chapter 3). After the constructs and their relationships are confirmed,
predictors of system use in government are statistically analysed. Taking into account the criticisms
of technology acceptance models in the literature, this study redefines ‘system adoption’ by creating
a new outcome variable that is relevant to the research context namely level of adoption.
2.4. Critical Success Factors for e-Government and e-Procurement Use
Seeking to understand the reasons for failure and the keys for successful e-Government
implementation is critical for achieving the benefits of e-Government. A review of the literature
indicates that several common critical success factors have been identified. Ebrahim and Irani
(2005) state that IT infrastructure, IT security and privacy, the IT skills of the user and
organisational and operational costs are the success factors in e-Government implementation. Lam
(2005) identified strategy, technology, policy and organisational factors as the primary factors in the
success or failure of e-Government integration. Other studies identify technical, organisational,
social and financial factors as the reasons behind the lack of success in e-Government adoption
(Alshehri and Drew, 2010; Alshehri, Drew and Alfarraj, 2012).
After comparing developed and developing countries, Chen et al. (2005) suggested that the e-
Government success factors differ between these two settings. In developed countries, Chen et al.
(2005) identified the presence of technical staff, technical support, collaboration between agencies,
and resource allocation as the critical success factors. In developing countries, they identified
internal financial support, external financial support, infrastructure development, technical staffing,
inter-agency collaboration, information accountability and process simplification as the key factors.
Based on a comparison of various models of technology use, Manal (2014) proposes seven factors
affecting e-Government success in developing countries: individual factors, governmental factors,
political issues, ICT infrastructure, service cost, service factors, and communication channels.
~ 21 ~
Findings in empirical field research indicate similar results. Schwester (2009) identified technical
factors, human resources and leader support as enablers of e-Government implementation in US
municipalities. Gilbert, Balestrini and Littleboy (2004) identified trust, information quality, time
and budget as the factors that predict e-Government system use in the UK. Prior empirical studies in
developing countries have also identified various critical success factors. Ifinedo (2007) found that
organisational, social and cultural, economic, and infrastructural and technical problems are the
constraints in e-Government use in Nigeria. In research in Malaysia, Talip and Narayan (2011)
found that cultural, social, psychological, technological and administrative factors were the barriers
to e-Government adoption. In Oman, mimetic, normative and coercive pressures were identified as
the reasons behind low levels of e-Government use (Mamari, Corbitt and Gekara, 2013). In Jordan,
the enablers of e-Government adoption were identified as cultural and social themes, such as
favouritism and word-of-mouth communication (Alomari, Sandhu and Woods, 2014).
Given the Indonesian context of the present study, it is important to be alert to what is known about
the critical success factors in e-Government use in Indonesia. Faruholt and Wahid (2008) found
management, infrastructure and human factors to be the critical success factors of e-Government
initiatives in a municipality in Indonesia: Sragen regency government. Kumorotomo (2009)
pinpointed culture, infrastructure and leadership as the barriers to e-Government implementation.
Comparing e-Government adoption at the local government level across Indonesia, Meithya (2004)
identified the enablers to e-Government implementation as financial support, technical skill
availability, infrastructure readiness, political will, e-Government application standards, and
government regulation. In regard to the government’s role, Salahuddin and Rusli (2005) highlighted
the lack of centrally coordinated planning as one of the barriers to e-Government in Indonesia.
Rokhman (2008) classified the critical success factors of Indonesian e-Government into three
categories, namely, bureaucrat ability in operating the Internet (peopleware), the availability of
technology and infrastructure (hardware) and organisational readiness (organoware). This review of
the literature indicates that e-Government use in developing and developed countries may share
similar critical success factors. A summary of e-Government’s critical success factors is presented
in Table 2.3.
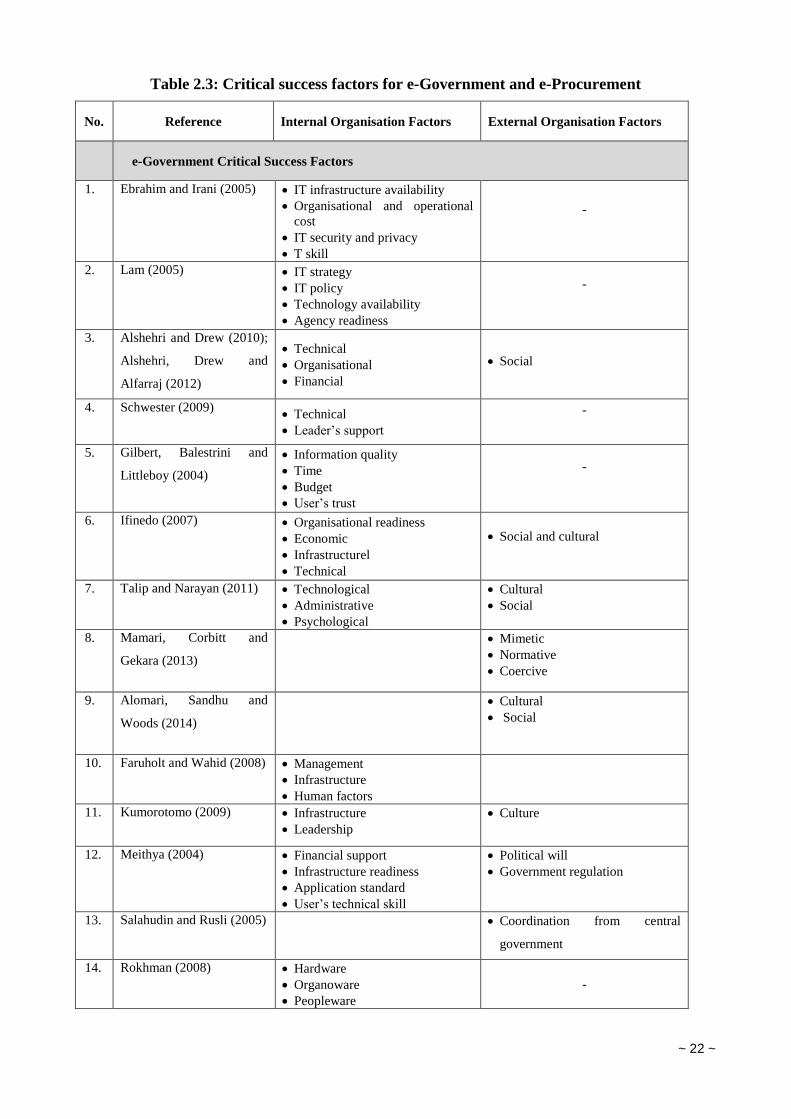
~ 22 ~
Table 2.3: Critical success factors for e-Government and e-Procurement
No. Reference Internal Organisation Factors External Organisation Factors
e-Government Critical Success Factors
1. Ebrahim and Irani (2005) IT infrastructure availability
Organisational and operational
cost
IT security and privacy
T skill
-
2. Lam (2005) IT strategy
IT policy
Technology availability
Agency readiness
-
3. Alshehri and Drew (2010);
Alshehri, Drew and
Alfarraj (2012)
Technical
Organisational
Financial
Social
4. Schwester (2009) Technical
Leader’s support
-
5. Gilbert, Balestrini and
Littleboy (2004)
Information quality
Time
Budget
User’s trust
-
6. . Ifinedo (2007) Organisational readiness
Economic
Infrastructurel
Technical
Social and cultural
7. Talip and Narayan (2011) Technological
Administrative
Psychological
Cultural
Social
8. Mamari, Corbitt and
Gekara (2013)
Mimetic
Normative
Coercive
9. Alomari, Sandhu and
Woods (2014)
Cultural
Social
10. Faruholt and Wahid (2008) Management
Infrastructure
Human factors
11. Kumorotomo (2009) Infrastructure
Leadership
Culture
12. Meithya (2004) Financial support
Infrastructure readiness
Application standard
User’s technical skill
Political will
Government regulation
13. Salahudin and Rusli (2005)
Coordination from central
government
14. Rokhman (2008) Hardware
Organoware
Peopleware
-
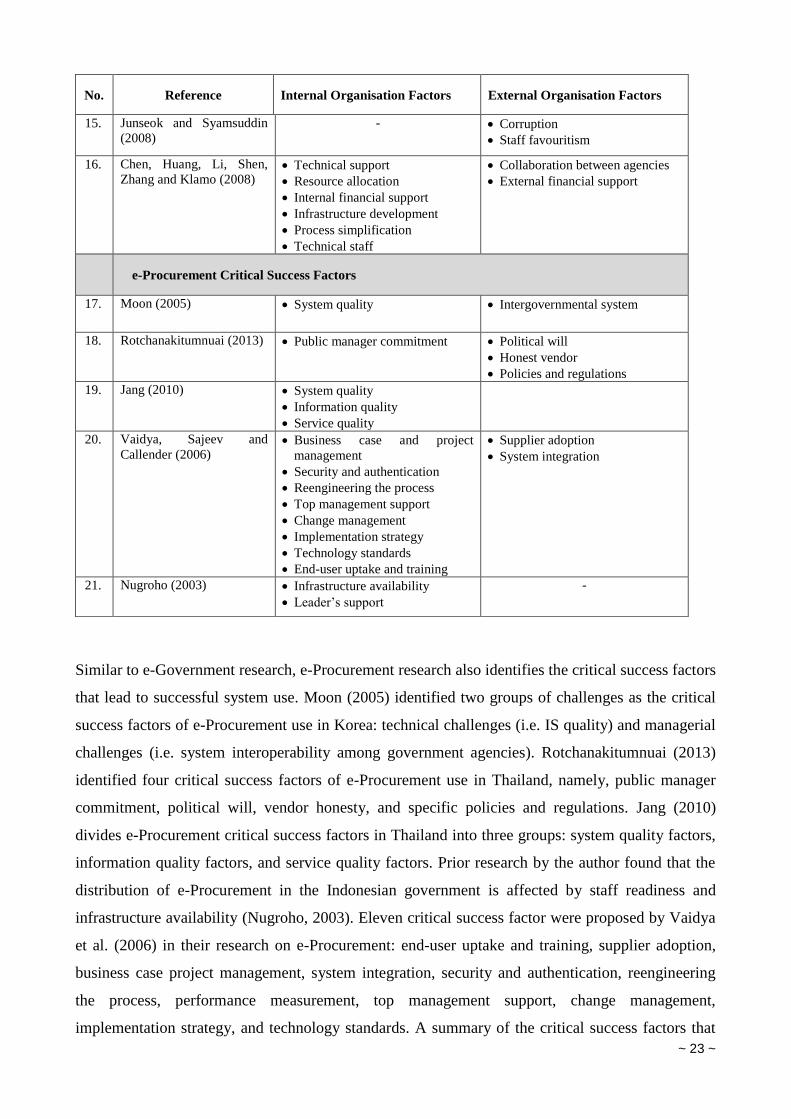
~ 23 ~
No. Reference Internal Organisation Factors External Organisation Factors
15. Junseok and Syamsuddin
(2008)
- Corruption
Staff favouritism
16. Chen, Huang, Li, Shen,
Zhang and Klamo (2008) Technical support
Resource allocation
Internal financial support
Infrastructure development
Process simplification
Technical staff
Collaboration between agencies
External financial support
e-Procurement Critical Success Factors
17. Moon (2005) System quality Intergovernmental system
18. Rotchanakitumnuai (2013) Public manager commitment
Political will
Honest vendor
Policies and regulations
19. Jang (2010) System quality
Information quality
Service quality
20. Vaidya, Sajeev and
Callender (2006) Business case and project
management
Security and authentication
Reengineering the process
Top management support
Change management
Implementation strategy
Technology standards
End-user uptake and training
Supplier adoption
System integration
21. Nugroho (2003) Infrastructure availability
Leader’s support
-
Similar to e-Government research, e-Procurement research also identifies the critical success factors
that lead to successful system use. Moon (2005) identified two groups of challenges as the critical
success factors of e-Procurement use in Korea: technical challenges (i.e. IS quality) and managerial
challenges (i.e. system interoperability among government agencies). Rotchanakitumnuai (2013)
identified four critical success factors of e-Procurement use in Thailand, namely, public manager
commitment, political will, vendor honesty, and specific policies and regulations. Jang (2010)
divides e-Procurement critical success factors in Thailand into three groups: system quality factors,
information quality factors, and service quality factors. Prior research by the author found that the
distribution of e-Procurement in the Indonesian government is affected by staff readiness and
infrastructure availability (Nugroho, 2003). Eleven critical success factor were proposed by Vaidya
et al. (2006) in their research on e-Procurement: end-user uptake and training, supplier adoption,
business case project management, system integration, security and authentication, reengineering
the process, performance measurement, top management support, change management,
implementation strategy, and technology standards. A summary of the critical success factors that
~ 24 ~
relate to e-Procurement use in particular was presented in Table 2.3 above, and shown in two large
groups of internal and external factors.
As shown in Table 2.3 above, the critical success factors for e-Procurement can be organised into
two groups based on where the critical success factors are located. Factors that come from inside an
organisation are grouped as “internal organisation factors”. Factors originating from outside an
organisation are grouped as “external organisation factors”. Examples of internal organisation
factors include infrastructure, organisational structure, budget, and internal users’ perceptions.
External organisation factors include factors in the social environment such as the regulatory and
policy framework, political will, and other organisations’ behaviours.
In the context of the present study, the summary in Table 2.3 provides a useful overview of the
existing critical success factors in system use and the differentiation of external and internal factors.
This overview of critical success factors assists the development of a conceptual model of
technology use to be applied in the present study (Chapter 3). The grouping of factors based on
whether they originate from inside or outside the organisation enables the researcher to understand
which factors are critical in the organisational decision-making on system use. Based on this
grouping, the final results of this thesis include the identification and location of the critical success
factors in e-Procurement use in government, covering factors both within and external to
government organisations, and the making of recommendations for overall government strategies to
progress e-Government use.
~ 25 ~
Chapter 3. Methodology
The objective of this study is to obtain insights into how e-Procurement is adopted in developing
countries, using Indonesia as a case study. The overarching research question addressed in this
study is: “What are the critical success factors that explain the adoption of pre-existing e-
Government solutions by government agencies within developing economies?” A set of methods
was employed to answer the research question. This chapter describes the methods that were
employed and provides the justification for choosing the methods. The description and justification
of the research methods is an important step since it brings to light the assumptions made in
performing research (Crotty, 1998).
This chapter is divided into five sections. The first section explains the case study used in this
research, followed by an overview of the research framework in Section 2. Section 3 discusses the
rationale behind choosing a two-stage, mixed method in this study. Section 4 describes the first
stage of the study in which the critical success factors of system use were identified and confirmed,
leading to the revision of the proposed model. Section 5 discusses the second stage in which the
revised model was validated. The chapter ends with a discussion of the ethical considerations taken
into account during the research.
3.1. Case Study: E-Procurement in Indonesia
A case study is a strategy of inquiry that enables a researcher to explore in depth a program or
activity (Creswell, 2009). The present study took one of Indonesia’s e-Government flagship
programs, namely, e-Procurement, as the case study. The e-Procurement system was chosen as the
case study for two reasons. First, it is a pre-existing system that is managed by the central
government for use in the public sector procurement processes. Second, there has been a significant
level of corruption in procurement in Indonesian government agencies; thus, it is worthwhile to
analyse the role of e-Procurement in overcoming the problem of corruption.
As described in Chapter 2, the procurement process is vulnerable to corruption. The high volume of
a government’s needs for goods and services combined with wide public official discretion makes
public sector procurement vulnerable to corruption, especially in Asian countries such as Indonesia
(ADB and OECD, 2007). According to Agus Rahardjo, a head of Indonesia’s public sector
procurement body, 70 per cent of all public sector corruption in Indonesia occurs during
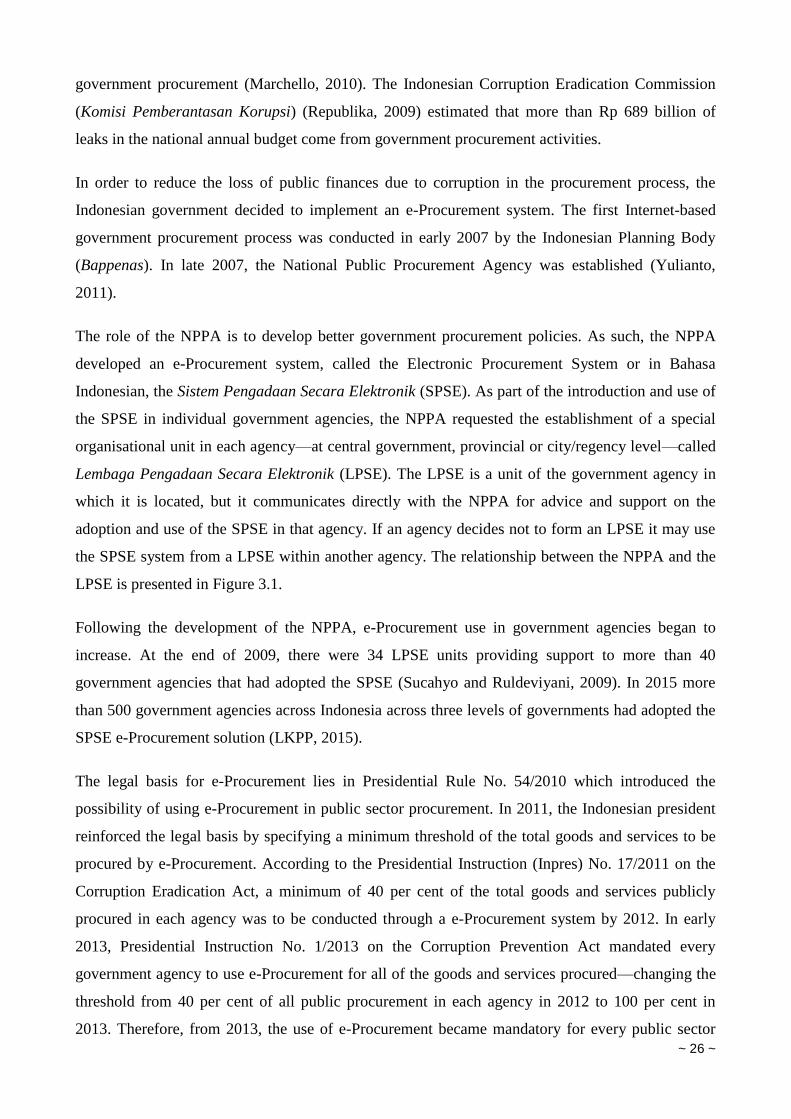
~ 26 ~
government procurement (Marchello, 2010). The Indonesian Corruption Eradication Commission
(Komisi Pemberantasan Korupsi) (Republika, 2009) estimated that more than Rp 689 billion of
leaks in the national annual budget come from government procurement activities.
In order to reduce the loss of public finances due to corruption in the procurement process, the
Indonesian government decided to implement an e-Procurement system. The first Internet-based
government procurement process was conducted in early 2007 by the Indonesian Planning Body
(Bappenas). In late 2007, the National Public Procurement Agency was established (Yulianto,
2011).
The role of the NPPA is to develop better government procurement policies. As such, the NPPA
developed an e-Procurement system, called the Electronic Procurement System or in Bahasa
Indonesian, the Sistem Pengadaan Secara Elektronik (SPSE). As part of the introduction and use of
the SPSE in individual government agencies, the NPPA requested the establishment of a special
organisational unit in each agency—at central government, provincial or city/regency level—called
Lembaga Pengadaan Secara Elektronik (LPSE). The LPSE is a unit of the government agency in
which it is located, but it communicates directly with the NPPA for advice and support on the
adoption and use of the SPSE in that agency. If an agency decides not to form an LPSE it may use
the SPSE system from a LPSE within another agency. The relationship between the NPPA and the
LPSE is presented in Figure 3.1.
Following the development of the NPPA, e-Procurement use in government agencies began to
increase. At the end of 2009, there were 34 LPSE units providing support to more than 40
government agencies that had adopted the SPSE (Sucahyo and Ruldeviyani, 2009). In 2015 more
than 500 government agencies across Indonesia across three levels of governments had adopted the
SPSE e-Procurement solution (LKPP, 2015).
The legal basis for e-Procurement lies in Presidential Rule No. 54/2010 which introduced the
possibility of using e-Procurement in public sector procurement. In 2011, the Indonesian president
reinforced the legal basis by specifying a minimum threshold of the total goods and services to be
procured by e-Procurement. According to the Presidential Instruction (Inpres) No. 17/2011 on the
Corruption Eradication Act, a minimum of 40 per cent of the total goods and services publicly
procured in each agency was to be conducted through a e-Procurement system by 2012. In early
2013, Presidential Instruction No. 1/2013 on the Corruption Prevention Act mandated every
government agency to use e-Procurement for all of the goods and services procured—changing the
threshold from 40 per cent of all public procurement in each agency in 2012 to 100 per cent in
2013. Therefore, from 2013, the use of e-Procurement became mandatory for every public sector
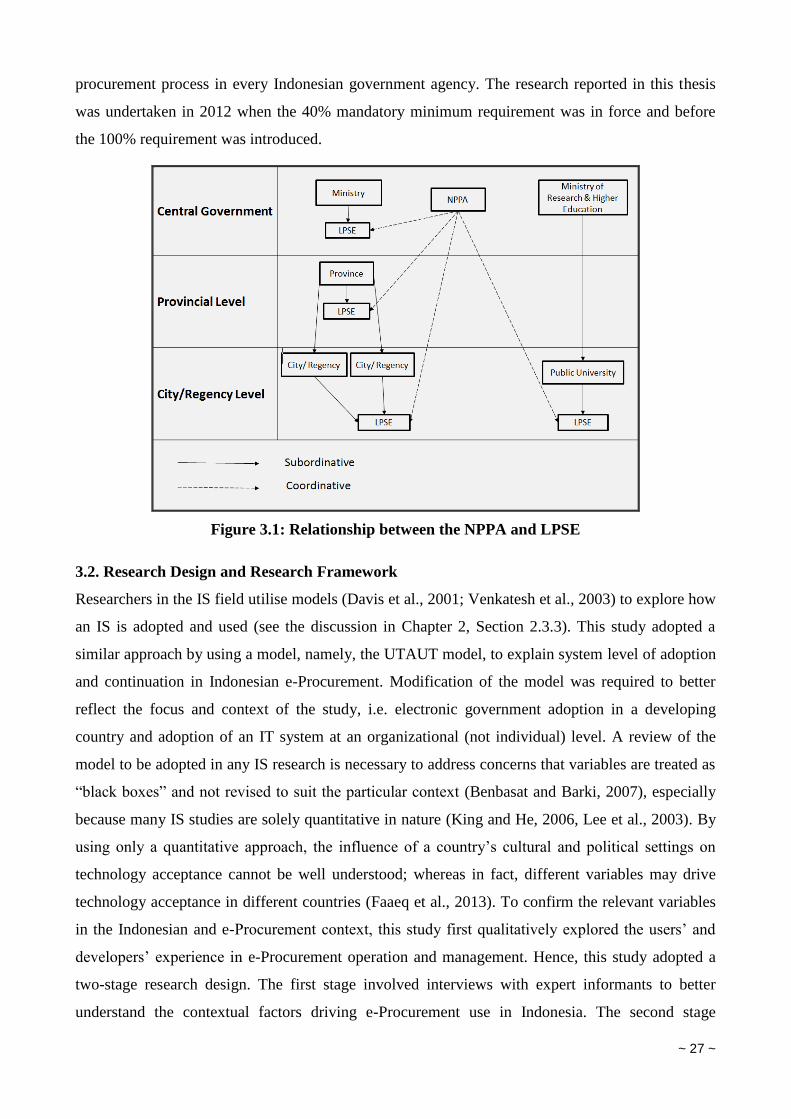
~ 27 ~
procurement process in every Indonesian government agency. The research reported in this thesis
was undertaken in 2012 when the 40% mandatory minimum requirement was in force and before
the 100% requirement was introduced.
Figure 3.1: Relationship between the NPPA and LPSE
3.2. Research Design and Research Framework
Researchers in the IS field utilise models (Davis et al., 2001; Venkatesh et al., 2003) to explore how
an IS is adopted and used (see the discussion in Chapter 2, Section 2.3.3). This study adopted a
similar approach by using a model, namely, the UTAUT model, to explain system level of adoption
and continuation in Indonesian e-Procurement. Modification of the model was required to better
reflect the focus and context of the study, i.e. electronic government adoption in a developing
country and adoption of an IT system at an organizational (not individual) level. A review of the
model to be adopted in any IS research is necessary to address concerns that variables are treated as
“black boxes” and not revised to suit the particular context (Benbasat and Barki, 2007), especially
because many IS studies are solely quantitative in nature (King and He, 2006, Lee et al., 2003). By
using only a quantitative approach, the influence of a country’s cultural and political settings on
technology acceptance cannot be well understood; whereas in fact, different variables may drive
technology acceptance in different countries (Faaeq et al., 2013). To confirm the relevant variables
in the Indonesian and e-Procurement context, this study first qualitatively explored the users’ and
developers’ experience in e-Procurement operation and management. Hence, this study adopted a
two-stage research design. The first stage involved interviews with expert informants to better
understand the contextual factors driving e-Procurement use in Indonesia. The second stage
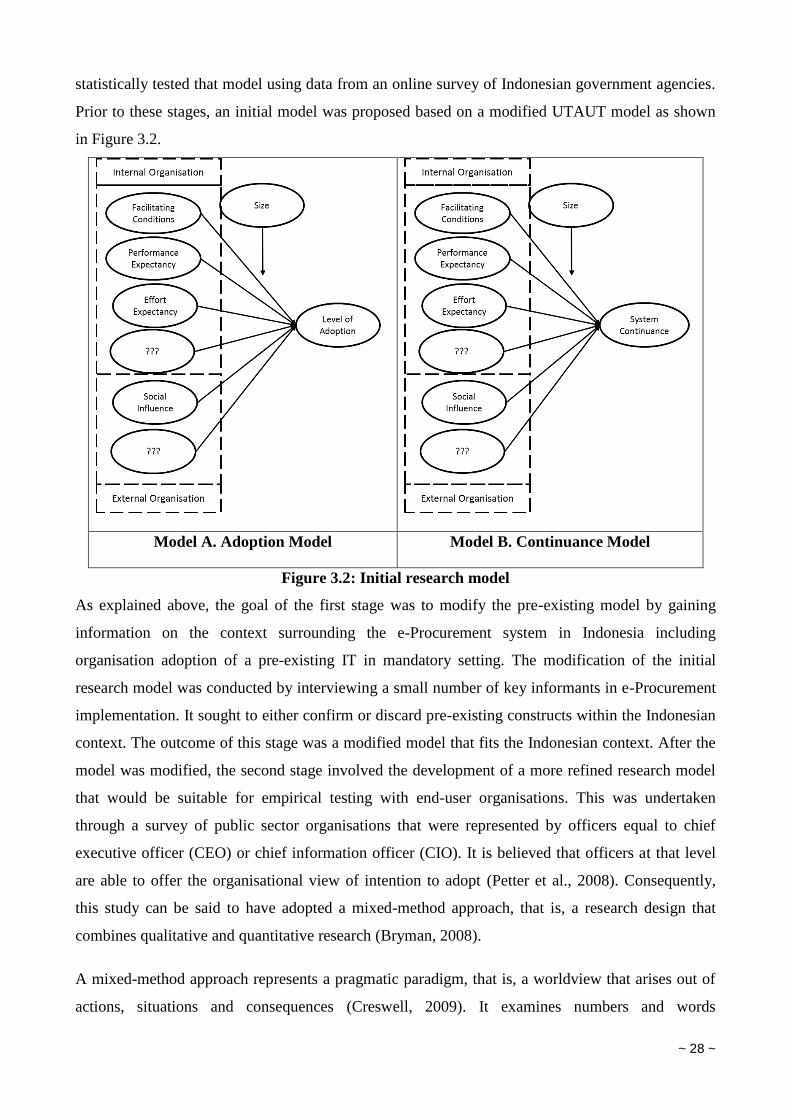
~ 28 ~
statistically tested that model using data from an online survey of Indonesian government agencies.
Prior to these stages, an initial model was proposed based on a modified UTAUT model as shown
in Figure 3.2.
Model A. Adoption Model Model B. Continuance Model
Figure 3.2: Initial research model
As explained above, the goal of the first stage was to modify the pre-existing model by gaining
information on the context surrounding the e-Procurement system in Indonesia including
organisation adoption of a pre-existing IT in mandatory setting. The modification of the initial
research model was conducted by interviewing a small number of key informants in e-Procurement
implementation. It sought to either confirm or discard pre-existing constructs within the Indonesian
context. The outcome of this stage was a modified model that fits the Indonesian context. After the
model was modified, the second stage involved the development of a more refined research model
that would be suitable for empirical testing with end-user organisations. This was undertaken
through a survey of public sector organisations that were represented by officers equal to chief
executive officer (CEO) or chief information officer (CIO). It is believed that officers at that level
are able to offer the organisational view of intention to adopt (Petter et al., 2008). Consequently,
this study can be said to have adopted a mixed-method approach, that is, a research design that
combines qualitative and quantitative research (Bryman, 2008).
A mixed-method approach represents a pragmatic paradigm, that is, a worldview that arises out of
actions, situations and consequences (Creswell, 2009). It examines numbers and words
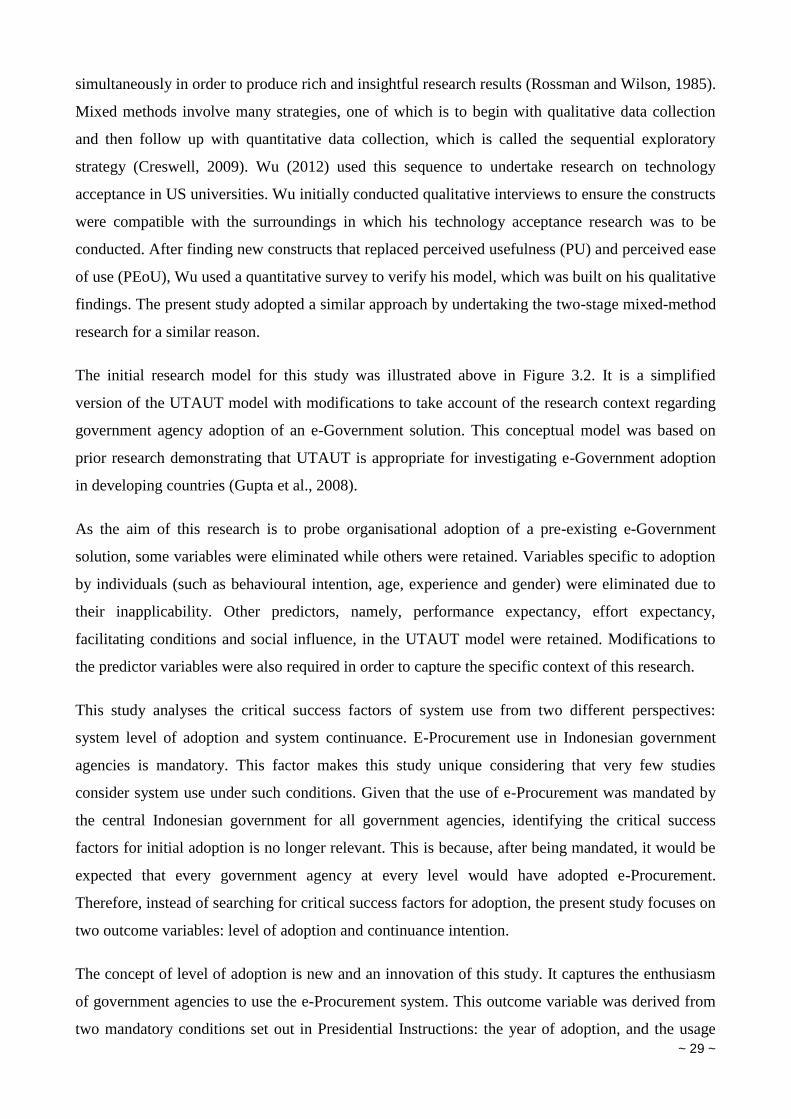
~ 29 ~
simultaneously in order to produce rich and insightful research results (Rossman and Wilson, 1985).
Mixed methods involve many strategies, one of which is to begin with qualitative data collection
and then follow up with quantitative data collection, which is called the sequential exploratory
strategy (Creswell, 2009). Wu (2012) used this sequence to undertake research on technology
acceptance in US universities. Wu initially conducted qualitative interviews to ensure the constructs
were compatible with the surroundings in which his technology acceptance research was to be
conducted. After finding new constructs that replaced perceived usefulness (PU) and perceived ease
of use (PEoU), Wu used a quantitative survey to verify his model, which was built on his qualitative
findings. The present study adopted a similar approach by undertaking the two-stage mixed-method
research for a similar reason.
The initial research model for this study was illustrated above in Figure 3.2. It is a simplified
version of the UTAUT model with modifications to take account of the research context regarding
government agency adoption of an e-Government solution. This conceptual model was based on
prior research demonstrating that UTAUT is appropriate for investigating e-Government adoption
in developing countries (Gupta et al., 2008).
As the aim of this research is to probe organisational adoption of a pre-existing e-Government
solution, some variables were eliminated while others were retained. Variables specific to adoption
by individuals (such as behavioural intention, age, experience and gender) were eliminated due to
their inapplicability. Other predictors, namely, performance expectancy, effort expectancy,
facilitating conditions and social influence, in the UTAUT model were retained. Modifications to
the predictor variables were also required in order to capture the specific context of this research.
This study analyses the critical success factors of system use from two different perspectives:
system level of adoption and system continuance. E-Procurement use in Indonesian government
agencies is mandatory. This factor makes this study unique considering that very few studies
consider system use under such conditions. Given that the use of e-Procurement was mandated by
the central Indonesian government for all government agencies, identifying the critical success
factors for initial adoption is no longer relevant. This is because, after being mandated, it would be
expected that every government agency at every level would have adopted e-Procurement.
Therefore, instead of searching for critical success factors for adoption, the present study focuses on
two outcome variables: level of adoption and continuance intention.
The concept of level of adoption is new and an innovation of this study. It captures the enthusiasm
of government agencies to use the e-Procurement system. This outcome variable was derived from
two mandatory conditions set out in Presidential Instructions: the year of adoption, and the usage
~ 30 ~
percentage. Presidential Instruction No. 17/2011 mandated every government agency in Indonesia
to use e-Procurement in 2012. However, as described previously (Section 3.1), some government
agencies had adopted the system prior to 2012, that is, before the use was mandated. The year in
which an agency adopted e-Procurement can thus be used as an indicator of the agency’s level of
enthusiasm for the technology, whereby the early adopters may be defined as more enthusiastic
about the e-Procurement idea than the later adopters who were driven by the mandatory
requirement. The usage percentage relates to the percentage of procurement processes which an
agency undertakes electronically. At the time of this research, there was a minimum required
threshold of 40% of procurement activities to be performed using e-Procurement. Like the year of
adoption, the usage percentage can be used as an indicator of the agencies’ enthusiasm for use; the
higher the usage percentage above the minimum threshold, the higher the enthusiasm of an agency
to use the e-Procurement system. The model for the level of adoption outcome variable is presented
above in Figure 3.2A.
Figure 3.2B above depicts the model for continuance intention. Continuance intention represents
the willingness of a government agency to continue to use e-Procurement after initial adoption. It is
interesting to probe this outcome considering some e-Government programs in developing countries
have been abandoned after being successfully adopted (Heeks, 2003). While it would be expected
that all agencies would indicate an intention to continue to use e-Procurement given that it is
mandatory, the study on system continuance would be able to identify the critical success factors
that lead to continued system use—in other words, the factors that drive agencies to continue to use
e-Procurement. As little is known from the literature about the critical success factors of system
continuance in a mandatory setting, this study may bring new understanding to the body of
knowledge by researching such a situation.
As gleaned in the literature review (Chapter 2, Table 2.3), a wide variety of critical success factors
for e-Government adoption have been identified in the literature. These can be classified into two
main groups: external organisational factors, and internal organisational factors. External
organisational factors refer to all factors outside the organisation. The construct in the UTAUT
model that is within this group is social influence. Social influence in the present study is defined as
the social environment surrounding the government agency. According to the literature, the
dimensions of social influence are mimetic, coercive and normative pressures (Teo et al., 2003b),
the social and cultural environment, and organisational image (Alomari et al., 2014). These
dimensions were used to measure social influence in the present study. The possibility of new
external organisational constructs emerging from the interview data was reflected in the bubbles
with question marks in Figure 3.2.
~ 31 ~
The second group of constructs is internal organisational factors, referring to all factors inside the
organisation. The constructs in UTAUT that fall within this group are facilitating conditions,
performance expectancy and effort expectancy. Facilitating conditions refers to the technical and/or
organisational structures that exist to support system use. Indicators such as training availability,
technical support availability from TAM 3 (Venkatesh and Bala, 2008) and infrastructure
availability from the TOE framework (Tornatzky and Fleischer, 1990) were employed in the
present study. Performance expectancy represents the usefulness of the system. It measures the
organisational perception of the usefulness of an electronic system. Effort expectancy is defined as
the organisational perception of the ease of using an electronic system.
Apart from these main constructs, researchers have explored the possibility of corruption as a new
predictor of system use that could be highly relevant in developing country conditions (Doig and
Riley, 1998, Hors, 2000) and corruption has been identified as a barrier to e-Government adoption
in Indonesia (Hwang and Syamsuddin, 2008). Thus, in Stage 1 of this study, consideration of
corruption as a factor in e-Procurement use was discussed. This new critical success factor may be
grouped with the internal organisational factors.
3.3. Stage 1: Confirming and Identifying Models
The objective of Stage 1 was to identify and refine the constructs and instruments used to measure
the dependent variable and independent variables outlined in the initial research model (Figure 3.2).
As revealed in the conceptual framework, the intention to adopt e-Procurement is a dependent
variable, and is predisposed by independent variables and moderating variables. Those variables
were identified from the literature. However, in order to adjust the variables to be appropriate for
the Indonesian context, interviews with key policy-makers and e-Procurement system users
provided a way to better understand the context of the research. In doing so, exploratory research
was undertaken.
Exploratory research follows a small-sample design and is used primarily for gaining insight into
and ideas about research problems, the variables related to those problems (McNabb, 2002) and the
relationships between them (Mather, 2010). Individuals with knowledge and experience about e-
Procurement adoption in Indonesia were interviewed in order to gain the necessary information.
Such participants are were known as key informants, and the process is referred to as key informant
interviews (McNabb, 2002).
The interview responses were classified into groups of similar characteristics. By so doing, it was
possible to interpret participants’ views in certain social contexts and to establish the meanings of
phenomena based on the key policy-makers’ views on e-Procurement implementation barriers. The
~ 32 ~
following sub-sections explain the data collection, analysis and the sampling in Stage 1 of this
research in more detail.
3.3.1. Interview Structure
To obtain the informants’ perceptions on the current conditions, barriers and constructs, this study
used a semi-structured interview method. Such a technique is appropriate for specific and focused
research topics (Fossey et al., 2002). This kind of interview posits questions less specifically than
the structured interview which is employed in quantitative research (Bryman, 2008). During the
interviews, the researcher was equipped with an interview guide containing specific topics and
well-developed sequenced questions (Patton, 1987).
In order to gain the information needed, an interview guide was prepared covering the key topics
(Appendix B). The key topics of the interview were structured around the constructs in the research
model (Figure 3.2), namely, facilitating conditions, social influence, performance expectancy and
effort expectancy. The questions sought to explore in depth the nature of these constructs in the
research context. Questions on general topics such as probing the initial use of e-Procurement and
gaining insights into differences in e-Procurement use were asked of the respondents. Given that
this study sought to examine the role of corruption in e-Procurement use, comments on the impact
of corruption on system level of adoption and continuance were also prompted in the interviews.
Finally, the interview guide included questions to identify other concerns held by the respondents
that might not be captured by the pre-existing constructs. The interviews were designed to enable
new variables relating to e-Procurement use to emerge.
3.3.2. Sampling & Recruitment
This study sought to interview key informants in e-Procurement adoption, that is, senior
government officials who were either e-Procurement policy-makers or e-Procurement system users.
The key informant technique involves only sampling people who have certain knowledge required
for answering the research questions (Bryman, 2008, McNabb, 2002). In this case study, the key
informants were divided into two groups: NPPA officers, and e-Procurement users. First, senior e-
Procurement policy-makers at the NPPA with knowledge and experience on the policy and
technical dimensions of e-Procurement at the national level were sought in order to gain insights
into the system’s critical success factors. Second, e-Procurement users were represented by senior
LPSE staff who were able to offer an organisational view of their agency’s considerations about e-
Procurement adoption and use. This study sought a minimum of eight respondents to obtain
saturation (McCracken, 2008). A minimum of two respondents and six respondents were targeted
for the NPPA officers and senior LPSE staff, respectively. In order to capture the variety of
~ 33 ~
organisations, the LPSE staffs were recruited from central and local government agencies and from
public universities. Unique variations of users such as early adopters, late adopters and users of
different e-Procurement systems were sought. Initial emails were sent to the potential interviewees
through professional email addresses publicly available on the Internet. In a few cases, other
interviewees were recruited based on the recommendation of an interviewee, that is, a snowballing
approach.
3.3.3. Data Analysis
When analysing the interview data, the researcher extracted the key themes that arose during the
interviews using a technique known as thematic analysis (Schütte, 2012). According to Aronson
(1994), this technique consists of five steps: (1) Audio-recording the interviews; (2) Transcribing
the conversations; (3) Seeking patterns in the interviews; (4) Categorising any patterns into sub-
themes; and (5) Creating a theme based on the literature review. For the task of categorising
patterns into sub-themes, the researcher relied on the initial research model (Figure 3.2) and on the
literature review (Chapter 2). The present study used the initial research model and literature review
as guidance in searching for the regularities and differences between the interviewees’ answers, as
well as identifying and understanding new critical success factors that may have arisen during the
interviews. NVivo 10 software was employed at this stage to assist data management during the
qualitative data analysis.
3.3.4. Trustworthiness
The quality of research is determined by the ability of the researcher to reveal their method and
address rigor. In qualitative research this is referred to as trustworthiness. The strategies to address
the four trustworthiness criteria of transferability, dependability, conformability and credibility are
described in this section.
This research looks closely at one case; therefore, the results of this study can only be carefully
extrapolated to other systems with different settings and functions. The interviews were conducted
in such a way to enable the respondents to give a rich description of their decisions to use an e-
Procurement system in their agency. By so doing, transferability of findings is enhanced because
rich descriptions from the respondents provide sufficient information to judge the appropriateness
of the research findings to other contexts (Lincoln and Guba, 1985).
The other strategy that was taken during the research process was peer examination. This strategy
helps to ensure the credibility and conformability of the research (Krefting, 1991). Several peer
examinations were conducted in the course of this study. First, the researcher’s supervisors audited
a sample of the raw data transcription. Second, the translation from Bahasa Indonesian to English
~ 34 ~
was audited by peers in a similar field of study. Third, the overall research process was audited in
three work-in-progress seminars at the University of Queensland. Fourth, part of the results was
presented at the European Conference on e-Government (ECEG) 2014. Fifth, the research process
and qualitative stage results were discussed with prominent scholars in the e-Government field via
email and professional conversations. This auditing process ensured the credibility and
dependability of the research process and reduced the opportunity for personal bias and theoretical
inclinations (Lincoln and Guba, 1985, Bryman, 2008).
The verbatim interview data were retained to ensure the conformability and credibility of the
research. This step enables an investigator to provide necessary documentation that supports the
analysis and interpretation undertaken in the research process (Lincoln and Guba, 1985). During
interviews, the investigator spent sufficient time with the respondents as a strategy to ensure
credibility (Krefting, 1991). This prolonged engagement (Lincoln and Guba, 1985) enabled the
researcher to identify reappearing patterns, themes and values in the use of e-Procurement in
Indonesian government agencies (Krefting, 1991).
3.4. Stage 2: Model Validation
The objective of Stage 2 was to statistically test the research model that was developed during the
previous stage. This was done by applying the model to a larger sample using a quantitative
research approach. Therefore, a survey method was employed to gather agency-level perceptions
about the e-Procurement system and the agency’s adoption and use of the system. The ways in
which the data in the second stage were collected and analysed are described in the following sub-
section.
3.4.1. Data Collection
Since the Indonesian government agencies that are relevant to e-Procurement adoption are scattered
all over Indonesia, the study used an online survey. The use of the Internet as a tool to disseminate
surveys has grown in recent years. This method provides low-cost data collection with a response
rate that is comparable to a mail survey (Kaplowitz, Hadlock and Levine., 2004), and fast response
times (Bryman, 2008). This method also has some disadvantages. Since it runs on the World Wide
Web, the targeted population must have an Internet connection. Fortunately, in this study it could be
presumed that all the potential respondents would have access to and familiarity with the Internet.
3.4.2. Sampling
The respondents in Stage 2 of this research were the users of an e-Procurement system in four
groups of adopters: city/regency government, provincial government, central government and
public universities. The respondents were the senior officers who had responsibilities in the e-
~ 35 ~
Procurement adoption and process in the agencies. The respondents were asked to complete the
survey to provide an organisational perspective. All the respondents held degrees or equivalent
professional experience, all were over 21 years and all were employed in the government agencies
at various levels or the public universities.
A minimum of 70 respondents were needed for the survey. This is because PLS SEM require a
minimum sample size of 10 times the maximum number of arrows leading to the latent variable
(Hair, et.al, 2014; Barclay Higgins and Thompson, 1995). In this study 7 arrowheads point to the
latent variable, therefore 70 respondents were used as the minimum sample size. A list of relevant
government agencies was publicly available on the NPPA website. All of the approximately 500
government agencies that were on the list were invited to join the survey through email. The email
address provided on the NPPA website is the email of the LPSE senior staff member who, it was
expected, would be able to provide organisational insights into e-Procurement adoption and
continued use. Prior to the survey taking place, initial contact with the NPPA was made and the
NPPA agreed to contribute to the research.
3.4.3. Survey Design and Development of the Constructs
The confirmed constructs in the model as identified in the review of the literature were checked. If
the construct had a measurement, the measurement was employed in this study with minor
adjustments. The new construct needed a new measurement. To validate the new measurement, this
study conducted a panel study consisting of experts in the field of government procurement. The
result of this expert study was a new measurement for the new construct. The questionnaire
development is explained in Chapter 5.
The survey covered seven main topics. The first topic was about demographic information. It
included basic questions about the respondents, their organisation’s location and type,
organisational size, year of e-Procurement adoption and percentage of procurement undertaken
electronically. Future e-Procurement use was the second topic. This covered the organisational
continuance intention. The remaining sections of the survey covered the key constructs in the
conceptual model (Figure 3.2) as revised after Stage 1, including facilitating conditions, the social
environment, effort expectancy and performance expectancy.
The aim of the first stage was to create an adoption/continuance model based on the context of the
research. In existing e-Government system initial adoption and continuation research, the
predictors’ constructs are measured using a minimum of two items for each construct and using a
Likert scale (Venkatesh et al., 2003, Bhattacherjee, 2001, Davis, 1985). This study took a similar
approach by having a minimum of two items for each construct and measuring each item using a
~ 36 ~
statement requiring a Likert scale response. Each item was presented as a statement with a Likert
scale response from 1 (being “strongly disagree”) to 5 (being “strongly agree”). The item questions
were taken from the literature where possible and appropriate.
3.4.4. Data Analysis
The purpose of Stage 2 was to test and validate the model that was revised at the end of Stage 1.
The modified UTAUT model was tested in two perspectives: system level of adoption, and system
continuance. Previous studies in e-Government have employed SEM when assessing models of IT
adoption and continued use. Horst et al. (2007a), Verdegem and Verleye (2009), Seyal and Pijpers
(2004) and Padhi and Mohapatra (2010) employed this technique in their research on e-Government
adoption. The UTAUT model was developed using PLS-SEM (Venkatesh, 2003). The decision to
use PLS-SEM to analyse the UTAUT model replicates other researchers’ approaches to research on
mobile technology adoption (Lai and Jordan, 2009) and e-Government (Afonso et al., 2012,
Neupane et al., 2014). Prior research utilises SEM and PLS-SEM to identify the predictors of
system use and system continuance.
In conducting data analysis, this study used PLS-SEM. There are two types of SEM: covariance-
based SEM (also referred to as SEM), and component-based SEM (also known as PLS-SEM)
(Wetzels et al., 2009). SEM is usually used for testing and confirming well-established theory,
while PLS-SEM is preferable for exploratory studies to build a new theory by finding the predictors
of a model (Lowry and Gaskin, 2014, Hair Jr et al., 2014). SEM requires a large sample size, while
PLS-SEM can be used on relatively smaller samples (Chin, 2010, Hair Jr et al., 2014, Lowry and
Gaskin, 2014). PLS-SEM works well in a non-normal distribution data compared to SEM (Chin,
2010, Hair Jr et al., 2014, Lowry and Gaskin, 2014). PLS-SEM was chosen as the data analysis
approach in Stage 2 for reasons of flexibility and versatility.
Further details about Stage 2, including the survey respondents and data analysis, are provided in
Chapter 5. The data analysis (as discussed in Chapter 5, Sections 5.6 and 5.7) followed the
recognised reporting procedure of PLS-SEM analysis and is consistent with prior research testing e-
Government adoption models (Chin, 2010; Hair et al., 2014; Lowry and Gaskin, 2014). The
procedure starts with the measurement model, model structuring and ends with mediation and
moderation analysis. The measurement model tests the reliability and validity of the measurements
used to represent each construct (Chin, 2010). Several tests were conducted to test the internal
consistency reliability, discriminant validity and convergent validity prior to model structuring. The
validity and reliability tests are discussed in detail below (Section 3.4.5).
~ 37 ~
After the measurements are confirmed to be valid and reliable, the next step involves the
performance of structural model examination (Chin, 2010; Hair et al., 2014). The structural model
is then evaluated by its coefficient determination (R2), predictive relevance (Q
2), goodness of fit
(GoF) and standardised root mean square residual (SRMR). R2 represents the combined effects of
endogenous variables on the exogenous variable (Hair et al., 2014). A value larger than zero for Q2
indicates the path model’s predictive relevance to the particular reflective endogenous construct
(Sarstedt, Ringle, Henseler and Hair, 2012). GoF was proposed by Tenenhaus, Amato and Vinzi
(2004) to measure PLS model performance (Chin, 2010) with reflective indicators (Henseler and
Sartsedt, 2013). The SRMR measures the root mean square difference between the observed
correlations and the model-implied correlations (Hu and Bentler 1998; 1999; Kline 2011). Ronko
and Evermann (2013) expressed doubts about the use of SRMR in evaluating PLS-SEM; however,
Henseler et al. (2014) addressed the issues raised in Ronko and Evermann’s research by ensuring
that SRMR can detect model misspecification in PLS-SEM. Therefore, the present study calculated
the SRMR value as suggested by Henseler et al. (2014). The details of each statistical test for each
step in the measurement model and model structuring are presented in Appendix D.
3.4.5. Reliability and Validity
The inclusion in the research model of measurements and indicators of existing variables that have
been validated and tested in the literature (see Figure 3.2) ensured that the item measurements’
content validity was established. For new constructs and measurement items, a panel of experts was
used to test the inter-rater reliability (Moore and Benbasat, 1991). Furthermore, to ensure the
content validity of the measurement, Lawshe’s (1975) content validity ratio (CVR) was used.
Prior to model structuring, a series of validity and reliability tests should be conducted including
composite reliability, convergent validity and discriminant validity. Composite reliability is suitable
for testing internal consistency reliability in PLS-SEM (Hair, Ringle and Sarstedt, 2011).
Composite reliability takes into account the different correlations between items and the variable
scores (Werts, Linn and Jöreskog, 1974) unlike Cronbach’s alpha (Cronbach, 1951) which assumes
that all items have equal correlations (Huntgeburth, 2014). Convergent validity ensures that
measurements that should be related are in reality related (Trochim, 2006). The average variance
extracted (AVE) is the criterion for convergent validity; it measures the sum of the squared loadings
divided by the number of indicators (Hair et al., 2014). Discriminant validity ensures that
measurements that should not be related are in reality not related (Trochim, 2006). Fornell and
Larcker (1981) proposed a criterion that compares the square root of the AVE values with the latent
variable correlations, whereby the AVE should exceed the squared correlations with any other
~ 38 ~
construct (Hair et al., 2014, p. 105). The above tests were conducted to ensure the statistical
reliability and validity of the Stage 2 research.
3.5. Ethics
The main ethical issues relating to both stages of the research were informed consent and
confidentiality. Following standard UQ ethical procedures, prospective respondents invited to
participate with their informed consent. In addition, the researcher explained to the respondents that
their privacy would be maintained by keeping their participation confidential and anonymous
(Bryman, 2008, Trochim, 2006). Their names and positions are concealed in the reporting of the
results. By following this procedure, the respondents would not be identifiable. The study was
approved by the UQ Ethics Committee (ethical clearance identification number 2014000111).
~ 39 ~
Chapter 4. Interview Results
4.1. Introduction
This chapter analyses the first stage of the research. In this stage, a qualitative research approach
was employed to collect and analyse research data. Ten respondents from six government agencies
were interviewed. Among the ten respondents, three were from the NPPA, the central government
agency responsible for promoting e-Procurement adoption including creation of the e-Procurement
system namely SPSE. Four user respondents were from two local government agencies at the
regency/city level, and two were from government-owned universities. In order to gain more
insights into e-Procurement use, a respondent from the central government ministry that had utilised
a different e-Procurement system was also interviewed (see Appendix A for details about
participants). The interviewees were purposefully selected to involve individuals with high-level
organisational knowledge about IT strategy, in positions equal to LPSE senior staff (see Chapter 3).
The interviews took between 45 and 75 minutes, and were audio-recorded. The Bahasa Indonesia
language was used in the interviews in order to gather genuine information and emotion from the
respondents. The interview recordings were fully transcribed in Bahasa Indonesia and analysed, and
then fully translated into English for reporting purposes.
The purpose of the interviews was to obtain an understanding of the experience of e-Procurement
use in Indonesia among various government agencies. The insights from these interviews were then
used to assess the applicability of standard UTAUT constructs in Indonesia and identify possible
new constructs not included in the initial research model (Figure 3.2). The results of the
confirmation and identification of the constructs were then used in the second stage of the research
which surveyed government agencies about the use of e-Procurement (see Chapter 5).
This chapter reports the standard UTAUT confirmed in the interviews and the other constructs
identified from the interviews. All of those constructs were later employed to explain system use.
Hereafter, a description of the findings is presented. The presentation of findings is divided into two
main groups of predictors: external organisational factors (i.e. social influence and external
organisation strategy), and internal organisational factors (i.e. facilitating conditions, top
management support, performance expectancy, and effort expectancy). Interview results on system
use as the outcome variable and size as a mediating variable is presented afterwards. This chapter
ends with the revised model and hypotheses.
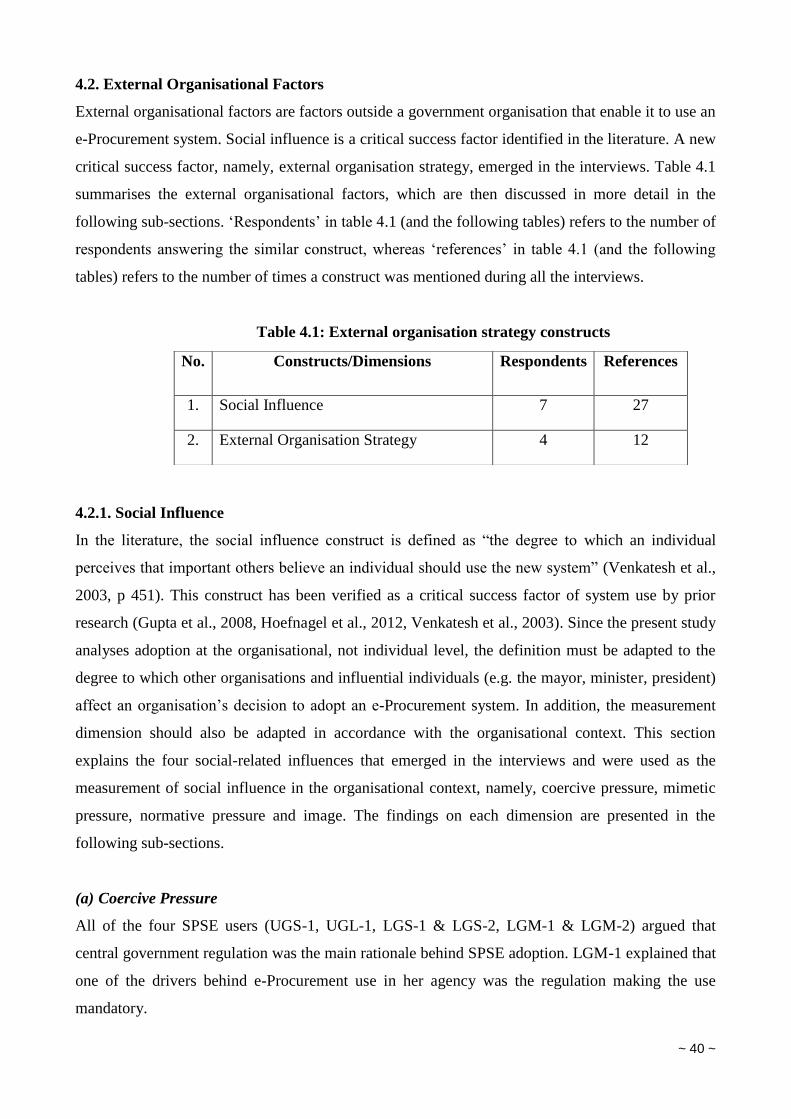
~ 40 ~
4.2. External Organisational Factors
External organisational factors are factors outside a government organisation that enable it to use an
e-Procurement system. Social influence is a critical success factor identified in the literature. A new
critical success factor, namely, external organisation strategy, emerged in the interviews. Table 4.1
summarises the external organisational factors, which are then discussed in more detail in the
following sub-sections. ‘Respondents’ in table 4.1 (and the following tables) refers to the number of
respondents answering the similar construct, whereas ‘references’ in table 4.1 (and the following
tables) refers to the number of times a construct was mentioned during all the interviews.
Table 4.1: External organisation strategy constructs
4.2.1. Social Influence
In the literature, the social influence construct is defined as “the degree to which an individual
perceives that important others believe an individual should use the new system” (Venkatesh et al.,
2003, p 451). This construct has been verified as a critical success factor of system use by prior
research (Gupta et al., 2008, Hoefnagel et al., 2012, Venkatesh et al., 2003). Since the present study
analyses adoption at the organisational, not individual level, the definition must be adapted to the
degree to which other organisations and influential individuals (e.g. the mayor, minister, president)
affect an organisation’s decision to adopt an e-Procurement system. In addition, the measurement
dimension should also be adapted in accordance with the organisational context. This section
explains the four social-related influences that emerged in the interviews and were used as the
measurement of social influence in the organisational context, namely, coercive pressure, mimetic
pressure, normative pressure and image. The findings on each dimension are presented in the
following sub-sections.
(a) Coercive Pressure
All of the four SPSE users (UGS-1, UGL-1, LGS-1 & LGS-2, LGM-1 & LGM-2) argued that
central government regulation was the main rationale behind SPSE adoption. LGM-1 explained that
one of the drivers behind e-Procurement use in her agency was the regulation making the use
mandatory.
No. Constructs/Dimensions Respondents References
1. Social Influence 7 27
2. External Organisation Strategy 4 12
~ 41 ~
Quote 1
LGM-1: “Yes we adopt SPSE as mandated by regulation.”
UGS-1 believed that adopting the SPSE was obligatory as it was mandated in the central
government regulation. Therefore, the government-owned university where he works adopted it.
Quote 2
UGS-1: “Because it is mandated by regulation and if we deal with the
central government’s policy, whether we like it or not, we have to
follow it.”
UGL-1 and LGM-2 gave a more detailed description of the regulation by explaining that all
government agencies have to perform 40 per cent of their procurement process through e-
Procurement. According to LGM-2, the President’s Instruction No. 17 accelerated SPSE adoption
because it required that 40 per cent of the procurement process in an agency should be performed
through the SPSE.
Quote 3
LGM-2: “[as in the] President’s Instruction No. 17 about e-Procurement
adoption acceleration, in that Instruction 40 per cent of the local
government’s budget should be spent using e-Procurement.”
His argument was confirmed by UGL-1 who added the 40 per cent requirement had impelled
government agencies to adopt SPSE.
Quote 4
UGL-1: “In 2012 they have to use e-Procurement. In 2011 they should
announce it [the procurement through the Internet] and in 2012 40
per cent of the agency budget should be spent electronically. That
will encourage them right? It means the regulation pushes them,
right?”
CGP-1, a respondent who used a different e-Procurement system also affirmed regulation as the key
to SPSE adoption.
Quote 5
CGP-1: “Why is SPSE used? Because there is a clear regulation that every
local government is obliged to form an Electronic Procurement
Service Body [i.e. LPSE]. That is the reason why e-Procurement
grows rapidly.”
To gather more information about non-adopters, the respondents were asked about the possibilities
of government agencies avoiding e-Procurement use in the future. Respondent UGL-1 answered
~ 42 ~
with the opinion that there would be punishment if a government agency decided to not adopt or use
the SPSE.
Quote 6
UGL-1: “If they [government agencies] don’t use it there would be
punishment.”
According to NPPA-1, the President’s regulation on e-Procurement gives the NPPA no legal power
to sanction. According to him, despite some focus on sanctioning, the NPPA pays more attention to
ensuring users receive the benefits from using the e-Procurement system.
Quote 7
NPPA-1: “[Mandated by] Perpres [presidential rule] right? Perpres doesn’t
have legal sanctions. In Indonesia there is only national and local
legislation [that have legal sanctions]. Besides those two can’t be
sanctioned. Since this is Perpres, we can’t sanction them. So what
we can give them [potential adopters] is showing them the benefit
of the system, not sanctioning them.”
The respondents from the NPPA expressed different opinions about the role of the mandatory
regulation in e-Procurement system use. All of them considered that the regulation acted as a tool,
rather than as the main enabler of SPSE adoption. For example, NPPA-2 said that not all
government agencies were motivated by the regulation mandate.
Quote 8
NPPA-2: “Some agencies need regulation, some others do not. Principally
we provide whatever they ask as long as they use e-Government
Procurement. Therefore no more excuses for not adopting it.”
NPPA-3 confirmed this by saying that the regulation was used to persuade a government agency.
He also added that, based on his field experience, the non-regulation factor was more effective in
motivating a government agency to adopt the SPSE.
Quote 9
NPPA-3: “Regulation is used to persuade a government agency so it should
be there. But according to my field experience, after handling this
work, the non-regulation factor is more effective. Yes, regulation
existence is relatively necessary, because government agencies
need regulation as a basis for their action.”
Moreover, he emphasised why regulation was not the main factor in SPSE adoption. In explaining
this, he explained the history of SPSE adoption. He said that before the government regulation was
~ 43 ~
approved in 2010, the number of SPSE adopters had reached 100 agencies out of more than 500
agencies.
Quote 10
NPPA-3: “That’s why I do not really agree with regulation [as the main key
success factor of adoption] because we already started in 2008 and
regulation just came up in 2010. At that time there was more or
less 100 LPSEs [had adopted e-Procurement].”
While the NPPA respondents understated the effect of regulation on system adoption, the views of
the SPSE users echoed the findings of prior studies in the IS field that regulation is a relevant factor.
For example, the technology organisation and environment (TOE) framework (Tornatzky et al.,
1990) is one of the adoption models that places regulation as a factor that influences technology
adoption. According to this theory, the presence of government regulation may support or hinder
innovation in an organisation (Baker, 2012). Research on the Financial Electronic Data Interchange
found that coercive pressure from a parent corporation resulted in better innovation adoption by its
child corporation (Teo et al., 2003). Coercive pressure can come in the forms of formal and
informal pressure on an organisation from other organisations on which they are dependent
(DiMaggio and Powell, 1991). In the present study, the respondents’ answers and the review of the
literature on the effect of regulation on innovation adoption led to the decision to include coercive
pressure as one of the dimensions in the adapted social influence construct.
(b) Mimetic Pressure
Five sources explained (see Table 4.1) that the initial driver of e-Procurement system adoption in
their agency was triggered by emulating other agencies’ success. LGM City Government was an
example. When Respondent LGM-2 initiated e-Procurement, he was inspired by LGM’s city
neighbour, LGB City Government, as the first city that had used e-Procurement for procurement
needs.
Quote 11
LGM-2: “First it was 6 years ago when one of this agency’s sub-division
was visiting the LGB City Government. The city had used e-
Government Procurement at that time and indeed we were inspired
to do the same.”
UGL1 told a similar story about his agency’s decision to adopt an e-Procurement system for the
first time (before adopting the SPSE). His organisation adopted the system that was developed by
LGB City Government.
~ 44 ~
Quote 12
UGL-1: “Before we adopted SPSE we built our own system and it was
finished around 2008. [At that time] we adopted the system from
the LGB City Government expert team. Actually LGB City
Government was the first one [that had the e-Procurement
system]…Then in 2009, NPPA starts … We migrated to their
system from then.”
LGS-1 reported a similar experience in her agency, which was influenced by other agencies’
success in using e-Procurement. She said she was impressed by the ease with which other agencies
could complete their procurement tasks using e-Procurement. The apparent ease in completing tasks
by using the system encouraged her to set up the system in LGB City Government:
Quote 13
LGS-1: “Yes, when we visited other local governments, they inspired us …
if we have LPSE our work will be easier…like that. So it motivated
us to build LPSE unit in here.”
All three SPSE user interviewees (presented in Quotes 11, 12, 13 above) were reassured by other
agencies’ success in e-Procurement adoption.
According to NPPA-2, the imitation of other agencies’ success is extended beyond adoption to
system advancement. He explained this point when asked about the role of emulation in system
adoption success.
Quote 14
NPPA-2: “… it’s so amazing really. Let say if a location has owned a more
advanced system the other location will wish to do the same.”
The interview results indicate that emulation of other agencies is one of the social-related aspects
that affect e-Procurement adoption. In previous research, this type of emulation is referred to as
mimetic pressure. The construct is used when a private organisation imitates competitors in
adopting an innovation (Oliveira and Martins, 2011, DiMaggio and Powell, 1983). The relevance of
this construct in explaining the adoption of innovation in private organisations has been tested
(Galaskiewicz and Wasserman, 1989, Fligstein, 1985, Haunschild and Miner, 1997). However, to
the best of the researcher’s knowledge, this construct has not been tested in government agencies
and the present study is the first to do so.
~ 45 ~
(c) Normative Pressure
Rather than leader’s vision, NPPA-2 underlined social capital as the norm of SPSE adoption. This
view emerged in the interview when NPPA-2 was asked about the impact of the leader’s vision in
e-Procurement use and success.
Quote 15
NPPA-2: “There is situation when there is no ICT vision or procurement
vision, but the adoption process is good. So the factor is not only
leadership, we recognise social capital as the catalyst.”
NPPA-2 used the term “social capital” six times during the interview and put an emphasis on it. He
explained what he meant by social capital.
Quote 16
NPPA-2: “The community, hmmm a community that consists of people who
are concerned about procurement. This community has the
capacity to do something if they have the channel. They see LPSE
as the channel to do something to actualize their vision on
procurement. This is the major force of this system’s adoption
process. [By having LPSE] the common vision is formed and
people agree to fight for their vision. This social movement is
unique; it hasn’t happened in other e-Government programs. If this
movement needs to be replicated to other program, it [the
something] should be found first…. Yeah, the common vision
should be discovered even if the common vision is
general…corruption…hmmm the pressure creates this common
vision. Then the community found it [LPSE] and used it as a
channel, therefore the social capital is maximized [to accelerate
the system’s adoption].”
NPPA-2 also said that the main barrier is how the social capital in the targeted agency can be
actualised. Social capital is defined as the resources embedded in a social structure that provide
benefits when needed (Lin, 1999, Häuberer, 2011). In relation to Quote 16 above, social capital can
be interpreted as the procurement community that supports e-Procurement adoption through the
presence of LPSE. This community creates norms among the group regarding the use of the e-
Procurement system. From the user perspective, one of the users explained the situation if an
agency was reluctant to use the e-Procurement system.
Quote 17
LGM-1: “I think in the future they will use it, if not, they will left behind by
others.”
LGM-1’s answer implies that there is a norm among the government agencies that if an agency is
reluctant to use the system, it will be left behind the other agencies. The relevance of normative
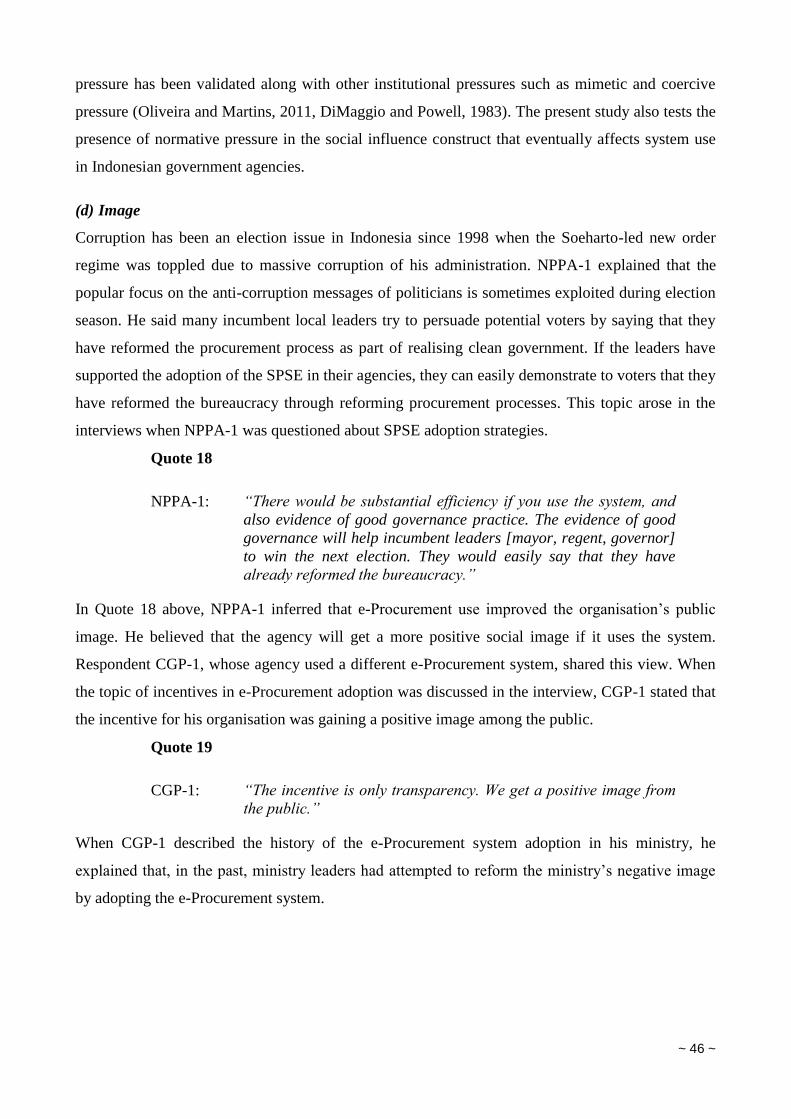
~ 46 ~
pressure has been validated along with other institutional pressures such as mimetic and coercive
pressure (Oliveira and Martins, 2011, DiMaggio and Powell, 1983). The present study also tests the
presence of normative pressure in the social influence construct that eventually affects system use
in Indonesian government agencies.
(d) Image
Corruption has been an election issue in Indonesia since 1998 when the Soeharto-led new order
regime was toppled due to massive corruption of his administration. NPPA-1 explained that the
popular focus on the anti-corruption messages of politicians is sometimes exploited during election
season. He said many incumbent local leaders try to persuade potential voters by saying that they
have reformed the procurement process as part of realising clean government. If the leaders have
supported the adoption of the SPSE in their agencies, they can easily demonstrate to voters that they
have reformed the bureaucracy through reforming procurement processes. This topic arose in the
interviews when NPPA-1 was questioned about SPSE adoption strategies.
Quote 18
NPPA-1: “There would be substantial efficiency if you use the system, and
also evidence of good governance practice. The evidence of good
governance will help incumbent leaders [mayor, regent, governor]
to win the next election. They would easily say that they have
already reformed the bureaucracy.”
In Quote 18 above, NPPA-1 inferred that e-Procurement use improved the organisation’s public
image. He believed that the agency will get a more positive social image if it uses the system.
Respondent CGP-1, whose agency used a different e-Procurement system, shared this view. When
the topic of incentives in e-Procurement adoption was discussed in the interview, CGP-1 stated that
the incentive for his organisation was gaining a positive image among the public.
Quote 19
CGP-1: “The incentive is only transparency. We get a positive image from
the public.”
When CGP-1 described the history of the e-Procurement system adoption in his ministry, he
explained that, in the past, ministry leaders had attempted to reform the ministry’s negative image
by adopting the e-Procurement system.
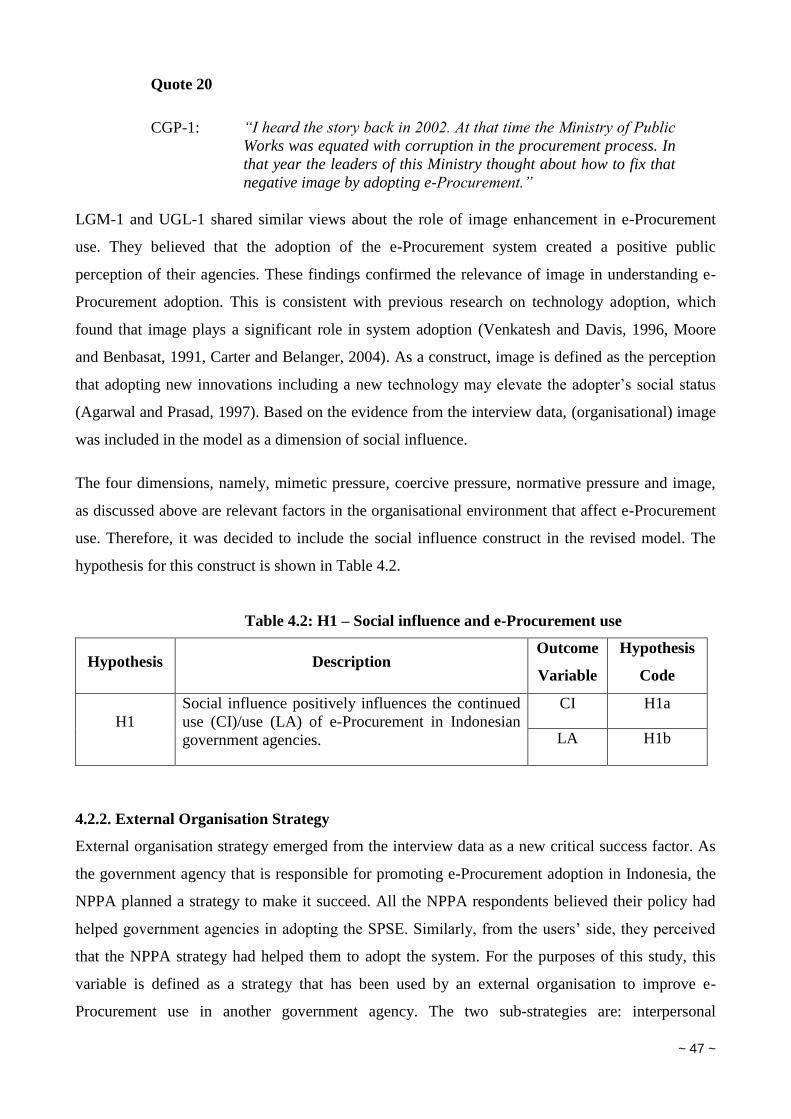
~ 47 ~
Quote 20
CGP-1: “I heard the story back in 2002. At that time the Ministry of Public
Works was equated with corruption in the procurement process. In
that year the leaders of this Ministry thought about how to fix that
negative image by adopting e-Procurement.”
LGM-1 and UGL-1 shared similar views about the role of image enhancement in e-Procurement
use. They believed that the adoption of the e-Procurement system created a positive public
perception of their agencies. These findings confirmed the relevance of image in understanding e-
Procurement adoption. This is consistent with previous research on technology adoption, which
found that image plays a significant role in system adoption (Venkatesh and Davis, 1996, Moore
and Benbasat, 1991, Carter and Belanger, 2004). As a construct, image is defined as the perception
that adopting new innovations including a new technology may elevate the adopter’s social status
(Agarwal and Prasad, 1997). Based on the evidence from the interview data, (organisational) image
was included in the model as a dimension of social influence.
The four dimensions, namely, mimetic pressure, coercive pressure, normative pressure and image,
as discussed above are relevant factors in the organisational environment that affect e-Procurement
use. Therefore, it was decided to include the social influence construct in the revised model. The
hypothesis for this construct is shown in Table 4.2.
Table 4.2: H1 – Social influence and e-Procurement use
Hypothesis Description Outcome
Variable
Hypothesis
Code
H1
Social influence positively influences the continued
use (CI)/use (LA) of e-Procurement in Indonesian
government agencies.
CI H1a
LA H1b
4.2.2. External Organisation Strategy
External organisation strategy emerged from the interview data as a new critical success factor. As
the government agency that is responsible for promoting e-Procurement adoption in Indonesia, the
NPPA planned a strategy to make it succeed. All the NPPA respondents believed their policy had
helped government agencies in adopting the SPSE. Similarly, from the users’ side, they perceived
that the NPPA strategy had helped them to adopt the system. For the purposes of this study, this
variable is defined as a strategy that has been used by an external organisation to improve e-
Procurement use in another government agency. The two sub-strategies are: interpersonal
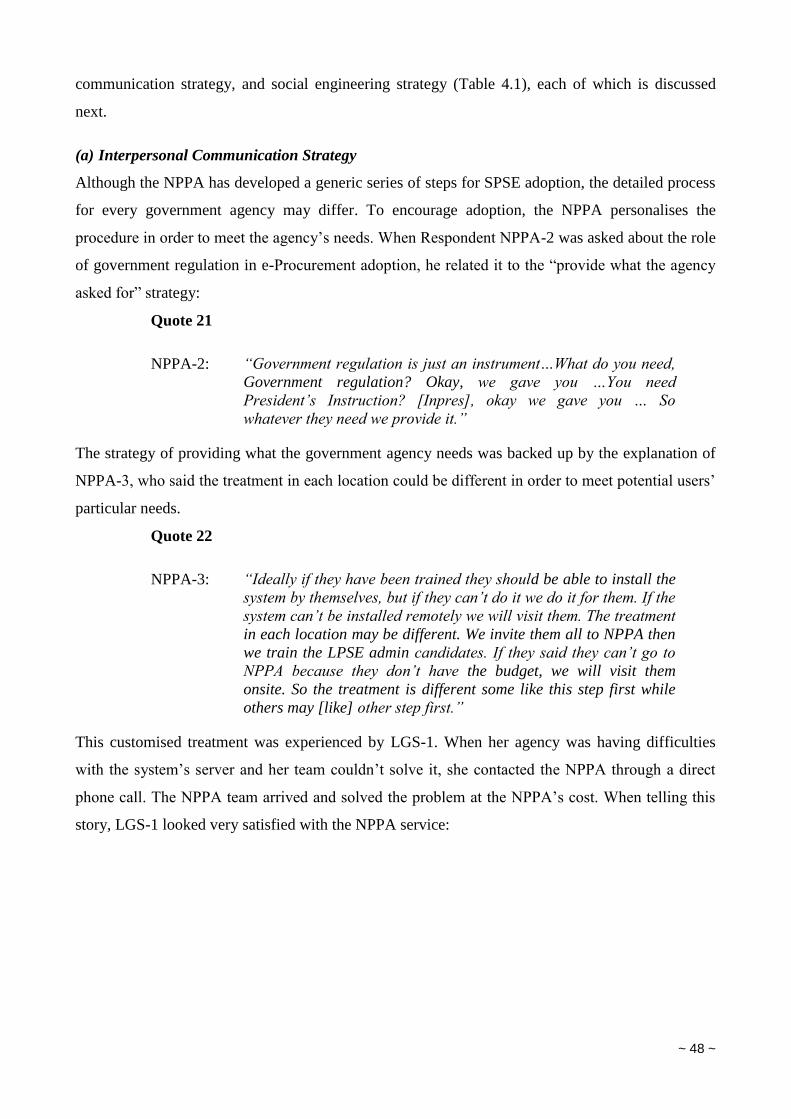
~ 48 ~
communication strategy, and social engineering strategy (Table 4.1), each of which is discussed
next.
(a) Interpersonal Communication Strategy
Although the NPPA has developed a generic series of steps for SPSE adoption, the detailed process
for every government agency may differ. To encourage adoption, the NPPA personalises the
procedure in order to meet the agency’s needs. When Respondent NPPA-2 was asked about the role
of government regulation in e-Procurement adoption, he related it to the “provide what the agency
asked for” strategy:
Quote 21
NPPA-2: “Government regulation is just an instrument…What do you need,
Government regulation? Okay, we gave you …You need
President’s Instruction? [Inpres], okay we gave you … So
whatever they need we provide it.”
The strategy of providing what the government agency needs was backed up by the explanation of
NPPA-3, who said the treatment in each location could be different in order to meet potential users’
particular needs.
Quote 22
NPPA-3: “Ideally if they have been trained they should be able to install the
system by themselves, but if they can’t do it we do it for them. If the
system can’t be installed remotely we will visit them. The treatment
in each location may be different. We invite them all to NPPA then
we train the LPSE admin candidates. If they said they can’t go to
NPPA because they don’t have the budget, we will visit them
onsite. So the treatment is different some like this step first while
others may [like] other step first.”
This customised treatment was experienced by LGS-1. When her agency was having difficulties
with the system’s server and her team couldn’t solve it, she contacted the NPPA through a direct
phone call. The NPPA team arrived and solved the problem at the NPPA’s cost. When telling this
story, LGS-1 looked very satisfied with the NPPA service:
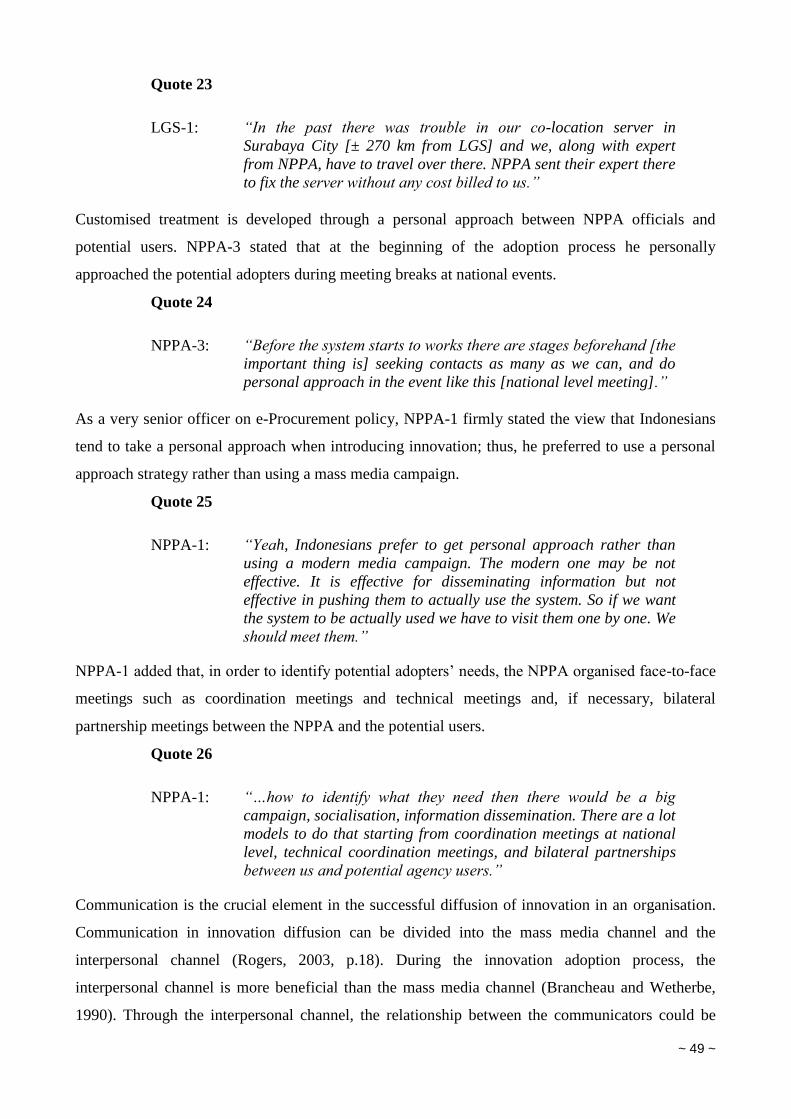
~ 49 ~
Quote 23
LGS-1: “In the past there was trouble in our co-location server in
Surabaya City [± 270 km from LGS] and we, along with expert
from NPPA, have to travel over there. NPPA sent their expert there
to fix the server without any cost billed to us.”
Customised treatment is developed through a personal approach between NPPA officials and
potential users. NPPA-3 stated that at the beginning of the adoption process he personally
approached the potential adopters during meeting breaks at national events.
Quote 24
NPPA-3: “Before the system starts to works there are stages beforehand [the
important thing is] seeking contacts as many as we can, and do
personal approach in the event like this [national level meeting].”
As a very senior officer on e-Procurement policy, NPPA-1 firmly stated the view that Indonesians
tend to take a personal approach when introducing innovation; thus, he preferred to use a personal
approach strategy rather than using a mass media campaign.
Quote 25
NPPA-1: “Yeah, Indonesians prefer to get personal approach rather than
using a modern media campaign. The modern one may be not
effective. It is effective for disseminating information but not
effective in pushing them to actually use the system. So if we want
the system to be actually used we have to visit them one by one. We
should meet them.”
NPPA-1 added that, in order to identify potential adopters’ needs, the NPPA organised face-to-face
meetings such as coordination meetings and technical meetings and, if necessary, bilateral
partnership meetings between the NPPA and the potential users.
Quote 26
NPPA-1: “…how to identify what they need then there would be a big
campaign, socialisation, information dissemination. There are a lot
models to do that starting from coordination meetings at national
level, technical coordination meetings, and bilateral partnerships
between us and potential agency users.”
Communication is the crucial element in the successful diffusion of innovation in an organisation.
Communication in innovation diffusion can be divided into the mass media channel and the
interpersonal channel (Rogers, 2003, p.18). During the innovation adoption process, the
interpersonal channel is more beneficial than the mass media channel (Brancheau and Wetherbe,
1990). Through the interpersonal channel, the relationship between the communicators could be
~ 50 ~
more personal, richer and therefore more effective in persuading others (Agarwal and Prasad,
1998a). Communication in the interpersonal channel could be in the form of word-of-mouth
communication, face-to-face training or presentations (Russell and Hoag, 2004). The interpersonal
channel has been found to be more effective for sharing knowledge about innovation (Agarwal and
Prasad, 1998b), especially in developing countries (Rogers, 2003, p.207).
Having reviewed the literature on the interpersonal channel and its use in innovation adoption, the
“personal approach” discussed NPPA-1 and NPPA-3 in the interviews is regarded as an example of
interpersonal communication as it includes informal and face-to-face meetings between NPPA
officials and potential adopters. This construct appears to affect e-Procurement use in Indonesia;
therefore, the interpersonal communication channel is included as a component in the new external
organisation strategy construct.
(b) Social Engineering Strategy
Social engineering strategy refers to the development of a dedicated organisation to deal with e-
Procurement adoption and operations in each government agency. In Indonesia, this dedicated
organisation is the LPSE (see Section 3.1). The creation of the LPSE as a social engineering
strategy was explained by NPPA-3.
Quote 27
NPPA-3: “The number of employees [NPPA] is too small for implementing
the system in all over Indonesia. LPSE is our social engineering
strategy. Due to the employee numbers we are only able to develop
the system, train the human resources, we create the standards for
the system. The LPSE will do the rest.”
NPPA-1 recognised the role of social engineering in e-Procurement adoption. He said that social
engineering was even more important than the effort of developing the application itself. When
asked about the key success factors in SPSE adoption, NPPA-1 divided the key success factors
based on the e-Procurement users’ point of view and the NPPA point of view. From the NPPA
point of view, social engineering was imperative.
~ 51 ~
Quote 28
NPPA-1: “… from our side it is not commitment, but how to disseminate this
e-Government Procurement, so the application is important, but
more importantly is the engineering how to do the social
engineering. Social engineering so they would be willing to use
that, that is more difficult …how to identify what they need then
there would be a big campaign, socialisation, information
dissemination.”
As described by Respondent LGS-1, the presence of the LPSE as a social engineering strategy has
helped support e-Procurement use.
Quote 29
NPPA-1: “…if we have LPSE, our work [in the procurement process] will be
easier.”
Social engineering refers to arranging and channelling environmental and social forces to create a
high probability that effective social action will occur (Podgorecki et al., 1996). In Indonesia, the
NPPA created the LPSE as a local e-Procurement body attached to each government agency. A
similar approach was reported in a study by Barlow and Beeh (1995) on technology adoption in an
Indonesian village. That study substantiated the relationship between social engineering and
successful technology adoption. Moreover, the literature on ICT change in an agency also supports
the observation that the presence of the LPSE network helps e-Procurement adoption. The literature
explains that ICT-related change may occur as a result of network and organisational affiliation in
the environment at the local or global level (Lamb and Kling, 2003). Based on the interview results
and the review of prior studies, it was decided to include the social engineering strategy undertaken
by the NPPA as one of the dimensions that constitute the external organisation strategy construct.
The interview findings on the external organisation strategy comprising the two dimensions of
interpersonal communication strategy and social engineering strategy indicate the role of this
construct in e-Procurement use success; hence, it was included in the revised model. The
relationship between external organisation strategy and system use is expressed in the hypothesis
summarised in Table 4.3.
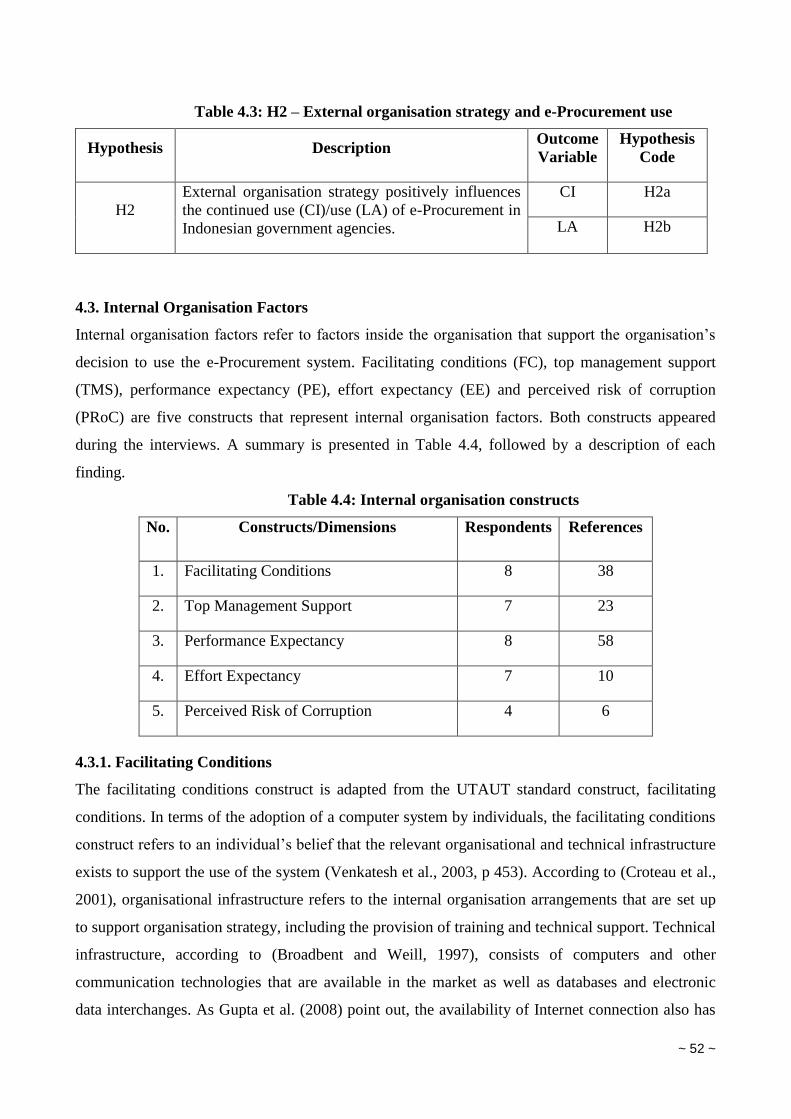
~ 52 ~
Table 4.3: H2 – External organisation strategy and e-Procurement use
Hypothesis Description Outcome
Variable
Hypothesis
Code
H2
External organisation strategy positively influences
the continued use (CI)/use (LA) of e-Procurement in
Indonesian government agencies.
CI H2a
LA H2b
4.3. Internal Organisation Factors
Internal organisation factors refer to factors inside the organisation that support the organisation’s
decision to use the e-Procurement system. Facilitating conditions (FC), top management support
(TMS), performance expectancy (PE), effort expectancy (EE) and perceived risk of corruption
(PRoC) are five constructs that represent internal organisation factors. Both constructs appeared
during the interviews. A summary is presented in Table 4.4, followed by a description of each
finding.
Table 4.4: Internal organisation constructs
No. Constructs/Dimensions Respondents References
1. Facilitating Conditions 8 38
2. Top Management Support 7 23
3. Performance Expectancy 8 58
4. Effort Expectancy 7 10
5. Perceived Risk of Corruption 4 6
4.3.1. Facilitating Conditions
The facilitating conditions construct is adapted from the UTAUT standard construct, facilitating
conditions. In terms of the adoption of a computer system by individuals, the facilitating conditions
construct refers to an individual’s belief that the relevant organisational and technical infrastructure
exists to support the use of the system (Venkatesh et al., 2003, p 453). According to (Croteau et al.,
2001), organisational infrastructure refers to the internal organisation arrangements that are set up
to support organisation strategy, including the provision of training and technical support. Technical
infrastructure, according to (Broadbent and Weill, 1997), consists of computers and other
communication technologies that are available in the market as well as databases and electronic
data interchanges. As Gupta et al. (2008) point out, the availability of Internet connection also has
~ 53 ~
to be included as one of the considerations when studying IS adoption in developing countries. For
the purpose of this research, the definition of facilitating conditions is adjusted to incorporate the
adequacy of the organisational and technical infrastructure to support the use of the computer
system within the organisation.
The facilitating conditions construct for individuals has been tested by many studies and has been
found to be a strong predictor of system use (Dwivedi et al., 2011b, Gupta et al., 2008, Venkatesh et
al., 2003, Zhan et al., 2011, Hoefnagel et al., 2012). In this study, respondents from various
government agencies identified issues that relate to the facilitating conditions of e-Procurement use.
The respondents’ answers varied from technical (server, Internet, electricity, etc) to organisational
matters (technical assistance, training, commitment, etc). The interview results were coded and then
grouped into four dimensions and explained below in the following sub-sections.
(a) Technical Support Availability
All four of the SPSE user respondents (i.e. the respondents from local governments and
universities) stated that technical assistance supports system use in their agency. The nature of
technical assistance itself as mentioned in the interviews can be divided into two types: assistance
from the NPPA to the LPSE, and assistance from the LPSE to SPSE users. SPSE users here refer to
the government officials who act as the procurers or the goods/services providers who are involved
in the procurement process. If the SPSE user has a problem they may visit or contact the LPSE
helpdesk. If the LPSE helpdesk is unable to find the solution, the LPSE may contact the NPPA.
Both LGM-1 and UGL-1 explained this practice.
Quote 30
LGM-1: “There is technical support here. We have an [system] admin. The
admin name is NND from Kominfo Division and there is a
helpdesk for solving problems encountered by either procurement
committees or procurement providers. The problem is raised to
helpdesk and we try to overcome it. If we can’t solve it, then we
refer it to NPPA and their response is usually pretty fast.”
Quote 31
UGL-1: “So if we can’t handle the technical problem we will ask [the
NPPA] and they will give us advice.”
According to LGS-1, the technical support by NPPA was helpful. She added that the NPPA
provided a free service that she used whenever she had a problem with the SPSE.
~ 54 ~
Quote 32
LGS-1: “There was trouble in our server. It was not working for two days
and the [server] back-up didn’t work. Then at that time we invited
NPPA to fix it up. Their staff came here and trained our
networking staff for two days…NPPA sent their expert to fix that
for free.”
Besides helping the LPSE in solving system troubles, the presence of a helpdesk in an LPSE is also
used by NPPA to measure the maturity level of the LPSE. The fewer problems reported to the
NPPA helpdesk, the more mature a LPSE is regarded to be. This was explained by NPPA-2.
Quote 33
NPPA-2: “If an agency faced many problems surely there would be a lot of
trouble ticketing. In other words, there would be many phone calls
to our helpdesk. A mature LPSE can solve problems by themselves.
The escalation of trouble tickets becomes an indicator of an LPSE
achievement. If a lot of troubles could not be handled by the LPSE,
it means that we have to strengthen the LPSE’s capacity.”
Quotes 30 to 33 presented above indicate that technical assistance supports system adoption in
government agencies. These findings resonate with previous research on computer system adoption.
For example, research conducted by Iacovou et al. (1995) found that an organisation with low IT
readiness tends to require technical assistance in system adoption. According to Goode (2005) and
Straub (2009), the absence of technical assistance could affect an organisation’s technology
deployment and adoption decision. Gupta et al. (2008) suggest that governments in developing
countries should take notice of technical support availability since it may influence IT usage. After
analysing the interview data and reviewing the literature, the technical support availability variable
was included as a dimension of the facilitating conditions construct in this study.
(b) Training Availability
Most of the interview respondents stated that limited human resources hindered e-Procurement
adoption in Indonesian government agencies. Human resources ability does not merely refer to
bureaucrats’ skills in operating the SPSE system, but also their mindset about electronic systems.
Before e-Procurement was introduced in Indonesian government agencies, the procurement process
was done manually. A change of mindset from a manual mindset to an electronic mindset is
required in order to facilitate e-Procurement adoption. NPPA-2 stated that changing the mindset of
government agencies was one of the critical success factors.
~ 55 ~
Quote 34
NPPA-2: “…really the mindset…the electronic mindset…[it is] not easy for
us to say this document has been approved…they will argue
us…Where’s the signature? Where is the stamp?”
As an LPSE head responsible for SPSE adoption in her office, LGM-1 experienced similar
problems in changing mindsets. She said that changing mindsets required effort and commitment
from the LPSE officer.
Quote 35
LGM-1: “…changing mindset from the manual to electronic needs effort
needs commitment needs an extra effort [from the LPSE] …”
The two quotes above (Quotes 10 and 11) show that changing a bureaucrat’s mindset is critical in
successful SPSE adoption. According to LGM-1, training is designed to solve this problem as well
as to improve bureaucrats’ abilities in operating the e-Procurement system.
Quote 36
LGM-1: “…training is not only changing mindsets, but also the technical
skills, so [it transforms] human resource’s mindset and ability [in
operating e-Procurement system.”
Similar to technical support, training is conducted by both the NPPA and LPSE. Training is
conducted by the NPPA for LPSE operators, while training is conducted by the LPSE for the
procurement committee and procurement providers in the respective agency. Before an LPSE is
allowed to conduct training, one of its employees must have completed the training for trainers
conducted by the NPPA.
Quote 37
UGL-1: “…we [LPSE] provide training as well. I’ve been trained through
Training for Trainers by NPPA so I could provide training here,
giving training for internal and external stakeholders [government
procurer and goods/services providers]…”
The above explanations indicated that the provision of training was important in supporting SPSE
adoption by changing the users’ manual mindset and improving their technical ability in operating
SPSE. These findings are consistent with the literature. Brancheau (in Lai and Guyness, (1997)
stated that training could be the enabler of faster technology use. Training was also identified as an
enabler of an e-Government program in Singapore (Devadoss et al., 2003). In addition, Gupta et al.
(2008) highlighted that training had a positive impact on ICT usage in developing countries. Thus,
they suggested that governments should pay attention to it. On the basis of the interview findings
~ 56 ~
and the literature on the importance of training in e-Government use success, training availability
was included as a dimension of the facilitating conditions construct in the revised model.
(c) Infrastructure Availability
A third dimension of facilitating conditions is infrastructure availability. This was raised in the
interviews by five respondents. The SPSE system requires adequate IT infrastructure to operate,
particularly within a distributed system architecture. Internet bandwidth (UGL-1, UGS-1) and
servers (UGL-1) are examples of the required infrastructure. Although the other respondents did not
specifically mention what IT infrastructure was needed, they stated that it was a critical success
factor in e-Procurement adoption (LGM-1, NPPA-3). LGM-1, for example, explained that her
agency’s IT infrastructure was adequately equipped to support e-Procurement use.
Quote 38
LGM-1: “In this city the infrastructure is more than enough…we have
prepared a server with high memory capacity to meet the NPPA
requirement…maybe more…we also have prepared the stable
Internet connection. Therefore so far this city government is ready
to support e-Government Procurement adoption.”
On the other hand, the absence of infrastructure may hinder e-Procurement adoption, as revealed by
CGP-1 who emphasised there could be no electronic system before infrastructure availability.
Quote 39
CGP-1: “The first barrier…the very first barrier is infrastructure because
we won’t talk electronic [system] before [there is] infrastructure.”
NPPA-3 had a similar opinion. He stated that the e-Procurement non-adopters were located in the
eastern region of Indonesia which has poorer infrastructure conditions compared to the western
region.
Quote 40
NPPA-3: “Actually the non-adopters are located in east Indonesia such as
Papua, West Papua, Maluku, North Maluku, and East Nusa
Tenggara. Other than those provinces, most government agencies
in Indonesia have adopted it ... Well in this case infrastructure is a
factor, the main problem is infrastructure.”
As well as IT infrastructure, two respondents (LGS-2 and UGL-1) added electricity availability as a
critical success factor in e-Procurement adoption. This came up in the interview with UGL-1 when
questioned about system failure.
~ 57 ~
Quote 41
UGL-1: “The failure…infrastructure readiness. For example energy… let’s
say if PLN [the Indonesian electricity provider] suddenly cut the
power off [in the middle of procurement process] then procurement
will fail right? Even though the failure is temporary, but it’s
something that needs attention.”
Although the LGS City Government did not have any issues regarding infrastructure, LGS-2
expressed his view on non-adopter agencies. He described electricity and Internet connection
availability as the critical success factors in e-Procurement system use in the eastern part of
Indonesia.
Quote 42
LGS-2: “Electricity and Internet, yes there are many complaints because
they [the non-adopters in east Indonesia] have the infrastructure
needed, but the power is unstable.”
Infrastructure has been identified as an important factor in technology adoption in e-Government
use studies. Kwon and Zmud (1987) emphasise the importance of infrastructure and technical skills
for successful IS diffusion. Adequate IS infrastructure is required to operate an inter-organisational
system (Premkumar and Ramamurthy, 1995). Research conducted in China also pointed out that
infrastructure must be available to support system use (Zhan et al., 2011). Based on the review of
the literature and the interviews, technical infrastructure availability was included as a dimension in
the facilitating conditions construct that predicts e-Procurement use.
(d) Other Dimensions
Other dimensions of the facilitating conditions construct emerged during the interviews, namely,
incentives, innovators and a special room for the bidding process (the “bidding room”). These
dimensions were discussed by a few respondents or there were inconsistencies in the respondents’
answers. A summary of these dimensions is presented in Table 4.5.
Table 4.5: Other dimensions of facilitating conditions construct
No. Codes Sources References
1. Incentives 6 25
2. Bidding room 2 4
3. Innovator 2 2
Innovators and the bidding room were mentioned by only two respondents on each dimension, and
hence were not regarded as sufficient to include in the revised model. The issue of incentives was
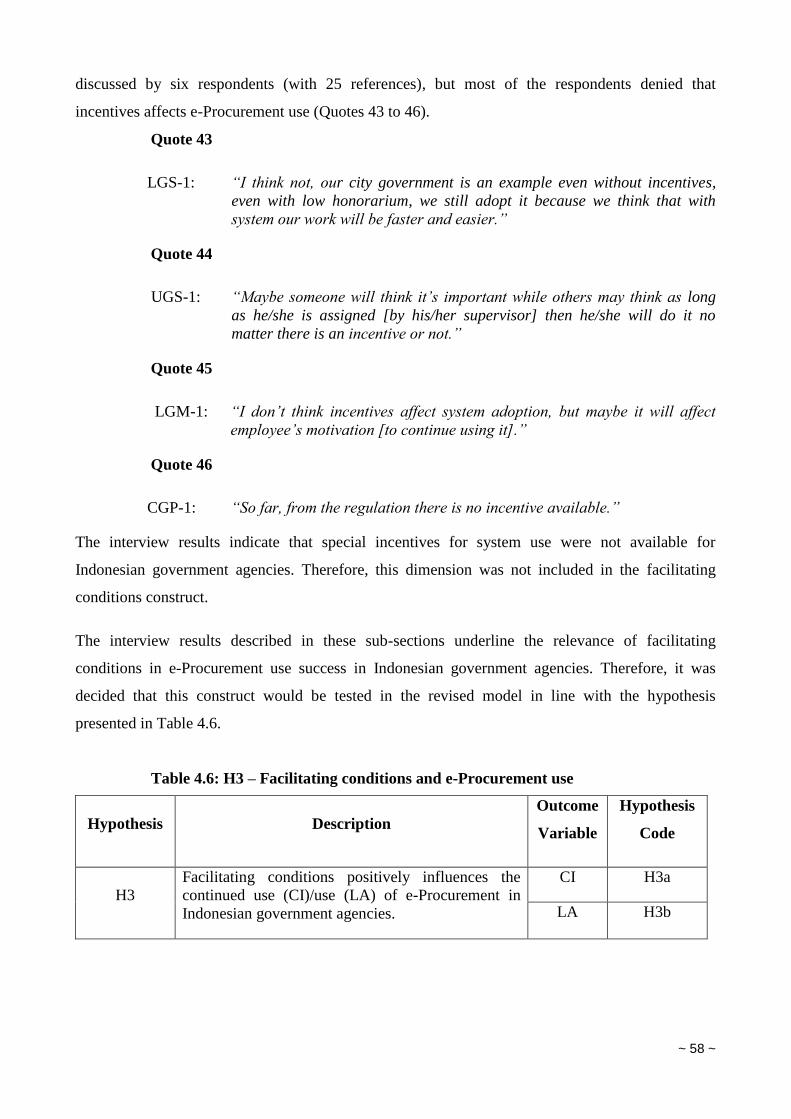
~ 58 ~
discussed by six respondents (with 25 references), but most of the respondents denied that
incentives affects e-Procurement use (Quotes 43 to 46).
Quote 43
LGS-1: “I think not, our city government is an example even without incentives,
even with low honorarium, we still adopt it because we think that with
system our work will be faster and easier.”
Quote 44
UGS-1: “Maybe someone will think it’s important while others may think as long
as he/she is assigned [by his/her supervisor] then he/she will do it no
matter there is an incentive or not.”
Quote 45
LGM-1: “I don’t think incentives affect system adoption, but maybe it will affect
employee’s motivation [to continue using it].”
Quote 46
CGP-1: “So far, from the regulation there is no incentive available.”
The interview results indicate that special incentives for system use were not available for
Indonesian government agencies. Therefore, this dimension was not included in the facilitating
conditions construct.
The interview results described in these sub-sections underline the relevance of facilitating
conditions in e-Procurement use success in Indonesian government agencies. Therefore, it was
decided that this construct would be tested in the revised model in line with the hypothesis
presented in Table 4.6.
Table 4.6: H3 – Facilitating conditions and e-Procurement use
Hypothesis Description
Outcome
Variable
Hypothesis
Code
H3
Facilitating conditions positively influences the
continued use (CI)/use (LA) of e-Procurement in
Indonesian government agencies.
CI H3a
LA H3b
~ 59 ~
4.3.2. Top Management Support
Top management support was mentioned by seven of the eight respondents on a total of 23
occasions. The critical importance of top management support was reinforced by NPPA-1, when he
said that infrastructure and human resource readiness were not the main barriers to e-Procurement
use; rather, he identified the absence of management commitment as the main barrier.
Quote 47
NPPA-1: “Some agencies argue that they did not have sufficient human
resources to [adopt e-Government Procurement]. Actually that
reason is not valid. If we look all over Indonesia, which area in this
country has adequate infrastructure and human resource
readiness? None of them! The problem is their willingness to use
or not to use the system, that’s it.”
Focusing on the phrase “willingness to use”, NPPA-1 was asked to provide more details about this
statement.
Quote 48
NPPA-1: “It’s commitment…there are cases in the remote area that are
successful in using e-Government Procurement because they were
committed to it.”
Furthermore, NPPA-1 stated that commitment from all the parties involved was important, but the
top manager’s commitment will ease the system’s use.
Quote 49
NPPA-1: “From many parties…there is a case where commitment from the
staff, not always from the leader. However it is easier if there is a
commitment from the top managers.”
As the e-Procurement adoption initiator in his agency, LGM-2 shared his story about the
importance of top managers’ commitment. He said when he was trying to adopt the e-Procurement
system six years ago the agency’s leaders didn’t support him. As a result his agency failed to adopt
it.
Quote 50
LGM-2: “First it was 6 years ago when the Development Division of this
agency was visiting Surabaya City Government for doing a
comparative study. Surabaya had used e-Procurement at that time
and actually we were interested to do the same…at that time the
software was ready, but there was no commitment from the
leaders, hence we stopped it.”
On the contrary, UGL-1 was convinced that the top managers in the university were committed to
the support of e-Procurement use.
~ 60 ~
Quote 51
UGL-1: “At first why did I use e-Government Procurement? Because I was
convinced that they [the agency’s leaders] will support everything
I need. I told them, Sir, I want to change this division to LPSE.
Please support it., and they [the agency’s top managers] replied …
ok we will provide this … this … this for you.”
Although the respondent from the central government agency used a different e-Procurement
system to the SPSE, he experienced the same situation. The leaders in his agency were very
supportive of e-Procurement adoption.
Quote 52
CGP-1: “The leadership role is very immense…in fact that is one of the key
success factors why e-Procurement in this ministry could run well,
because of the commitment from this ministry’s leaders.”
Another four respondents from both local government and the NPPA (LGS-1, LGM-1, NPPA-2 and
NPPA-3) also underlined the importance of top managers’ commitment in e-Procurement adoption
success in their respective agencies. In a study on e-Government adoption in Singapore, Teo et al.
(2009a) concluded that top management support is essential. Thong and Yap (1995) found that the
attitude of an organisation’s top manager is important in IT adoption. The interview findings and
the literature review indicate that top management support is essential in IS use success. Hence, the
relationship between top management support and system use was included in the revised model.
One study in the literature suggests that the key to IS use success is convincing the top managers to
use it (Lederer and Mendelow, 1988). In other words, convincing top managers is the key to system
use success. As discussed above (Section 4.3.1.), the NPPA provides supporting factors to
Indonesian government agencies in their use of the e-Procurement system such as training and
technical support; therefore, considering this unique circumstance, the present study probed the
presence of facilitating conditions in building top management support which, in turn, affects
system use. Thus, it was posited that top management support is a mediating variable between
facilitating conditions and system use.
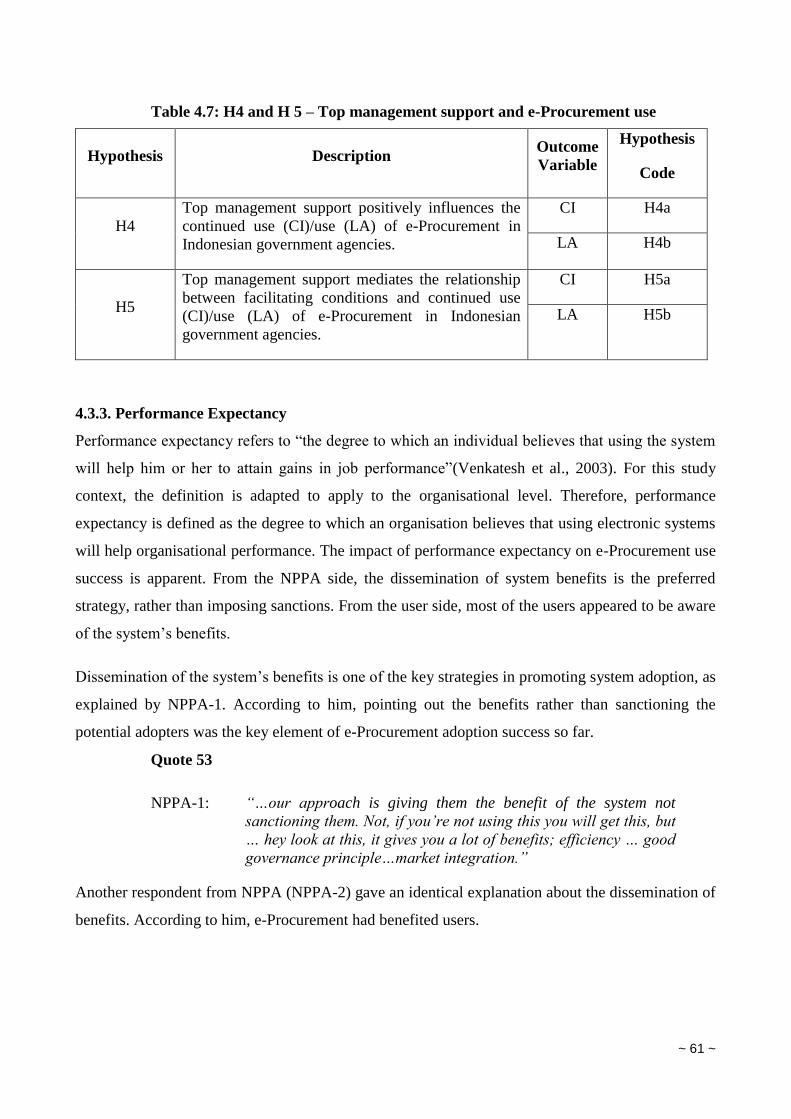
~ 61 ~
Table 4.7: H4 and H 5 – Top management support and e-Procurement use
Hypothesis Description Outcome
Variable
Hypothesis
Code
H4
Top management support positively influences the
continued use (CI)/use (LA) of e-Procurement in
Indonesian government agencies.
CI H4a
LA H4b
H5
Top management support mediates the relationship
between facilitating conditions and continued use
(CI)/use (LA) of e-Procurement in Indonesian
government agencies.
CI H5a
LA H5b
4.3.3. Performance Expectancy
Performance expectancy refers to “the degree to which an individual believes that using the system
will help him or her to attain gains in job performance”(Venkatesh et al., 2003). For this study
context, the definition is adapted to apply to the organisational level. Therefore, performance
expectancy is defined as the degree to which an organisation believes that using electronic systems
will help organisational performance. The impact of performance expectancy on e-Procurement use
success is apparent. From the NPPA side, the dissemination of system benefits is the preferred
strategy, rather than imposing sanctions. From the user side, most of the users appeared to be aware
of the system’s benefits.
Dissemination of the system’s benefits is one of the key strategies in promoting system adoption, as
explained by NPPA-1. According to him, pointing out the benefits rather than sanctioning the
potential adopters was the key element of e-Procurement adoption success so far.
Quote 53
NPPA-1: “…our approach is giving them the benefit of the system not
sanctioning them. Not, if you’re not using this you will get this, but
… hey look at this, it gives you a lot of benefits; efficiency … good
governance principle…market integration.”
Another respondent from NPPA (NPPA-2) gave an identical explanation about the dissemination of
benefits. According to him, e-Procurement had benefited users.
~ 62 ~
Quote 54
NPPA-2: “Firstly e-Procurement has benefited users… The most noticeable
benefit is that SPSE can save tender budget or we call it tender left
over…by average we can save 11 per cent [of total procurement
budget allocated].”
The strategy of disseminating information on the usefulness of the system was effective. All of the
SPSE users indicated that the e-Procurement system had benefited their organisation. Some of the
benefits identified by the SPSE users were similar to the benefits described by NPPA-2 above,
namely, the benefits of efficiency, transparency (bureaucratic reform) and market integration, each
of which is discussed next.
(a) Efficiency
All the SPSE users (UGL-1, LGS-2, LGM-1 & LGM-2, and UGS-1) and different e-Procurement
system users (CGP-1) identified efficiency as one of the e-Procurement advantages. LGM-1
reported that, after attending a national coordination meeting, she understood that there would be
significant efficiency by using an e-Procurement system.
Quote 55
LGM-1: “I noticed from the latest national meeting that by using this e-
Government Procurement system, efficiency of [government
procurement] will be huge … the efficiency value is very
significant.”
When asked about the main benefits of the e-Procurement system, she identified efficiency as one
of the main benefits. According to her, efficiency comes from the competitive prices provided by
the procurement providers. The level of competition between procurement providers had increased
since the introduction of e-Procurement.
Quote 56
LGM-1: “…efficiency because … there is open competition so all of the
procurement provider will bid with the lowest price…efficiency can
be obtained from there as well.”
Similarly, UGL-1 identified efficiency as a benefit, explaining that he obtained a bigger margin in
the e-Procurement system since the procurement providers were more varied due to openness.
~ 63 ~
Quote 57
UGL-1: “Since all procurement providers can join the procurement as long
as they’re qualified and all of the requirements are fulfilled, we get
bigger margins from our own predicted price hence it gives us
efficiency. The more competitors in the procurement process the
cheaper the offer.”
UGS-1 and CGP-1 had a different perception about efficiency in e-Procurement. According to
them, the efficiency came from minimising the use of paper.
Quote 58
UGS-1: “Obviously efficiency, it is clear because we don’t have to use hard
copy [paper] anymore.”
CGP-1: “First of all [the benefit] is efficiency, efficiency is clear because
[by using this system] the procurement process require minimum
cost. For example, costs for printing document, costs for
explaining the bidding, all of which can be done virtually.”
(b) Transparency
Transparency was perceived to be a benefit of the e-Procurement system by all user respondents.
For example, LGM-1 explained that e-Procurement may lead to corruption prevention.
Quote 59
LGM-1: “There is many main benefits…firstly corruption prevention, even
it has not fully realised yet but at least we’re heading toward that
direction. Why? Because using e-Procurement all of the processes
are open, transparent and the process can be seen by anyone
involved.”
CGP-1 had a similar view. He considered that the adoption of e-Procurement in his ministry was
motivated by the need for transparency in the procurement process.
Quote 60
CGP-1: “If we look on the transparency and openness side, by using an
electronic system nothing can be hidden anymore. In the past
[manual process] the process may be concealed [from the public]
but now it’s impossible to do that.”
Other respondents (UGS-1, UGL-1, LGM-1) also mentioned transparency as a system benefit.
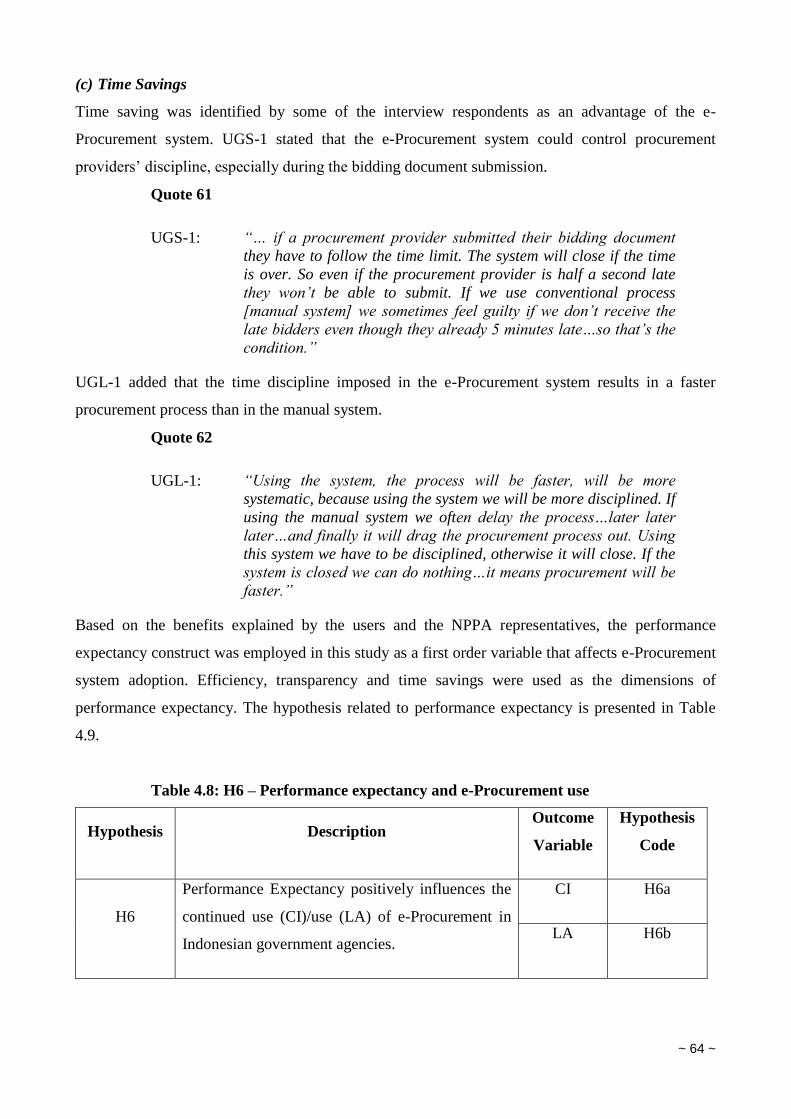
~ 64 ~
(c) Time Savings
Time saving was identified by some of the interview respondents as an advantage of the e-
Procurement system. UGS-1 stated that the e-Procurement system could control procurement
providers’ discipline, especially during the bidding document submission.
Quote 61
UGS-1: “… if a procurement provider submitted their bidding document
they have to follow the time limit. The system will close if the time
is over. So even if the procurement provider is half a second late
they won’t be able to submit. If we use conventional process
[manual system] we sometimes feel guilty if we don’t receive the
late bidders even though they already 5 minutes late…so that’s the
condition.”
UGL-1 added that the time discipline imposed in the e-Procurement system results in a faster
procurement process than in the manual system.
Quote 62
UGL-1: “Using the system, the process will be faster, will be more
systematic, because using the system we will be more disciplined. If
using the manual system we often delay the process…later later
later…and finally it will drag the procurement process out. Using
this system we have to be disciplined, otherwise it will close. If the
system is closed we can do nothing…it means procurement will be
faster.”
Based on the benefits explained by the users and the NPPA representatives, the performance
expectancy construct was employed in this study as a first order variable that affects e-Procurement
system adoption. Efficiency, transparency and time savings were used as the dimensions of
performance expectancy. The hypothesis related to performance expectancy is presented in Table
4.9.
Table 4.8: H6 – Performance expectancy and e-Procurement use
Hypothesis Description Outcome
Variable
Hypothesis
Code
H6
Performance Expectancy positively influences the
continued use (CI)/use (LA) of e-Procurement in
Indonesian government agencies.
CI H6a
LA H6b
~ 65 ~
4.3.4. Effort Expectancy
Effort expectancy refers to the degree of ease associated with the use of a system (Venkatesh et al.,
2003., p 450). This definition is relevant to both the individual and organisational level, and hence
did not need to be modified to fit the context of this study. The NPPA paid attention to the ease of
using the system. NPPA-3 claimed that the SPSE was easy to operate.
Quote 63
NPPA-3: “…the indicator is easy, if the system is not easy to use then it has
been abandoned although the regulation mandated them to use it.
There was a system namely e-RUP, although the system has been
mandated all government agencies to use the system but up to now
no one used it.”
Similarly, the SPSE users indicated that the system was easy to use. When the ease of using the
system was questioned, most of the respondents expressed the presumption that their organisation
was able to operate it. Quotes 64 and 65 exemplify the users’ views on the ease of using the system.
Quote 64
UGL-1: “They can [use the system]… that’s relatively easy.”
Quote 65
UGS-1: “In the [software] version that we use I think it’s quite easy to use,
there are not many problems and all of the procurement committee
that we trained never complain about this system operation.”
As well as confirming the ease of using the SPSE, LGM-1 added that the procurement committees
and procurement providers need to be willing to learn as the system is always changing.
Quote 66
LGM-1: “I think this organisation is able to operate the system, but it needs
the willingness to learn because the SPSE version is always
evolving.”
The interview results discussed above indicated the role of effort expectancy in e-Procurement
adoption in Indonesian government agencies; therefore, this construct was included as one of the
variables affecting system use. The hypothesis relating to effort expectancy is presented Table 4.10.
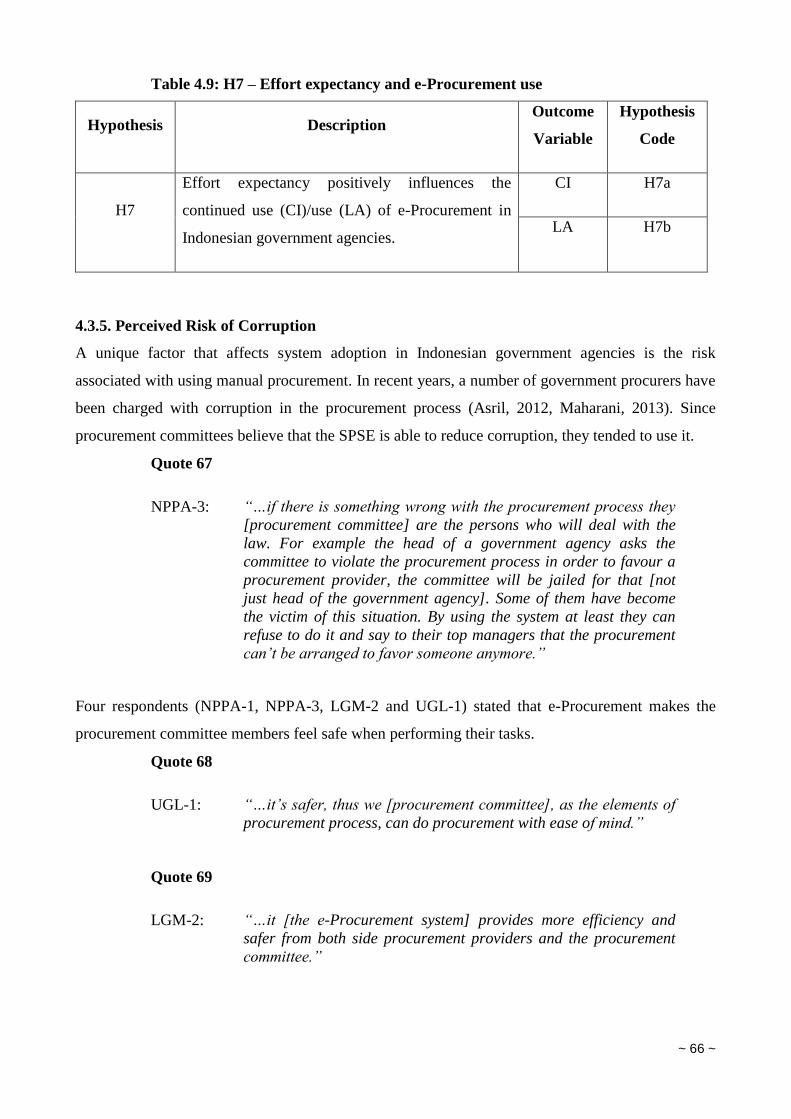
~ 66 ~
Table 4.9: H7 – Effort expectancy and e-Procurement use
Hypothesis Description Outcome
Variable
Hypothesis
Code
H7
Effort expectancy positively influences the
continued use (CI)/use (LA) of e-Procurement in
Indonesian government agencies.
CI H7a
LA H7b
4.3.5. Perceived Risk of Corruption
A unique factor that affects system adoption in Indonesian government agencies is the risk
associated with using manual procurement. In recent years, a number of government procurers have
been charged with corruption in the procurement process (Asril, 2012, Maharani, 2013). Since
procurement committees believe that the SPSE is able to reduce corruption, they tended to use it.
Quote 67
NPPA-3: “…if there is something wrong with the procurement process they
[procurement committee] are the persons who will deal with the
law. For example the head of a government agency asks the
committee to violate the procurement process in order to favour a
procurement provider, the committee will be jailed for that [not
just head of the government agency]. Some of them have become
the victim of this situation. By using the system at least they can
refuse to do it and say to their top managers that the procurement
can’t be arranged to favor someone anymore.”
Four respondents (NPPA-1, NPPA-3, LGM-2 and UGL-1) stated that e-Procurement makes the
procurement committee members feel safe when performing their tasks.
Quote 68
UGL-1: “…it’s safer, thus we [procurement committee], as the elements of
procurement process, can do procurement with ease of mind.”
Quote 69
LGM-2: “…it [the e-Procurement system] provides more efficiency and
safer from both side procurement providers and the procurement
committee.”
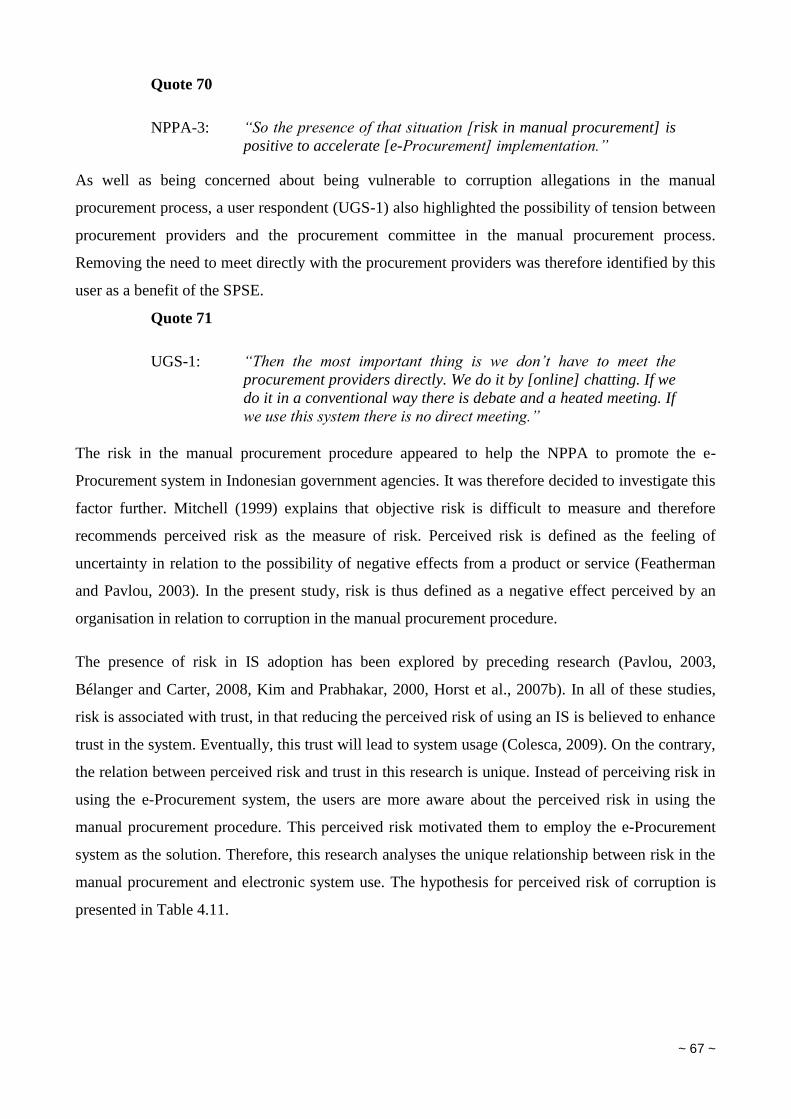
~ 67 ~
Quote 70
NPPA-3: “So the presence of that situation [risk in manual procurement] is
positive to accelerate [e-Procurement] implementation.”
As well as being concerned about being vulnerable to corruption allegations in the manual
procurement process, a user respondent (UGS-1) also highlighted the possibility of tension between
procurement providers and the procurement committee in the manual procurement process.
Removing the need to meet directly with the procurement providers was therefore identified by this
user as a benefit of the SPSE.
Quote 71
UGS-1: “Then the most important thing is we don’t have to meet the
procurement providers directly. We do it by [online] chatting. If we
do it in a conventional way there is debate and a heated meeting. If
we use this system there is no direct meeting.”
The risk in the manual procurement procedure appeared to help the NPPA to promote the e-
Procurement system in Indonesian government agencies. It was therefore decided to investigate this
factor further. Mitchell (1999) explains that objective risk is difficult to measure and therefore
recommends perceived risk as the measure of risk. Perceived risk is defined as the feeling of
uncertainty in relation to the possibility of negative effects from a product or service (Featherman
and Pavlou, 2003). In the present study, risk is thus defined as a negative effect perceived by an
organisation in relation to corruption in the manual procurement procedure.
The presence of risk in IS adoption has been explored by preceding research (Pavlou, 2003,
Bélanger and Carter, 2008, Kim and Prabhakar, 2000, Horst et al., 2007b). In all of these studies,
risk is associated with trust, in that reducing the perceived risk of using an IS is believed to enhance
trust in the system. Eventually, this trust will lead to system usage (Colesca, 2009). On the contrary,
the relation between perceived risk and trust in this research is unique. Instead of perceiving risk in
using the e-Procurement system, the users are more aware about the perceived risk in using the
manual procurement procedure. This perceived risk motivated them to employ the e-Procurement
system as the solution. Therefore, this research analyses the unique relationship between risk in the
manual procurement and electronic system use. The hypothesis for perceived risk of corruption is
presented in Table 4.11.
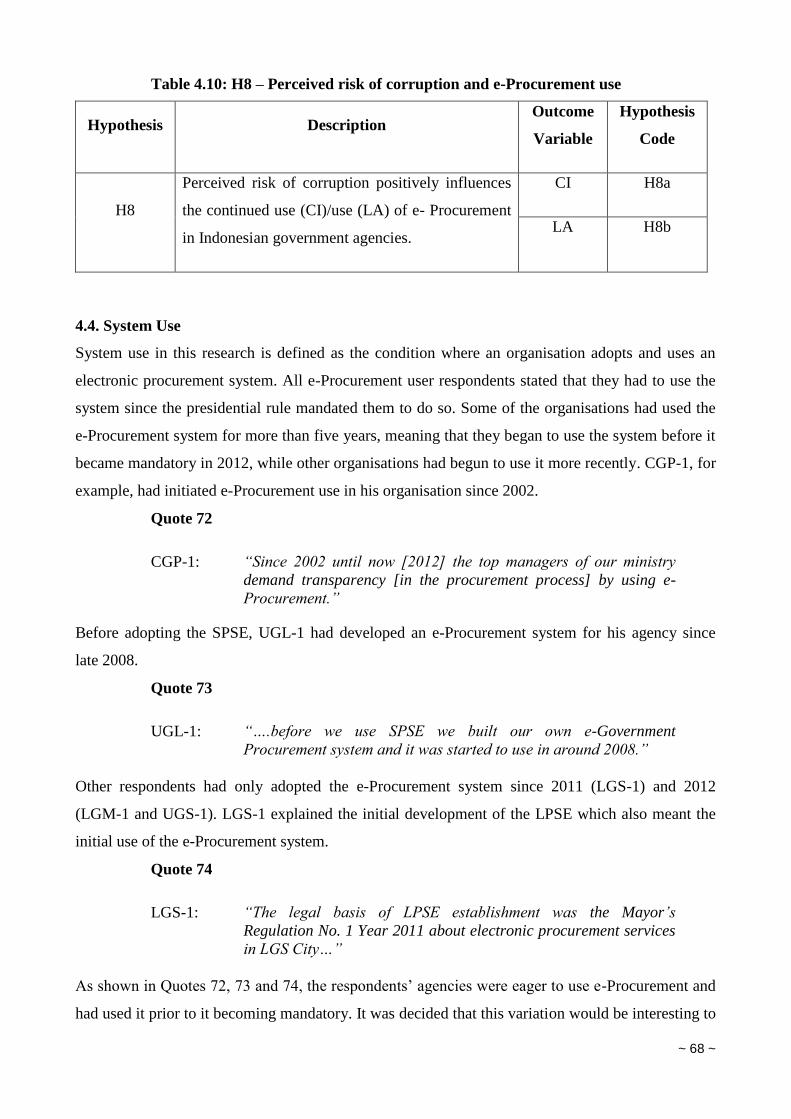
~ 68 ~
Table 4.10: H8 – Perceived risk of corruption and e-Procurement use
Hypothesis Description Outcome
Variable
Hypothesis
Code
H8
Perceived risk of corruption positively influences
the continued use (CI)/use (LA) of e- Procurement
in Indonesian government agencies.
CI H8a
LA H8b
4.4. System Use
System use in this research is defined as the condition where an organisation adopts and uses an
electronic procurement system. All e-Procurement user respondents stated that they had to use the
system since the presidential rule mandated them to do so. Some of the organisations had used the
e-Procurement system for more than five years, meaning that they began to use the system before it
became mandatory in 2012, while other organisations had begun to use it more recently. CGP-1, for
example, had initiated e-Procurement use in his organisation since 2002.
Quote 72
CGP-1: “Since 2002 until now [2012] the top managers of our ministry
demand transparency [in the procurement process] by using e-
Procurement.”
Before adopting the SPSE, UGL-1 had developed an e-Procurement system for his agency since
late 2008.
Quote 73
UGL-1: “….before we use SPSE we built our own e-Government
Procurement system and it was started to use in around 2008.”
Other respondents had only adopted the e-Procurement system since 2011 (LGS-1) and 2012
(LGM-1 and UGS-1). LGS-1 explained the initial development of the LPSE which also meant the
initial use of the e-Procurement system.
Quote 74
LGS-1: “The legal basis of LPSE establishment was the Mayor’s
Regulation No. 1 Year 2011 about electronic procurement services
in LGS City…”
As shown in Quotes 72, 73 and 74, the respondents’ agencies were eager to use e-Procurement and
had used it prior to it becoming mandatory. It was decided that this variation would be interesting to
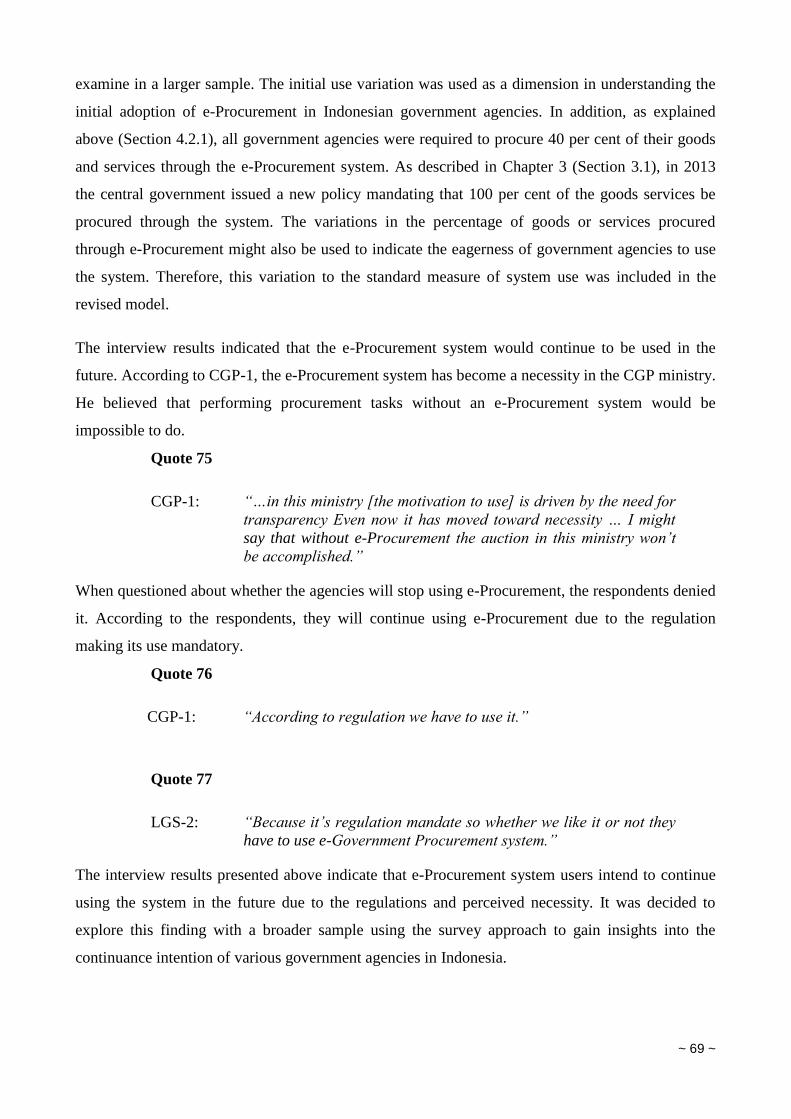
~ 69 ~
examine in a larger sample. The initial use variation was used as a dimension in understanding the
initial adoption of e-Procurement in Indonesian government agencies. In addition, as explained
above (Section 4.2.1), all government agencies were required to procure 40 per cent of their goods
and services through the e-Procurement system. As described in Chapter 3 (Section 3.1), in 2013
the central government issued a new policy mandating that 100 per cent of the goods services be
procured through the system. The variations in the percentage of goods or services procured
through e-Procurement might also be used to indicate the eagerness of government agencies to use
the system. Therefore, this variation to the standard measure of system use was included in the
revised model.
The interview results indicated that the e-Procurement system would continue to be used in the
future. According to CGP-1, the e-Procurement system has become a necessity in the CGP ministry.
He believed that performing procurement tasks without an e-Procurement system would be
impossible to do.
Quote 75
CGP-1: “…in this ministry [the motivation to use] is driven by the need for
transparency Even now it has moved toward necessity … I might
say that without e-Procurement the auction in this ministry won’t
be accomplished.”
When questioned about whether the agencies will stop using e-Procurement, the respondents denied
it. According to the respondents, they will continue using e-Procurement due to the regulation
making its use mandatory.
Quote 76
CGP-1: “According to regulation we have to use it.”
Quote 77
LGS-2: “Because it’s regulation mandate so whether we like it or not they
have to use e-Government Procurement system.”
The interview results presented above indicate that e-Procurement system users intend to continue
using the system in the future due to the regulations and perceived necessity. It was decided to
explore this finding with a broader sample using the survey approach to gain insights into the
continuance intention of various government agencies in Indonesia.

~ 70 ~
4.5. Size
According to Kamal (2006), in terms of IT adoption by public sector organisation, organisational
size can be divided into two: community size, and organisational size. Community size refers to the
size of the community served by the organisation, whereas organisational size refers to the number
of employees in an organisation. Norris (1999) found that the larger the community served, the
more likely it is that an organisation can adopt sophisticated technologies as it has more financial
power. In this research, the targeted respondents represented public sector organisations. The public
organisations served communities of various sizes, from the local/municipal government serving
the smallest community to the central government serving the largest community. Provincial
government and government-owned university organisations are in the middle in terms of the size
of the community served.
According to NPPA-2, the barriers to e-Procurement use may include budgetary constraints or lack
of commitment.
Quote 78
LGS-2: “The barriers are many, could be the budget, could be
commitment.”
From the user perspective, even though the cost of operating an e-Procurement system is small
compared to the total budget, the budget is a critical success factor in an organisation’s decision to
use e-Procurement. This view was explained by LGM-1 in relation to the total budget of LGM City
Government.
Quote 79
LGM-1: “Small, very small, it’s less than 10% … far less than that …”
The budget was also identified as a critical success factor in e-Procurement use success by LGM-2.
Quote 80
LGM-2: “Human resource and budget [are factors]”
Based on the literature and the findings from the interview stage, organisational size was retained as
a moderator variable in the revised model. The hypothesis relating to organisation size as a
moderating variable is presented in Table 4.11.
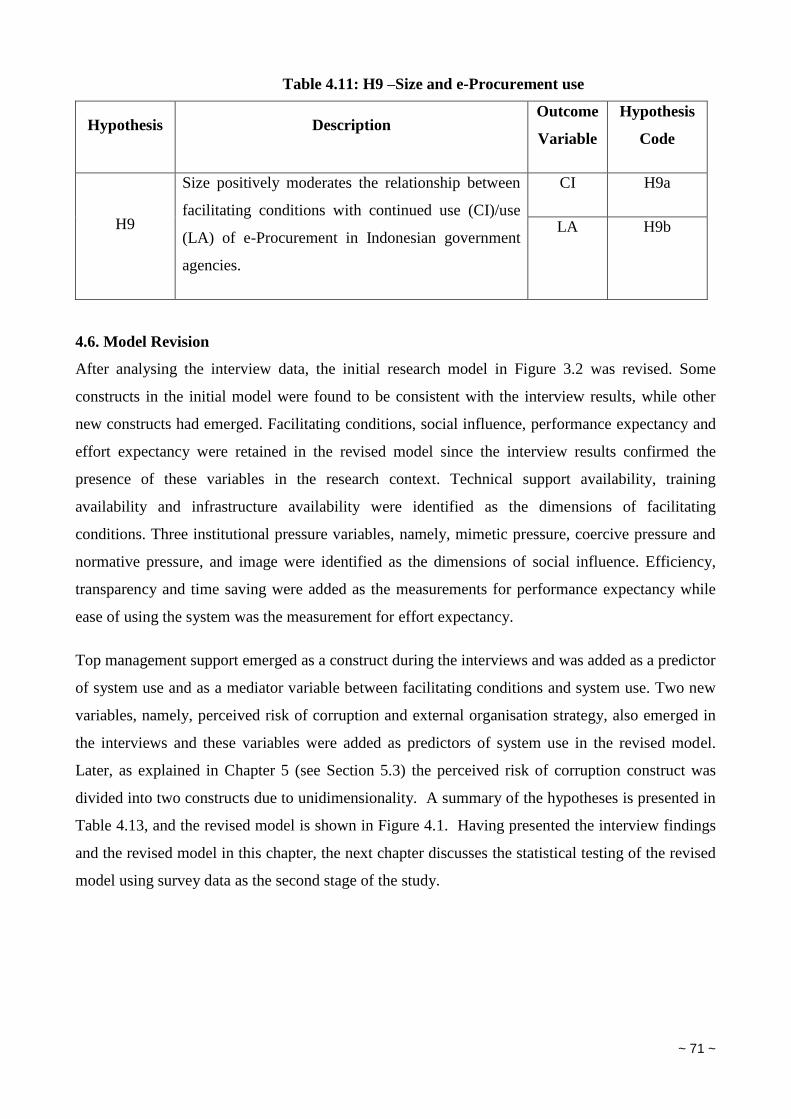
~ 71 ~
Table 4.11: H9 –Size and e-Procurement use
Hypothesis Description Outcome
Variable
Hypothesis
Code
H9
Size positively moderates the relationship between
facilitating conditions with continued use (CI)/use
(LA) of e-Procurement in Indonesian government
agencies.
CI H9a
LA H9b
4.6. Model Revision
After analysing the interview data, the initial research model in Figure 3.2 was revised. Some
constructs in the initial model were found to be consistent with the interview results, while other
new constructs had emerged. Facilitating conditions, social influence, performance expectancy and
effort expectancy were retained in the revised model since the interview results confirmed the
presence of these variables in the research context. Technical support availability, training
availability and infrastructure availability were identified as the dimensions of facilitating
conditions. Three institutional pressure variables, namely, mimetic pressure, coercive pressure and
normative pressure, and image were identified as the dimensions of social influence. Efficiency,
transparency and time saving were added as the measurements for performance expectancy while
ease of using the system was the measurement for effort expectancy.
Top management support emerged as a construct during the interviews and was added as a predictor
of system use and as a mediator variable between facilitating conditions and system use. Two new
variables, namely, perceived risk of corruption and external organisation strategy, also emerged in
the interviews and these variables were added as predictors of system use in the revised model.
Later, as explained in Chapter 5 (see Section 5.3) the perceived risk of corruption construct was
divided into two constructs due to unidimensionality. A summary of the hypotheses is presented in
Table 4.13, and the revised model is shown in Figure 4.1. Having presented the interview findings
and the revised model in this chapter, the next chapter discusses the statistical testing of the revised
model using survey data as the second stage of the study.
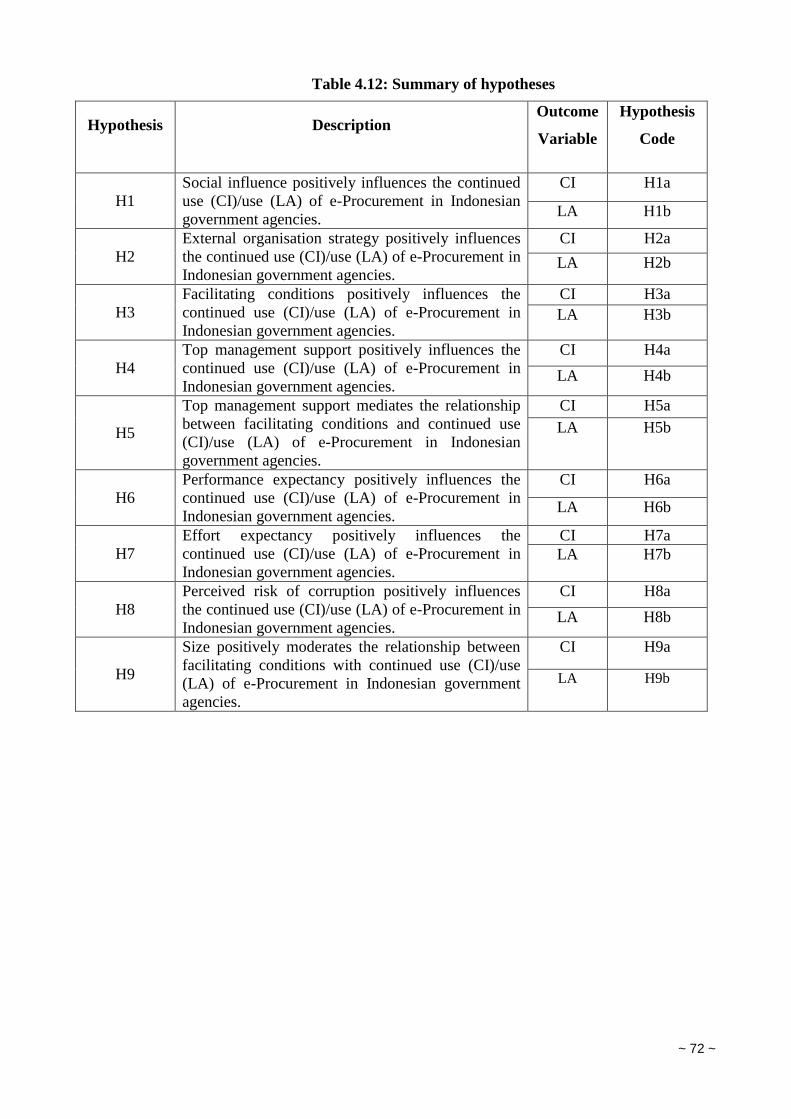
~ 72 ~
Table 4.12: Summary of hypotheses
Hypothesis Description Outcome
Variable
Hypothesis
Code
H1
Social influence positively influences the continued
use (CI)/use (LA) of e-Procurement in Indonesian
government agencies.
CI H1a
LA H1b
H2
External organisation strategy positively influences
the continued use (CI)/use (LA) of e-Procurement in
Indonesian government agencies.
CI H2a
LA H2b
H3
Facilitating conditions positively influences the
continued use (CI)/use (LA) of e-Procurement in
Indonesian government agencies.
CI H3a
LA H3b
H4
Top management support positively influences the
continued use (CI)/use (LA) of e-Procurement in
Indonesian government agencies.
CI H4a
LA H4b
H5
Top management support mediates the relationship
between facilitating conditions and continued use
(CI)/use (LA) of e-Procurement in Indonesian
government agencies.
CI H5a
LA H5b
H6
Performance expectancy positively influences the
continued use (CI)/use (LA) of e-Procurement in
Indonesian government agencies.
CI H6a
LA H6b
H7
Effort expectancy positively influences the
continued use (CI)/use (LA) of e-Procurement in
Indonesian government agencies.
CI H7a
LA H7b
H8
Perceived risk of corruption positively influences
the continued use (CI)/use (LA) of e-Procurement in
Indonesian government agencies.
CI H8a
LA H8b
H9
Size positively moderates the relationship between
facilitating conditions with continued use (CI)/use
(LA) of e-Procurement in Indonesian government
agencies.
CI H9a
LA H9b
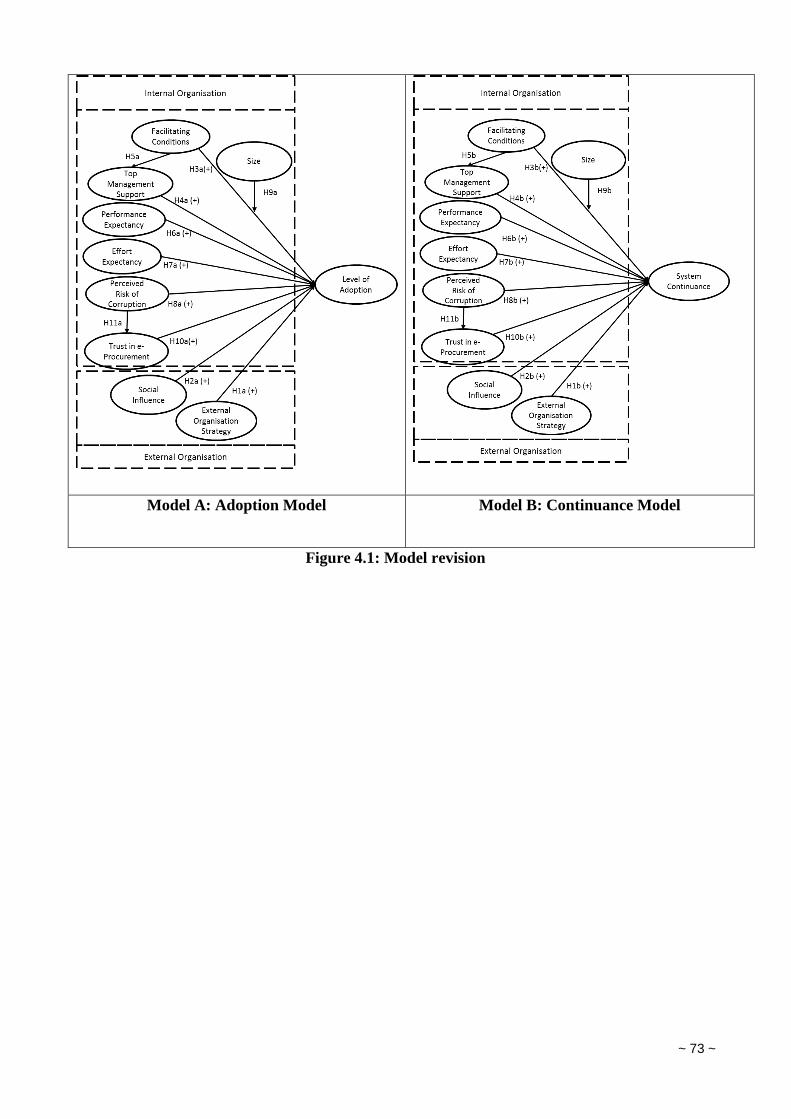
~ 73 ~
Model A: Adoption Model Model B: Continuance Model
Figure 4.1: Model revision
~ 84 ~
Chapter 5. Survey Results
5.1. Introduction
The purpose of this chapter is to validate the revised model presented in Chapter 4 using structural
equation modelling (SEM). This was the second stage of the research. As discussed in Chapter 3,
the validation is conducted by applying the revised model to a broader sample through the survey
data. A survey was conducted to obtain an organisational perspective on the adoption and continued
use of e-Procurement in Indonesian public sector agencies. Hence, the targeted participants in this
survey were the top managers or senior staff responsible for e-Procurement implementation in each
Indonesian government agency. As the respondents were located across Indonesia, an online survey
was chosen as the tool for data collection.
The data description and analysis of this data are explained in nine sections. After this first
introductory section, Section 5.2 revisits the survey design strategy explained in Chapter 3 and
describes how the strategy was implemented for data collection. The development of the
measurement of the latent variable is explained in Section 5.3. Sections 5.4 and 5.5 present the data
preparation and data representativeness prior to data analysis. Section 5.6 describes the PLS-SEM
analysis for continuance intention model and Section 5.7 does the same for the level of adoption
model. These two models are based on the two different setting used in this study: system adoption
and system continuance perspective. This chapter ends with a summary of the results of both
models in Section 5.9.
5.2. Survey Design
The unit of analysis in this research is an Indonesian government (or public) agency where each
respondent provide an organisation viewpoint for their organisation. As part of the electronic
procurement adoption strategy, each government agency in Indonesia is required to set up a special
electronic procurement body named the LPSE within each agency. Since the unit of analysis is an
organisation, the survey was designed to capture an organisational-level perception. Therefore, the
survey recruitment targeted senior officers in the LPSE who are equivalent to the Chief Information
Officer (CIO). This could be an LPSE head or agency senior staff member who can represent the
organisation’s perspective on the electronic procurement system level of adoption and continuance
in their organisation.
Invitation emails were sent to the entire Indonesian population of LPSE top managers in 534
agencies scattered all over Indonesia’s main islands. The online survey provider (surveygizmo)
~ 85 ~
provides a service to block a second response from the same IP address, to ensure that there was
only one respondent per government agency. Responses were classified by the location of the
agency according to the classification of Indonesia’s seven main islands. Once classified, the
representativeness of the responses was analysed. The survey opened on February 19th 2014 and
closed on May 3rd 2014. The survey was administered in the Indonesian language (Bahasa
Indonesia). The questionnaire was double translated from English to Bahasa and back to ensure the
meanings were the same as in the original instrument (McGorry, 2000). A total of 257 respondents
accessed the questionnaire and 149 questionnaires were completed, constituting a response rate of
28% from the total population of 534.This is considered adequate for an online survey (Nulty,
2008).
5.3. Data Preparation
To understand the nature of the collected data, a series of statistical tests should be conducted such
as tests for missing data, normality and outliers (Hair, Hult, Ringle and Sartsedt, 2014). Prior to
PLS-SEM analysis, reflective measurement requires the unidimensionality test (Tenenhaus, Vinzi,
Chatelin and Lauro, 2005) to ensure the item measurements reflect one and only one latent
construct (Straub, Bodreau and Gefen, 2004). The data preparation analysis is discussed in
summary in the next paragraph, with more details set out in Appendix F.
Three respondents with missing values in excess of 15% (Hair et al., 2014) were deleted. The
expectation maximisation (EM) algorithm was used in order to replace the missing data in the
dataset. The normality test was also conducted on the dataset. Some variables, namely, EMPL,
BUDG, CI3, FC4, SI4, PRoC4, EoS9 and PE3, had kurtosis values more than the threshold (+/-
1.96). Treatment for non-normal data was not conducted as it may have affected the final
interpretation and this research uses PLS-SEM that does not require data normality (Hair et al.,
2014). Some items (FC6, FC7, FC8, FC9) were removed from further analysis. This removal is
based on fact that it has more than 15% missing data. After rechecking the survey display, it seems
that the question was misplaced on the screen so many respondents did not notice it on the screen.
After removal facilitating condition (FC) construct still have five item measurements, so its removal
has not to be considered as statistically problematic.
No univariate outliers were detected in the dataset but two respondents were deleted due to
multivariate outliers. After this deletion, the number of respondents was 144. The unidimensionality
test was also conducted, with the result indicating that all existing exogenous and endogenous
variables were unidimensional. The new construct EOS was unidimensional, but PRoC was divided
into two constructs, namely, PRoC and trust in e-Procurement (TieP). Here TieP is defined as
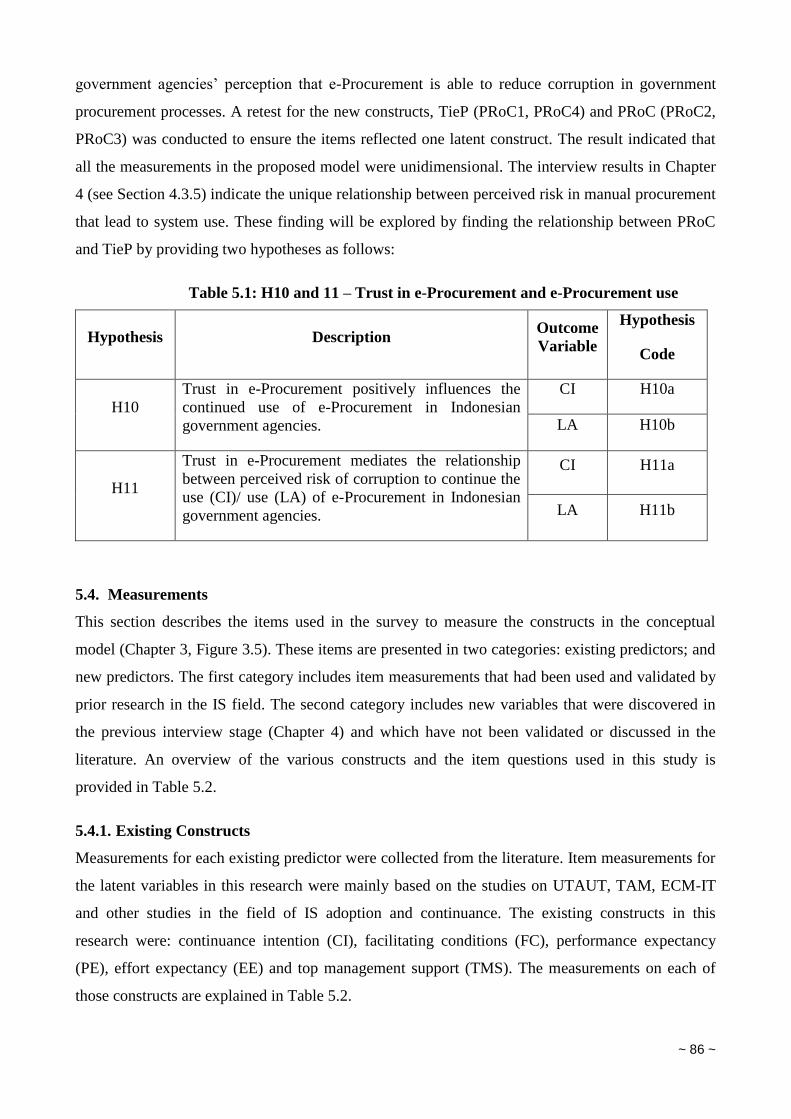
~ 86 ~
government agencies’ perception that e-Procurement is able to reduce corruption in government
procurement processes. A retest for the new constructs, TieP (PRoC1, PRoC4) and PRoC (PRoC2,
PRoC3) was conducted to ensure the items reflected one latent construct. The result indicated that
all the measurements in the proposed model were unidimensional. The interview results in Chapter
4 (see Section 4.3.5) indicate the unique relationship between perceived risk in manual procurement
that lead to system use. These finding will be explored by finding the relationship between PRoC
and TieP by providing two hypotheses as follows:
Table 5.1: H10 and 11 – Trust in e-Procurement and e-Procurement use
Hypothesis Description Outcome
Variable
Hypothesis
Code
H10
Trust in e-Procurement positively influences the
continued use of e-Procurement in Indonesian
government agencies.
CI H10a
LA H10b
H11
Trust in e-Procurement mediates the relationship
between perceived risk of corruption to continue the
use (CI)/ use (LA) of e-Procurement in Indonesian
government agencies.
CI H11a
LA H11b
5.4. Measurements
This section describes the items used in the survey to measure the constructs in the conceptual
model (Chapter 3, Figure 3.5). These items are presented in two categories: existing predictors; and
new predictors. The first category includes item measurements that had been used and validated by
prior research in the IS field. The second category includes new variables that were discovered in
the previous interview stage (Chapter 4) and which have not been validated or discussed in the
literature. An overview of the various constructs and the item questions used in this study is
provided in Table 5.2.
5.4.1. Existing Constructs
Measurements for each existing predictor were collected from the literature. Item measurements for
the latent variables in this research were mainly based on the studies on UTAUT, TAM, ECM-IT
and other studies in the field of IS adoption and continuance. The existing constructs in this
research were: continuance intention (CI), facilitating conditions (FC), performance expectancy
(PE), effort expectancy (EE) and top management support (TMS). The measurements on each of
those constructs are explained in Table 5.2.
~ 87 ~
The item measurements for the endogenous variable, continuance intention, were adapted from
Bhattacherjee (2001). This item has been used and validated by at least two prior studies on e-
Government continuation of use in different country settings (Alruwaie, El Haddadeh and
Weerakkody, 2012; Venkatesh, Thong, Chan, Hu and Brown, 2011). Four existing exogenous
constructs in IT adoption were identified in the conceptual framework (see Figure 2.2 in Chapter 2).
The variables were FC, social influence (SI), PE and EE. These four existing constructs were
assumed to influence two endogenous variables, namely, CI and level of adoption (LA). The
literature also validates these four existing construct to measure e-Procurement adoption in an
organisational setting (Chu, Hsiao, Lee and Chen, 2004). In addition, the interview results presented
in Chapter 4 demonstrated the presence of these constructs as an enabler of e-Procurement adoption
and continuance. Therefore, these four existing constructs were retained as predictors of the IS level
of adoption and continuance in the survey.
The four constructs mentioned above were taken from two well-established models of IS adoption:
the UTAUT (Venkatesh, Morris, Davis and Davis, 2003) and the TAM (Davis, 1985; Venkatesh
and Davis, 2000; Venkatesh and Bala, 2008). In this research, the item questions for PE and EE
were taken from the research by Davis (1989), Davis, Baggozi and Warshaw (1989) and Moore and
Benbasat (1991). Item wording adjustment was conducted for e-Procurement in the Indonesian
context. For FC, the results of the interviews in the previous research stage identified three new
dimensions of FC: infrastructure (Chen and Tsou, 2007; Taylor and Todd, 1995), training (Simon,
Grover, Teng and Whitcomb, 1996; Thong, Yap and Raman, 1996) and technical support
(Thompson, Higgins and Howell, 1991; Thong et al., 1996). These new dimensions were added to
the FC construct.
The interview results revealed four dimensions of SI for e-Procurement adoption and continuance in
the Indonesian e-Procurement context: Coercive Pressure (CP), Normative Pressure (NP), Mimetic
Pressure (MP), and Image (IMG). CP, NP and MP are the dimensions of Institutional Pressure (IP)
(DiMaggio and Powell, 1981). The presence of IP has been used and validated in IS adoption
research either in private organisations (Mignerat and Rivard, 2009) or in government agencies
(Zhen, Chen, Huang and Zhang, 2013). The four dimensions of IP were measured using existing
items. The item question for measuring CP, MP and NP were taken from the literature on IS system
adoption (Shi and Shambare, 2008; Teo, Wei and Benbasat, 2003; Ugrin, 2009). To measure the
IMG dimension, item questions from Moore and Benbasat’s (1991) research were utilised. Recent
work in the literature on e-Procurement adoption in developing countries used all of the above
dimensions to measure SI (Wahid, 2010).
~ 88 ~
The qualitative stage of this thesis also indicated the importance of the top managers’ role toward e-
Procurement adoption and continuance. In order to validate this finding, this stage probes the role of
TMS in predicting CI and LA of an IT innovation in an Indonesian government agency. The TMS
item measurement has been used by prior research in organisational settings (Rodgers, Hunter and
Rogers, 1993; Yap, Soh and Raman, 1992) and in the e-Government context (Kim, Kim and Lee,
2009). The present adopts similar items with adjustments for the Indonesian e-Procurement context.
The details on each item in the existing constructs are presented in Table 5.2.
5.4.2. New Constructs
This section explains how the new item measurements found in the qualitative stage were
developed. The discussion starts with an overview of the new item development and ends with an
explanation of the new item validation.
(a) New Item Development
External organisation strategy (EOS) has been found to be a determinant of electronic system
adoption at the local government level in Indonesia (Nurdin, Stockdale and Scheepers, 2012). The
qualitative stage in this research produced a similar result by revealing the role of an external
organisation (namely, the NPPA) in the successful adoption and continuance of an e-Procurement
system. For the agencies investigated in this study, the NPPA acted as an advocate and facilitator
for the implementation of the e-Procurement system. Even though Nurdin et al.’s (2012) research
produced a similar result, there does not appear to be any developed dimensions or item
measurements for measuring the influence of an external organisation’s strategy on ICT system
level of adoption or system continuation in their study or elsewhere in the literature. Therefore, this
research developed new item measurements for measuring EOS. EOS in this research is defined as
the role of an external organisation strategy in facilitating e-Procurement adoption success.
Another new construct, namely, perceived risk of corruption (PRoC), was also discovered during
the interview stage of this study (see Chapter 4). This construct implies that the risk of corruption in
the manual procurement motivate government agency to adopt e-Procurement system. PRoC
construct is mainly based on the perceived risk regarding the newly adopted electronic system
(Belanger and Carter, 2008; Colesca, 2009). Due to limited previous work about perceived risk in
the manual process in relation to IS use and/or continuance, this research has developed
measurement items for PRoC. PRoC is defined as risk perceived by government procurement
official as a result of law enforcement in combating corruption in manual procurement process. The
complete item measurements for the new constructs were presented above in Table 5.2.
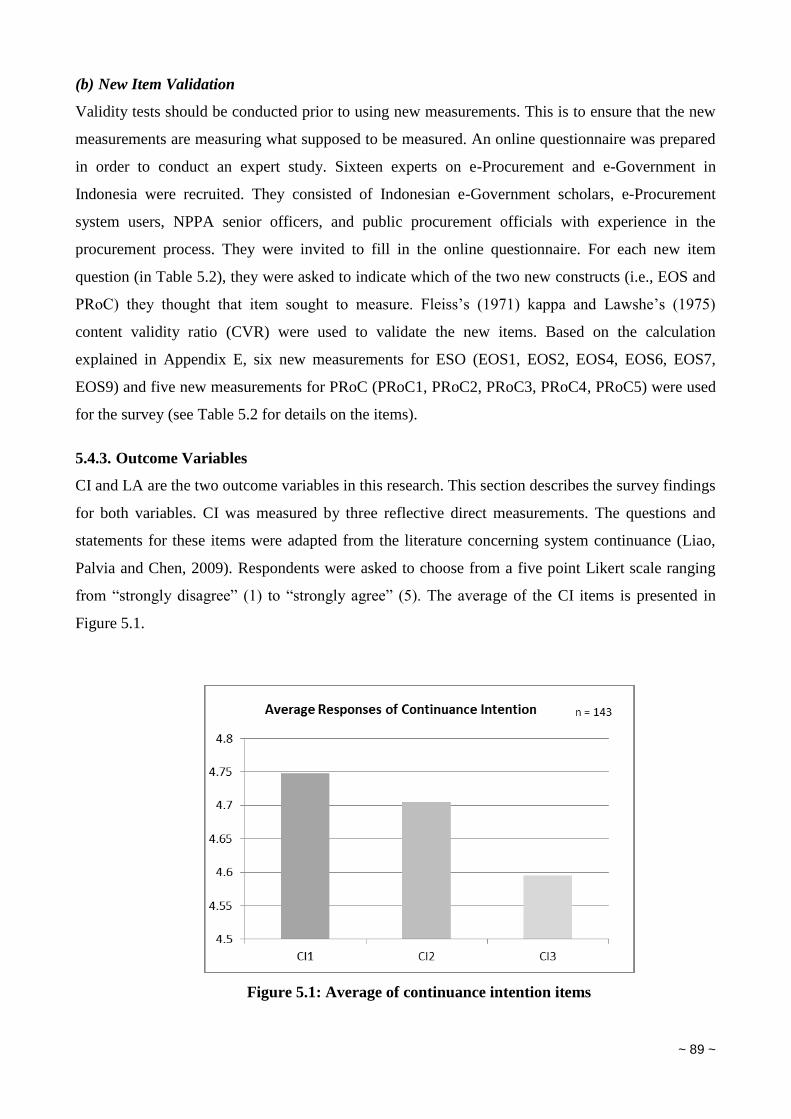
~ 89 ~
(b) New Item Validation
Validity tests should be conducted prior to using new measurements. This is to ensure that the new
measurements are measuring what supposed to be measured. An online questionnaire was prepared
in order to conduct an expert study. Sixteen experts on e-Procurement and e-Government in
Indonesia were recruited. They consisted of Indonesian e-Government scholars, e-Procurement
system users, NPPA senior officers, and public procurement officials with experience in the
procurement process. They were invited to fill in the online questionnaire. For each new item
question (in Table 5.2), they were asked to indicate which of the two new constructs (i.e., EOS and
PRoC) they thought that item sought to measure. Fleiss’s (1971) kappa and Lawshe’s (1975)
content validity ratio (CVR) were used to validate the new items. Based on the calculation
explained in Appendix E, six new measurements for ESO (EOS1, EOS2, EOS4, EOS6, EOS7,
EOS9) and five new measurements for PRoC (PRoC1, PRoC2, PRoC3, PRoC4, PRoC5) were used
for the survey (see Table 5.2 for details on the items).
5.4.3. Outcome Variables
CI and LA are the two outcome variables in this research. This section describes the survey findings
for both variables. CI was measured by three reflective direct measurements. The questions and
statements for these items were adapted from the literature concerning system continuance (Liao,
Palvia and Chen, 2009). Respondents were asked to choose from a five point Likert scale ranging
from “strongly disagree” (1) to “strongly agree” (5). The average of the CI items is presented in
Figure 5.1.
Figure 5.1: Average of continuance intention items
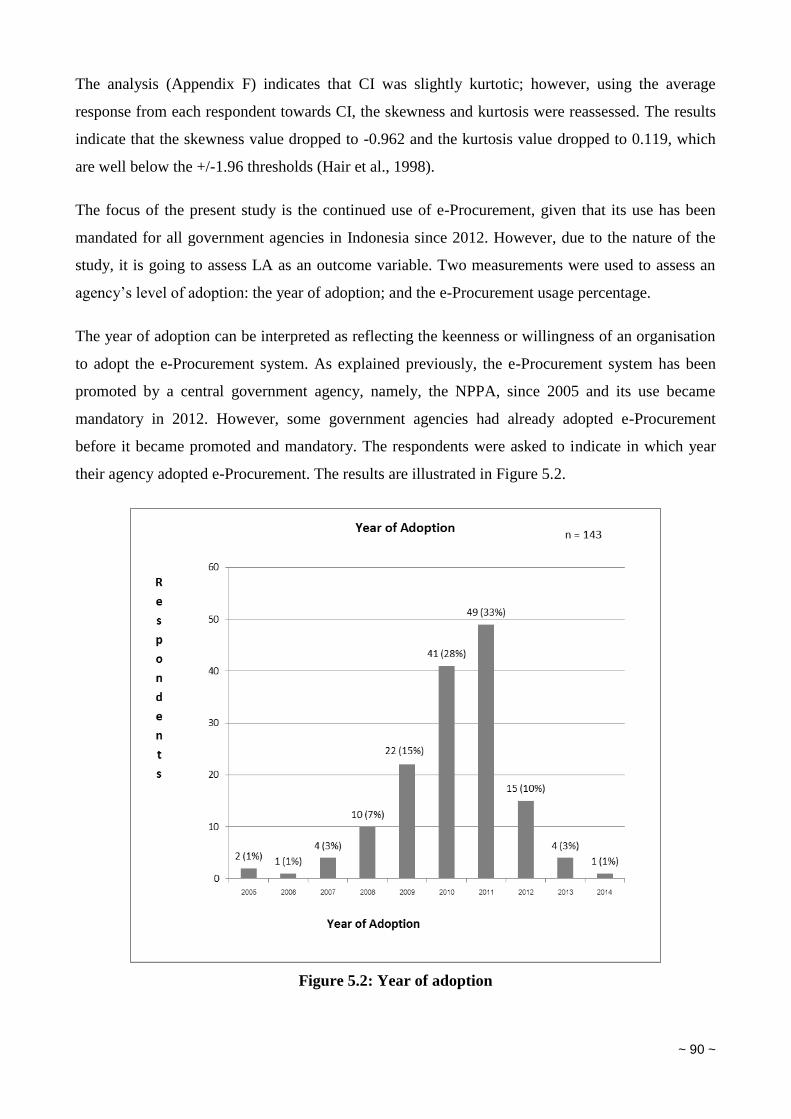
~ 90 ~
The analysis (Appendix F) indicates that CI was slightly kurtotic; however, using the average
response from each respondent towards CI, the skewness and kurtosis were reassessed. The results
indicate that the skewness value dropped to -0.962 and the kurtosis value dropped to 0.119, which
are well below the +/-1.96 thresholds (Hair et al., 1998).
The focus of the present study is the continued use of e-Procurement, given that its use has been
mandated for all government agencies in Indonesia since 2012. However, due to the nature of the
study, it is going to assess LA as an outcome variable. Two measurements were used to assess an
agency’s level of adoption: the year of adoption; and the e-Procurement usage percentage.
The year of adoption can be interpreted as reflecting the keenness or willingness of an organisation
to adopt the e-Procurement system. As explained previously, the e-Procurement system has been
promoted by a central government agency, namely, the NPPA, since 2005 and its use became
mandatory in 2012. However, some government agencies had already adopted e-Procurement
before it became promoted and mandatory. The respondents were asked to indicate in which year
their agency adopted e-Procurement. The results are illustrated in Figure 5.2.
Figure 5.2: Year of adoption
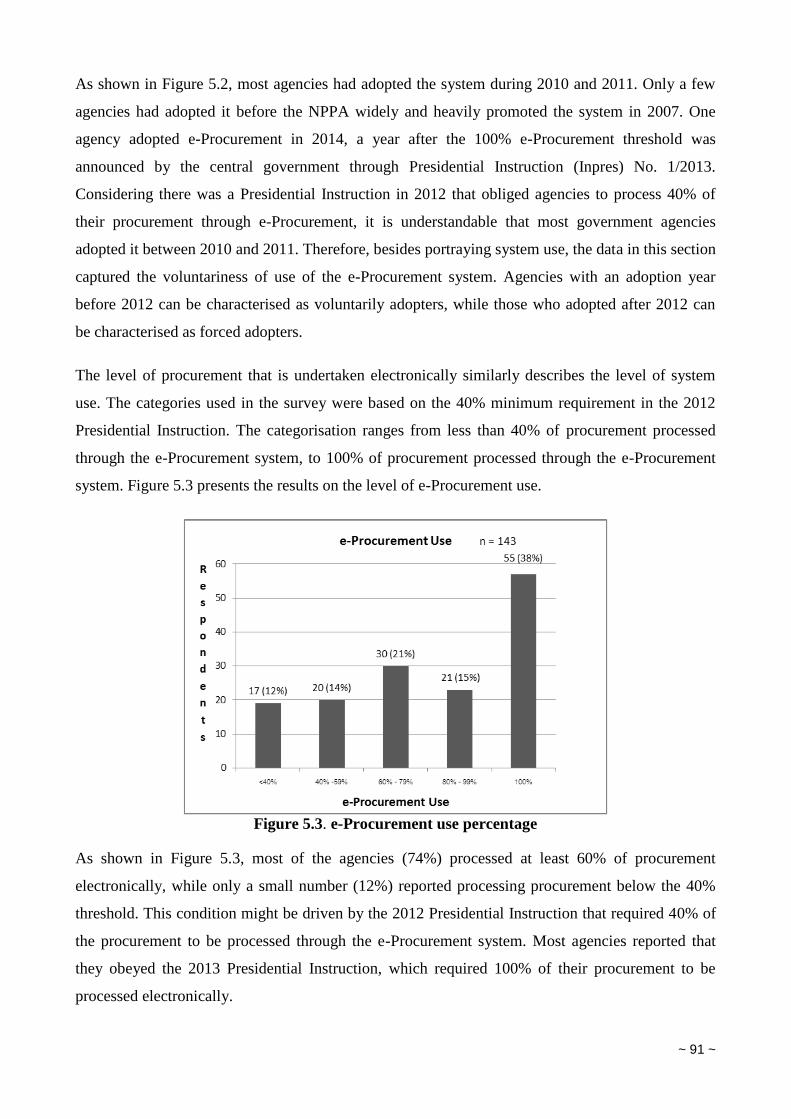
~ 91 ~
As shown in Figure 5.2, most agencies had adopted the system during 2010 and 2011. Only a few
agencies had adopted it before the NPPA widely and heavily promoted the system in 2007. One
agency adopted e-Procurement in 2014, a year after the 100% e-Procurement threshold was
announced by the central government through Presidential Instruction (Inpres) No. 1/2013.
Considering there was a Presidential Instruction in 2012 that obliged agencies to process 40% of
their procurement through e-Procurement, it is understandable that most government agencies
adopted it between 2010 and 2011. Therefore, besides portraying system use, the data in this section
captured the voluntariness of use of the e-Procurement system. Agencies with an adoption year
before 2012 can be characterised as voluntarily adopters, while those who adopted after 2012 can
be characterised as forced adopters.
The level of procurement that is undertaken electronically similarly describes the level of system
use. The categories used in the survey were based on the 40% minimum requirement in the 2012
Presidential Instruction. The categorisation ranges from less than 40% of procurement processed
through the e-Procurement system, to 100% of procurement processed through the e-Procurement
system. Figure 5.3 presents the results on the level of e-Procurement use.
Figure 5.3. e-Procurement use percentage
As shown in Figure 5.3, most of the agencies (74%) processed at least 60% of procurement
electronically, while only a small number (12%) reported processing procurement below the 40%
threshold. This condition might be driven by the 2012 Presidential Instruction that required 40% of
the procurement to be processed through the e-Procurement system. Most agencies reported that
they obeyed the 2013 Presidential Instruction, which required 100% of their procurement to be
processed electronically.
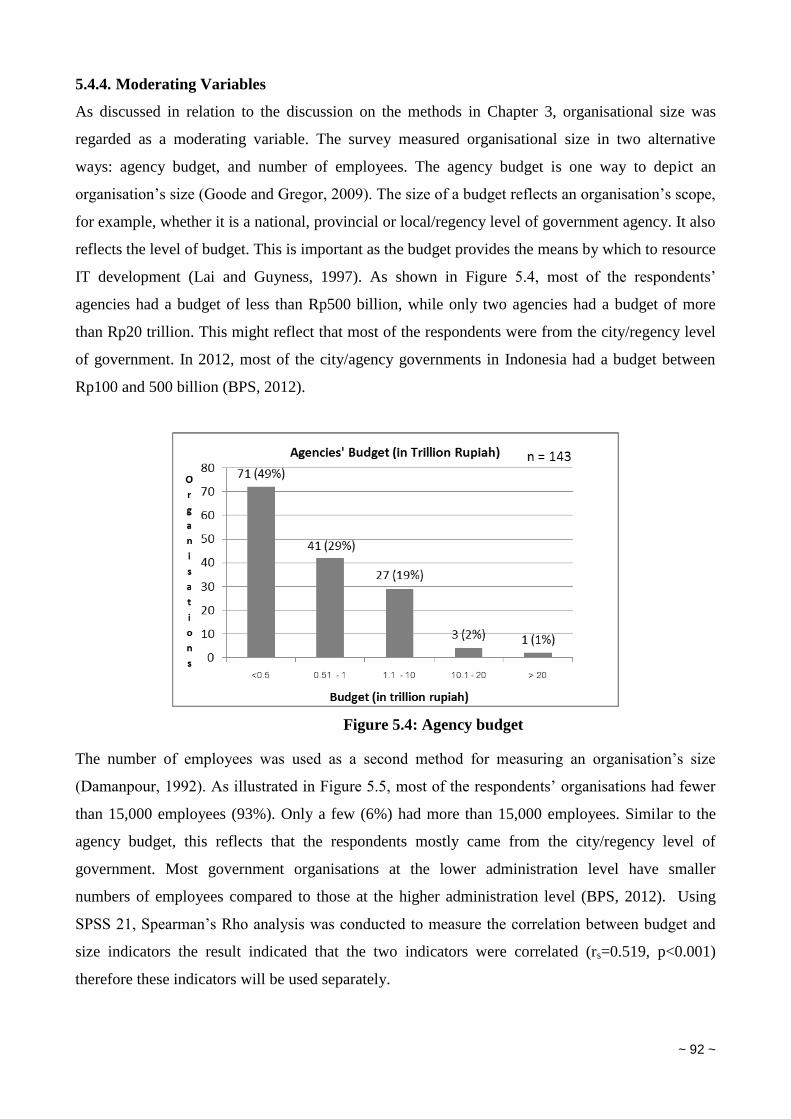
~ 92 ~
5.4.4. Moderating Variables
As discussed in relation to the discussion on the methods in Chapter 3, organisational size was
regarded as a moderating variable. The survey measured organisational size in two alternative
ways: agency budget, and number of employees. The agency budget is one way to depict an
organisation’s size (Goode and Gregor, 2009). The size of a budget reflects an organisation’s scope,
for example, whether it is a national, provincial or local/regency level of government agency. It also
reflects the level of budget. This is important as the budget provides the means by which to resource
IT development (Lai and Guyness, 1997). As shown in Figure 5.4, most of the respondents’
agencies had a budget of less than Rp500 billion, while only two agencies had a budget of more
than Rp20 trillion. This might reflect that most of the respondents were from the city/regency level
of government. In 2012, most of the city/agency governments in Indonesia had a budget between
Rp100 and 500 billion (BPS, 2012).
Figure 5.4: Agency budget
The number of employees was used as a second method for measuring an organisation’s size
(Damanpour, 1992). As illustrated in Figure 5.5, most of the respondents’ organisations had fewer
than 15,000 employees (93%). Only a few (6%) had more than 15,000 employees. Similar to the
agency budget, this reflects that the respondents mostly came from the city/regency level of
government. Most government organisations at the lower administration level have smaller
numbers of employees compared to those at the higher administration level (BPS, 2012). Using
SPSS 21, Spearman’s Rho analysis was conducted to measure the correlation between budget and
size indicators the result indicated that the two indicators were correlated (rs=0.519, p<0.001)
therefore these indicators will be used separately.
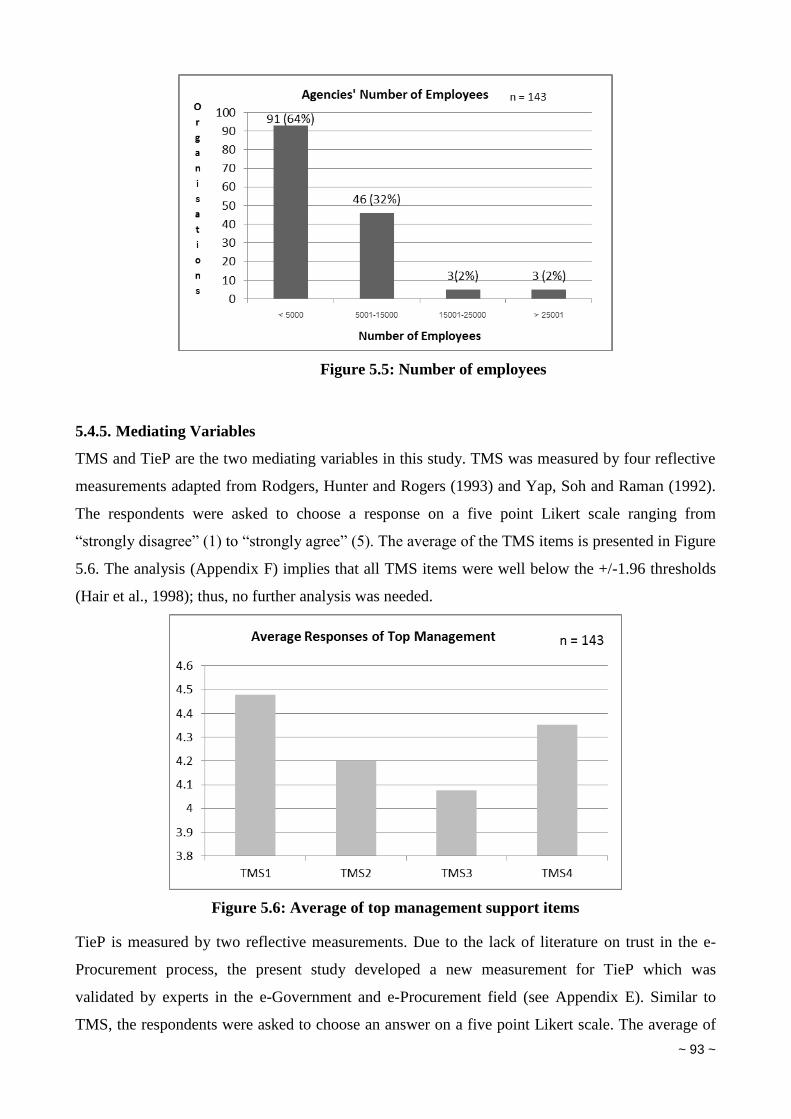
~ 93 ~
Figure 5.5: Number of employees
5.4.5. Mediating Variables
TMS and TieP are the two mediating variables in this study. TMS was measured by four reflective
measurements adapted from Rodgers, Hunter and Rogers (1993) and Yap, Soh and Raman (1992).
The respondents were asked to choose a response on a five point Likert scale ranging from
“strongly disagree” (1) to “strongly agree” (5). The average of the TMS items is presented in Figure
5.6. The analysis (Appendix F) implies that all TMS items were well below the +/-1.96 thresholds
(Hair et al., 1998); thus, no further analysis was needed.
Figure 5.6: Average of top management support items
TieP is measured by two reflective measurements. Due to the lack of literature on trust in the e-
Procurement process, the present study developed a new measurement for TieP which was
validated by experts in the e-Government and e-Procurement field (see Appendix E). Similar to
TMS, the respondents were asked to choose an answer on a five point Likert scale. The average of
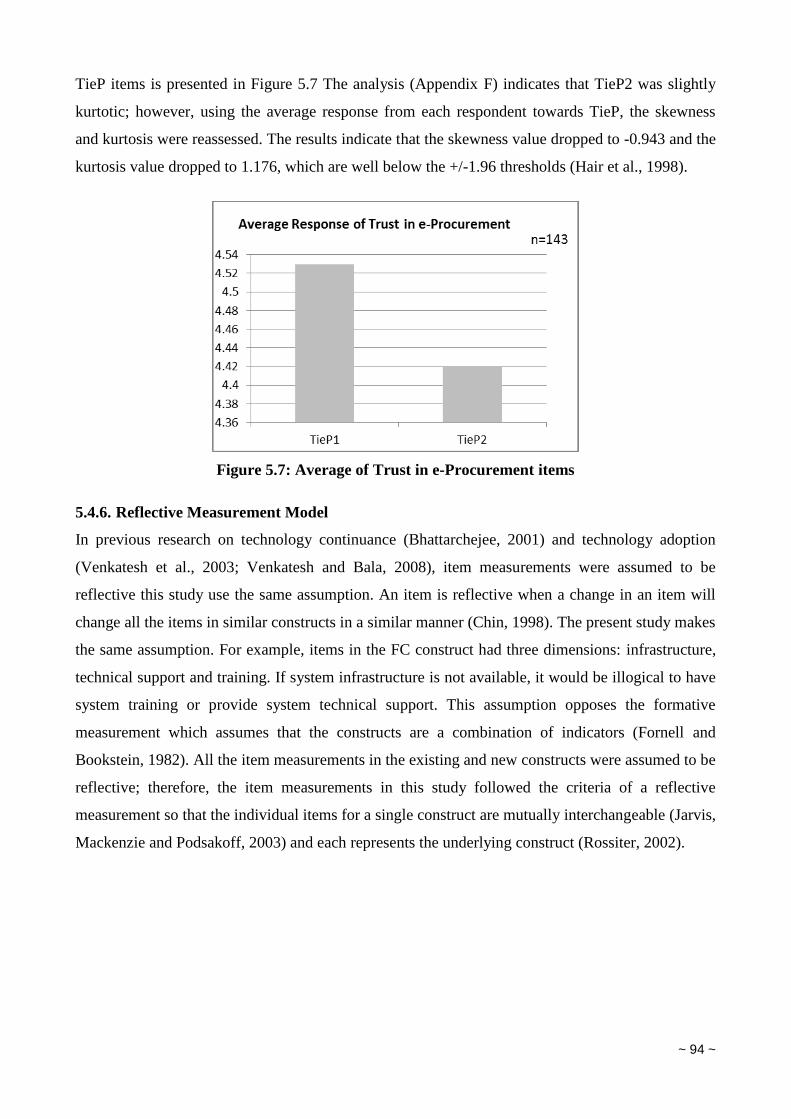
~ 94 ~
TieP items is presented in Figure 5.7 The analysis (Appendix F) indicates that TieP2 was slightly
kurtotic; however, using the average response from each respondent towards TieP, the skewness
and kurtosis were reassessed. The results indicate that the skewness value dropped to -0.943 and the
kurtosis value dropped to 1.176, which are well below the +/-1.96 thresholds (Hair et al., 1998).
Figure 5.7: Average of Trust in e-Procurement items
5.4.6. Reflective Measurement Model
In previous research on technology continuance (Bhattarchejee, 2001) and technology adoption
(Venkatesh et al., 2003; Venkatesh and Bala, 2008), item measurements were assumed to be
reflective this study use the same assumption. An item is reflective when a change in an item will
change all the items in similar constructs in a similar manner (Chin, 1998). The present study makes
the same assumption. For example, items in the FC construct had three dimensions: infrastructure,
technical support and training. If system infrastructure is not available, it would be illogical to have
system training or provide system technical support. This assumption opposes the formative
measurement which assumes that the constructs are a combination of indicators (Fornell and
Bookstein, 1982). All the item measurements in the existing and new constructs were assumed to be
reflective; therefore, the item measurements in this study followed the criteria of a reflective
measurement so that the individual items for a single construct are mutually interchangeable (Jarvis,
Mackenzie and Podsakoff, 2003) and each represents the underlying construct (Rossiter, 2002).
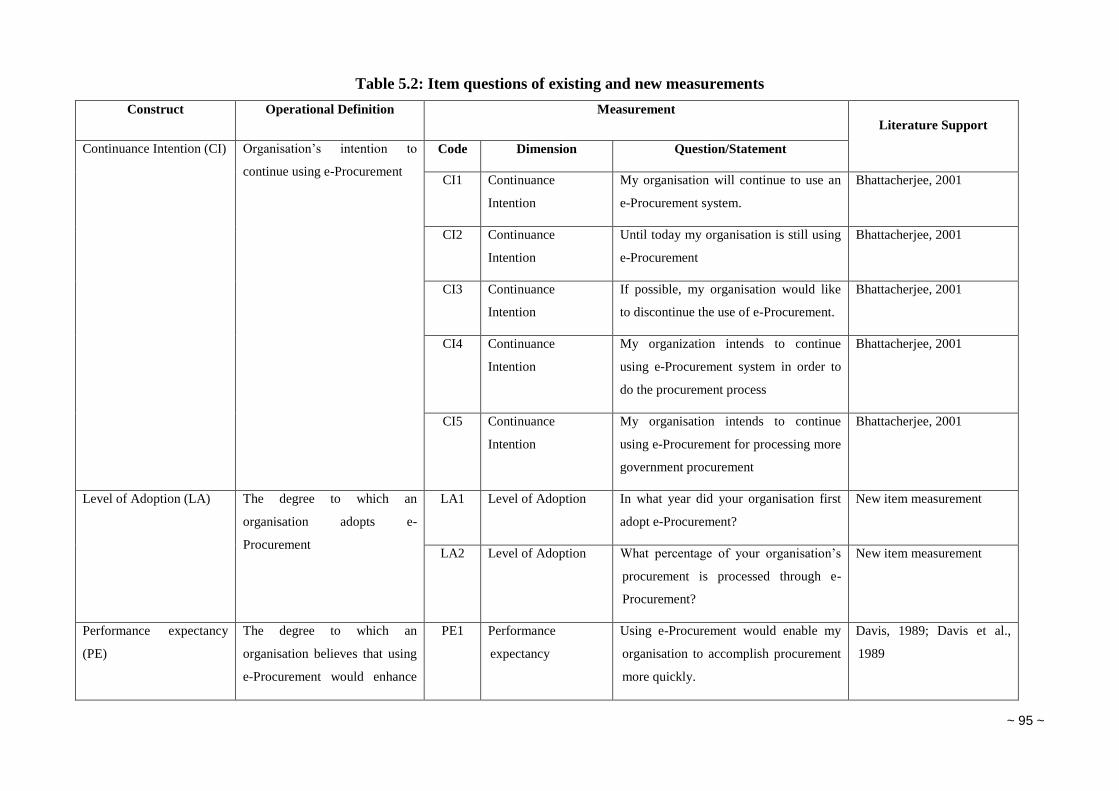
~ 95 ~
Table 5.2: Item questions of existing and new measurements
Construct Operational Definition Measurement
Literature Support
Continuance Intention (CI) Organisation’s intention to
continue using e-Procurement
Code Dimension Question/Statement
CI1 Continuance
Intention
My organisation will continue to use an
e-Procurement system.
Bhattacherjee, 2001
CI2 Continuance
Intention
Until today my organisation is still using
e-Procurement
Bhattacherjee, 2001
CI3 Continuance
Intention
If possible, my organisation would like
to discontinue the use of e-Procurement.
Bhattacherjee, 2001
CI4 Continuance
Intention
My organization intends to continue
using e-Procurement system in order to
do the procurement process
Bhattacherjee, 2001
CI5 Continuance
Intention
My organisation intends to continue
using e-Procurement for processing more
government procurement
Bhattacherjee, 2001
Level of Adoption (LA) The degree to which an
organisation adopts e-
Procurement
LA1 Level of Adoption In what year did your organisation first
adopt e-Procurement?
New item measurement
LA2 Level of Adoption What percentage of your organisation’s
procurement is processed through e-
Procurement?
New item measurement
Performance expectancy
(PE)
The degree to which an
organisation believes that using
e-Procurement would enhance
PE1 Performance
expectancy
Using e-Procurement would enable my
organisation to accomplish procurement
more quickly.
Davis, 1989; Davis et al.,
1989
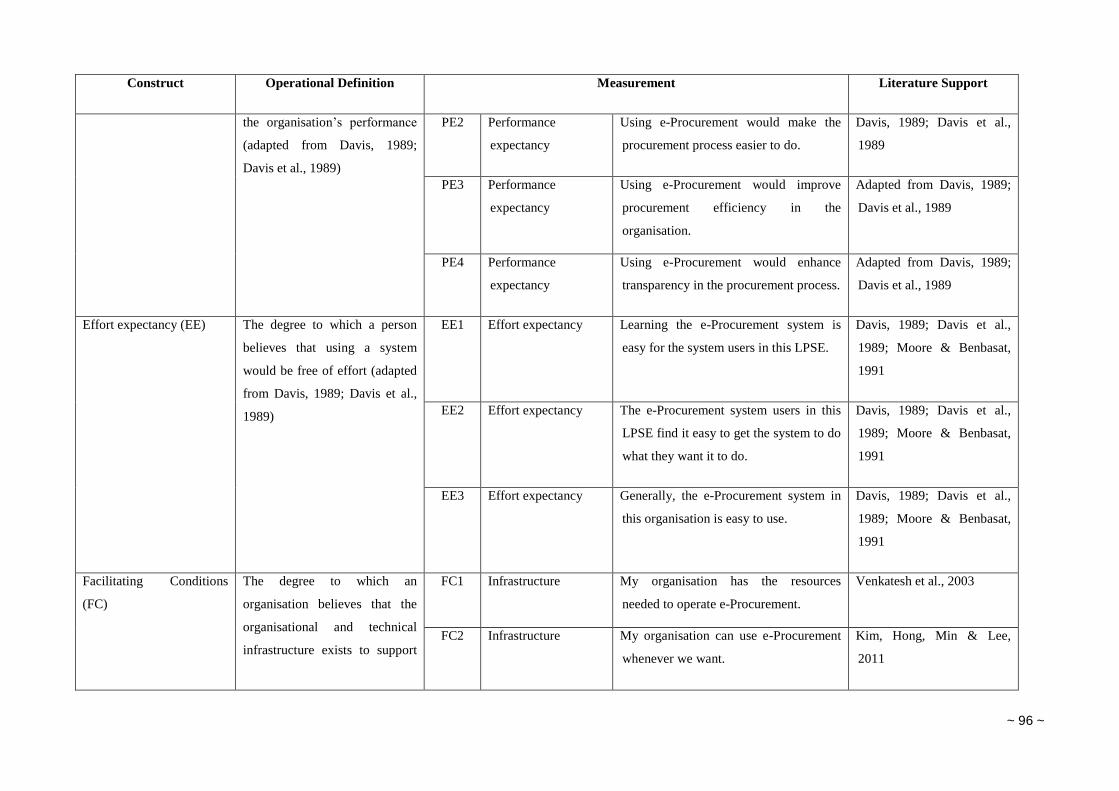
~ 96 ~
Construct Operational Definition Measurement Literature Support
the organisation’s performance
(adapted from Davis, 1989;
Davis et al., 1989)
PE2 Performance
expectancy
Using e-Procurement would make the
procurement process easier to do.
Davis, 1989; Davis et al.,
1989
PE3 Performance
expectancy
Using e-Procurement would improve
procurement efficiency in the
organisation.
Adapted from Davis, 1989;
Davis et al., 1989
PE4 Performance
expectancy
Using e-Procurement would enhance
transparency in the procurement process.
Adapted from Davis, 1989;
Davis et al., 1989
Effort expectancy (EE) The degree to which a person
believes that using a system
would be free of effort (adapted
from Davis, 1989; Davis et al.,
1989)
EE1 Effort expectancy Learning the e-Procurement system is
easy for the system users in this LPSE.
Davis, 1989; Davis et al.,
1989; Moore & Benbasat,
1991
EE2 Effort expectancy The e-Procurement system users in this
LPSE find it easy to get the system to do
what they want it to do.
Davis, 1989; Davis et al.,
1989; Moore & Benbasat,
1991
EE3 Effort expectancy Generally, the e-Procurement system in
this organisation is easy to use.
Davis, 1989; Davis et al.,
1989; Moore & Benbasat,
1991
Facilitating Conditions
(FC)
The degree to which an
organisation believes that the
organisational and technical
infrastructure exists to support
FC1 Infrastructure My organisation has the resources
needed to operate e-Procurement.
Venkatesh et al., 2003
FC2 Infrastructure My organisation can use e-Procurement
whenever we want.
Kim, Hong, Min & Lee,
2011
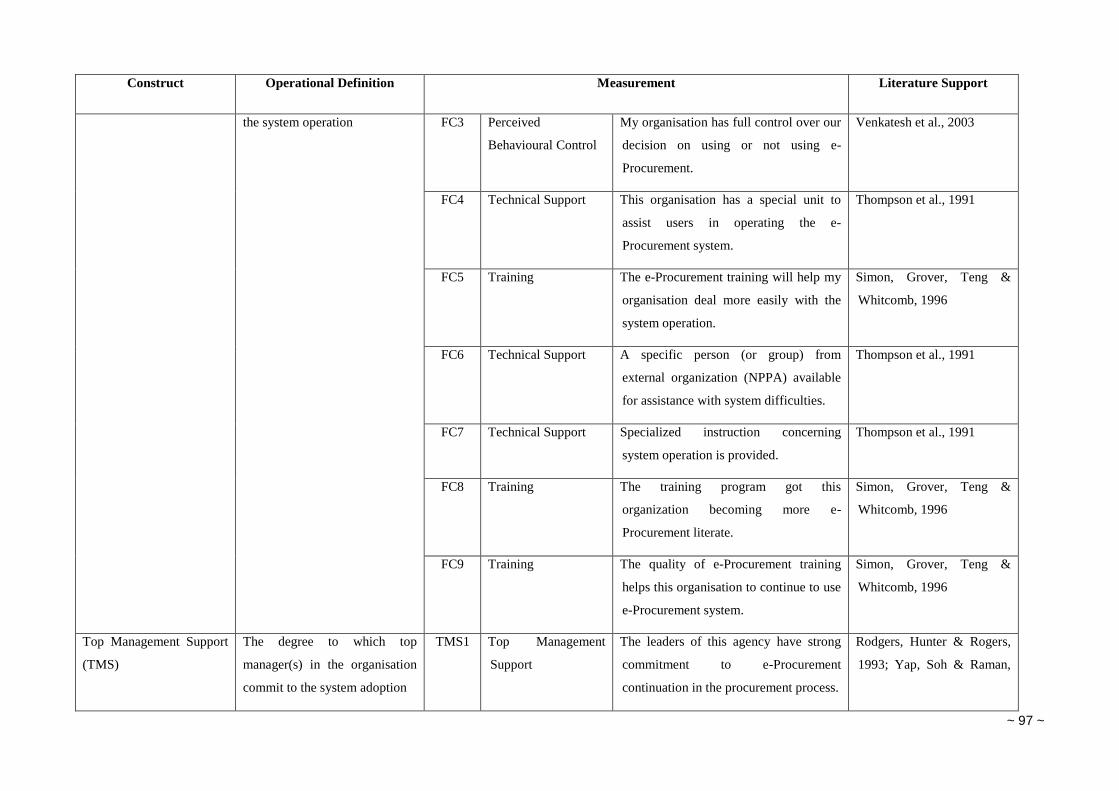
~ 97 ~
Construct Operational Definition Measurement Literature Support
the system operation FC3 Perceived
Behavioural Control
My organisation has full control over our
decision on using or not using e-
Procurement.
Venkatesh et al., 2003
FC4 Technical Support This organisation has a special unit to
assist users in operating the e-
Procurement system.
Thompson et al., 1991
FC5 Training The e-Procurement training will help my
organisation deal more easily with the
system operation.
Simon, Grover, Teng &
Whitcomb, 1996
FC6 Technical Support A specific person (or group) from
external organization (NPPA) available
for assistance with system difficulties.
Thompson et al., 1991
FC7 Technical Support Specialized instruction concerning
system operation is provided.
Thompson et al., 1991
FC8 Training The training program got this
organization becoming more e-
Procurement literate.
Simon, Grover, Teng &
Whitcomb, 1996
FC9 Training The quality of e-Procurement training
helps this organisation to continue to use
e-Procurement system.
Simon, Grover, Teng &
Whitcomb, 1996
Top Management Support
(TMS)
The degree to which top
manager(s) in the organisation
commit to the system adoption
TMS1 Top Management
Support
The leaders of this agency have strong
commitment to e-Procurement
continuation in the procurement process.
Rodgers, Hunter & Rogers,
1993; Yap, Soh & Raman,
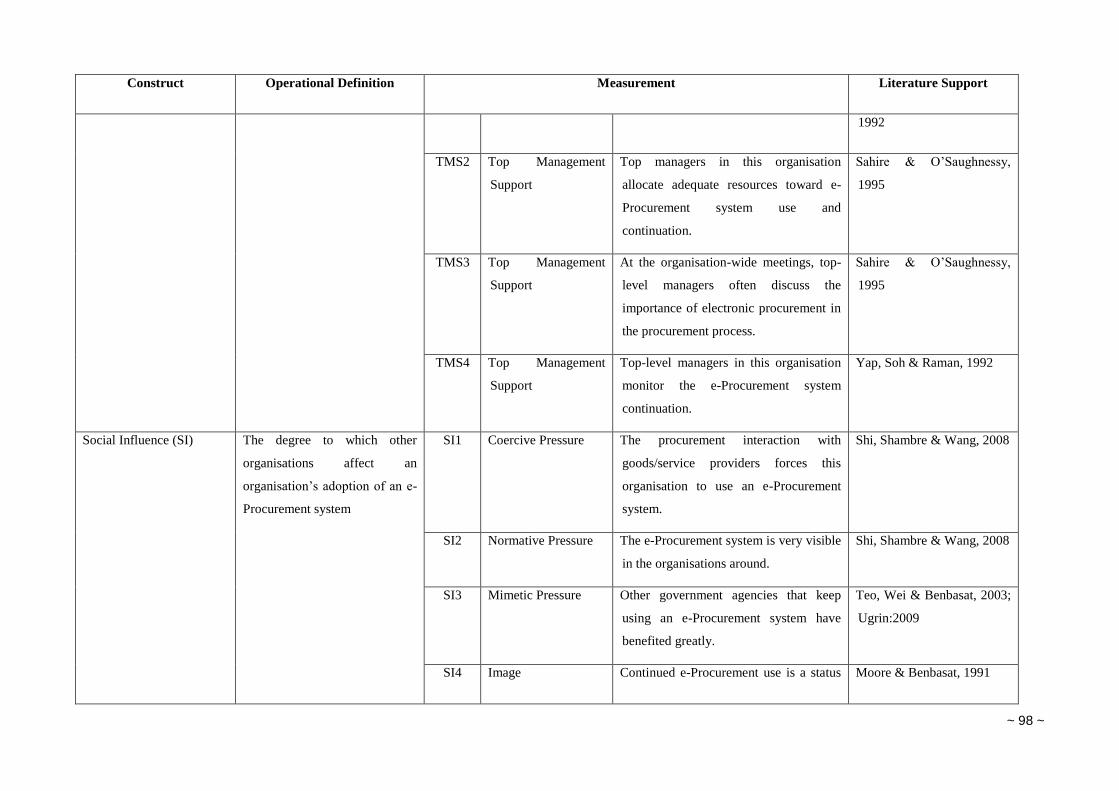
~ 98 ~
Construct Operational Definition Measurement Literature Support
1992
TMS2 Top Management
Support
Top managers in this organisation
allocate adequate resources toward e-
Procurement system use and
continuation.
Sahire & O’Saughnessy,
1995
TMS3 Top Management
Support
At the organisation-wide meetings, top-
level managers often discuss the
importance of electronic procurement in
the procurement process.
Sahire & O’Saughnessy,
1995
TMS4 Top Management
Support
Top-level managers in this organisation
monitor the e-Procurement system
continuation.
Yap, Soh & Raman, 1992
Social Influence (SI) The degree to which other
organisations affect an
organisation’s adoption of an e-
Procurement system
SI1 Coercive Pressure The procurement interaction with
goods/service providers forces this
organisation to use an e-Procurement
system.
Shi, Shambre & Wang, 2008
SI2 Normative Pressure The e-Procurement system is very visible
in the organisations around.
Shi, Shambre & Wang, 2008
SI3 Mimetic Pressure Other government agencies that keep
using an e-Procurement system have
benefited greatly.
Teo, Wei & Benbasat, 2003;
Ugrin:2009
SI4 Image Continued e-Procurement use is a status Moore & Benbasat, 1991
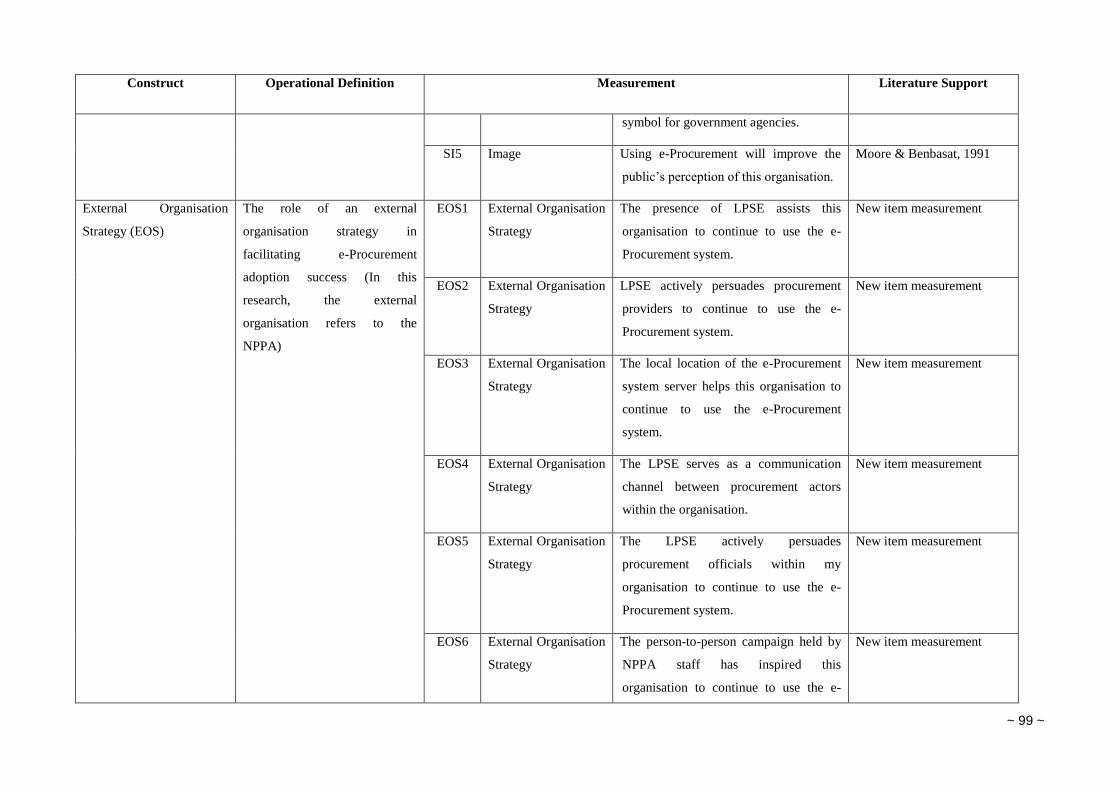
~ 99 ~
Construct Operational Definition Measurement Literature Support
symbol for government agencies.
SI5 Image Using e-Procurement will improve the
public’s perception of this organisation.
Moore & Benbasat, 1991
External Organisation
Strategy (EOS)
The role of an external
organisation strategy in
facilitating e-Procurement
adoption success (In this
research, the external
organisation refers to the
NPPA)
EOS1 External Organisation
Strategy
The presence of LPSE assists this
organisation to continue to use the e-
Procurement system.
New item measurement
EOS2 External Organisation
Strategy
LPSE actively persuades procurement
providers to continue to use the e-
Procurement system.
New item measurement
EOS3 External Organisation
Strategy
The local location of the e-Procurement
system server helps this organisation to
continue to use the e-Procurement
system.
New item measurement
EOS4 External Organisation
Strategy
The LPSE serves as a communication
channel between procurement actors
within the organisation.
New item measurement
EOS5 External Organisation
Strategy
The LPSE actively persuades
procurement officials within my
organisation to continue to use the e-
Procurement system.
New item measurement
EOS6 External Organisation
Strategy
The person-to-person campaign held by
NPPA staff has inspired this
organisation to continue to use the e-
New item measurement
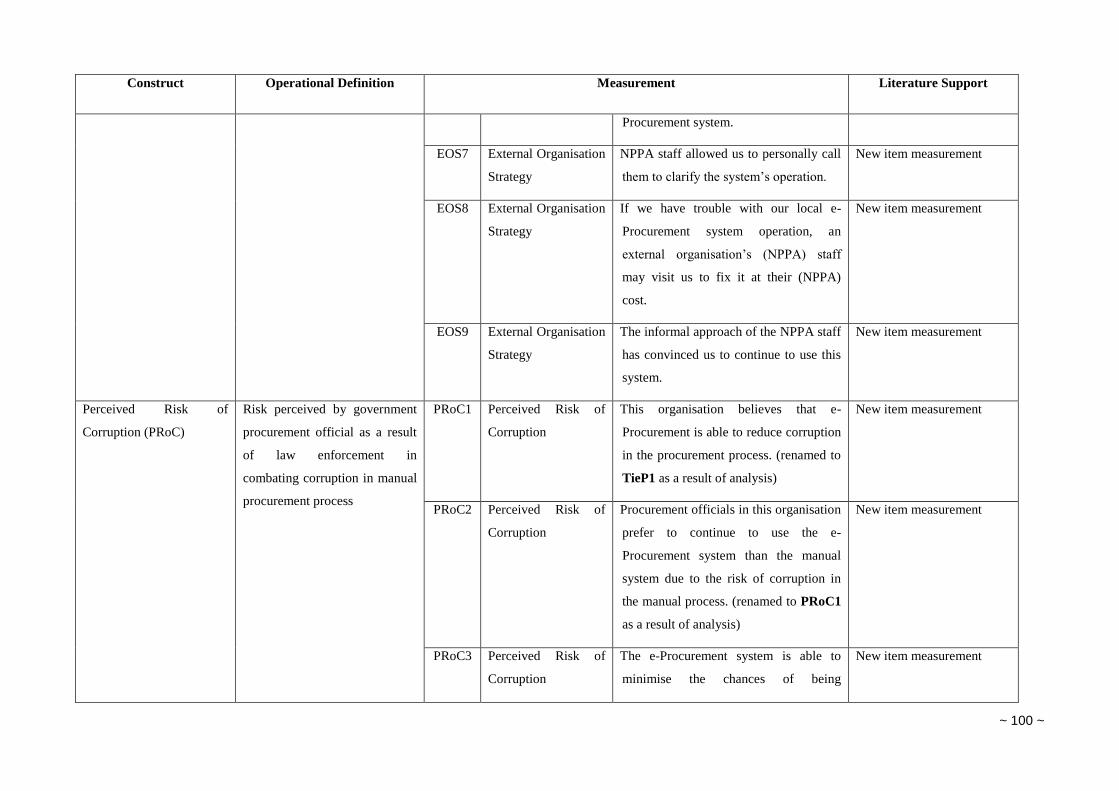
~ 100 ~
Construct Operational Definition Measurement Literature Support
Procurement system.
EOS7 External Organisation
Strategy
NPPA staff allowed us to personally call
them to clarify the system’s operation.
New item measurement
EOS8 External Organisation
Strategy
If we have trouble with our local e-
Procurement system operation, an
external organisation’s (NPPA) staff
may visit us to fix it at their (NPPA)
cost.
New item measurement
EOS9 External Organisation
Strategy
The informal approach of the NPPA staff
has convinced us to continue to use this
system.
New item measurement
Perceived Risk of
Corruption (PRoC)
Risk perceived by government
procurement official as a result
of law enforcement in
combating corruption in manual
procurement process
PRoC1 Perceived Risk of
Corruption
This organisation believes that e-
Procurement is able to reduce corruption
in the procurement process. (renamed to
TieP1 as a result of analysis)
New item measurement
PRoC2 Perceived Risk of
Corruption
Procurement officials in this organisation
prefer to continue to use the e-
Procurement system than the manual
system due to the risk of corruption in
the manual process. (renamed to PRoC1
as a result of analysis)
New item measurement
PRoC3 Perceived Risk of
Corruption
The e-Procurement system is able to
minimise the chances of being
New item measurement
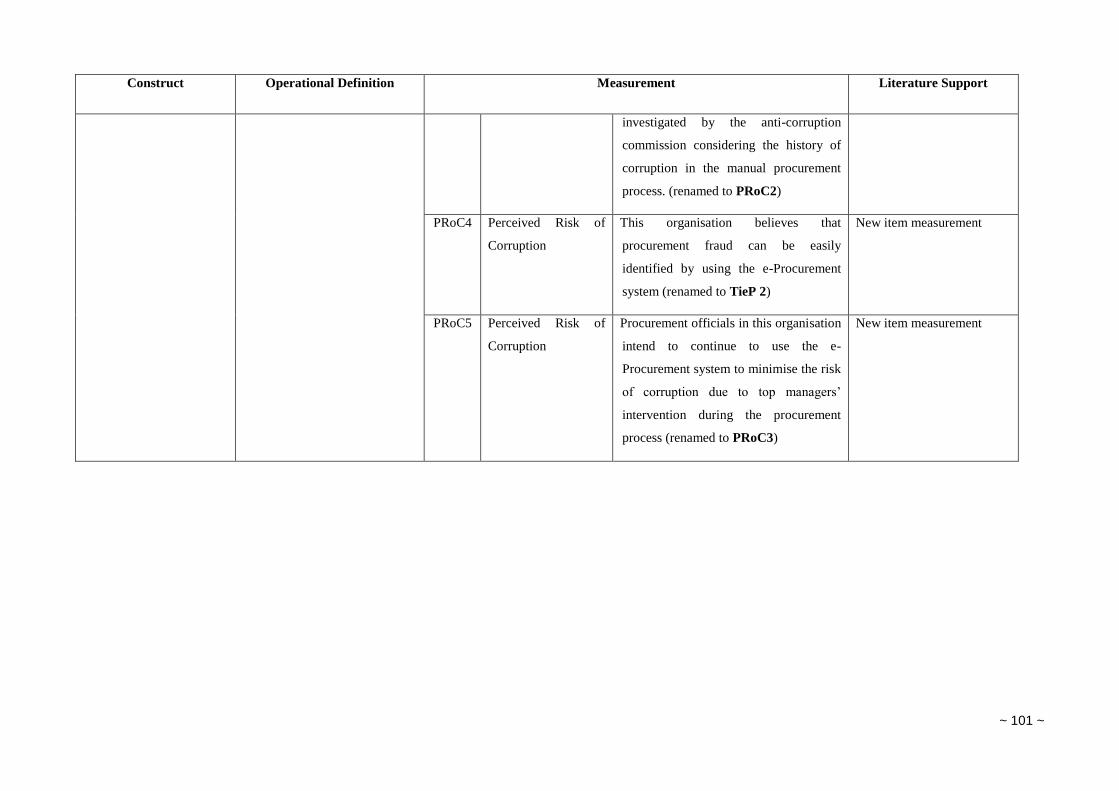
~ 101 ~
Construct Operational Definition Measurement Literature Support
investigated by the anti-corruption
commission considering the history of
corruption in the manual procurement
process. (renamed to PRoC2)
PRoC4 Perceived Risk of
Corruption
This organisation believes that
procurement fraud can be easily
identified by using the e-Procurement
system (renamed to TieP 2)
New item measurement
PRoC5 Perceived Risk of
Corruption
Procurement officials in this organisation
intend to continue to use the e-
Procurement system to minimise the risk
of corruption due to top managers’
intervention during the procurement
process (renamed to PRoC3)
New item measurement
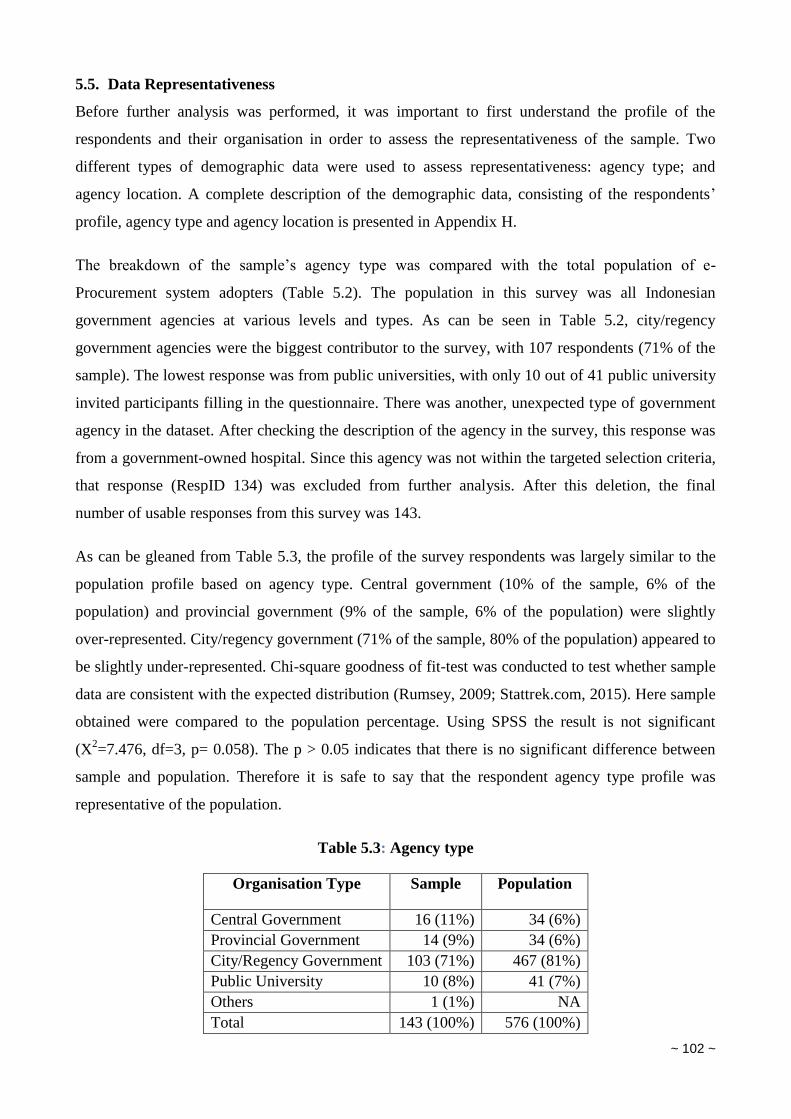
~ 102 ~
5.5. Data Representativeness
Before further analysis was performed, it was important to first understand the profile of the
respondents and their organisation in order to assess the representativeness of the sample. Two
different types of demographic data were used to assess representativeness: agency type; and
agency location. A complete description of the demographic data, consisting of the respondents’
profile, agency type and agency location is presented in Appendix H.
The breakdown of the sample’s agency type was compared with the total population of e-
Procurement system adopters (Table 5.2). The population in this survey was all Indonesian
government agencies at various levels and types. As can be seen in Table 5.2, city/regency
government agencies were the biggest contributor to the survey, with 107 respondents (71% of the
sample). The lowest response was from public universities, with only 10 out of 41 public university
invited participants filling in the questionnaire. There was another, unexpected type of government
agency in the dataset. After checking the description of the agency in the survey, this response was
from a government-owned hospital. Since this agency was not within the targeted selection criteria,
that response (RespID 134) was excluded from further analysis. After this deletion, the final
number of usable responses from this survey was 143.
As can be gleaned from Table 5.3, the profile of the survey respondents was largely similar to the
population profile based on agency type. Central government (10% of the sample, 6% of the
population) and provincial government (9% of the sample, 6% of the population) were slightly
over-represented. City/regency government (71% of the sample, 80% of the population) appeared to
be slightly under-represented. Chi-square goodness of fit-test was conducted to test whether sample
data are consistent with the expected distribution (Rumsey, 2009; Stattrek.com, 2015). Here sample
obtained were compared to the population percentage. Using SPSS the result is not significant
(X2=7.476, df=3, p= 0.058). The p > 0.05 indicates that there is no significant difference between
sample and population. Therefore it is safe to say that the respondent agency type profile was
representative of the population.
Table 5.3: Agency type
Organisation Type Sample Population
Central Government 16 (11%) 34 (6%)
Provincial Government 14 (9%) 34 (6%)
City/Regency Government 103 (71%) 467 (81%)
Public University 10 (8%) 41 (7%)
Others 1 (1%) NA
Total 143 (100%) 576 (100%)
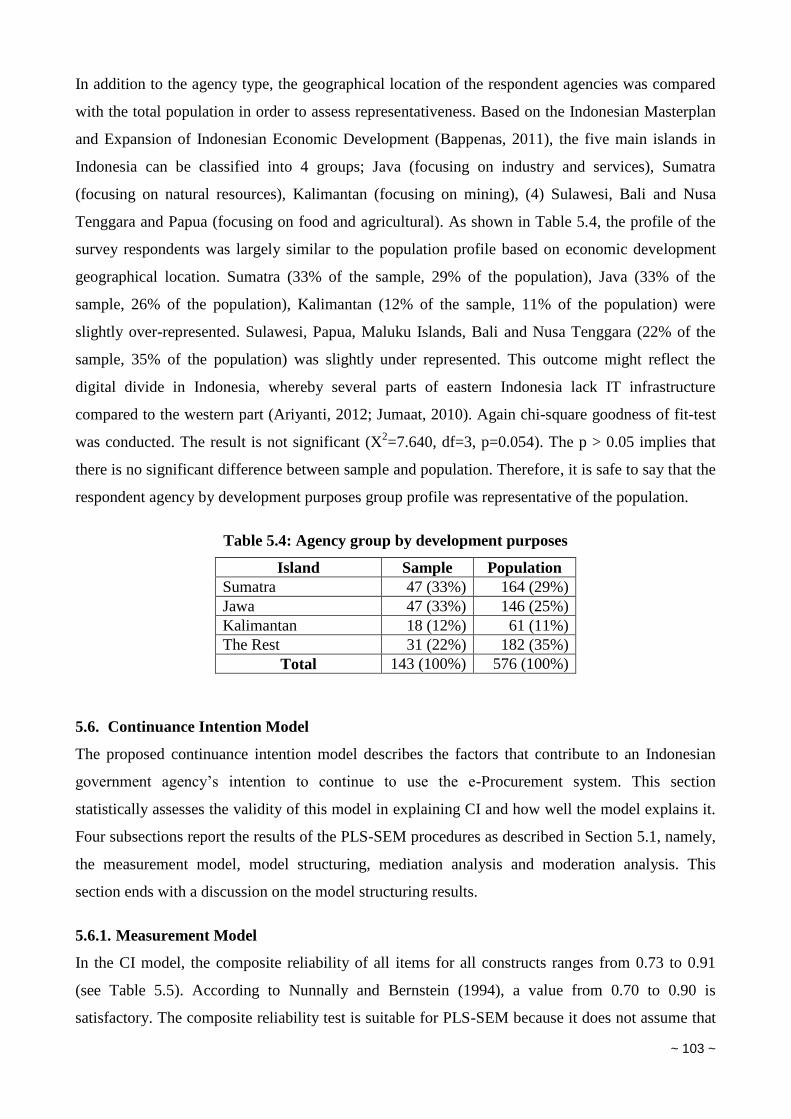
~ 103 ~
In addition to the agency type, the geographical location of the respondent agencies was compared
with the total population in order to assess representativeness. Based on the Indonesian Masterplan
and Expansion of Indonesian Economic Development (Bappenas, 2011), the five main islands in
Indonesia can be classified into 4 groups; Java (focusing on industry and services), Sumatra
(focusing on natural resources), Kalimantan (focusing on mining), (4) Sulawesi, Bali and Nusa
Tenggara and Papua (focusing on food and agricultural). As shown in Table 5.4, the profile of the
survey respondents was largely similar to the population profile based on economic development
geographical location. Sumatra (33% of the sample, 29% of the population), Java (33% of the
sample, 26% of the population), Kalimantan (12% of the sample, 11% of the population) were
slightly over-represented. Sulawesi, Papua, Maluku Islands, Bali and Nusa Tenggara (22% of the
sample, 35% of the population) was slightly under represented. This outcome might reflect the
digital divide in Indonesia, whereby several parts of eastern Indonesia lack IT infrastructure
compared to the western part (Ariyanti, 2012; Jumaat, 2010). Again chi-square goodness of fit-test
was conducted. The result is not significant (X2=7.640, df=3, p=0.054). The p > 0.05 implies that
there is no significant difference between sample and population. Therefore, it is safe to say that the
respondent agency by development purposes group profile was representative of the population.
Table 5.4: Agency group by development purposes
Island Sample Population
Sumatra 47 (33%) 164 (29%)
Jawa 47 (33%) 146 (25%)
Kalimantan 18 (12%) 61 (11%)
The Rest 31 (22%) 182 (35%)
Total 143 (100%) 576 (100%)
5.6. Continuance Intention Model
The proposed continuance intention model describes the factors that contribute to an Indonesian
government agency’s intention to continue to use the e-Procurement system. This section
statistically assesses the validity of this model in explaining CI and how well the model explains it.
Four subsections report the results of the PLS-SEM procedures as described in Section 5.1, namely,
the measurement model, model structuring, mediation analysis and moderation analysis. This
section ends with a discussion on the model structuring results.
5.6.1. Measurement Model
In the CI model, the composite reliability of all items for all constructs ranges from 0.73 to 0.91
(see Table 5.5). According to Nunnally and Bernstein (1994), a value from 0.70 to 0.90 is
satisfactory. The composite reliability test is suitable for PLS-SEM because it does not assume that
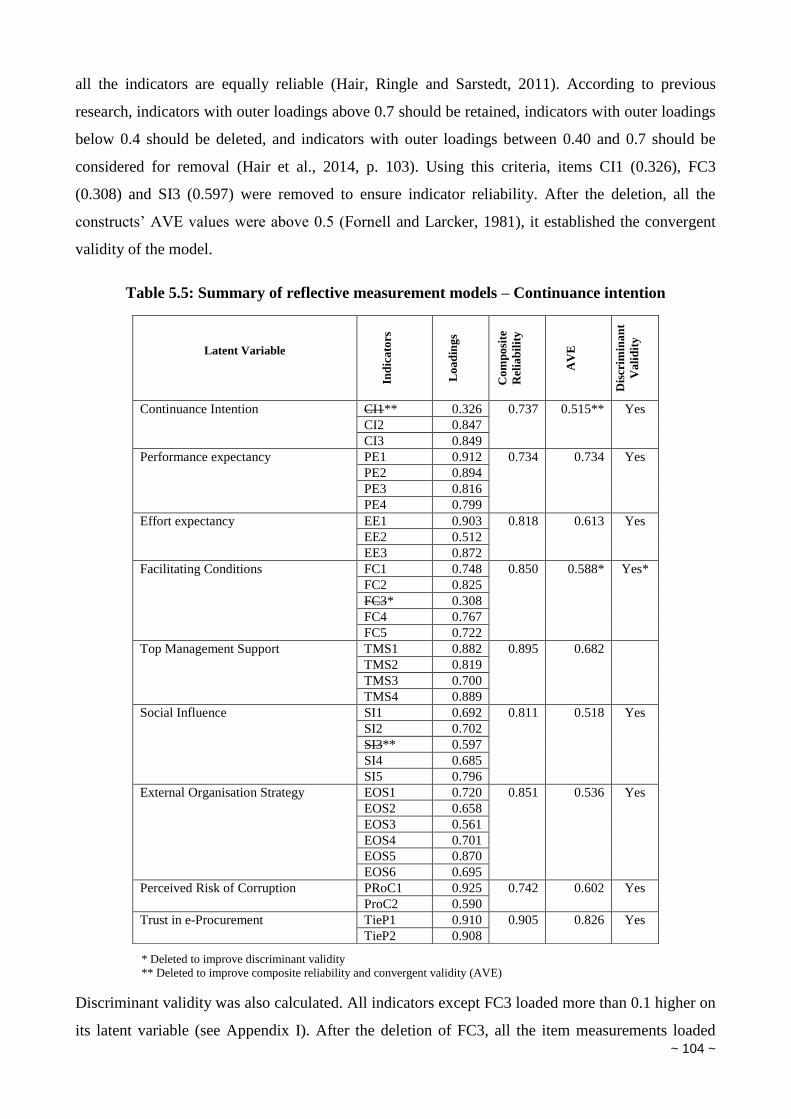
~ 104 ~
all the indicators are equally reliable (Hair, Ringle and Sarstedt, 2011). According to previous
research, indicators with outer loadings above 0.7 should be retained, indicators with outer loadings
below 0.4 should be deleted, and indicators with outer loadings between 0.40 and 0.7 should be
considered for removal (Hair et al., 2014, p. 103). Using this criteria, items CI1 (0.326), FC3
(0.308) and SI3 (0.597) were removed to ensure indicator reliability. After the deletion, all the
constructs’ AVE values were above 0.5 (Fornell and Larcker, 1981), it established the convergent
validity of the model.
Table 5.5: Summary of reflective measurement models – Continuance intention
* Deleted to improve discriminant validity
** Deleted to improve composite reliability and convergent validity (AVE)
Discriminant validity was also calculated. All indicators except FC3 loaded more than 0.1 higher on
its latent variable (see Appendix I). After the deletion of FC3, all the item measurements loaded
Latent Variable
Ind
ica
tors
Lo
ad
ing
s
Co
mp
osi
te
Rel
iab
ilit
y
AV
E
Dis
crim
ina
nt
Va
lid
ity
Continuance Intention CI1** 0.326 0.737 0.515** Yes
CI2 0.847
CI3 0.849
Performance expectancy PE1 0.912 0.734 0.734 Yes
PE2 0.894
PE3 0.816
PE4 0.799
Effort expectancy EE1 0.903 0.818 0.613 Yes
EE2 0.512
EE3 0.872
Facilitating Conditions FC1 0.748 0.850 0.588* Yes*
FC2 0.825
FC3* 0.308
FC4 0.767
FC5 0.722
Top Management Support TMS1 0.882 0.895 0.682
TMS2 0.819
TMS3 0.700
TMS4 0.889
Social Influence SI1 0.692 0.811 0.518 Yes
SI2 0.702
SI3** 0.597
SI4 0.685
SI5 0.796
External Organisation Strategy EOS1 0.720 0.851 0.536 Yes
EOS2 0.658
EOS3 0.561
EOS4 0.701
EOS5 0.870
EOS6 0.695
Perceived Risk of Corruption PRoC1 0.925 0.742 0.602 Yes
ProC2 0.590
Trust in e-Procurement TieP1 0.910 0.905 0.826 Yes
TieP2 0.908
~ 105 ~
higher on their latent variable than the other latent variable; this assured the discriminant validity in
the model (Gefen and Straub, 2005; Hair et al., 2014). In addition, the square root AVE of each
construct loaded higher than all its cross-loadings with other constructs. According to Fornell and
Larcker (1981), this result supports discriminant validity (see Appendix I).
5.6.2. Model Structuring
Using these revised items, model structuring of CI was conducted. The results are presented in
Figure 5.8. The model was tested separately for the two different measures of organisational size
(budget and number of employees). Only the results of the budget measure of size are reported here.
The analysis of the model using the number of employees as a measure of organisational size (as
presented in Appendix J) generated similar conclusions to the budget measure of organisational
size. This model resulted from the bootstrap procedure in SmartPLS 3. Bootstrapping is a
nonparametric technique to assess statistical significance without relying on distributional
assumptions (Efron and Tibshirani, 1994; Hair et al., 2014; Mooney and Duval, 1993). In the
context of PLS-SEM, Hair et al. (2011) suggested the rule of thumb for bootstrap samples is 5,000
with the number of cases equal to the number of samples obtained, which in this research equaled
143.
(a) Collinearity Assessment
Collinearity (sometimes referred to as multicollinearity) occurs when two constructs measure the
same construct (Kock and Lynn, 2012). When collinearity is present, the result of a model will be
difficult to interpret (Tabachnik and Fidell, 2007) because it may produce an “incorrect sign”
although the R2 is large (O’Brien, 2007). Tabachnik and Fidell (2007) suggest tolerance values of
less than 0.10 and variance inflation factor (VIF) values of more than 10.0 to be collinear, while
Hair et al. (2014) places stricter limits with tolerance values of less than 0.20 and VIF values of
more than 5.0 deemed collinear. As presented in Table 5.6, all the constructs in the proposed model
had tolerance values above 0.20 and VIF values below 5.0, thereby indicating that none of the
constructs had a collinearity issue. No further action needed to be taken.
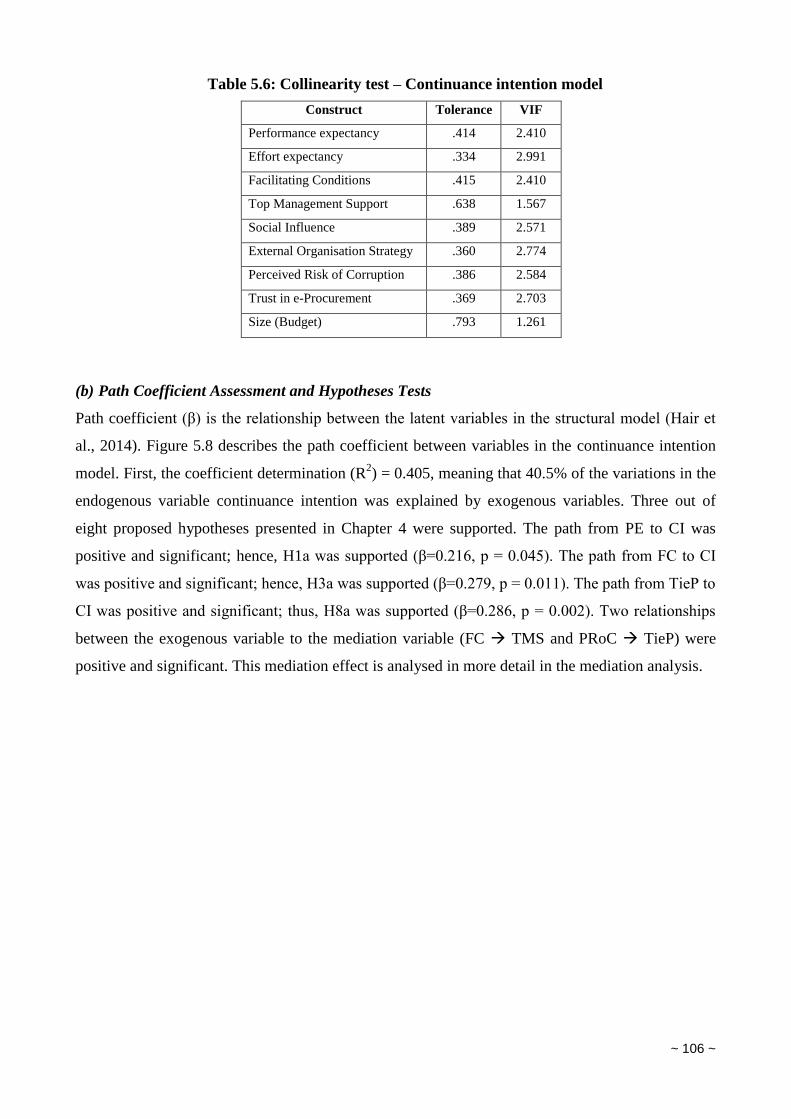
~ 106 ~
Table 5.6: Collinearity test – Continuance intention model
Construct Tolerance VIF
Performance expectancy .414 2.410
Effort expectancy .334 2.991
Facilitating Conditions .415 2.410
Top Management Support .638 1.567
Social Influence .389 2.571
External Organisation Strategy .360 2.774
Perceived Risk of Corruption .386 2.584
Trust in e-Procurement .369 2.703
Size (Budget) .793 1.261
(b) Path Coefficient Assessment and Hypotheses Tests
Path coefficient (β) is the relationship between the latent variables in the structural model (Hair et
al., 2014). Figure 5.8 describes the path coefficient between variables in the continuance intention
model. First, the coefficient determination (R2) = 0.405, meaning that 40.5% of the variations in the
endogenous variable continuance intention was explained by exogenous variables. Three out of
eight proposed hypotheses presented in Chapter 4 were supported. The path from PE to CI was
positive and significant; hence, H1a was supported (β=0.216, p = 0.045). The path from FC to CI
was positive and significant; hence, H3a was supported (β=0.279, p = 0.011). The path from TieP to
CI was positive and significant; thus, H8a was supported (β=0.286, p = 0.002). Two relationships
between the exogenous variable to the mediation variable (FC TMS and PRoC TieP) were
positive and significant. This mediation effect is analysed in more detail in the mediation analysis.
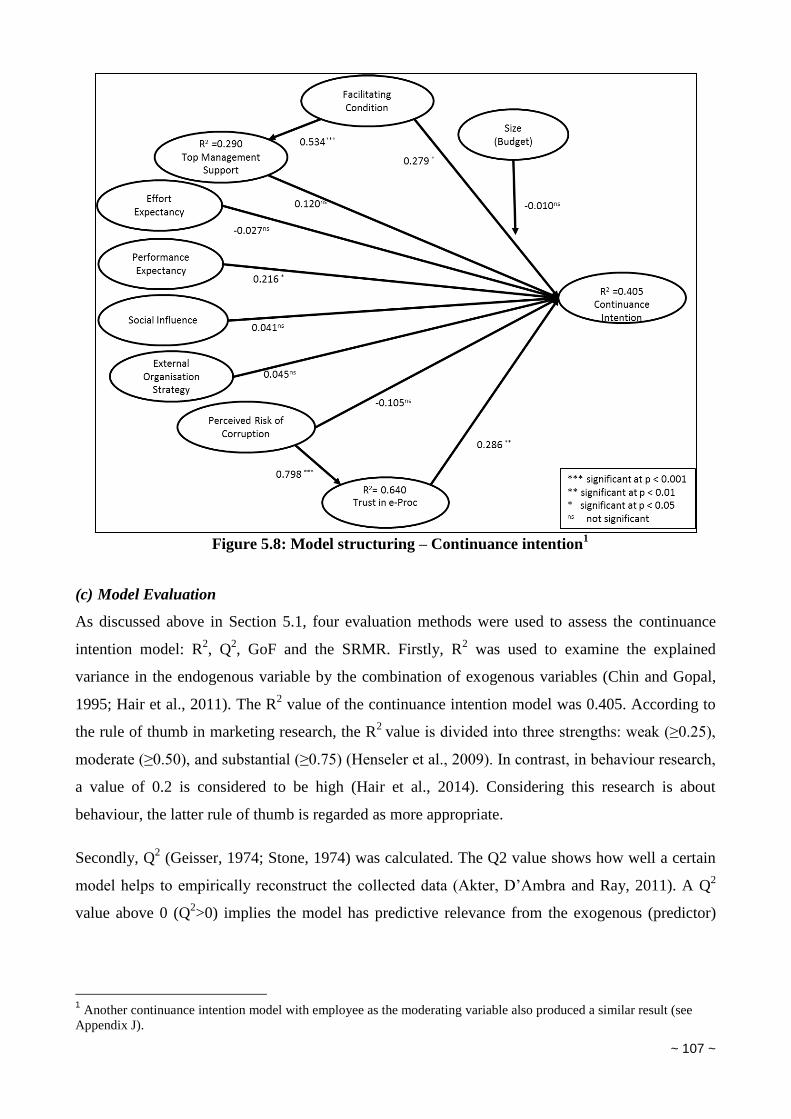
~ 107 ~
Figure 5.8: Model structuring – Continuance intention
1
(c) Model Evaluation
As discussed above in Section 5.1, four evaluation methods were used to assess the continuance
intention model: R2, Q
2, GoF and the SRMR. Firstly, R
2 was used to examine the explained
variance in the endogenous variable by the combination of exogenous variables (Chin and Gopal,
1995; Hair et al., 2011). The R2 value of the continuance intention model was 0.405. According to
the rule of thumb in marketing research, the R2
value is divided into three strengths: weak (≥0.25),
moderate (≥0.50), and substantial (≥0.75) (Henseler et al., 2009). In contrast, in behaviour research,
a value of 0.2 is considered to be high (Hair et al., 2014). Considering this research is about
behaviour, the latter rule of thumb is regarded as more appropriate.
Secondly, Q2 (Geisser, 1974; Stone, 1974) was calculated. The Q2 value shows how well a certain
model helps to empirically reconstruct the collected data (Akter, D’Ambra and Ray, 2011). A Q2
value above 0 (Q2>0) implies the model has predictive relevance from the exogenous (predictor)
1 Another continuance intention model with employee as the moderating variable also produced a similar result (see
Appendix J).
~ 108 ~
variable to the endogenous (outcome) variable (Chin, 2010; Hair et al., 2014). The blindfolding2
procedure in SmartPLS 3 produced a Q2result of 0.218 for the continuance intention model. This
value (Q2> 0) indicates that the eight exogenous variables (PE, EE, FC, TMS, SI, EOS, PRoC and
TieP) had predictive relevance for the endogenous variable (CI).
Thirdly, the GoF was assessed. GoF was introduced by Tenenhaus, Amato and Vinzi (2004) as a
global criterion of goodness of fit for PLS-SEM (Chin, 2010). As the standard, Wetzels,
Odekerken-Schroder and van Oppen (2009) set three threshold values for the GoF value
(GoFsmall=0.1, GoFmedium= 0.25 and GoFlarge=0.36). Using the equation ( ), a GoF
value of 0.53 was obtained, which exceeds the threshold value for GoFlarge, meaning that the
model’s goodness of fit is large.
Finally, the SRMR was calculated. Hu and Bentler (1999) suggested an SRMR threshold point of
about 0.08, but other researchers interpret Hu and Bentler’s cut-off point as ≤0.08 (Henseler et al.,
2014; Kline, 2011; Ronko and Evermann, 2013). Based on the calculation by SmartPLS 3, the
SRMR value for the continuance intention model was 0.075, indicating that the model has good fit.
All the above evaluation results imply that the continuance intention model performs well (Wetzels
et al., 2009) and has better prediction power (Akter et al., 2011) compared to the baseline values.
Other evaluations conducted on the model quality also supported this findings, as the R2, Q
2 and
SRMR exceeded the respective baseline values (R2>0.2, Q
2>0, and SRMR< 0.08).
5.6.3. Mediation Analysis
Two mediation variables were included in the continuance intention model, namely, TMS and TieP.
According to Baron and Kenny (1986), three requirements must be met for a mediator variable: (i)
variations in the independent variable must account significantly for the variations in the mediator
(p12); (ii) variations in the mediator must account significantly for the variations in the dependent
variable (p23); and (iii) when the mediator variable is controlled, the path between the independent
and dependent variables significantly changes its value (p13).
The interview results presented in Chapter 4 indicated that top management plays a key role in
providing e-Procurement facilitating conditions (infrastructure, training and technical support). This
2 Blindfolding is a sample reuse technique that omits a part of the data for a particular block of indicators during
parameter estimations and the attempts to estimate the omitted part using the estimated parameters (Chin, 2010). It is
used for getting Q2 value and has been validated by prior research (Chin, 2010; Hair et al., 2014; Lowry and Gaskin,
2014).
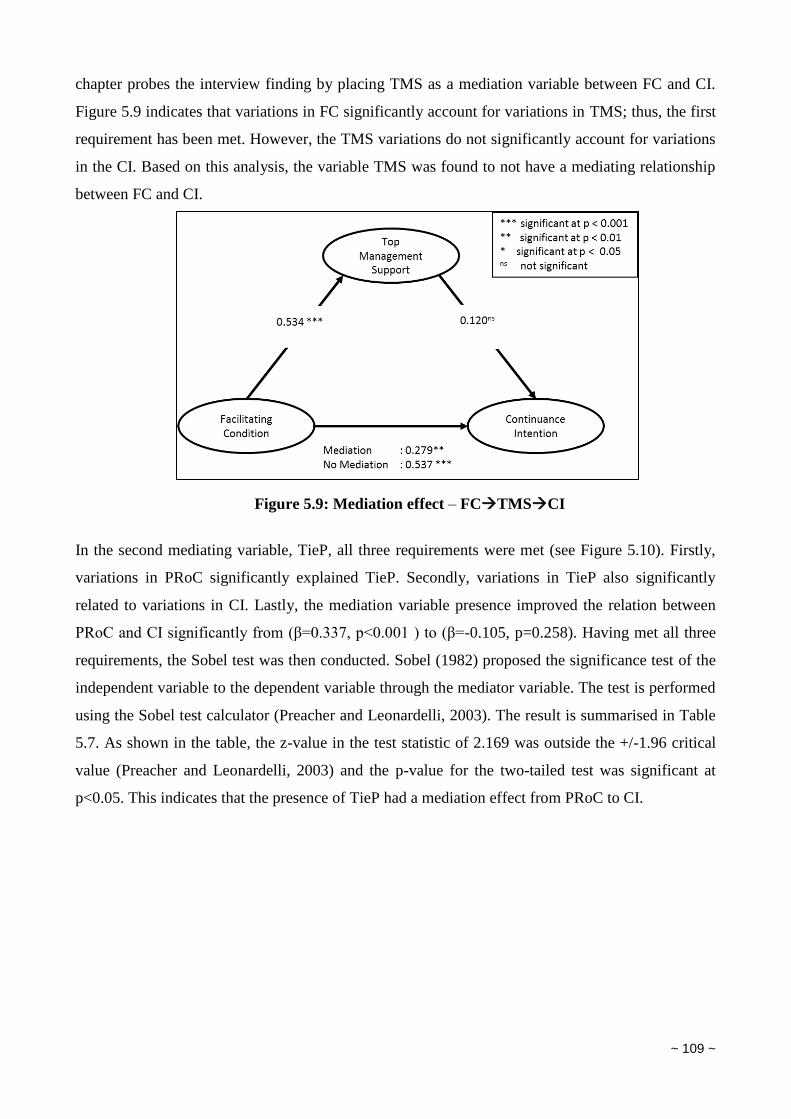
~ 109 ~
chapter probes the interview finding by placing TMS as a mediation variable between FC and CI.
Figure 5.9 indicates that variations in FC significantly account for variations in TMS; thus, the first
requirement has been met. However, the TMS variations do not significantly account for variations
in the CI. Based on this analysis, the variable TMS was found to not have a mediating relationship
between FC and CI.
Figure 5.9: Mediation effect – FCTMSCI
In the second mediating variable, TieP, all three requirements were met (see Figure 5.10). Firstly,
variations in PRoC significantly explained TieP. Secondly, variations in TieP also significantly
related to variations in CI. Lastly, the mediation variable presence improved the relation between
PRoC and CI significantly from (β=0.337, p<0.001 ) to (β=-0.105, p=0.258). Having met all three
requirements, the Sobel test was then conducted. Sobel (1982) proposed the significance test of the
independent variable to the dependent variable through the mediator variable. The test is performed
using the Sobel test calculator (Preacher and Leonardelli, 2003). The result is summarised in Table
5.7. As shown in the table, the z-value in the test statistic of 2.169 was outside the +/-1.96 critical
value (Preacher and Leonardelli, 2003) and the p-value for the two-tailed test was significant at
p<0.05. This indicates that the presence of TieP had a mediation effect from PRoC to CI.
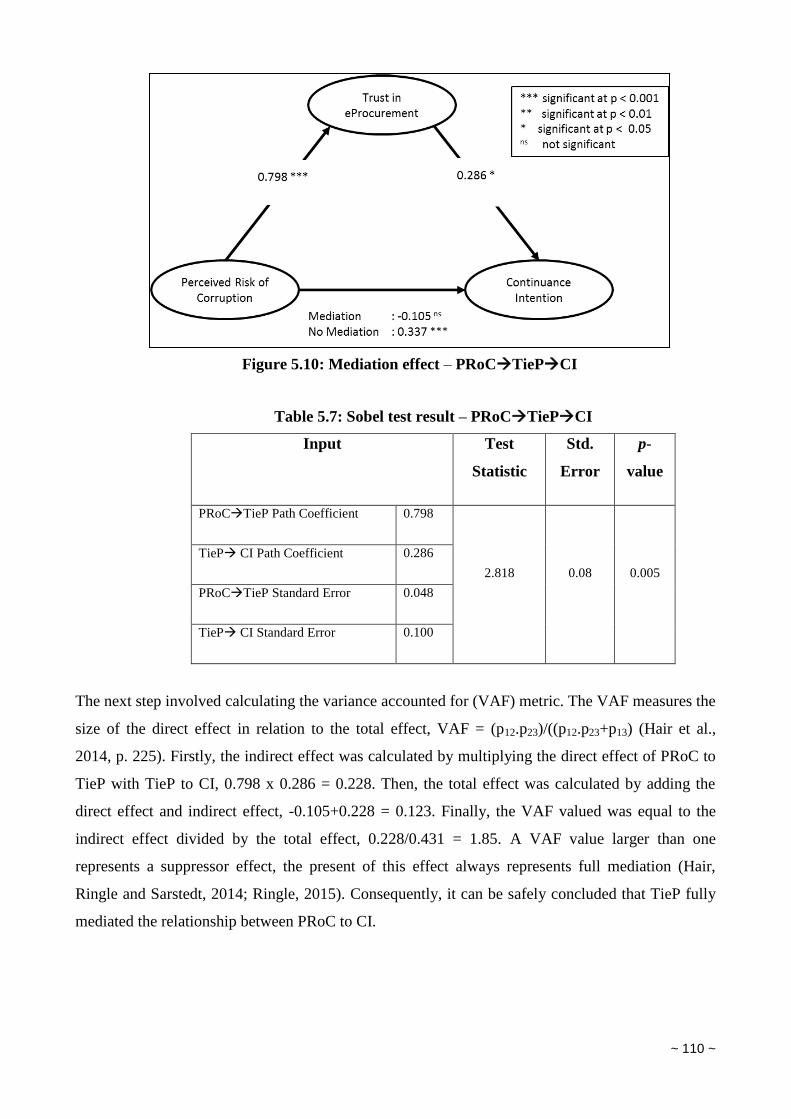
~ 110 ~
Figure 5.10: Mediation effect – PRoCTiePCI
Table 5.7: Sobel test result – PRoCTiePCI
Input Test
Statistic
Std.
Error
p-
value
PRoCTieP Path Coefficient 0.798
2.818 0.08 0.005
TieP CI Path Coefficient 0.286
PRoCTieP Standard Error 0.048
TieP CI Standard Error 0.100
The next step involved calculating the variance accounted for (VAF) metric. The VAF measures the
size of the direct effect in relation to the total effect, VAF = (p12.p23)/((p12.p23+p13) (Hair et al.,
2014, p. 225). Firstly, the indirect effect was calculated by multiplying the direct effect of PRoC to
TieP with TieP to CI, 0.798 x 0.286 = 0.228. Then, the total effect was calculated by adding the
direct effect and indirect effect, -0.105+0.228 = 0.123. Finally, the VAF valued was equal to the
indirect effect divided by the total effect, 0.228/0.431 = 1.85. A VAF value larger than one
represents a suppressor effect, the present of this effect always represents full mediation (Hair,
Ringle and Sarstedt, 2014; Ringle, 2015). Consequently, it can be safely concluded that TieP fully
mediated the relationship between PRoC to CI.
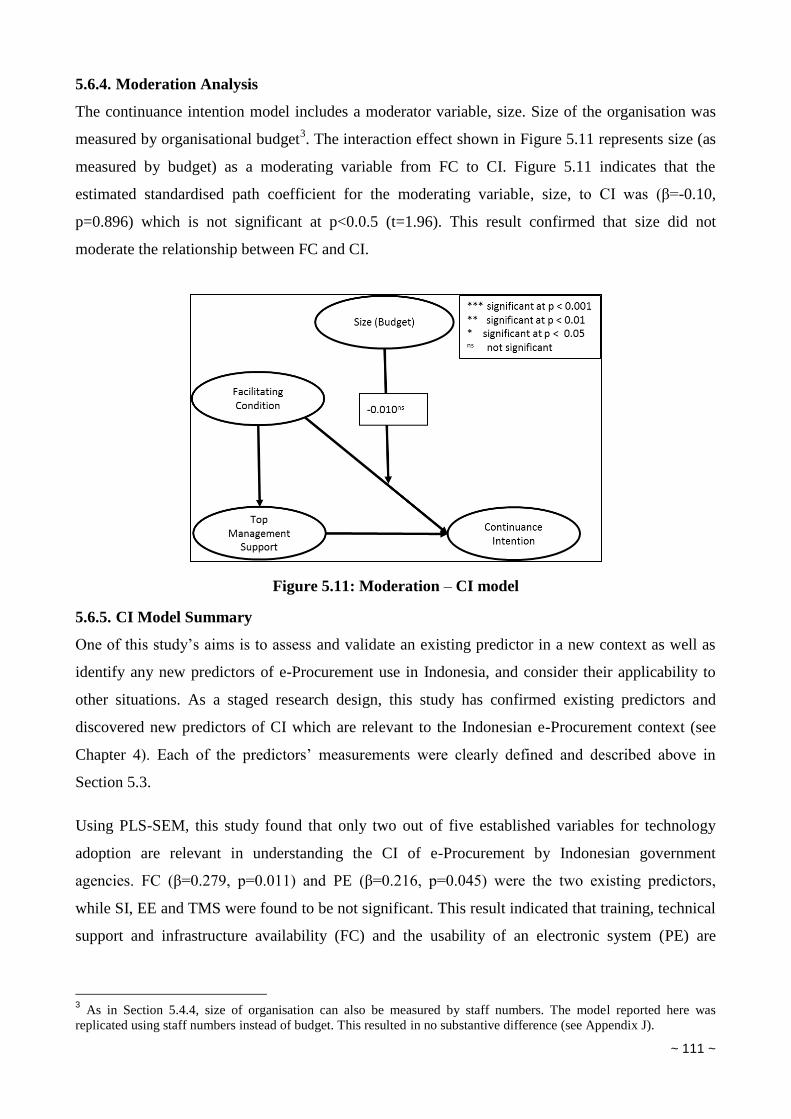
~ 111 ~
5.6.4. Moderation Analysis
The continuance intention model includes a moderator variable, size. Size of the organisation was
measured by organisational budget3. The interaction effect shown in Figure 5.11 represents size (as
measured by budget) as a moderating variable from FC to CI. Figure 5.11 indicates that the
estimated standardised path coefficient for the moderating variable, size, to CI was (β=-0.10,
p=0.896) which is not significant at p<0.0.5 (t=1.96). This result confirmed that size did not
moderate the relationship between FC and CI.
Figure 5.11: Moderation – CI model
5.6.5. CI Model Summary
One of this study’s aims is to assess and validate an existing predictor in a new context as well as
identify any new predictors of e-Procurement use in Indonesia, and consider their applicability to
other situations. As a staged research design, this study has confirmed existing predictors and
discovered new predictors of CI which are relevant to the Indonesian e-Procurement context (see
Chapter 4). Each of the predictors’ measurements were clearly defined and described above in
Section 5.3.
Using PLS-SEM, this study found that only two out of five established variables for technology
adoption are relevant in understanding the CI of e-Procurement by Indonesian government
agencies. FC (β=0.279, p=0.011) and PE (β=0.216, p=0.045) were the two existing predictors,
while SI, EE and TMS were found to be not significant. This result indicated that training, technical
support and infrastructure availability (FC) and the usability of an electronic system (PE) are
3 As in Section 5.4.4, size of organisation can also be measured by staff numbers. The model reported here was
replicated using staff numbers instead of budget. This resulted in no substantive difference (see Appendix J).
~ 112 ~
substantial factors in the decision to continue using e-Procurement in Indonesian government
agencies.
PRoC and EOS were new constructs identified in the interview phase of this research and were
included in the revised continuance intention model. As a result of the unidimensionality test (see
Appendix G), the PRoC construct was split into two: PRoC and TieP. Among these three newly
discovered constructs, only TieP (β=0.286, p=0.002) was found to be significant in predicting e-
Procurement CI in Indonesia. It means that the organisation’s trust of system’s ability in reducing
corruption has motivated government agencies in adopting e-Procurement.
The mediation analysis showed that PRoC impacted on TieP (β=0.724, p<0.0001), which in turn
influenced CI (β=0.309, p=0.002). In this relationship, PRoC was fully mediated by TieP. This
result implies that lowering the perceived risk of corruption through the use of the e-Procurement
system appears to increase the trust in the system, which in turn leads to a significant intention to
continue to use.
This study also explored the presence of organisational size (budget) as a moderating variable in the
relationship between FC to CI and the mediating variable TieP in the relationship between PRoC
and CI. The moderation role of organisational size was separately assessed using two different
proxies—organisational budget and organisational staff numbers (see Appendix J)—both of which
were found to have no moderating effect.
5.7. Level of Adoption Model
As discussed previously, two different models were developed and tested based on different
outcome variables. The previous section considered the model predicting the intention to continue
to use the e-Procurement system by Indonesian government agencies, while the second model was
based on the level of use of the e-Procurement system because of organisational discretion in the
extent to which the system is used. The level of adoption was measured by two items: the
proportion of organisational procurement that is undertaken electronically, and the year in which
the system was adopted.
5.7.1. Measurement Model
In the LA model, all the constructs’ composite reliability values ranged from 0.73 to 0.90, and were
thus regarded as satisfactory (Nunnally and Bernstein, 1994). PE1 (0.339), PE2 (0.223), FC3
(0.335), SI1 (0.234), SI3 (0.074) and SI4 (-0.103) loaded into different constructs in the cross-
loading test and had outer loading values below 0.4, and were therefore deleted in order to improve
the convergent validity and discriminant validity (Hair et al., 2014), indicated in Table 5.8 by
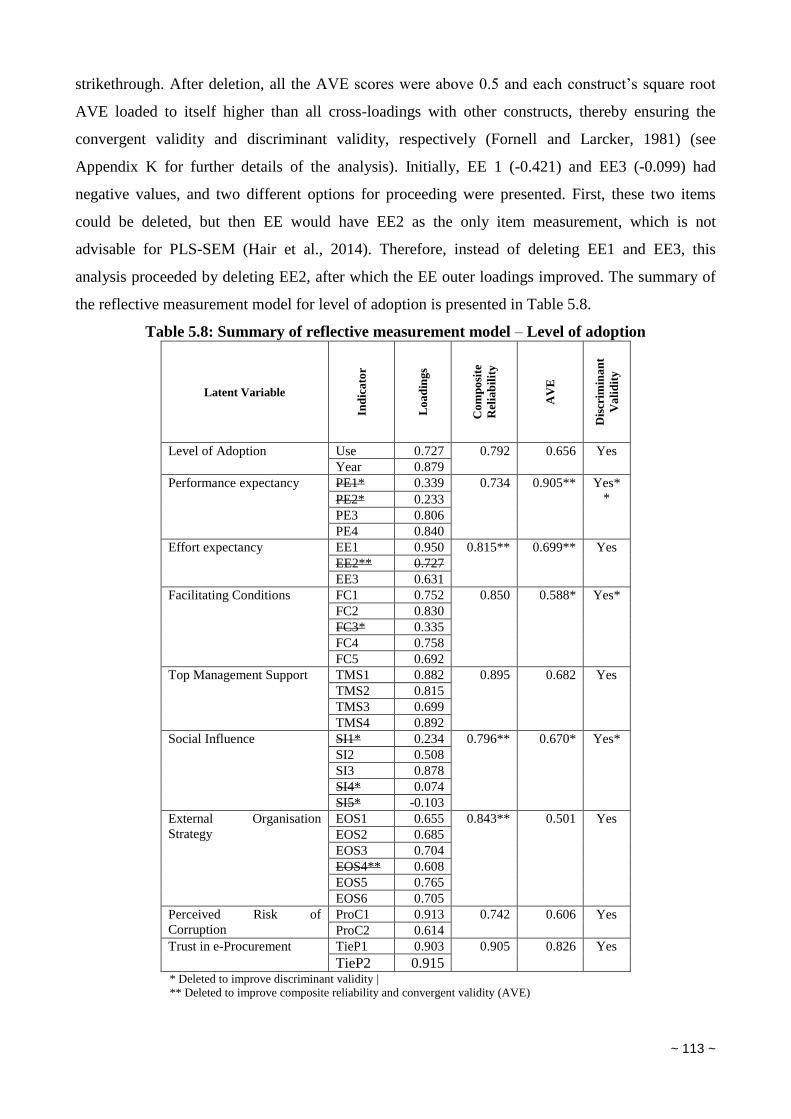
~ 113 ~
strikethrough. After deletion, all the AVE scores were above 0.5 and each construct’s square root
AVE loaded to itself higher than all cross-loadings with other constructs, thereby ensuring the
convergent validity and discriminant validity, respectively (Fornell and Larcker, 1981) (see
Appendix K for further details of the analysis). Initially, EE 1 (-0.421) and EE3 (-0.099) had
negative values, and two different options for proceeding were presented. First, these two items
could be deleted, but then EE would have EE2 as the only item measurement, which is not
advisable for PLS-SEM (Hair et al., 2014). Therefore, instead of deleting EE1 and EE3, this
analysis proceeded by deleting EE2, after which the EE outer loadings improved. The summary of
the reflective measurement model for level of adoption is presented in Table 5.8.
Table 5.8: Summary of reflective measurement model – Level of adoption
Latent Variable
Ind
ica
tor
Lo
ad
ing
s
Co
mp
osi
te
Rel
iab
ilit
y
AV
E
Dis
crim
ina
nt
Va
lid
ity
Level of Adoption Use 0.727 0.792 0.656 Yes
Year 0.879
Performance expectancy PE1* 0.339 0.734 0.905** Yes*
* PE2* 0.233
PE3 0.806
PE4 0.840
Effort expectancy EE1 0.950 0.815** 0.699** Yes
EE2** 0.727
EE3 0.631
Facilitating Conditions FC1 0.752 0.850 0.588* Yes*
FC2 0.830
FC3* 0.335
FC4 0.758
FC5 0.692
Top Management Support TMS1 0.882 0.895 0.682 Yes
TMS2 0.815
TMS3 0.699
TMS4 0.892
Social Influence SI1* 0.234 0.796** 0.670* Yes*
SI2 0.508
SI3 0.878
SI4* 0.074
SI5* -0.103
External Organisation
Strategy
EOS1 0.655 0.843** 0.501 Yes
EOS2 0.685
EOS3 0.704
EOS4** 0.608
EOS5 0.765
EOS6 0.705
Perceived Risk of
Corruption
ProC1 0.913 0.742 0.606 Yes
ProC2 0.614
Trust in e-Procurement TieP1 0.903 0.905 0.826 Yes
TieP2 0.915 * Deleted to improve discriminant validity |
** Deleted to improve composite reliability and convergent validity (AVE)
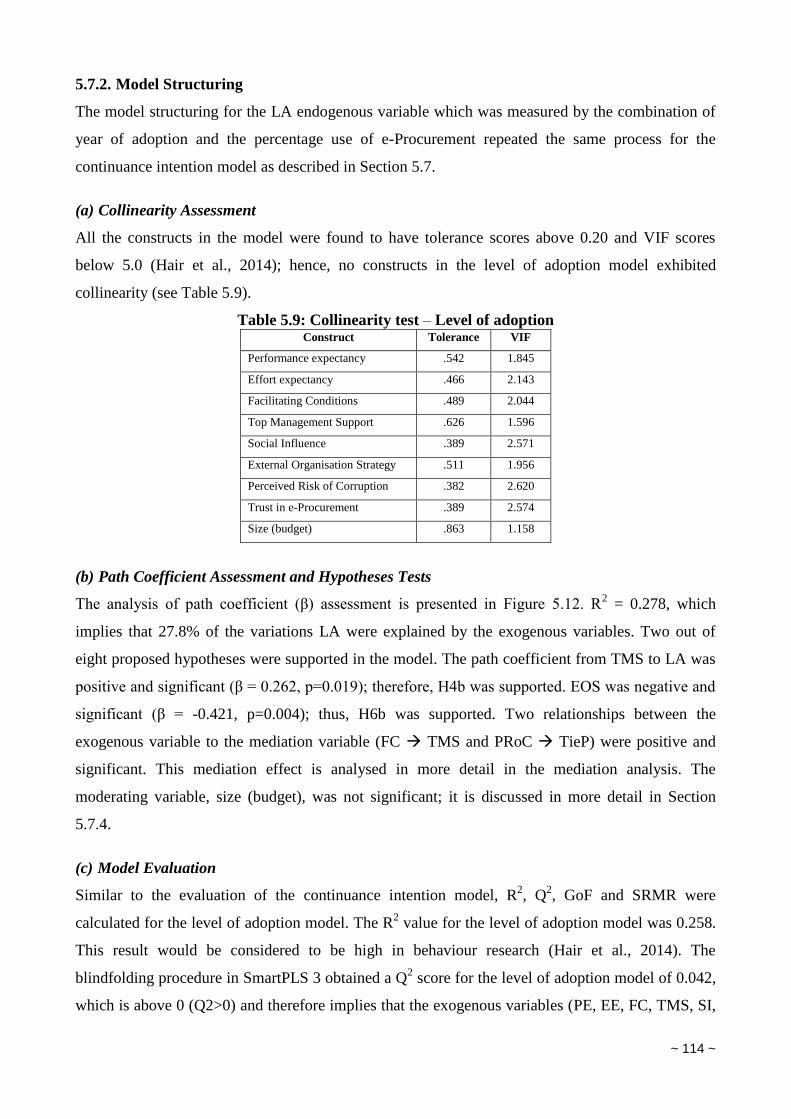
~ 114 ~
5.7.2. Model Structuring
The model structuring for the LA endogenous variable which was measured by the combination of
year of adoption and the percentage use of e-Procurement repeated the same process for the
continuance intention model as described in Section 5.7.
(a) Collinearity Assessment
All the constructs in the model were found to have tolerance scores above 0.20 and VIF scores
below 5.0 (Hair et al., 2014); hence, no constructs in the level of adoption model exhibited
collinearity (see Table 5.9).
Table 5.9: Collinearity test – Level of adoption Construct Tolerance VIF
Performance expectancy .542 1.845
Effort expectancy .466 2.143
Facilitating Conditions .489 2.044
Top Management Support .626 1.596
Social Influence .389 2.571
External Organisation Strategy .511 1.956
Perceived Risk of Corruption .382 2.620
Trust in e-Procurement .389 2.574
Size (budget) .863 1.158
(b) Path Coefficient Assessment and Hypotheses Tests
The analysis of path coefficient (β) assessment is presented in Figure 5.12. R2 = 0.278, which
implies that 27.8% of the variations LA were explained by the exogenous variables. Two out of
eight proposed hypotheses were supported in the model. The path coefficient from TMS to LA was
positive and significant (β = 0.262, p=0.019); therefore, H4b was supported. EOS was negative and
significant (β = -0.421, p=0.004); thus, H6b was supported. Two relationships between the
exogenous variable to the mediation variable (FC TMS and PRoC TieP) were positive and
significant. This mediation effect is analysed in more detail in the mediation analysis. The
moderating variable, size (budget), was not significant; it is discussed in more detail in Section
5.7.4.
(c) Model Evaluation
Similar to the evaluation of the continuance intention model, R2, Q
2, GoF and SRMR were
calculated for the level of adoption model. The R2 value for the level of adoption model was 0.258.
This result would be considered to be high in behaviour research (Hair et al., 2014). The
blindfolding procedure in SmartPLS 3 obtained a Q2 score for the level of adoption model of 0.042,
which is above 0 (Q2>0) and therefore implies that the exogenous variables (PE, EE, FC, TMS, SI,
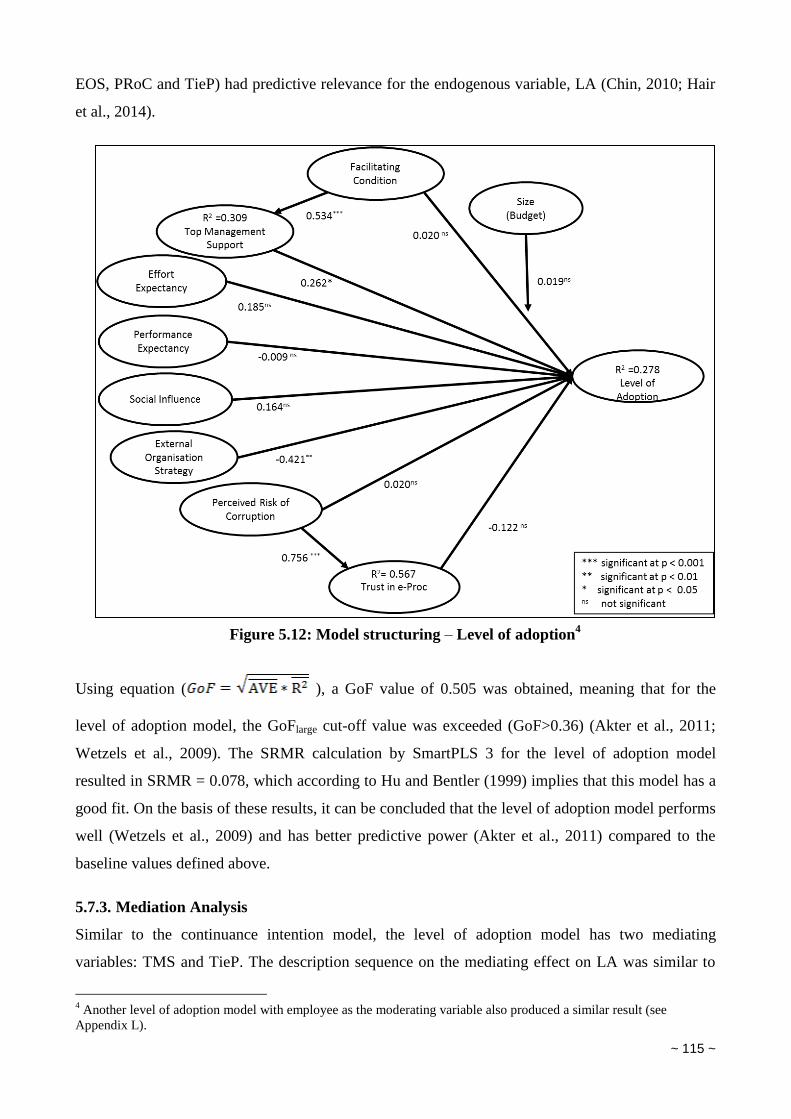
~ 115 ~
EOS, PRoC and TieP) had predictive relevance for the endogenous variable, LA (Chin, 2010; Hair
et al., 2014).
Figure 5.12: Model structuring – Level of adoption4
Using equation ( ), a GoF value of 0.505 was obtained, meaning that for the
level of adoption model, the GoFlarge cut-off value was exceeded (GoF>0.36) (Akter et al., 2011;
Wetzels et al., 2009). The SRMR calculation by SmartPLS 3 for the level of adoption model
resulted in SRMR = 0.078, which according to Hu and Bentler (1999) implies that this model has a
good fit. On the basis of these results, it can be concluded that the level of adoption model performs
well (Wetzels et al., 2009) and has better predictive power (Akter et al., 2011) compared to the
baseline values defined above.
5.7.3. Mediation Analysis
Similar to the continuance intention model, the level of adoption model has two mediating
variables: TMS and TieP. The description sequence on the mediating effect on LA was similar to
4 Another level of adoption model with employee as the moderating variable also produced a similar result (see
Appendix L).
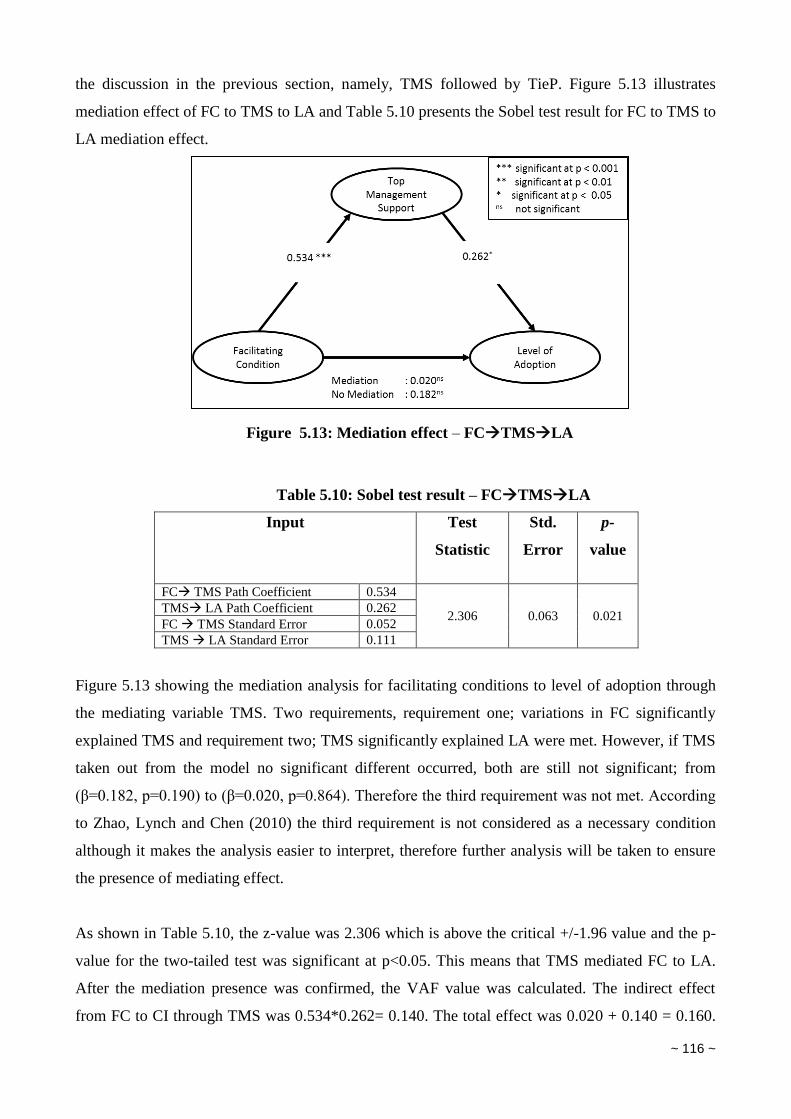
~ 116 ~
the discussion in the previous section, namely, TMS followed by TieP. Figure 5.13 illustrates
mediation effect of FC to TMS to LA and Table 5.10 presents the Sobel test result for FC to TMS to
LA mediation effect.
Figure 5.13: Mediation effect – FCTMSLA
Table 5.10: Sobel test result – FCTMSLA
Input Test
Statistic
Std.
Error
p-
value
FC TMS Path Coefficient 0.534
2.306 0.063 0.021 TMS LA Path Coefficient 0.262
FC TMS Standard Error 0.052
TMS LA Standard Error 0.111
Figure 5.13 showing the mediation analysis for facilitating conditions to level of adoption through
the mediating variable TMS. Two requirements, requirement one; variations in FC significantly
explained TMS and requirement two; TMS significantly explained LA were met. However, if TMS
taken out from the model no significant different occurred, both are still not significant; from
(β=0.182, p=0.190) to (β=0.020, p=0.864). Therefore the third requirement was not met. According
to Zhao, Lynch and Chen (2010) the third requirement is not considered as a necessary condition
although it makes the analysis easier to interpret, therefore further analysis will be taken to ensure
the presence of mediating effect.
As shown in Table 5.10, the z-value was 2.306 which is above the critical +/-1.96 value and the p-
value for the two-tailed test was significant at p<0.05. This means that TMS mediated FC to LA.
After the mediation presence was confirmed, the VAF value was calculated. The indirect effect
from FC to CI through TMS was 0.534*0.262= 0.140. The total effect was 0.020 + 0.140 = 0.160.
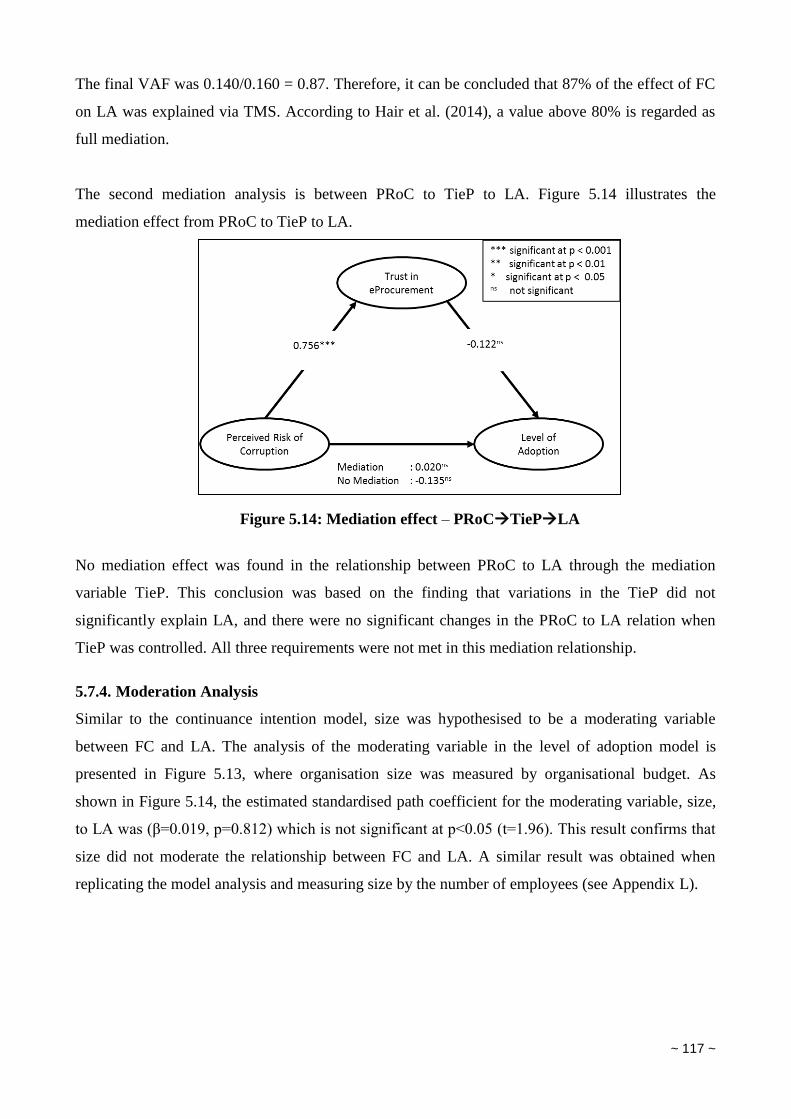
~ 117 ~
The final VAF was 0.140/0.160 = 0.87. Therefore, it can be concluded that 87% of the effect of FC
on LA was explained via TMS. According to Hair et al. (2014), a value above 80% is regarded as
full mediation.
The second mediation analysis is between PRoC to TieP to LA. Figure 5.14 illustrates the
mediation effect from PRoC to TieP to LA.
Figure 5.14: Mediation effect – PRoCTiePLA
No mediation effect was found in the relationship between PRoC to LA through the mediation
variable TieP. This conclusion was based on the finding that variations in the TieP did not
significantly explain LA, and there were no significant changes in the PRoC to LA relation when
TieP was controlled. All three requirements were not met in this mediation relationship.
5.7.4. Moderation Analysis
Similar to the continuance intention model, size was hypothesised to be a moderating variable
between FC and LA. The analysis of the moderating variable in the level of adoption model is
presented in Figure 5.13, where organisation size was measured by organisational budget. As
shown in Figure 5.14, the estimated standardised path coefficient for the moderating variable, size,
to LA was (β=0.019, p=0.812) which is not significant at p<0.05 (t=1.96). This result confirms that
size did not moderate the relationship between FC and LA. A similar result was obtained when
replicating the model analysis and measuring size by the number of employees (see Appendix L).
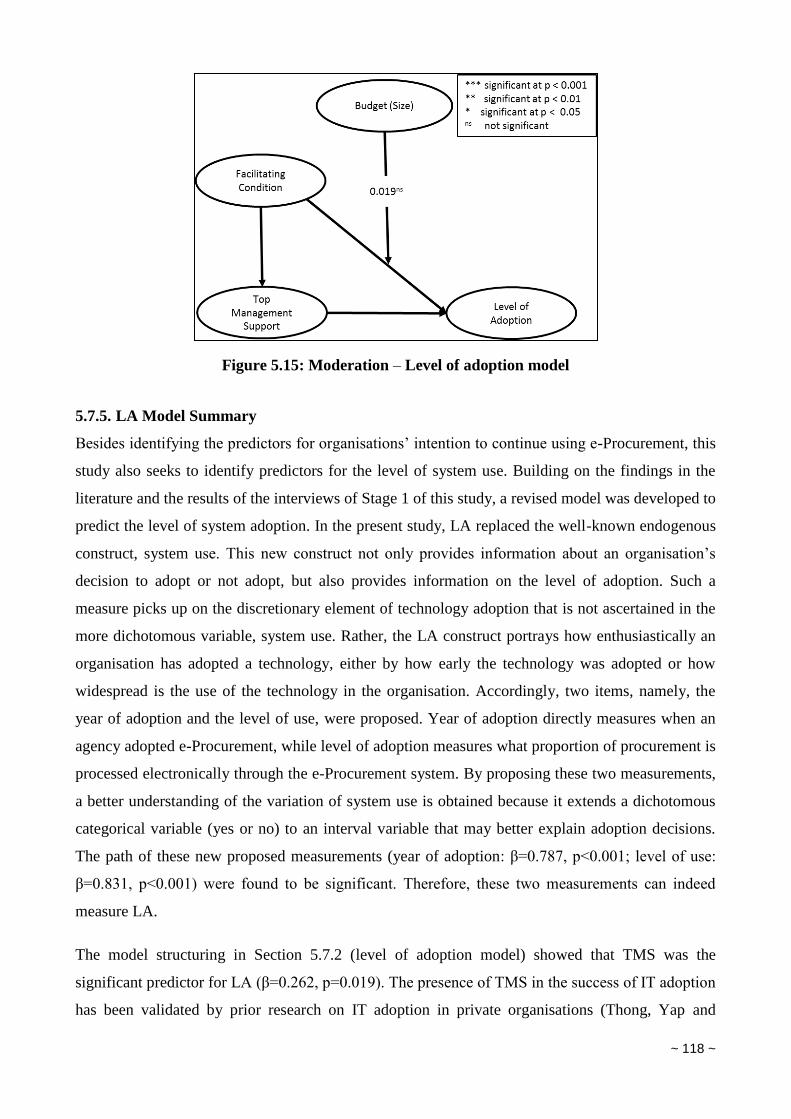
~ 118 ~
Figure 5.15: Moderation – Level of adoption model
5.7.5. LA Model Summary
Besides identifying the predictors for organisations’ intention to continue using e-Procurement, this
study also seeks to identify predictors for the level of system use. Building on the findings in the
literature and the results of the interviews of Stage 1 of this study, a revised model was developed to
predict the level of system adoption. In the present study, LA replaced the well-known endogenous
construct, system use. This new construct not only provides information about an organisation’s
decision to adopt or not adopt, but also provides information on the level of adoption. Such a
measure picks up on the discretionary element of technology adoption that is not ascertained in the
more dichotomous variable, system use. Rather, the LA construct portrays how enthusiastically an
organisation has adopted a technology, either by how early the technology was adopted or how
widespread is the use of the technology in the organisation. Accordingly, two items, namely, the
year of adoption and the level of use, were proposed. Year of adoption directly measures when an
agency adopted e-Procurement, while level of adoption measures what proportion of procurement is
processed electronically through the e-Procurement system. By proposing these two measurements,
a better understanding of the variation of system use is obtained because it extends a dichotomous
categorical variable (yes or no) to an interval variable that may better explain adoption decisions.
The path of these new proposed measurements (year of adoption: β=0.787, p<0.001; level of use:
β=0.831, p<0.001) were found to be significant. Therefore, these two measurements can indeed
measure LA.
The model structuring in Section 5.7.2 (level of adoption model) showed that TMS was the
significant predictor for LA (β=0.262, p=0.019). The presence of TMS in the success of IT adoption
has been validated by prior research on IT adoption in private organisations (Thong, Yap and
~ 119 ~
Raman, 1996). EOS was the second new construct resulting from the qualitative phase of this study
(see Chapter 4). In the level of adoption model, this new construct was the second construct found
to be significant (β=-0.421, p=0 .004) in influencing the level of adoption.
Based on the data analysis using PLS-SEM, two out of eight proposed exogenous constructs, one
existing variable, TMS (β = 0.262, p=0.019) and one new variable, EOS (β = -0.421, p=0.004),
were found to significantly affect LA, while FC, SI, EE, PE and TieP were found to be not
significant. This indicates that the support from the agency’s top manager is significant to the
organisation’s enthusiasm of adoption that is represented by LA.
The negative path coefficient (β=-0.421, p=0.004) from EOS to LA is particularly interesting to
consider. This result means that the longer an agency has used the system (as measured by the year
of adoption) and the more procurement processed electronically (as measured by the level of
usage), the less an external organisation’s intervention is needed to generate adoption in a certain
government agency. This finding is logical, as the high level of adoption reflects a high
voluntariness of adoption, and thus requires less external encouragement or support.
The moderator and mediator variables were tested in the level of adoption model. The moderating
variable, organisational size (as measured by either budget or employee number), was not found to
influence LA. TieP was also found to not mediate the effect of PRoC on LA, whereas TMS was
found to mediate the relationship between FC and LA. FC was found to influence TMS (β=0.556,
p<0.001) which in turn influences LA (β=-0.262, p=0.019) with 87% of the relationship between
FC to LA mediated by TMS. The finding on TMS as mediating variable adds a new understanding
of IT adoption in developing countries where a perceived higher degree to which an organisation
believes that the organisational and technical infrastructure exists to support the system operation,
leads to a higher level of top management support for the e-Procurement system, which in turn
leads to a higher level of (mandatory) system adoption.
5.8. Discussion Overview
The summary on the continuance intention model and level of adoption model showed the
difference in the critical success factors between continued use and level of adoption. In the post-
adoption setting, FC, PE and TieP were the critical success factors. This result supported H3a, H6a
and H11a. On the other hand, TMS was the only critical success factor in the level of adoption
setting, and thus supported H4b. TMS mediated the relationship between FC to LA but not to CI;
hence, it only supported H5b. Another mediating variable, TieP mediated PRoC to CI only; in other
words, it supported H11a. The exogenous variables, EE, SI, PRoC and the moderating variable,
~ 120 ~
size, were found to be not significant in both the level of adoption and continuance intention
settings. The results of the hypothesis tests in this research are summarised in Table 5.11.
The results indicated that no single construct contributes to explaining both continued use and level
of adoption. Facilitating conditions, which comprises IT infrastructure availability, technical
support and training, was able to directly predict both continued use and level of adoption if
mediated by top management support. It means that the presence of IT infrastructure, technical
support and training are substantial for the success of e-Procurement use in a government agency.
This result contradicts prior study that suggest the minor role of facilitating condition of the
electronic system adoption in the developed country (Bhattacherjee, 2000) but support prior
research in the developing country environment that found the significance of facilitating condition
in the e-Procurement adoption (Patrick, 2007).
In addition, the well-known predictors, namely, the easiness in operating the e-Procurement system
(EE) and other organisation’s decision to use e-Procurement (SI), are not found to substantially
affect the agencies’ decision on e-Procurement use and e-Procurement continuance. Both findings
oppose prior studies in similar settings. The result on EE contradicts Aboelmaged’s (2010) study
that explained the significant role of ease of use in e-Procurement use in a developing country. The
result on SI departs from Teo, Wei and Benbasat’s (2003) study that concludes the importance of
other organisational pressure on the electronic system adoption.
The size of an organisation, whether measured by its budget or staffing, is not found to mediate e-
Procurement use. This indicates that budget is not a driver in Indonesian government agencies’ e-
Procurement use. This result reinforce prior research (Teo, Wei and Benbasat, 2003) where size is
not significantly IT use at the organisation level. A further discussion of the findings and their
relationship to the literature is presented in Chapter 6.
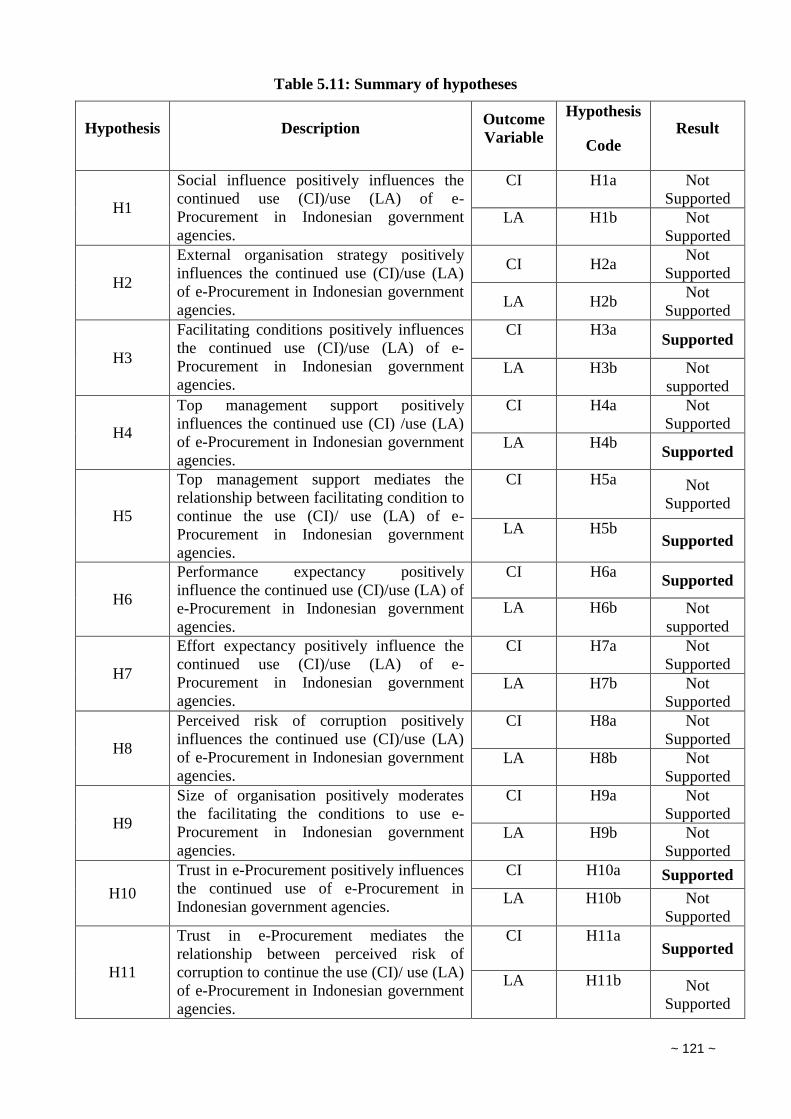
~ 121 ~
Table 5.11: Summary of hypotheses
Hypothesis Description Outcome
Variable
Hypothesis
Code Result
H1
Social influence positively influences the
continued use (CI)/use (LA) of e-
Procurement in Indonesian government
agencies.
CI H1a Not
Supported
LA H1b Not
Supported
H2
External organisation strategy positively
influences the continued use (CI)/use (LA)
of e-Procurement in Indonesian government
agencies.
CI H2a Not
Supported
LA H2b Not
Supported
H3
Facilitating conditions positively influences
the continued use (CI)/use (LA) of e-
Procurement in Indonesian government
agencies.
CI H3a Supported
LA H3b Not
supported
H4
Top management support positively
influences the continued use (CI) /use (LA)
of e-Procurement in Indonesian government
agencies.
CI H4a Not
Supported
LA H4b Supported
H5
Top management support mediates the
relationship between facilitating condition to
continue the use (CI)/ use (LA) of e-
Procurement in Indonesian government
agencies.
CI H5a Not
Supported
LA H5b Supported
H6
Performance expectancy positively
influence the continued use (CI)/use (LA) of
e-Procurement in Indonesian government
agencies.
CI H6a Supported
LA H6b Not
supported
H7
Effort expectancy positively influence the
continued use (CI)/use (LA) of e-
Procurement in Indonesian government
agencies.
CI H7a Not
Supported
LA H7b Not
Supported
H8
Perceived risk of corruption positively
influences the continued use (CI)/use (LA)
of e-Procurement in Indonesian government
agencies.
CI H8a Not
Supported
LA H8b Not
Supported
H9
Size of organisation positively moderates
the facilitating the conditions to use e-
Procurement in Indonesian government
agencies.
CI H9a Not
Supported
LA H9b Not
Supported
H10
Trust in e-Procurement positively influences
the continued use of e-Procurement in
Indonesian government agencies.
CI H10a Supported
LA H10b Not
Supported
H11
Trust in e-Procurement mediates the
relationship between perceived risk of
corruption to continue the use (CI)/ use (LA)
of e-Procurement in Indonesian government
agencies.
CI H11a Supported
LA H11b Not
Supported
~ 122 ~
Chapter 6. Discussion and Conclusion
6.1. Introduction
The purpose of this research was to find predictors for the adoption of e-Government in developing
countries. The focus of this study is a government agency’s use of a pre-existing IS solution, not
individuals’ use of e-Government. To obtain this goal, this study took the Indonesian e-Procurement
system as a case study. The e-Procurement system is one of a few e-Government systems that have
been successfully adopted by various levels of government in Indonesia, and in 2013 its use was
mandated by government, some six years after its first introduction in 2007 as a voluntary system.
Despite the mandated status of the system, agencies are only required to conduct a minimum of
40% of procurement transactions through the system. Therefore, this study is unique in that it
explores the organisational adoption and use of a pre-existing IS within a mandatory policy setting.
Two outcome variables, namely, level of adoption (LA) and continuance intention (CI), were
examined in this research. Most research in the e-Government adoption literature directly uses well-
established predictors without first validating those predictors in the specific context; in contrast,
the present study conducted qualitative and quantitative research in two stages to answer the
research question: “What are the predictors that explain the use of pre-existing e-Government
solutions by government agencies in developing countries?”
The first stage of the research involved testing the appropriateness and conformity of existing
variables in e-Government adoption to the Indonesian e-Procurement context and identifying any
new variables relevant to that context. Interviews and thematic analysis were used to interpret the
data. The findings of the first stage were then assessed in the second stage, using PLS-SEM on the
survey data to test the significance of the proposed predictors.
This remainder of the chapter is organised in three sections. Section 6.2 presents an overview of the
research findings and explains how they answer the research question and purpose. This is then
followed by a discussion of the implications of the research findings in Section 6.3. Lastly, Section
6.4 ends this chapter and the thesis with a discussion of the study’s limitations and suggestions for
future research.
6.2. Overview of the Findings
This study started by reviewing the literature and highlighting the well-known predictors in the pre-
existing technology adoption models, namely, the UTAUT (Venkatesh, Morris, Davis and Davis,
2003), TAM (Davis, Bagozzi and Warshaw, 1989; Venkatesh and Davis, 2000; Venkatesh and
~ 123 ~
Bala, 2008) and ECM-IT (Bhattacherjee, 2001). In the research framework (see Chapter 2), four
constructs from the TAM and UTAUT model were identified as the key predictors of e-
Procurement use: social influence, facilitating conditions, performance expectancy and effort
expectancy. An outcome construct, namely, continuance intention, was taken from ECM-IT to
measure an organisation’s intention to continue to use e-Procurement. During the course of the
study, the framework was revised in various ways. Firstly, several of the pre-existing constructs
were not found to be particularly relevant to the study context, or had to be refined. Some of these
findings were made in Stage 1 and some were made in Stage 2. Secondly, new constructs related to
the study context were identified and validated. In the first stage, interviews were conducted to
gather data on the pre-existing predictors of e-Government adoption. This was followed by
statistical findings from the survey conducted in the second stage in which the constructs that had
been confirmed in the previous phase were tested for the prediction of two outcome variables,
namely, continuance intention and level of adoption.
The findings from Stage 1 confirmed that four variables in the technology adoption literature were
relevant to the context of e-Procurement in Indonesian government agencies: facilitating conditions
(FC), performance expectancy (PE), effort expectancy (EE) and social influence (SI). As well as
confirming the traditional predictors of system use in the Indonesian e-Procurement context, this
phase revealed the role of top management support (TMS) variable in e-Procurement success. The
following sections summarise the results on each construct.
6.2.1. Discussion of Results
Facilitating conditions was defined in this study as the adequacy of the organisational and
technical infrastructure to support the use of computer systems within the organisation (i.e.
technical support, training and infrastructure availability). The interviews in the first phase
indicated the important role of technical support and training in e-Procurement adoption in
Indonesia. While not explicitly acknowledged in the traditional UTAUT and TAM, this finding
supports prior research stating that technical support and training are important interventions for IS
adoption (Venkatesh and Bala 2008). In the second phase, these findings along with IT
infrastructure availability were added as measurement dimensions of FC. In short, FC was
measured by items on infrastructure, training and technical support availability. Statistical testing in
the second phase indicated that this revised construct of FC significantly affects system use in two
circumstances. First, in terms of an organisation’s intention to continue using e-Procurement, FC
directly affects the outcome variable of continuance intention. Second, in the context of an
organisation’s adoption, when mediated by top management support, FC significantly affects the
enthusiasm for use and therefore the level of adoption. FC is the only predictor found to
~ 124 ~
significantly affect system use in regard to both enthusiasm of use and intention to continue to use.
The result implies that the presence of technical support, training and infrastructure availability is
important for the success of e-Procurement use. The finding on the importance of FC comprising
technical support, training and infrastructure is consistent with the finding in prior studies on e-
Procurement success in the developing country context (Patrick, 2007).
Top management support is the degree to which an organisation’s top managers support an
electronic system use in a government agency. In this study, the interview respondents emphasised
the importance of TMS in e-Procurement adoption success. Consequently, TMS was developed as a
possible predictor of e-Procurement use in Indonesia. Based on the statistical analysis in the second
phase, TMS was found to influence enthusiasm for use (LA) but was not significant in terms of
affecting an organisation’s intention to continue using the system (CI). This finding on TMS
strengthens previous findings on the critical success factors of e-Government adoption (Altameem,
Zairi and Alshawi, 2006; Elbeltagi, McBride and Hardaker, 2005). TMS is needed to make the
change to adopt or increase use; however, when the system is in place it becomes part of
organisational practice and so the support of top management no longer appears to be part of the
key considerations in continued use. TMS was also found to mediate FC (technical support, training
and infrastructure availability) in generating enthusiasm for use (LA). The findings on TMS
uncover two interesting facts: first, the role of top managers is important in influencing an
organisation’s enthusiasm for use; second, the presence of training, technical support and
infrastructure motivates top managers to support IS use in Indonesian government agencies. In
other words, the presence of FC helps the top managers to support e-Government adoption; thus, if
FC is not there, then TMS is not expected to be there.
Performance expectancy is the degree to which an organisation believes that using an IS will help
organisational performance. PE is proven to be a significant predictor in the organisation’s intention
to continue to use (CI). This finding validates the finding in prior research (Bhattacherjee, 2001;
Liao, Palvia and Chen, 2009; Patrick, 2007; Yeh and Teng, 2012) that usefulness is significant in
terms of a system’s continued use in a developing country. Interestingly, system usefulness was not
found to be significant in relation to the organisation’s enthusiasm of use (LA). This finding is
contrary to the finding reported in the literature that performance expectancy is a significant
predictor of the initial adoption of e-Government. The result implies that system usefulness is
significant when a government agency decides to continue using an e-Government but not if an
agency wants to improve the level of use.
~ 125 ~
Effort expectancy was defined in this research as the degree of ease associated with the use of the
IS and the organisational perception of the easiness of an IS. This construct was found to not
significantly influence system use in relation to either the organisation’s intention to continue to use
(CI) or the organisation’s enthusiasm for use (LA). This result is similar to the results of previous
research conducted in Indonesia (Rokhman, 2005) and Malaysia (Patrick, 2007). It also supports
other research on IS use (Schaup and Carter, 2005). This finding indicates that the easiness or
complexity of an IS is not a factor that helps or hinders e-Procurement use in Indonesian
government agencies.
For the purpose of this research, social influence was defined as the degree to which other
organisations and the public influence a government agency’s use of an IS. Two dimensions were
used in measuring SI, namely, institutional isomorphism and image. The interviews in Stage 1
identified institutional isomorphism as an essential factor in e-Procurement use. This supports
similar findings where institutional isomorphism was identified as a predictor of e-Government
adoption (Kim, Kim and Lee, 2009). Based on this finding, the measurement items for the SI
construct were revised. Two out of three measurements from the UTAUT, namely, subjective
norms and social factors (Venkatesh et al., 2003), were replaced by institutional isomorphism, and
another measurement, namely, image, was retained. Institutional isomorphism consisting of
normative, coercive and mimetic pressure was used to measure other organisations’ influence on a
government agency’s decision to adopt or not adopt a new technology. Coercive pressure refers to
pressure from other organisations, mimetic pressure refers to the mimicking of another
organisation’s success, and normative pressure refers to the following of norms among the
organisations. Image refers to how an agency wants to be perceived by the public, that is, its public
persona. Even though the dimension was revised in line with the result in Stage 1, the structural
model in Stage 2 found that social influence does not significantly influence an organisation’s
intention to continue using an IS (CI) or its enthusiasm for use (LA).
This result supports Rokhman’s (2011) study in which image was not found to be a predictor of an
individual’s intention to use e-Government services in Indonesia, and also consistent with a prior
study in system adoption (Schaup and Carter, 2005); however, the finding contradicts other research
in the literature where image is reported to be significant (Carter and Belanger, 2004). In terms of
institutional pressure, the result supports prior research (Ke et al., 2008) in which institutional
pressure was not found to be significant in driving system use, but is inconsistent with the findings
by Teo, Wei and Benbasat (2003). This result implies that e-Procurement use in a government
organisation is not affected either by other organisations’ decision to use e-Procurement or by the
public’s judgment. This conclusion is based on the result whereby coercive, normative and mimetic
~ 126 ~
pressures (measuring how other organisations influence an organisation to use an IS) and image
(measuring the public’s judgment) were evidently not significant in the decision regarding system
use. The interesting aspect of this finding is that the system use decisions by government agencies
in Indonesia were not influenced by other organisations (such as procurement providers) or by other
government agencies’ success. Based on this finding, it can be concluded that the decision to use or
not to use the system was their own decision.
As well as confirming the relevance of existing constructs to Indonesian e-Procurement, two new
predictors were discovered through the interviews relating to IS adoption in Indonesia. There were
referred to as external organisation strategy (EOS) and perceived risk of corruption (PRoC).
External organisation strategy was defined as a strategy by an external organisation that has the
authority to coordinate system use at national level. This construct was developed based on the
results of the Stage 1 interviews (see Chapter 4). The interview respondents emphasised the
importance of the central government agency, the NPPA, in the success of e-Procurement system
use. This finding formed the basis of EOS as a new construct comprising two dimensions:
interpersonal communication strategy (ICS), and social engineering strategy (SES). ICS refers to
the personal approach taken by the NPPA that, according to the respondents, motivates
organisations to use e-Procurement. SES refers to the NPPA strategy to create a special e-
Procurement body that is attached to each government agency and coordinated by the NPPA. The
model structuring in Chapter 5 indicated that EOS was significant in predicting an organisation’s
enthusiasm for use (LA), and also not significant in predicting an organisation’s intention to
continue using the system (CI). However there is an interesting finding about external organization
strategy; the relationship between EOS and LA was significant and negative, meaning that the more
enthusiastic a government agency was in its use of e-Procurement, the less it needed an external
organisation to help its e-Procurement use.
The use of e-Procurement enables the prevention of corruption in public procurement. The study’s
findings provide an insight into how law enforcement on corruption is enables the adoption of e-
Procurement in Indonesia. Perceived risk of corruption emerged as a new construct from the
interviews conducted in Stage 1 of the study. The perception of the risk of corruption can be
divided into two dimensions. First, there is a perception that performing an act of corruption in
manual procurement may lead to an inspection by the anti-corruption commission. Second, the risk
of being investigated motivates procurers to trust the e-Procurement system as it is able to reduce
corruption in the public procurement process. The measurements of PRoC were derived from the
interview questions on procurement and corruption. In Stage 2, PRoC was divided into two
~ 127 ~
constructs due to unidimensionality. As a result, two constructs were created to better capture the
perception of the risk of corruption. The first construct was defined as the risk of corruption in
manual procurement processing. The second construct, called trust in e-Procurement (TieP),
explained the organisational perception of the ability of the e-Procurement process to reduce the
capacity for corruption and to help the organisation ultimately avoid being investigated by the anti-
corruption commission.
The development of the concepts of PRoC and TieP was informed by research on trust and risk in
e-Procurement use by Belanger and Carter (2008). The results of the present study indicated a
significant relationship between TieP and an organisation’s intention to continue to use the system
(CI) but did not indicate a significant relationship between TieP and an organisation’s enthusiasm
for using the system (LA). Moreover, TieP was found to mediate the relationship between PRoC
and LA. In other words, the perception of the risk of corruption in manual processing (in this study,
enforcement of the law on corruption in manual procurement) influences trust in an IS (in this
study, an e-Procurement system), which in turn positively increases an organisation’s enthusiasm
for use of the system. This result brings a new understanding of the relationship between manual
and electronic processing and of the unique role of an IS in reducing corruption.
The present study also analysed the role of organisational size as a moderating variable between
FC and system level of adoption (LA) and continuance (CI). Size here refers to organisational size
as measured by the dimensions of organisational budget and the number of staff. Based on the
model validation (see Chapter 5), organisational size was not found to significantly moderate FC
and an organisation’s intention to continue using the system (CI) nor FC and an organisation’s
enthusiasm for using the system (LA). This result supports the findings of a prior study on the
determinants of e-Government use in Indonesia (Pudjianto et al., 2011). Therefore, it can be
concluded that organisational size is not a determinant of e-Procurement use in Indonesian
government agencies.
The predictors discussed above can be classified into two groups: the internal drivers of use (FC,
PE, EE, TMS, PRoC), and the external drivers of use (SI and EOS). In the system level of adoption
perspective, internal drivers (FC, TMS) and external driver (EOS) are able to predict the
organisational adoption decision. In relation to continuance, the organisational decision is mostly
based on the internal drivers of FC, PE, PRoC and TieP. The revised model (see Chapter 4)
proposes six different variables as predictors of system use. The model validation (see Chapter 5)
subsequently indicated that two variables and one mediating variable are significant for system
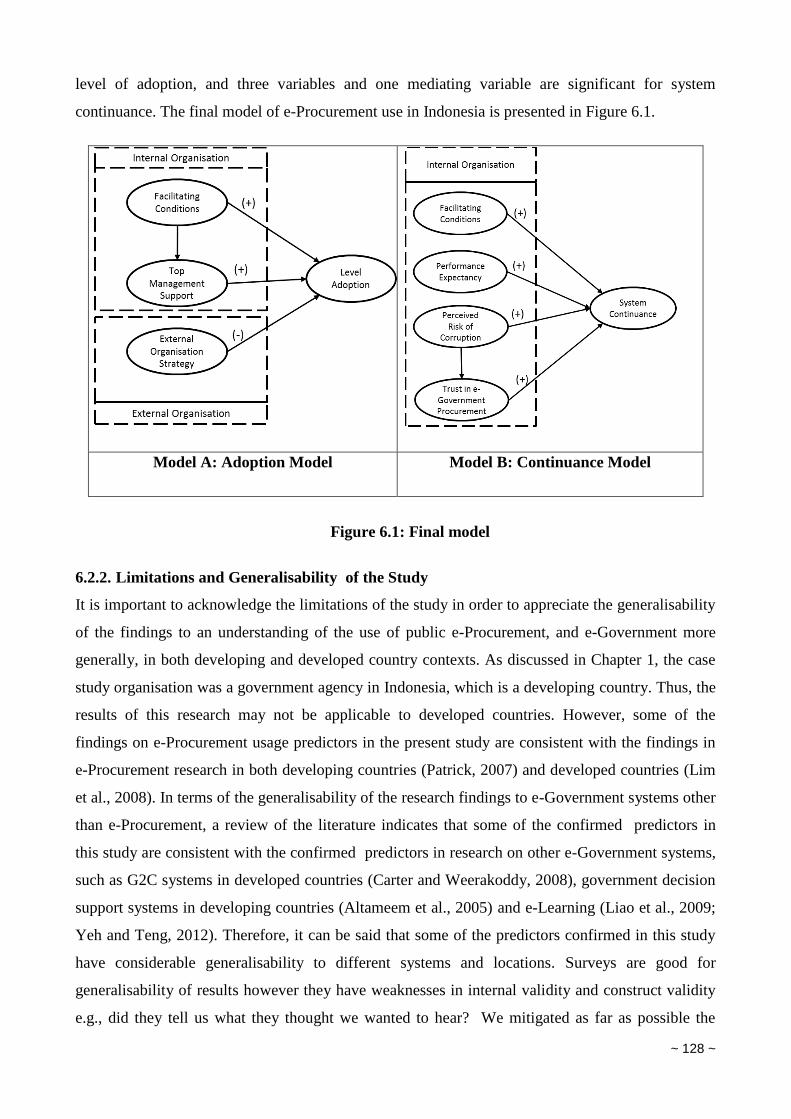
~ 128 ~
level of adoption, and three variables and one mediating variable are significant for system
continuance. The final model of e-Procurement use in Indonesia is presented in Figure 6.1.
Model A: Adoption Model Model B: Continuance Model
6.2.2. Limitations and Generalisability of the Study
It is important to acknowledge the limitations of the study in order to appreciate the generalisability
of the findings to an understanding of the use of public e-Procurement, and e-Government more
generally, in both developing and developed country contexts. As discussed in Chapter 1, the case
study organisation was a government agency in Indonesia, which is a developing country. Thus, the
results of this research may not be applicable to developed countries. However, some of the
findings on e-Procurement usage predictors in the present study are consistent with the findings in
e-Procurement research in both developing countries (Patrick, 2007) and developed countries (Lim
et al., 2008). In terms of the generalisability of the research findings to e-Government systems other
than e-Procurement, a review of the literature indicates that some of the confirmed predictors in
this study are consistent with the confirmed predictors in research on other e-Government systems,
such as G2C systems in developed countries (Carter and Weerakoddy, 2008), government decision
support systems in developing countries (Altameem et al., 2005) and e-Learning (Liao et al., 2009;
Yeh and Teng, 2012). Therefore, it can be said that some of the predictors confirmed in this study
have considerable generalisability to different systems and locations. Surveys are good for
generalisability of results however they have weaknesses in internal validity and construct validity
e.g., did they tell us what they thought we wanted to hear? We mitigated as far as possible the
Figure 6.1: Final model
~ 129 ~
impacts of this threat through the rigorous procedures of the survey design and administration.
Overall the strength are… this finding could be … and generalize in other environment it might be
useful
6.3. Implications of the Research
The theoretical, academic and practical contributions and implications of this research are described
in the following three sub-sections.
6.3.1. Theoretical Contributions
In relation to the theoretical contributions, this study provides several inputs to the literature on
technology adoption and the use of new technologies, especially in the field of e-Government. This
study’s contributions to conceptual models of technology adoption importantly include the
identification of a new relationship between perceived risk and trust in e-Government systems as a
new indicator of successful technology continuance and the proposal of an alternative construct for
measuring system use.
In relation to the first theoretical contribution, the prior research indicates that trust in an e-
Government system leads to the reduction of the perceived risk of a new IS, which increases the
likelihood of e-Government system adoption (Carter and Belanger, 2008; Colesca, 2009). The
literature on perceived risk and trust explores whether or not the use of an IS is riskier than the non-
use of the IS. For example, an individual who trusts an online transaction system will perceive that
buying goods through online website is not risky, which eventually affects their decision to
undertake online shopping. The present study found a different relationship between perceived risk
and trust. The relationship between perceived risk and trust was reversed. Here, the perceived risk
about the manual processing of public procurement transactions had led the government agency to
use e-Procurement for its perceived ability to reduce corruption in the public procurement process.
The risk and trust model proposed by Carter and Belanger (2008) is based on the assumption that
trust in an IS affects the perceived risk of using the IS, which eventually affects the system use. In
the present study, the relationship between the two constructs was reversed: perceived risk in not
using the IS influenced trust in using the system. This relationship between the two constructs was
consistent in both the CI and LA models. The findings also showed an interesting pattern between
manual and electronic processing. Here, the perceived risk in the manual process, that is, corruption
in the procurement process, triggered the organisation’s trust in the IS, which ultimately increased
the organisation’s intention to continue using e-Procurement. This finding potentially adds a new
understanding of the risk and trust model proposed by Carter and Belanger (2008).
~ 130 ~
The second theoretical contribution of this research involves the measurement of e-Government
system use. Some researchers have criticised the system use construct used in most technology
adoption research (Straub Jr and Burton-Jones, 2007) because rarely have technology adoption
studies sought to first validate the relevance of the system use constructs to the research context
(Burton-Jones and Straub Jr, 2006). Addressing these criticisms, this study proposed a new system
use construct based on the context, namely, level of adoption. This construct measured the
enthusiasm for using the e-Procurement system in Indonesian government agencies. Two
dimensions were built up around the construct. Starting in 2012, the use of e-Procurement for at
least 40 per cent of all goods or services procured was mandated for all government agencies in
Indonesia. The level of adoption construct captured the enthusiasm for use by identifying the year
of the agency’s initial use of the e-Procurement system and the percentage of goods and services
procured through the system. The use of this construct can enrich e-Government use studies that
typically require only a yes–no answer to measure system adoption or use, with the strength of
intention typically measured by responses on a Likert scale. As explained in the research context
(Chapter 1), this research was conducted to understand the use of a pre-existing IS in a government-
mandated setting. Although system use is typically conceptualised as dichotomous (that is, use or
non-use), the level of adoption is a new approach to assessing e-Government use by capturing the
level of enthusiasm and eagerness for the e-Government system.
The present study measured the level of adoption by two dimensions, namely, the year of adoption
and the percentage of use. Identifying the year of adoption picks up how quickly or slowly the
agency adopted the technology, with some agencies adopting the system before the presidential
decree mandating its use from 2012. Early adopters can be thought of as keen users of new
technology, compared to late adopters who are compelled to use that technology. The percentage of
use refers to the proportion of procurement that is conducted electronically in the organisation.
Again, those agencies operating above the minimal standard can be thought of as keen users of the
new technology. Thus, agencies which adopted e-Procurement before it became mandatory and
which had a use percentage exceeding the mandated 40% threshold were considered as voluntary or
eager adopters. The context of mandatory or voluntary use has been deemed significant in defining
system use at the organisational level (Doll and Torkzadeh, 1998). The findings presented in
Chapter 5 indicate that these two proposed measurements are valid measures of the level of
adoption. This study thus provides an alternative measurement to the system use construct, that is,
the level of adoption construct that can be measured by year of adoption and by the level of use.
The external organisation strategy construct emerged in the interviews as a new and relevant
concept in understanding e-Government use and was validated as a significant negative predictor of
~ 131 ~
the level of adoption (see Chapter 5). In the context of the present research, this construct arose
because the strategies of the central government agency (the NPPA) were consistently mentioned
by the interview respondents as an important factor in e-Procurement success (see Chapter 4). As a
central government agency, the NPPA has the authority to issue procurement policies including
policies on e-Procurement adoption and continuance. The role of this agency was proven to be a
significant factor in successful level of adoption. EOS was measured by two dimensions relevant to
the e-Procurement context: social engineering strategy, and interpersonal communication strategy.
SES refers to the creation of sections located within an organisation but supervised by a central
government agency. In the Indonesian e-Procurement context (with the NPPA as the relevant
central government agency), this proved to be significant in supporting system use. This finding is a
unique contribution to the theory of adoption due to the lack of literature on sub-organisation
structure as an influence on IS adoption and continuance.
The finding on interpersonal communication supports the findings of prior research on the role of
interpersonal communication at an individual level in advancing technology adoption (Agarwal and
Prasad, 1998; Brancheau and Wetherbe, 1990; Yi, Jackson, Park and Probst, 2006). It also supports
the diffusion of innovation theory whereby interpersonal channels are found to be relatively
important for successful IS use (Rogers, 1995). Overall, this finding indicates that a centrally
coordinated strategy has influenced e-Government use. The findings of this study also support the
research on procurement that notes the important role of central government agencies in
procurement innovation success (Moon, 2005). For example, the provision of legal foundations was
found to have facilitated and reinforced e-Procurement system adoption in Korea’s online e-
Procurement system (Kim, Kim and Lee, 2009). Similarly, Vaidya et al. (2006) noted the
importance of an external strategy. To the best of the author’s knowledge, no prior study has
indicated the role of external organisation strategy in e-Government adoption success.
The predictors influencing e-Procurement adoption in Indonesia include existing and new variables.
In the model validation in Stage 2, only three existing predictors from well-known acceptance
models in the literature were able to predict e-Procurement adoption in Indonesia (in relation to
both adoption and continuance). This finding supports the suggestion in the literature that it is
important to look for new predictors in different situations (Anandarajan, Igbaria and Anakwe,
2002; Chen, Chen, Huang and Ching, 2006).
6.3.2. Knowledge Contributions
This research contributes new empirical knowledge in three ways. First, it demonstrates that models
of system adoption and use at the individual level can be applied to organisational-level use.
~ 132 ~
Second, this study found some predictors that are consistent with other contexts with similar
environments. Finally, the research suggests a procedure for finding new predictors that are context-
specific.
In relation to the first contribution, this research demonstrates that constructs can be taken from
well-known individual-level theories of technology adoption (FC, PE and TMS) and appropriately
modified to successfully model organisational-level adoption. Revisions of the item question
wording and construct dimensions were necessary to effectively measure organisational-level
system use. This approach aligns with Baker’s (2012) recommendation to synthesise individual-
level and organisational-level factors to predict system use. For example, the social influence
concept in this study was not proved to be significant but might be useful in other research contexts.
In relation to the second contribution, this study found a significant relationship between predictors
and outcome variables in the modelling of system adoption which validates prior research in e-
Procurement adoption, namely, FC and PE (Rahim, 2008) and TMS (Rahim, 2008; Vaidya et al.,
2006). Interestingly, prior research on e-Procurement in Malaysia found that PE plays an important
role in e-Procurement adoption from the supplier side (Kaliannan, Awang, Raman and Dorasamy,
2009). Therefore, it can be concluded that in a developing country setting, the PE construct has
been proven to be a significant predictor of e-Procurement adoption from both the supplier and
government agency side. Therefore, further research on the organisational-level adoption of IS in
developing countries should include the PE construct as a potential predictor.
The study’s findings on new and pre-existing variables suggest that when undertaking research into
e-Government adoption in developing countries, instead of only using pre-existing variables (that
have been mainly established in developed countries), researchers should investigate the possibility
of variables that are specific to developing countries and the study context. The combination of
qualitative and quantitative methods in this research gave a more complete understanding on e-
Procurement adoption in Indonesia than one method. Prior research in the IS field has shown the
importance of combining qualitative and quantitative research in exploring relationships between an
IS and its (prospective) users (Dadayan and Ferro 2000; Kaplan and Duchon, 1988). This research
indicates that, in developing country settings, this two-staged approach provides a deeper
understanding of the predictors of IS use, by providing new variables that are unique to the
Indonesian context (namely, EOS) and proposing a new relationship between perceived risk in the
manual procurement process and trust in IS adoption. Therefore, future research into IS adoption
with a developing country as its locus of study may find the mixed-method approach to be the best
~ 133 ~
approach for exploring and identifying predictors that are specific to the developing country
context.
This study has validated new reflective indicators for measuring system use comprising two unique
indicators: the year of adoption and the percentage of system usage. In further research, this new
construct may be used to explore new item measurements for the level of adoption in order to better
understand the variations of the construct. As an addition to the body of knowledge, the level of
adoption construct could be tested in formative measurement mode. Similar action could be taken
for other new predictors, namely, EOS, perceived risk in the manual procurement process, and trust
in the e-Government system. It would also be interesting to replicate the finding about the
relationship between perceived risk in the manual procurement process and trust in the e-
Government system in another context.
6.3.3. Practical Contributions
The present study makes several practical contributions to government agencies and IS
practitioners. Based on the findings, some suggestions can be made regarding the key factors that
may facilitate e-Government success. As this research was conducted in Indonesian government
agencies, the findings might be relevant for other e-Government projects in Indonesia or other
countries which have similar characteristics, such as Southeast Asian countries or other developing
world countries, and also where public sector corruption is a concern.
The first suggestion is to apply a centrally coordinated strategy that is developed and managed by a
special body assigned to address the e-Government system use. Such a strategy should be built
around the development of sub-organisation units within each potential organisational user. The
sub-organisation would be designed as a communication hub between the central government
agency, the targeted adopters and other stakeholders. An interpersonal communication strategy with
potential adopters is also suggested by this research to be more appropriate than a formal
communication approach. Therefore, instead of merely relying on top-down formal communication
(e.g. by formal letter), potential adopters are more likely to be persuaded by direct, personal
communication.
Infrastructure, technical support and training were identified as critical success factors for e-
Government use success in relation to both initial use and continued use. Therefore, prior to
implementing an e-Government system, government policy-makers and IS consultants should
ensure that these three important factors exist. When these factors are present, top managers will be
more motivated to promote system use among their subordinates.
~ 134 ~
Lastly, instead of using incentives to motivate potential adopters, punitive measures are
recommended. This suggestion is based on the finding that the perceived risk of using the manual
procurement process pushed potential adopters to use e-Procurement. In this case, the punishment
took the form of enforcement of the law on corruption. Similar conditions might be created for
other e-Government systems to ensure continual use. Further, users should be reminded of the
benefits of the e-Government system, as this emphasis was also found to be a key point in continual
use success.
6.3.4. Future Research
The findings in this research unfold new topics for future research. First, the study has revealed the
unique relationships between some of the predictors, such as the relationship between risk, trust and
system use. It would be interesting to replicate this relationship in other research involving public
procurement and concerns about corruption. Hence, future research to test the consistency of the
relationship between risk, trust and system use would be worthwhile.
Second, system use in this study was defined by two measurements: level of adoption to measure
the enthusiasm for use, and continuance intention to measure an organisation’s intention to continue
to use an IS. It would be interesting to further examine the relationship between these two outcome
variables, such as investigating whether or not an organisation with high levels of adoption will go
on to demonstrate high levels of continued use. A similar relationship has been tested by the
technology use model, with intention to use as a strong predictor of actual use (Davis, 1989,
Venkatesh et al., 2003) and continuance intention as a strong predictor of continuance behavior
(Bhattacherjee et al., 2008) ; however, very limited research has examined the relationship between
system use and system continuance. Due to the lack of literature on the relationship between the
level of adoption and continued use, future research should be conducted to reveal the relationship
between these two outcome variables.
Third, the ECM-IT (Bhattacherjee, 2001) proposes user satisfaction and confirmation of expectation
as predictors of the intention to continue using an IS. This model is based on the assumption that
confirmed performance (i.e. ‘confirmation’) positively affects satisfaction and performance
expectancy, which eventually influences IS continuance intention. Recent research adds predictors
to the ECM-IT, such as perceived playfulness (Lin, Wu and Tsai, 2004) and perceived identity
verification (Chou, Min, Chang and Tung, 2010), and even combining ECM-IT with another model
of adoption such as TPB and TAM (Kim, 2010; Lee, 2010). Future studies may follow this trend by
validating the present study’s results with the ECM-IT. The predictors that are significant in the
~ 135 ~
continuance intention setting, such as PE, FC and trust–risk should be tested in the ECM-IT setting,
thereby adding further predictors of IS continuance to the literature.
Corruption is a common problem in developing countries. Prior research has found that the use of e-
Government systems might overcome the problem of corruption in developing countries (Kaliannan
and Awang, 2010, Kim et al., 2009, Ko and Liao, 2014, Neupane et al., 2012b, Neupane et al.,
2012a, Neupane et al., 2012c, Neupane et al., 2014); thus, the continued use of e-Government
systems in developing countries is important to reduce corruption and protect public revenue.
However, policy on e-Government usage in a developing country must be carefully planned as each
country has unique circumstances that might not be effectively portrayed in the existing e-
Government use strategies that have been mostly formulated in developed countries. The critical
success factors identified in the present study might be gainfully used in the planning of e-
Government strategies in a developing country. In addition, this research provides an alternative
understanding of how the enforcement of laws against corruption ultimately motivates potential
users to use an e-Government system. This finding brings a new dimension to the understanding of
the relationship between corruption and e-Government use.
~ 136 ~
References
ABOELMAGED, M. G. 2010. Predicting e-procurement adoption in a developing country: an
empirical integration of technology acceptance model and theory of planned
behaviour. Industrial Management & Data Systems, 110(3), 392-414
AFONSO, C., DE LA GONZALEZ, M., ROLDAN, J. & SANCHEZ-FRANCO, M. 2012.
Determinants of User Acceptance of a Local eGovernment Electronic Document
Management System (EDMS). Proceedings of the 12th European Conference on
Egovernment, Vols 1 and 2, 19-28.
AGARWAL, R. & PRASAD, J. 1997. The role of innovation characteristics and perceived
voluntariness in the acceptance of information technologies. Decision sciences, 28, 557-582.
AGARWAL, R. & PRASAD, J. 1998a. The antecedents and consequents of user perceptions in
information technology adoption. Decision support systems, 22, 15-29.
AGARWAL, R. & PRASAD, J. 1998b. A conceptual and operational definition of personal
innovativeness in the domain of information technology. Information systems research, 9,
204-215.
AJZEN, I. & FISHBEIN, M. 1980. Understanding attitudes and predicting social behaviour.
Englewood Cliffs, N.J: Prentice-Hall.
ALAWADHI, S. & MORRIS, A. The Use of the UTAUT Model in the Adoption of E-Government
Services in Kuwait. Hawaii International Conference on System Sciences, Proceedings of
the 41st Annual, 7-10 Jan. 2008 2008. 219-219.
ALBANO, G., BUCCIROSSI, P., ZANZA, M. & SPAGNOLO, G. 2006. Preventing collusion in
procurement auctions. Handbook of procurement.
ALOMARI, M. K., SANDHU, K. & WOODS, P. 2014. Exploring citizen perceptions of barriers to
e-government adoption in a developing country. Transforming Government: People,
Process and Policy, 8, 131-150.
ALRUWAIE, M., EL-HADDADEH, R., & WEERAKKODY, V. 2012. A Framework for
Evaluating Citizens’ Expectations and Satisfaction toward Continued Intention to Use E-
Government Services. In Electronic Government (pp. 273-286). Springer Berlin Heidelberg.
ALRYALAT, M., DWIVEDI, Y. K. & WILLIAMS, M. D. 2013. Examining Jordanian citizens'
intention to adopt electronic government. Electronic Government, 10, 324-342.
AL-SHAFI, S. & WEERAKKODY, V. 2009a. Citizen's acceptance of electronic services: A qatari
perspective. Handbook of Research on ICT-enabled Transformational Government: A
Global Perspective, pp 419-428. IGI Global. UK
AL-SHAFI, S. & WEERAKKODY, V. 2009b. Technology acceptance of free wireless internet
park initiatives. E-Government Development and Diffusion: Inhibitors and Facilitators of
Digital Democracy. International Journal of Value Chain Management, 4 (1-2) , pp. 68-85
AL-SHAFI, S. & WEERAKKODY, V. 2010. Factors affecting e-government adoption in the state
of Qatar. Proceedings of the European, Mediterranean and Middle Eastern Conference on
Information Systems: Global Information Systems Challenges in Management, EMCIS
2010.
~ 137 ~
AL-SHAFI, S. & WEERAKKODY, V. 2009c. Understanding citizens' behavioural intention in the
adoption of e-government services in the state of Qatar. 17th European Conference on
Information Systems, ECIS 2009.
AL-SHAFI, S., WEERAKKODY, V. & JANSSEN, M. 2009. Investigating the adoption of e-
government services in Qatar using the UTAUT model. AMCIS 2009 Proceedings. 260.
ALTAMEEM, T., ZAIRI, M., & ALSHAWI, S. 2006. Critical success factors of e-government: a
proposed model for e-government implementation. In Innovations in Information
Technology, 2006 November. pp. 1-5. IEEE.
AL-ZOUBI, M., SAM, T. L. & EAM, L. H. 2011. E-GOVERNMENT ADOPTION AMONG
BUSINESSES IN JORDAN. Academic Research International, 1, 141-156.
ANANDARAJAN, M., IGBARIA, M., & ANAKWE, U. P. 2002. IT acceptance in a less-
developed country: a motivational factor perspective. International Journal of Information
Management, 22(1), 47-65.
ANDERSEN, T. B. 2009. E-Government as an anti-corruption strategy. Information Economics
and Policy, 21, 201-210.
ARDUINI, D., BELOTTI, F., DENNI, M., GIUNGATO, G. & ZANFEI, A. 2010. Technology
adoption and innovation in public services the case of e-government in Italy. Information
Economics and Policy, 22, 257-275.
ARONSON, J. 1994. A pragmatic view of thematic analysis. Qualitative report, 2, 1.
ASRIL, S. 2012. Kongkalikong di Balik Penetapan Pemenang Hambalang. Available:
http://regional.kompas.com/read/2012/11/01/12361747/Kongkalikong.di.Balik.Penetapan.P
emenang.Lelang.Hambalang.
BABBIE, E. 2010. The practice of social research, Belmont, Wadsworth.
BAKER, J. 2012. The Technology-Organization-Environment Framework. In: DWIVEDI, Y. K.,
.WADE, M. R. & SCHNEBERGER, S. L. (eds.) Information System Theory Explaining and
Predicting Our Digital Society New York: Springer.
BARLOW, C., & BEEH, M. 1995. Southeast Asia: Transferring New Technology to Village
Communities: a Non-Government Organisation Experience in Indonesia (Vol. 95). Research
School of Pacific Studies Australian National Univ
BARNEY, D. 2004. The Network Society, Cambridge, Polity Press.
BELANCHE, D., CASALÓ, L. V. & FLAVIÁN, C. 2010. The importance of confirming citizens'
expectations in e-government. IFIP Advances in Information and Communication
Technology.
BÉLANGER, F. & CARTER, L. 2008. Trust and risk in e-government adoption. The Journal of
Strategic Information Systems, 17, 165-176.
BELDAD, A., DE JONG, M. & STEEHOUDER, M. 2010. Reading the least read? Indicators of
users' intention to consult privacy statements on municipal websites. Government
Information Quarterly, 27, 238-244.
BENBASAT, I. & BARKI, H. 2007. Quo vadis, TAM? Journal of the Association of Information
Systems, 8, 211-218.
BERNSTEIN, IRA H., AND J. C. NUNNALLY. 1994. Psychometric theory. New York:
McGraw—Hill.
~ 138 ~
BERTOT, J. C., JAEGER, P. T. & GRIMES, J. M. 2010. Using ICTs to create a culture of
transparency: E-government and social media as openness and anti-corruption tools for
societies. Government Information Quarterly, 27, 264 - 771.
BHATNAGAR, S. 2004. E-Government From Vision to Implementation, New Delhi, Sage
Publications.
BHATTACHERJEE, A. 2000. Acceptance of e-commerce services: the case of electronic
brokerages. Systems, Man and Cybernetics, Part A: Systems and Humans, IEEE
Transactions on, 30(4), 411-420.
BHATTACHERJEE, A. 2001. Understanding information systems continuance: An expectation-
confirmation model. MIS Quarterly: Management Information Systems, 25, 351-370.
BHATTACHERJEE, A., PEROLS, J. & SANFORD, C. 2008. Information technology continuance:
A theoretic extension and empirical test. Journal of Computer Information Systems, 49, 17-
26.
BIGDEIL, A. Z., KAMAL, M. & DE CESARE, S. 2013. Information sharing through inter-
organisational systems in local government. Transforming Government: People, Process
and Policy, 7, 148-176.
BILANDZIC, M., KNEBEL, U. & WECKENMANN, D. Technology Acceptance Research –
current development and concerns. In: KRCMAR, H., ed. 2nd Workshop on Information
Systems and Services Sciences 2008 Garching, Germany. Technische Universität München.
BOEDIONO. 2011. Sambutan Wakil Presiden RI pada Pembukaan Seminar Nasional Ikatan
Alumni Lemhanas (IKAL) 2011 [Online]. Available:
http://wapresri.go.id/index/preview/pidato/69 [Accessed 21 July 2012].
BPS. 2010. Penduduk Indonesia menurut Provinsi 1971, 1980, 1990, 1995, 2000 dan 2010
[Online]. Available: Penduduk Indonesia menurut Provinsi 1971, 1980, 1990, 1995, 2000
dan 2010 [Accessed 21 Oct 2011].
BRANCHEAU, J. C., & WETHERBE, J. C. 1990. The adoption of spreadsheet software: testing
innovation diffusion theory in the context of end-user computing. Information Systems
Research, 1(2), 115-143.
BROADBENT, M. & WEILL, P. 1997. Management by maxim: how business and IT managers
can create IT infrastructures. Sloan management review, 38, 77-92.
BROWN, S. A., MASSEY, A. P., MONTOYA-WEISS, M. M., & BURKMAN, J. R. 2002. Do I
really have to? User acceptance of mandated technology. European journal of information
systems, 11(4), 283-295.
BRUDNEY, J. L. & SELDEN, S. C. 1995. The adoption of innovation by smaller local
governments: The case of computer technology. The American Review of Public
Administration, 25, 71-86.
BRYMAN, A. 2008. Social Research Methods 3rd Edition, New York, Oxford University Press.
BURNS, R. B. 2000. Introduction to research methods. Frenchs Forest, N.S.W: Pearson Education.
BURTON-JONES, A., & STRAUB JR, D. W. 2006). Reconceptualizing system usage: An
approach and empirical test. Information systems research, 17(3), 228-246.
BYRNE, B. M. 2013. Structural equation modeling with AMOS: Basic concepts, applications, and
programming. Routledge.
CARTER, L. & BELANGER, F. 2004. The influence of perceived characteristics of innovating on
e-government adoption. Electronic Journal of E-government, 2, 11-20.
~ 139 ~
CARTER, L. & WEERAKKODY, V. 2008. E-government adoption: A cultural comparison.
Information Systems Frontiers, 10, 473-482
CARTER, L., & BELANGER, F. 2004. The influence of perceived characteristics of innovating on
e-government adoption. Electronic Journal of E-government, 2(1), 11-20.
CARTER, L., SCHAUPP, L. C., HOBBS, J. & CAMPBELL, R. 2012. E-government utilization:
Understanding the impact of reputation and risk. International Journal of Electronic
Government Research, 8, 83-97.
CASTELLS, M. 2010. The rise of the network society 2nd edition, Singapore, Willey-Blackwell.
CEGARRA-NAVARRO, J. G., ELDRIDGE, S., MARTINEZ-CARO, E. & SANCHEZ POLO, M.
T. The value of extended framework of TAM in the electronic government services.
Proceedings of the European Conference on Knowledge Management, ECKM, 2013. 148-
158.
CHAN, F. K. Y., THONG, J. Y. L., VENKATESH, V., BROWN, S. A., HU, P. J.-H. & TAM, K.
Y. 2010. Modeling Citizen Satisfaction with Mandatory Adoption of an E-Government
Technology. Journal of the Association for Information Systems, 11, 519-549.
CHEN, J. S., & TSOU, H. T. 2007. Information technology adoption for service innovation
practices and competitive advantage: The case of financial firms. Information
Research,12(3), 314-314.
CHEN, Y. N., CHEN, H. M., HUANG, W. & CHING, R. K. H. 2006. E-government strategies in
developed and developing countries: An implementation framework and case study. Journal
of Global Information Management, 14, 23-46.
CHIN, W. W. 2010. How to write up and report PLS analyses. Handbook of partial least squares.
Springer.
CHOU, S. W., MIN, H. T., CHANG, Y. C. & LIN, C. T. 2010. Understanding continuance
intention of knowledge creation using extended expectation-confirmation theory: An
empirical study of Taiwan and China online communities. Behaviour and Information
Technology, 29, 557-570.
CHU, P. Y., HSIAO, N., LEE, F. W. & CHEN, C. W. 2004. Exploring success factors for Taiwan's
government electronic tendering system: behavioral perspectives from end users.
Government Information Quarterly, 21, 219-234.
CHU, P. Y., WU, T. Z. & LEE, C. H. 2009. Technology acceptance in public sector: An empirical
study of a knowledge management system in Kaohsiung City Government. International
Journal of Management and Decision Making, 10, 341-358.
CHUTTUR, M. Y. 2009. Overview of the Technology Acceptance Model: Origins, Developments
and Future Directions. 9 (37), 9-37.
COLESCA, S. E. 2009. Increasing e-trust: A solution to minimize risk in e-government
adoption. Journal of applied quantitative methods, 4(1), 31-44.
CONCHA, G. & ANRIQUE, R. Impacts of the public procurement reform in Chile on the
municipal level. ACM International Conference Proceeding Series, 2012. 440-449.
COOK, C., HEATH, F. & THOMPSON, R. L. 2000. A meta-analysis of response rates in web-or
internet-based surveys. Educational and Psychological Measurement, 60, 821-836.
COUPER, M. P., TRAUGOTT, M. W. & LAMIAS, M. J. 2001. Web survey design and
administration. Public opinion quarterly, 65, 230-253.
CRESWELL, J. W. 2009. Research Design Qualitative, Quantitative and Mixed Methods
Approaches, California, Sage Publications Inc.
~ 140 ~
CROTEAU, A.-M., SOLOMON, S., RAYMOND, L. & BERGERON, F. Organizational and
technological infrastructures alignment. System Sciences, 2001. Proceedings of the 34th
Annual Hawaii International Conference on, 2001. IEEE, 9 pp.
DADA, D. 2006. The Failure of E-Government in Developing Countries: A Literature Review. The
Electronic Journal of Information Systems in Developing Countries, 26, 1-10.
DADAYAN, L., & FERRO, E. 2005. When technology meets the mind: A comparative study of the
technology acceptance model. In Electronic Government (pp. 137-144). Springer Berlin
Heidelberg.
DAMANPOUR, F. 1992. Organizational size and innovation. Organization studies, 13(3), 375-402.
DAMODARAN, L., NICHOLLS, J., HENNEY, A., LAND, F. & FARBEY, B. 2005. The
Contribution of Sociotechnical Systems Thinking to the Effective Adoption of e-
Government and the Enhancement of Democracy. Electronic Journal of e-Government, 3, 1
- 12.
DAVIS JR, F. D. 1986. A technology acceptance model for empirically testing new end-user
information systems: Theory and results. Massachusetts Institute of Technology.
DAVIS, F. D. 1989. Perceived Usefulness, Perceived Ease of Use, and User Acceptance of
Information Technology. MIS Quarterly, 13, 319-340.
DAVIS, F. D. 1993. User acceptance of information technology: system characteristics, user
perceptions and behavioral impacts. International Journal of Man-Machine Studies, 38,
475-487.
DAVIS, F. D., BAGOZZI, R. P. & WARSHAW, P. R. 1989. User Acceptance of Computer
Technology: A Comparison of Two Theoretical Models. Management Science, 35, 982-
1003.
DEHNING, B., RICHARDSON, V. J. & ZMUD, R. W. 2007. The financial performance effects of
IT-based supply chain management systems in manufacturing firms. Journal of Operations
Management, 25, 806-824.
DETLOR, B., HUPFER, M., RUHI, U. & ZHAO, L. 2009. A Citizen-Centric Framework for e-
Government Services use. Proceedings of 5th International Conference on E-Government,
41-48.
DEVADOSS, P. R., PAN, S. L. & HUANG, J. C. 2003. Structurational analysis of e-government
initiatives: a case study of SCO. Decision support systems, 34, 253-269.
DIMAGGIO, P. J. & POWELL, W. W. 1983. The Iron Cage Revisited: Institutional Isomorphism
and Collective Rationality in Organizational Fields. American Sociological Review, 48, No
2, 147-160.
DIMAGGIO, P. J. & POWELL, W. W. 1991. The new institutionalism in organizational analysis,
University of Chicago Press Chicago.
DIMITRI, N., PIGA, G. & SPAGNOLO, G. 2006. Handbook of procurement, Cambridge
University Press.
DOIG, A. & RILEY, S. 1998. Corruption and Anti-Corruption Strategies: Issues and Case Studies
from Developing Countries In: KPUNDEH, S. J. & HORS, I. (eds.) Corruption And
Integrity Improvement Initiatives In Developing Countries. New York: United Nations
Development Programme.
DOLL, W. J., & TORKZADEH, G. 1998. Developing a multidimensional measure of system-use in
an organizational context. Information & Management, 33(4), 171-185.
~ 141 ~
DUNLEAVY, P., MARGETTS, H., BASTOW, S. & TINKLER, J. 2006. Digital Era Governance:
It Corporations, the State, and E-Government, New York, Oxford University Press.
DWIVEDI, Y. K., RANA, N. P., CHEN, H. & WILLIAMS, M. D. 2011. A Meta-analysis of the
Unified Theory of Acceptance and Use of Technology (UTAUT). Governance and
Sustainability in Information Systems. Managing the Transfer and Diffusion of IT. Springer.
EFRON, B., & TIBSHIRANI, R. J. 1994. An introduction to the bootstrap (Vol. 57). CRC press.
ELBELTAGI, I., MCBRIDE, N., & HARDAKER, G. 2005. Evaluating the factors affecting DSS
usage by senior managers in local authorities in Egypt. Journal of Global Information
Management (JGIM), 13(2), 42-65.
EREMINAITE, S. 2013. Assessment aspects of electronic public procurement maturity. Public
Policy and Administration, 12, 567-580.
FAAEQ, M. K., ALQASA, K. & AL-MATARI, E. M. 2015. Technology adoption and innovation
of E-Government in Republic of Iraq. Asian Social Science, 11, 135-145.
FAAEQ, M. K., ISMAIL, N. A., OSMAN, W. R. S., AL–SWIDI, A. K. & FAIEQ, A. K. 2013. A
meta–analysis of the unified theory of acceptance and use of technology studies among
several countries. Electronic Government, an International Journal, 10, 343-360.
FAAQ, M. K., ISMAIL, N. A., OSMAN, W. R. S., FAIEQ, A. K. & ALEQAB, M. 2009.
Application of TAM in the readiness for E-Government services.
FATHUL WAHID, & MAUNG K. SEIN. 2013. Institutional entrepreneurs. Transforming
Government: People, Process and Policy, 7(1), 76. doi:10.1108/17506161311308179.
FEATHERMAN, M. S. & PAVLOU, P. A. 2003. Predicting e-services adoption: a perceived risk
facets perspective. International Journal of Human-Computer Studies, 59, 451-474.
FISHBEIN, M. & AJZEN, I. 1975. Belief, attitude, intention and behavior: An introduction to
theory and research.
FLEISS, J. L. 1971. Measuring nominal scale agreement among many raters. Psychological
Bulletin, 76(5), 378-382. doi:10.1037/h0031619.
FLIGSTEIN, N. 1985. The Spread of the Multidivisional Form Among Large Firms, 1919-1979.
American Sociological Review, 50, No 3, 377-391.
FLOROPOULOS, J., SPATHIS, C., HALVATZIS, D. & TSIPOURIDOU, M. 2010. Measuring the
success of the Greek Taxation Information System. International Journal of Information
Management, 30, 47-56.
FORNELL, C., & BOOKSTEIN, F. L. 1982. Two structural equation models: LISREL and PLS
applied to consumer exit-voice theory. Journal of Marketing research, 440-452.
FORNELL, C., & LARCKER, D. F. 1981. Evaluating structural equation models with
unobservable variables and measurement error. Journal of marketing research, 39-50.
FOSSEY, E., HARVEY, C., MCDERMOTT, F. & DAVIDSON, L. 2002. Understanding and
evaluating qualitative research. Australian and New Zealand Journal of Psychiatry, 36, 717-
732.
FRAMBACH, R. T. & SCHILLEWAERT, N. 2002. Organizational innovation adoption: a multi-
level framework of determinants and opportunities for future research. Journal of Business
Research, 55, 163-176.
FURUHOLT, B. & WAHID, F. E-Government Challenges and the Role of Political Leadership in
Indonesia; The Case of Sragen. Hawaii International Conference on System Sciences,
Proceedings of the 41st Annual, 7-10 Jan. 2008 2008. 411-411.
~ 142 ~
GALASKIEWICZ, J. & WASSERMAN, S. 1989. Mimetic Processes Within an Interorganizational
Field: An Empirical Test. Administrative Science Quarterly, 34, 454-479.
GEERTZ, C. 1973. The interpretation of cultures: selected essays, Basic Books.
GOODE, S. 2005. Something for nothing: management rejection of open source software in
Australia’s top firms. Information & Management, 42, 669-681.
GOODE, S., & GREGOR, S. 2009. Rethinking organisational size in IS research: meaning,
measurement and redevelopment. European Journal of Information Systems, 18(1), 4-25.
GUPTA, B., DASGUPTA, S. & GUPTA, A. 2008. Adoption of ICT in a government organization
in a developing country: An empirical study. The Journal of Strategic Information Systems,
17, 140-154.
GUZMAN, I. R. & KAARST-BROWN, M. L. Research in progress: Fun versus productivity and
intentions to use ICT's in Bolivia. SIGMIS-CPR'12 - Proceedings of the 2012 Computers
and People Research Conference, 2012. 137-141.
HAIR JR, J. F., HULT, G. T. M., RINGLE, C. & SARSTEDT, M. 2014. A primer on partial least
squares structural equation modeling (PLS-SEM), Sage Publications.
HAIR, J. F., RINGLE, C. M., & SARSTEDT, M. 2011. PLS-SEM: Indeed a Silver Bullet. Journal
of Marketing Theory and Practice,19(2), 139-151.
HAMNER, M. & AL-QAHTANI, F. 2009. Enhancing the case for Electronic Government in
developing nations: A people-centric study focused in Saudi Arabia. Government
Information Quarterly, 26, 137-143.
HÄUBERER, J. 2011. Social Capital Theory, Vs Verlag Fur Sozialwissenschaften] Springer
Fachmedien Wiesbaden Gmbh.
HAUNSCHILD, P. R. & MINER, A. S. 1997. Modes of Interorganizational Imitation: The Effects
of Outcome Salience and Uncertainty. Administrative Science Quarterly, 42, 472-500.
HEEKS, R. 2003. Most eGovernment-for-Development Projects Fail: How Can Risks be Reduced?
: iGovernment Working Paper Series, IDPM.
HENMAN, P. 2010. Governing electronically: E-government and the reconfiguration of public
administration, policy, and power, Palgrave Macmillan.
HENRIKSEN, H. Z. & ANDERSEN, K. V. 2003. e-Procurement adoption: Theory and practice.
Lecture Notes in Computer Science (including subseries Lecture Notes in Artificial
Intelligence and Lecture Notes in Bioinformatics).
HIDAYAT, K. 2005. Tool Kit Anti Korupsi Dalam Pengadaan Barang dan Jasa Pemerintah.
Jakarta: Indonesia Procurement Watch.
HILL, T., SMITH, N. D. & MANN, M. F. 1987. Role of efficacy expectations in predicting the
decision to use advanced technologies: The case of computers. Journal of applied
psychology, 72, 307.
HOEFNAGEL, R., OERLEMANS, L. & GOEDEE, J. 2012. Acceptance by the Public of the
Virtual Delivery of Public Services The Effect of Affect. Social Science Computer Review,
30, 274-296.
HONG, S., THONG, J. Y. L. & TAM, K. Y. 2006. Understanding continued information
technology usage behavior: A comparison of three models in the context of mobile internet.
Decision Support Systems, 42, 1819-1834.
~ 143 ~
HORS, I. 2000. Fighting corruption in the developing countries. OECD Observer. 43-43. Available:
http://www.oecdobserver.org/news/archivestory.php/aid/291/Fighting_corruption_in_the_de
veloping_countries.html
HORST, M., KUTTSCHREUTER, M., & GUTTELING, J. M. 2007. Perceived usefulness,
personal experiences, risk perception and trust as determinants of adoption of e-government
services in The Netherlands. Computers in Human Behavior,23(4), 1838-1852.
HOSSAIN, M. D., MOON, J., CHOI, S. M. & KIM, T. H. The effect of social embeddedness to the
information systems continuance: Context of e-government system implementing in rural
area. ICCIT 2009 - 4th International Conference on Computer Sciences and Convergence
Information Technology, 2009. 1487-1492.
HSIAO, C. H., WANG, H. C. & DOONG, H. S. 2012. A study of factors influencing e-
Government service acceptance intention: A multiple perspective approach. Lecture Notes
in Computer Science (including subseries Lecture Notes in Artificial Intelligence and
Lecture Notes in Bioinformatics).
HU, P. J., CHAU, P. Y., SHENG, O. R. L., & TAM, K. Y. (1999). Examining the technology
acceptance model using physician acceptance of telemedicine technology. Journal of
management information systems, 91-112.
HUANG, K. The relations and interactions of E-government and e-commerce. Educational and
Network Technology (ICENT), 2010 International Conference on, 25-27 June 2010. 527-
530.
HUANG, S. Y., HUANG, S. M., WU, T. H. & LIN, W. K. 2009. Process efficiency of the
enterprise resource planning adoption. Industrial Management and Data Systems, 109,
1085-1100.
HUNG, S.-Y., TANG, K.-Z., CHANG, C.-M. & KE, C.-D. 2009. User acceptance of
intergovernmental services: An example of electronic document management system.
Government Information Quarterly, 26, 387-397.
HUNTGEBURTH, J. 2014. Developing and Evaluating a Cloud Service Relationship Theory.
HUSSEIN, R., KARIM, N. S. A. & SELAMAT, M. H. 2007. The impact of technological factors
on information systems success in the electronic-government context. Business Process
Management Journal, 13, 613-627.
HUSSEIN, R., MOHAMED, N., AHLAN, A. R., MAHMUD, M. & ADITIAWARMAN, U. 2010.
G2c adoption of e-government in Malaysia: Trust, perceived risk and political self-efficacy.
International Journal of Electronic Government Research, 6, 57-72.
HWANG, J. & SYAMSUDDIN, I. Failure of E-Government Implementation: A Case Study of
South Sulawesi Paper presented at the Convergence and Hybrid Information Technology,
2008. ICCIT'08. Third International Conference on System Science, 2008.
IACOVOU, C. L., BENBASAT, I. & DEXTER, A. S. 1995. Electronic data interchange and small
organizations: adoption and impact of technology. Management Information Systems
Quarterly, 19, 465-486.
IFINEDO, P. 2007. Moving Towards E-Government in a Developing Society: Glimpses of the
Problems, Progress, and Prospects in Nigeria. In: HAKIM, L. A. (ed.) Global E-
Government Theory, Applications and Benchmarking. Hershey PA: Idea Group Publisher.
JACKSON, C. M., CHOW, S. & LEITCH, R. A. 1997. Toward an understanding of the behavioral
intention to use an information system. Decision sciences, 28, 357-389.
~ 144 ~
JANG, C. L. 2010. Measuring electronic government procurement success and testing for the
moderating effect of computer self-efficacy. International Journal of Digital Content
Technology and its Applications, 4.
JARVIS, C. B., MACKENZIE, S. B., & PODSAKOFF, P. M. 2003. A critical review of construct
indicators and measurement model misspecification in marketing and consumer
research. Journal of consumer research, 30(2), 199-218.
JOSEPH, B. K. 2010. E-government Adoption Landscape Zambia: Context, Issues, and Challenges.
In: REDDICK, C. G. (ed.) Comparative E-Government.
JUNSEOK, H. & SYAMSUDDIN, I. Failure of E-Government Implementation: A Case Study of
South Sulawesi. Convergence and Hybrid Information Technology, 2008. ICCIT '08. Third
International Conference on, 11-13 Nov. 2008 2008. 952-960.
KALIANNAN, M. & AWANG, H. 2010. Adoption and use of e-Government services: A case
study on e-Procurement in Malaysia. WSEAS Transactions on Business and Economics, 7,
1-10.
KALIANNAN, M., AWANG, H., RAMAN, M., & DORASAMY, M. e-Procurement for the Public
Sector: Determinants of attitude towards Adoption. http://www.csisigegov.
org/critical_pdf/25_224-234. pdf.
KALIANNAN, M., RAMAN, M., & DORASAMY, M. 2009. E-procurement adoption in the
malaysian public sector: Organizational perspectives. Paper presented at the 189-194.
doi:10.1109/EDOCW.2009.5331999.
KAMAL, M. 2006. IT innovation adoption in the government sector: identifying the critical success
factors. Journal of Enterprise Information Management, 19, 192-222.
KAPLAN, B., & DUCHON, D. 1988. Combining qualitative and quantitative methods in
information systems research: a case study. MIS quarterly, 571-586.
KAPLOWITZ, M. D., HADLOCK, T. D. & LEVINE, R. 2004a. A Comparison of Web and Mail
survey response rate. Public Opinion Quarterly, 68 No 1, 94-101.
KARAHANNA, E., STRAUB, D. W. & CHERVANY, N. L. 1999. Information technology
adoption across time: A cross-sectional comparison of pre-adoption and post-adoption
beliefs. MIS Quarterly: Management Information Systems, 23, 183-213.
KE, W., LIU, H., WEI, K. K., GU, J., & CHEN, H. 2009. How do mediated and non-mediated
power affect electronic supply chain management system adoption? The mediating effects
of trust and institutional pressures. Decision Support Systems, 46(4), 839-851.
KIM, B. 2010. An empirical investigation of mobile data service continuance: Incorporating the
theory of planned behavior into the expectation-confirmation model. Expert Systems with
Applications, 37, 7033-7039.
KIM, J., HONG, S., MIN, J., & LEE, H. 2011. Antecedents of application service continuance: A
synthesis of satisfaction and trust. Expert Systems with Applications, 38(8), 9530-9542.
KIM, K. & PRABHAKAR, B. Initial trust, perceived risk, and the adoption of internet banking.
Proceedings of the twenty first international conference on Information systems, 2000.
Association for Information Systems, 537-543.
KIM, S. H. & SONG, Y.-M. 2009. An Empirical Study on User's Intention to Use Government
Portal Sites: Moderating Effects of Ambiguity & Government Supports. The Journal of
Information Systems, 18, 117-144.
KIM, S., KIM, H. J. & LEE, H. 2009. An institutional analysis of an e-government system for anti-
corruption: The case of OPEN. Government Information Quarterly, 26, 42-50.
~ 145 ~
KIM, Y. & ZHANG, P. Continued use of technology: Combining controlled and automatic
processes. ICIS 2010 Proceedings - Thirty First International Conference on Information
Systems, 2010.
KIMBERLY, JR. 1987. Organizational and contextual influences on the diffusion of technological
innovation. New Technology as Organizational Innovation. Ballinger, Cambridge, MA.
KING, W. R. & HE, J. 2006. A meta-analysis of the technology acceptance model. Information &
Management, 43, 740-755.
KO, C. H. & LIAO, H. S. 2014. Reducing ineligible contractor disputes in government
procurement: A lesson from Taiwan. KSCE Journal of Civil Engineering, 18, 409-418.
KOVÁCS, A. 2004. Enhancing procurement practices: Comprehensive approach to acquiring
complex facilities and projects, Springer Science & Business Media.
KROMIDHA, E. & CÓRDOBA-PACHÓN, J. R. 2009. E-government and its evaluation in South
East Europe: The case of Albania. Systems Thinking and E-Participation: ICT in the
Governance of Society.
KUMOROTOMO, W. 2009. Kegagalan Penerapan E-Government dan Kegiatan Tidak Produktif
Dengan Internet. [Accessed 20 Dec 2011].
KUPPUSAMY, M., PAHLAVANI, M. & SALEH, A. S. 2008. Fostering ICT development for
growth: Measuring the payoffs for Australia and the Asean-5 countries. American Journal of
Applied Sciences, 5, 1676-1685.
KWON, T. H. & ZMUD, R. W. 1987. Unifying the fragmented models of information systems
implementation. In: R. J. BOLAND, JR. & HIRSCHHEIM, R. A. (eds.) Critical issues in
information systems research. John Wiley & Sons, Inc.
LAI, C. S. K. & PIRES, G. Towards a model of macao's E-Government portal adoption.
Innovation and Knowledge Management in Twin Track Economies Challenges and
Solutions - Proceedings of the 11th International Business Information Management
Association Conference, IBIMA 2009, 2009. 1102-1112.
LAI, V. S., & GUYNES, J. L. 1997. An assessment of the influence of organizational
characteristics on information technology adoption decision: a discriminative
approach. Engineering Management, IEEE Transactions on,44(2), 146-157.
LAMB, R. & KLING, R. 2003. Reconceptualizing Users as Social Actors in Information Systems
Research. MIS Quarterly, 27, 197-236.
LANDIS, J. R., & KOCH, G. G. 1977. The measurement of observer agreement for categorical
data. Biometrics, 33(1), 159-174.
LAU, T. Y., ABOULHOSON, M., LIN, C. & ATKIN, D. J. 2008. Adoption of e-government in
three Latin American countries: Argentina, Brazil and Mexico. Telecommunications Policy,
32, 88-100.
LEDERER, A. L. & MENDELOW, A. L. 1988. Convincing Top Management of the Strategic
Potential of Information Systems. MIS Quarterly, 12, 525-534.
LEE, J. & RAO, H. R. 2012. Service source and channel choice in G2C service environments: a
model comparison in the anti/counter-terrorism domain. Information Systems Journal, 22,
313-341.
LEE, M. C. 2010. Explaining and predicting users' continuance intention toward e-learning: An
extension of the expectation-confirmation model. Computers and Education, 54, 506-516.
~ 146 ~
LEE, Y., KOZAR, K. A. & LARSEN, K. R. T. 2003. The Technology Acceptance Model: Past,
Present, and Future. Communications of the Association for Information Systems: , Vol. 12,
Article 50, 752 -780.
LENGWILER, Y. & WOLFSTETTER, E. 2006. Corruption in procurement auctions. Available at
SSRN 874705.
LEONARD-BARTON, D. 1988. Implementation characteristics of organizational innovations.
Communication Research. 15(5), 603–631.
LIAO, C., PALVIA, P. & CHEN, J.-L. 2009. Information technology adoption behavior life cycle:
Toward a Technology Continuance Theory (TCT). International Journal of Information
Management, 29, 309-320.
LIIKANEN, E. 2003. eGovernment: An EU Perspective. In: CURTINS, G. G., SOMMER, M. H.
& VIS-SOMMER, V. (eds.) The World of E-Government. New York: The Haworth Press,
Inc.
LIM, S. H., KIM, D. J. & LEE, J. S. 2013. An empirical study on the sustained adoption of e-
government services using extended expectation confirmation model. International Journal
of Information Processing and Management, 4, 192-198.
LIN, F., FOFANAH, S. S. & LIANG, D. 2011. Assessing citizen adoption of e-Government
initiatives in Gambia: A validation of the technology acceptance model in information
systems success. Government Information Quarterly, 28, 271-279.
LIN, N. 1999. Building a network theory of social capital. Connections, 22, 28-51.
LINCOLN, Y. S. & GUBA, E. G. 1985. Naturalistic inquiry, Sage Publications.
LIO, M.-C., LIU, M.-C. & OU, Y.-P. 2011. Can the internet reduce corruption? A cross-country
study based on dynamic panel data models. Government Information Quarterly, 28, 47-53.
LIU, Y., ZHOU, C. & CHEN, Y. Customer satisfaction measurement model of e-government
service. Proceedings of 2010 IEEE International Conference on Service Operations and
Logistics, and Informatics, SOLI 2010, 2010. 419-423.
LKPP. 2015. LPSE [Online]. Available: http://eproc.lkpp.go.id/lpse [Accessed 18 February 2015].
LO, M. C. & LAU, R. S. M. 2005. A proposed mdel of ERP system acceptance determinants. In:
ZHAO, X. & NGUYEN, H. T. (eds.) Proceedings of the Fourth International Conference
on Information and Management Sciences.
LOO, W. H., YEOW, P. H. P. & CHONG, S. C. 2009. User acceptance of Malaysian government
multipurpose smartcard applications. Government Information Quarterly, 26, 358-367.
LOPEZ-SISNIEGA, C. 2009. Barriers to Electronic Government use as Perceived by Citizens at the
Municipal Level in Mexico. Proceedings of 5th International Conference on E-Government,
130-138.
LOWRY, P. B. & GASKIN, J. 2014. Partial least squares (PLS) structural equation modeling
(SEM) for building and testing behavioral causal theory: When to choose it and how to use
it. Professional Communication, IEEE Transactions on, 57, 123-146.
LOXTON, N. 2014. Applied Structural Equation Modelling [Coursenote]. Australian Consortium
for Social and Political Research Incorporated, Australia.
LUCAS JR, H. C., SWANSON, E. B. & ZMUD, R. W. 2007. Implementation, innovation, and
related themes over the years in information systems research. Journal of the Association of
Information Systems, 8, 206-210.
~ 147 ~
MAHARANI, D. 2013. Kejaksaan Agung Tahan 5 Petinggi PT PLN. Available:
http://nasional.kompas.com/read/2013/05/30/03422226/Kejaksaan.Agung.Tahan.5.Petinggi.
PT.PLN.
MARKUS, ML. 1983. Power, politics, and MIS implementation. Communications of the ACM
26(6), 430–444.
MATHER, J. H. 2010. Focus Group and Qualitative Research. In: DORF, R. C. (ed.) The
technology management handbook. CRC Press.
McGORRY. S. Y. (2000). Measurement in a cross-cultural environment: survey translation issues.
Qualitative Market Research: An International Journal, 3(2), 74-81.
MCNABB, D. E. 2002. Research Methods in Public Administration and Nonprofit Management
Quantitative and Qualitative Approach, New York, M.E. Sharpe Inc.
MERCURI, R. T. 2005. Trusting in transparency. Communications of the ACM, 48, 15-19.
MIGNERAT, M., & RIVARD, S. 2009. Positioning the institutional perspective in information
systems research. Journal of Information Technology, 24(4), 369-391.
doi:10.1057/jit.2009.13
MINIWATTSMARKETINGGROUP. 2015. World Internet Users and 2014 Population Stats
[Online]. Available: http://www.internetworldstats.com/stats.htm [Accessed 17 February
2015].
MIRCHANDANI, D. A., JOHNSON JR, J. H. & JOSHI, K. 2008. Perspectives of citizens towards
e-government in Thailand and Indonesia: A multigroup analysis. Information Systems
Frontiers, 10, 483-497.
MITCHELL, V.-W. 1999. Consumer perceived risk: conceptualisations and models. European
Journal of marketing, 33, 163-195.
MOON, M. J. 2005. E-procurement management in state governments: diffusion of e-procurement
practices and its determinants. Journal of Public Procurement, 5, 54-72.
MOONEY, C. Z., & DUVAL, R. D. (Eds.). 1993. Bootstrapping: A nonparametric approach to
statistical inference (No. 94-95). Sage.
MOORE, G. C. & BENBASAT, I. 1991. Development of an instrument to measure the perceptions
of adopting an information technology innovation. Information systems research, 2, 192-
222.
NARIMAN, D. & YAMAMOTO, S. An Evaluation of Information quality of e-Government in
Indonesia. In: REMENYI, D., ed. 4th International Conference on e-Government, 2008
RMIT University, Melbourne, Australia. Academic Publishing Limited, Reading, 309 - 318.
NEUMAN, W. L. 2011. Social research methods: qualitative and quantitative approaches,
Pearson/Allyn and Bacon.
NEUPANE, A., SOAR, J. & VAIDYA, K. 2012a. Perceived benefits related to anti-corruption from
e-tendering system in Nepal. Asian Journal of Information Technology, 11, 22-29.
NEUPANE, A., SOAR, J. & VAIDYA, K. 2012b. The potential of e-procurement technology for
reducing corruption. International Journal of Information Technology and Management, 11,
273-287.
NEUPANE, A., SOAR, J., VAIDYA, K. & YONG, J. 2014. Willingness to adopt e-procurement to
reduce corruption: Results of the PLS Path modeling. Transforming Government: People,
Process and Policy, 8, 500-520.
~ 148 ~
NEUPANE, A., SOAR, J., VAIDYA, K. & YONG, J. Role of public e-procurement technology to
reduce corruption in government procurement. Proceedings of the 5th International Public
Procurement Conference (IPPC5), 2012c. Public Procurement Research Center, 304-334.
NORRIS, D. F. 1999. Leading edge information technologies and their adoption: lessons for U.S.
cities. In: GARSON, G. D. (ed.) Information technology and computer applications in
public administration. IGI Publishing.
NTALIANI, M., COSTOPOULOU, C., KARETSOS, S., TAMBOURIS, E. & TARABANIS, K.
2010. Agricultural e-government services: An implementation framework and case study.
Computers and Electronics in Agriculture, 70, 337-347.
NUGROHO, R. 2006. Studi penjelajahan tentang kebijakan pengadaan barang/jasa melalui Internet
di Departemen Pekerjaan Umum. Spirit Publik Jurnal Ilmu Administrasi, 2, 75-80.
NUGROHO, R. 2010. Peluang dan tantangan Electronic Government Procurement di Indonesia:
studi kasus 55 instansi pemerintah. In: SUAEDI, F. & WARDIYANTO, B. (eds.)
Revitalisasi Administrasi Negara Reformasi Birokrasi dan e-Governance. Yogyakarta:
Graha Ilmu.
NUGROHO, R. A. 2005. Monitoring Kebijakan Pengadaan Barang/Jasa Melalui Internet di
Departemen Pekerjaan Umum. Spirit Publik Jurnal Ilmu Administrasi, Vol. 2 No. 2 77 - 83.
NULTY, D. D. 2008. The adequacy of response rates to online and paper surveys: what can be
done? Assessment & Evaluation in Higher Education, 33(3), 301-314.
OLIVEIRA, T. & MARTINS, M. F. 2011. Literature Review of Information Technology Adoption
Models at Firm Level. Electronic Journal of Information Systems Evaluation, 14 no 1, 110-
121.
OLIVEIRA, T. & MARTINS, M. F. 2011. Literature Review of Information Technology Adoption
Models at Firm Level. The Electronic Journal Information Systems Evaluation, 14, 110-
121.
PADHI, S. S. & MOHAPATRA, P. K. J. 2010. Adoption of e-procurement in the government
departments. Electronic Government, 7, 41-59.
PATRICK, G. 2007. User Acceptance of the E-Perolehan System Among Government Users in
Malaysia (Doctoral dissertation, Universiti Putra Malaysia).
PATTON, M. Q. 1987. How to use qualitative methods in evaluation, Nebury Park Sage
Publications.
PAVLOU, P. A. 2003. Consumer acceptance of electronic commerce: integrating trust and risk with
the technology acceptance model. International journal of electronic commerce, 7, 101-134.
PETTER, S., DELONE, W. & MCLEAN, E. 2008. Measuring information systems success:
Models, dimensions, measures, and interrelationships. European Journal of Information
Systems, 17, 236-263.
PODGORECKI, A., ALEXANDER, J. & SHIELDS, R. 1996. Social engineering, McGill Queens
Univ.
PRAMONO, S. 2011. Lima Penyebab Kemerosotan Kepuasan Publik. kompas.com.
PREACHER, K. J., & LEONARDELLI, G. J. 2003. Calculation for the Sobel test. An interactive
calculation tool for mediation tests. Retrieved December 12, 2014, from
http://quantpsy.org/sobel/sobel.htm
PREMKUMAR, G. & RAMAMURTHY, K. 1995. The Role of Interorganizational and
Organizational Factors on the Decision Mode for Adoption of Interorganizational Systems*.
Decision Sciences, 26, 303-336.
~ 149 ~
PUDJIANTO, B. W. & HANGJUNG, Z. Factors affecting e-government assimilation in developing
countries. 4th Communication Policy Research, South Conference, Negombo, Sri Lanka,
2009.
PUDJIANTO, B., ZO, H., CIGANEK, A. P. & RHO, J. J. 2011. Determinants of e-government
assimilation in Indonesia: An empirical investigation using a TOE framework. Asia Pacific
Journal of Information Systems, 21, 49-80.
RAHARDJO, E. 2007. E-Government Functionality and Website Features: A Case Study of
Indonesia. Journal of Global Information Technology Management : JGITM, 10, 31.
RAHIM, M. M. 2008. Identifying factors affecting acceptance of e-procurement systems: An initial
qualitative study at an Australian City Council.Communications of the IBIMA, 3(1), 7-17.
RANA, N. P., DWIVEDI, Y. K. & WILLIAMS, M. D. 2013. Evaluating the validity of IS success
models for the electronic government research: An empirical test and integrated model.
International Journal of Electronic Government Research, 9, 1-22.
RANA, N. P., WILLIAMS, M. D., DWIVEDI, Y. K. & WILLIAMS, J. 2011. Reflecting on e-
government research: Toward a taxonomy of theories and theoretical constructs.
International Journal of Electronic Government Research, 7, 64-88.
REHMAN, M. & ESICHAIKUL, V. Factors influencing the adoption of e-government in Pakistan.
E -Business and E -Government (ICEE), 2011 International Conference on, 6-8 May 2011
2011. 1-4.
RINGLE, C. M., WENDE, S., & BECKER, J-M. 2014. SmartPLS 3. Hamburg: www.
smartpls.com.
ROGERS, E. M. 2003. Diffusion of innovations/Everett M. Rogers. New York., NY, Free Press.
ROKHMAN, A. 2008. Potret Dan Hambatan E-Government Indonesia. Inovasi [Online],
11/XX/July 2008. Available: http://io.ppijepang.org/article.php?id=263
ROKHMAN, A. 2011. E-Government Adoption in Developing Countries; the Case of Indonesisa.
Journal of Emerging Trends in Computing and Information Sciences, 2, 228.
ROSE, M. 2004. Democratizing information and communication by implementing e-government in
Indonesian regional government. The International Information and Library Review, 36,
219-226.
ROSSITER, J. R. 2002. The C-O-A-R-S-E procedure for scale development in
marketing. International journal of research in marketing, 19(4), 305-335.
ROSSMAN, G. B. & WILSON, B. L. 1985. Numbers and Words: Combining Quantitative and
Qualitative Methods in a Single Large-Scale Evaluation Study. Evaluation Review, 9, 627-
643.
ROTCHANAKITUMNUAI, S. 2013. The governance evidence of e-government procurement.
Transforming Government: People, Process and Policy, 7, 309-321.
ROTCHANAKITUMNUAI, S. 2009. Electronic government service acceptance: The E-GOV-
SAM aspect of the e-revenue system. Proceedings of the International Conference on
Electronic Business (ICEB), 2009. 345-350.
RUSSELL, D. M. & HOAG, A. M. 2004. People and information technology in the supply chain:
social and organizational influences on adoption. International Journal of Physical
Distribution & Logistics Management, 34, 102-122.
SALAHUDDIN, M. & RUSLI, A. 2005. Information Systems Planning For E-Government In
Indonesia. The Second Internationa Conference on Innovations in Information Technology
(IIT'05). Dubai, UAE.
~ 150 ~
SANG, S. & LEE, J.-D. 2009. A Conceptual Model of e-Government Acceptance in Public Sector.
2009 Third International Conference on Digital Society, 71-76.
SARSTEDT, M., RINGLE, C. M., HENSELER, J., & HAIR, J. F. 2014. On the emancipation of
PLS-SEM: A commentary on Rigdon (2012). Long Range Planning, 47(3), 154-160.
SATRIYA, E. Pentingnya Revitalisasi e-Government di Indonesia. Konferensi Nasional Teknologi
Informasi & Komunikasi untuk Indonesia, 2006 Bandung.
SCHAUPP, L. C., & CARTER, L. (2005). E-voting: from apathy to adoption. Journal of Enterprise
Information Management, 18(5), 586-601.
SCHELIN, S. H. 2003. E-Government: An Overview. In: GARSON, G. D. (ed.) Public Information
Technology: Policy and Management Issues. Hershey, PA Idea Group Publishing.
SCHÜTTE, S. A. 2012. AGAINST THE ODDS: ANTI-CORRUPTION REFORM IN
INDONESIA. Public Administration and Development, 32, 38-48.
SEBETCI, O. & AKSU, G. 2014. Evaluating e-government systems in Turkey: The case of the 'e-
movable system'. Information Polity, 19, 225-243.
SEDAGHAT, S., PIEPRZYK, J. & SELTSIKAS, P. 2007. The management of citizen identity in
electronic government.
SELKE, S., MALLICK, B. & HOLZBACH, A. 2008. e-Honesty: Technical Potentials and Social
Risks of Local e-Government Strategies in Bangladesh for Supporting the Fight Against
Corruption. Proceedings of the 8th European Conference on E-Government, 475-482.
SEYAL, A. H. & PIJPERS, G. G. M. 2004. Senior government executives' use of the internet: A
Bruneian scenario. Behaviour and Information Technology, 23, 197-210.
SHAJARI, M. & ISMAIL, Z. 2010. Acomprehensive adoption model of e-Government services in
developing countries. Advanced Management Science (ICAMS), 2010 IEEE International
Conference on, 9-11 July 2010,548-553.
SHAREEF, M. A., KUMAR, V., KUMAR, U. & DWIVEDI, Y. K. 2011. e-Government Adoption
Model (GAM): Differing service maturity levels. Government Information Quarterly, 28,
17-35.
SHI, W., & SHAMBARE, N. 2008. The adoption of internet banking: An institutional theory
perspective. Journal of Financial Services Marketing, 12(4), 272-286.
doi:10.1057/palgrave.fsm.4760081
SHIBLY, H. H. A. & TADROS, I. H. 2010. Employeés perceptions towards electronic government
in Jordan. European Journal of Scientific Research, 48, 169-176.
SIMON, S. J., GROVER, V., TENG, J. T. C., & WHITCOMB, K. 1996. The relationship of
information system training methods and cognitive ability to end-user satisfaction,
comprehension, and skill transfer: A longitudinal field study. Information Systems
Research, 7(4), 466-490. doi:10.1287/isre.7.4.466
SOBEL, M. E. 1982. Asymptotic confidence intervals for indirect effects in structural equation
models. Sociological methodology, 13(1982), 290-312.
SØREIDE, T. 2002. Corruption in public procurement. Causes, consequences and cures, Chr.
Michelsen Intitute.
SRIVASTAVA, S. C. & TEO, T. S. 2007. What facilitates e-government development? A cross-
country analysis. Electronic Government, An International Journal, 4, 365-378.
SRIVASTAVA, S. C. & TEO, T. S. H. 2010. E-government, e-business, and national economic
performance. Communications of the Association for Information Systems, 26, 267-286.
~ 151 ~
SRIVASTAVA, S. C. & TEO, T. S. H. 2006. Determinants and impact of e-government and
ebusiness development: A global perspective. ICIS 2006 Proceedings - Twenty Seventh
International Conference on Information Systems. 465-482.
STRAUB JR, D. W. & BURTON-JONES, A. 2007. Veni, vidi, vici: Breaking the TAM logjam.
Journal of the Association of Information Systems, 8, 223-229.
STRAUB, E. T. 2009. Understanding technology adoption: Theory and future directions for
informal learning. Review of Educational Research, 79, 625-649.
SUCAHYO, Y. G. & RULDEVIYANI, Y. 2009. Implementasi e-Procurement sebagai Inovasi
Pelayanan Publik. LKPP, available at http://www. lkpp. go. id/v2/files/content/file/e-Proc%
20book% 20final. pdf (accessed on 26 October 2011).
SULTANA, R., LOPEZ, J. L. & RUSU, L. 2011. Barriers to e-commerce implementation in small
enterprises in Sweden. Communications in Computer and Information Science.
SWEENEY, A. 2007. Personal Interview Transcripts for Research on Exploring Citizen
Perspectives on Electronic Government-Citizen Relationships, January-May 2005. Inter-
university Consortium for Political and Social Research, v1.
TAMBOURIS, E. & WIMMER, M. 2005. Online One-Stop Government: A Single Point of Access
to Public Services. In: HUANG, W., SIAU, K. & WEI, K. K. (eds.) Electronic Government
Strategies and Implementation. Hershey, PA: Idea Group Publishing.
TAYLOR, S., & TODD, P. A. 1995. Understanding information technology usage: A test of
competing models. Information Systems Research, 6(2), 144-176. doi:10.1287/isre.6.2.144
TEO, H.-H., WEI, K. K. & BENBASAT, I. 2003. Predicting intention to adopt interorganizational
linkages: An institutional perspective. Mis Quarterly, 19-49.
TEO, T. S. H., SRIVASTAVA, S. C. & JIANG, L. 2008. Trust and Electronic Government
Success: An Empirical Study. Journal of Management Information Systems, 25, 99-131.
TEO, T. S., LIN, S. & LAI, K.-H. 2009. Adopters and non-adopters of e-procurement in Singapore:
an empirical study. Omega, 37, 972-987.
THOMPSON, R. L., HIGGINS, C. A., & HOWELL, J. M. 1991. Personal computing: Toward a
conceptual model of utilization.MIS Quarterly, 15(1), 125-143.
THONG, J. Y. & YAP, C.-S. 1995. CEO characteristics, organizational characteristics and
information technology adoption in small businesses. Omega, 23, 429-442.
THONG, J. Y. L., YAP, C., & RAMAN, K. S. 1996. Top management support, external expertise
and information systems implementation in small businesses. Information Systems
Research, 7(2), 248-267. doi:10.1287/isre.7.2.248
TORNATZKY, L. G., FLEISCHER, M. & CHAKRABARTI, A. K. 1990. The processes of
technological innovation, Lexington Books Lexington, MA.
TRANSPARENCY INTERNATIONAL. 2012. The Corruption Perception Index [Online].
Available: http://cpi.transparency.org [Accessed 7 July 2012].
TROCHIM, W. M. K. 2006. Research methods: knowlede base [Online]. Available:
http://www.socialresearchmethods.net/kb/ [Accessed 12 Dec 2011].
TSENG, F. M. & LO, H. Y. 2011. Antecedents of consumers' intentions to upgrade their mobile
phones. Telecommunications Policy, 35, 74-86.
TSENG, F. M., KUO, S. C. & LO, H. 2011. What forms the migrating pattern for innovation
adoption? The case of mobile data services. Proceedings - 2011 International Joint
Conference on Service Sciences, IJCSS 2011. 158-162.
~ 152 ~
TURNER, M., KITCHENHAM, B., BRERETON, P., CHARTERS, S. & BUDGEN, D. 2010. Does
the technology acceptance model predict actual use? A systematic literature review.
Information and Software Technology, 52, 463-479.
UGRIN, J. C. 2009. The effect of system characteristics, stage of adoption, and experience on
institutional explanations for ERP systems choice. Accounting Horizons, 23(4), 365-389.
doi:10.2308/acch.2009.23.4.365
UNITED NATIONS 2012. E-Government Survey 2012: E-Government for the People. New York:
United Nations.
VAIDYA, K. 2009. Electronic Procurement: Impact on Procurement Performance: Electronic
Procurement: the Organizational Assimilation Process and Its Impact on Public
Procurement Performance, LAP LAMBERT Academic Publishing AG & Company KG.
VAIDYA, K., SAJEEV, A. & CALLENDER, G. 2006. Critical factors that influence e-
procurement implementation success in the public sector. Journal of public procurement, 6,
70.
VENKATESH, V. & BALA, H. 2008. Technology acceptance model 3 and a research agenda on
interventions. Decision Sciences, 39, 273-315.
VENKATESH, V. & DAVIS, F. D. 1996. A model of the antecedents of perceived ease of use:
Development and test*. Decision sciences, 27, 451-481.
VENKATESH, V. & DAVIS, F. D. 2000. Theoretical extension of the Technology Acceptance
Model: Four longitudinal field studies. Management Science, 46, 186-204.
VENKATESH, V., DAVIS, F. D. & MORRIS, M. G. 2007. Dead or alive? The development,
trajectory and future of technology adoption research. Journal of the Association of
Information Systems, 8, 267-286.
VENKATESH, V., MORRIS, M. G., DAVIS, G. B. & DAVIS, F. D. 2003. User acceptance of
information technology: Toward a unified view. MIS Quarterly: Management Information
Systems, 27, 425-478.
VENKATESH, V., THONG, J. Y. L., CHAN, F. K. Y., HU, P. J., & BROWN, S. A. 2011.
Extending the two‐stage information systems continuance model: Incorporating UTAUT
predictors and the role of context. Information Systems Journal, 21(6), 527-555.
doi:10.1111/j.1365-2575.2011.00373.x
VERDEGEM, P. & VERLEYE, G. 2009. User-centered E-Government in practice: A
comprehensive model for measuring user satisfaction. Government Information Quarterly,
26, 487-497.
VRČEK, N. & KLAČMER, M. 2014. Intention to use and variables influencing intention to use
electronic government services among citizens. Journal of Information and Organizational
Sciences, 38, 55-69.
WAHID, F. 2010. Examining adoption of e-procurement in public sector using the perceived
characteristics of innovating: Indonesian perspective. In Next Generation Society.
Technological and Legal Issues (pp. 64-75). Springer Berlin Heidelberg.
WANG, C. 2014. Antecedents and consequences of perceived value in Mobile Government
continuance use: An empirical research in China. Computers in Human Behavior, 34, 140-
147.
WANG, Y.-S. & LIAO, Y.-W. 2008. Assessing eGovernment systems success: A validation of the
DeLone and McLean model of information systems success. Government Information
Quarterly, 25, 717-733.
~ 153 ~
WARNER, R. M. 2012. Applied Statistics: From Bivariate Through Multivariate Techniques: From
Bivariate Through Multivariate Techniques. Sage.
WEERAKKODY, V., EL-HADDADEH, R., AL-SOBHI, F., SHAREEF, M. A. & DWIVEDI, Y.
K. 2013. Examining the influence of intermediaries in facilitating e-government adoption:
An empirical investigation. International Journal of Information Management, 33, 716-725.
WELCH, E. W., HINNANT, C. C. & MOON, M. J. 2005. Linking Citizen satisfaction with E-
Government and trust in Government Journal of Public Administration Research and
Theory, 15, 371 - 391.
WERTS, C. E., LINN, R. L., & JÖRESKOG, K. G. 1974. Intraclass reliability estimates: Testing
structural assumptions. Educational and Psychological measurement, 34(1), 25-33.
WETZELS, M., ODEKERKEN-SCHRÖDER, G. & VAN OPPEN, C. 2009. Using PLS path
modeling for assessing hierarchical construct models: Guidelines and empirical illustration.
MIS Quarterly: Management Information Systems, 33, 177-196.
WILLIAMS, M. D., RANA, N. P. & DWIVEDI, Y. K. 2012. A Bibliometric analysis of articles
using the Unified Theory of Acceptance and Use of Technology. In: DWIVEDI, Y. K.,
WADE, M. R. & SCHNEBERGER, S. L. (eds.) Information Systems Theory Explaining and
Predicting Our Digital Society. New York: Springer.
WILLIAMS, M. D., RANA, N. P., DWIVEDI, Y. K. & LAL, B. 2011. Is UTAUT really used or
just cited for the sake of it? A systematic review of citations of UTAUT's originating artcile.
Available: http://is2.lse.ac.uk/asp/aspecis/20110235.pdf
WILLIAMS-ELEGBE, S. 2012. Fighting corruption in public procurement: a comparative
analysis of disqualification or debarment measures, Bloomsbury Publishing.
WU, P. F. 2012. A Mixed Methods Approach to Technology Acceptance Research. Journal of the
Association for Information Systems, 13, 172 187.
YAHYA, M., NADZAR, F. & RAHMAN, B. A. 2012. Examining User Acceptance of E-Syariah
Portal Among Syariah Users in Malaysia. In: MAMAT, M. N., ALIAS, N. A., JONO, M.,
ISA, M. A. M., ABAZIZ, A., LUARAN, J. E., MOHAMAD, S. N. A., ASARANI, N. A. M.
& IBRAHIM, Z. (eds.) 3rd International Conference on E-Learning.
YEH, R. K. J. & TENG, J. T. C. 2012. Extended conceptualisation of perceived usefulness:
Empirical test in the context of information system use continuance. Behaviour and
Information Technology, 31, 525-540.
YI, M. Y., JACKSON, J. D., PARK, J. S., & PROBST, J. C. 2006. Understanding information
technology acceptance by individual professionals: Toward an integrative view. Information
& Management, 43(3), 350-363.
YOUNG-JIN, S. & SEANG-TAE, K. 2007. E-Government Concepts, Measures and Best Practices.
In: AL-HAKIM, L. (ed.) Global E-Government Theory, Applications and Benchmarking.
Hershey, PA: Idea Group Publishing.
YULIANTO, A. 2011. Sejarah LPSE. LPSE [Online]. Available from:
http://lpse.blogdetik.com/sejarah/ 2015].
ZHAN, Y., WANG, P. & XIA, S. 2011. Exploring the drivers for ICT adoption in government
organization in China. Proceedings - 2011 4th International Conference on Business
Intelligence and Financial Engineering, BIFE 2011. 220-223.
ZHANG, N., GUAN, X. & MENG, Q. 2011 Exploring different roles between service expectation
and technology expectation in citizen's e-government continuance adoption: An extended
expectation-confirmation model Research-in-Progress. Proceedings of the PACIS 2011.
~ 154 ~
ZHENG, D., CHEN, J., HUANG, L., & ZHANG, C. 2013. E-government adoption in public
administration organizations: Integrating institutional theory perspective and resource-based
view. European Journal of Information Systems, 22(2), 221-234. doi:10.1057/ejis.2012.28.
ZHU, K. & KRAEMER, K. L. 2005. Post-adoption variations in usage and value of e-business by
organizations: Cross-country evidence from the retail industry. Information Systems
Research, 16, 61-84.
ZUBOFF, S. 1988. In the Age of the Smart Machine. Basic Books, New York.
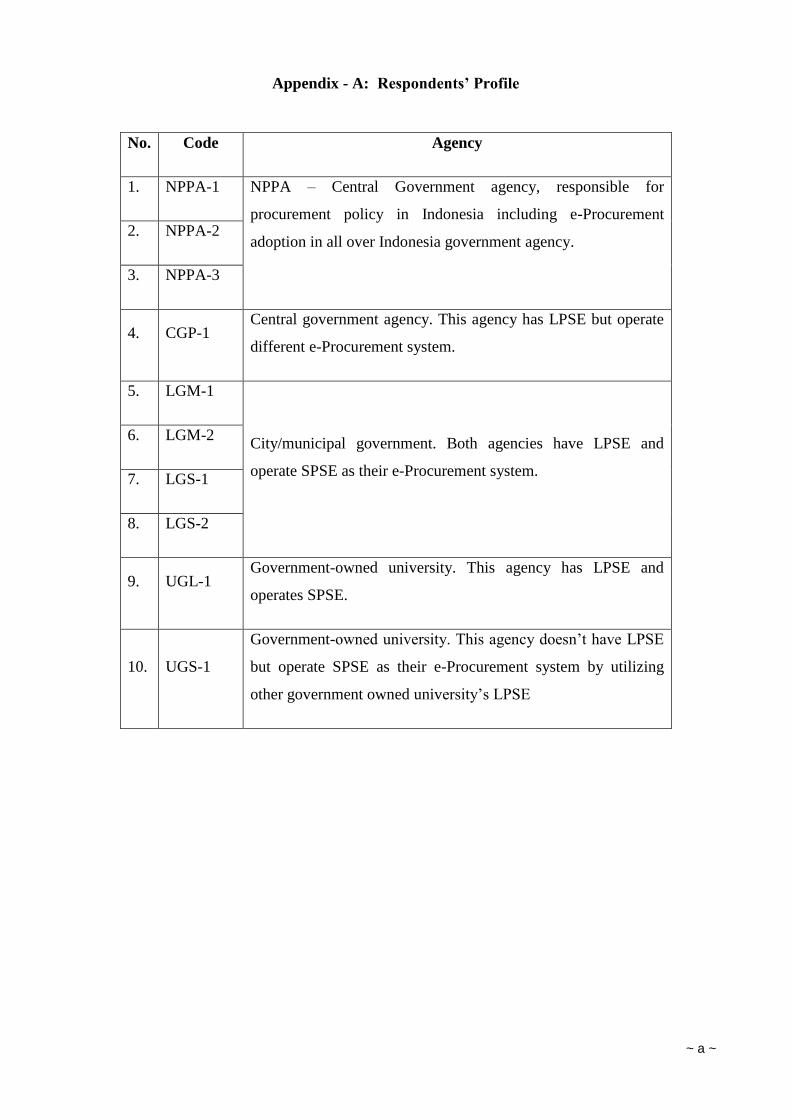
~ a ~
Appendix - A: Respondents’ Profile
No. Code Agency
1. NPPA-1 NPPA – Central Government agency, responsible for
procurement policy in Indonesia including e-Procurement
adoption in all over Indonesia government agency. 2. NPPA-2
3. NPPA-3
4. CGP-1 Central government agency. This agency has LPSE but operate
different e-Procurement system.
5. LGM-1
City/municipal government. Both agencies have LPSE and
operate SPSE as their e-Procurement system.
6. LGM-2
7. LGS-1
8. LGS-2
9. UGL-1 Government-owned university. This agency has LPSE and
operates SPSE.
10. UGS-1
Government-owned university. This agency doesn’t have LPSE
but operate SPSE as their e-Procurement system by utilizing
other government owned university’s LPSE
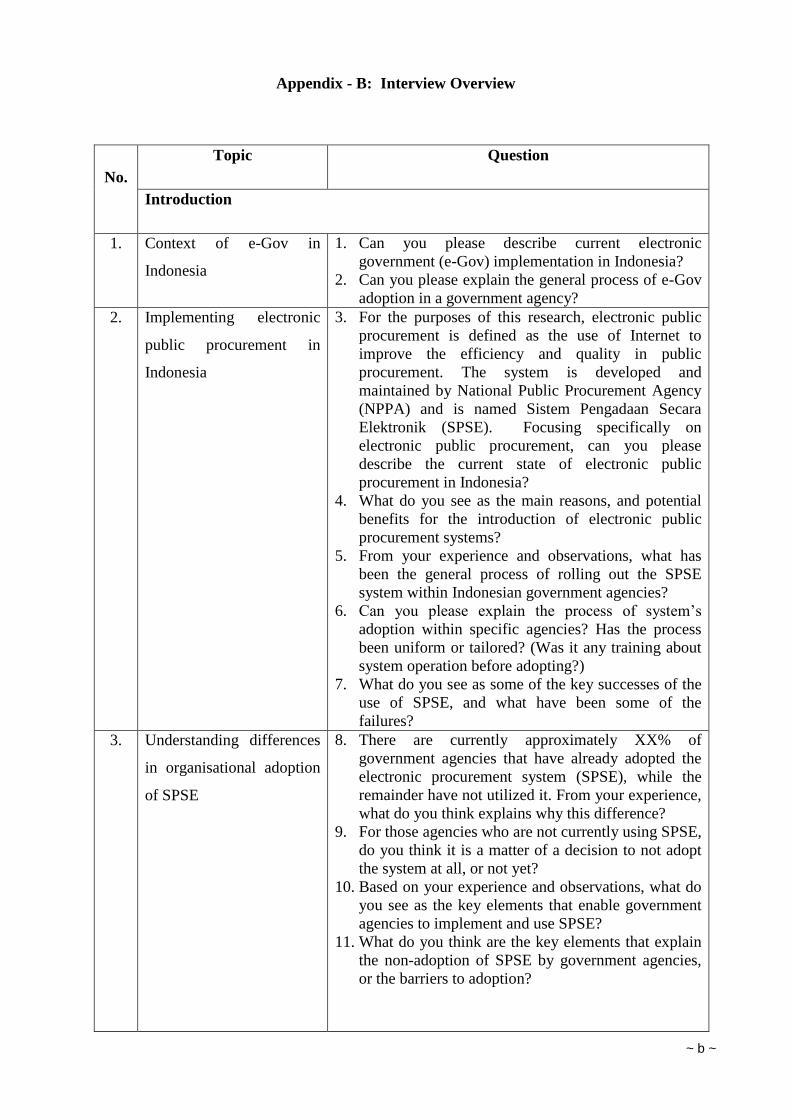
~ b ~
Appendix - B: Interview Overview
No.
Topic Question
Introduction
1. Context of e-Gov in
Indonesia
1. Can you please describe current electronic
government (e-Gov) implementation in Indonesia?
2. Can you please explain the general process of e-Gov
adoption in a government agency?
2. Implementing electronic
public procurement in
Indonesia
3. For the purposes of this research, electronic public
procurement is defined as the use of Internet to
improve the efficiency and quality in public
procurement. The system is developed and
maintained by National Public Procurement Agency
(NPPA) and is named Sistem Pengadaan Secara
Elektronik (SPSE). Focusing specifically on
electronic public procurement, can you please
describe the current state of electronic public
procurement in Indonesia?
4. What do you see as the main reasons, and potential
benefits for the introduction of electronic public
procurement systems?
5. From your experience and observations, what has
been the general process of rolling out the SPSE
system within Indonesian government agencies?
6. Can you please explain the process of system’s
adoption within specific agencies? Has the process
been uniform or tailored? (Was it any training about
system operation before adopting?)
7. What do you see as some of the key successes of the
use of SPSE, and what have been some of the
failures?
3. Understanding differences
in organisational adoption
of SPSE
8. There are currently approximately XX% of
government agencies that have already adopted the
electronic procurement system (SPSE), while the
remainder have not utilized it. From your experience,
what do you think explains why this difference?
9. For those agencies who are not currently using SPSE,
do you think it is a matter of a decision to not adopt
the system at all, or not yet?
10. Based on your experience and observations, what do
you see as the key elements that enable government
agencies to implement and use SPSE?
11. What do you think are the key elements that explain
the non-adoption of SPSE by government agencies,
or the barriers to adoption?
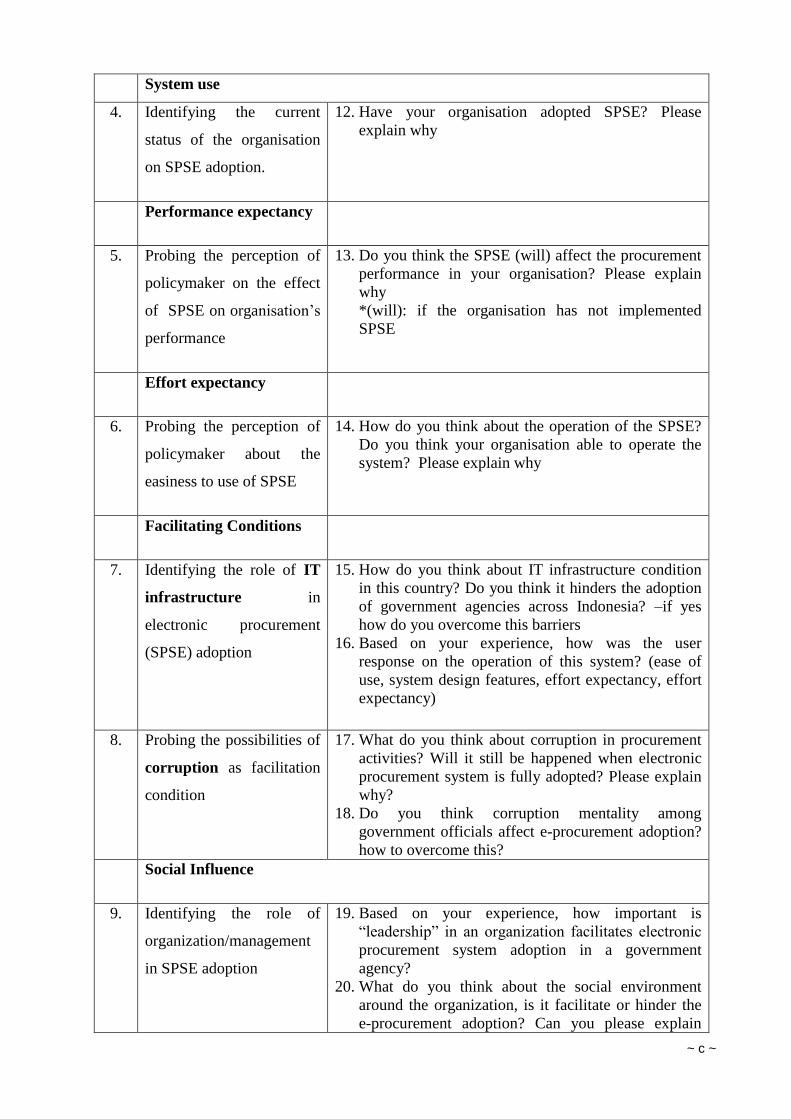
~ c ~
System use
4. Identifying the current
status of the organisation
on SPSE adoption.
12. Have your organisation adopted SPSE? Please
explain why
Performance expectancy
5. Probing the perception of
policymaker on the effect
of SPSE on organisation’s
performance
13. Do you think the SPSE (will) affect the procurement
performance in your organisation? Please explain
why
*(will): if the organisation has not implemented
SPSE
Effort expectancy
6. Probing the perception of
policymaker about the
easiness to use of SPSE
14. How do you think about the operation of the SPSE?
Do you think your organisation able to operate the
system? Please explain why
Facilitating Conditions
7. Identifying the role of IT
infrastructure in
electronic procurement
(SPSE) adoption
15. How do you think about IT infrastructure condition
in this country? Do you think it hinders the adoption
of government agencies across Indonesia? –if yes
how do you overcome this barriers
16. Based on your experience, how was the user
response on the operation of this system? (ease of
use, system design features, effort expectancy, effort
expectancy)
8. Probing the possibilities of
corruption as facilitation
condition
17. What do you think about corruption in procurement
activities? Will it still be happened when electronic
procurement system is fully adopted? Please explain
why?
18. Do you think corruption mentality among
government officials affect e-procurement adoption?
how to overcome this?
Social Influence
9. Identifying the role of
organization/management
in SPSE adoption
19. Based on your experience, how important is
“leadership” in an organization facilitates electronic
procurement system adoption in a government
agency?
20. What do you think about the social environment
around the organization, is it facilitate or hinder the
e-procurement adoption? Can you please explain
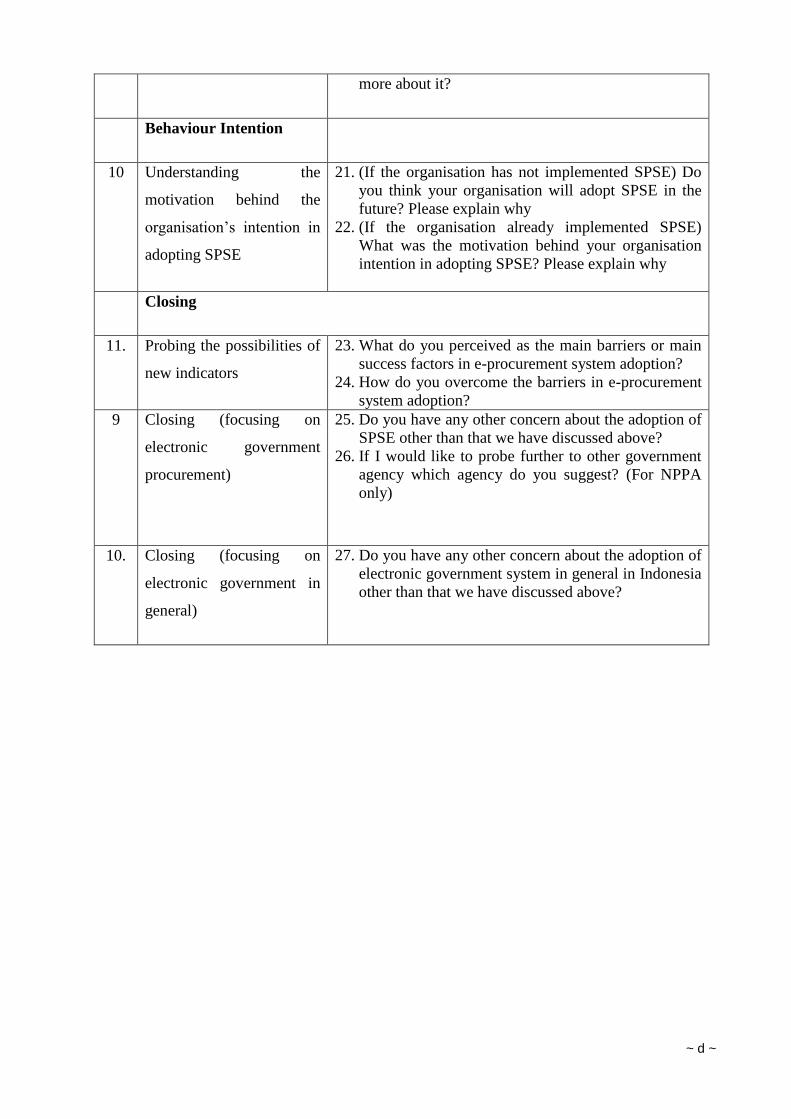
~ d ~
more about it?
Behaviour Intention
10 Understanding the
motivation behind the
organisation’s intention in
adopting SPSE
21. (If the organisation has not implemented SPSE) Do
you think your organisation will adopt SPSE in the
future? Please explain why
22. (If the organisation already implemented SPSE)
What was the motivation behind your organisation
intention in adopting SPSE? Please explain why
Closing
11. Probing the possibilities of
new indicators
23. What do you perceived as the main barriers or main
success factors in e-procurement system adoption?
24. How do you overcome the barriers in e-procurement
system adoption?
9 Closing (focusing on
electronic government
procurement)
25. Do you have any other concern about the adoption of
SPSE other than that we have discussed above?
26. If I would like to probe further to other government
agency which agency do you suggest? (For NPPA
only)
10. Closing (focusing on
electronic government in
general)
27. Do you have any other concern about the adoption of
electronic government system in general in Indonesia
other than that we have discussed above?
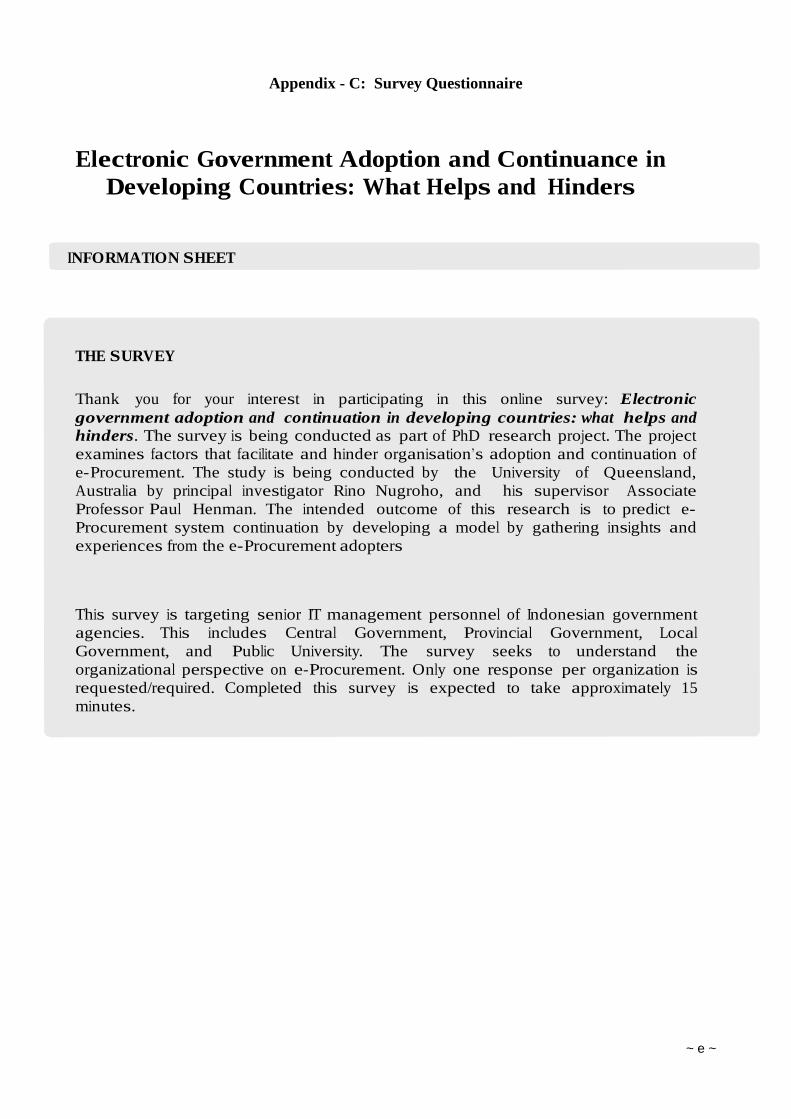
~ e ~
Appendix - C: Survey Questionnaire
Electronic Government Adoption and Continuance in
Developing Countries: What Helps and Hinders
THE SURVEY
Thank you for your interest in participating in this online survey: Electronic
government adoption and continuation in developing countries: what helps and
hinders. The survey is being conducted as part of PhD research project. The project
examines factors that facilitate and hinder organisation’s adoption and continuation of
e-Procurement. The study is being conducted by the University of Queensland,
Australia by principal investigator Rino Nugroho, and his supervisor Associate
Professor Paul Henman. The intended outcome of this research is to predict e-
Procurement system continuation by developing a model by gathering insights and
experiences from the e-Procurement adopters
This survey is targeting senior IT management personnel of Indonesian government
agencies. This includes Central Government, Provincial Government, Local
Government, and Public University. The survey seeks to understand the
organizational perspective on e-Procurement. Only one response per organization is
requested/required. Completed this survey is expected to take approximately 15
minutes.
INFORMATION SHEET
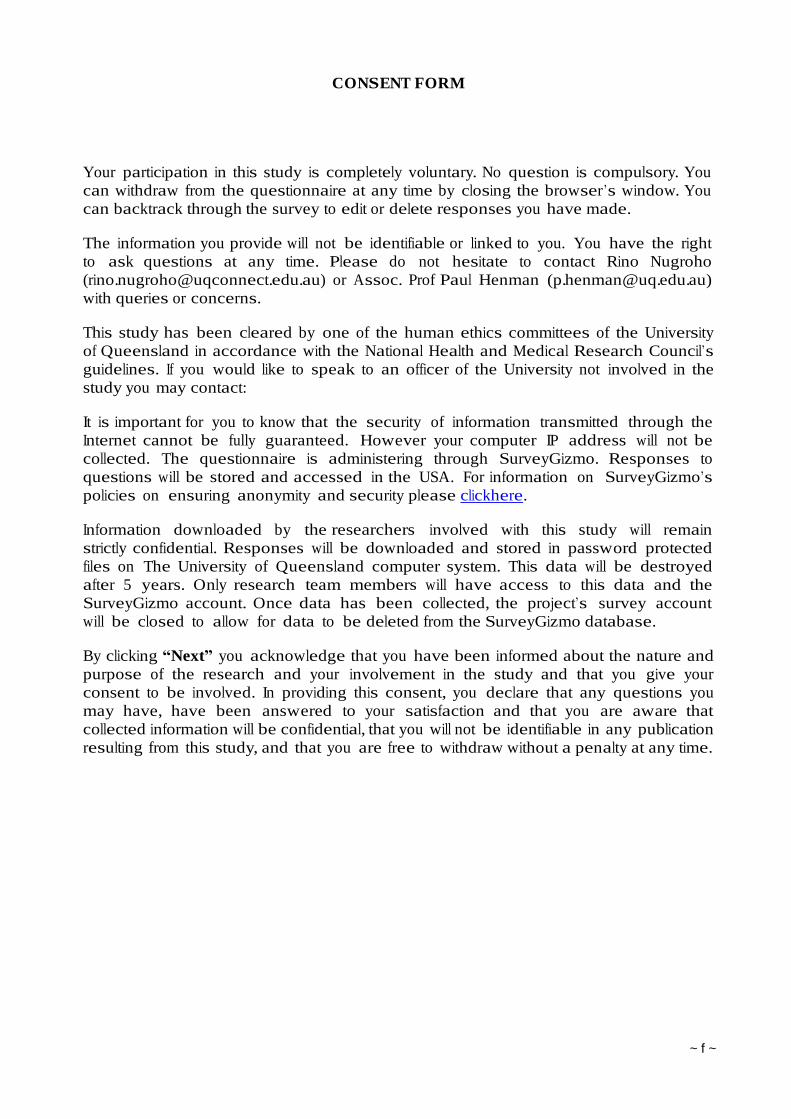
~ f ~
CONSENT FORM
Your participation in this study is completely voluntary. No question is compulsory. You
can withdraw from the questionnaire at any time by closing the browser’s window. You
can backtrack through the survey to edit or delete responses you have made.
The information you provide will not be identifiable or linked to you. You have the right
to ask questions at any time. Please do not hesitate to contact Rino Nugroho
([email protected]) or Assoc. Prof Paul Henman ([email protected])
with queries or concerns.
This study has been cleared by one of the human ethics committees of the University
of Queensland in accordance with the National Health and Medical Research Council’s
guidelines. If you would like to speak to an officer of the University not involved in the
study you may contact:
It is important for you to know that the security of information transmitted through the
Internet cannot be fully guaranteed. However your computer IP address will not be
collected. The questionnaire is administering through SurveyGizmo. Responses to
questions will be stored and accessed in the USA. For information on SurveyGizmo’s
policies on ensuring anonymity and security please click here.
Information downloaded by the researchers involved with this study will remain
strictly confidential. Responses will be downloaded and stored in password protected
files on The University of Queensland computer system. This data will be destroyed
after 5 years. Only research team members will have access to this data and the
SurveyGizmo account. Once data has been collected, the project’s survey account
will be closed to allow for data to be deleted from the SurveyGizmo database.
By clicking “Next” you acknowledge that you have been informed about the nature and
purpose of the research and your involvement in the study and that you give your
consent to be involved. In providing this consent, you declare that any questions you
may have, have been answered to your satisfaction and that you are aware that
collected information will be confidential, that you will not be identifiable in any publication
resulting from this study, and that you are free to withdraw without a penalty at any time.
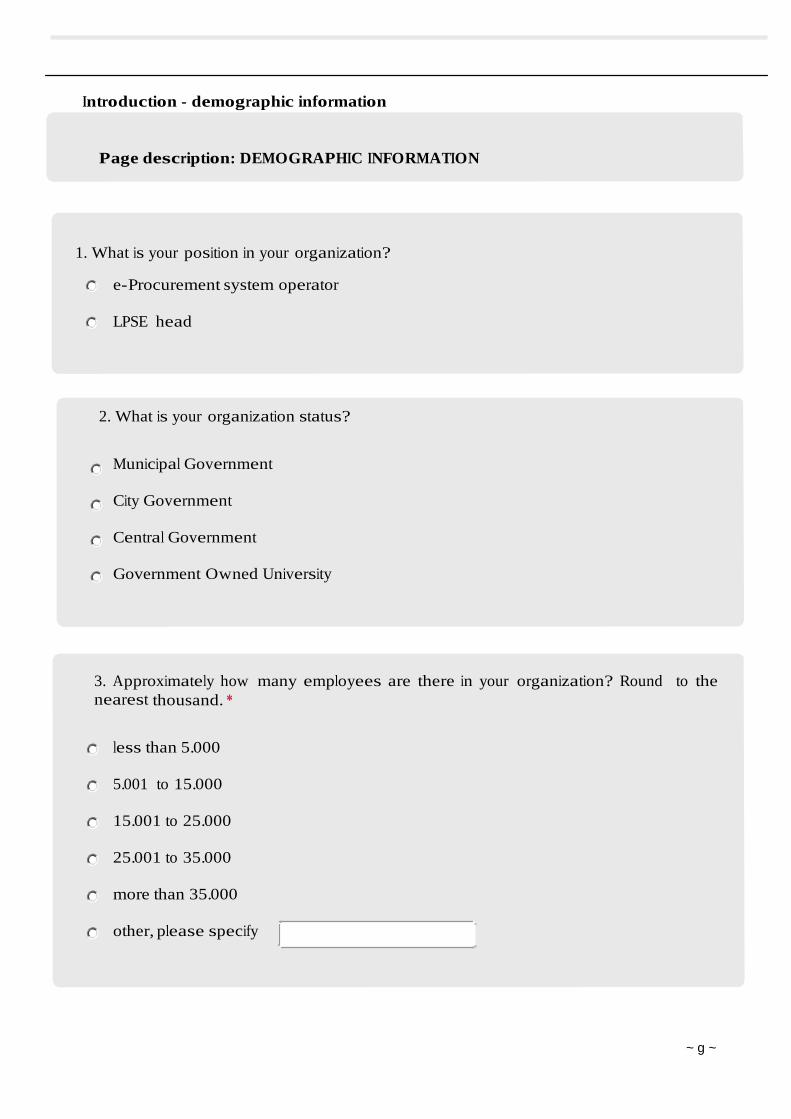
~ g ~
Introduction - demographic information
Page description: DEMOGRAPHIC INFORMATION
1. What is your position in your organization?
e-Procurement system operator
LPSE head
2. What is your organization status?
Municipal Government
City Government
Central Government
Government Owned University
3. Approximately how many employees are there in your organization? Round to the
nearest thousand. *
less than 5.000
5.001 to 15.000
15.001 to 25.000
25.001 to 35.000
more than 35.000
other, please specify
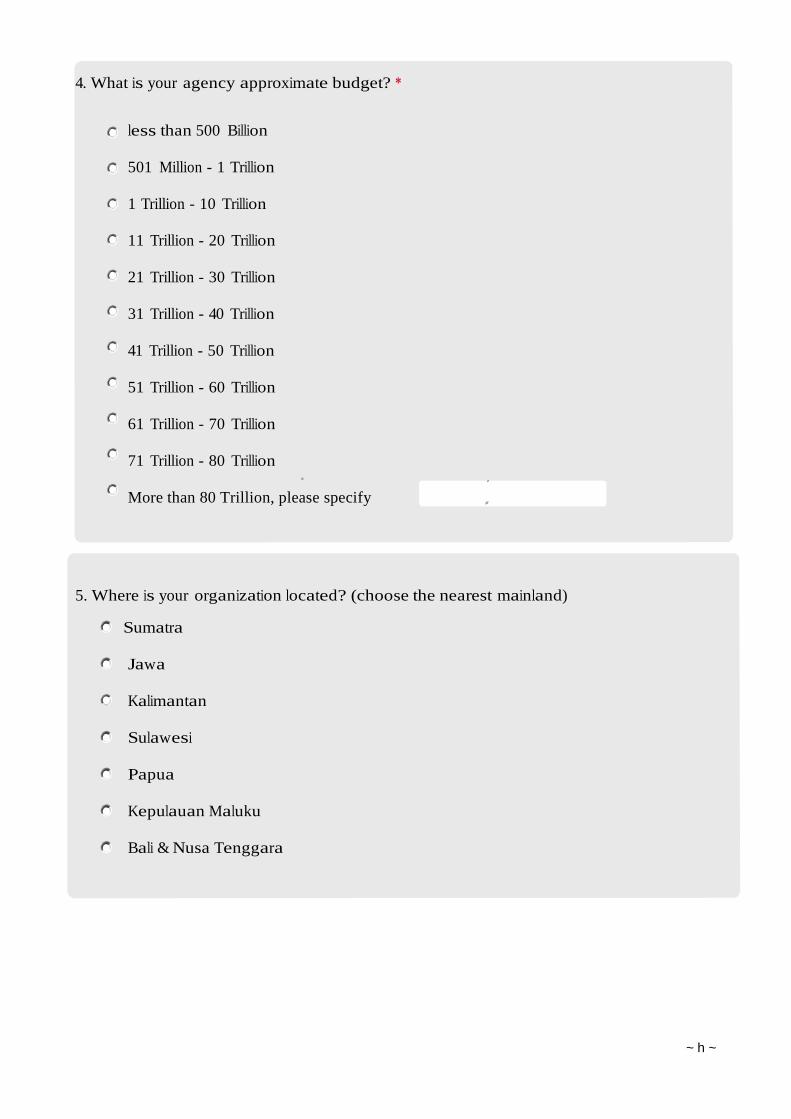
~ h ~
4. What is your agency approximate budget? *
less than 500 Billion
501 Million - 1 Trillion
1 Trillion - 10 Trillion
11 Trillion - 20 Trillion
21 Trillion - 30 Trillion
31 Trillion - 40 Trillion
41 Trillion - 50 Trillion
51 Trillion - 60 Trillion
61 Trillion - 70 Trillion
71 Trillion - 80 Trillion
More than 80 Trillion, please specify
5. Where is your organization located? (choose the nearest mainland)
Sumatra
Jawa
Kalimantan
Sulawesi
Papua
Kepulauan Maluku
Bali & Nusa Tenggara
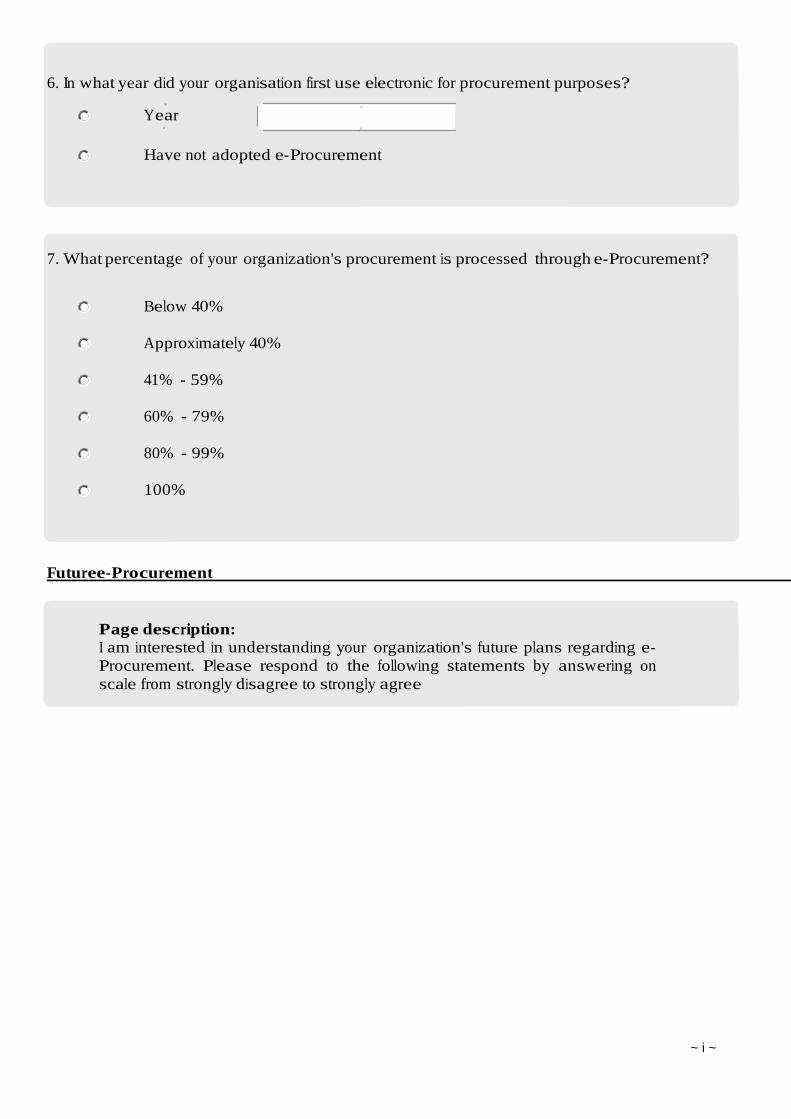
~ i ~
6. In what year did your organisation first use electronic for procurement purposes?
Year
Have not adopted e-Procurement
7. What percentage of your organization's procurement is processed through e-Procurement?
Below 40%
Approximately 40%
41% - 59%
60% - 79%
80% - 99%
100%
Future e-Procurement
Page description: I am interested in understanding your organization's future plans regarding e-
Procurement. Please respond to the following statements by answering on
scale from strongly disagree to strongly agree
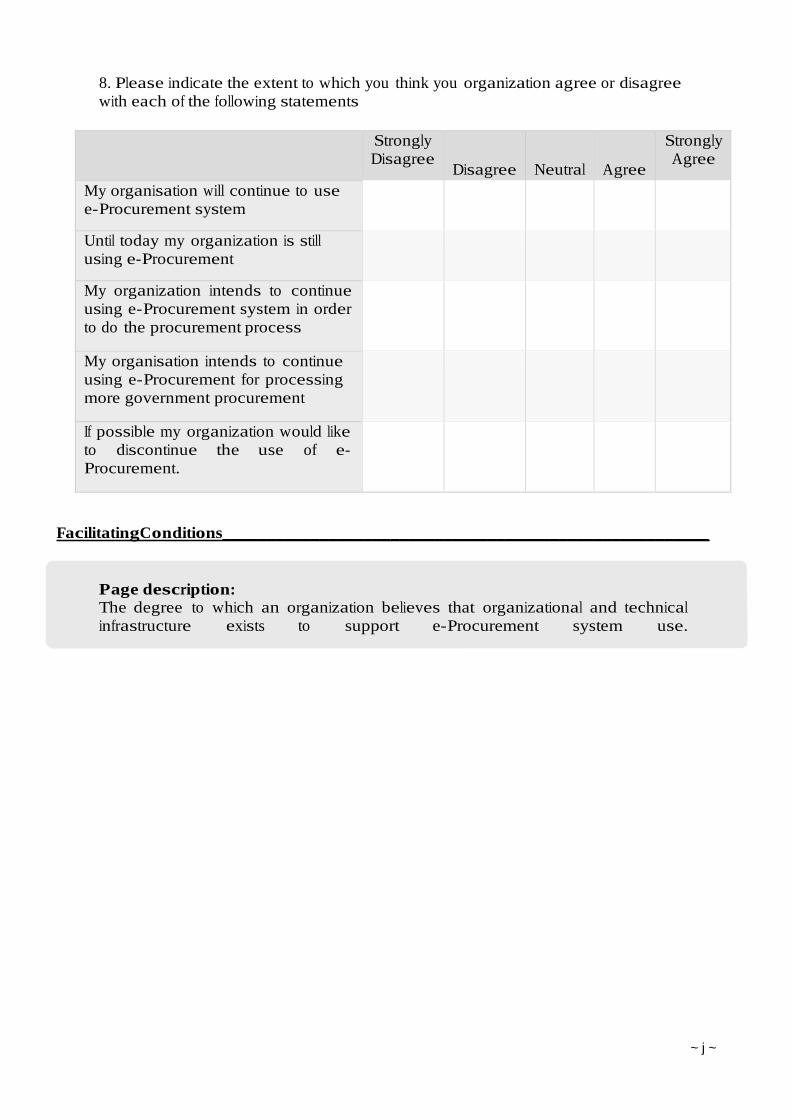
~ j ~
8. Please indicate the extent to which you think you organization agree or disagree
with each of the following statements
Strongly
Disagree
Disagree
Neutral
Agree
Strongly
Agree
My organisation will continue to use
e-Procurement system
Until today my organization is still
using e-Procurement
My organization intends to continue
using e-Procurement system in order
to do the procurement process
My organisation intends to continue
using e-Procurement for processing
more government procurement
If possible my organization would like
to discontinue the use of e-
Procurement.
Facilitating Conditions_______________________________________________________
Page description: The degree to which an organization believes that organizational and technical
infrastructure exists to support e-Procurement system use.
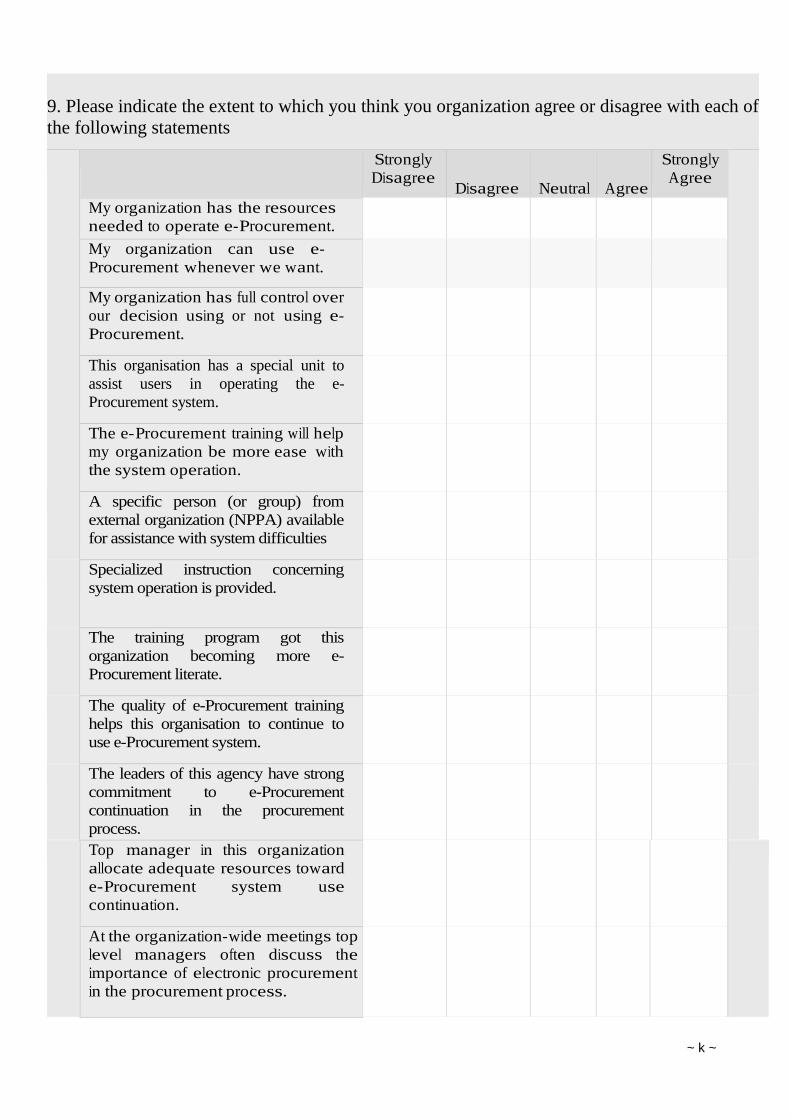
~ k ~
9. Please indicate the extent to which you think you organization agree or disagree with each of
the following statements
Strongly
Disagree
Disagree
Neutral
Agree
Strongly
Agree
My organization has the resources
needed to operate e-Procurement.
My organization can use e-
Procurement whenever we want.
My organization has full control over
our decision using or not using e-
Procurement.
This organisation has a special unit to
assist users in operating the e-
Procurement system.
The e-Procurement training will help
my organization be more ease with
the system operation.
A specific person (or group) from
external organization (NPPA) available
for assistance with system difficulties
Specialized instruction concerning
system operation is provided.
The training program got this
organization becoming more e-
Procurement literate.
The quality of e-Procurement training
helps this organisation to continue to
use e-Procurement system.
The leaders of this agency have strong
commitment to e-Procurement
continuation in the procurement
process.
Top manager in this organization
allocate adequate resources toward
e-Procurement system use
continuation.
At the organization-wide meetings top
level managers often discuss the
importance of electronic procurement
in the procurement process.
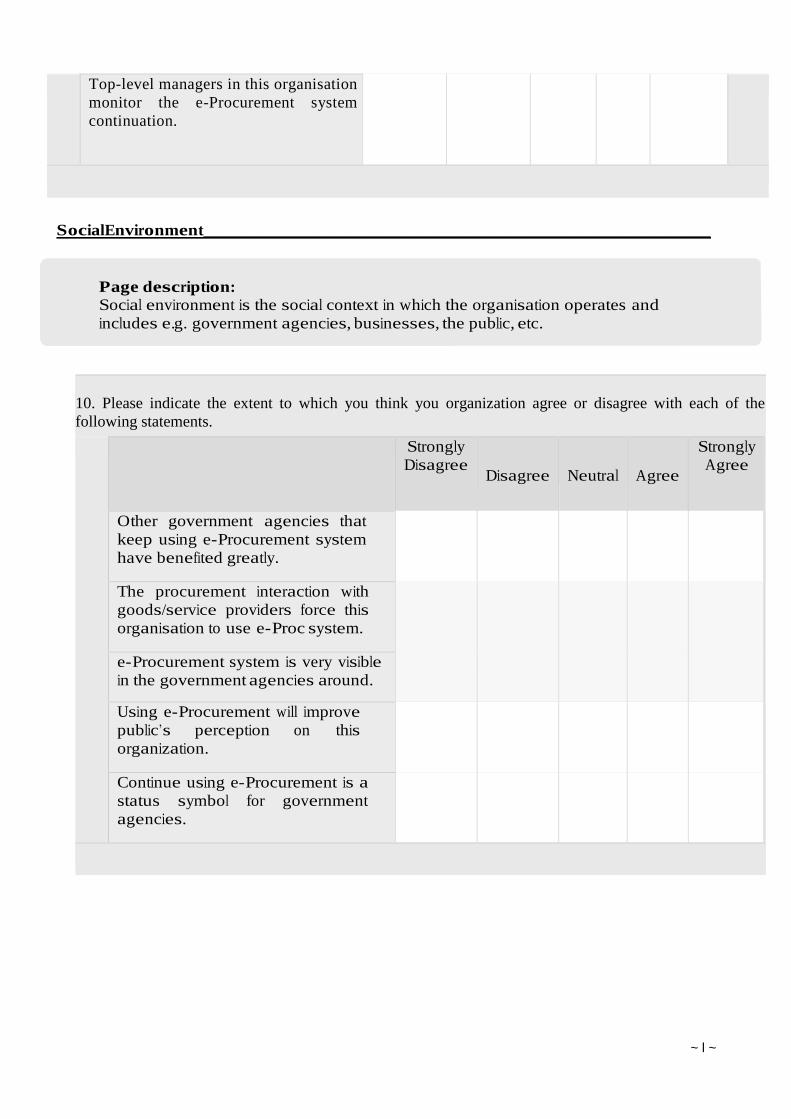
~ l ~
Top-level managers in this organisation
monitor the e-Procurement system
continuation.
Social Environment_______________________________________________________________
Page description: Social environment is the social context in which the organisation operates and
includes e.g. government agencies, businesses, the public, etc.
10. Please indicate the extent to which you think you organization agree or disagree with each of the
following statements.
Strongly
Disagree
Disagree
Neutral
Agree
Strongly
Agree
Other government agencies that
keep using e-Procurement system
have benefited greatly.
The procurement interaction with
goods/service providers force this
organisation to use e-Proc system.
e-Procurement system is very visible
in the government agencies around.
Using e-Procurement will improve
public’s perception on this
organization.
Continue using e-Procurement is a
status symbol for government
agencies.
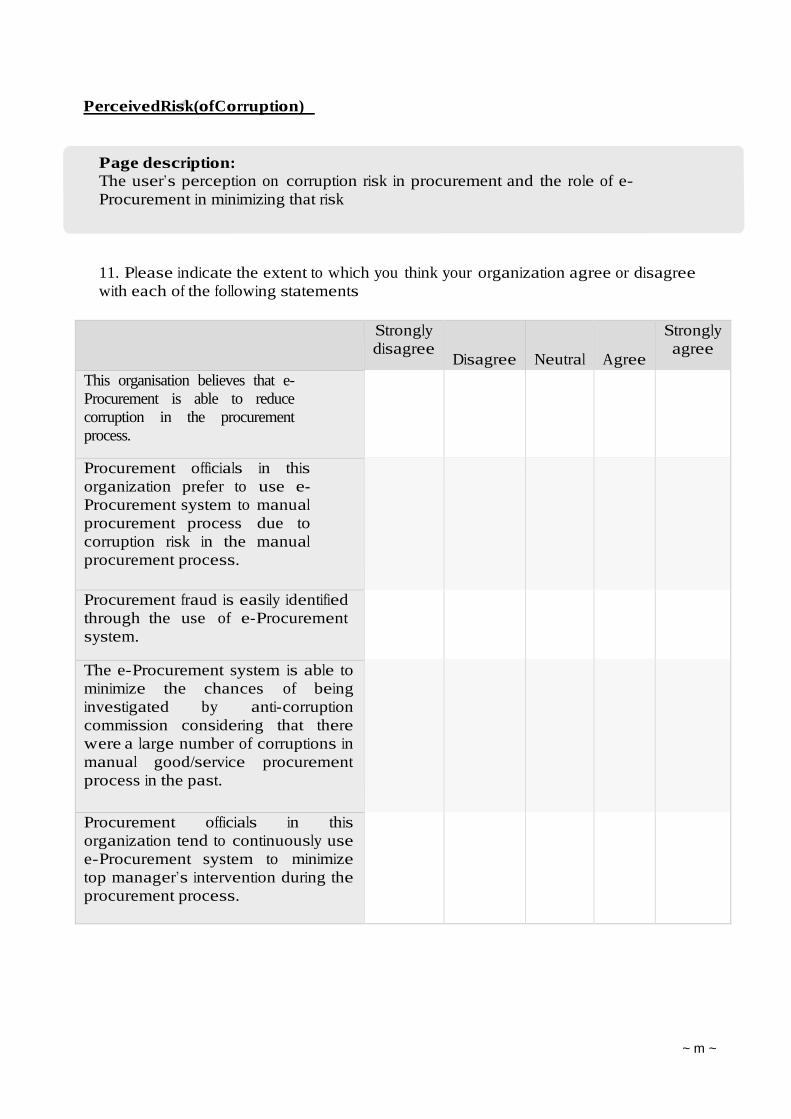
~ m ~
Perceived Risk (of Corruption)
Page description: The user’s perception on corruption risk in procurement and the role of e-
Procurement in minimizing that risk
11. Please indicate the extent to which you think your organization agree or disagree
with each of the following statements
Strongly
disagree
Disagree
Neutral
Agree
Strongly
agree
This organisation believes that e-
Procurement is able to reduce
corruption in the procurement
process.
Procurement officials in this
organization prefer to use e-
Procurement system to manual
procurement process due to
corruption risk in the manual
procurement process.
Procurement fraud is easily identified
through the use of e-Procurement
system.
The e-Procurement system is able to
minimize the chances of being
investigated by anti-corruption
commission considering that there
were a large number of corruptions in
manual good/service procurement
process in the past.
Procurement officials in this
organization tend to continuously use
e-Procurement system to minimize
top manager’s intervention during the
procurement process.
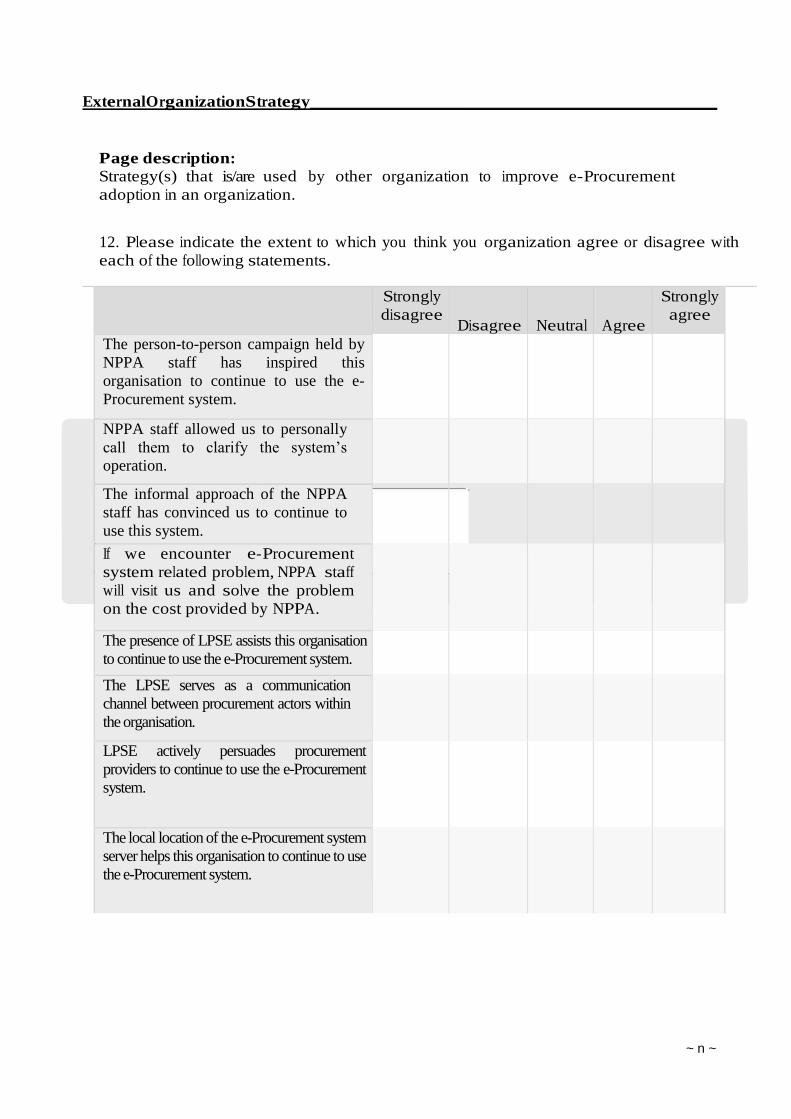
~ n ~
External Organization Strategy___________________________________________________
Page description: Strategy(s) that is/are used by other organization to improve e-Procurement
adoption in an organization.
12. Please indicate the extent to which you think you organization agree or disagree with
each of the following statements.
Strongly
disagree
Disagree
Neutral
Agree
Strongly
agree
The person-to-person campaign held by
NPPA staff has inspired this
organisation to continue to use the e-
Procurement system.
NPPA staff allowed us to personally
call them to clarify the system’s
operation.
The informal approach of the NPPA
staff has convinced us to continue to
use this system.
If we encounter e-Procurement
system related problem, NPPA staff
will visit us and solve the problem
on the cost provided by NPPA.
The presence of LPSE assists this organisation
to continue to use the e-Procurement system.
The LPSE serves as a communication
channel between procurement actors within
the organisation.
LPSE actively persuades procurement
providers to continue to use the e-Procurement
system.
The local location of the e-Procurement system
server helps this organisation to continue to use
the e-Procurement system.

~ o ~
13. If you have concern or opinion about e-Procurement other than that have been
stated, please write down here
Thank You!
Thank you for taking our survey. Your response is very important to us.
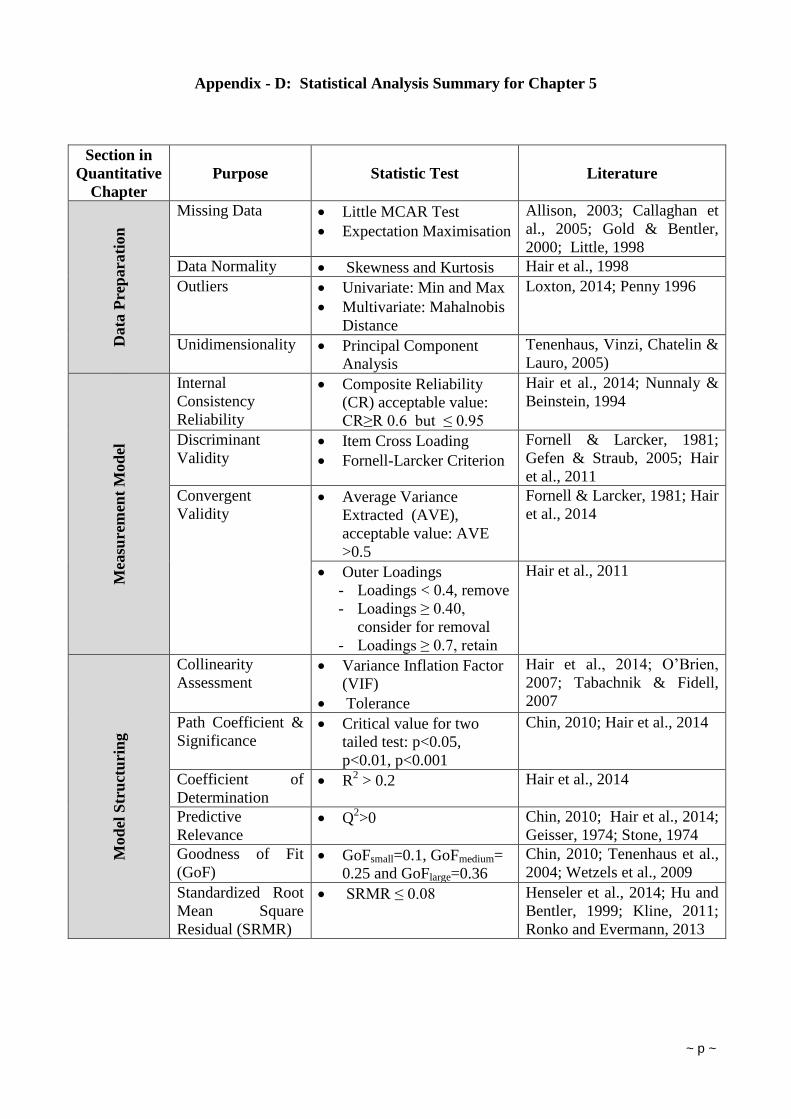
~ p ~
Appendix - D: Statistical Analysis Summary for Chapter 5
Section in
Quantitative
Chapter
Purpose Statistic Test Literature
Data
Pre
para
tion
Missing Data Little MCAR Test
Expectation Maximisation
Allison, 2003; Callaghan et
al., 2005; Gold & Bentler,
2000; Little, 1998
Data Normality Skewness and Kurtosis Hair et al., 1998
Outliers Univariate: Min and Max
Multivariate: Mahalnobis
Distance
Loxton, 2014; Penny 1996
Unidimensionality Principal Component
Analysis
Tenenhaus, Vinzi, Chatelin &
Lauro, 2005)
Mea
sure
men
t M
od
el
Internal
Consistency
Reliability
Composite Reliability
(CR) acceptable value:
CR≥R 0.6 but ≤ 0.95
Hair et al., 2014; Nunnaly &
Beinstein, 1994
Discriminant
Validity Item Cross Loading
Fornell-Larcker Criterion
Fornell & Larcker, 1981;
Gefen & Straub, 2005; Hair
et al., 2011
Convergent
Validity Average Variance
Extracted (AVE),
acceptable value: AVE
>0.5
Fornell & Larcker, 1981; Hair
et al., 2014
Outer Loadings
- Loadings < 0.4, remove
- Loadings ≥ 0.40,
consider for removal
- Loadings ≥ 0.7, retain
Hair et al., 2011
Mod
el S
tru
ctu
rin
g
Collinearity
Assessment Variance Inflation Factor
(VIF)
Tolerance
Hair et al., 2014; O’Brien,
2007; Tabachnik & Fidell,
2007
Path Coefficient &
Significance Critical value for two
tailed test: p<0.05,
p<0.01, p<0.001
Chin, 2010; Hair et al., 2014
Coefficient of
Determination R
2 > 0.2 Hair et al., 2014
Predictive
Relevance Q
2>0 Chin, 2010; Hair et al., 2014;
Geisser, 1974; Stone, 1974
Goodness of Fit
(GoF) GoFsmall=0.1, GoFmedium=
0.25 and GoFlarge=0.36
Chin, 2010; Tenenhaus et al.,
2004; Wetzels et al., 2009
Standardized Root
Mean Square
Residual (SRMR)
SRMR ≤ 0.08 Henseler et al., 2014; Hu and
Bentler, 1999; Kline, 2011;
Ronko and Evermann, 2013
~ q ~
Appendix - E: New Measurement Development Details
Validity and reliability tests should be conducted prior to using new measurements. An
online questionnaire was prepared in order to conduct an expert study. Sixteen experts on e-
Procurement and e-Government in Indonesia were recruited. They consisted of Indonesian
e-Government scholars, e-Procurement system users, NPPA senior officers, and public
procurement officials with experience in the procurement process. They were invited to fill
in the online questionnaire. For each new item question/statement (in Table 5.2), they were
asked to indicate which of the two new constructs (i.e., EOS and PRoC) they thought that
item sought to measure.
Eleven out of the 16 invited experts completely filled in the questionnaire. A table of
agreement was formed (see Table B.1). Initially, all the questions were included in the Fleiss
kappa calculation (Fleiss, 1971) with a resulting kappa value of 0.47. According to Landis
and Koch (1977), this may be inferred as moderate agreement between the raters about the
questions provided. In order to obtain a higher agreement, five questions with low
agreement from the table were deleted and the Fleiss kappa was recalculated, resulting in a
kappa value of 0.67, meaning that there was substantial agreement between the raters about
the questions provided. This ensured the reliability of the new measurements. The experts
agreed on six new measurements for external organisation strategy (EOS1, EOS2, EOS4,
EOS6, EOS7, EOS9) and four new measurements for perceived risk of corruption (PRoC1,
PRoC2, PRoC3, PRoC4).
The next step was to test the content validity. Lawshe’s (1975) content validity ratio (CVR)
test approach was followed to complete this process. Only item questions with high inter-
rater reliability were included; thus, only EOS1, EOS2, EOS4, EOS6, EOS7 and EOS9 for
external organisation strategy and PRoC1, PRoC2, PRoc3 and PRoc4 for perceived risk of
corruption were included in the Fleiss kappa calculation. For twelve respondents, this
technique required items with a CVR value above 0.56 to be statistically significant at 0.05
(Lawshe, 1975). All items received this level of significance (see Table B-1) and were used
for the larger survey.
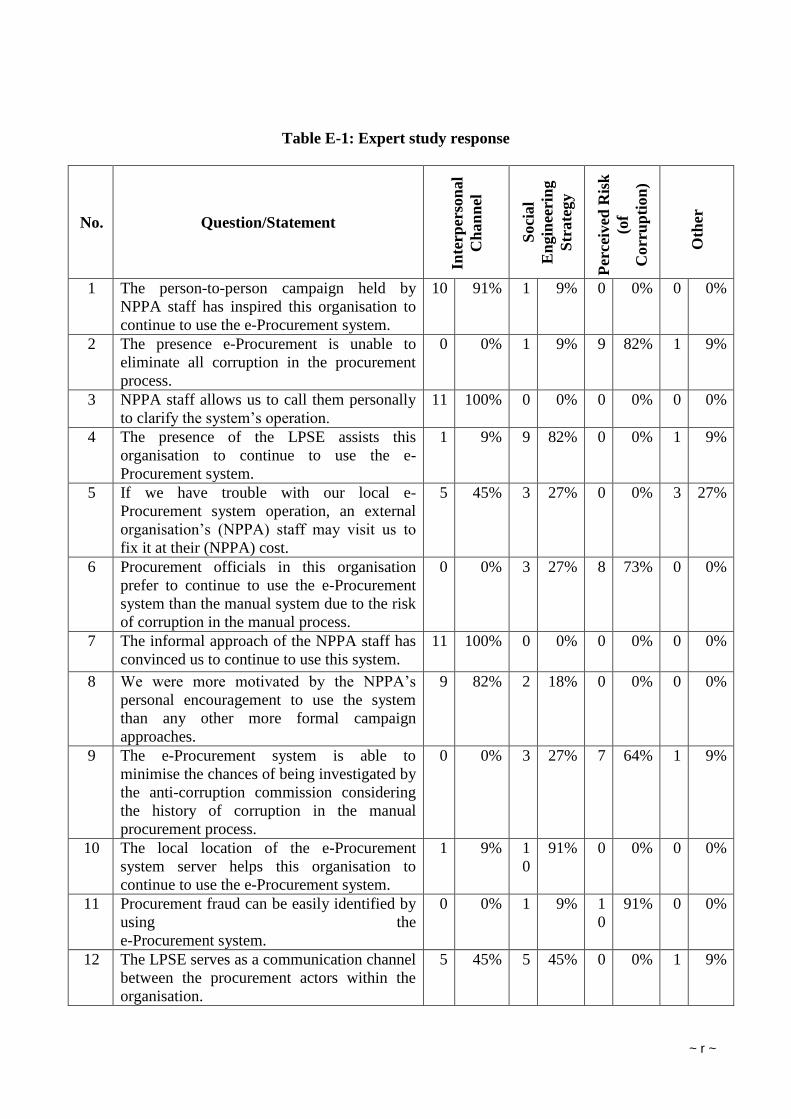
~ r ~
Table E-1: Expert study response
No. Question/Statement
Inte
rper
son
al
Ch
an
nel
Soci
al
En
gin
eeri
ng
Str
ate
gy
Per
cei
ved
Ris
k
(of
Corr
up
tion
)
Oth
er
1 The person-to-person campaign held by
NPPA staff has inspired this organisation to
continue to use the e-Procurement system.
10 91% 1 9% 0 0% 0 0%
2 The presence e-Procurement is unable to
eliminate all corruption in the procurement
process.
0 0% 1 9% 9 82% 1 9%
3 NPPA staff allows us to call them personally
to clarify the system’s operation.
11 100% 0 0% 0 0% 0 0%
4 The presence of the LPSE assists this
organisation to continue to use the e-
Procurement system.
1 9% 9 82% 0 0% 1 9%
5 If we have trouble with our local e-
Procurement system operation, an external
organisation’s (NPPA) staff may visit us to
fix it at their (NPPA) cost.
5 45% 3 27% 0 0% 3 27%
6 Procurement officials in this organisation
prefer to continue to use the e-Procurement
system than the manual system due to the risk
of corruption in the manual process.
0 0% 3 27% 8 73% 0 0%
7 The informal approach of the NPPA staff has
convinced us to continue to use this system.
11 100% 0 0% 0 0% 0 0%
8 We were more motivated by the NPPA’s
personal encouragement to use the system
than any other more formal campaign
approaches.
9 82% 2 18% 0 0% 0 0%
9 The e-Procurement system is able to
minimise the chances of being investigated by
the anti-corruption commission considering
the history of corruption in the manual
procurement process.
0 0% 3 27% 7 64% 1 9%
10 The local location of the e-Procurement
system server helps this organisation to
continue to use the e-Procurement system.
1 9% 1
0
91% 0 0% 0 0%
11 Procurement fraud can be easily identified by
using the
e-Procurement system.
0 0% 1 9% 1
0
91% 0 0%
12 The LPSE serves as a communication channel
between the procurement actors within the
organisation.
5 45% 5 45% 0 0% 1 9%
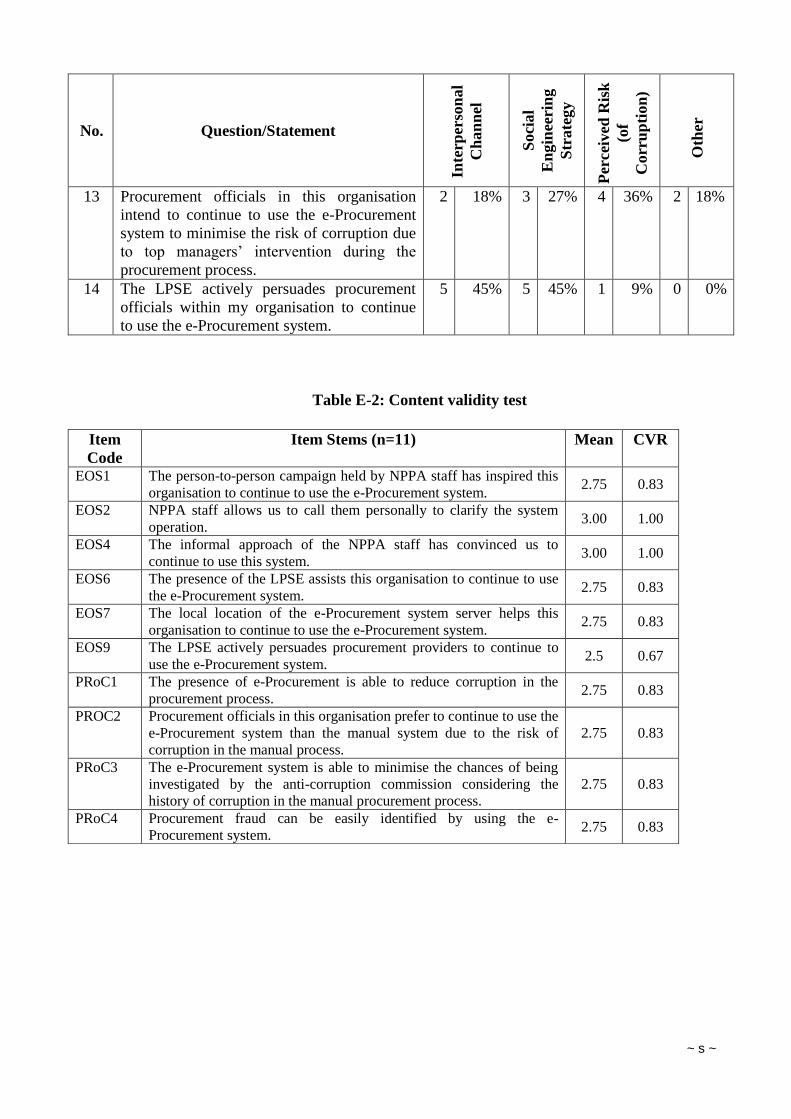
~ s ~
No. Question/Statement
Inte
rper
son
al
Ch
an
nel
Soci
al
En
gin
eeri
ng
Str
ate
gy
Per
cei
ved
Ris
k
(of
Corr
up
tion
)
Oth
er
13 Procurement officials in this organisation
intend to continue to use the e-Procurement
system to minimise the risk of corruption due
to top managers’ intervention during the
procurement process.
2 18% 3 27% 4 36% 2 18%
14 The LPSE actively persuades procurement
officials within my organisation to continue
to use the e-Procurement system.
5 45% 5 45% 1 9% 0 0%
Table E-2: Content validity test
Item
Code
Item Stems (n=11) Mean CVR
EOS1 The person-to-person campaign held by NPPA staff has inspired this
organisation to continue to use the e-Procurement system. 2.75 0.83
EOS2 NPPA staff allows us to call them personally to clarify the system
operation. 3.00 1.00
EOS4 The informal approach of the NPPA staff has convinced us to
continue to use this system. 3.00 1.00
EOS6 The presence of the LPSE assists this organisation to continue to use
the e-Procurement system. 2.75 0.83
EOS7 The local location of the e-Procurement system server helps this
organisation to continue to use the e-Procurement system. 2.75 0.83
EOS9 The LPSE actively persuades procurement providers to continue to
use the e-Procurement system. 2.5 0.67
PRoC1 The presence of e-Procurement is able to reduce corruption in the
procurement process. 2.75 0.83
PROC2 Procurement officials in this organisation prefer to continue to use the
e-Procurement system than the manual system due to the risk of
corruption in the manual process.
2.75 0.83
PRoC3 The e-Procurement system is able to minimise the chances of being
investigated by the anti-corruption commission considering the
history of corruption in the manual procurement process.
2.75 0.83
PRoC4 Procurement fraud can be easily identified by using the e-
Procurement system. 2.75 0.83
~ t ~
Appendix - F: Data Preparation Details
F.1. Data Preparation
There are standard procedures for preparing the data for SEM analysis, referring to missing data,
skewness and outliers (Kline, 2011). This section discusses the data preparation prior to data
analysis.
F.2. Initial Process – Data Coding
As a first step, the data in the surveygizmo database was downloaded in Excel format. The data was
carefully checked and coded. All the questions were changed into variable codes, ranging from Data
Demographic (DD) to perceived risk of corruption (PRoC). Similarly, all the responses to five point
Likert scales were coded into item scales and responses to demographic data into rank scales. Item
reversals were conducted in the items with reverse scores (CI3 and LA1). After the data coding
process was completed, the data preparation process began.
After the dataset was downloaded and coded, the raw data was then carefully observed. Some
respondents failed to answer some questions by leaving it blank or they chose “Don’t know” as
their answer for some items. Both types of responses were considered to be missing data, and the
following section explains how this missing data was treated. The dataset in Excel form was then
exported to statistics software. All the statistical processes for data preparation were conducted
using SPSS 21 (IBM, 2012).
F.3. Missing Data
Three respondents had more than 10 missing responses out of a total of 46 items: Respondent ID
(RespID) 227 (34 missing responses), RespID 277 (30 missing responses), and RespID 148 (11
missing responses). These three respondents were excluded from the dataset. This method is known
as listwise deletion (Kline, 2011, p. 55). Another concern when dealing with missing data in SEM is
whether the missing data is Missing Not At Random (MNAR), Missing at Random (MAR) or
Missing Completely at Random (MCAR) (Rubin, 1976). MAR occurs when the missing data in a
variable is related to another variable, but not with itself. MCAR occurs when the missing value in a
variable is independent of other variables. Other than those two criteria, the missing data is regarded
as MNAR (Enders, 2003; Kline, 2011; Loxton, 2014).
Little’s (1988) MCAR test was run using SPSS 21 as a preliminary test for missing-value analysis.
The result indicated that H0 was failed to reject, meaning that the MCAR hypothesis was accepted
(X2 = 27.83.93, df=2678, p =0.205). This condition means that the expectation maximisation (EM)
~ u ~
algorithm could be used to replace the missing values in the dataset (Enders, 2003). The EM
algorithm provides an unbiased estimation of missing data values (Callaghan et al., 2005). It is
favoured among missing data techniques as it is reliable regardless of the sample size, the
proportion of missing data and the characteristics of the data (Gold & Bentler, 2000). EM is part of
the maximum likelihood technique that is commonly used in SEM estimation (Allison, 2003).
F.4. Skewness and Kurtosis
Based on rules of thumb, a dataset is considered normal if the skewness and kurtosis values lie
between +/-1.96; any number outside the critical range is considered not normally distributed (Hair
et al., 1998). Using SPSS 21, the skewness and kurtosis values of the collected data were
calculated.. The descriptive table (see Table F-1) after the missing data treatment indicates kurtosis
in some variables: EMPL, BUDG, CI3,FC4, SI4, PRoC4, EoS9 and PE3 have kurtosis values more
than 1.96 or above the threshold. Other than those mentioned items, the data in the dataset was
considered normally distributed. The treatment for non-normal data was not conducted as it may
affect the final interpretation. This research used PLS-SEM which does not require data normality.
See Table C-1 for details.
F.5. Outliers
The presence of two types of outliers, namely, univariate and multivariate outliers, was tested.
Univariate outliers were checked using the minimum and maximum value of the data (Loxton,
2014). To do this, simple descriptive statistics was performed using SPSS 21. Based on the result,
no univariate outliers were detected (see Table C-1). The Mahalanobis distance test was then used
to test for multivariate outliers (Penny, 1996). The value of the Mahalanobis test result was then
compared with chi-square tables. With degree of freedom = 46, α= 0.001, chi-square = 81.400,
RespID 172 (98.790) and RespID 259 (152.039) were all above the chi-square critical cut-off point
values. These indicated multivariate outliers from the mentioned respondents. The common practice
to deal with multivariate outliers is deleting the item (Loxton, 2014). Therefore, these two responses
were deleted from the dataset for further analysis. The deletion assured the researcher that no
outliers were left in the dataset. In total, five responses were deleted due to missing data and
outliers. Later on in the data preparation, one more respondent (RespID 134) was deleted due to not
being included in the targeted respondents.
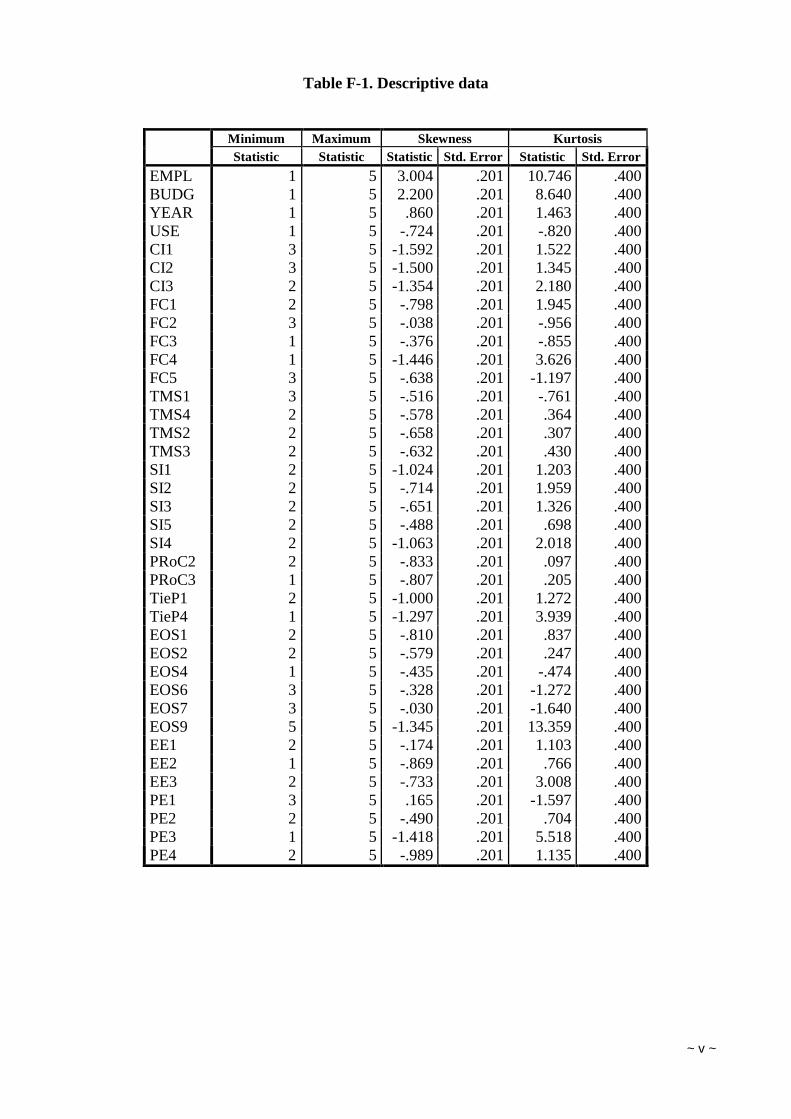
~ v ~
Table F-1. Descriptive data
Minimum Maximum Skewness Kurtosis
Statistic Statistic Statistic Std. Error Statistic Std. Error
EMPL 1 5 3.004 .201 10.746 .400
BUDG 1 5 2.200 .201 8.640 .400
YEAR 1 5 .860 .201 1.463 .400
USE 1 5 -.724 .201 -.820 .400
CI1 3 5 -1.592 .201 1.522 .400
CI2 3 5 -1.500 .201 1.345 .400
CI3 2 5 -1.354 .201 2.180 .400
FC1 2 5 -.798 .201 1.945 .400
FC2 3 5 -.038 .201 -.956 .400
FC3 1 5 -.376 .201 -.855 .400
FC4 1 5 -1.446 .201 3.626 .400
FC5 3 5 -.638 .201 -1.197 .400
TMS1 3 5 -.516 .201 -.761 .400
TMS4 2 5 -.578 .201 .364 .400
TMS2 2 5 -.658 .201 .307 .400
TMS3 2 5 -.632 .201 .430 .400
SI1 2 5 -1.024 .201 1.203 .400
SI2 2 5 -.714 .201 1.959 .400
SI3 2 5 -.651 .201 1.326 .400
SI5 2 5 -.488 .201 .698 .400
SI4 2 5 -1.063 .201 2.018 .400
PRoC2 2 5 -.833 .201 .097 .400
PRoC3 1 5 -.807 .201 .205 .400
TieP1 2 5 -1.000 .201 1.272 .400
TieP4 1 5 -1.297 .201 3.939 .400
EOS1 2 5 -.810 .201 .837 .400
EOS2 2 5 -.579 .201 .247 .400
EOS4 1 5 -.435 .201 -.474 .400
EOS6 3 5 -.328 .201 -1.272 .400
EOS7 3 5 -.030 .201 -1.640 .400
EOS9 5 5 -1.345 .201 13.359 .400
EE1 2 5 -.174 .201 1.103 .400
EE2 1 5 -.869 .201 .766 .400
EE3 2 5 -.733 .201 3.008 .400
PE1 3 5 .165 .201 -1.597 .400
PE2 2 5 -.490 .201 .704 .400
PE3 1 5 -1.418 .201 5.518 .400
PE4 2 5 -.989 .201 1.135 .400
~ w ~
Appendix - G: Unidimensionality Test
Exploratory Factor Analysis was conducted to test the unidimensionality of the constructs.
Unidimensionality is essential in the reflective measurement to ensure that the variables are
assumed to measure the same underlying concept (Wang, Meng & Tennenhaus, 2010). A construct
is unidimensional if the first eigenvalue is higher than 1 while the others are smaller (Kaiser’s rule
in Vinzi, Trinchera & Amato, 2010). Principal component analysis is a relevant method to examine
underlying indicators (Götz, Liehr-Gobbers, & Krafft, 2010).
The presentation of the unidimensionality test results is divided into three subsections: existing
constructs (facilitating conditions, social influence, performance expectancy and effort expectancy),
new constructs (external organisation strategy and perceived risk of corruption), and outcome
variables (continuance intention and level of adoption). The tests were conducted using SPSS 21
with principal component extraction.
G.1. Exogenous Variable: Pre-Existing Constructs
Factor analysis was deemed appropriate as indicated by all constructs' Bartlett’s Test of Sphericity
values being significant at p<0.001 level (Bartlett, 1954). Moreover all of the Kaiser-Meyer-Olkin
(KMO) measures of sampling adequacy were above the rule of thumb of 0.60 (Kaiser, 1974). Using
Kaiser’s recommendation, at least eigenvalues equal to 1 are retained. Using this rule, all latent
variables, PE, EE, FC, TMS and SI, were extracted into a single construct meaning that all
dimensions in each measurement formed one factor. This ensures the unidimensionality of all
constructs. Performance expectancy explained bigger variation on its construct than any other latent
variable in the existing construct with 84% total variance explained. On the other hand, social
influence explained 52% of the total variance. The other variables ranged between 58% (facilitating
conditions), 62% (effort expectancy), and 70% (top management support). Table G-1 presents these
results.
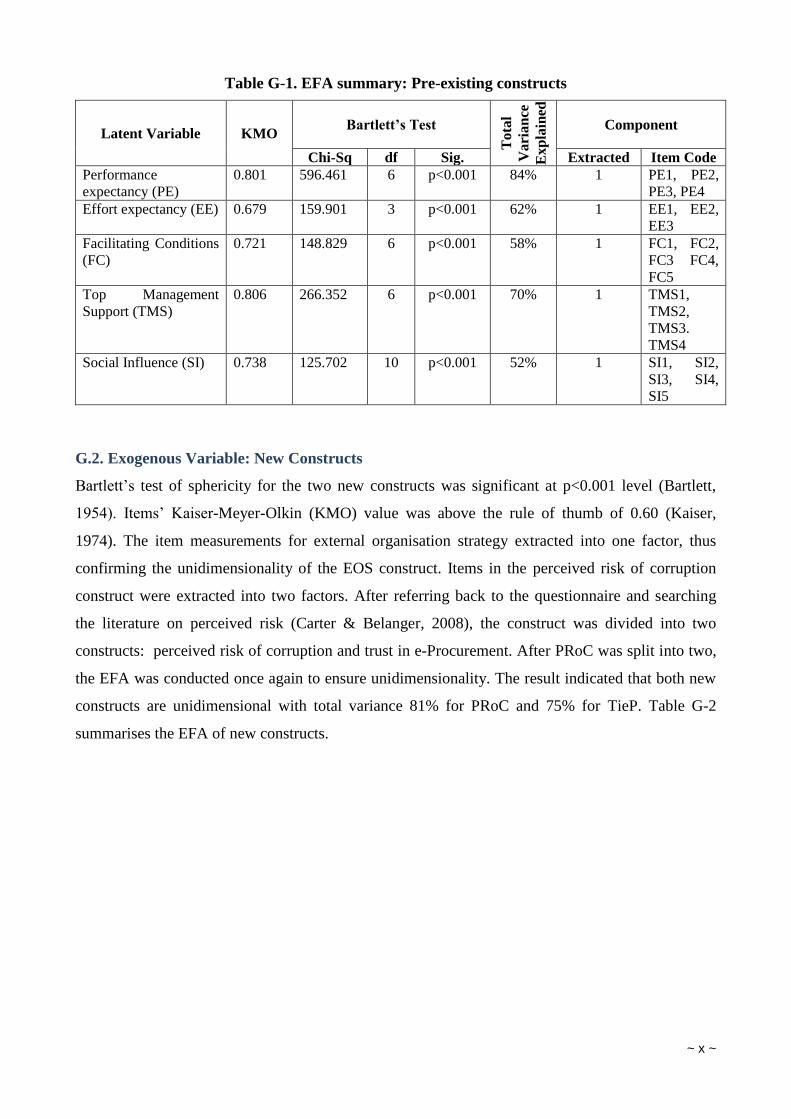
~ x ~
Table G-1. EFA summary: Pre-existing constructs
Latent Variable KMO Bartlett’s Test
To
tal
Va
ria
nce
Ex
pla
ined
Component
Chi-Sq df Sig. Extracted Item Code
Performance
expectancy (PE)
0.801
596.461 6 p<0.001 84% 1 PE1, PE2,
PE3, PE4
Effort expectancy (EE) 0.679 159.901 3 p<0.001 62% 1 EE1, EE2,
EE3
Facilitating Conditions
(FC)
0.721 148.829 6 p<0.001 58% 1 FC1, FC2,
FC3 FC4,
FC5
Top Management
Support (TMS)
0.806 266.352 6 p<0.001 70% 1 TMS1,
TMS2,
TMS3.
TMS4
Social Influence (SI) 0.738 125.702 10 p<0.001 52% 1 SI1, SI2,
SI3, SI4,
SI5
G.2. Exogenous Variable: New Constructs
Bartlett’s test of sphericity for the two new constructs was significant at p<0.001 level (Bartlett,
1954). Items’ Kaiser-Meyer-Olkin (KMO) value was above the rule of thumb of 0.60 (Kaiser,
1974). The item measurements for external organisation strategy extracted into one factor, thus
confirming the unidimensionality of the EOS construct. Items in the perceived risk of corruption
construct were extracted into two factors. After referring back to the questionnaire and searching
the literature on perceived risk (Carter & Belanger, 2008), the construct was divided into two
constructs: perceived risk of corruption and trust in e-Procurement. After PRoC was split into two,
the EFA was conducted once again to ensure unidimensionality. The result indicated that both new
constructs are unidimensional with total variance 81% for PRoC and 75% for TieP. Table G-2
summarises the EFA of new constructs.
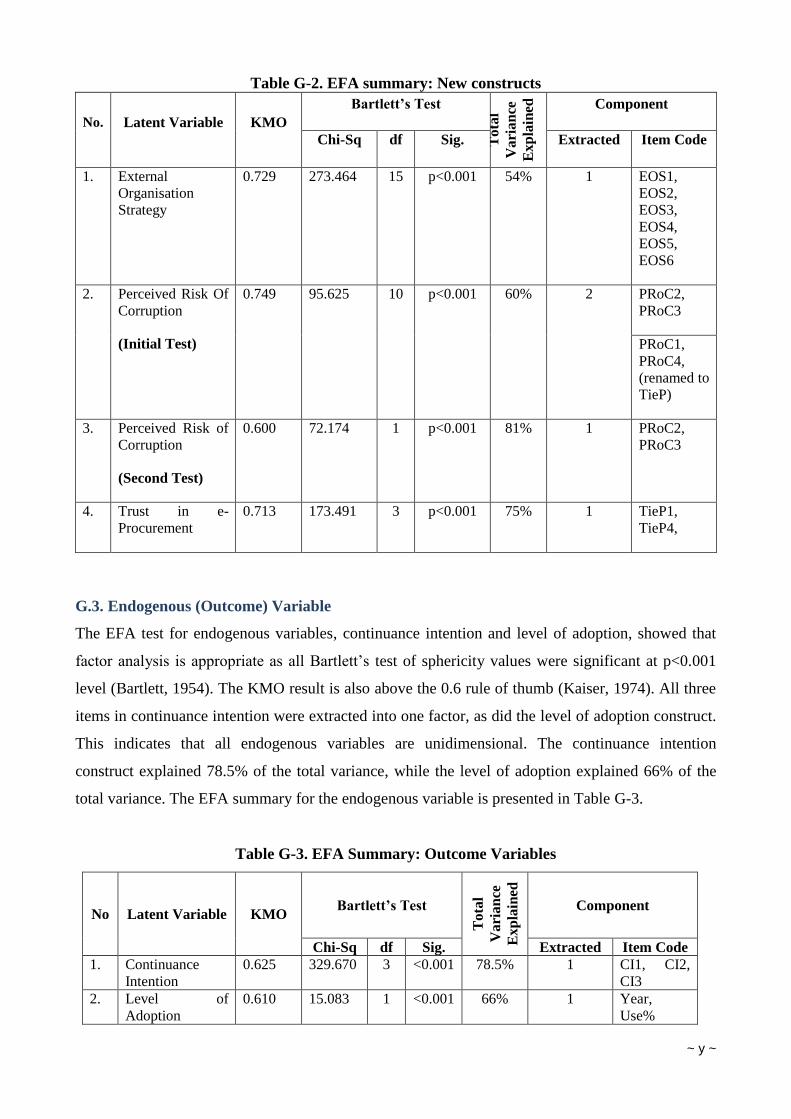
~ y ~
Table G-2. EFA summary: New constructs
No. Latent Variable KMO
Bartlett’s Test
To
tal
Va
ria
nce
Ex
pla
ined
Component
Chi-Sq df Sig. Extracted Item Code
1. External
Organisation
Strategy
0.729 273.464 15 p<0.001 54% 1 EOS1,
EOS2,
EOS3,
EOS4,
EOS5,
EOS6
2. Perceived Risk Of
Corruption
(Initial Test)
0.749 95.625 10 p<0.001 60% 2 PRoC2,
PRoC3
PRoC1,
PRoC4,
(renamed to
TieP)
3. Perceived Risk of
Corruption
(Second Test)
0.600 72.174 1 p<0.001 81% 1 PRoC2,
PRoC3
4. Trust in e-
Procurement
0.713 173.491 3 p<0.001 75% 1 TieP1,
TieP4,
G.3. Endogenous (Outcome) Variable
The EFA test for endogenous variables, continuance intention and level of adoption, showed that
factor analysis is appropriate as all Bartlett’s test of sphericity values were significant at p<0.001
level (Bartlett, 1954). The KMO result is also above the 0.6 rule of thumb (Kaiser, 1974). All three
items in continuance intention were extracted into one factor, as did the level of adoption construct.
This indicates that all endogenous variables are unidimensional. The continuance intention
construct explained 78.5% of the total variance, while the level of adoption explained 66% of the
total variance. The EFA summary for the endogenous variable is presented in Table G-3.
Table G-3. EFA Summary: Outcome Variables
No Latent Variable KMO Bartlett’s Test
To
tal
Va
ria
nce
Ex
pla
ined
Component
Chi-Sq df Sig. Extracted Item Code
1. Continuance
Intention
0.625 329.670 3 <0.001 78.5% 1 CI1, CI2,
CI3
2. Level of
Adoption
0.610 15.083 1 <0.001 66% 1 Year,
Use%
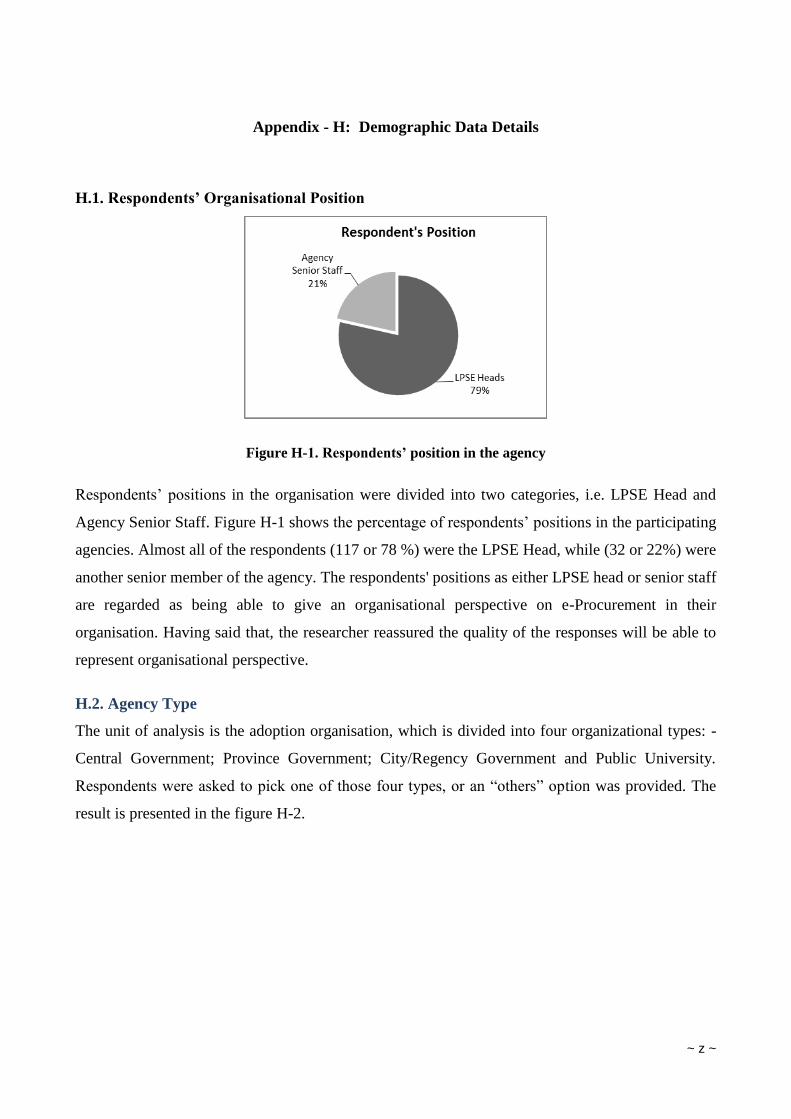
~ z ~
Appendix - H: Demographic Data Details
H.1. Respondents’ Organisational Position
Figure H-1. Respondents’ position in the agency
Respondents’ positions in the organisation were divided into two categories, i.e. LPSE Head and
Agency Senior Staff. Figure H-1 shows the percentage of respondents’ positions in the participating
agencies. Almost all of the respondents (117 or 78 %) were the LPSE Head, while (32 or 22%) were
another senior member of the agency. The respondents' positions as either LPSE head or senior staff
are regarded as being able to give an organisational perspective on e-Procurement in their
organisation. Having said that, the researcher reassured the quality of the responses will be able to
represent organisational perspective.
H.2. Agency Type
The unit of analysis is the adoption organisation, which is divided into four organizational types: -
Central Government; Province Government; City/Regency Government and Public University.
Respondents were asked to pick one of those four types, or an “others” option was provided. The
result is presented in the figure H-2.
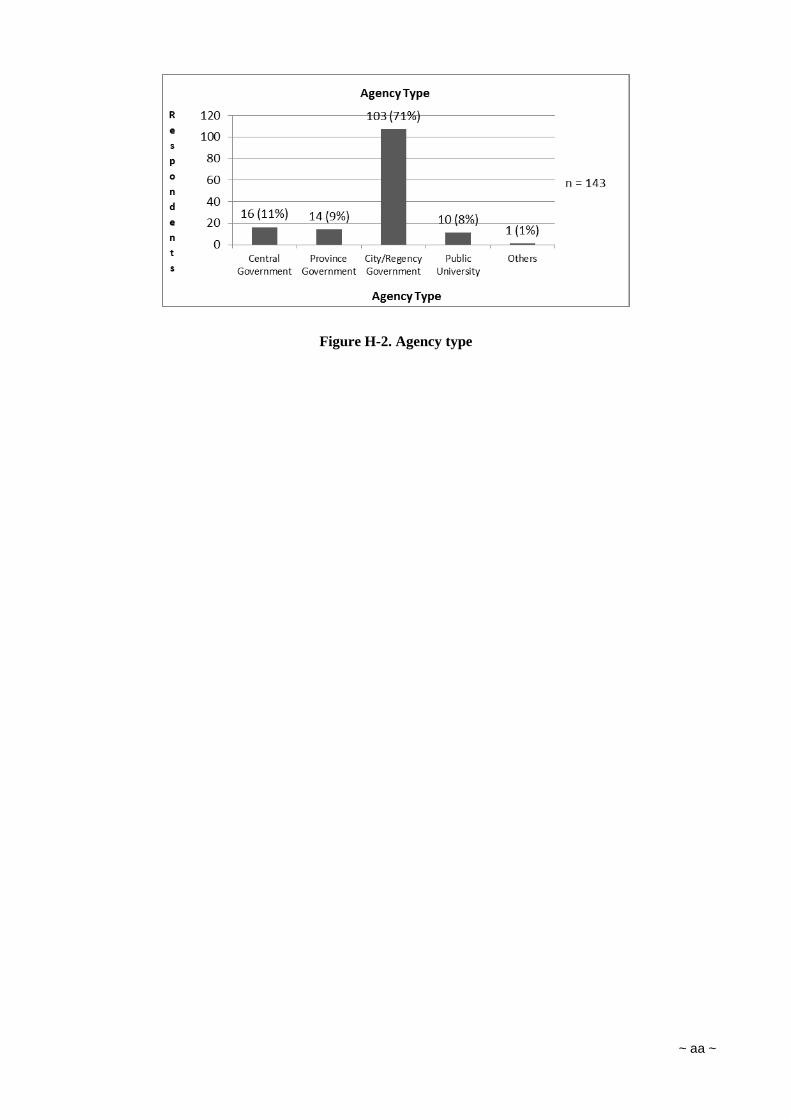
~ aa ~
Figure H-2. Agency type
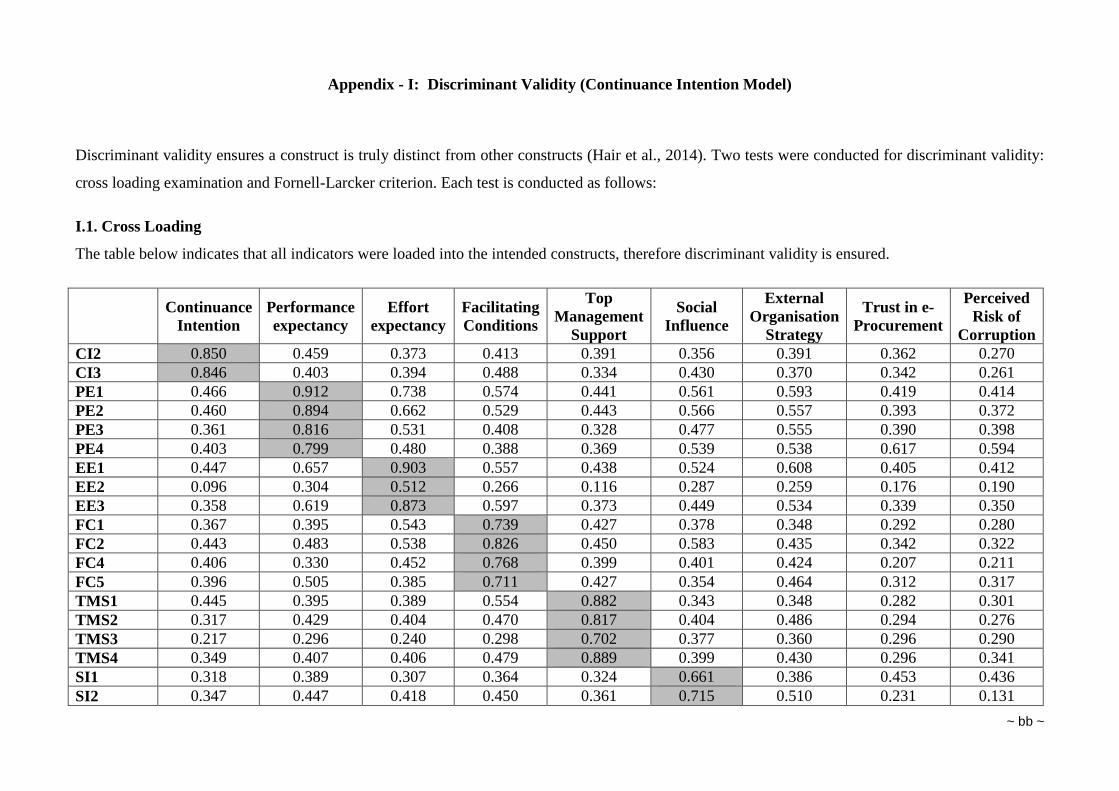
~ bb ~
Appendix - I: Discriminant Validity (Continuance Intention Model)
Discriminant validity ensures a construct is truly distinct from other constructs (Hair et al., 2014). Two tests were conducted for discriminant validity:
cross loading examination and Fornell-Larcker criterion. Each test is conducted as follows:
I.1. Cross Loading
The table below indicates that all indicators were loaded into the intended constructs, therefore discriminant validity is ensured.
Continuance
Intention
Performance
expectancy
Effort
expectancy
Facilitating
Conditions
Top
Management
Support
Social
Influence
External
Organisation
Strategy
Trust in e-
Procurement
Perceived
Risk of
Corruption
CI2 0.850 0.459 0.373 0.413 0.391 0.356 0.391 0.362 0.270
CI3 0.846 0.403 0.394 0.488 0.334 0.430 0.370 0.342 0.261
PE1 0.466 0.912 0.738 0.574 0.441 0.561 0.593 0.419 0.414
PE2 0.460 0.894 0.662 0.529 0.443 0.566 0.557 0.393 0.372
PE3 0.361 0.816 0.531 0.408 0.328 0.477 0.555 0.390 0.398
PE4 0.403 0.799 0.480 0.388 0.369 0.539 0.538 0.617 0.594
EE1 0.447 0.657 0.903 0.557 0.438 0.524 0.608 0.405 0.412
EE2 0.096 0.304 0.512 0.266 0.116 0.287 0.259 0.176 0.190
EE3 0.358 0.619 0.873 0.597 0.373 0.449 0.534 0.339 0.350
FC1 0.367 0.395 0.543 0.739 0.427 0.378 0.348 0.292 0.280
FC2 0.443 0.483 0.538 0.826 0.450 0.583 0.435 0.342 0.322
FC4 0.406 0.330 0.452 0.768 0.399 0.401 0.424 0.207 0.211
FC5 0.396 0.505 0.385 0.711 0.427 0.354 0.464 0.312 0.317
TMS1 0.445 0.395 0.389 0.554 0.882 0.343 0.348 0.282 0.301
TMS2 0.317 0.429 0.404 0.470 0.817 0.404 0.486 0.294 0.276
TMS3 0.217 0.296 0.240 0.298 0.702 0.377 0.360 0.296 0.290
TMS4 0.349 0.407 0.406 0.479 0.889 0.399 0.430 0.296 0.341
SI1 0.318 0.389 0.307 0.364 0.324 0.661 0.386 0.453 0.436
SI2 0.347 0.447 0.418 0.450 0.361 0.715 0.510 0.231 0.131
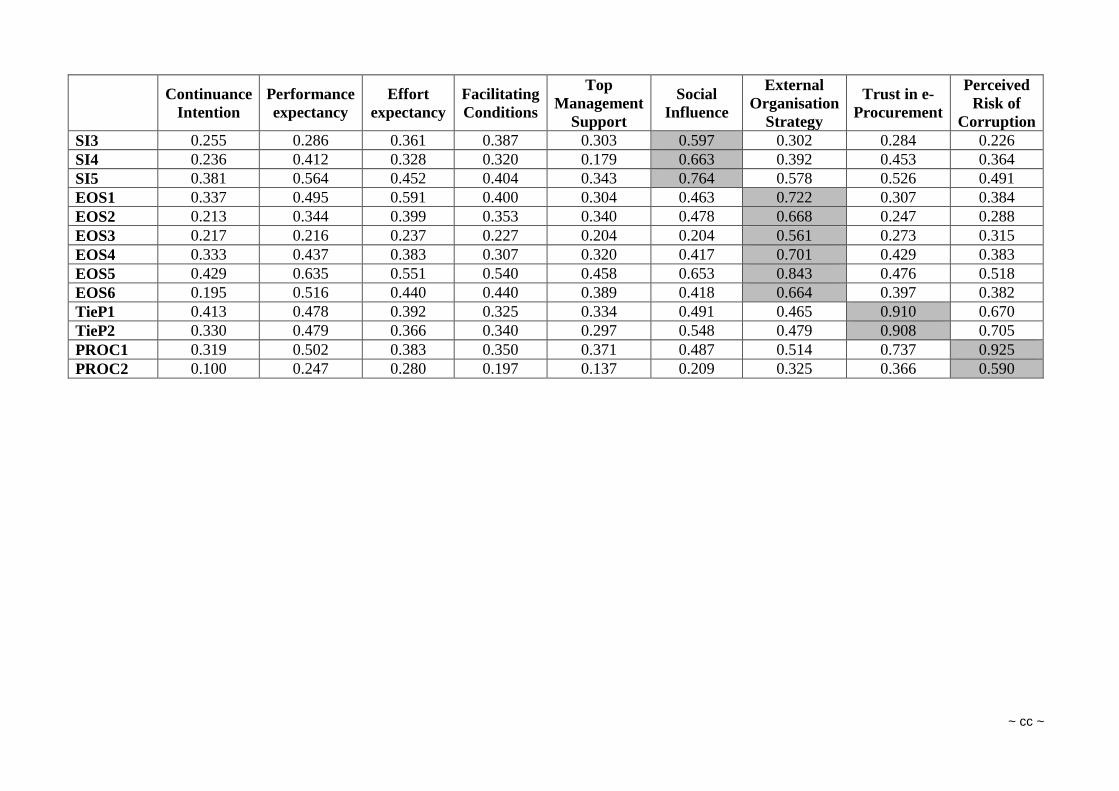
~ cc ~
Continuance
Intention
Performance
expectancy
Effort
expectancy
Facilitating
Conditions
Top
Management
Support
Social
Influence
External
Organisation
Strategy
Trust in e-
Procurement
Perceived
Risk of
Corruption
SI3 0.255 0.286 0.361 0.387 0.303 0.597 0.302 0.284 0.226
SI4 0.236 0.412 0.328 0.320 0.179 0.663 0.392 0.453 0.364
SI5 0.381 0.564 0.452 0.404 0.343 0.764 0.578 0.526 0.491
EOS1 0.337 0.495 0.591 0.400 0.304 0.463 0.722 0.307 0.384
EOS2 0.213 0.344 0.399 0.353 0.340 0.478 0.668 0.247 0.288
EOS3 0.217 0.216 0.237 0.227 0.204 0.204 0.561 0.273 0.315
EOS4 0.333 0.437 0.383 0.307 0.320 0.417 0.701 0.429 0.383
EOS5 0.429 0.635 0.551 0.540 0.458 0.653 0.843 0.476 0.518
EOS6 0.195 0.516 0.440 0.440 0.389 0.418 0.664 0.397 0.382
TieP1 0.413 0.478 0.392 0.325 0.334 0.491 0.465 0.910 0.670
TieP2 0.330 0.479 0.366 0.340 0.297 0.548 0.479 0.908 0.705
PROC1 0.319 0.502 0.383 0.350 0.371 0.487 0.514 0.737 0.925
PROC2 0.100 0.247 0.280 0.197 0.137 0.209 0.325 0.366 0.590
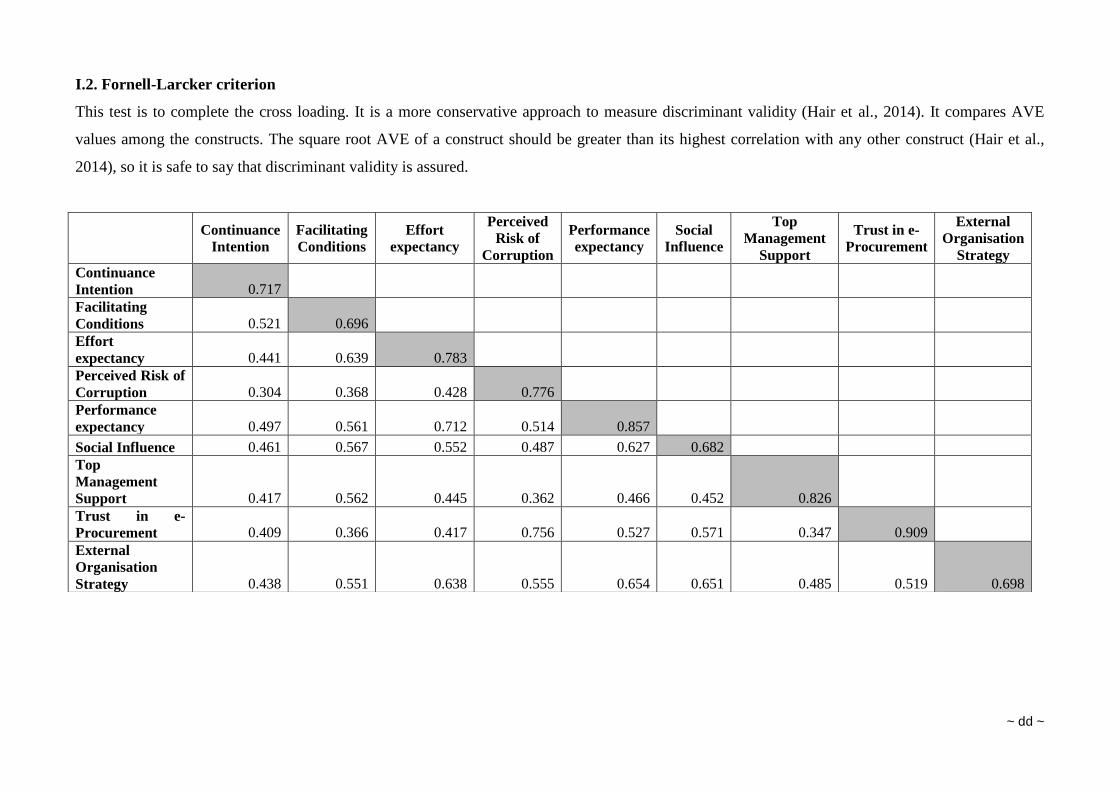
~ dd ~
I.2. Fornell-Larcker criterion
This test is to complete the cross loading. It is a more conservative approach to measure discriminant validity (Hair et al., 2014). It compares AVE
values among the constructs. The square root AVE of a construct should be greater than its highest correlation with any other construct (Hair et al.,
2014), so it is safe to say that discriminant validity is assured.
Continuance
Intention
Facilitating
Conditions
Effort
expectancy
Perceived
Risk of
Corruption
Performance
expectancy
Social
Influence
Top
Management
Support
Trust in e-
Procurement
External
Organisation
Strategy
Continuance
Intention 0.717
Facilitating
Conditions 0.521 0.696
Effort
expectancy 0.441 0.639 0.783
Perceived Risk of
Corruption 0.304 0.368 0.428 0.776
Performance
expectancy 0.497 0.561 0.712 0.514 0.857
Social Influence 0.461 0.567 0.552 0.487 0.627 0.682
Top
Management
Support 0.417 0.562 0.445 0.362 0.466 0.452 0.826
Trust in e-
Procurement 0.409 0.366 0.417 0.756 0.527 0.571 0.347 0.909
External
Organisation
Strategy 0.438 0.551 0.638 0.555 0.654 0.651 0.485 0.519 0.698
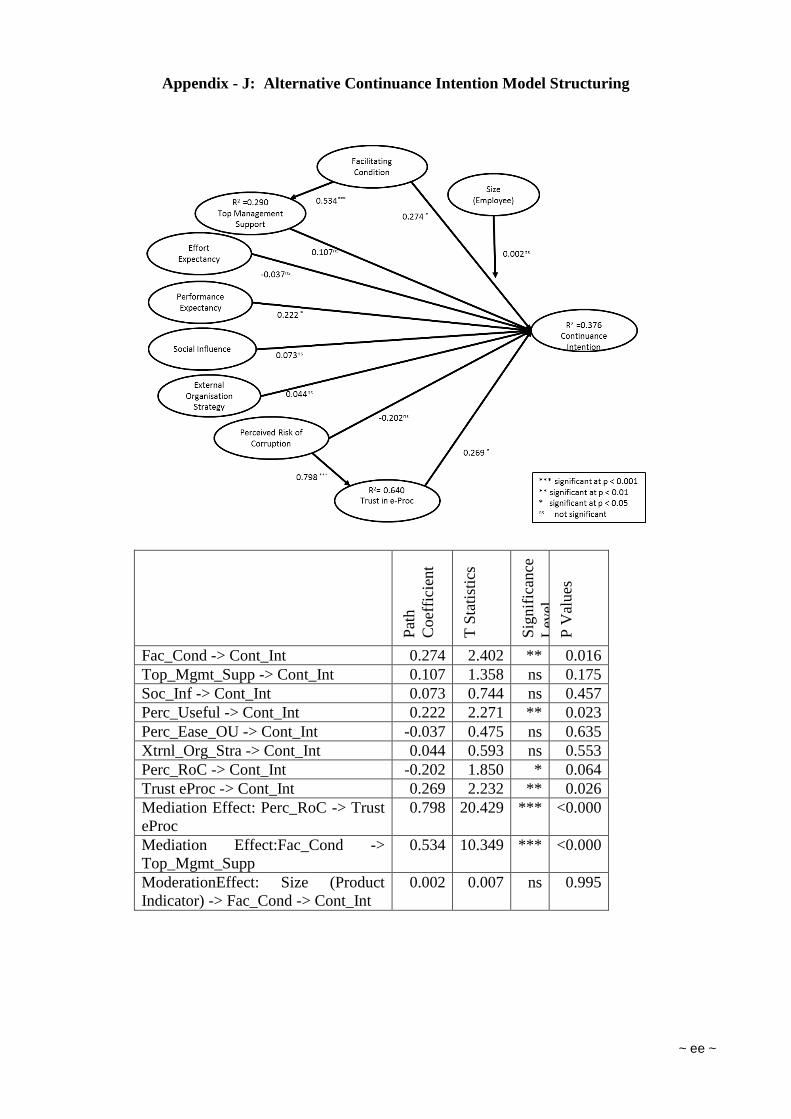
~ ee ~
Appendix - J: Alternative Continuance Intention Model Structuring
Pat
h
Coef
fici
ent
T S
tati
stic
s
Sig
nif
ican
ce
Lev
el
P V
alues
Fac_Cond -> Cont_Int 0.274 2.402 ** 0.016
Top_Mgmt_Supp -> Cont_Int 0.107 1.358 ns 0.175
Soc_Inf -> Cont_Int 0.073 0.744 ns 0.457
Perc_Useful -> Cont_Int 0.222 2.271 ** 0.023
Perc_Ease_OU -> Cont_Int -0.037 0.475 ns 0.635
Xtrnl_Org_Stra -> Cont_Int 0.044 0.593 ns 0.553
Perc_RoC -> Cont_Int -0.202 1.850 * 0.064
Trust eProc -> Cont_Int 0.269 2.232 ** 0.026
Mediation Effect: Perc_RoC -> Trust
eProc
0.798 20.429 *** <0.000
Mediation Effect:Fac_Cond ->
Top_Mgmt_Supp
0.534 10.349 *** <0.000
ModerationEffect: Size (Product
Indicator) -> Fac_Cond -> Cont_Int
0.002 0.007 ns 0.995
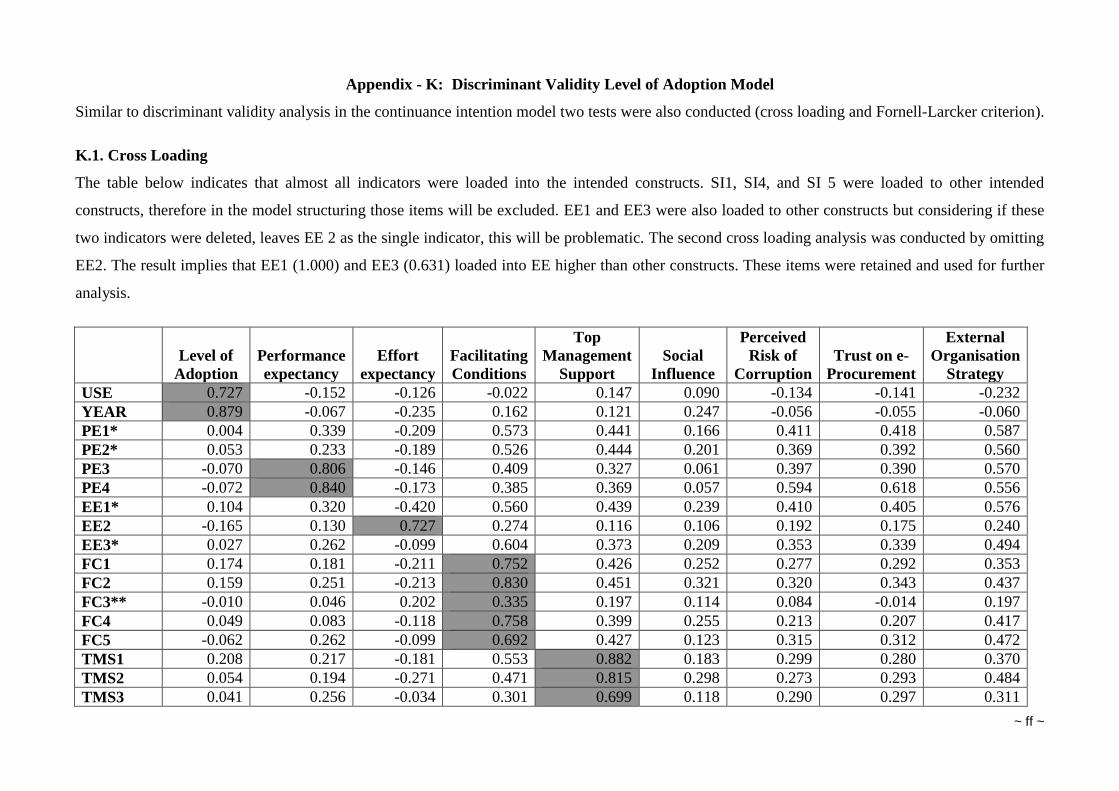
~ ff ~
Appendix - K: Discriminant Validity Level of Adoption Model
Similar to discriminant validity analysis in the continuance intention model two tests were also conducted (cross loading and Fornell-Larcker criterion).
K.1. Cross Loading
The table below indicates that almost all indicators were loaded into the intended constructs. SI1, SI4, and SI 5 were loaded to other intended
constructs, therefore in the model structuring those items will be excluded. EE1 and EE3 were also loaded to other constructs but considering if these
two indicators were deleted, leaves EE 2 as the single indicator, this will be problematic. The second cross loading analysis was conducted by omitting
EE2. The result implies that EE1 (1.000) and EE3 (0.631) loaded into EE higher than other constructs. These items were retained and used for further
analysis.
Level of
Adoption
Performance
expectancy
Effort
expectancy
Facilitating
Conditions
Top
Management
Support
Social
Influence
Perceived
Risk of
Corruption
Trust on e-
Procurement
External
Organisation
Strategy
USE 0.727 -0.152 -0.126 -0.022 0.147 0.090 -0.134 -0.141 -0.232
YEAR 0.879 -0.067 -0.235 0.162 0.121 0.247 -0.056 -0.055 -0.060
PE1* 0.004 0.339 -0.209 0.573 0.441 0.166 0.411 0.418 0.587
PE2* 0.053 0.233 -0.189 0.526 0.444 0.201 0.369 0.392 0.560
PE3 -0.070 0.806 -0.146 0.409 0.327 0.061 0.397 0.390 0.570
PE4 -0.072 0.840 -0.173 0.385 0.369 0.057 0.594 0.618 0.556
EE1* 0.104 0.320 -0.420 0.560 0.439 0.239 0.410 0.405 0.576
EE2 -0.165 0.130 0.727 0.274 0.116 0.106 0.192 0.175 0.240
EE3* 0.027 0.262 -0.099 0.604 0.373 0.209 0.353 0.339 0.494
FC1 0.174 0.181 -0.211 0.752 0.426 0.252 0.277 0.292 0.353
FC2 0.159 0.251 -0.213 0.830 0.451 0.321 0.320 0.343 0.437
FC3** -0.010 0.046 0.202 0.335 0.197 0.114 0.084 -0.014 0.197
FC4 0.049 0.083 -0.118 0.758 0.399 0.255 0.213 0.207 0.417
FC5 -0.062 0.262 -0.099 0.692 0.427 0.123 0.315 0.312 0.472
TMS1 0.208 0.217 -0.181 0.553 0.882 0.183 0.299 0.280 0.370
TMS2 0.054 0.194 -0.271 0.471 0.815 0.298 0.273 0.293 0.484
TMS3 0.041 0.256 -0.034 0.301 0.699 0.118 0.290 0.297 0.311
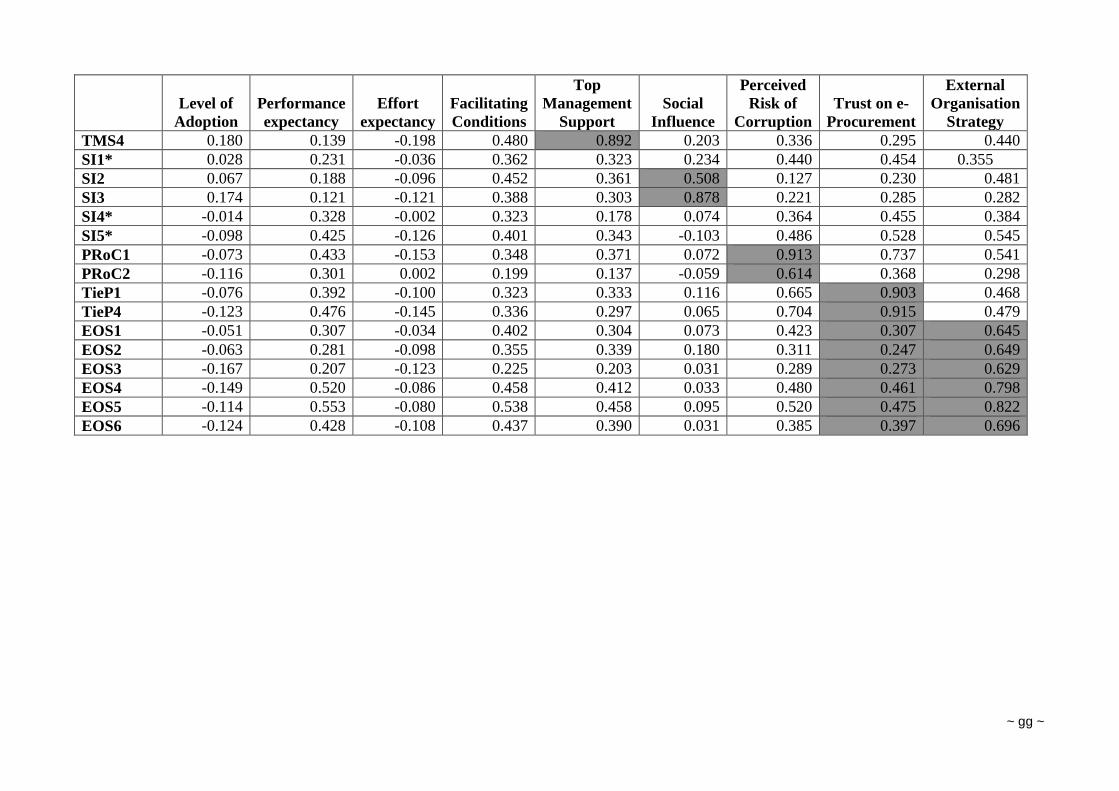
~ gg ~
Level of
Adoption
Performance
expectancy
Effort
expectancy
Facilitating
Conditions
Top
Management
Support
Social
Influence
Perceived
Risk of
Corruption
Trust on e-
Procurement
External
Organisation
Strategy
TMS4 0.180 0.139 -0.198 0.480 0.892 0.203 0.336 0.295 0.440
SI1* 0.028 0.231 -0.036 0.362 0.323 0.234 0.440 0.454 0.355
SI2 0.067 0.188 -0.096 0.452 0.361 0.508 0.127 0.230 0.481
SI3 0.174 0.121 -0.121 0.388 0.303 0.878 0.221 0.285 0.282
SI4* -0.014 0.328 -0.002 0.323 0.178 0.074 0.364 0.455 0.384
SI5* -0.098 0.425 -0.126 0.401 0.343 -0.103 0.486 0.528 0.545
PRoC1 -0.073 0.433 -0.153 0.348 0.371 0.072 0.913 0.737 0.541
PRoC2 -0.116 0.301 0.002 0.199 0.137 -0.059 0.614 0.368 0.298
TieP1 -0.076 0.392 -0.100 0.323 0.333 0.116 0.665 0.903 0.468
TieP4 -0.123 0.476 -0.145 0.336 0.297 0.065 0.704 0.915 0.479
EOS1 -0.051 0.307 -0.034 0.402 0.304 0.073 0.423 0.307 0.645
EOS2 -0.063 0.281 -0.098 0.355 0.339 0.180 0.311 0.247 0.649
EOS3 -0.167 0.207 -0.123 0.225 0.203 0.031 0.289 0.273 0.629
EOS4 -0.149 0.520 -0.086 0.458 0.412 0.033 0.480 0.461 0.798
EOS5 -0.114 0.553 -0.080 0.538 0.458 0.095 0.520 0.475 0.822
EOS6 -0.124 0.428 -0.108 0.437 0.390 0.031 0.385 0.397 0.696
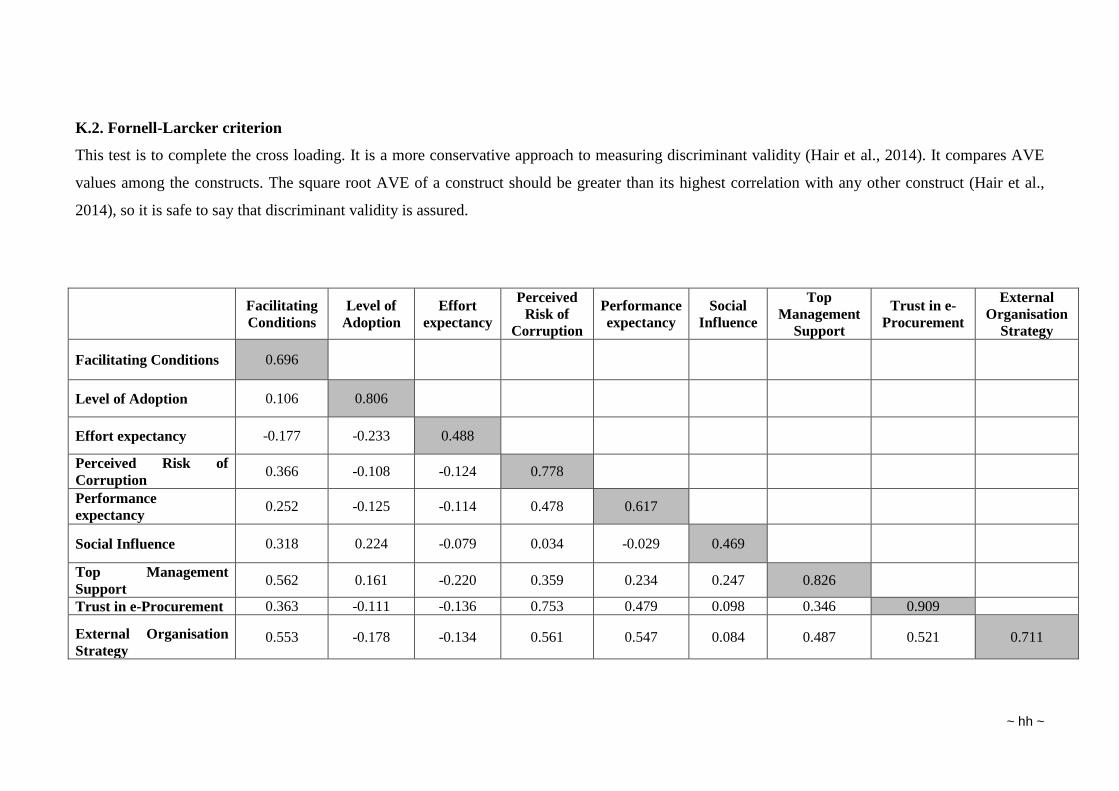
~ hh ~
K.2. Fornell-Larcker criterion
This test is to complete the cross loading. It is a more conservative approach to measuring discriminant validity (Hair et al., 2014). It compares AVE
values among the constructs. The square root AVE of a construct should be greater than its highest correlation with any other construct (Hair et al.,
2014), so it is safe to say that discriminant validity is assured.
Facilitating
Conditions
Level of
Adoption
Effort
expectancy
Perceived
Risk of
Corruption
Performance
expectancy
Social
Influence
Top
Management
Support
Trust in e-
Procurement
External
Organisation
Strategy
Facilitating Conditions 0.696
Level of Adoption 0.106 0.806
Effort expectancy -0.177 -0.233 0.488
Perceived Risk of
Corruption 0.366 -0.108 -0.124 0.778
Performance
expectancy 0.252 -0.125 -0.114 0.478 0.617
Social Influence 0.318 0.224 -0.079 0.034 -0.029 0.469
Top Management
Support 0.562 0.161 -0.220 0.359 0.234 0.247 0.826
Trust in e-Procurement 0.363 -0.111 -0.136 0.753 0.479 0.098 0.346 0.909
External Organisation
Strategy 0.553 -0.178 -0.134 0.561 0.547 0.084 0.487 0.521 0.711
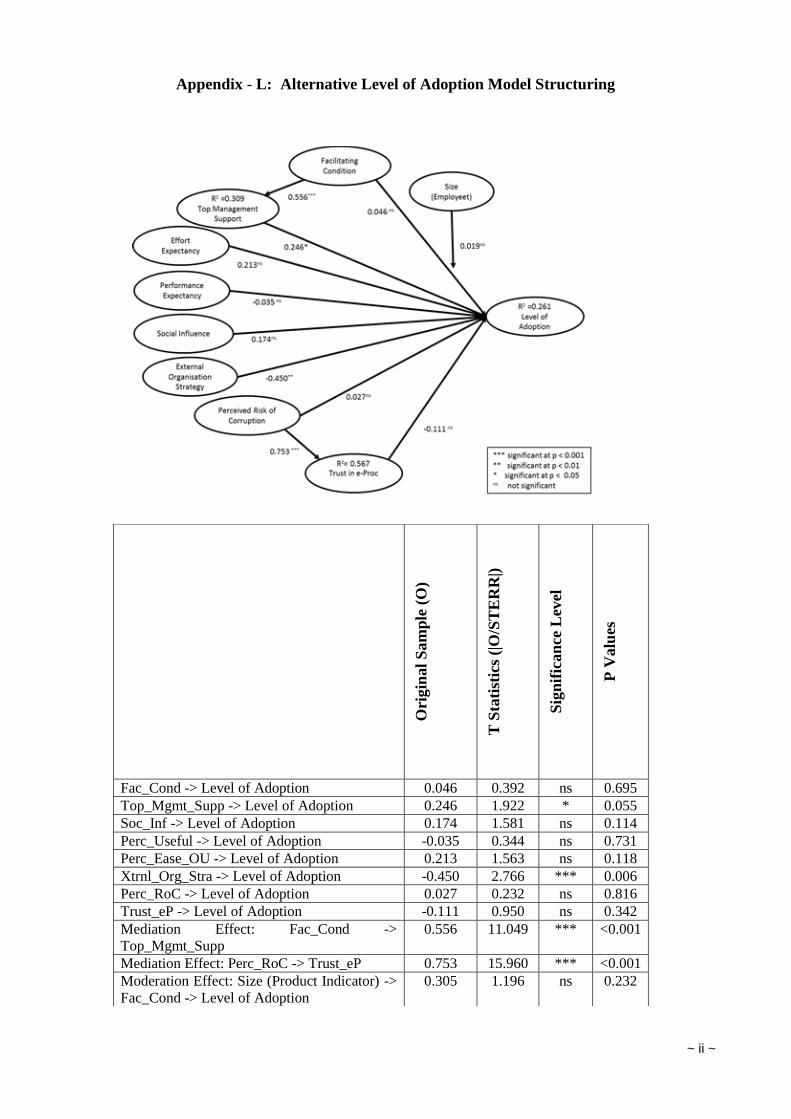
~ ii ~
Appendix - L: Alternative Level of Adoption Model Structuring
Ori
gin
al
Sam
ple
(O
)
T S
tati
stic
s (|
O/S
TE
RR
|)
Sig
nif
ican
ce L
evel
P V
alu
es
Fac_Cond -> Level of Adoption 0.046 0.392 ns 0.695
Top_Mgmt_Supp -> Level of Adoption 0.246 1.922 * 0.055
Soc_Inf -> Level of Adoption 0.174 1.581 ns 0.114
Perc_Useful -> Level of Adoption -0.035 0.344 ns 0.731
Perc_Ease_OU -> Level of Adoption 0.213 1.563 ns 0.118
Xtrnl_Org_Stra -> Level of Adoption -0.450 2.766 *** 0.006
Perc_RoC -> Level of Adoption 0.027 0.232 ns 0.816
Trust_eP -> Level of Adoption -0.111 0.950 ns 0.342
Mediation Effect: Fac_Cond ->
Top_Mgmt_Supp
0.556 11.049 *** <0.001
Mediation Effect: Perc_RoC -> Trust_eP 0.753 15.960 *** <0.001
Moderation Effect: Size (Product Indicator) ->
Fac_Cond -> Level of Adoption
0.305 1.196 ns 0.232
Recommended