ELECTRIC AND MAGNETIC PHENOMENA IN WATER AND LIVING SYSTEMS
BY
MOHAMMAD JABERANSARI
A thesis presented for the Degree of Doctor of Philosophy at the University of Salford
Department of Electronic and Electrical Engineering
University of Salford
1989

CONTENTS
PAGE
Acknowledgements i
Dedication
Summary iii
PART ONE
CHAPTER I Biological cells
1.1 Introduction
1.2 Yeast cells 1 1.2.1 Growth rate 3 1.2.2 Pure culture 6 1.2.3 Logarithmic curve 7 1.2.3.1 Lag phase 8 1.2.3.2 Exponential phase 8 1.2.3.3 Stationary phase 9 1.2.3.4 Death phase 9 1.2.4 Synchronous growth 10 1.2.5 Cultivation and examination of
Saccharomyces cerevisiae 10 1.2.5.1 Preparation of media 10 1.2.5.2 Pressure cooker (sterilid-er) 11 1.2.5. -3 Inoculating cabinets 11 1.2.5.4 Containers 11
1.3 Leishmania cells 12 1.3.1 Leishmania major 13 1.3.2 Physiology of Leishmania major cells 14 1.3.3 Nutrition and growth 15 1.3.4 The Leishmaniases in man 15
1.4 Water in biological system 16
REFERENCES
CHAPTER 2 Dielectrophoresis, pearl chain formation and cellular rotation in biological systems
2.1 Introduction 20
2.2 Dielectrophoresis 20 2.2.1 Basic theory of dielectrophoresis 22 2.2.2 Comparison of dielectrophoresis and
electrophoresis 26
2.3 Pearl chain formation 27 2.3.1 Theoretical aspects of yield 29 2.3.2 Mechanism involved in the response of
the living cells to non-uniform electric fields 33

2.4 Cellular rotation 34 2.4.1 AC and DC responses 41 2.4.2 Advantages and future application 43
REFERENCES
CHAPTER 3 Electron & Ion beam charging of surfaces 3.1 Introduction 45
3.2 The electronic beam as a technological process 45
3.2.1 Energy conversion at the point of action 47 3.2.2, X-ray production and shielding 48 3.2.3 Thermionic emission and emission of
secondary electrons and electron back- scattering 49
3.2.4 Electron range 50 3.2.5 Charge and dose effect 51
3.3 Isotope separator 53 3.3.1 Basic data 53 3.3.1.1 Ion source 53 3.3.1.2 H. T. supply 54 3.3.1.3 Analysing magnet 54 3.3.1.4 Target chamber 55 3.3.2 General data 56 3.3.2.1 Special notes 59
3.4 Van de Graaff 61 3.4.1 The high voltage terminal 62 3.4.2 Magnetic analyser 64 3.4.3 Ion beam flight path 64 3.4.4 Target chamber 65
3.5 DC plasma ion bombardment 68 3.5.1 Gas discharge 70
REFERENCES

PART TWO
EXPERIMENTAL WORKS AND OBSERVATIONS
CHAPTER 4 Thin film electrodes 4.1 Introduction 71
4.2 Wire electrodes and problems associated with wire electrodes 71
4.3 Preparation of electrodes by thimjilm vacuum 73
4.3.1 Preparation of mask 73 4.3.2 Pre-cleaning of the glass slide 75 4.3.3 Evaporation process 75 4.3.3.1 Evaporation method 76 4.3.4 Sputtering process 79 4.3.4.1 Sputtering method 80 4.3.4.2 Advantages 80
4.4 Electrode effect 81
4.5 Electrode cleaning 81
REFERENCES
CHAPTER 5 Electronic circuit design and applications
5.1 Introduction 83
5.2 Three-phase voltage generator circuit 83 5.2.1 Three-phase rotating electric field 85
5.3 Four-phase voltage generator 87 5.3.1 Four-phase rotating electric field 88
5.4 Fixed Voltage Regulator 90
5.5 Charge-sensitive amplifier 91
5.6 Ioniser 94 5.6.1 Circuit design of an ionizer 95 5.6.2 Testing 99
. 5.6.3 Measurements 99
5.7 Computer controlled oscillator 103 5.7.1 Using a D/A converter with a microcompute r107
5.8 Class AB emitter follower 109 5.8.1 Class B and class AB push-pull operation 109
REFERENCES
4-
CHAPTER 6 Construction of the electron beam gun
6.1 Introduction 115
6.2 Requirements for constructing the electron gun 115
6.3 Electron optical system 119 6.3.1 Magnetic lens 119 6.3.2 Phosphor screen 120 6.3.2.1 Preparation of the phosphor screen 121
6.4 Experiments 122
6.5 Operation of the electron gun 125
6.6 Measurements on the electron gun 125 6.6.1 Beam current/Energy 125 6.6.2 Beam current vs Filament current 130 6.6.3 Filament current/Energy/Beam current 132
REFERENCES
CHAPTER 7 Charge Implantation Experimental: Equipment and procedure
7.1 Introduction 134
7.2 Electron bombardment and injection 134 7.2.1 Electron charge measurement 137 7.2.1.1 Decay time 137 7.2.1.2 Errors 138 7.2.1.3 Results 138 7.2.2 Dose calculation 140
7.3 Van de Graaff 141
7.4 Isotope separator 142
7.5 DC plasma ion bombardment system 144, 7.5.1 Ion bombardment method by DC plasma ion 147 7.5.2 Infrared measurement 147
REFERENCES
CHAPTER 8 Experiments with cell oscillation and rotation
8.1 Introduction 151
8.2 Action of non-uniform electric fields on Leishmania and yeast cells in H2 and Sub-H2 ranges 153
8.2.1 Observation of pearl chains at sub-audio frequencies 154
8.3 Experiments involving cell rotation 157 8.3.1 Procedure 159 8.3.2 Problems associated with CSR studies 160 8.3.3 Sources of error 162 8.3.4 Results 162
8.4 Discussion 169
REFERENCES
CHAPTER 9 Cellular Attachment
9.1 Introduction 173
9.2 Scratched plastic as a substrate for attachment 175
9.3 Surface of substratum 178
9.4 The physical implications of the attachment of L. major cells to electron bombarded surfaces 179
9.4.1 Electron bombardment 180 9.4.2 Ion implantation 184
9.5 Effect of ionisers on Leishmania cells 185
9.6 Charge distribution 188
9.7 U. V. sterilization effect 189
9.8 Advantages of "In vitro" attachment 189
9.9 Discussion 190
REFERENCES
CHAPTER 10 The effects of magnetic fields on water and ice formation.
10.1 Introduction 192
10.2 Experiments on ice formation 193
10.3 Ice crystals from frozen saline 199 10.3.1 Temperature 201 10.3.2 Exposure time 201 10.3.3 Current 201 10.3.4 Frequency 204
10.4 Ice crystals 208 10.4.1 Bragg's law 209 10.4.2 Scattering of X-rays 209 10.4.3 Diffraction of X-rays 211 10.4.4 Transmission of X-rays 217
10.5 Supercooling 223
10.6 Discussion 228

REFERENCES
CONCLUSION 232
APPENDIX 1 Savouraud Dextose Agar 235
APPENDIX 2 Electronc Data Sheets 237
APPENDIX 3 Three dimensional program 247
APPENDIX 4 Least square program 249
APPENDIX 5 Millipore letter 253
PUBLICATIONS 255
(i)
ACKNOWLEDGEMENT
The author would like to give his sincere thanks to Dr. CA. Smith for his continuous encouragement and supervision during his eight years at Salford University as an undergraduate and graduate student.
Professor D. Molyneux and Dr. K Wallbank are thanked for their help during the biological work and informative discussions.
Many thanks are also conveyed Brimble, Department of Elect: Electrical Engineering; The Laboratory and the Library Staff, P Fleming who has given her assistance in typing this thesis.
to Mr. E. ronic and
Computer and to Mrs.
time and

ii )
DEDICATION
The Author's heartfelt thanks go to his
beloved parents, his wife and his baby,
for just about everything
SUMMARY
We are called organisms because our cells are organized into a co-
operative assemblage of interacting elements. Human beings are more
than simply bags of interacting chemicals walking around enclosed
within 1.8 square metres of skin. It has long been known that
biological organisms, including ourselves, use chemical communication
systems. Internally from tissue-to-tissue, for example, there are
hormones; and externally, between individual organisms, particularly
insects, there are pheromones. For the most part, the regulation of
biological processes has been assumed to take place by means of
chemical communication systems from a transmitter molecule via
diffusion or bulk transport as the transmission link to a receiver or
receptor molecule. Multicellular organisms, and human beings, comprise
at least (1011 ) cells, a more rapid and efficient system of
communication, other than a solely chemical means, is necessary to
provide for the vast number of interactions essential for proper
management of the whole system-In real time such a system might need to
have a band width only obtainable with an optical carrier. Organisms
are also dielectric resonators by virtue of their difference in
dielectric constant from their environment, and, thus, are surrounded
by an evanescent electromagnetic envelope which can act as a
communication link to a similar field system [1). Bioelectromagnetic
fields are part and parcel of life, the study of which involves the
study of the electric, magnetic and electromagnetic field patterns
surrounding a living system. I
The phenomena of bioelectromagnetic field interactions with water, and
simple cells such as yeasts, Saccharomyces cerevisiae and parasites
Leishmania major have been demonstrated by several experimental

WI)
approaches, namely:
i) Direct dielectric measurements on water [2].
ii) Dielectrophoresis experiments on yeast cells.
iii) Cellular spin resonance of yeast and parasite cells.
iv) Observation of attachment of parasite cells to negatively (electron
beam) charged substrates.
V) Studies of ice crystals grown in the presence of a magnetic field.
Dielectrophoresis experiments carried out on living yeast cells during
the course of the writer's MSc work [21 showed that there is an anomaly
in, the "pearl chain" formation of yeast cells as the geomagnetic field
strength satisfies the resonance condition for H1 (the yield of pearl
chains drops in the region of 2.7 kHz for a geomagnetic field strength
of 0.7 gauss). This corresponds to the proton nuclear magnetic
resonance which results in a repulsion force between the cells in the
pearl chain.
In the continued course of the work described in this thesis, the
interaction of rotating electric fields has been studied in respect of
the yeast and parasite cells. A cellular spin resonance of lone cells
has been observed at critical values of the environmental magnetic
fields, and the spectrum of the rotation speed of cells for different
values of the applied frequency of rotating electric field is shown and
discussed in Chapter (8). In this case the electrodes were made of
thin films of platinum or gold prepared by vacuum sputtering. Thin
film metal electrodes allow the microscope observations to be carried
out at high optical magnification using short working distance
objectives. The details of the preparation of these electrodes are
given in Chapter (4).

tV)
The treatment of polystyrene petri dishes to produce a negative
electrostatic charge on their surface was found to facilitate the
attachment of Leishmania major cells thereby permitting their culture
"in vitro". It may be that an electrostatic phenomenon provides the
effective mechanism.
Attempts were made to elucidate these attachment systems by comparing
the effects of charging polystyrene petri dishes either negatively by
electron bombardment or possibly by the use of a positive ion beam. In
Chapter (9) effects are described which were obtained when these
experiments were carried out using Leishmania major cells. It became
clear that these cells had a clear preference for the negative
(electron charged) surfaces and regarded them as a good place to stick.
Chapter (3) explains the physical nature of tht: processes by which the
polystyrene petri dishes may be negatively or positively charged.
Since the electron-beam charging of the petri dishes resulted in the
attachment of parasites to the surface of the substrate which had
received the negative charge, presumably, in some important respect,
this stimulated their normal habitat on cuticular surfaces in the gut
of their sandfly host which is known to carry a negative charge. The
polystyrene petri dishes were electron beam irradiated at a variety of
charge doses. For the low doses (10"I e/m), a special low-energy
electron gun had to be constructed, as described in Chapter (6).
Any living organism is approximately 80% water. Although the
interaction of the weak geomagnetic field with water will cause proton
precession at the frequency of magnetic resonance, the organism can 0
survive the effect of a strong, steady magnetic field even though this
may have an effect on the cell water as demonstrated by the formation
WD
of ice crystals from water exposed to a magnetic field. Some
hypersensitive patients react not only to certain chemicals in very
small amounts, but may also react to magnetic field treated water,
differently depending upon the specific frequencies (3]. For this
reason also, possible effects of a magnetic field on water through the
ice crystals formed by freezing water in a magnetic field were
investigated by X-ray crystallography (Chapter (10)).

REFERENCES
1) RIVERA, H., POLLOCK, J. K. and POHL, H. A. "A. C. Field Patterns About Living Cells", Cell Biophysics, 1985,7, p. 43.
2) JABERANSARI, M. "Dielectrophoresis, Electrodynamic. and Magnetic Resonance Phenomena in Yeast Cells", M. Sc. Thesis, Salford University, 1985.
3) SMITH, C. W., CHOY, R., MONRO, J. Environmental, Allergenic and Therapeutic Effect of Electromagnetic Field", 3rd Annual International Symposium on Man and His Environment in Health and Disease, Feb. 21-24, Dallas, Texas.

PART I
THEORETICAL WORK

CHAPTER (1)
BIOLOGICAL CELLS
1.1 INTRODUCTION
The experiments reported in this thesis were confined to two different
kinds of biological systems: yeast cells (Saccharomyces cerevisiae) and
parasites (Leishmania major). The following pages describe the basic
physiology, and the nutrition and cultivation of these cells together
with their importance to and effect on man and his environment.
Because of the pathogenicity of Leishmania major. cells, the number of
experiments on these cells was limited; reliance had to be placed on
information obtained from researchers having the necessary skills- for
results involving the handling of the live parasites.
1.2 Yeast cells
Yeasts have been defined as fungi whose usual and dominant growth form
is unicellular, and great variations exist among them. Yeast cells may
be spherical, ellipsoidal or cylindrical: the yeast cells used in this
research were Saccharomyces cerevisiae and these are roughly spherical
in shape. Cells of Saccharomyces cerevisiae are usually within the
range 2 pm to 8 Fm in diameter with 3 pm to 15 pm length for. the major
axis of the most ellipsoidal cells.
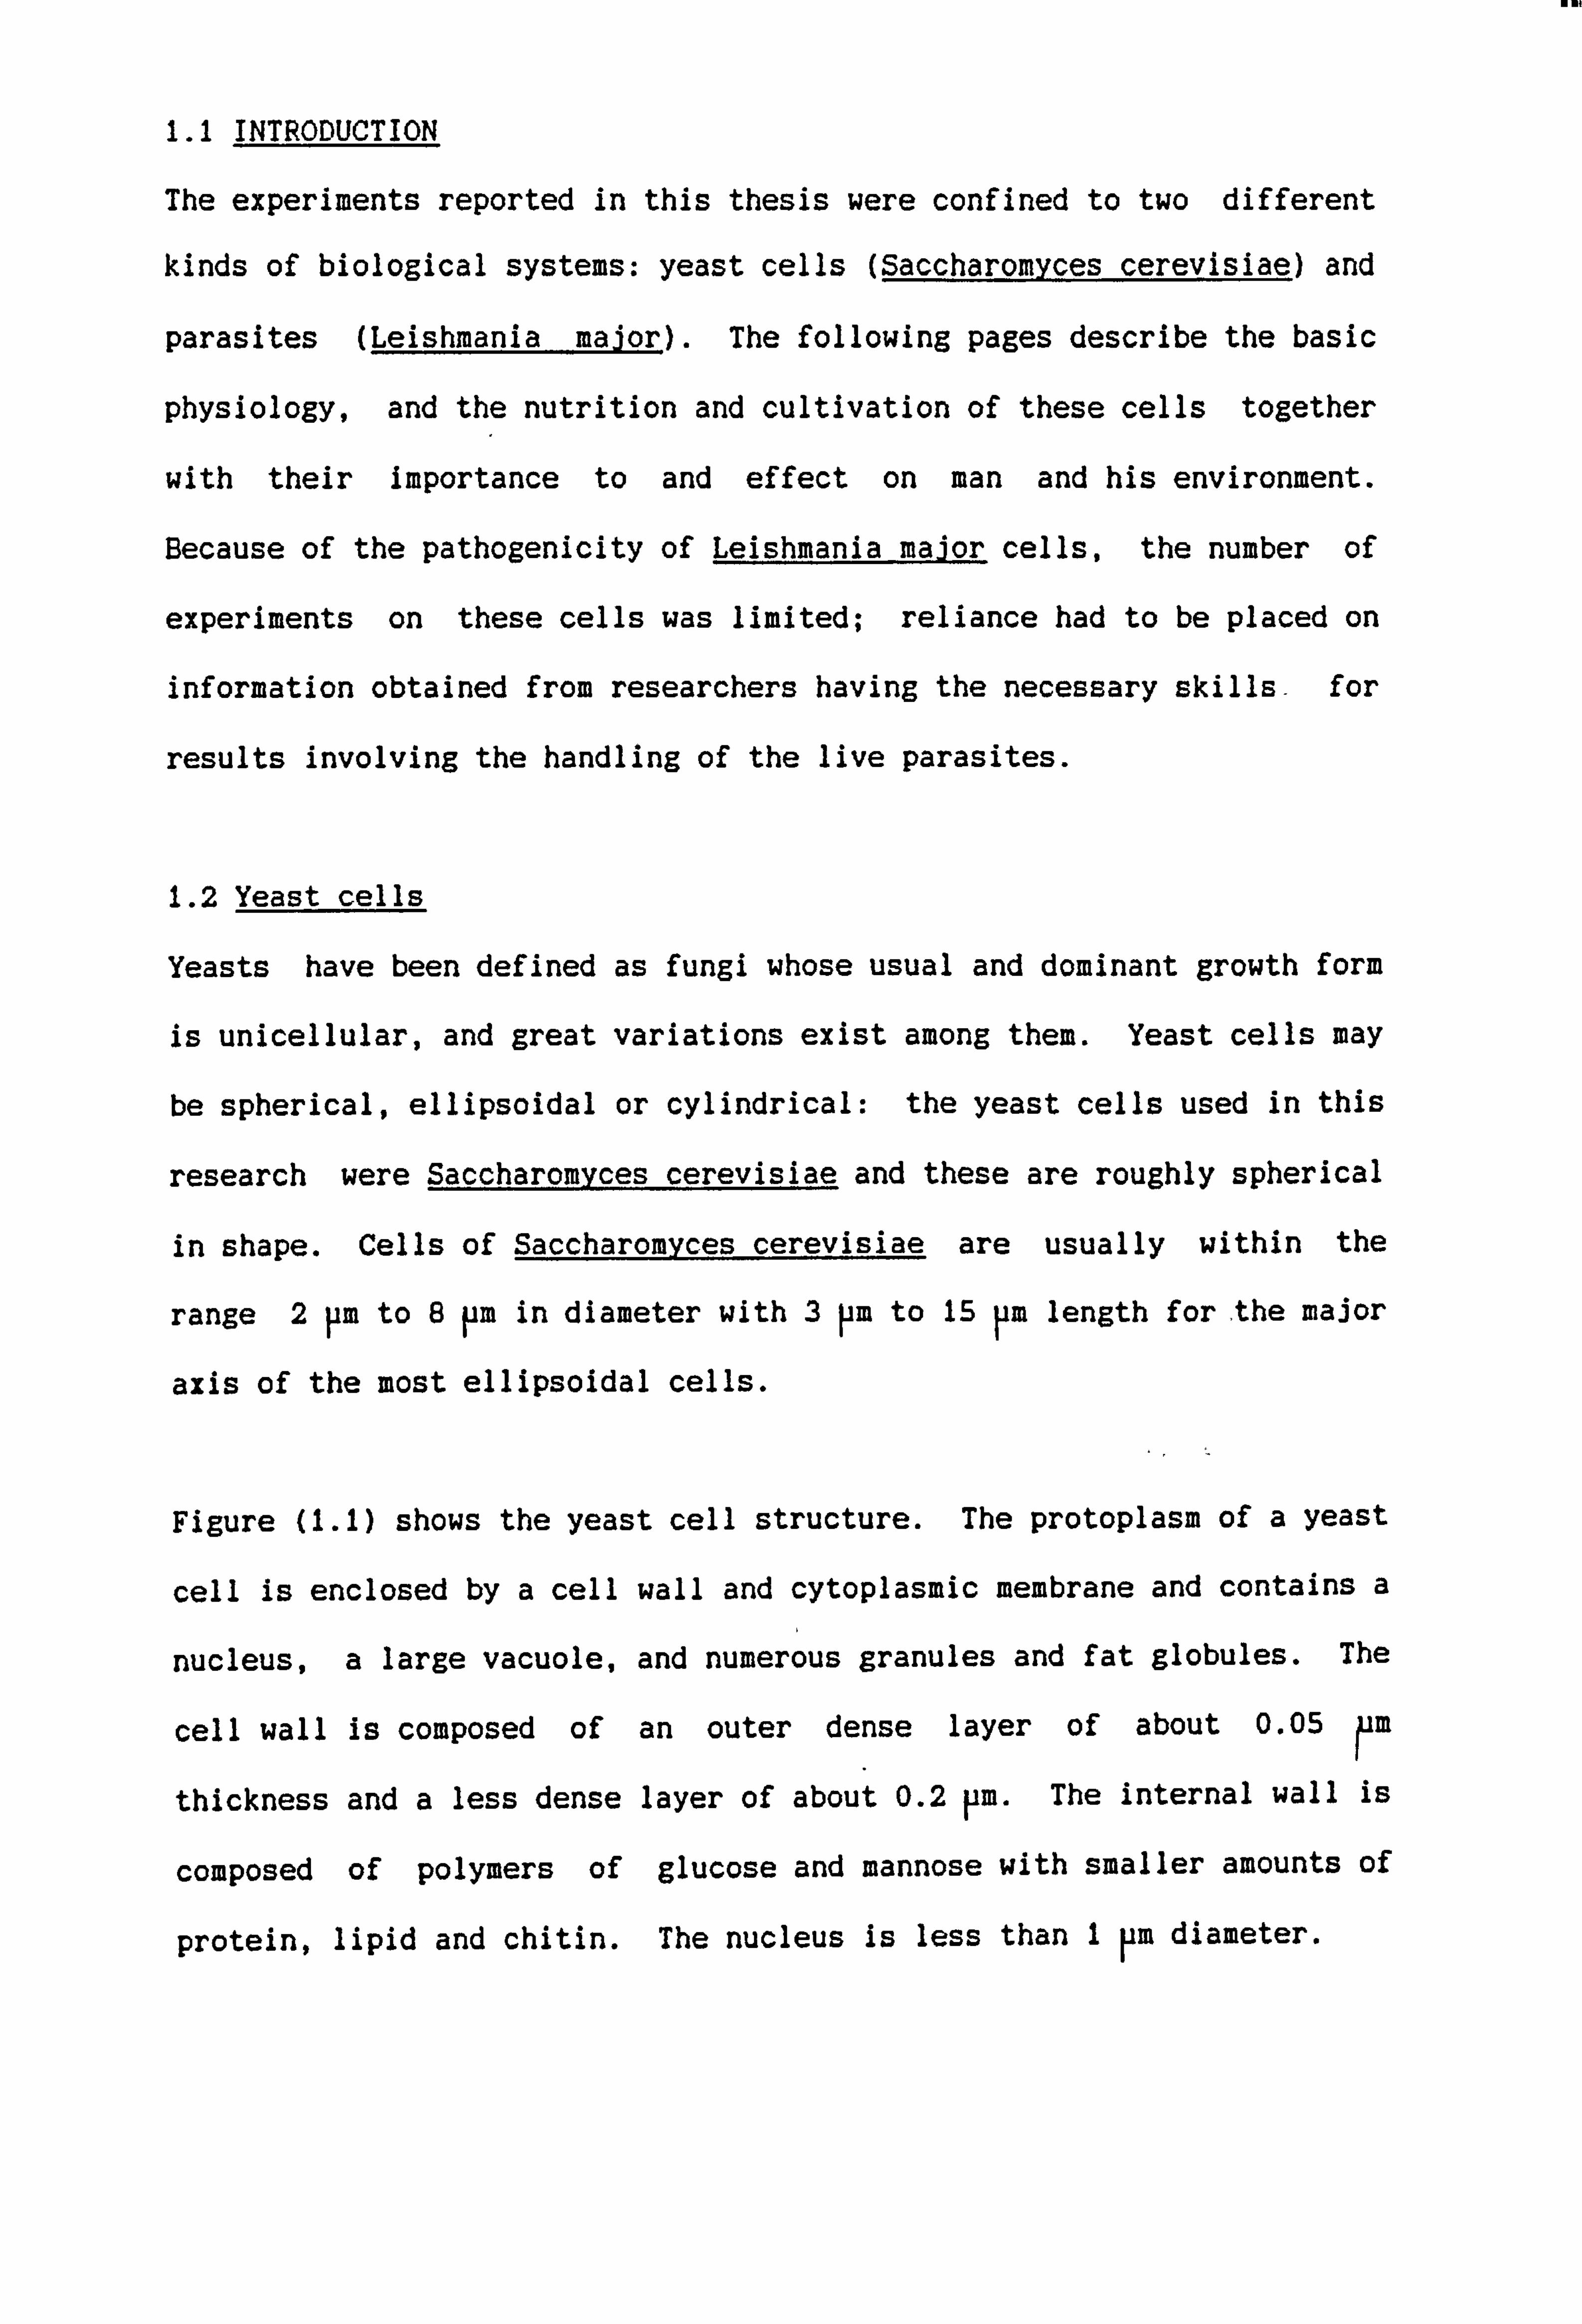
Figure (1.1) shows the yeast cell structure. The protoplasm of a yeast
cell is enclosed by a cell wall and cytoplasmic membrane and contains a
nucleus, a large vacuole, and numerous granules and fat globules. The
cell wall is composed of an outer dense layer of about 0.05 M
thickness and a less dense layer of about 0.2 pm. The internal wall is
composed of polymers of glucose and mannose with smaller amounts of
protein, lipid and chitin. The nucleus is less than 1 pm diameter.
2
C 11 Membrane
Cell Wall
Centrosome
Cent rochromatin
Vocuole
Mitochondriovt
Nucleus Chromosomes
Nuclear Membrane
Cyto Plasm
Fig. 1.1 The structure of the yeast cell according to Lindegren (1952)
Yeasts require the same chemicals as other forms of life. These
include carbon, hydrogen, oxygen, nitrogen, phosphorus, potassium,
sodium chloride, sulphur, mangnesium, iron, zinc, manganese, ' copper and
molybdenum. These are often present in sufficient amounts as
impurities in the water or other ingredients of culture media.
Yeast cells were the first organisms to be shown to grow in the absence
of atmospheric oxygen and also grow over a wide range ofruvalues. The
optimum rate of growth usually occurring between pH 4.5 and 5.0. '
Growth cannot be expected at temperatures much below freezing, nor does
it occur above 47-C, the most favourable temperature is usually between
20-C and 30-C.
Cells of most species are killed within five to ten minutes at 5210C to

Iti
3
58-C, the medium in which the organisms are suspended affects the
sterilization time and temperature.
1.2.1 Growth rate of yeast
Growth is defined as an increase in the number of microbial cells.
Growth rate is expressed as the growth per unit time.
In the yeast micro-organism, growth usually involves an increase in
cell numbers. A single cell will continually increase in size until it
is double its original size. Then the cell division occurs, resulting
in the formation of two cells the size of the original cell. The
interval between the successive formations of two cells from one is
called the generation time. Generation time is thus the time required
for the cell population to double. It has been found to be more
convenient to replace the generation time by mean generation time
(M. G. T. ). This is because not all the cells will produce even a single
daughter cell, but also it is commonly observed that some cells develop
two or more buds at the'same time.
Under optimum conditions, one can easily determine the mean generation
time by the equation (1.5) derived below. Experimentally, the mean
generation time for yeast cells is determined by inoculating the medium
with a known number of cells, allowing the yeast to grow under optimum
conditions, and then determining the final cell population, now too
large to be counted directly, by serial dilution and counting.
The experimental data required to calculate the MGT includes (a) the
number of yeast cells present at the beginning, (b) the number of yeast
cells present at the end of a given time interval, and (c) the time
in
4
interval.
The relationship of cell numbers and mean generation time can be
expressed by the following equations where B is the number of yeast
cells Inoculated into medium or cell count at zero time. b is the
number of cells at the end of the given time period t. G is the mean
generation time (MGT) and n the number of generations each of time
equal to MGT.
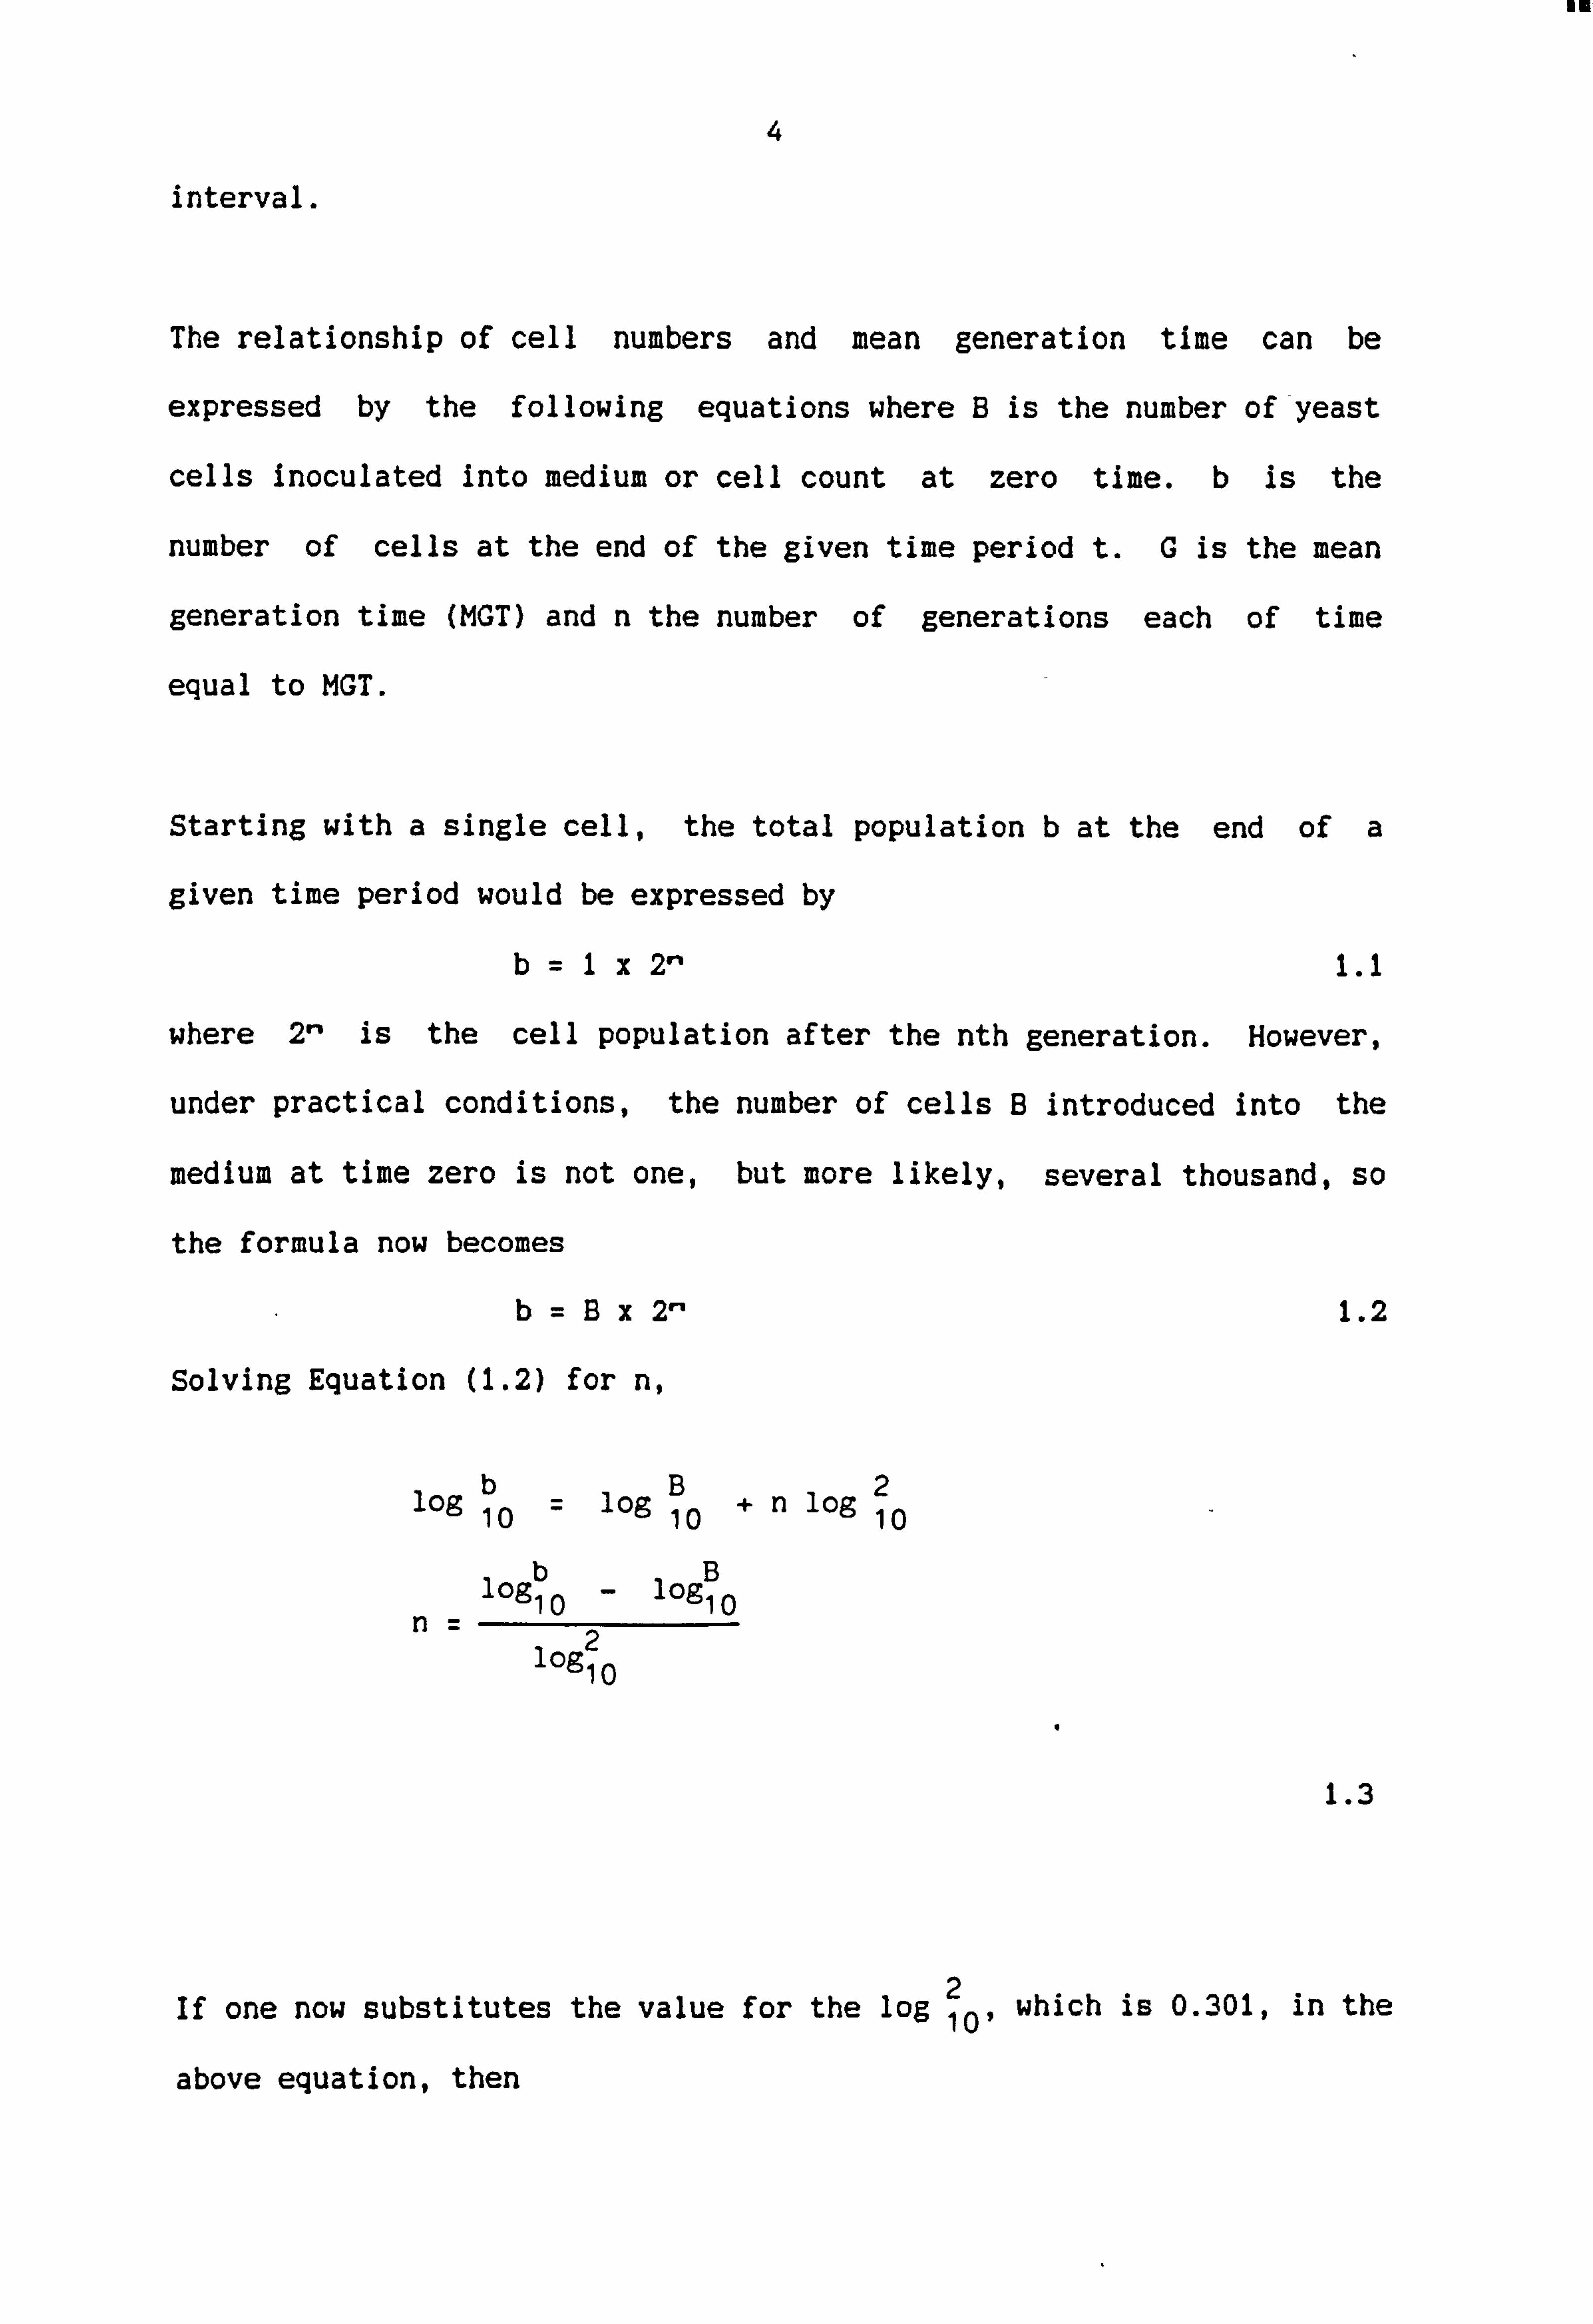
Starting with a single cell, the total population b at the end of a
given time period would be expressed by
b=1x 2- 1.1
where 2" is the cell population after the nth generation. However,
under practical conditions, the number of cells B introduced into the
medium at time zero is not one, but more likely, several thousand, so
the formula now becomes
b=Bx 2- 1.2
Solving Equation (1.2) for n,
log b log B+n log 2 10 10 10
log b- log B 10 10
log 2 10
1.3
If one now substitutes the value for the log 2 09 which is 0.301, in the 1
above equation, then
5
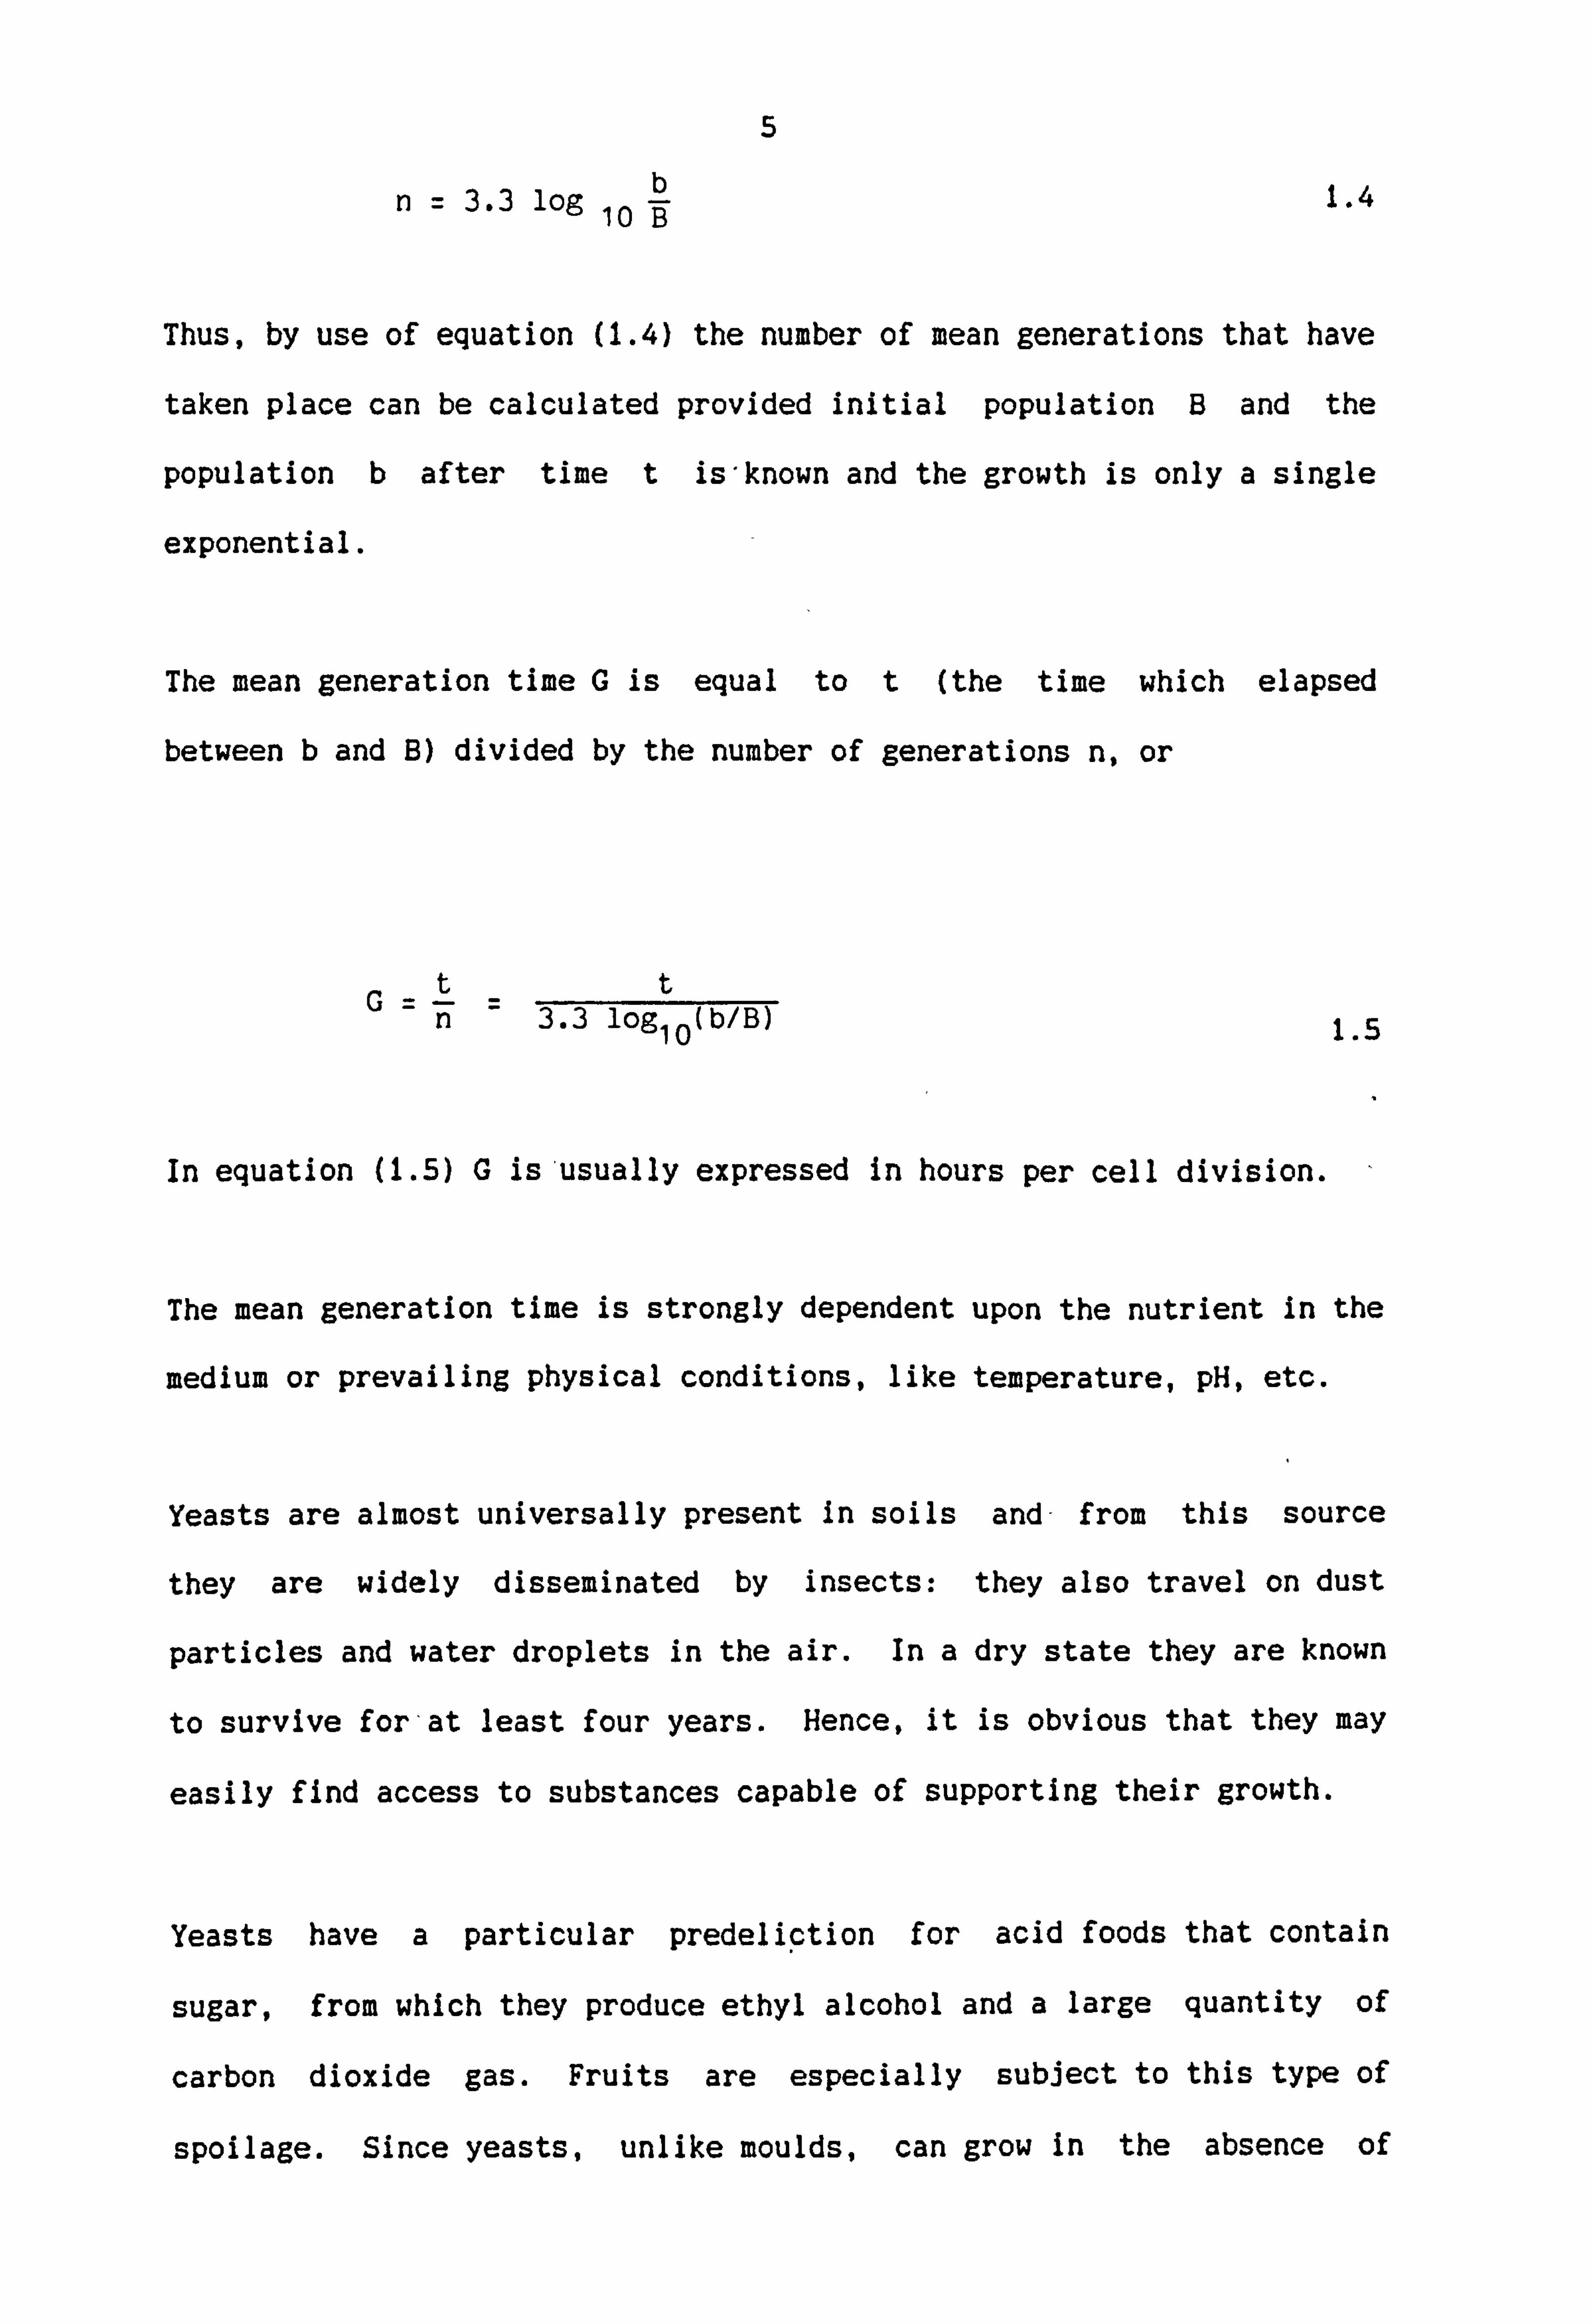
n=3.3 log b 10 B
1.4
Thus, by use of equation (1.4) the number of mean generations that have
taken place can be calculated provided initial population B and the
population b after time t is-known and the growth is only a single
exponential.
The mean generation time G is equal to t (the time which elapsed
between b and B) divided by the number of generations n, or
G=t=t n 3.3 log 10 (b/B) 1.5
In equation (1.5) G is'usually expressed in hours per cell division.
The mean generation time is strongly dependent upon the nutrient in the
medium or prevailing physical conditions, like temperature, pH, etc.
Yeasts are almost universally present in soils and- from this source
they are widely disseminated by insects: they also travel on dust
particles and water droplets in the air. In a dry state they are known
to survive for, at least four years. Hence, it is obvious that they may
easily find access to substances capable of supporting their growth.
Yeasts have a particular predeliction for acid foods that contain
sugar, from which they produce ethyl alcohol and a large quantity of
carbon dioxide gas. Fruits are especially subject to this type of
spoilage. Since yeasts, unlike moulds, can grow in the absence of

6
oxygen, sealing a food container does not prevent spoilage.
Yeasts are also very important in industry. Alcoholic fermentation has
been practiced for thousands of years. Strains of Saccharomyces
cerevisiae are used to make beers, ales, wines, C02 and industrial
alcohol. This organism also produces the various fermented milks such
as the Kafir' Koumiss' and Matzoon and participates in the production
of certain cheeses. Compressed yeast is used not only in baking but
also as a source of vitamins and of enzymes useful in the manufacture
of syrups and confectionery products.
1.2.2 Pure culture
When yeasts grow in an artificial medium which is referred to as a
"culture", different species of yeast growing on the same kind of
culture medium may appear quite different. To determine the
chracteristics of a particular species of mirco-organism, it is
important that the organism be isolated and grown in the laboratory as
a pure culture. There are a variety of techniques whereby the
different species in a natural specimen can be isolated and grown as a
pure culture [1]. However, only the Spread-Plate Technique is
discussed here:
By means of a transfer loop a portion of the yeast specimen suspension
is placed into a liquid medium (inoculum). In this present work, The
medium used was Sabouraud Medium (See Appendix (1)). The inoculum is
then incubated for eight hours. A few drops of the culture are
transferred by spreading or streaking over the surface of a nutrient
agar medium. The nutrient agar medium used was Sabouraud dextrose
agar. Spread plates are usually streaked using a sterilised bent glass
ill
7
rod. This manipulation distributes the yeast cells over the agar
surface so that separated yeast colonies may develop from each
individual yeast cell.
However, *one of the limitations of this technique is that only a small
amount of the specimen can be spread over the surface of the'medium.
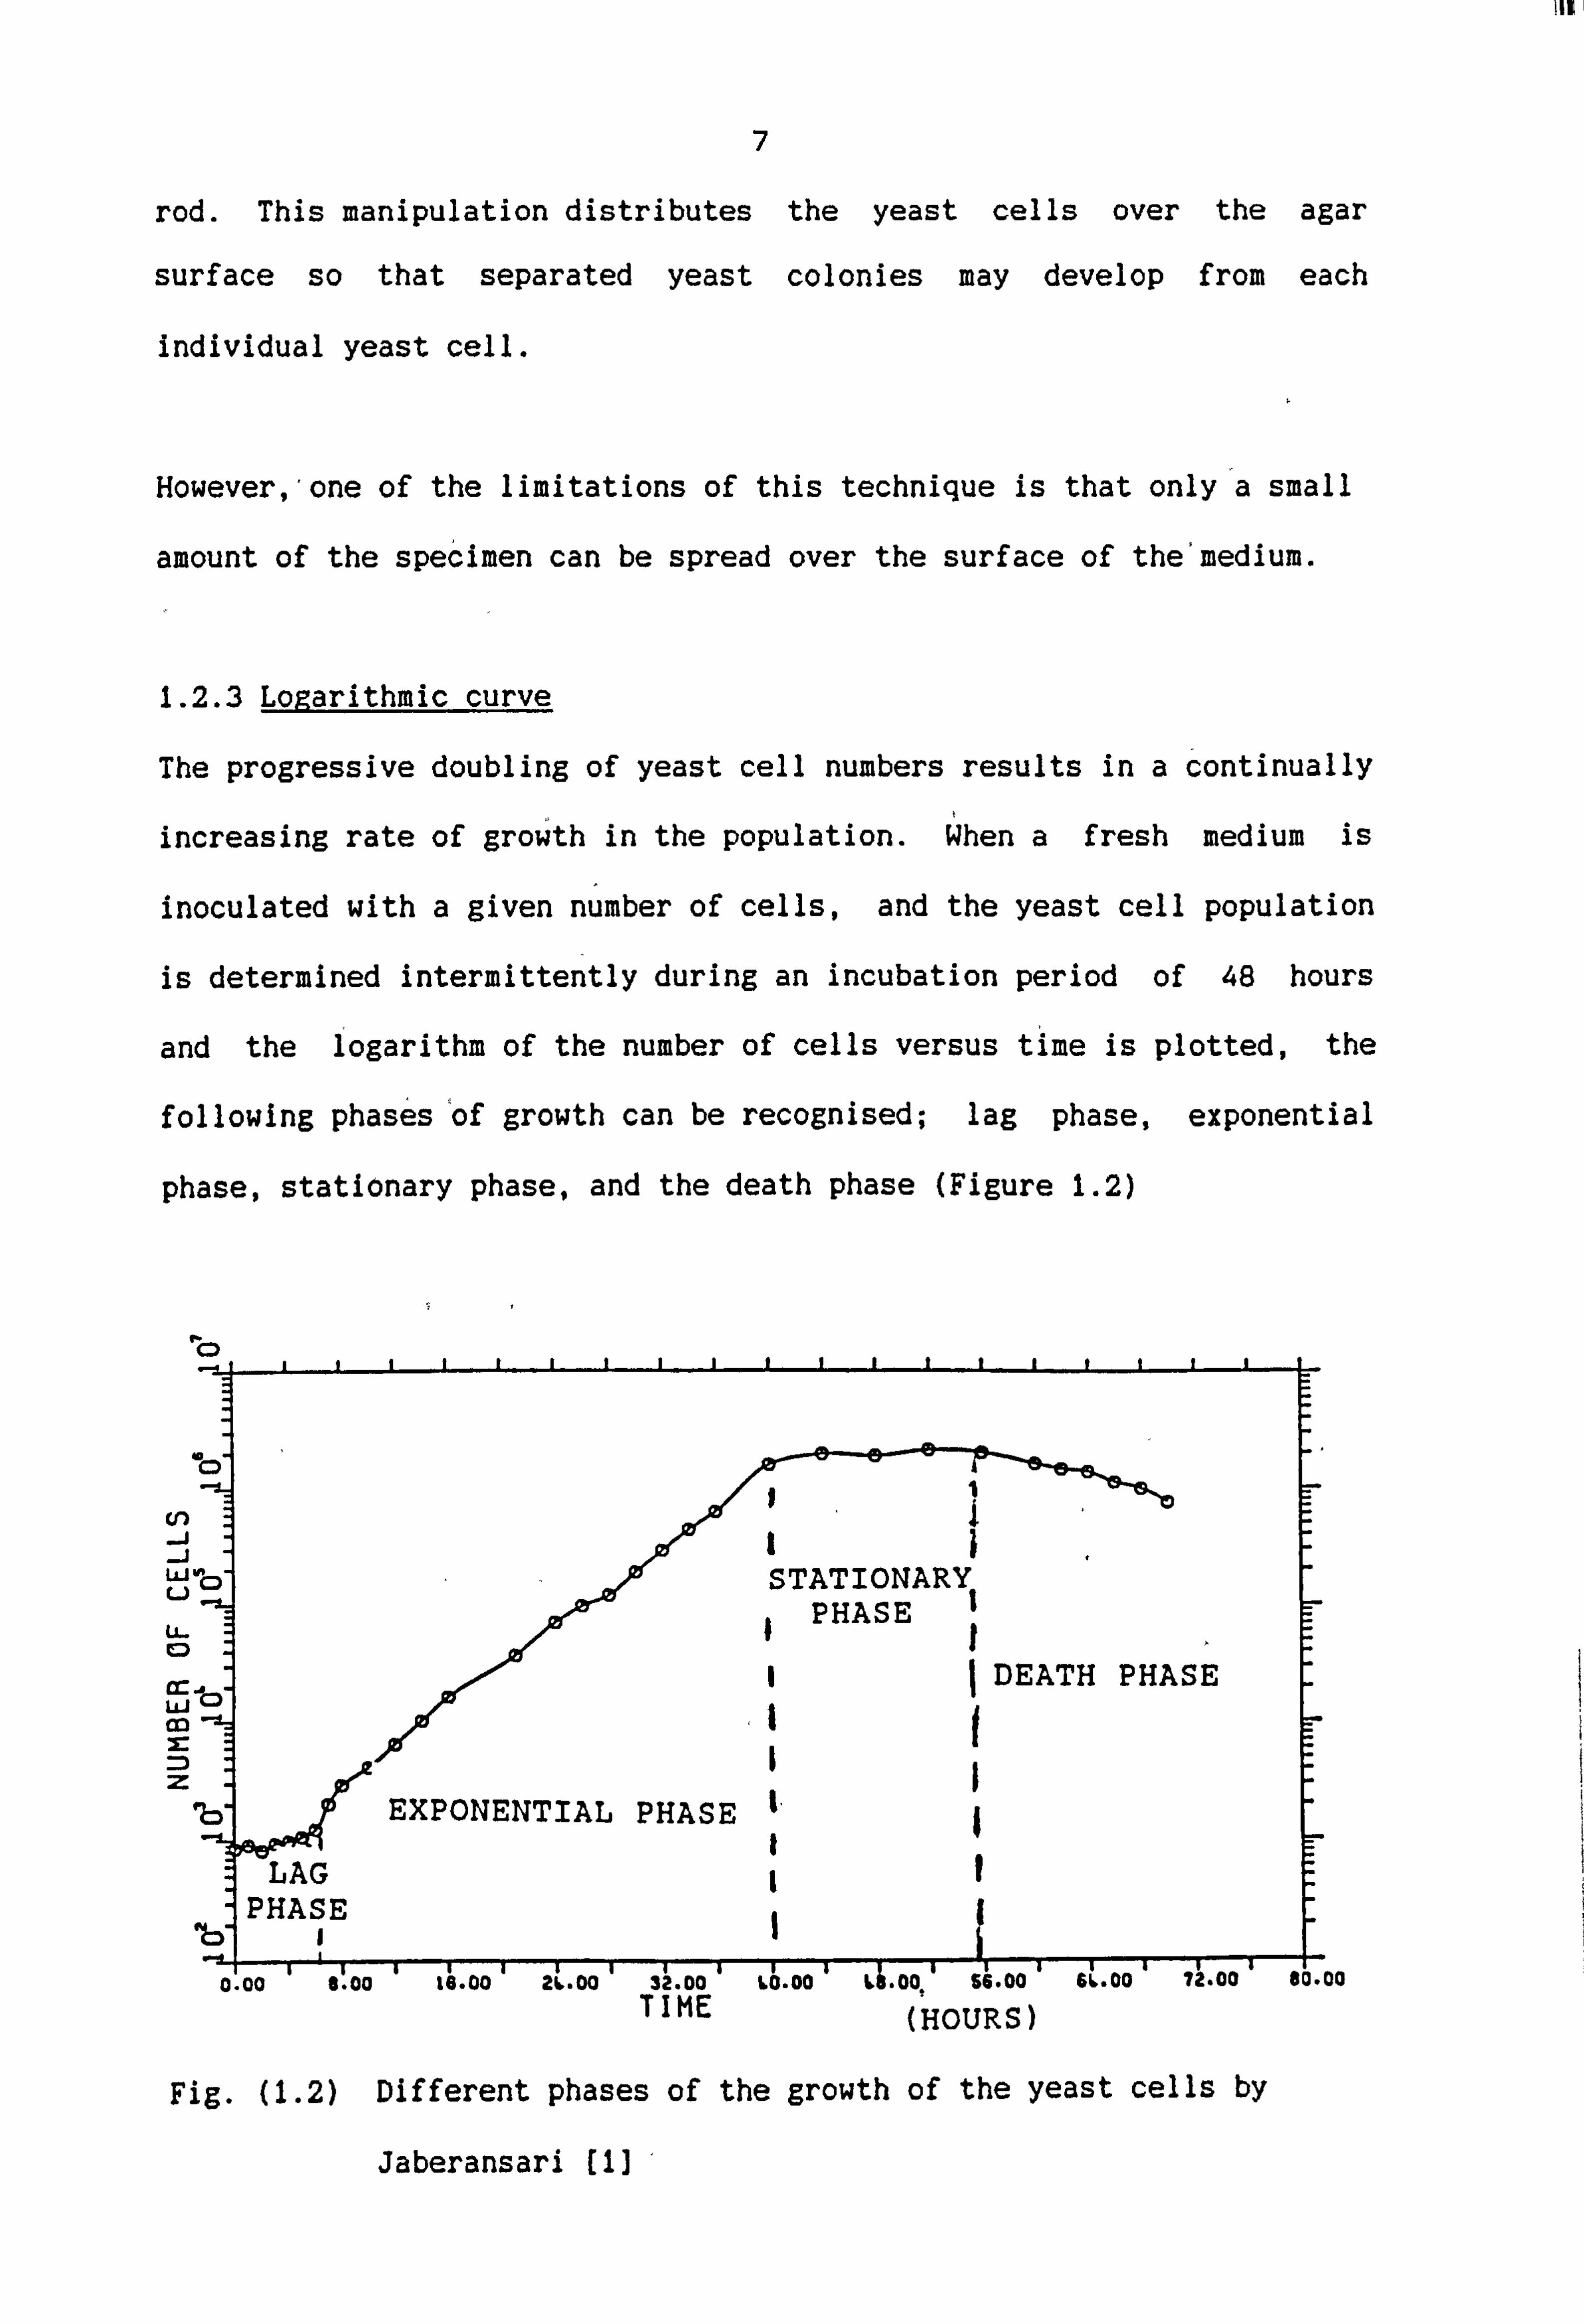
1.2.3 Loizarithmic curve
The progressive doubling of yeast cell numbers results in a continually
increasing rate of growth in the population. When a fresh medium is
inoculated with a given number of cells, and the yeast cell population
is determined intermittently during an incubation period of 48 hours
and the logarithm of the number of cells versus time is plotted, the
following phases'of growth can be recognised; lag phase, exponential
phase, stationary phase, and the death phase (Figure 1.2)
'0
ob-
-j J
IONý u STATIONARY P
u- PHASE
I DEATH PHASE
Co
lb EXPONENTIAL PHASE
LAG Ps HASE
0.00 8,00 16.00 Do L0.00 L4.00" S; -00 61.. 00 721-00 80'. 00 26.00 32' 1 TIAE (HOURS)
Fig. (1.2) Different phases of the growth of the yeast cells by
Jaberansari (11,

8
1.2.3.1 Lag phase
When a yeast cell is inoculated into a fresh medium, growth usually
does not begin immediately but only after a period of time. This
interval is called the Lag phase and it may be brief or extended
depending on the conditions. In this phase, each cell grows by
increasing its cell mass. The cell enlarges, undergoing extensive
macromolecule synthesis. This period is an adaption stage: growth
without cell division. The lag also occurs because the cells must
become adjusted to the new medium before growth can begin. A lag can
be avoided if an exponentially growing culture is transferred to an
identical culture medium at exactly the same temperature. In this
case, no adjustment by the cells is needed, and growth can continue at
the same rate. At, the end of Lag phase, each organism divides. From
experimental graph it can be seen that it takes about four hours from
inoculation before cells start dividing.,
1.2.3.2 Exponential Phase
During this period the cells divide steadily at a constant rate. This
is a consequence of the fact that each cell divides to form two or more
cells, and so on. The growth rate of yeast is also greatly affected by
the culture medium and environmental conditions, especially
temperature. In practice, one usually tries to choose a culture medium
and a temperature that are optimum for the organism.
Exponential growth cannot proceed indefinitely or else the world would
be swamped with micro-organisms. Obviously, something must happen to
limit growth long before this time. What generally happens is that an
essential nutrient of the medium is used, waste products of the yeasts
build up in the medium to an inhibitory level and the yeasts themselves

9
produce specific inhibitutory substances, the colicins. Thus
exponential growth ceases and the population reaches the stationary
phase.
1.2.3.3 Stationary phase
During the stationary phase the population remains the same, and the
birth rate is balanced by the death rate. In this phase the slowing of
the growth rate continues after 40 hours. Here there is also
exhaustion of the nutritional factors of the medium and the
accumulation of waste products. The population then remains constant
for about 16 hours.
1.2.3.4 Death phase
Following the stationary phase, the cells may begin to die off faster
than new cells are produced. Death occurs either because the yeast
undergoes starvation or because some toxic products (colicins) are
produced that accumulate and attenuate the growth or kill the yeast
cells.
It is possible to maintain viable cultures and prevent the onset of the
death phase by removing cultures from the incubator shortly before
exponential growth is over and placing them at a lower temperature,
where growth and function are slowed. Death often occurs less rapidly
if the organism is grown on a culture medium that is not too rich,
since in a rich medium a high population density occurs and hence, more
waste and toxic products build up.
The only way a culture can be maintained is by periodic transfer to a
fresh medium. The growth of the culture must be watched, and as soon
Is I
10
as the stationary phase is approached, a transfer to a fresh medium
should be made.
1.2.4 Synchronous growth
The number of cells in a culture usually increases smoothly because at
any time at least a few cells are dividing, in other words, cell
division is not normally synchronized. However, a population in which
all the cells are undergoing division at approximately the same time is
sometimes desirable,, particularly for growth studies of yeast cells.
But the synchrony generally lasts for only'a few generations since even
the daughters of a single cell soon get out of step with one another.
Synchronization is achieved by inoculating cells into a medium at a
sub-optimal temperature., if they are kept in this condition for some
time, they will metabolize slowly but will not divide. When the
temperature is raised to the optimum, the cells begin to undergo
synchronized division. They may also be given an' osmotic change
"shock" to trigger the division process. When these cells are observed
by phase contrast microscope, they are all reasonably well synchronized
with each other.
1.2.5 Cultivation and examination of Saccharomyces cerevisiae
The basic equipment and techniques needed for growing Sacchromyc-es
cerevisiae involved the following:
1.2.5.1 Preparation of media
Sabouraud liquid media capable of supporting the growth of micro-
organisms are now available in a ready-prepared dehydrated state (Oxoid
Ltd and Difco). It is often convenient to dissolve the ingredients in
water contained in a large beaker or flask, and then dispense the
U-
11
resulting medium into appropriate containers ready for autoclaving.
1.2.5.2 Pressure cooker (steriliser)
This is needed to sterilise media and equipment such as glassware that
will withstand a high temperature. When sterilising media in screw cap
containers, enough room must be left inside the bottle for the medium
to expand and the cap left partially unscrewed so that air can escape.
1.2.5.3 Inoculating cabinets
These are highly desirable for the transfer of microbes to culture
media since they protect the operator from the microbes-he is handling,
and also minimise contamination of the cultures from air-borne
particles. The cabinet consists of a "perspex" box with a-sliding door
to screen the operator from the TUV sterilizing lamp.
1.2.5.4 Containers
The containers employed in the experiments were those required to hold
the culture medium and grow the yeast cells. They are listed below:
i) Petri dishes (diameter 9 cm): sterile plastic petri dishes are now
readily available and these are very convenient for use in a
microbiology laboratory. They are used to grow yeast cells on
solid agar media and can then be disposed of. Glass petri dishes
which can be re-used after sterilization are also available.
ii) Bacteriological tubes are used to hold 10-15 ml of solid or liquid
media. They are glass tubes (25 ml) with a loose metal cap or
cotton wool bung which can be removed with ease when tranferring an
inoculum. Agar media may be prepared as a "deep" or as a "slope",
12
i. e. the agar poured in with the tube vertical, or inclined and
then left to set.
iii) Screw cap glass bottle of 20-30 ml capacity.
iv) Medical flats are flat-bottomed glass containers; the 100 ml and
250 ml sizes are the most useful. The main function of these is to
store large quantities of prepared sterile media. Such volumes of
agar media take about an hour to melt in hot water or several
minutes when using the microwave oven. However, they do save time
when a large number of agar plates have to be poured.
v) Conical flask, preferably 100 and 250 ml are required for growing
the yeast in liquid culture media.
1.3 LEISHMANIA CELLS
Life in the animal world consists of communities'of organisms which
live by eating each other. In a broad sense, all animals are parasites
in that they are helpless without other organisms to produce food for
them. Plants alone are able to build up their body substance out of
sunlight, water and chemicals. But, animal and plants are preyed upon
not only by larger forms which overpower and eat them, they also fall
prey to successively smaller forms of life which attack. and destroy
small more-or-less replaceable portions of the host, or even more
subtly, exploit the energies of the host by subsisting on the food on
which a lot of time and energy has been expended in collecting. There
are vast numbers of species of animals in the world and their common
names differ in different parts of the world. Indeed, the same common
name may refer to different organisms in different places. The only

11 =
13
feasible solution has been to give each organism a scientific name
which does not vary. The genus used in this part of the work is the
Leishmania parasite.
The word Leishmania, which is capitalized, is the genus name. This
indicates the group to which this particular type of parasite belongs.
Different names have also been given ýo
the diseases produced by it,
but infections with Leishmania species are technically called
Leishmaniases. Leishmaniases are examples of zoonoses which reach man
through insect vectors. Various rodents, dogs, and other carnivores
especially, maintain the infection in nature ie. they are "reservoir
hosts". Most mammalian Leishmania can infect man.. We shall discuss
one of the widely accepted groups and the exact species which have been
used during this research programme. Later we shall describe the
physiology of this species and its nutrition and growth, and the
clinical danger of this Leishmania species to man.
1.3.1 Leishmania major
The Leishmanias are heteroxenous. Part of their life cycle is spent in-
the gut of a fly, where they assume the form of a promastigote; the
remainder of their life cycle is completed in vertebrate tissues. The
species of Leishmania used for investigating cellular attachment to the
electrostatically charged petri dishes was the one causing cutaneous
sores, "Le_ishmania major". The second word of "Leishmania major"
(which is not capitalized), is the species name, and indicates the type
of parasite itself. Leishmania major produces a cutaneous ulcer known
as "cutaneous leishmaniasis". There are two varieties of cutaneous
disease which are distinguished on pathological and epidemiological
grounds, the urban type known as L. tropica, and the rural type L. major.

is ý
14
The urban type is found in more densely populated areas. By contrast,
the rural type is found in sparsely inhabited regions. The variety of
Leishmania chosen in this project was the L. major type (cutaneous
leishmaniasis) because of low pathogenisity. These were obtained from
a soldier in a prisoner of war camp (during the Iran-Iraq war) in the
South-western province of Iran known as Khozestan, in middle east Asia.
1.3.2 Physiology of Leishmania major cells
Parasites in the genus Leishmania. are unicellular and usually
uniflagellate elongated organisms measuring 4 to 40 um in total length.
They are either mobile and free-swimming or sedentary and attached to
the cuticle of the invertebrate host's'gut, the sandfly. They belong
to the family Trypanosomatidae of the suborder Trypanosomatina, and
order Kinetoplasticida. They are characterised by a single
mitochondrion containing a small compact mass of DNA. This is the
Kinetoplast which lies close to the base of the flagellum, the
locomotory organelle, and usually stains intensely with Romanowsky
stains such as Giemsa's.
PLACEI-LUM
CIIE. L. i-
0.., 01
K1 NE70 PLAST
44694.
ll th
'. ,
e: 0. '.
9 900.
, UC;
YT Ll; j I-PISIM
Fig. (1.3) Basic structure of "Leishmania major" cells

11 ý
is
1.3.3 Hutrition and growth
Leishmania major cells were grown and suspended in a tissue culture
medium 199 (GIBCO), Grace's insect tissue culture medium (GIBCO) or
Schneiders Drosophila. medium (GIBCO). The above media each
supplemented with 20% foetal calf serum (FCS, Sera-Lab) formed the
basis for the culture system investigated. For convenience, and to
preclude contamination, each culture medium was stored in aliquots of
50 or 100 ml and the FCS was in 5 or 10 ml aliquots prior to use. All
aliquots were incubated at 34ýC. for 72 hours as a sterility check.
Aliquots of tissue-culture medium were then stored at 4-C. and the sera
at -10-C. until needed. Further mention of any of the media studied,
i. e. Grace's, or medium 199, includes 20% FCS (V/V), unless otherwise
indicated.
Leishmania promastigotes multiply by binary fission, doubling every 4-8
hours while in the lag phase of growth.
1.3.4 The Leishmaniases in Man
Although the leishmaniases give rise to important public health
problems, current efforts to control these diseases are insufficient.
The wide diversity of both the clinical forms of the diseases and the
epidemiological situations mean that each focus requires specific
control principles and methods. Moreover, Leishmaniasis control is
usually hampered by ignorance of the true relevance of the diseases and
underestimation of the human suffering and invalidity they cause.
There are a few clinical forms of Leishmaniases in man, but the species
used in this project, L. major, is the least pathogenic, causing a self-
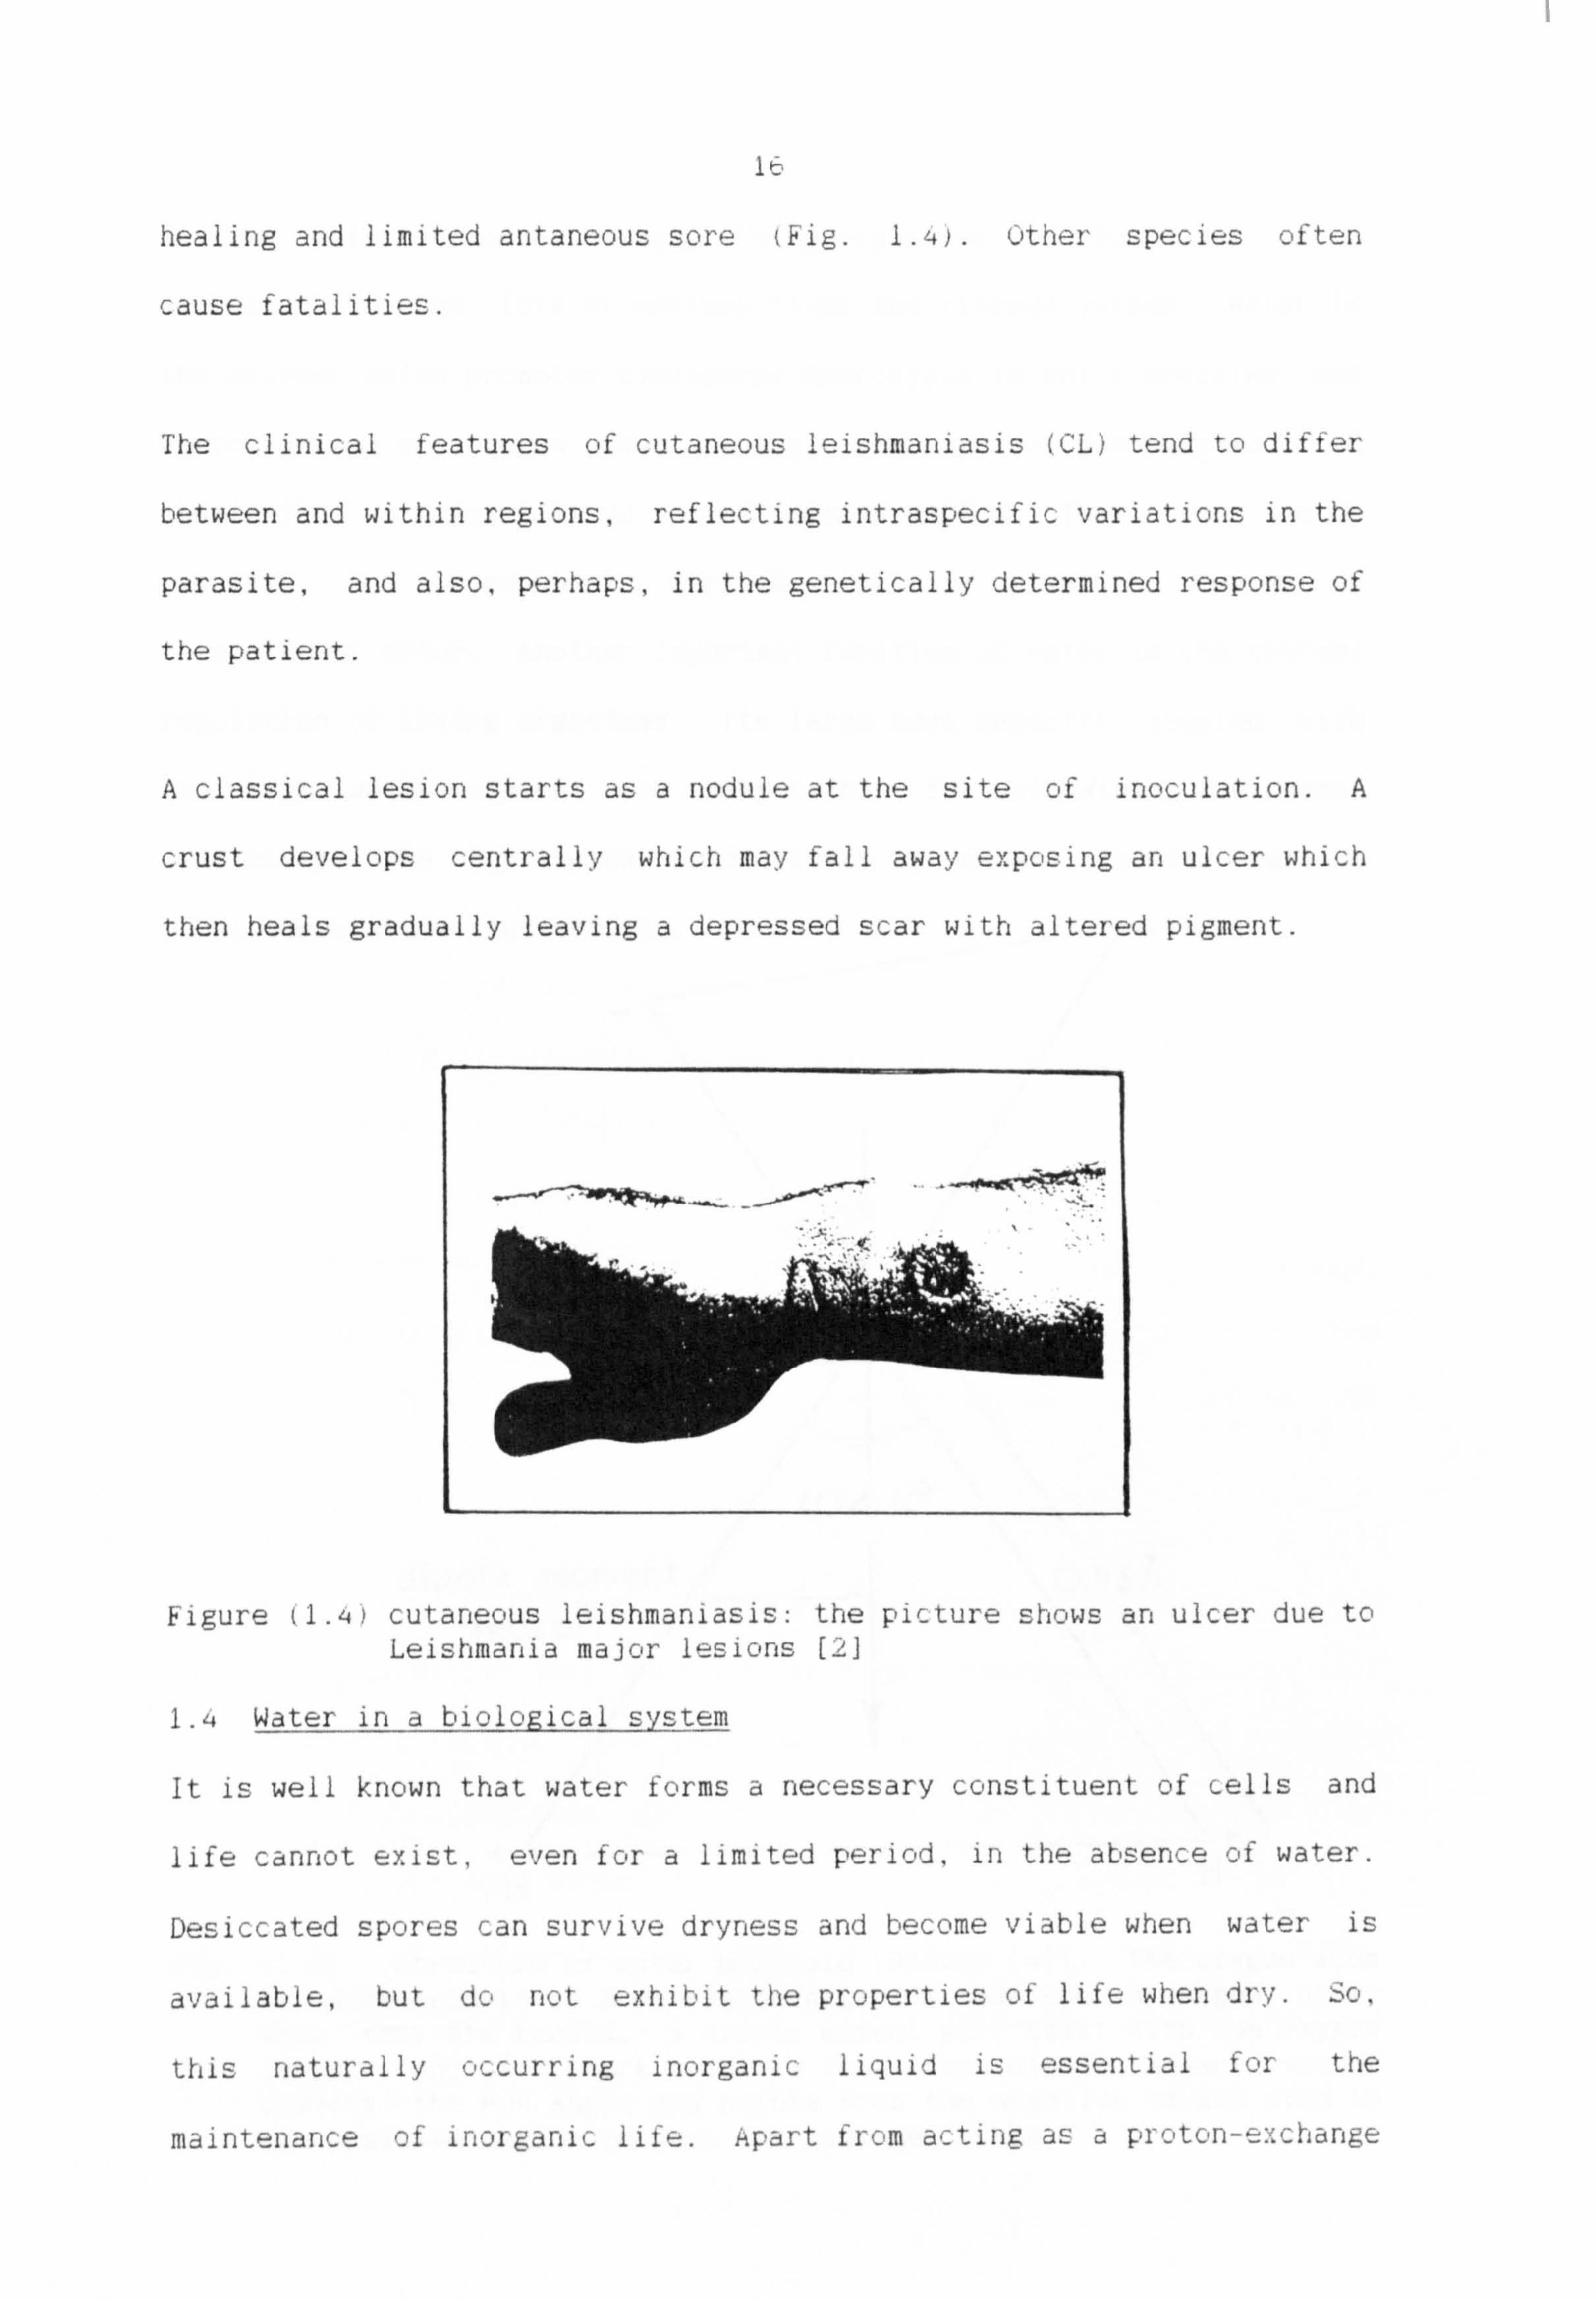
I P;
healing and limited antaneous sore (Fig. 1.4). Other species often
cause fatalities.
The clinical features of cutaneous leishmaniasis (CL) tend to differ
between and within regions, reflecting intraspecific variations in the
parasite, and also, perhaps, in the genetically determined response of
the patient.
A classical lesion starts as a nodule at the site of inoculation. A
crust develops centrally which may fall away exposing an ulcer which
then heals gradually leaving a depressed scar with altered pigment.
Figure cutaneous leishmaniasis: the picture shows an ulcer due to Leishmania major lesions
1.4 Water in a biological system
It is well known that water forms a necessary constituent of cells and
life cannot exist, even for a limited period, in the absence of water.
Desiccated spores can survive dryness and become viable when water is
available, but do not -7-xhibit the properties of life when dry. So,
this naturally occurring inorganic liquid is essential for the
maintenance of inorganic life. Apart from acting as a proton-exchange
-0

17
medium, water permeates through living organisms and functions as a
lubricant in the form of surface films and viscous juices. Water is
the solvent which promotes biological hydrolysis in which proteins and
carbohydrates are broken doWn; lipids, although not actually modified
chemically, are solubilized in the aqueous medium. Thus, the energy
required for biosynthesis derives partially from the energy of
formation of water. Another important function of water is the thermal
regulation of living organisms, its large heat capacity coupled with
the high water content are responsible for maintaining isothermal
conditions. The high thermal conductivity of water prevents serious
local temperature fluctuations.
,7 Ln
404.5
dipole moment 0.96A 9 Yect or
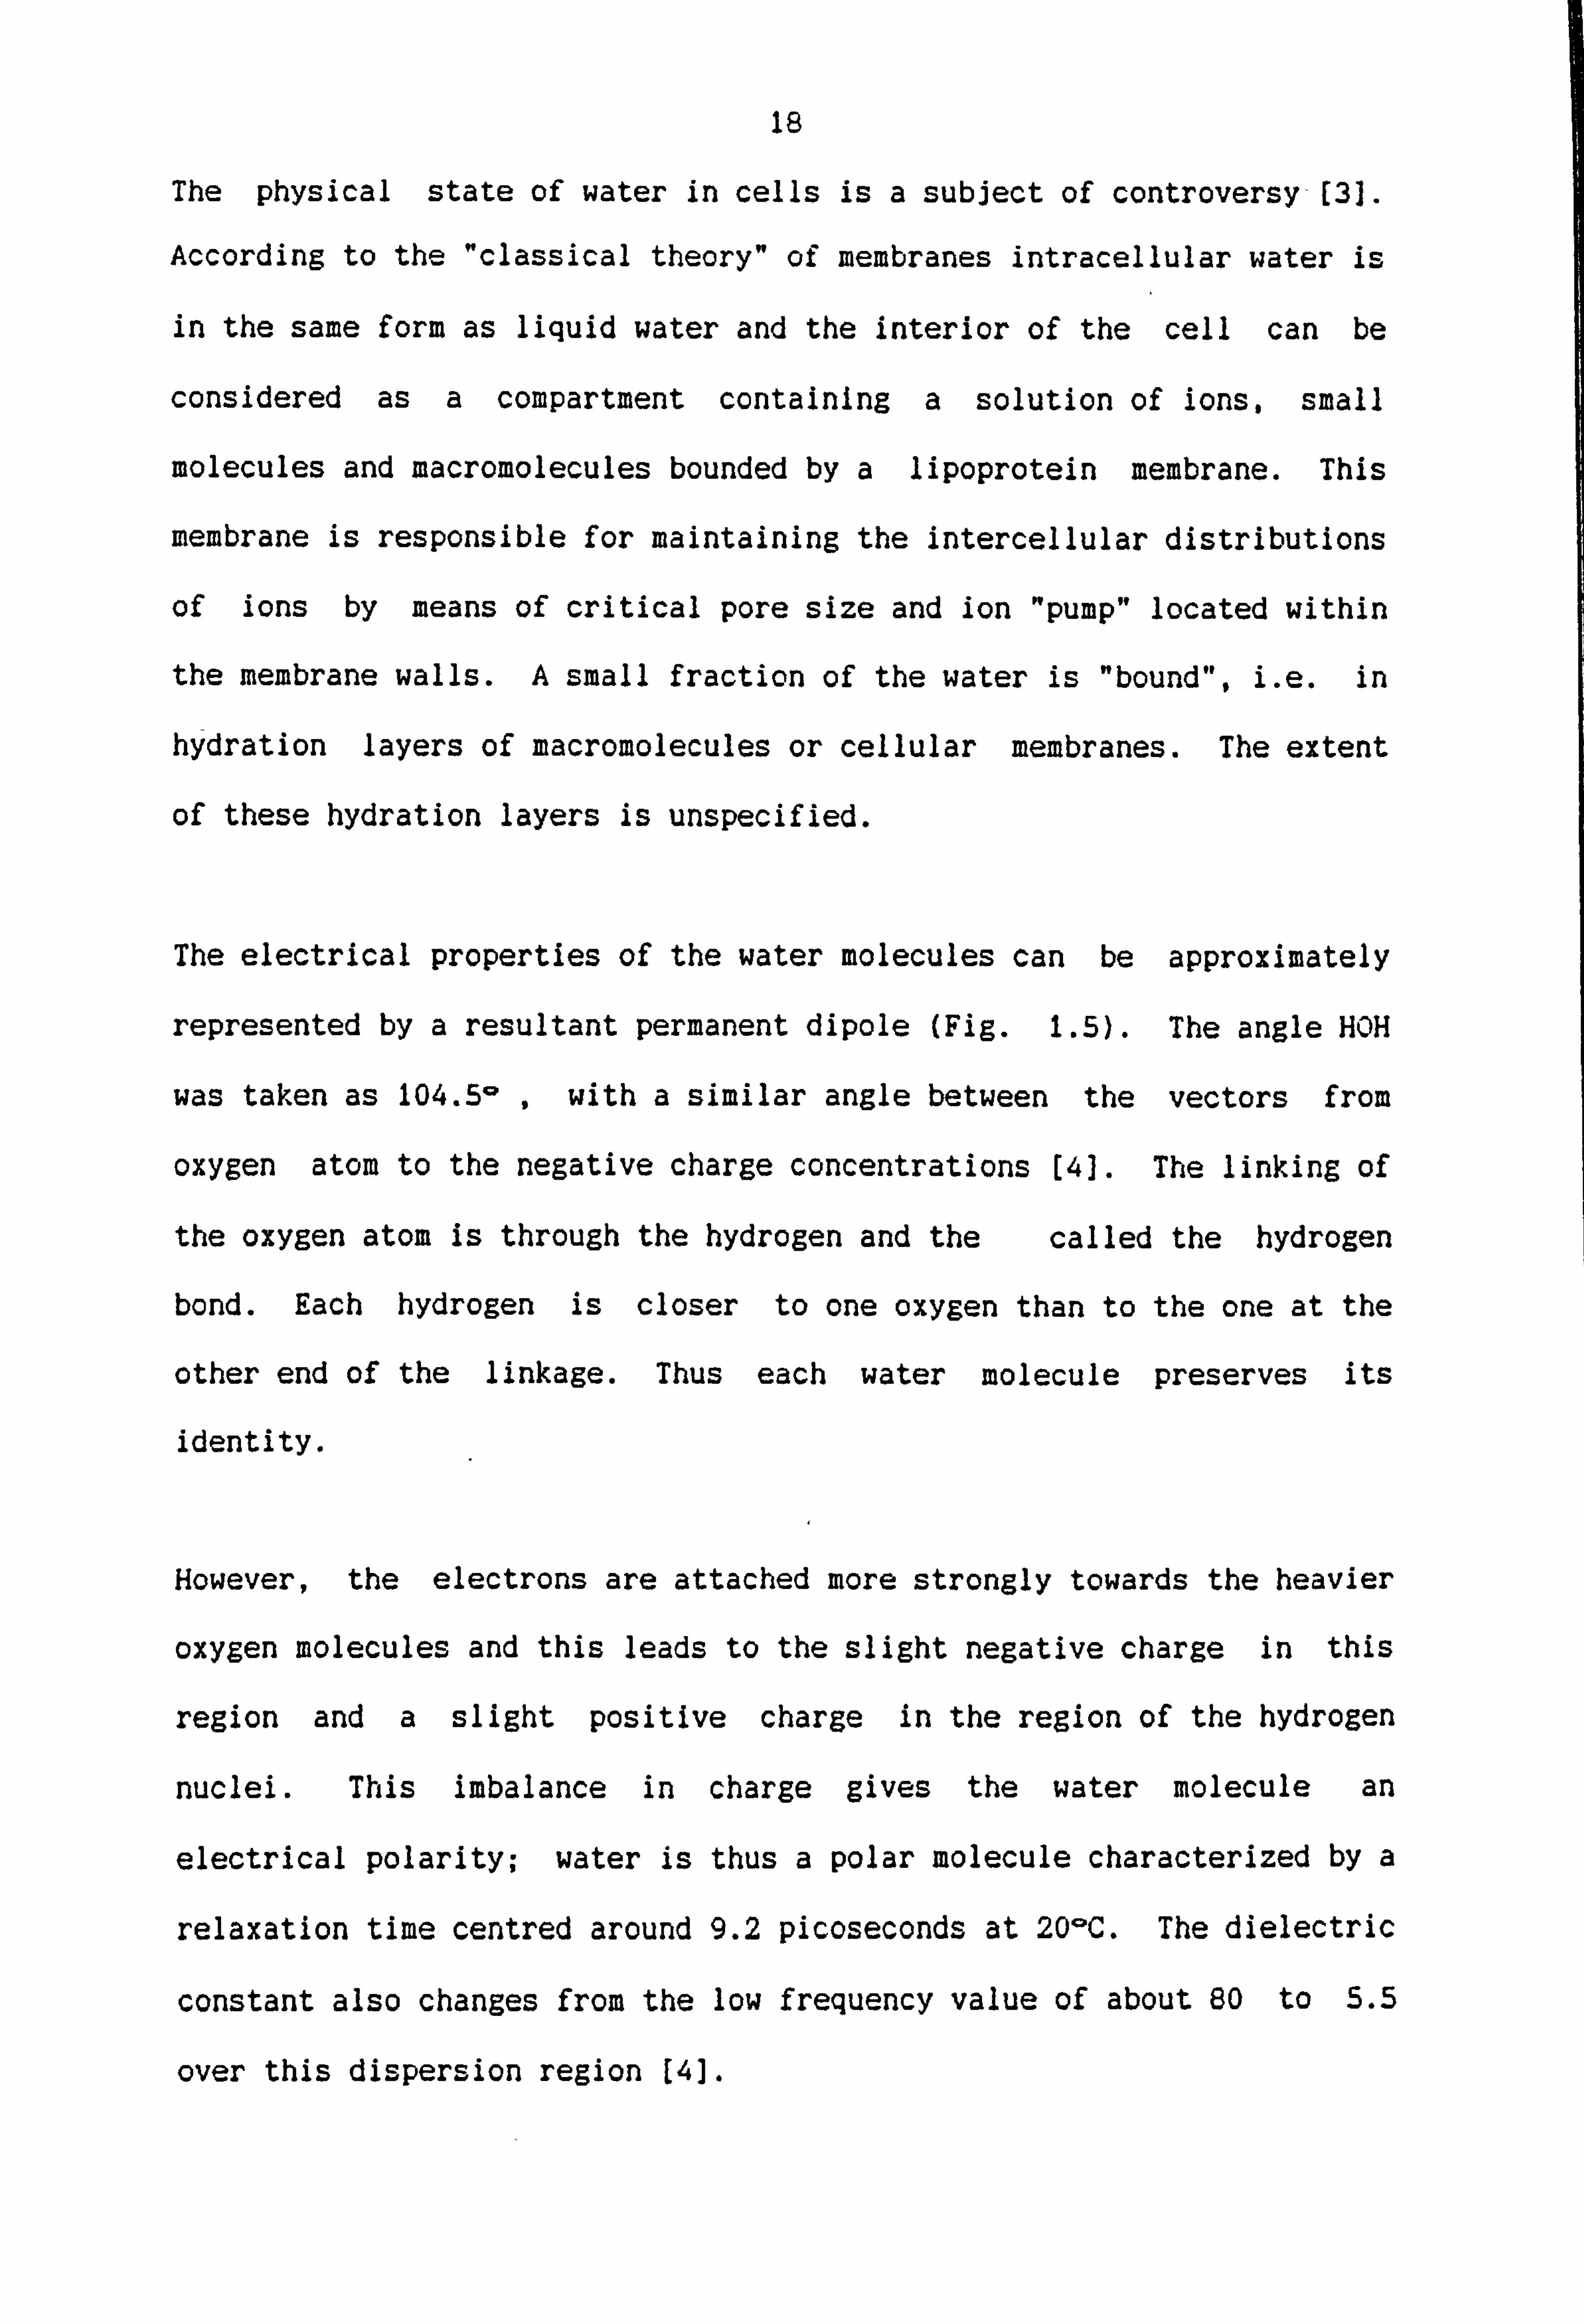
Fig. (1.5) Structure of water molecule (HASTED (4]). The oxygen atom is considered to be more electronegative than the hydrogen atom. When they are bonded, a dipole moment will exist with the oxygen negative and it appears probable that the dipole moment vector bisects the HOH angle and points from the negative oxygen atom to the positive region between the hydrogen atoms.
18
The physical state of water in cells is a subject of controversy-[31.
According to the "classical theory" of membranes intracellular water is
in the same form as liquid water and the interior of the cell can be
considered as a compartment containing a solution of ions, small
molecules and macromolecules bounded by a lipoprotein membrane. This
membrane is responsible for maintaining the intercellular distributions
of ions by means of critical pore size and ion "pump" located within
the membrane walls. A small fraction of the water is "bound", i. e. in
hydration layers of macromolecules or cellular membranes. The extent
of these hydration layers is unspecified.
The electrical properties of the water molecules can be approximately
represented by a resultant permanent dipole (Fig. 1.5). The angle HOH
was taken as 104.5- , with a similar angle between the vectors from
oxygen atom to the negative charge concentrations [4]. The linking of
the oxygen atom is through the hydrogen and the called the hydrogen
bond. Each hydrogen is closer to one oxygen than to the one at the
other end of the linkage. Thus each water molecule preserves its
identity.
However, the electrons are attached more strongly towards the heavier
oxygen molecules and this leads to the slight negative charge in this
region and a slight positive charge in the region of the hydrogen
nuclei. This imbalance in charge gives the water molecule an
electrical polarity; water is thus a polar molecule characterized by a
relaxation time centred around 9.2 picoseconds at 20-C. The dielectric
constant also changes from the low frequency value of about 80 to 5.5
over this dispersion region [4].
19
Although the water structure does not exist for any appreciable period
of time, "'but it might well have a significance and a long range
coherence on a time-scale of the order of picoseconds. According to
Hasted (51, -the lifetimes of any dipole ordering and the vibrational
and rotational modes of any such structuring would be very sensitive to
changes in pressure, temperature and to the presence of solutes.
Water accounts for between 60% and 90% of the weight of a micro-
organism. According to Rose (5] the water requirements of micro-
organisms can be expressed quantiatively in the form of the water
activity (a. ) of the environment or substrate, this is equal to P/F. ,
P being the vapour pressure of the solution and P.. the vapour pressure
of water. Water has an a. value of 1.00, this value decreases when
solutes are dissolved in water.
Yeasts vary in the optimum a. values required for growth, but the
minimum values for these organisms (0.91 - 0.88) are lower than those
of the majority of bacteria (5].
The general effect of lowering the a. value of a medium below the
optimum is to increase the length of the lag phase of growth and to
decrease the growth rate and the size of the crop of the organism [6].
It must be concluded that from the different ways in which water is
involved with the life processes indicates clearly that water, acting
as a solvent, a dispersing and lubricating medium, a versatile reactant
and that, morphologically and functionally - life as we know it and
water are inseparable. It is therefore, hardly surprising that living
organisms are sensitively attuned to the properties of their water.
6
H
REFERENCES
JABERANSARI, M. "Dielectrophoresis, electrodynamic and magnetic resonance phenomena in yeast cells", M. Sc. Thesis, University of Salford, 1985
2) The LEISHMANIASES, Report of a WHO expert committee. World Health Organization, Geneva, 1984.
3) CLEGG, J. Trans -far. so c- 91938 134 vp
4) HASTED, J. B. "Aqueous dielectrics", ed. A. D. Buckingham. London: Chapman and Hall, 1973.
5) ROSE, A. H. "Chemical microbiology", 3rd ed. London: Butterworth, 1976.

CHAPTER (2)
DIELECTROPHORESIS, PEARL CHAIN FORMATION AND CELLULAR ROTATION IN BIOLOGICAL SYSTEMS
on
20
2.1 INTRODUCTION
This chapter considers the subject of "Dielectrophoresis" in the
context of "bunching effects" by which the cells are brought into close
contact by means of an alternating electric field. The cells often
form chain-like patterns, hence the commonly applied term "pearl chain"
formation. This is described in the second part of this chapter.
It is not unusual to see several cells in a long "pearl chain" of cells
spinning individually in their places as the frequency is changed.
Several types of electric fields can be used to produce this
phenomenon, including circularly rotating fields using a multiplicity
of electrodes. Part C of this chapter presents a theory to explain the
spin of cells by an applied electric field.
2.2 Dielectrophoresis
"Dielectrophoresis" is defined [11 as the motion of matter due to
polarization effects in a non-uniform electric field in which the most
polar matter moves towards the region of greatest field intensity. It
is to be carefully distinguished from motion caused by the response to
free charge on a body in an electric field (uniform or non-uniform),
which is known as electrophoresis and is proportional to the field. In
dielectrophoresis studies it is therefore important to use alternating
fields because this effect depends on the square of the field and
electrophoretic effects are thereby eliminated.
Dielectrophoresis has a relatively simple physical explanation. Any
electric field, uniform or non-uniform, exerts a force upon a charged
body. It is characteristic of non-uniform fields however, that they
exert a force upon neutral bodies. A wide variety of interesting and

I'llit -
21
useful events take place as a result. The use of biological
dielectrophoresis is generally restricted to the use of alternating
electric fields rather than static fields as applied in
electrophoresis. This is a major point of difference in the two
techniques.
It is helpful, in considering the nature of the action of a non-uniform
field upon neutral matter, to explain the various possible responses of
yeast cells to non-uniform fields.
By comparison with uniform field effects, the deliberate study of non-
uniform field phenomenon has been attempted by relatively few workers.
Wrede [21 in the late 1920s studied the use of non-uniform electric
fields to deflect molecular beams, and in 1938 Muller [31 presented
theoretical evidence to show that non-uniform field effects would not
be significant for molecular sized particles. More recently, this
subject has gained fresh momentum, chiefly as a result of the
considerable and significant work by Pethig, Zimmerman & Pohl. [1,4,
5]. This work, together with that of Losche & Hultschig [61, has given
both a theoretical and practical foundation for the study of
dielectrophoresis. The effects are easily measurable for large neutral
particles of solid, liquid, or gas. But, as the size of the
electrically neutral particles approaches that of small yeast cells
(approx. 5 Vm), the random thermal processes of Brownian Motion begin
to mask dielectrophoretic phenomena.
It is the purpose of this chapter to outline the physical principles of
dielectrophoresis, and to indicate its relevance to the study of
yeast cells.

I MISS
22
2.2.1 Basic theory of dielectrophoresis
In understanding the action of non-uniform electric fields on
electrically neutral particles, it will be helpful, first, to consider
the action of electric fields on electrically charged particles. If a
particle possessing a positive charge +Q is placed in a uniform
electric field of intensity E volts/meter, it will experience a force
F=Q. E, and will be pulled along the field lines towards the electrode
of opposite polarity, in this case the cathode, as shown in Fig. (2.1).
The behaviour of neutral particles is different.
(a)
/ -- --
I. -
I
- - -
Chirged body - mo-, cs along fidJ lincs
---
(4 )-___ (-I
Neutral body - merely pul. trized
UNIFORM FIELD
// .-
Charted body - moves along field lines
Ncutrzil body - . polarized and pulled toward strongest field region
NONUNIFORM FIELI
Fig. (2.1) Comparison of behaviour of neutral and charged bodies in (a) a uniform electric field; (b) a non-uniform electric field (7)
In a uniform field the neutral particle will merely become polarized,
with a positive charge being induced on the side nearest the cathode,
and a negative charge on the opposite side nearest the anode, as shown
in Figure (2.1a). Since the particle is electrically neutral, then
these two regions of induced charge will be of equal magnitude. The
extent of the polarization will depend upon its total polarizability.
23
If the particle is composed of anisotropic material, or the particle is
asymmetric in shape (e. g. elongated), then this polarization may
produce a torque acting upon the particle to orientate or align it with
the field direction. No such torque will result for a uniformly
isotropic particle. Whether or not an induced torque results, no net
force will act upon this neutral particle in a uniform field, and it
will remain motionless unless subjected to forces arising from other
effects.
In a non-uniform electric field, the behaviour of neutral particles is
different. The neutral particle will again become polarized, but now a
net force will act upon the particle so as to give it a translational
motion towards the region of strongest electric field. This effect can
be described with reference to Fig. (2.1), where it is seen that the
field E, to the left of the neutral particle is greater than the field
E, to the right.
The induced positive and negative charge &q
particle will still have equal magnitudes
proportional to Et 6q pulling the particle t,
exceed that pulling it towards the low field
This net force producing the translational
dielectrophoretic force.
on the sides of the
so that the net force,
Dwards the cathode will
direction of the anode.
motion is termed the
If the polarity of the electrode arrangement shown in Fig. (2.1) were
to be reversed, the neutral particle would still move towards the left,
in other words, towards the region of greatest field intensity. This
now indicates another fundamental difference between the behaviour of
charged and neutral particles in electric fields. In an alternating

24
electric field, the charged particle will always tend to move towards
the electrode having the opposite polarity to its own net charge; it
appears, in fact, that a more detailed analysis shows that a gentle
force acts upon a charged particle in an alternating field so as to
force it away from the region of highest field intensity (7].
A neutral particle, on the other hand, will tend towards the field
region of maximum intensity, no matter what is happening to the
polarity of the electrode producing the region of maximum field
intensity.
The theory for the force exerted by a non-uniform field on an
electrically neutral body suspended in a fluid medium, will now be
outlined. Provided certain assumptions are made, this theory can be
reduced to a relatively simple analytical expression. The treatment
given here is based on that given by Pethig (1].
In a static field, the net translational force on a neutral small body
at equilibrium is given by
F= (P. L)E (2.1)
where u is the dipole moment vector (induced or permanent), L is the
del vector, and E the external electric field. For the case where the
neutral dielectric body is homogeneously, linearly, and isotropically
polarizable, then
p= *(VE (2.2)
where t( is the polarizability, and V is the volume of the body.

25
This gives
F= ON (E. a) E (2.3)
= XVL(E')/2.
Now consider the body to be a sphere of radius a, composed of an ideal
(zero conductivity) dielectric of permittivity K2, suspended in an
ideal dielectric fluid medium of infinite extent and permittivity KI,
then the field interior Ei., to the small spherical body associated with
an external field E is given by:
3K1 EIL" =( ---------- ) E. (2.4)
K2 + 2K,
The induced polarization per unit volume is:
H= K2 W2 - K2) Et., (2.5)
and the induced dipole moment of polarizable sphere is given by:
V= VH = CKVE
the polarizability of per unit volume is therefore given (equations
(2.4) and (2-5) as
E &,, H/E = (K; z - KO ---
E
K-- -K jL Ul -------
K2 + 2K, (2.6)
and from equation (2.3), the total dielectrophoretic force F acting on
the small sphere of volume V= 4/3 P is given by
Ki (K2-Ki) 2ffa --------- (E2). (2.7)
W2 +2Kt
From this equation we see that the dielectrophoretic force depends
directly upon the volume and polarizability of the body, and upon the
square of the electric field intensity. This field square law
dependence reminds us that dielectrophoresis is independent of the sign
26
of the field, and that it can take place in both an alternating and
static field.
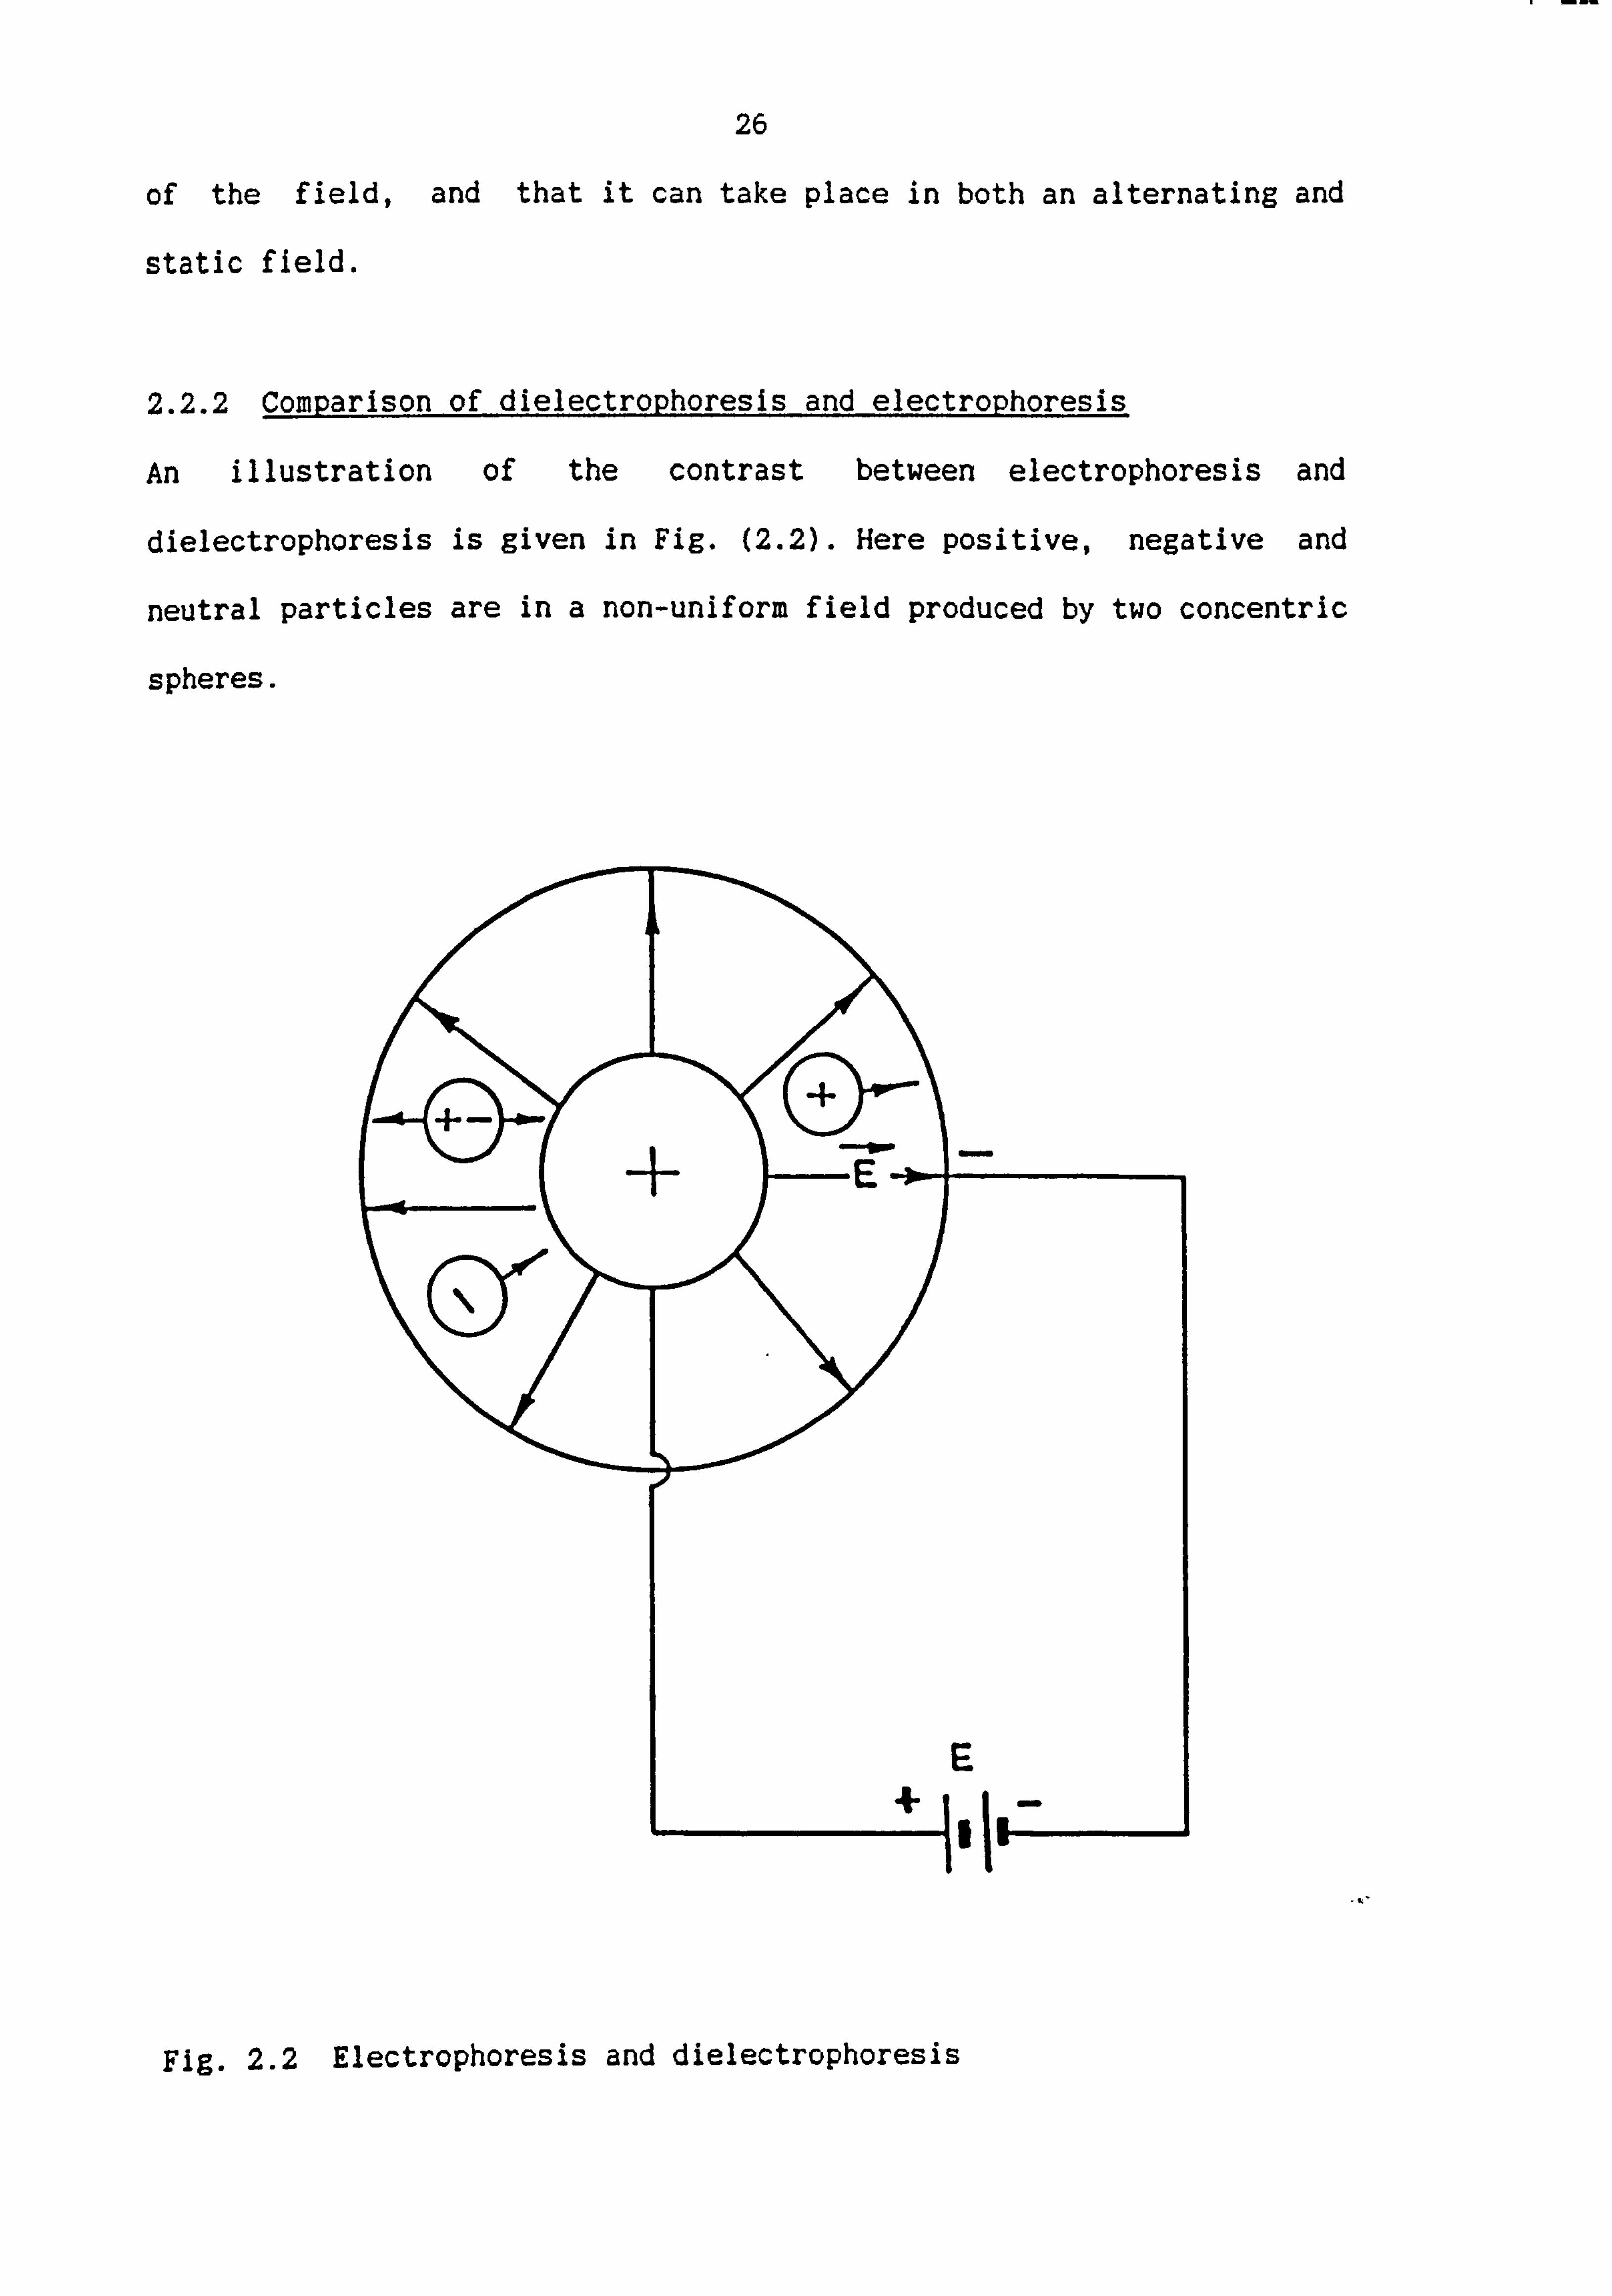
2.2.2 Comparison of dielectrophoresis and electrophoresis
An illustration of the contrast between electrophoresis and
dielectrophoresis is given in Fig. (2.2). Here positive, negative and
neutral particles are in a non-uniform field produced by two concentric
spheres.
Fig. 2.2 Electrophoresis and dielectrophoresis
mat
27
The charged particles obey the laws of electrostatics and move to the
oppositely charged electrodes, the positive charge toward the outer
wall and the negative charge toward the central sphere. The neutral
particle is polarised by the field and its individual charges lie in a
stronger field than the positive charges which experience a stronger
force. The result is a net force on the particle in the direction of
the central electrode. A change in polarity of the electrodes causes
the charge particles to reverse their direction of motion. The neutral
particle, however, continues to be pulled inward. An alternating
electric field will cause the electrophoresis forces to average to
zero, leaving only the dielectrophoresis effects. In dielectrophoretic
studies it is, therefore, important to use alternating fields.
Dielectrophoresis deposits volumes of particles proportional to the
applied voltage during equal times of deposition, provided a
substantial difference exists in the relative permittivities of the
particle and the surrounding medium [ie. W2 - Ki) ), 11.
Electrophoresis can be appreciable even when the free charge- per unit
volume of the particle is quite small: it is unlike dielectrophoresis
in that it does not depend upon the particle volume (and hence upon the
total polarization available), but rather upon the free charge on the
particle.
2.3 Pearl chain formation
The pearl chain formation arises in the following way. The particles
which have a polarizibility greater than that of the surrounding
medium, distort the field. Each particle then experiences a non-
uniform field near the other. As each is already polarized by the
external field, the particles are then attracted to the regions of
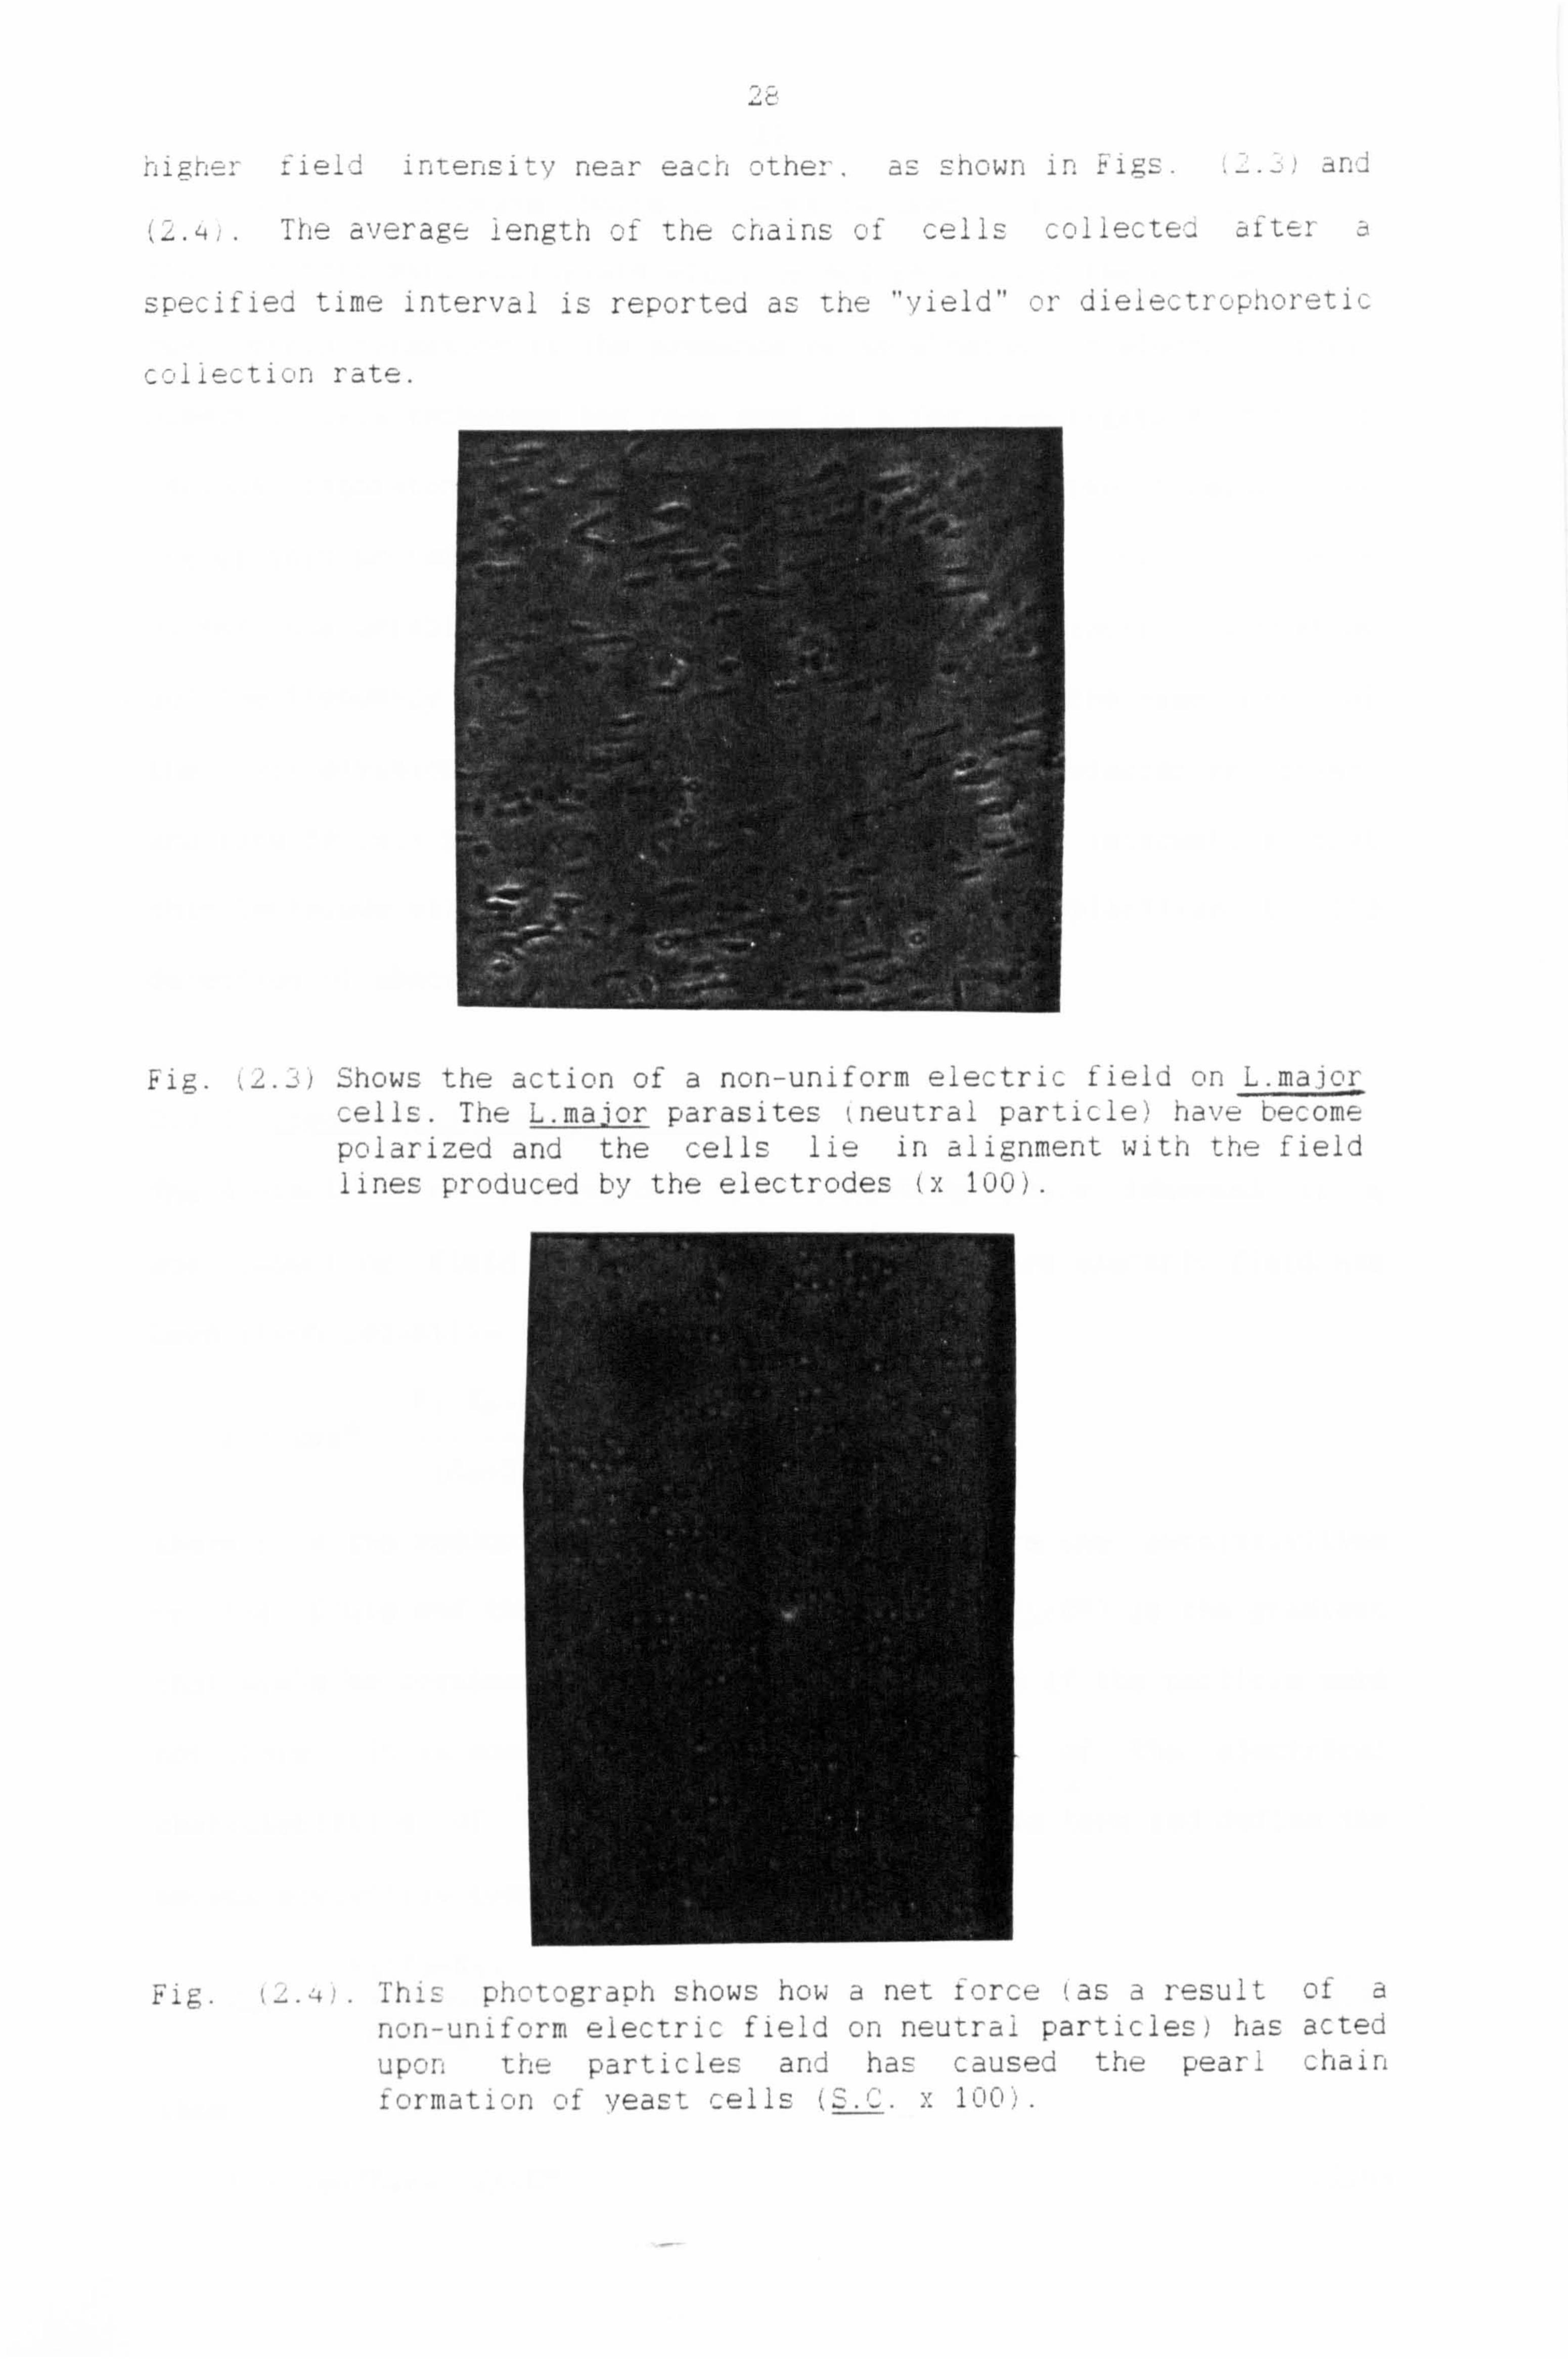
and hieidir., L eris i ýv nea r ea ch t he--- a-c shown in Fig's
Tht average iength cf T- '4 ,. he rýlairls C, f cells ý c, Iiect c-a af ter a
specified time interval is reported as the "vield" or dieie-ctrcýphoretic
rate.
pig. Shows the action of a non-uniform eiectri, - fieid on L. ma)cýi cells. The L. major parasites , neutral particle'ý have become polarized and the cells lie in aiignment with the field lines produced the --lectrodes ý,,: luu).
1ý 2ý1-1 : jv I 1, -ý -ý I I'D r3E-: 1 1' eSU ol
eiectri-- field c., r, neuTrai particles, ý has ac ted upon, the particies and has caused the peari chain lormatic'n Dt veast cells (Sý., -'. x 100) .
29
This rather unfortunate choice of terms is used, probably, to explain
the fact that many biologists still do not know about the phenomenon of
pearl chain formation in the presence of an alternating electric field.
However, this technique has been used by a few investigators [2-5) in
various laboratories for the separation and isolation of cells. The
use of this procedure for cell separation presupposes that the cells
differ considerably in their volume, since their dielectric properties
and the frequency dependence of these properties for the same part of
the cell division cycle are very similar. Such differences in volumes
are rare in cell preparation of medical or biological interest, so that
this technique will probably find only limited application to the
detection of abnormalities in-dielectric properties.
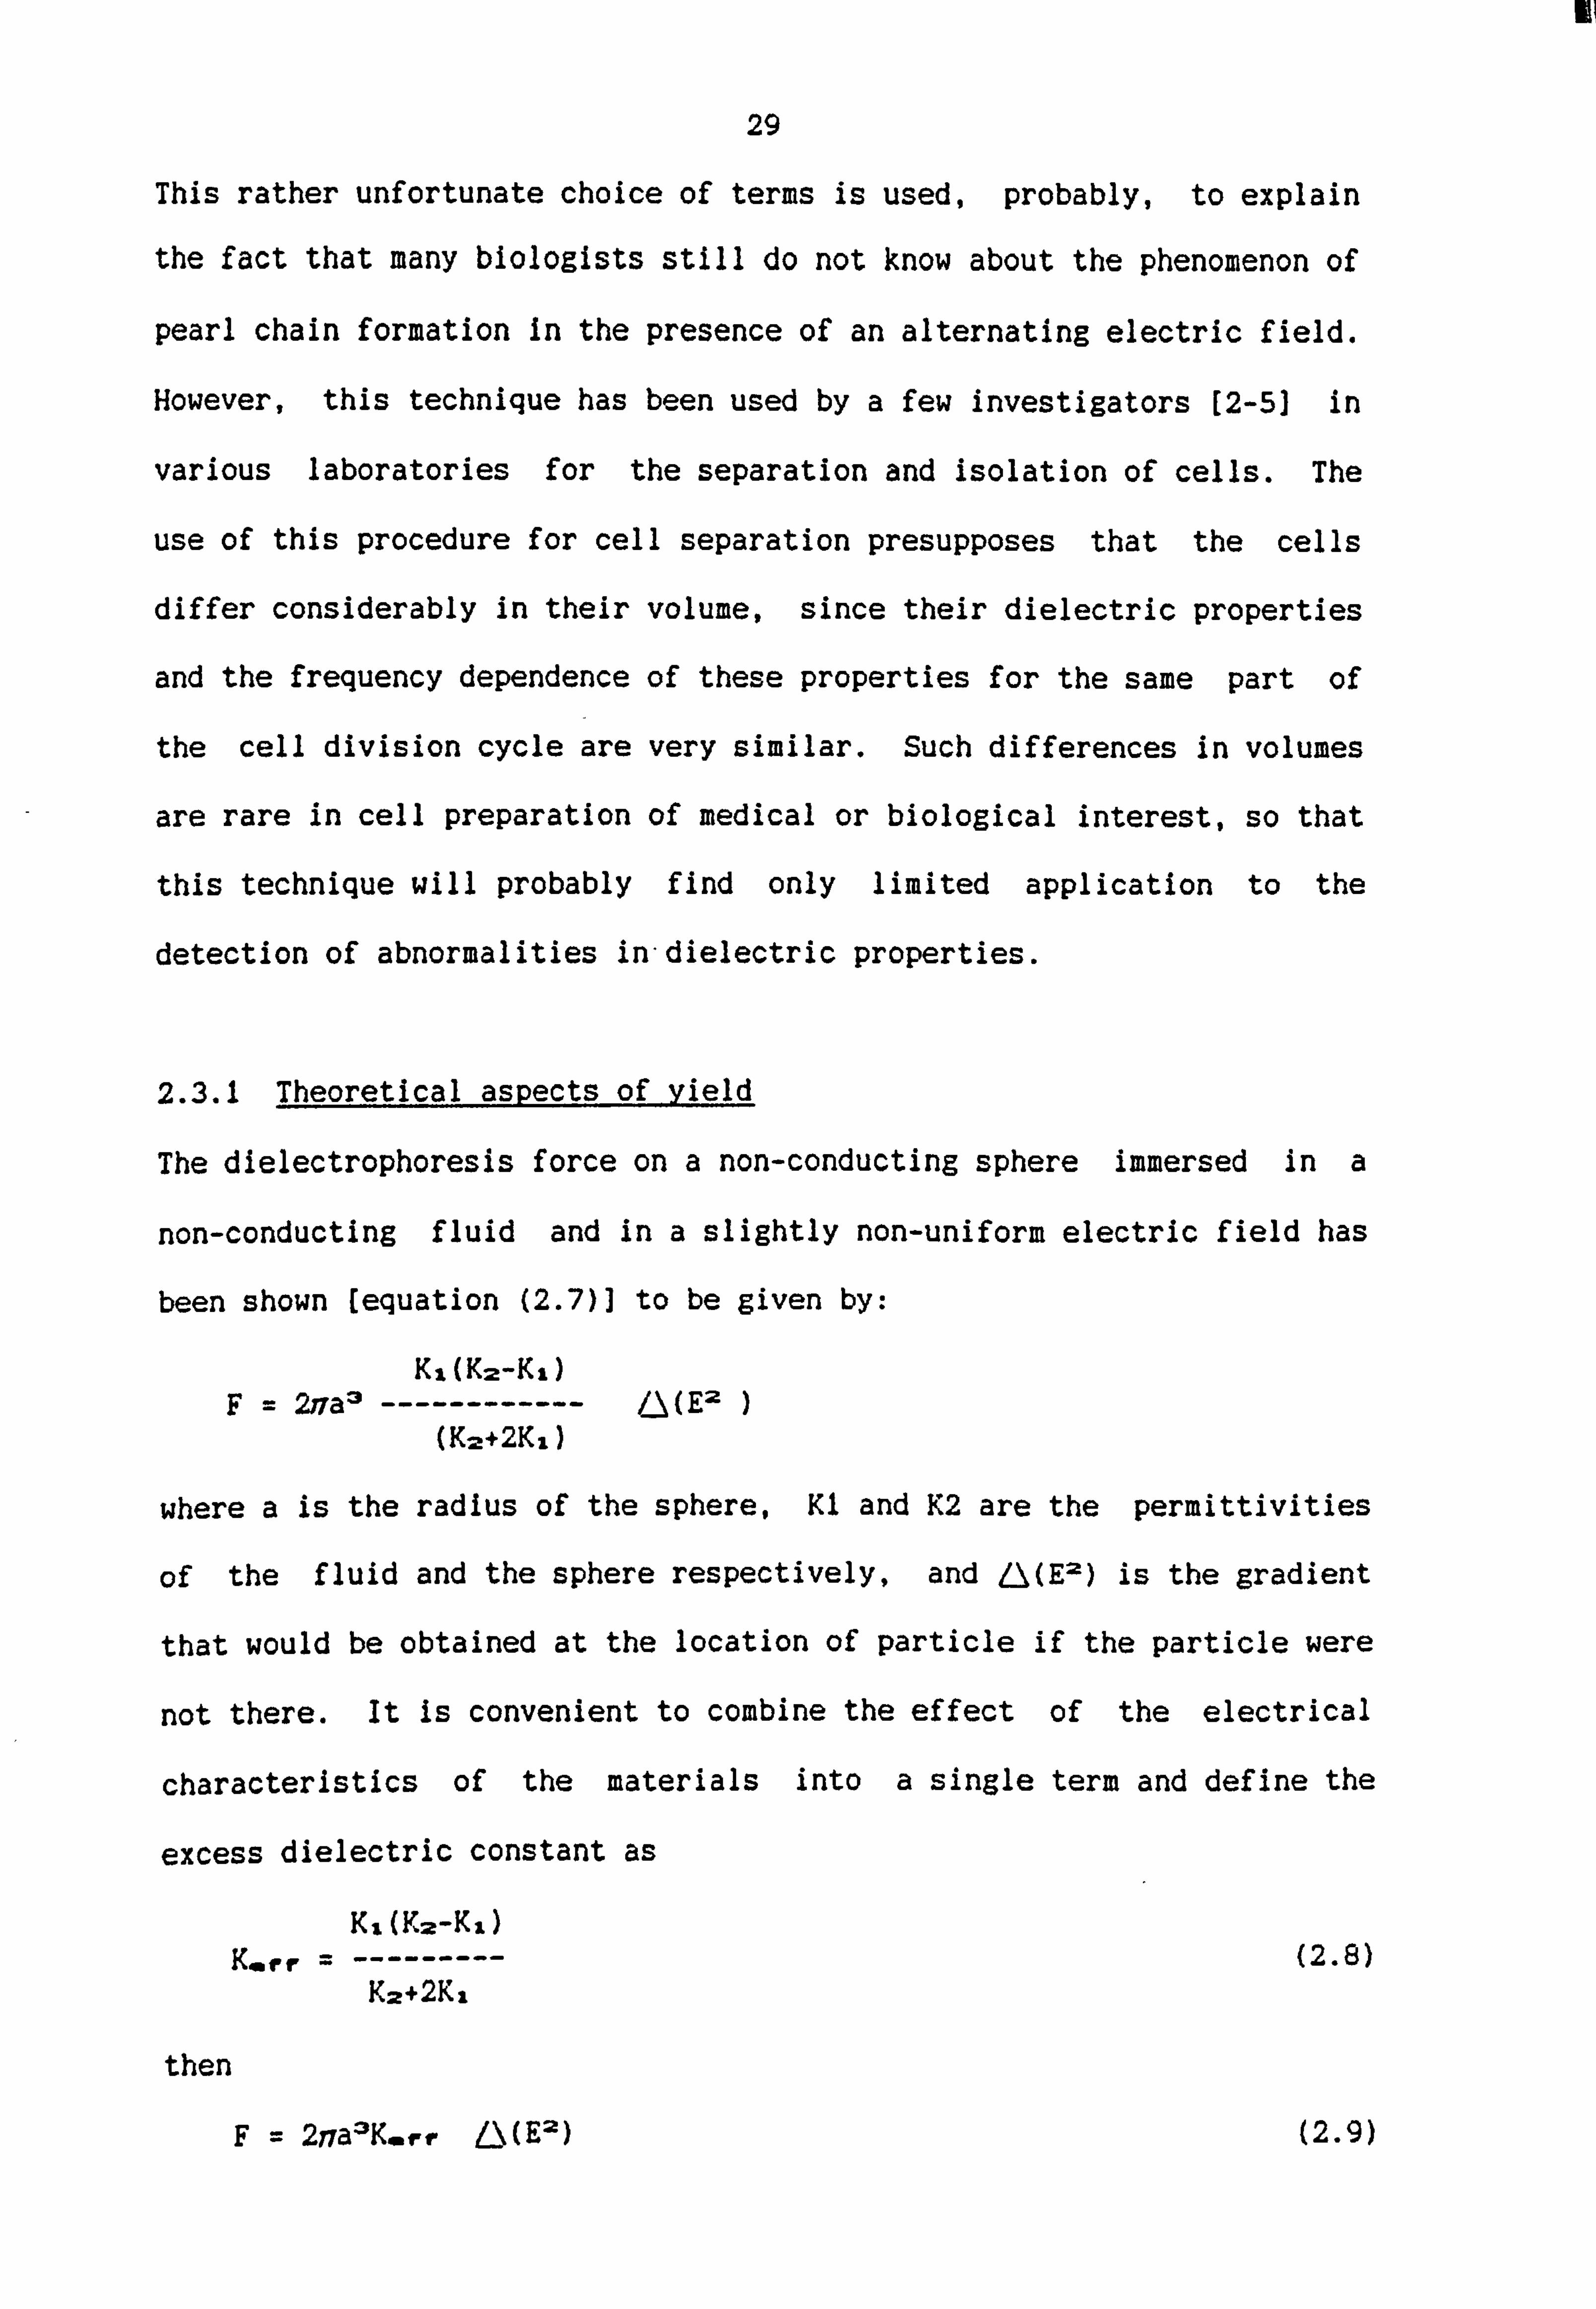
2.3.1 Theoretical aspects of yield
The dielectrophoresis force on a non-conducting sphere immersed in a
non-conducting fluid and in a slightly non-uniform electric field has
been shown [equation (2.7)] to be given by:
K3. (K2-Ki) F=2; 7a3 ------------ (E2
(K2+2K, )
where a is the radius of the sphere, KI and K2 are the permittivities
of the fluid and the sphere respectively, and Z-ý(E2) is the gradient
that would be obtained at the location of particle if the particle were
not there. It is convenient to combine the effect of the electrical
characteristics of the materials into a single term and define the
excess dielectric constant as
K IL ( K2-K IL ) K. rr = --------- (2.8)
K2+2Ki
then
2na: 3K. Pr L(El) (2.9)

Ei
30
In the case of conducting media the effect is no longer given by
equation (2.7) but it is possible to put all of the effects due to the
materials into a single parameter and define an excess dielectric
constant using equation (2.9). Since this excess dielectric constant
will certainly not be a real constant for biological materials it is
called the excess permittivity [1].
By specifying the electrode geometry, the resulting field and the
corresponding force could be determined. The rate of the collection of
a suspension of similar bodies can be found from the knowledge of the
force on the body which results in the prediction of this motion. The
force in a radial field can be derived following Pohl (7].
Mirrored symmetry exists between two rounded pin tips, and the electric
field is essentially that between a round pin tip and a flat plate
electrode. The field is approximately the same as that produced by
concentric spherical electrodes near one of the spherical pin tips.
At some radius r the potential between two concentric spheres of radius
r, and r2 such that r, 4( r2 is
viri(r2-ri)
----------- (r2-ri)r (2.10)
where V, is the root-mean-square of the alternating potential of the
inner spherical electrode, and V2 = 0. Since
V, Lri r2
r; l r2-ri (2.11)
Vi, 2r, L--r, 2
---------- (2.12) r4(r2-ri)2

31
and
vir-Lr2 2ro
r5 (2.13)
where r. is the unit r-vector. From equation (2.9) the force on a
spherical particle in this field is given by:
8ý112r 12 r22 K. rra3 17 -----------------
rl(rz! - r, )2 (2.14)
When p is positive and the negative sign indicates that the force is
directed inwards towards the region of strongest field.
A spherical particle will experience a viscous drag force (Stokes' Law)
opposing its motion when it moves under the action of the
dielectrophoretic force equation (2.14).
F. d = -6rTai V (2.15)
Whereý and V are the viscosity of the suspended fluid and particle
velocity through the medium respectively. Under dynamic equilibrium
F+F., = (2.16)
By substituting equation (2.16) into equation (2.14) an equation for the
velocity can be obtained.
4 V12 r 12 rl2K. rra2 dr
-- --------------- r,, - --r,, 3ý r'5(r2-ri )2 dt
(2.17)
For a particle to travel from a radial distance r.. to the central
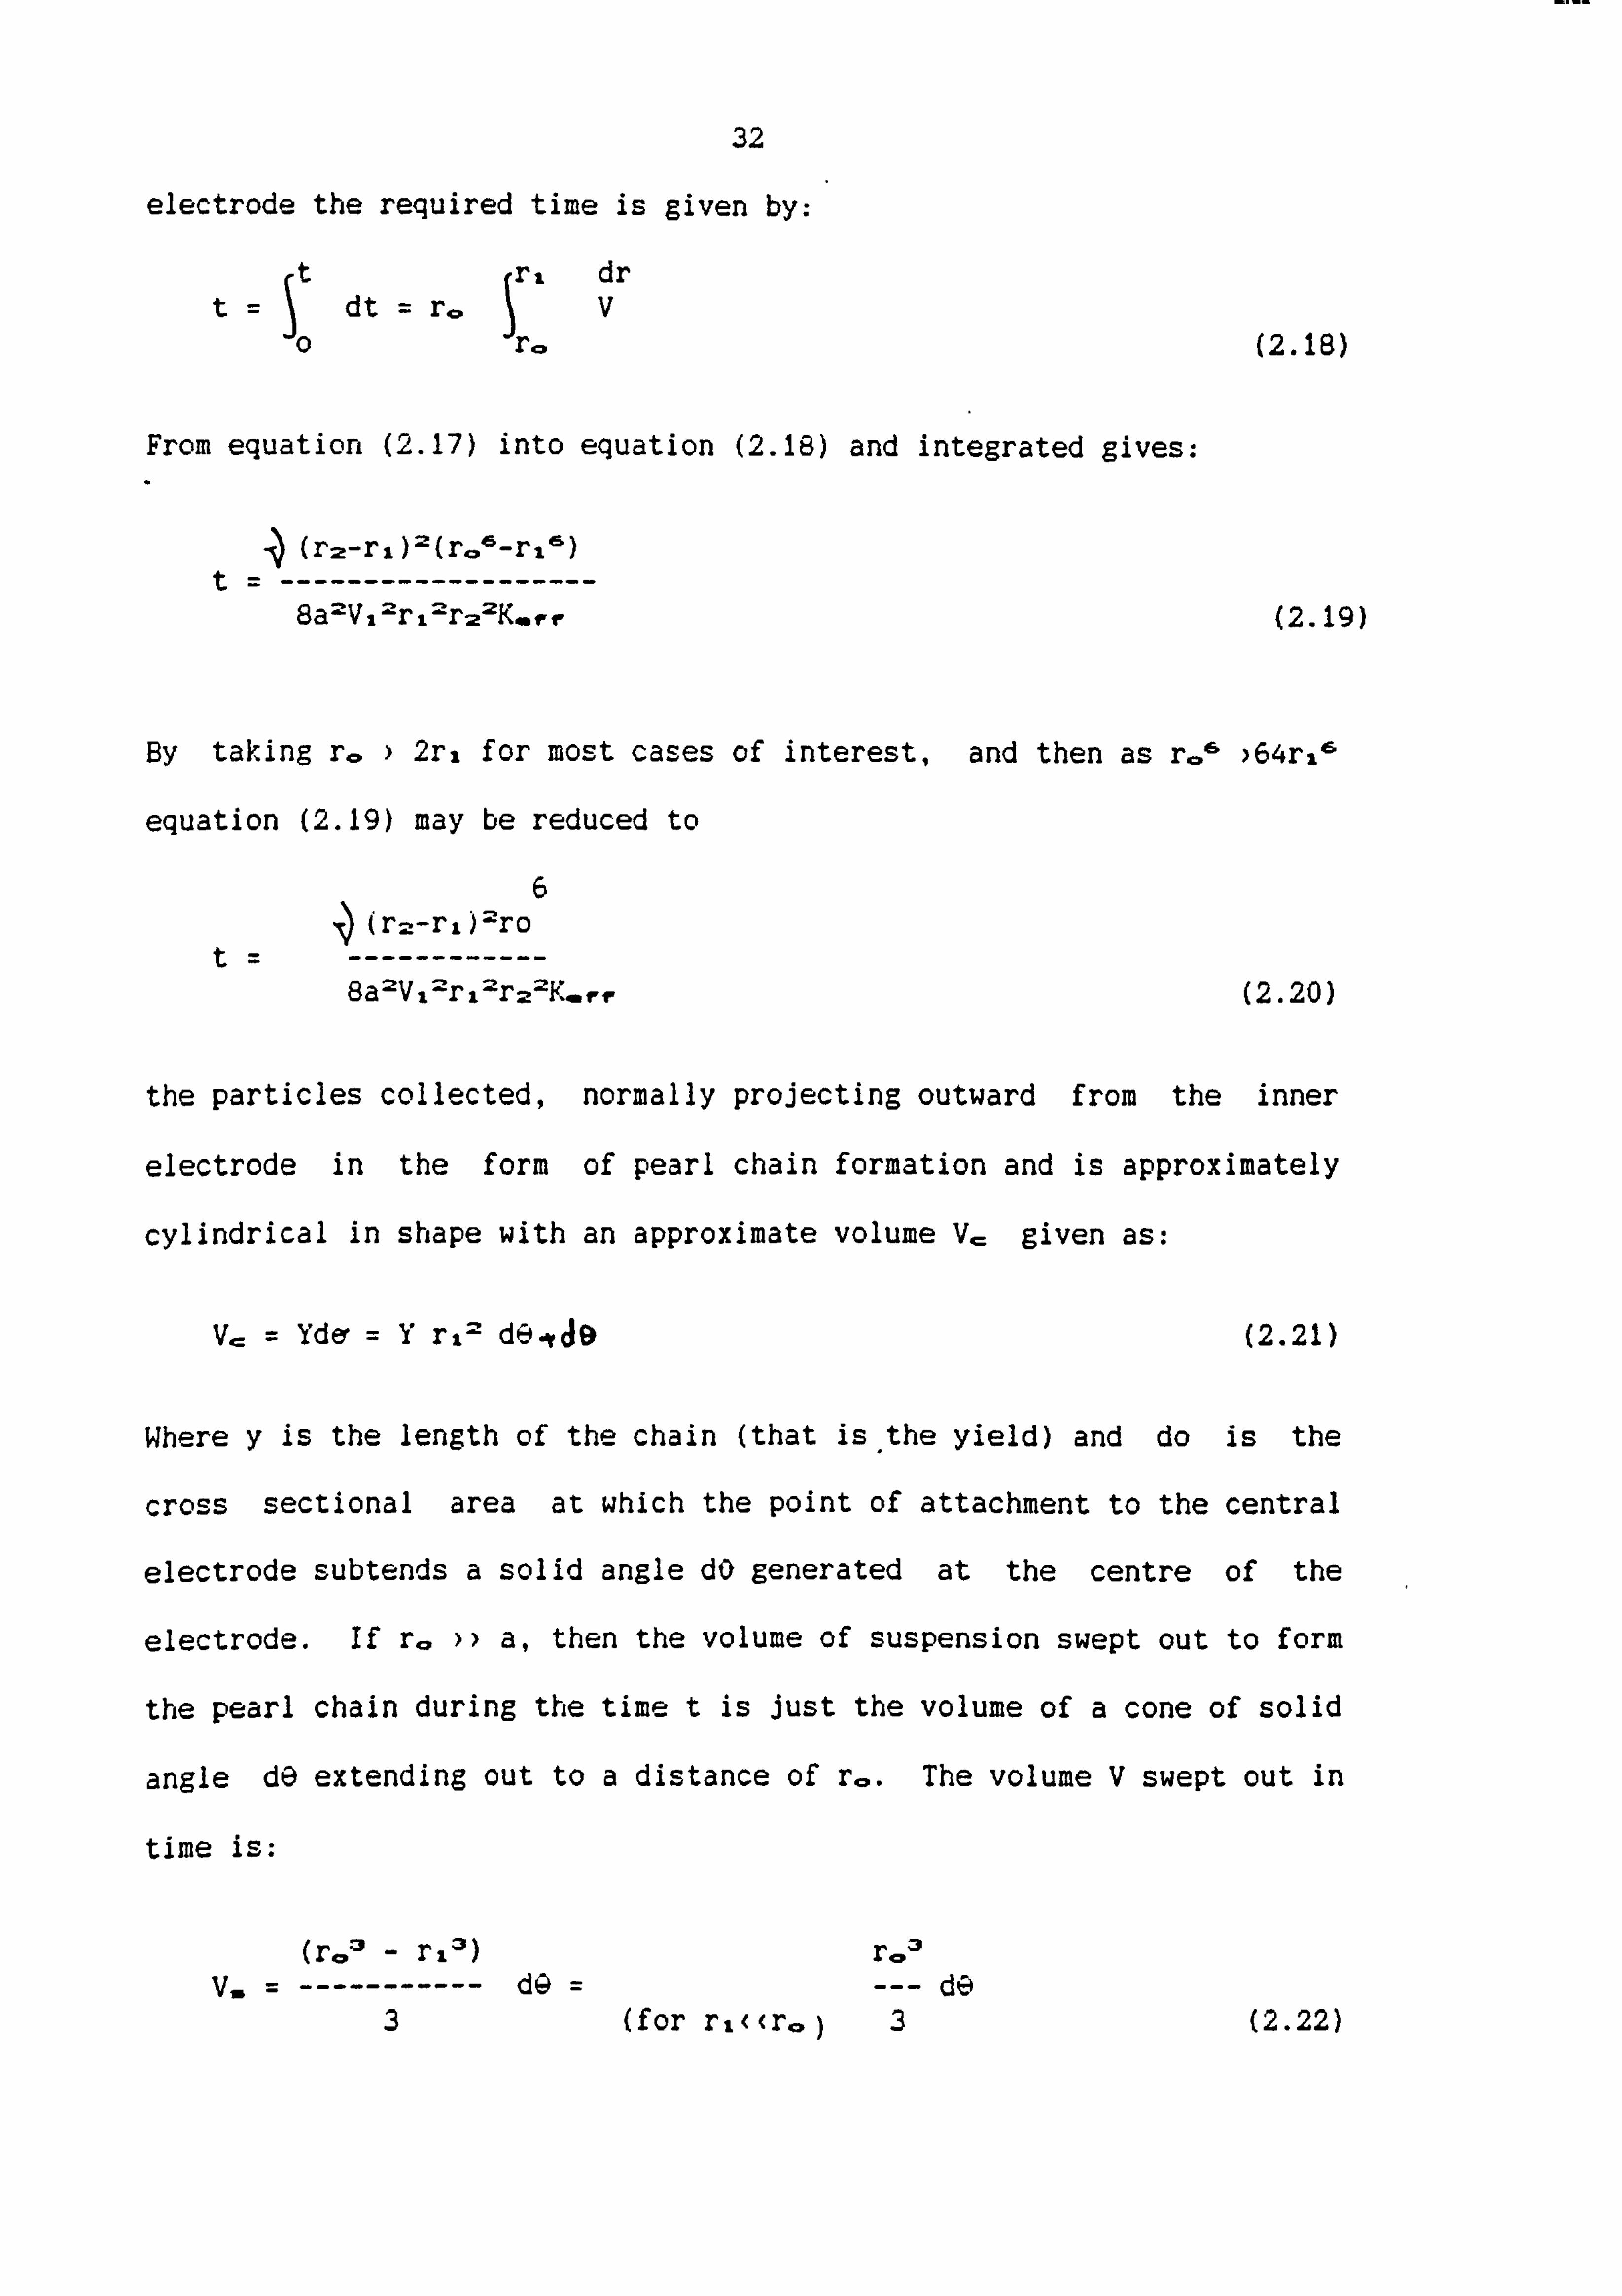
32
electrode the required time is given by:
r, dr dt = r. v
From equation (2.17) into equation (2.16) and integrated gives:
ý (r2-rjL)2(r. r--r, -s)
-------------------
8a2V, --r, 2r-2-2K. rr (2.19)
By taking r. ) 2r, for most cases of interest, and then as r. 6 )64r, 6
equation (2.19) may be reduced to
6 (r2-rL)2ro
------------
Ba 2V, 2r 2r22Krr (2.20)
the particles collected, normally projecting outward from the inner
electrode in the form of pearl chain formation and is approximately
cylindrical in shape with an approximate volume V-- given as:
V,, -- = Yder =Yr, 2 de-49
Where y is the length of the chain (that is, the yield) and do is the
cross sectional area at which the point of attachment to the central
electrode subtends a solid angle dO generated at the centre of the
electrode. If r. )) a, then the volume of suspension swept out to form
the pearl chain during the time t is just the volume of a cone of solid
angle d9 extending out to a distance of r.. The volume V swept out in
time is:
r, 3)
----------- dGo d9 3 (for rL((r. ) 3 (2.22)
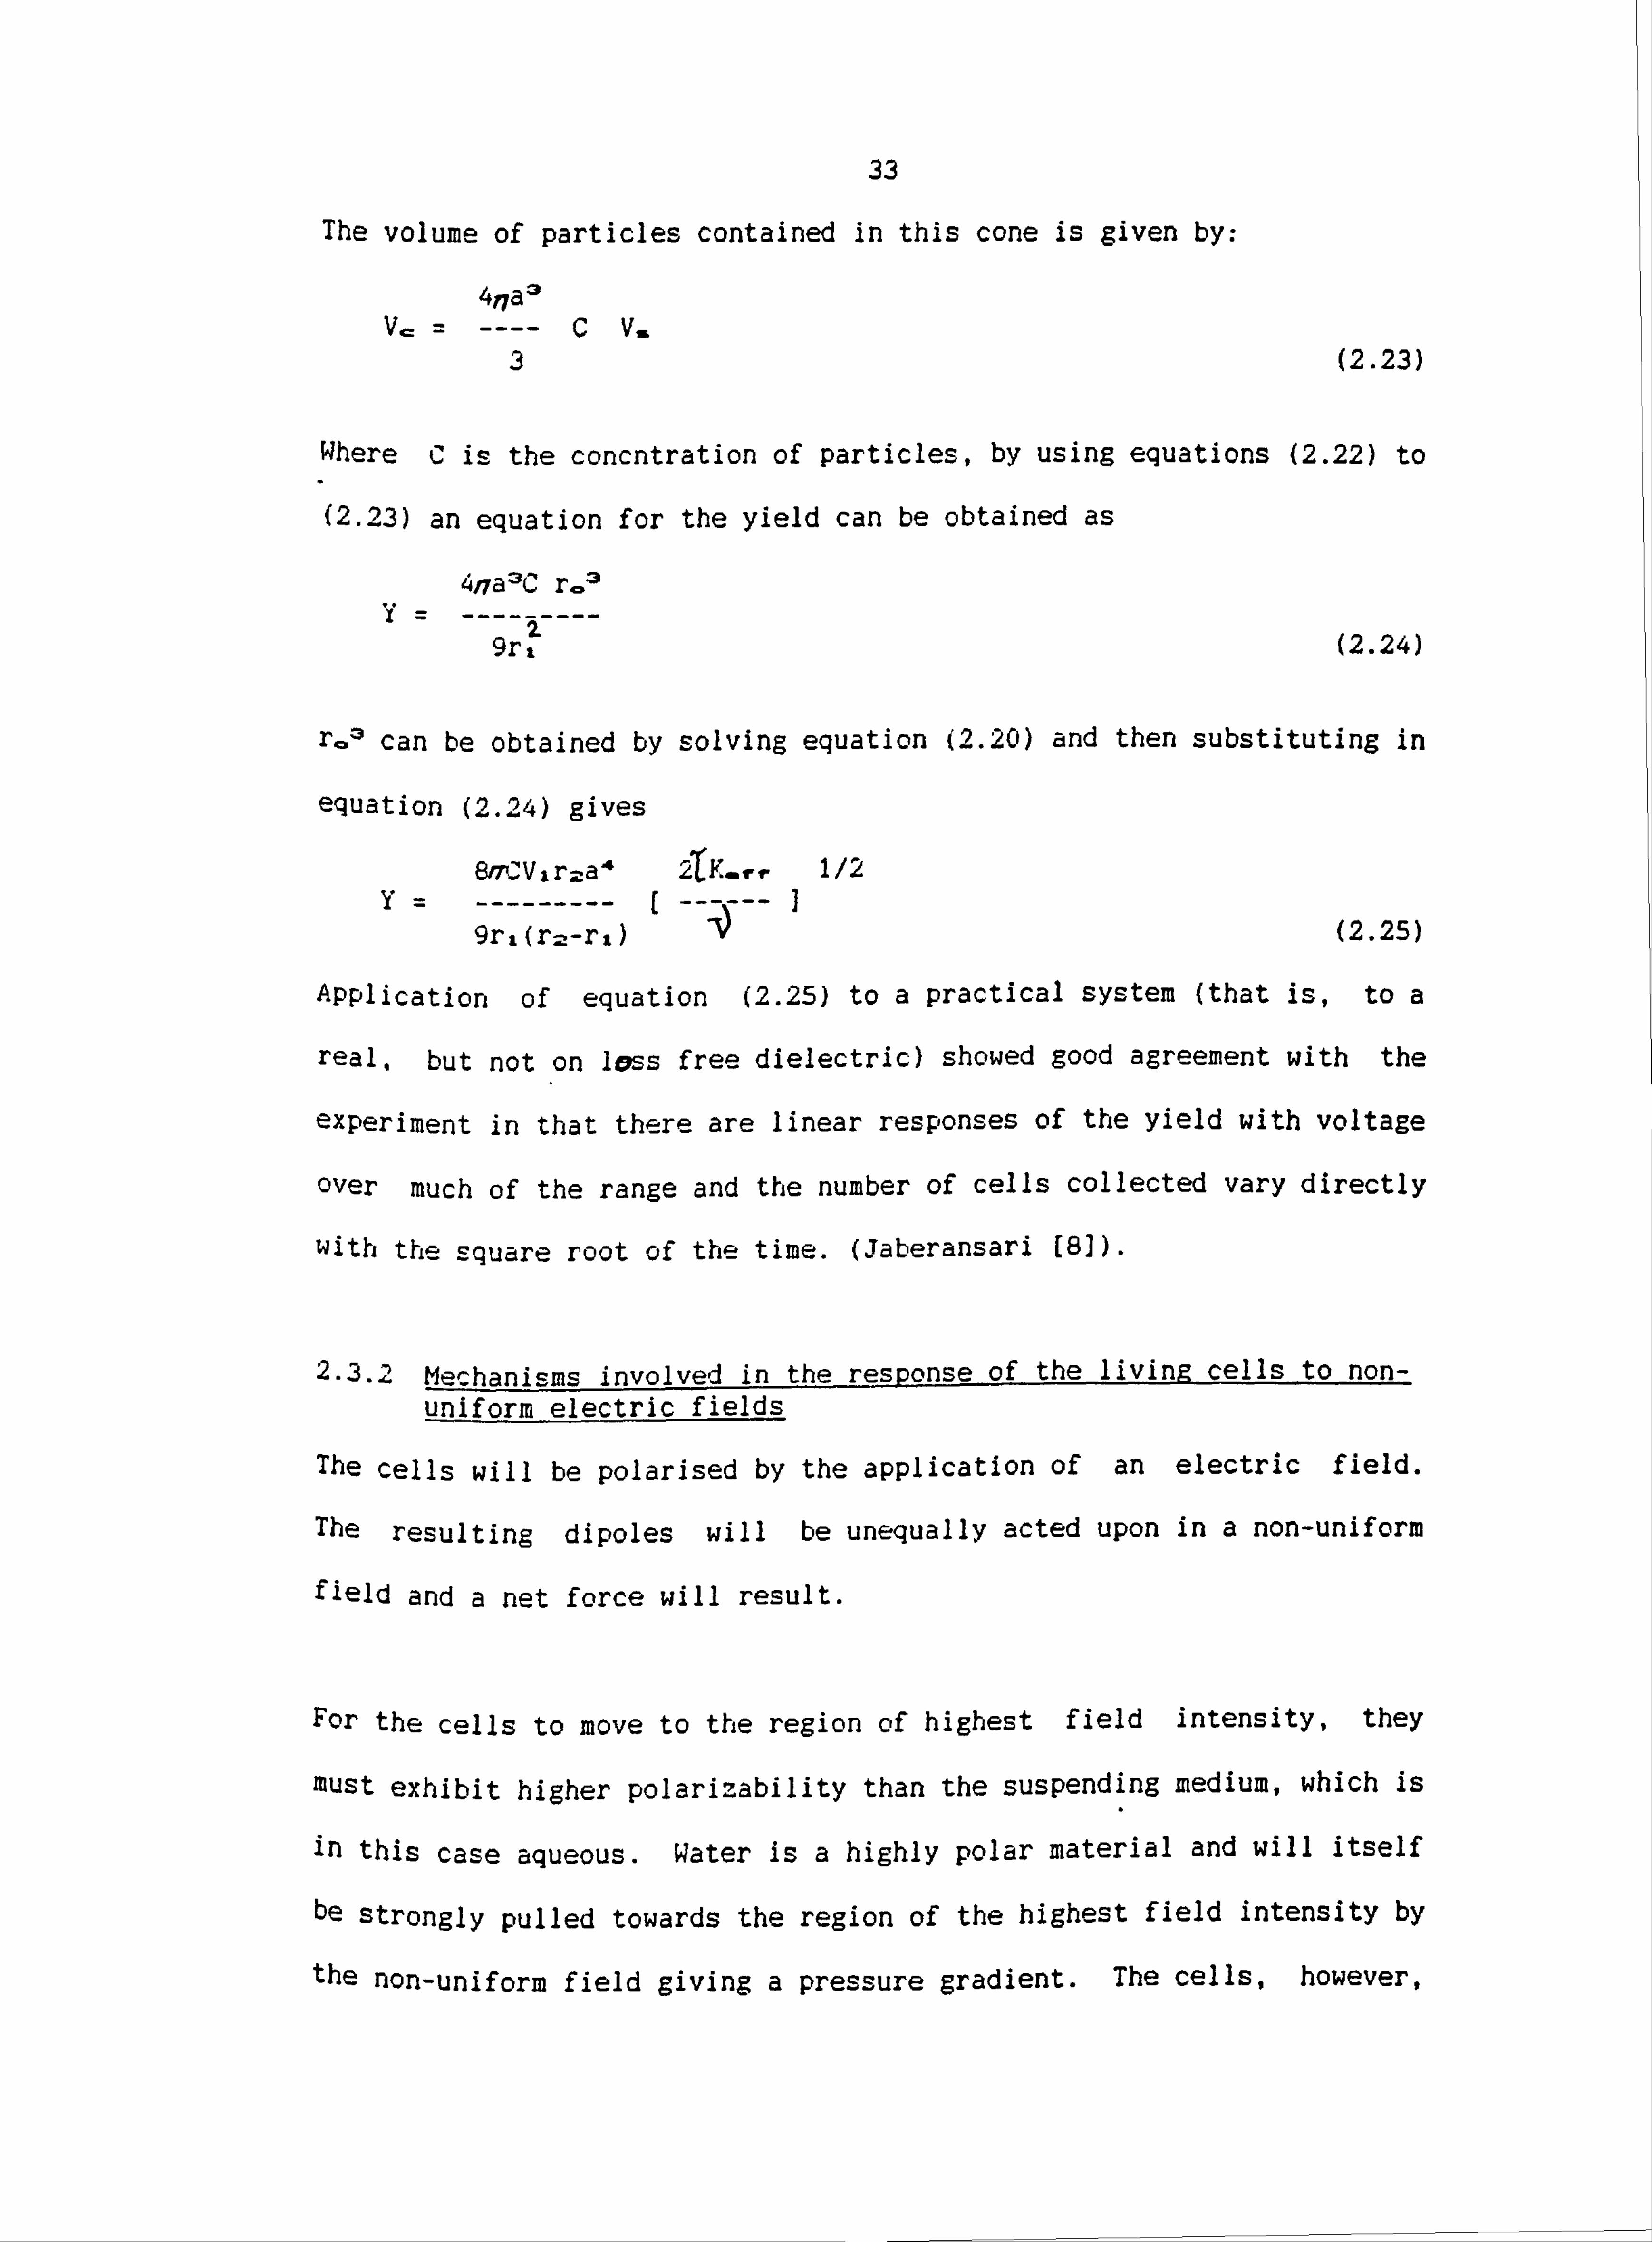
33
The volume of particles contained in this cone is given by:
417al C V.
3 (2.23)
Where C is the concntration of particles, by using equations (2.22) to
(2-23) an equation for the yield can be obtained as
4/7a3C r. 3
y= ---------
9r (2.24)
r, ý, a can be obtained by solving equation (2.20) and then substituting in
equation (2.24) gives
8ri, C, V, r2a 4 1/2
9r, (r2-ri) (2.25)
Application of equation (2-25) to a practical system (that is, to a
real, but not on less free dielectric) showed good agreement with the
experiment in that there are linear responses of the yield with voltage
over much of the range and the number of cells collected vary directly
With the square root of the time. (Jaberansari [81).
2.3. z, Mechanisms involved in the response of the living cells to non- uniform electric fields
The cells will be polarised by the application of an electric field.
The resulting dipoles will be unequally acted upon in a non-uniform
field and a net force will result.
For the cells to move to the region of highest field intensity, they
Must exhibit higher polarizability than the suspending medium, which is
in this case aqueous. Water is a highly polar material and will itself
be strongly pulled towards the region of the highest field intensity by
the non-uniform field giving a pressure gradient. The cells, however,
Mimi
34
can attain a higher polarizability in a number of ways. Firstly, the
cell itself is largely water. Secondly, there are dissolved in the
intra-cellular regions numerous polar molecules (proteins, DNA, RNA,
etc. ), all of which contribute to the polarization. Thirdly, there are
. structured regions which can act as capacitive regions, interfered, or
interpoles. For example, there are the lipid membranes across which
the electrolytes can act to produce observable charge distributions.
Fourthly, there are structured areas at the cell surface where ionic
double layers can produce quite enormous values of polarization (k. rr)101).
However, when live cells are killed. their response to a non-uniform
field is somewhat different. When our cells, both membrane and nucleus
were damaged by prolonged (overnight) exposure to a TUV lamp
(wavelength 254 nm); effectively, the cells were killed. The nucleus
then appeared granular as observed under a phase contrast microscope;
this exposure resulted in the cell being unable to reproduce. For
these cells, dielectrophoresis does not reflect those polarization
mechanisms which are sensitive to the physiological state as found with
live cells.
2.4 Cellular rotation
Investigations into the behaviour of cells in high-frequency
alternating electric fields frequently indicate that cells start to
spin under defined conditions. Holzaptel et al (91 explains this
phenomenon as resulting from the direct influence of the applied
alternating field on the cells and, additionally, from interaction of
dipoles generated in adjacent cells. Based on this theory, Arnold and
Zimmerman [101 indicated that even single cells rotated if they were
placed in a rotating high-frequency field. Therefore, a rotating

ME
35
electric field was used to produce cellular rotation for the
observations during this research programme. Such a field can be
generated in a chamber consisting of three electrodes driven by
sinusoidal voltage (Chapter (5)) with progressive 120- or four
-electrode with 90- phase shifts progressively between them.
In general, the rotational behaviour of biological particles can be
interpreted as rotation of dielectric bodies in rotating electric
fields. Particle rotation was found to be attributable to polarization
phenomena resulting from charge separations on dielectric boundary
layers. In Fig. (2.5) the principle of rotation is demonstrated on a
homogenous sphere in an external medium (liquid).
A
ý2,02
B
(r__
m' E \: çi
Kl, 01 E
Fig. (2.5) Polarized dielectric sphere in an external medium K, K2 - dielectric constants, 01-02 - conductivities
Particle polarization can be described by the resulting electrical
dipole (m). At low angular frequencies, the dipole (m) follows the
field vector (E. ) without delay. Charge separation and charge
dispersion, therefore, are much faster than the movement of the field
vector. In other words, wT((l (where T is the time constant of the
36
polarization process and w the angular frequency of the rotating
field). With w increased., dipole orientation is slower and follows the
field vector by a definite angle (ý) (Fig. (2.5)). In such cases the
relaxation time of the polarization process close to the dielectric
-barriers cannot be neglected WC = 1). A definite torque (N) will
occur in this frequency range and lead to rotation of the particle. A
maximum of angular velocity can be observed if wT=1. Further
increases in angUlar frequency are followed by drops in polarization,
and at wr )>1 no torque acts at all.
Rotational behaviour is much more complicated when it comes to
biological particles (yeast cells, Leishmania major cells). The
principles and theoretical considerations of this phenomena are
discussed by a number of researchers (11 & 121. The origins of the
observed cellular spin resonance are, as yet, not determined. There
are, in theory, two distinct ways in which an applied rotating electric
field could evoke cell spinning (131.
A- Cell-cell polarization
The theory given by Pohl (111 includes an
W., for a freely-spinning particle in a
first, the following assumptions may-
resonance (CSR) of a spherical cell parti,
voltage component rotating electric field
Assumptions
expression for, the spin rate,
rotating electric field. But
be made for cellular spin
. le in an electroýe, n phase,
generator.
1. A homogeneous dielectric sphere in a homogenous medium.

37
2. The rotating speed, W. of cells is much less than that of the
applied field, We =2nýl = 2"/p. (i. e. W= (( WE
3. The polarization of the sphere can be respented by a simple single
time constant Debye type of relaxation time, C.
4. The field is applied as a series of sine waves of magnitude E. ,
each for a duration of 6 sec., at intervals of s seconds during
which the speed is ns=p sec., that is each phase begins 3601/n
apart from the adjacent phase.
5. The cells rotate in near-equilibrium according to Stokes' Law for
hydrodynamic drag.
With the above restrictions and assumptions,
3""E. K. rrE. '(T/'s) W'_ = ------------------ (1-e-OA)3
(2.26)
Where K. rr =Re{K, (K2 -K, )/K2 + 2ki) and K, is the complex conjugate of Ki.
ý is the relaxation time of the cell-water system.
E., is the maximum-field strength applied by each phase of the signal.
is the duration of signal.
s is the time between the successive starts of the signals.
Spin rate
From the above equation the spin rate W, is proportional to E. IJ,
11G, and to K. rr, the effective dielectric constant of the sphere, and
is independent of the sphere radius.

B14,
38
B- Natural, intrinsic oscillating cellular dipoles
The interaction of such natural radio frequency dipolar fields with the
external oscillating field is the most probable cause of CSR, but this
needs further examination and study (141. If the frequency of the
. applied rf field is f(E) and that of the natural cellular oscillating
dipole field. is f(D), then one can expect the frequency of the cellular
rotation to be:
f(E) = f(D) t f(R) (2.27)
The present model is that the natural rf, oscillating dipoles arise from
oscillating chemical reactions coupling within the cells to physically
mobile regions of ions so as to produce charge density waves. There
are several well studied systems'of oscillating reactions (15-171.
If, during the ionic phase, the outward speed of travel of the positive
ions does not exactly match that of the negative ions, then a charge
wave will develop (Fig. 2.6). As these developing charge waves
encounter structures within the cell that effect a parallelization of
the wave development. collimation of the charge wave will ensue. The
various charge waves travelling within these parallel regions will then
develop a co-operative correlation [181 to form a coherent set of
charge waves involving large regions of the cell as a co-operative
oscillating giant dipole. The testable model suggests a number of
experimental studies as to its energy source, its strength and cause.
There are, of course, a number of structures known in cells which might
be able to effect parallelization of such charge waves. These include
the mitotic spindle apparatus, the walls of the endoplasmic reticulae
39
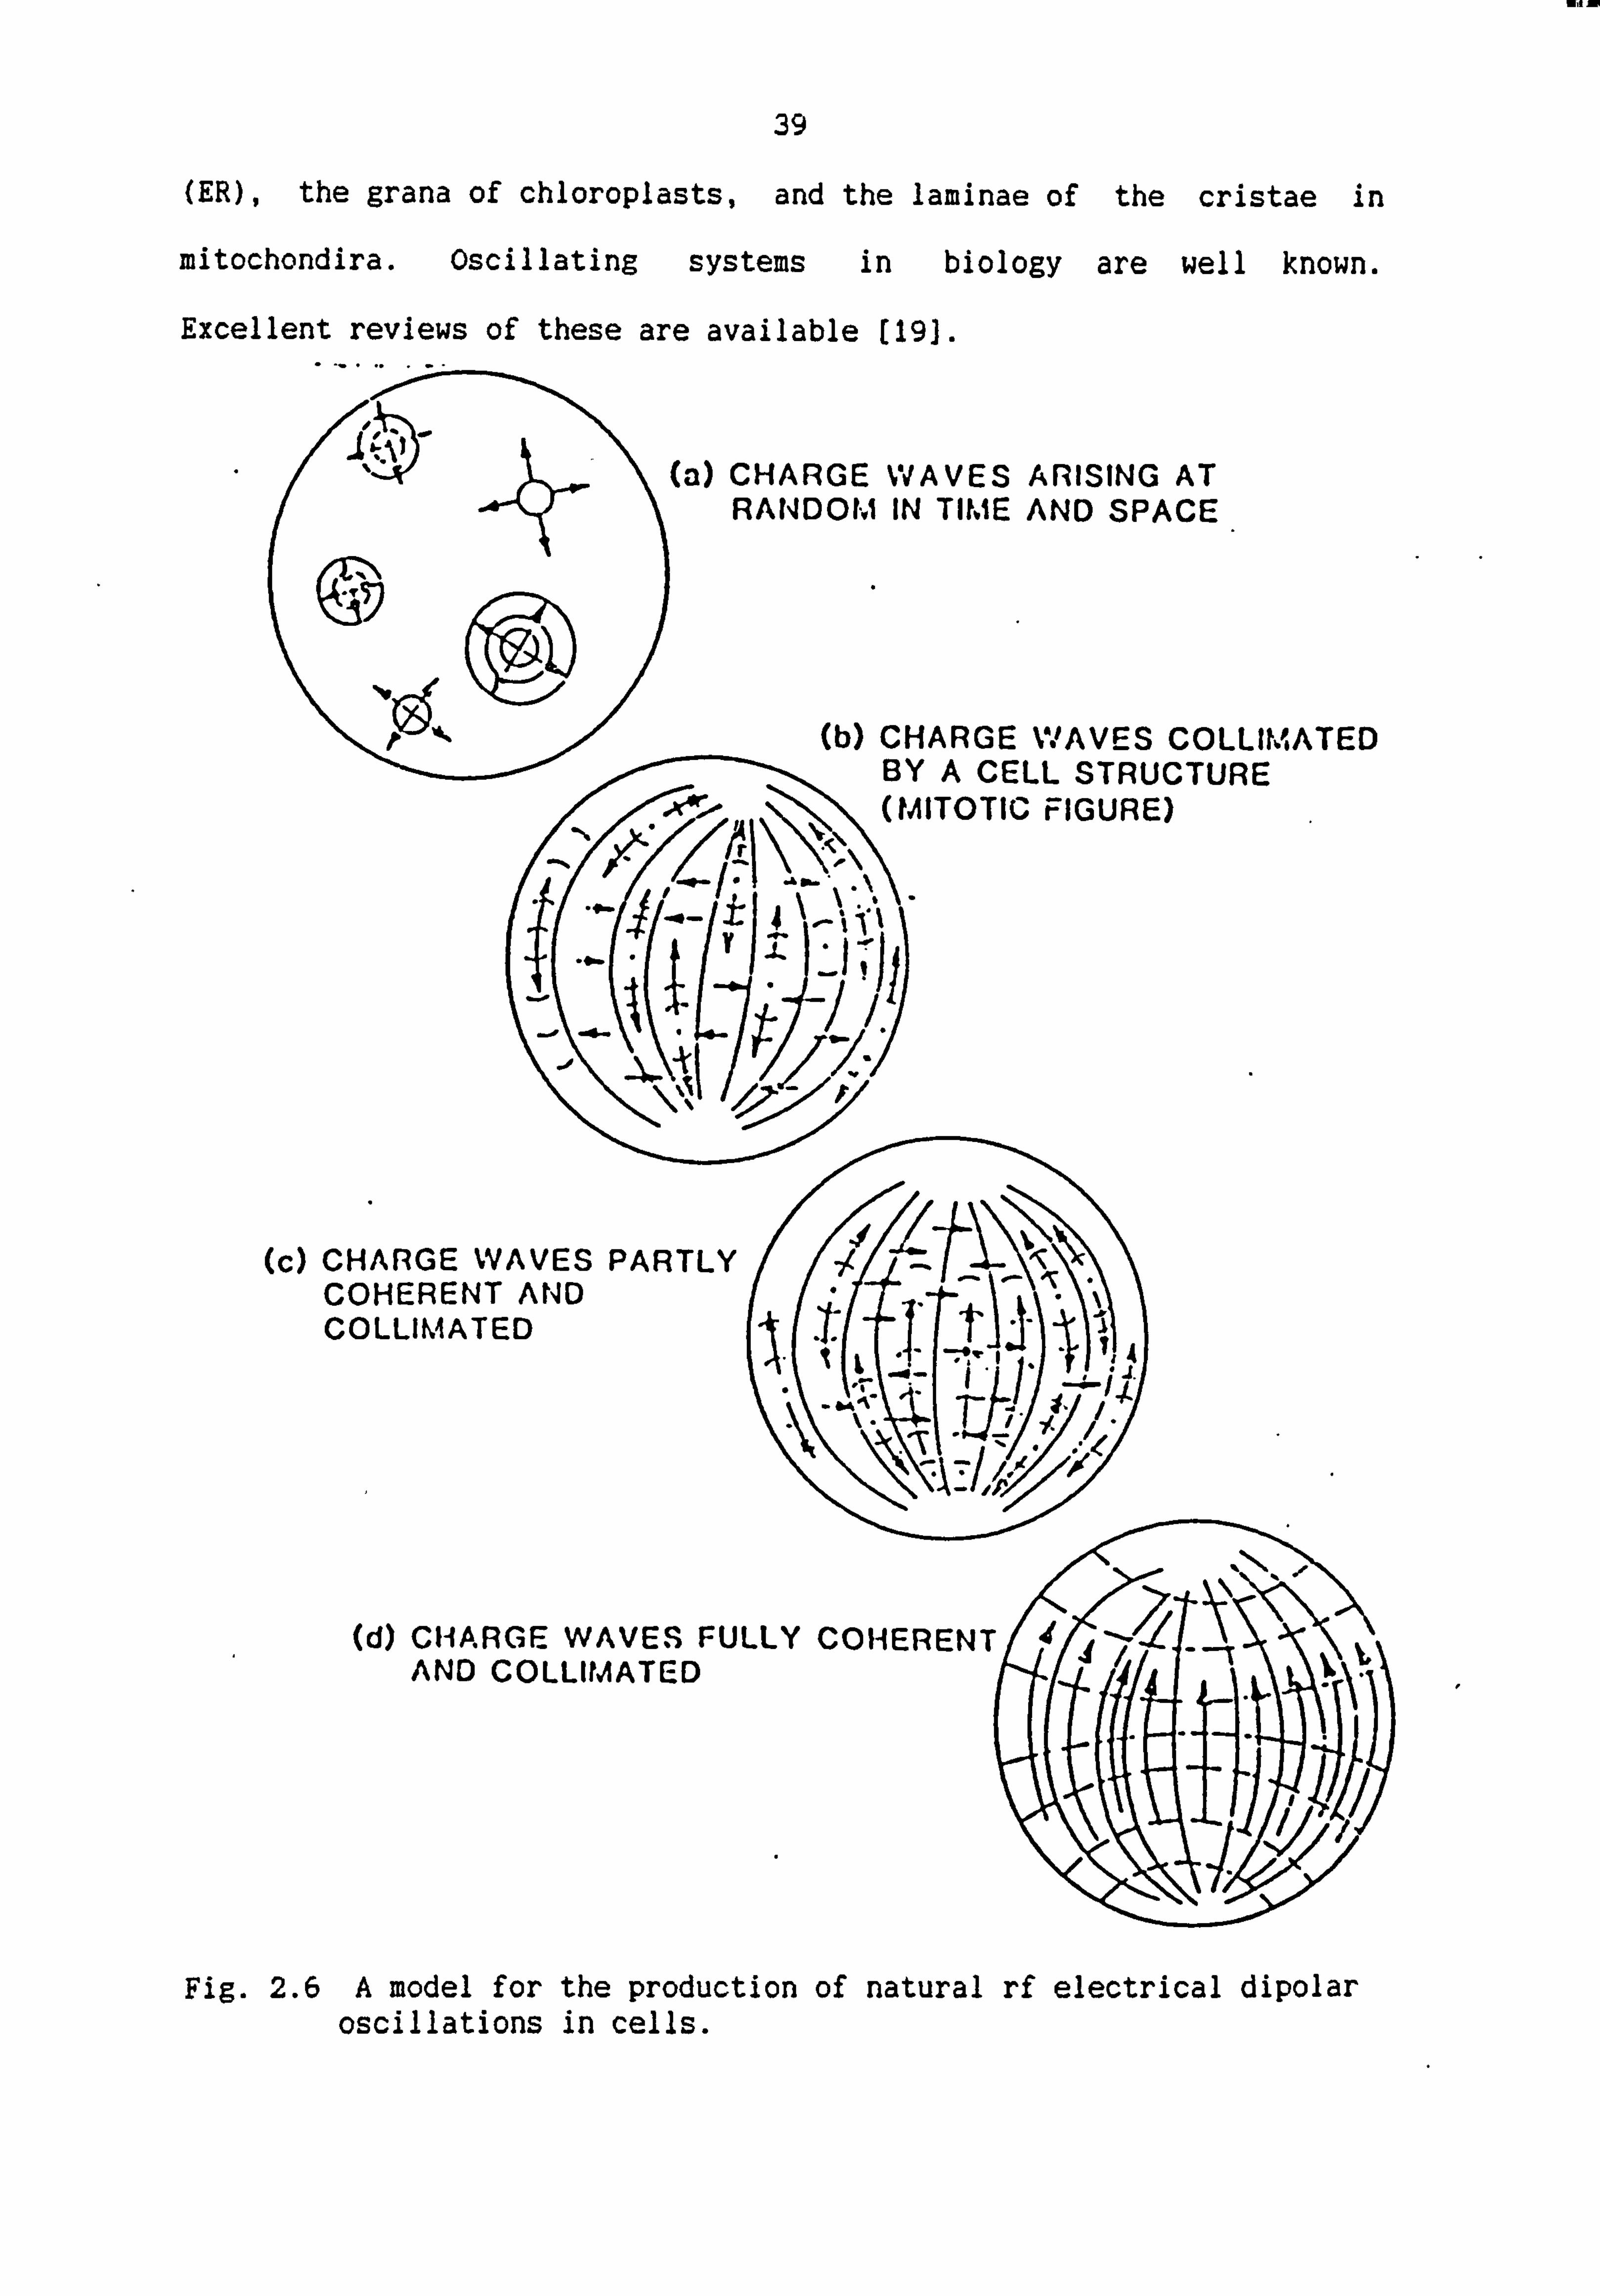
(ER), the grana of chloroplasts, and the laminae of the cristae in
mitochondira. Oscillating systems in biology are well known.
Excellent reviews of these are available (191.
CHARGE WAVES ARISING AT RANDOIA IN TUJE AND SPACE
(b) CHARGE WAVES CO BY A CELL STRUCTI. (MITOTIC FIGURE)
/. r
. 0-
yi\, Iý%
RANDOI-. i IN TUJE AND SPACE
(b) CHARGE WAVES COLLRAMTED BY A CELL STRUCTURE (MITOTIC FIGURE)
(1I1
"! ( Tt) \\ thj, j, ':
CHARGE WAVES PARTLY COHERENT AND COLLIMATED
(d) CHARGE WAVES FULLY COHERENT 4 AND COLLIMATED
Fig. 2.6 A model for the production of natural rf electrical dipolar oscillations in cells.
40
(A) Charge waves from periodic reactions radiate out from various
initiating sites in the cell. As shown, the waves from various sites
are incoherent and uncollimated.
(B) If various possible structures are present in the cell, the
. individual charge waves can become collimated and parallelized.
Although longitudinal waves are shown for ease of the graphic,
presentation waves progressing at right angles to the intracellular
surfaces are probably the more likely. As parallelizing structures one
may have various cytoskeletal elements such as endoplasmic reticulum
(ER) microtubules, actin microfilaments, various trabeculae, and
membranes as in chloroplast granae and mitochondrial cristae. (28)
(C) Collimation and partial coherence of charge waves, providing an
oscillating dipole.
(D) Charge waves collimated and almost completely coherent. It is
expected that the resultant dipole oscillator will be evident outside
the cell only when the charge waves are very close to the outer
plasmalemma, because of the short range of electric fields in the
conductive plasma of the cell interior.
Whether the proposed charge waves providing the source of the natural
rf oscillations are due to reactions which proceed geometrically
parallel to or at right angles to the laminar cell structures is not
known, although kinetic data on the assumed charge waves imply that the
charge waves proceed across, rather than along, the laminar regions,
especially in the case of the high frequency oscillations. The study
of oscillating reactions is in an increasingly active state. An
interesting paper by Schmidt and Ortoleva (201 suggests how oscillating
reactions might be coupled to waves of electrical charge.
IF, 9i
41
Frohlich (211 showed that an assembly of randomly oscillating, but
lightly coupled, similar dipoles would be driven to operate in a co-
operatively condensed mode if the input power (chemical, electrical or
mechanical) exceeded a certain minimum level. This, and a series of
-stimulating subsequent papers, opened a new avenue of cellular studies
(10,12,131.
Whatever model is eventually found to be correct for the origins of the
observed natural rf oscillations of cells, it will be of much interest
to learn if they are cause or effect, 'necessity or frill in the living
state.
We must conclude from this observation described in Chapter (8) that
the CSR is due to natural rf oscillations as modified by the
polarizability of the cell and medium, and acting in response to the
applied field. ý This is a somewhat complex physical problem and needs
quantitative treatment and resolution.
2.4.1 AC and DC Responses
If natural and internally driven dipoles are present, they can be
expected to evoke a torque and a spinning of the cells-if (Pohl [221)
the dipolar. frequency, fD , matches that of the external field, fr=
, as
seen during the cellular spinning at frequency fR, i. e., Eq. (2.27)
applies.
Thus, the frequency fD will be slightly modifiable by-the presence of
the external field at fe, ("motor-boating") and by the presence of its
internal polarization 0< (E, fD Such, a response of a- natural
oscillating dipole, expressed in terms of the internal polarization of

42
the cell, can be expected to result in spinning whether the applied
field sinusoidal (AC) or pulsed DC (rectified sinusoidal) of the same
basal frequency. It is expected then to vary with the square of the
applied field intensity.
On the other hand, if the cell subjected to an external field has no
natural oscillating dipole, but has only that dipole induced by the
presence of an external field, then such a cell would only librate but
not spin synchronously. If a cell spins while in the presence of a
high frequency AC field, and continues to spin when this field is
smoothly altered to that of a pulsed DC field of the same frequency, we
may be assured that it has a natural-rf dipole. ' If, on the other hand,
it does not spin but only librates in the pulsed DC field, then induced
and not natural rf dipoles are indicated present.
It is interesting to note that rotation of deoxygenated sickled
erythocytes in a rotating magnetic field was recently reported by
Riberia et al [231. The speed rotation was proportional'to the square
of magnetic field strength. In recent years the orientation of cells,
organelles and tissues in a homogenous magnetic field has been reported
on. For sickled erythrocytes, self-orientation is perpendicular to the
magnetic field [24-271.
Smith, Aarholt and Jaffary [281 have also reported the effect of
magnetic -fields on several biological cells. They reported the
existence of a proton NMR effect involving the geomagnetic field when
they were examining the behaviour of cells under the influence of
dielectrophoretic forces. However, the already reported effects of
electric and magnetic fields on living cells were sufficient to merit
MIA
43
further investigations into this area of research.
2.4.2 Advantages and future application
Investigations on the behaviour of cells in high frequency alternating
electric fields frequently find cells starting to spin under defined
conditions, this has become known as "Electrotation". Electrotation is
a new method and its application to various problems depends on its
future technical development.
At present, the method of electrotation as observed under a microscope
has been considered a useful tool for certain purposes of analysis. In
particular, it permits a non-destructive analysis of selected single
cells. A considerable advantage for many problems of cell biology and
biotechnology. Biophysical properties of the membrane of cells such as
their conductance, and the specific capacitance and the conductance of
the cell plasma can be measured by this method [11,131. It allows a
time saving selection for locating single cells in a contactless and
non-destructive manner. For medical purposes the examination of single
cells in cell suspensions is possible. This method may also be
extended to computer-aided data recording and processing systems with
special interfaces for electronic field generation and control devices,
and special variable measuring chambers.
Electrorotation can further be applied for studying
(a) characterisation and the study of the influence of drugs and other
agents on cells (in particular of such drugs as affect
membrane permeability, e. g. diuretics, ionophores);
(b) characterisation of cells before and after artificially induced
44
fusion (intactness of membrane, detection of successful fusion);
(C) differentiation and classification of cells (e. g. vitality test);
(d) interaction of cells with artificial surfaces; (eg. Leishmania
cells)
(e) separation of cells under special conditions
III
REFERENCES
PETHIG, R. "Dielectric and Electric Properties of Biological Materials", Wiley, ' Chichester, 1979.
2) WREDE, E. Z. Physik, 1927,44, p. 261.
3) MULLER, F., WISE, H. Veroffentl Siemens Worken, 1938,17,20.
4) ZIMMERMAN, U. "Electric Field Mediated Fusion and Related Electrical Phenomena", Biochemica. Biophys., 1982A, 694, p. 227.
POHL, H. A. Dielectrophoresis, Cambridge University Press, Cambridge, 1978.
") MULLER9F. 9 AND W ISE lHo vVerf f ent Li Siemens Werken 91986117 op. 2i r
7) POHL, H. A. J. Theor. Biol., 1981A, 93, p. 207.
8) JABERANSARI, M. Dielectrophoresis, Electrodynamics and Magnetic Resonance Phenomena in Yeast Cells, M. Sc. Thesis, Salford University, 1985.
9) HOLZAPFEL, C., VIENKEN, J., and ZIMMERMAN, U. "Rotation of Cells in An Alternating Electric Field", J. Membrane Biol., 1982,6-7, p. 13.
10) ARNOLD, W. M., WENDT, B., ZIMMERMAN, U. and KORENSTEIN, R. Biochem. Biophys. Acta, 1985,813 (Act A), p. 117.
11) POHL, H. A. "A New Method for Determining the Dielectric Properties of Living Cells", Int. Journal of Quantum Chemistry, 1983,
_10, p. 161.
12) HAAGEDORN, R., FUHR, G. "Calculation of Rotation of Biological Objects in the Electric Rotating Field", Studia Biophysica, 1984,102(3), p. 229.
13) GLASER, R., FUHR, G. "Electrorotation of Single Cells -A New Method for Assessment of Membrane Properties". Electrical Double Layers in Biology (Martin Blank eds. ), Plenum Press, New York & London, 1986.
14) POHL, H. A. 1. Biological Physics, 1983,11, p. 59.
15) NOYES, R. M. and FIELD, R. J. Ann. Rev. Phys. Chem., 1974,25, p. 95. I
16) NOYES, R. M. Acc. Chem. Res., 1977,10, p. 214.
17) EPSTEIN, I. R., KUSTIN, K., DE KEEPER, P. and ORBAN, M. J. Am. Chem. Soc., 1981,103, p. 2133.
18) POHL, H. A. and CRANE, J. S. Biophysical Journal, 1971,11, p. 725.
19) TREHERNE, J. E., FOSTER, W. A., SCHOFIELD, P. K. "Cellular Oscillators", J. Exp. Biol. (Review Volume), 1979,81.
20) SCHMIDT, S., ORTOLEVA, P. J. Chem. Phys., 1979,71, p. 1010.
21) FRbHLICH, H. IEEE Trans. Microwave Theory Techniques, 1978, MTT-26, 613.
22) POHL, H. A. "Microdielectrophoresis of Living Cells" in Bioelectro- chemistry (H. Keyzer and F Gutmann, eds. ), Plenum Press, NY, 1980B.
23) RIBEIRO, P. C., DAVIDORICH, M. A., WAJNBERG, E., BERNSKI, G. and KISCHINEVSKY, M. Biophys. J., 1981,36, p. 443.
24) ARNOLD, W., STEELE, R. and MULLER, H. Proc. Nat. Acad. Sci., U. S. A., 1958,44, p. l.
25) MURAYAMA, M. Nature, 1965,206, p. 420.
26) GEACINTOV, N. E., VAN NOSTRAND, F., BECKER, J. F. and TINKER, J. B. Biochem. Biophys., 1972A, 267,65.
27) BERCKERS, J. F., GEACINTOV, N. E. and SWENBERG, C. E. Biochem. Biophys., 1978A, 503,545.
4
28) AARHOLT, E., FLINN, E. A. and SMITH, C. W. Phys. Med. Biol., 1981,26, p. 613.

CHAPTER (3)
ELECTRON & ION BEAM CHARGING OF SURFACES

Kim
45
3.1 INTRODUCTION
This chapter will review theoretical aspects of electron bombardment
processes and mechanisms and their relationship to X-ray production and
shielding, secondary electrons, electron backscattering, electron range
and the charge and dose effects. This is because Leishmania major
cells tend to attach only to electron beam scored substrates.
Following this theoretical work on electron beam injection there are
some basic results for ion implantation using isotope separators, Van
de Graaff and D. C. plasma ion sources.
Finally, the theories presented in this chapter are very preliminary in
nature.
3.2 The Electronic Beam as a Technological Process
Any electron bombardment (EB) processing technique utilising electron
beams requires that in the work chamber the electron beam, as the
energy carrier, be adequately matched to the properties of the target
material so as to act in the most appropriate manner. Electron beam
generation takes place in an electron gun which is described in Chapter
(6). Such a gun is based on the thermionic emission of free electrons
into a vacuum, followed by the acceleration and beam formation in
electrostatic fields, and thus beam focussing and deflection through
either magnetic or electric fields. The electron beam is guided into
the work chamber through an aperture in the (high energy) electron gun
chamber. The parts, or products, to be processed, which generally have
to be moved in some appropriate manner, were arranged at the work site.
Since the general and unrestricted propogation of an electron beam is

46
only possible in a high vacuum, it is necessary to pump down the beam-
generating and guidance spaces. In general, and this is also the case
for the work chamber (Chapter (7)), vacuum systems are therefore among
the most important components of an EB processing plant. The vacuum
required in the beam-generating chamber of a gun is usually of the
order of 10-2-10-1 Pa, and that in the work chamber is generally around
10-2 Pa.
There were no gas-type pressures used in the chamber for electron
bombardment of the target material and accelerating voltage, and beam
current and exposure time are the principal parameters that determine
the interaction between beam electrons and target material from the
point of emission to the electron bombardment site.
When the beam impinges on the matter to be bombarded, the kinetic
energy of the electrons is converted into various kindsýof energy
through interaction with the atoms of the target material.
In general, electron beams have many technological applications. For
example, when the beam is utilised for melting, welding, evaporation,
or thermal processing, it is the produced thermal energy that is used.
With non-thermal processing and other radiation processes the
collisions of the beam electrons excite or ionize the electron shells
of the atoms and molecules, which as a follow-up process, initiates
chemical reactions. Sterilization through electron beams is based on
similar processes so that, as a result, biological systems are killed.
Other actions of electron beams during impingement on matter are beyond
the scope of this thesis.

ti E
47
3.2.1 Energy Conversion at the point of action
When an acceleration voltage Va is applied, electrons are accelerated
in the electrostatic field of the beam source so that they attain a
kinetic energy E, where kinetic energy E=ex Va and e is the electron
charge. The accelerating voltages used in this project are in the
range 500-20 x 10-3 volts. In this sort of energy range, the electron
velocities are:
LEE mm
where Ve is the electron velocity
m is the mass of an electron
E is the kinetic energy of electron .,
For the above energy range, the electron velocities are 0.04 - 0.3 of
the velocity of light.
At the point of beam impact interactions with the atoms of the electron
bombarded matter convert the kinetic energy of the electron beams into
either heat or atomic or molecular excitation energy. A certain
portion of the incident electrons will be back-scattered. In addition,
secondary processes produce X-rays, secondary electrons,, and possibly,
thermionic electron emission at the point of beam incident. The
generated heat results in a small rise in temperature at the work site
(this is greater at higher electron energies), limited by heat
conduction from the zone of energy conversion, to the environment.
(Fig. MM
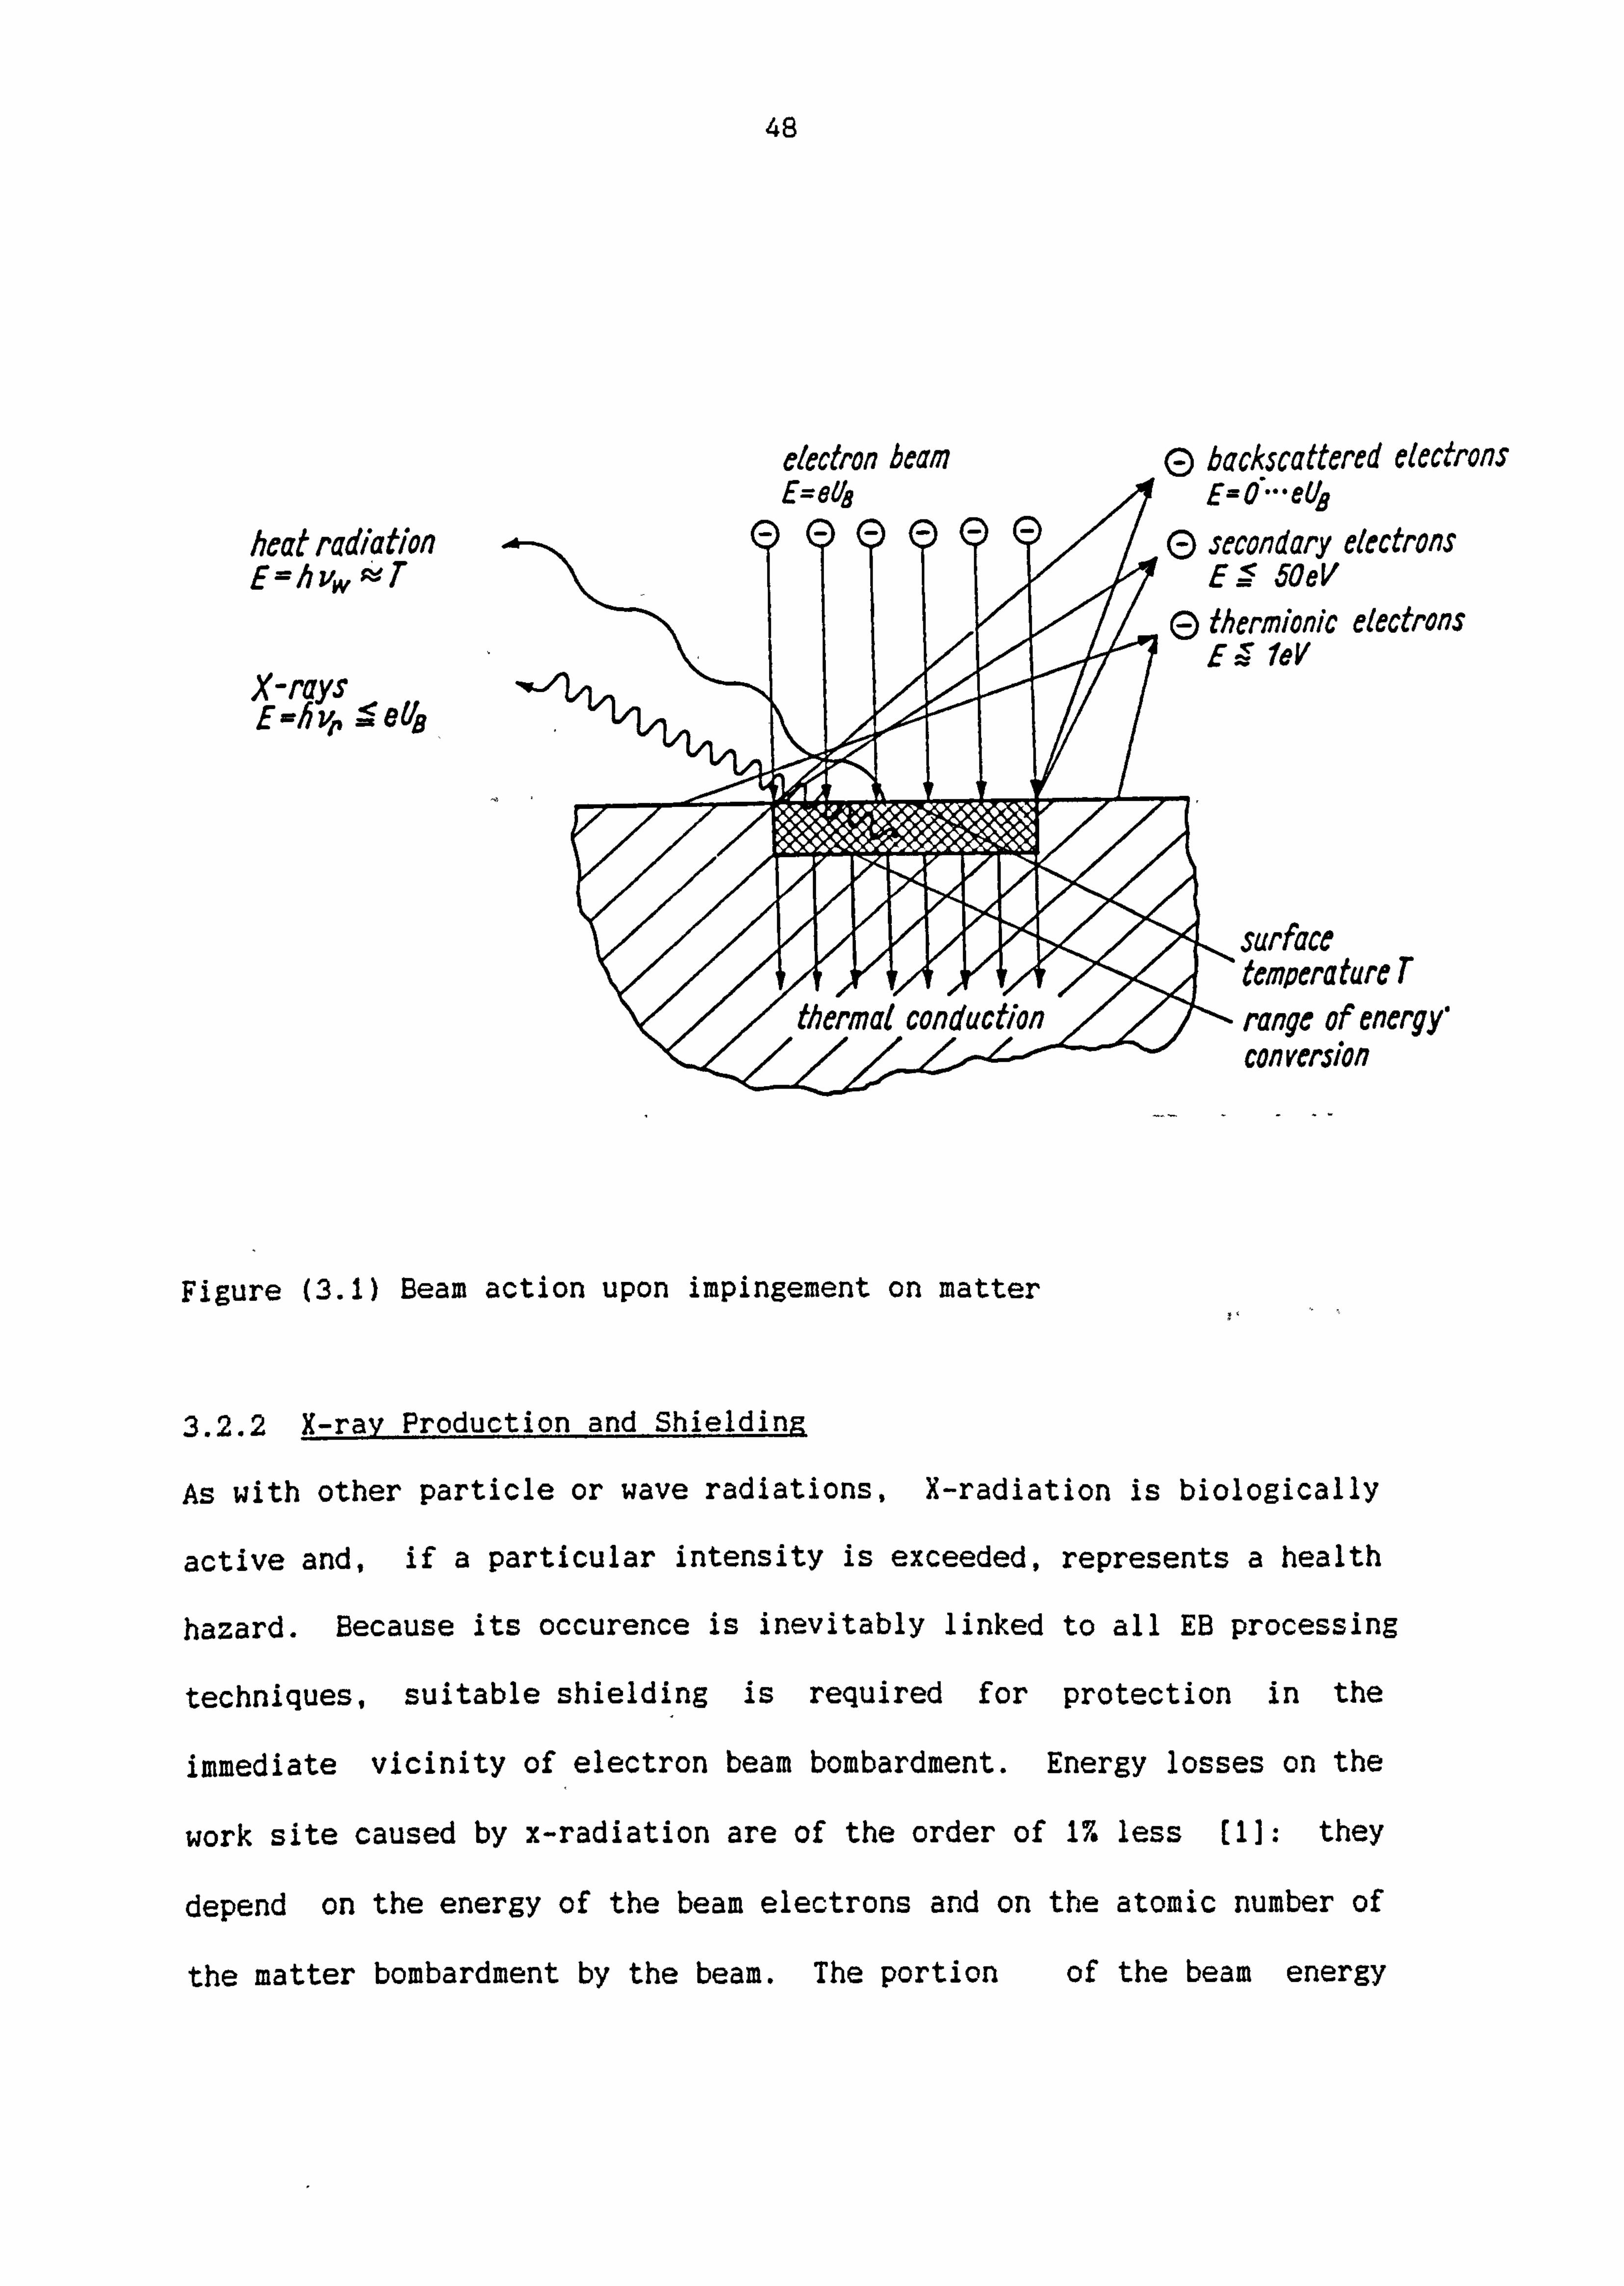
48
electron beam
heat radi ation E=hv,, Af T
X-rqys E -h 1/,, ;5e 1/18
ebackscattered electrons Em 0.. - etI8
(E) secondary electrons E -5 5OeV
E) therinionic electrons E:; fev
surface tempera ture r range of energy' con version
Figure (3.1) Beam action upon impingement on matter
3.2.2 X-ray Production and Shielding
As with other particle or wave radiations, X-radiation is biologically
active and, if a particular intensity is exceeded, represents a health
hazard. Because its occurence is inevitably linked to all EB processing
techniques, suitable shielding is required for protection in the
immediate vicinity of electron beam bombardment. Energy losses on the
work site caused by x-radiation are of the order of 1% less (1]: they
depend on the energy of the beam electrons and on the atomic number of
the matter bombardment by the beam. The portion of the beam energy
111011
49
converted into X-radiation is (11
) ;:, 10-1 V. z (3.2)
where Va is expessed in volts.
In low energy ranges, the resultant energy in the total X-ray emission
can be neglected, but this emission cannot be neglected when working in
high energy ranges. Because the penetrability of X-rays increases with
quantum energy, and hence with the irradiant electron beam energy,
shielding measures are determined mainly by the maximum accelerating
voltages to be used in a particular EB bombardment application.
3.2.3 Thermionic Emission and Emission of Secondary electrons and electron back-scatteriM
The emission of secondary electrons at the point of beam action takes
place with an energy lower than 50 eV. Being proportional to the
impinging beam current, the emitted flow of secondary electrons depends
on the target material - in particular, its surface as well as the
angle of the incident beam and the electron energy.
With the commonly-used operating regime in zero-field space, the
emission of secondary and thermal electrons is limited to low values
because of space-charge formation. This is why their emission is
practically meaningless as far as the energy balance of the EB
bombardment is concerned. Their total dissipation amounts to about
1/1000 beam power.
Electron back-scattering causes emission of electrons within the range

its
50
of beam action, the X-ray energy spectrum of which goes up to the
energy of the beam electrons is most intense at about 1/3 of this.
Above all, the portion of back-scattered beam electrons and their
energy spectrum and direction distribution are determined by the atomic
number Z of the target material as well as by the angle of incidence,
contrast to thermionic emission, it is independent of temperature.
obviously the lower the atomic number the lower back-scattering, but
back-scattering increases with the angle between the direction of beam
incidence and the normal to the surface. Because of energy loss, the
emission of back-scattered electrons has a negative effect on the
surface electron charge in electron bombardment processes.
3.2.4 Electron Range
The electrons in the beam impinging on the target material
(polystyrene) are subjected to elastic and inelastic collisions with
atoms or molecules upon matter penetration. The beam electron
transfers energy to the particle struck and thereby departs from its
initial trajectory. Since the mass of an electron is small (1/2000)
compared to that of atoms or molecules, the striking electron loses
only a very small fraction of its energy during each collision (about
30eV). Hence, a great many collisions are needed for the electron beam
to give all its energy to the polystyrene petri dish.
The distance from a perpendicular target surface, within which the
electrons give off practically all their energy, is called the electron
range S. It is solely determined by the electron energy and the
polystyrene density (? ). Because the impact probability depends on the
electron energy, there are diverse analytical relationships for the
various energy ranges (2]. For energies up to 100 keV
51
-12 2 S 2.1 . 10 Va
? (3.3)
where S (cm) is the electron range in the polystyrene and Va (volts) is
the acceleration voltage traversed by the beam electrons and f (g. cm-3)
is the density of polystyrene.
For an electron beam of energy Va = 20 kV onto polystyrene, this yields
an electron penetration depth of 8Vm (polystyrene e=1.05 gm-3).
Hence the beam energy is converted within this very thin surface layer
and the electrons are trapped in the polystyrene [3] because of its
very low conductivity.
3.2.5 Charge and Dose Effect
There are a few recently published papers, for example those by Watson
[4) on the transport of electrons in polystyrene, which observe that
the surface potential of polystyrene will be changed as the electrons
get trapped within the polystyrene. The decay is characterised by an
initial discharge; the rate of decay then decreases with time and
ceases after a while, leaving a high negative residual voltage on the
sample which can only be erased by heating.
The initial discharge suggests that when
injected into the polymer they are able to
before becoming deeply trapped. If this is
time after bombardment the electrons will be
space charge field and the decay should
although modified by the presence of traps in
the electrons are first
move relatively freely
. orrect, then for a short
drifting in their own
be space-charge limited,
the polymer. The dose
of electron bombardment of any sample is directly proportional to
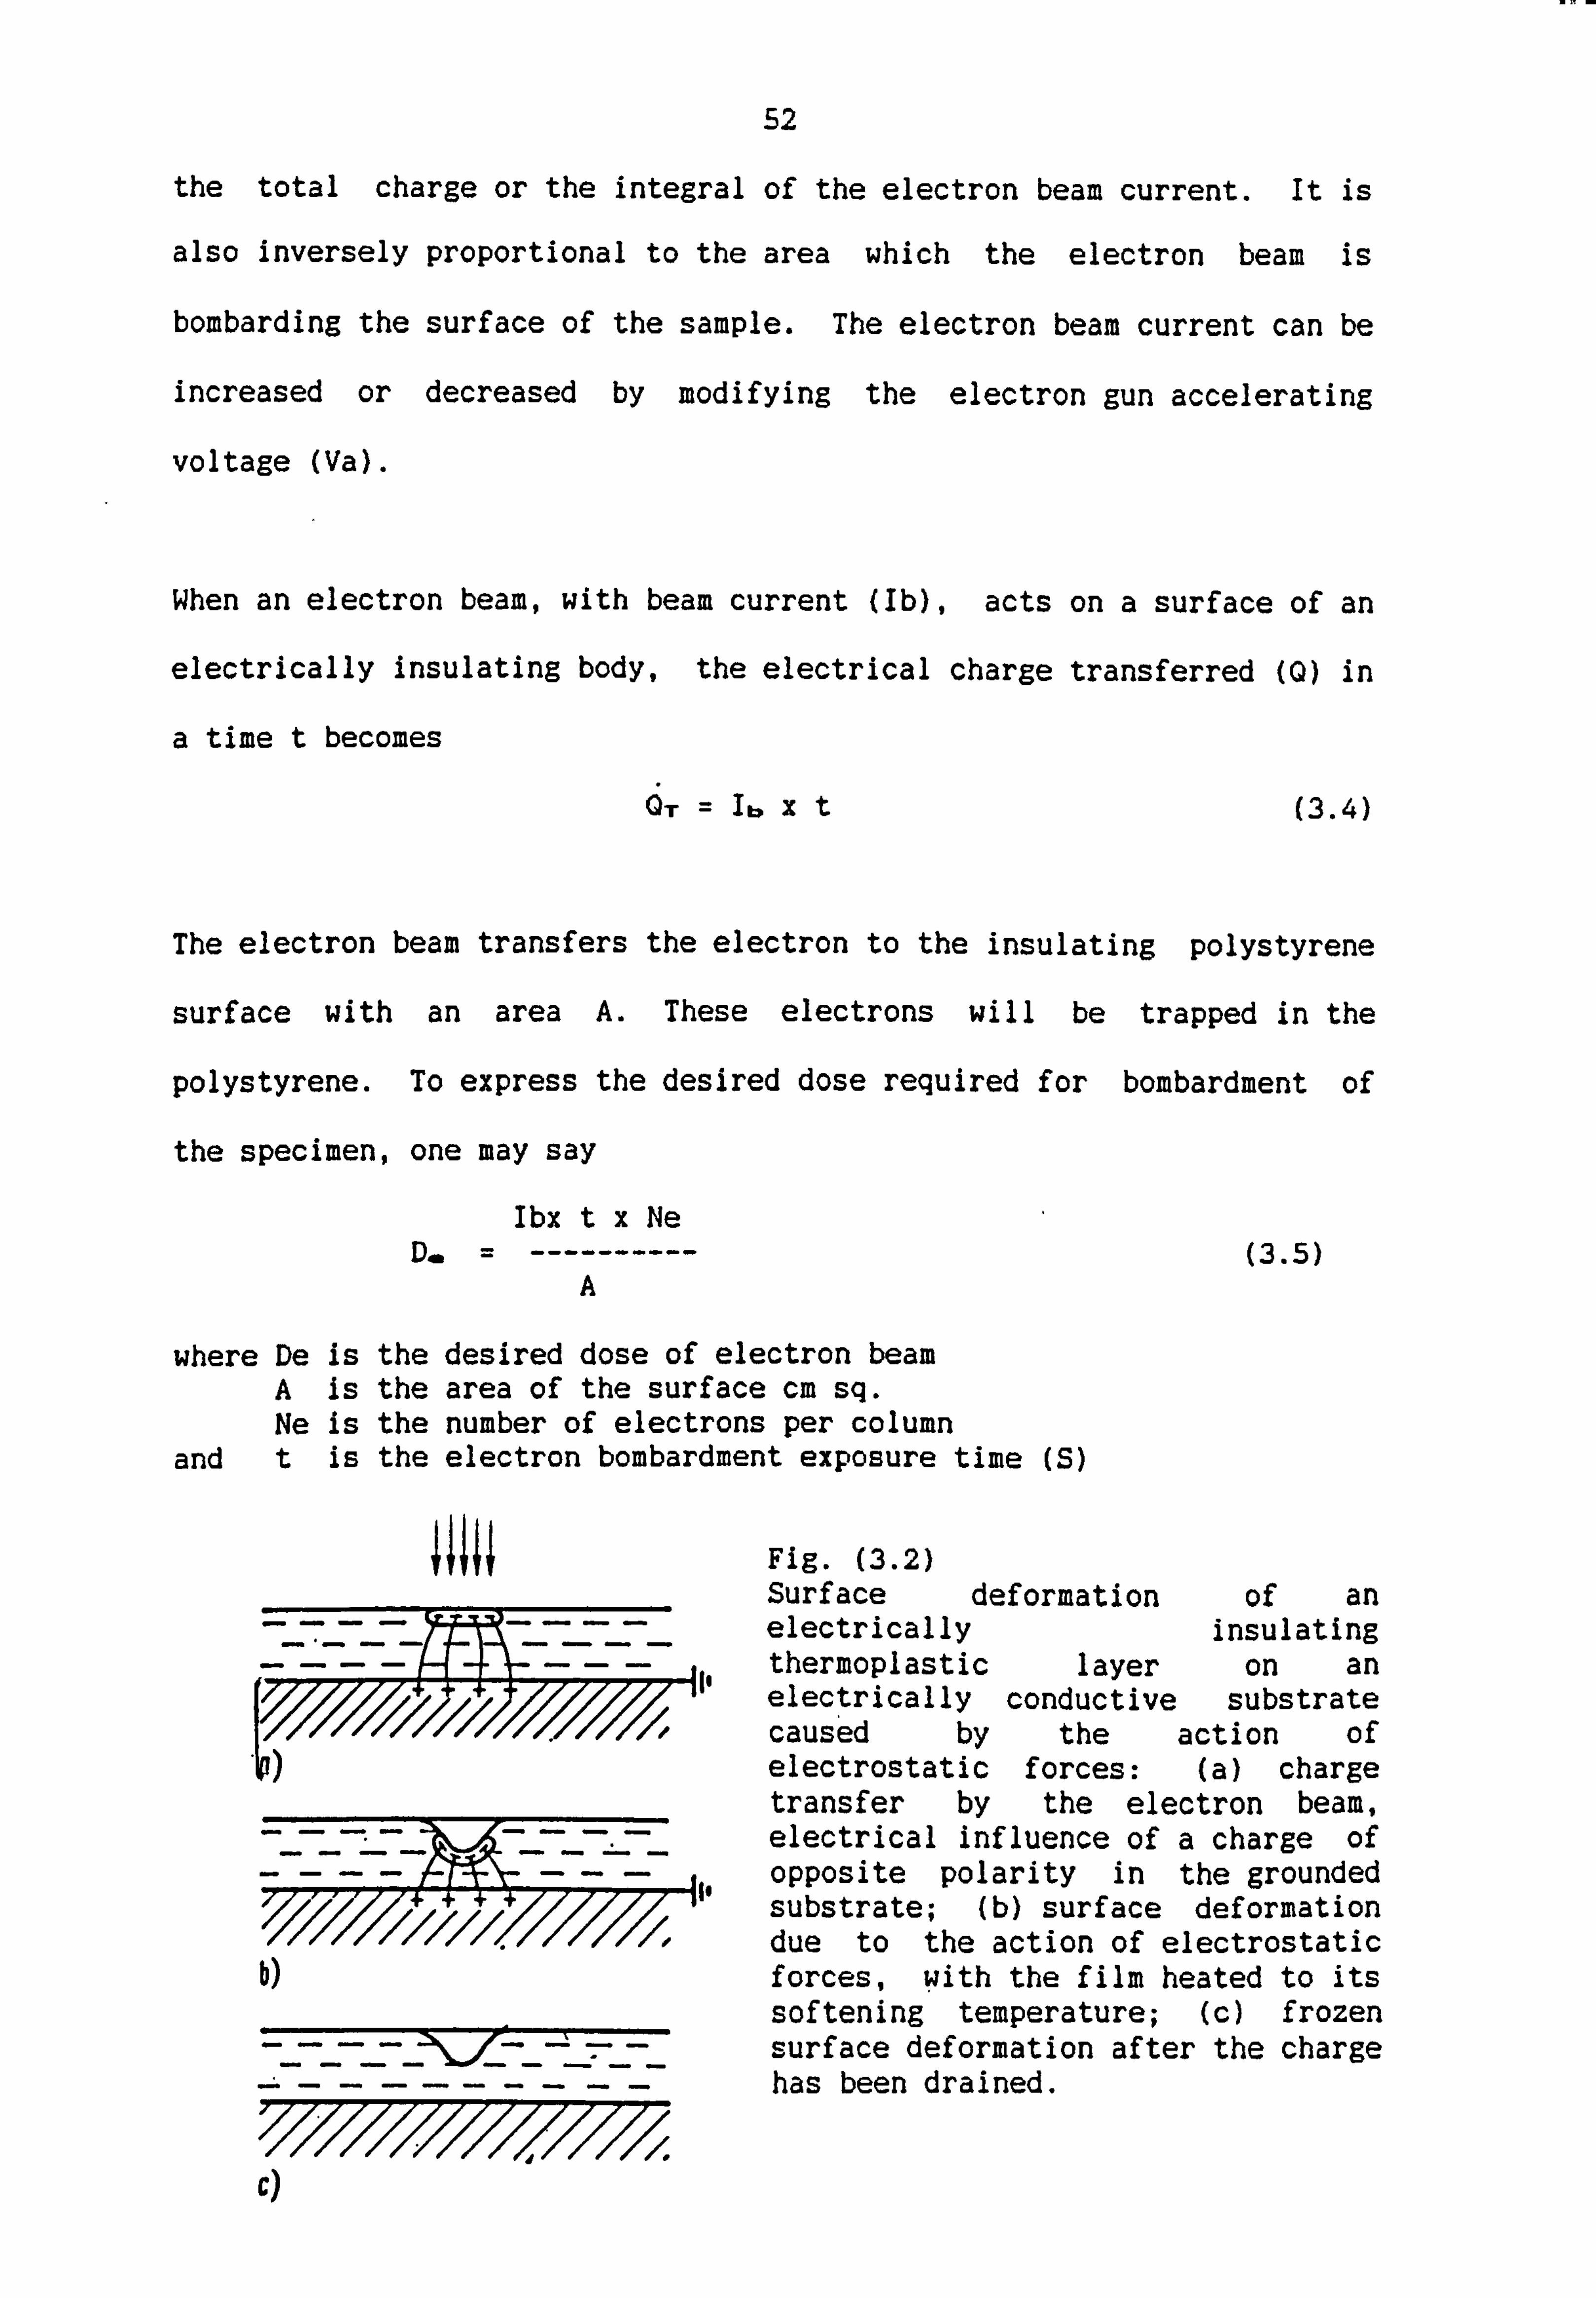
52
the total charge or the integral of the electron beam current. It is
also inversely proportional to the area which the electron beam is
bombarding the surface of the sample. The electron beam current can be
increased or decreased by modifying the electron gun accelerating
voltage (Va).
When an electron beam, with beam current (Ib), acts on a surface of an
electrically insulating body, the electrical charge transferred (0) in
a time t becomes
OT ý Ib (3.4)
The electron beam transfers the electron to the insulating polystyrene
surface with an area A. These electrons will be trapped in the
polystyrene. To express the desired dose required for bombardment of
the specimen, one may say
Ibx tx Ne ---------- (3.5)
A
where De is the desired dose of electron beam A is the area of the surface cm sq. Ne is the number of electrons per column
and t is the electron bombardment exposure time (S)
III
b)
ýý/000/0/// //ý/
Fig. (3.2) Surface deformation of an electrically insulating thermoplastic layer on an electrically conductive substrate caused by the action of electrostatic forces: (a) charge transfer by the electron beam, electrical influence of a charge of opposite polarity in the grounded substrate; (b) surface deformation due to the action of electrostatic forces, With the film heated to its softening temperature; (c) frozen surface deformation after the charge has been drained.

53
3.3 Isotope Separator
All heavy ion implants (to polystyrene petri dishes) performed in the
course of this work were carried out using the Harwell Mk. 4 isotope
separator at Salford University. This machine is best described in
terms of its consisting of a number of distinct units. All the units
are kept evacuated to a basic pressure 410-r, torr using
"diffstak"/rotary pumping systems.
3.3.1 Basic Data
3.3.1.1 Ion Source
The ion source, which "floats" at the required accelerating potential
is known as a Freeman source it comprises:
(a) A carbon arc chamber in which lies a filament run at -100-140 A.
(4V). Between the filament and the arc chamber (electrically
isolated) there is a 100V potential which will initiate a
discharge if any gas (usually inert) is introduced to the arc
chamber.
(b) Acceleration - up to 40 keV. is achieved within the source, and the
arc and filament supplies from isolated transformers) and the
input gas feed line are isolated from the earthed frame of the
source by large insulators.
(c) Many solid comPounds may be run in the source by loading them into
a small carbon crucible which is moved into the source chamber
temperature gradient by external movement of a steel rod (lear
loader) connected to the crucible with an alumina rod as
insulator. Corrosive vapours may also be run through the gas line
and externally controlled by a low flow-rate leak valve.

III
54
3.3.1.2 H. T. Supply
(a) This is variable from 0-400 and stabilised to I in 104.
(b) It is modulated by a sinusoidal voltage variable between 0-7 kV
peak-peak in order to provide horizontal sweeping of the extracted
ion beams.
Ions from the arc chamber are therefore velocity modulated until
they reach the analysing magnet from where, according to momentum
analysis, they emerge as convergent wedge-shaped beams, sweeping
sinusoidally with time (50 c. p. s. ) horizontally across the target
area.
3.3.1.3 Analysing MaRnet
The magnet is of a standard 'C' shape design with water cooled coils-
and provides a magnetic field variable between 0-11 kilogauss. It has
a nominal radius (for central beams) of 40 cm and a deflection angle of
60 degrees. To facilitate the focussing of the incident divergent
wedge-shaped beams (4 cm high), the pole tips are semi-circular shaped
and rotatable (+ 25 deg. ). Because of the vertical focussing action of
the magnet (or defocussing due to fringe field), the incident beams
are either vertically focussed or defocussed. Focussing occurs if the
pole tips are turned inward from their neutral 60 deg. position and
vice-versa for outward movement. Primarily, the pole tips are used to
focus the vertical line beam; inward movement brings this focus point
nearer to the exit pole face and vice-versa.
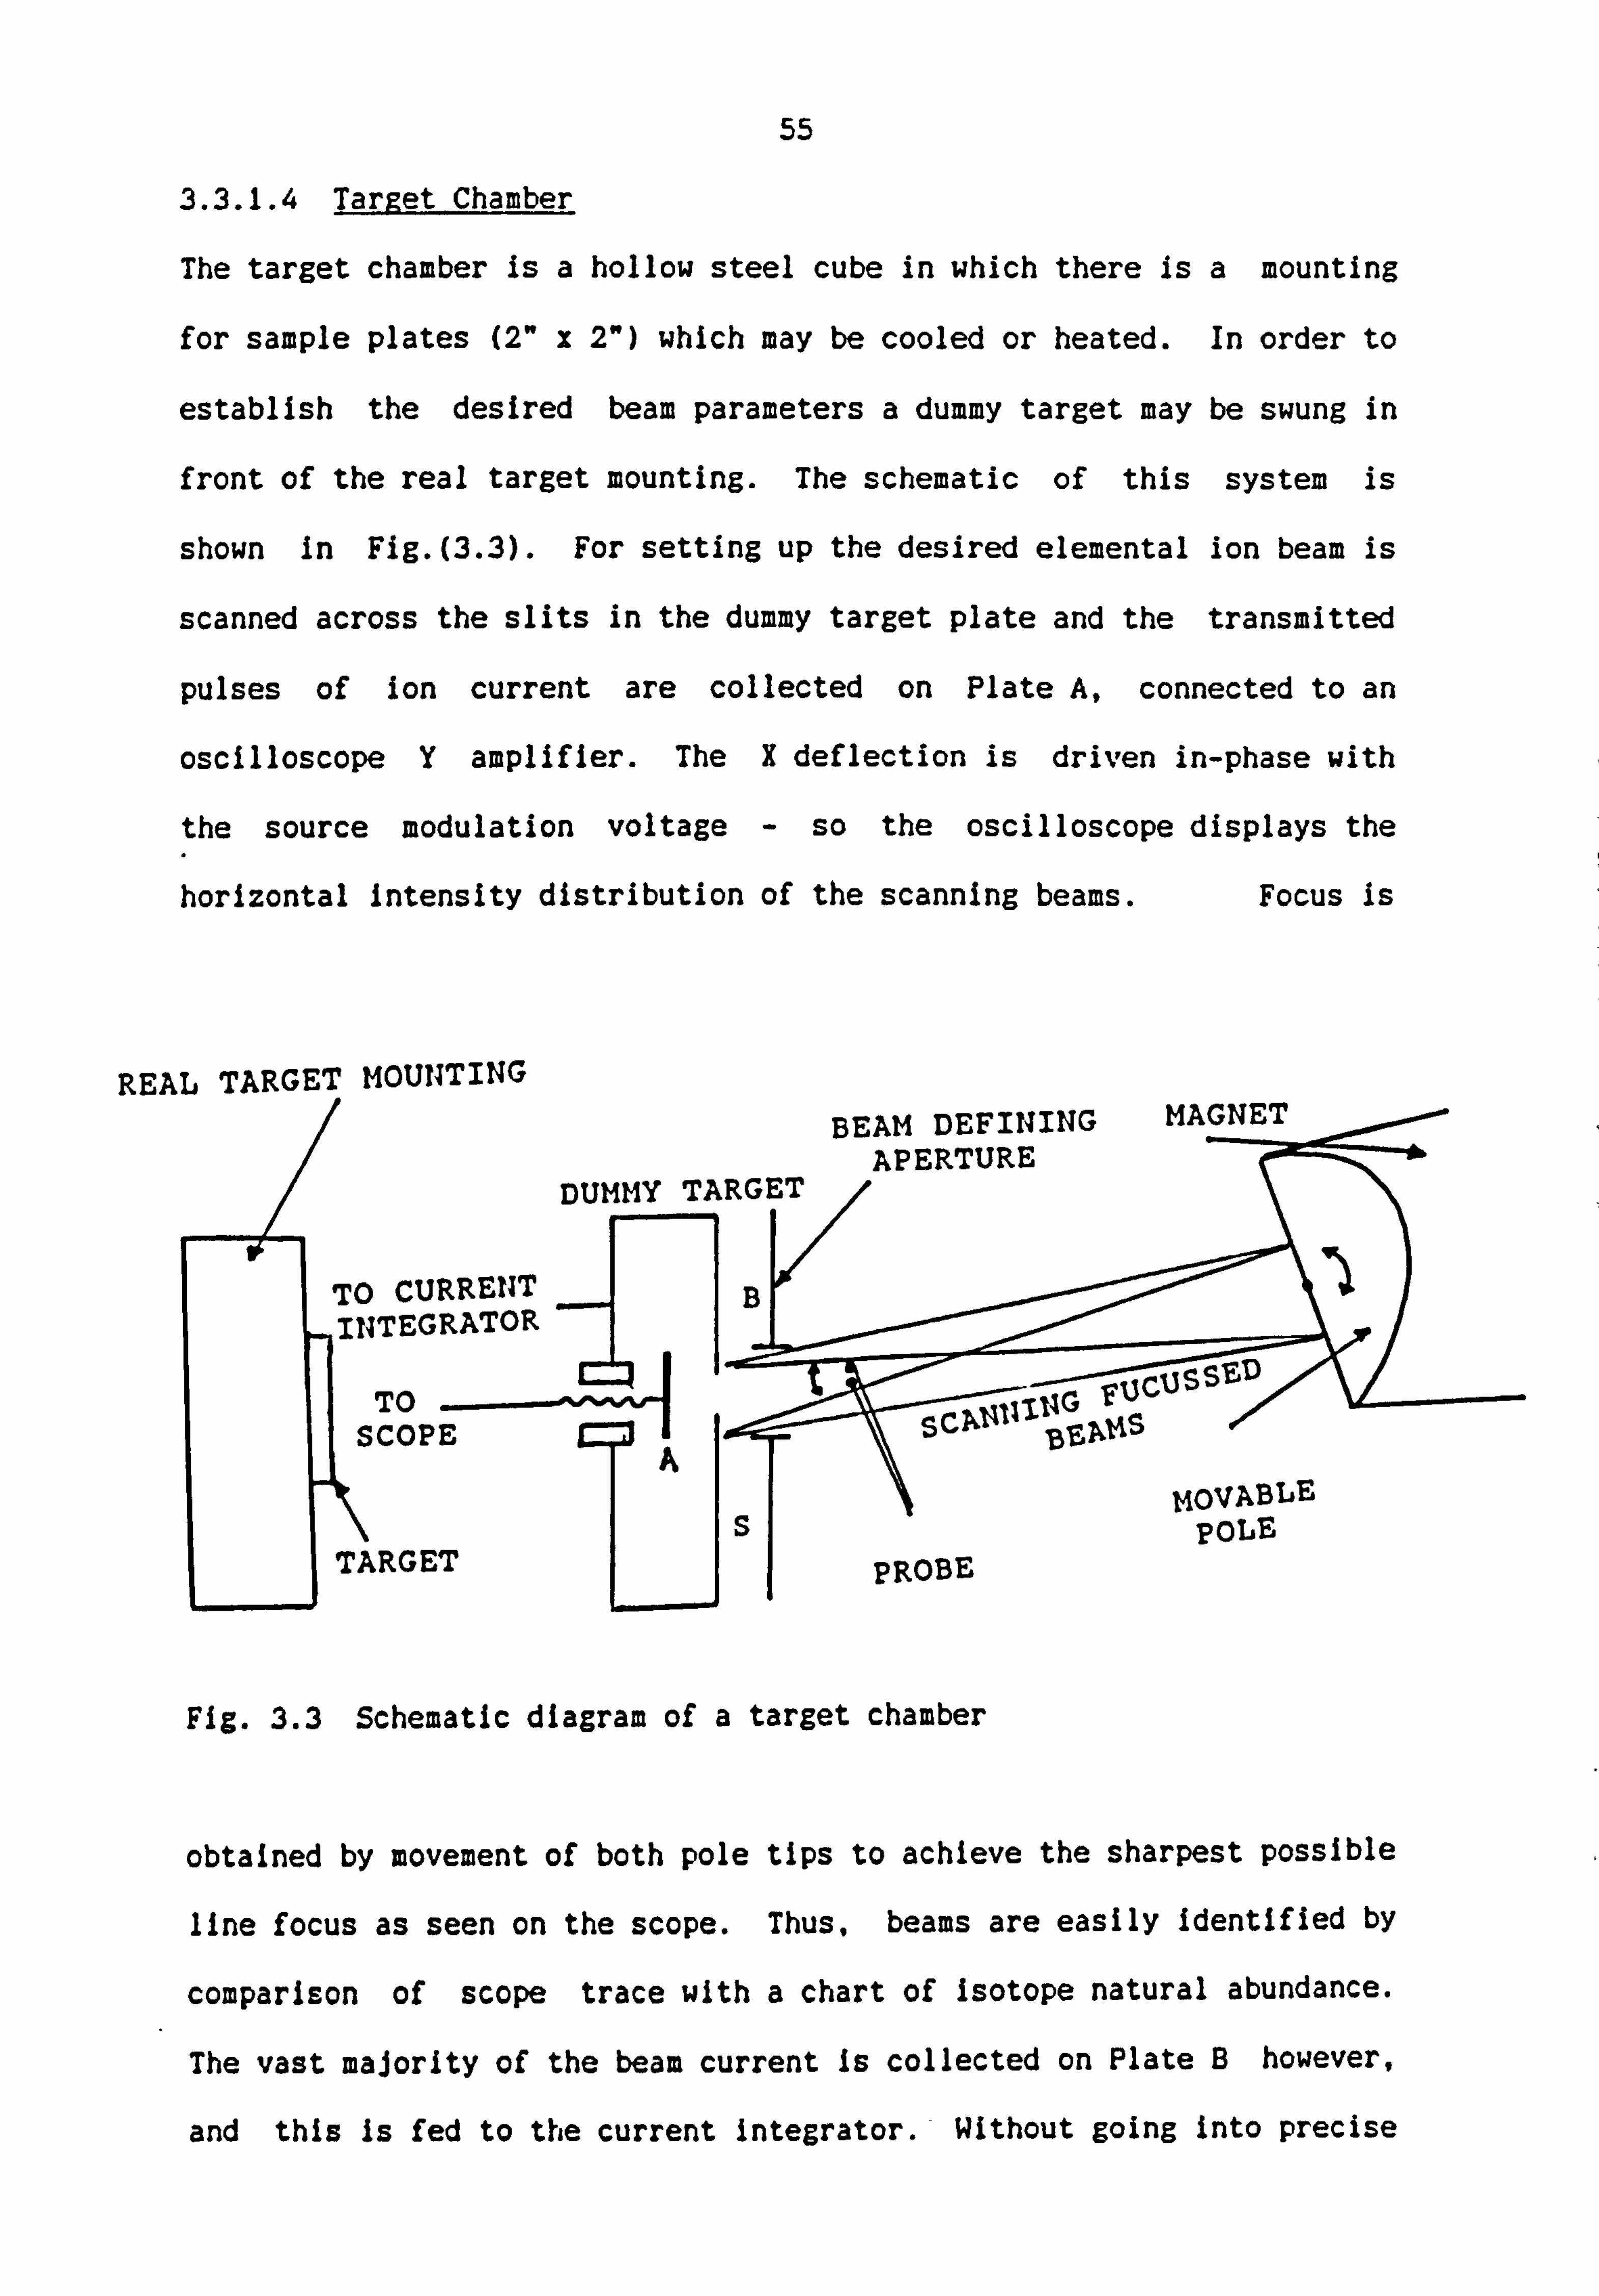
55
3.3.1.4 Target Chamber
The target chamber is a hollow steel cube in which there is a mounting
for sample plates (2" x 2") which may be cooled or heated. In order to
establish the desired beam parameters a dummy target may be swung in
front of the real target mounting. The schematic of this system is
shown in Fig. (3.3). For setting up the desired elemental ion beam is
scanned across the slits in the dummy target plate and the transmitted
pulses of ion current are collected on Plate A, connected to an
oscilloscope Y amplifier. The X deflection is driven in-phase with
the source modulation voltage - so the oscilloscope displays the
horizontal Intensity distribution of the scanning beams. Focus is
REAL TARGET MOUNTING
DUMMY TARGET
CURRENT B ITEGRATOR
TO COPE---ý
A
s ýRGET
BEAM DEFINING MAGNET APERTURE
I
UjS S'eD ýcu
; Mlli-lAG sc .I N14S 13f,
140VABLE POLE
PROBE
Fig. 3.3 Schematic diagram of a target chamber
obtained by movement of both pole tips to achieve the sharpest possible
line focus as seen on the scope. Thus, beams are easily Identified by
comparison of scope trace with a chart of Isotope natural abundance.
The vast majority of the beam current is collected on Plate B however,
and this is fed to the current integrator. Without going into precise
56
detail, the integrator incorporates two range switching devices - one a
current range switch, the other a voltage range switch. When all the
necessary parameters had been calculated, the defining apertures were
manufactured to a range of different sizes and ascribed a number (1-4).
The apertures are square with areas of 2.08-8.32 cm sq.; to achieve a
desired dose D (ions/cm sq. ) the counter on the integrator is set to a
number of counts given by
Dx (Aperture number) counts = -------------------------------------- (3.6)
10-18 x(Voltage range)x(Current range)
The Integrator count rate may be switched to an order above or below
the rate normally used (as in formula above). The normal count rate
used Is 3 counts per full scale second of the current meter.
3.3.2 General Data
To get horizontal uniformity of implant the beam must be swept over the
largest area possible without bringing unwanted beams near the
aperture. If high Intensity unwanted beams (as shown on 'scope) are
close to desired beams, then a small aperture must be used with a
corresponding reduced beam sweep.
As arranged for most studies, the effective optical source of ions is
at the line of the filament which ý76 cm from the magnet entry pole.
The target plane is at ý70 cm from its exit pole.
As shown In the accompanying drawings (Fig. (3.4)), the focal plane is
not normal to the line of beam exit from the magnet.
One-to-one scaling of the scope separation distances with the real
57
isotope separation at the plane of the target is obtained by inserting
two probes into the lower extremity of the beams just before the
aperture (Fig. (3.4). These are set 2 cm apart, therefore, by
adjusting the 'scope display X gain until the signals from each probe
are 2 cm apart, the display then shows the real physical separation of
isotopes at the ýarget place. In the normal mode of operation, the
separation of masses M&M +4 M is independent of beam energy and is
approximately given by:
separation ZZ 40 6M CMS m
The machine must not be run if base pressures are )10-41 torr. To get
stable arcs, the pressure in the source chamber (not the arc chamber)
must be ' 10-1 torr. Since the entire flight tube is 2ý14 cm wide and 6
cm high to allow transit of the beams, differential pumping to a high
degree is not possible. However, target pressures should still not
exceed Z5 x 10-1 torr.
Targets are loaded onto the mounting through an air lock which is taken
down to roughing pressure (ý5 x 10⁻² torr) before opening the side
loader gate valve.
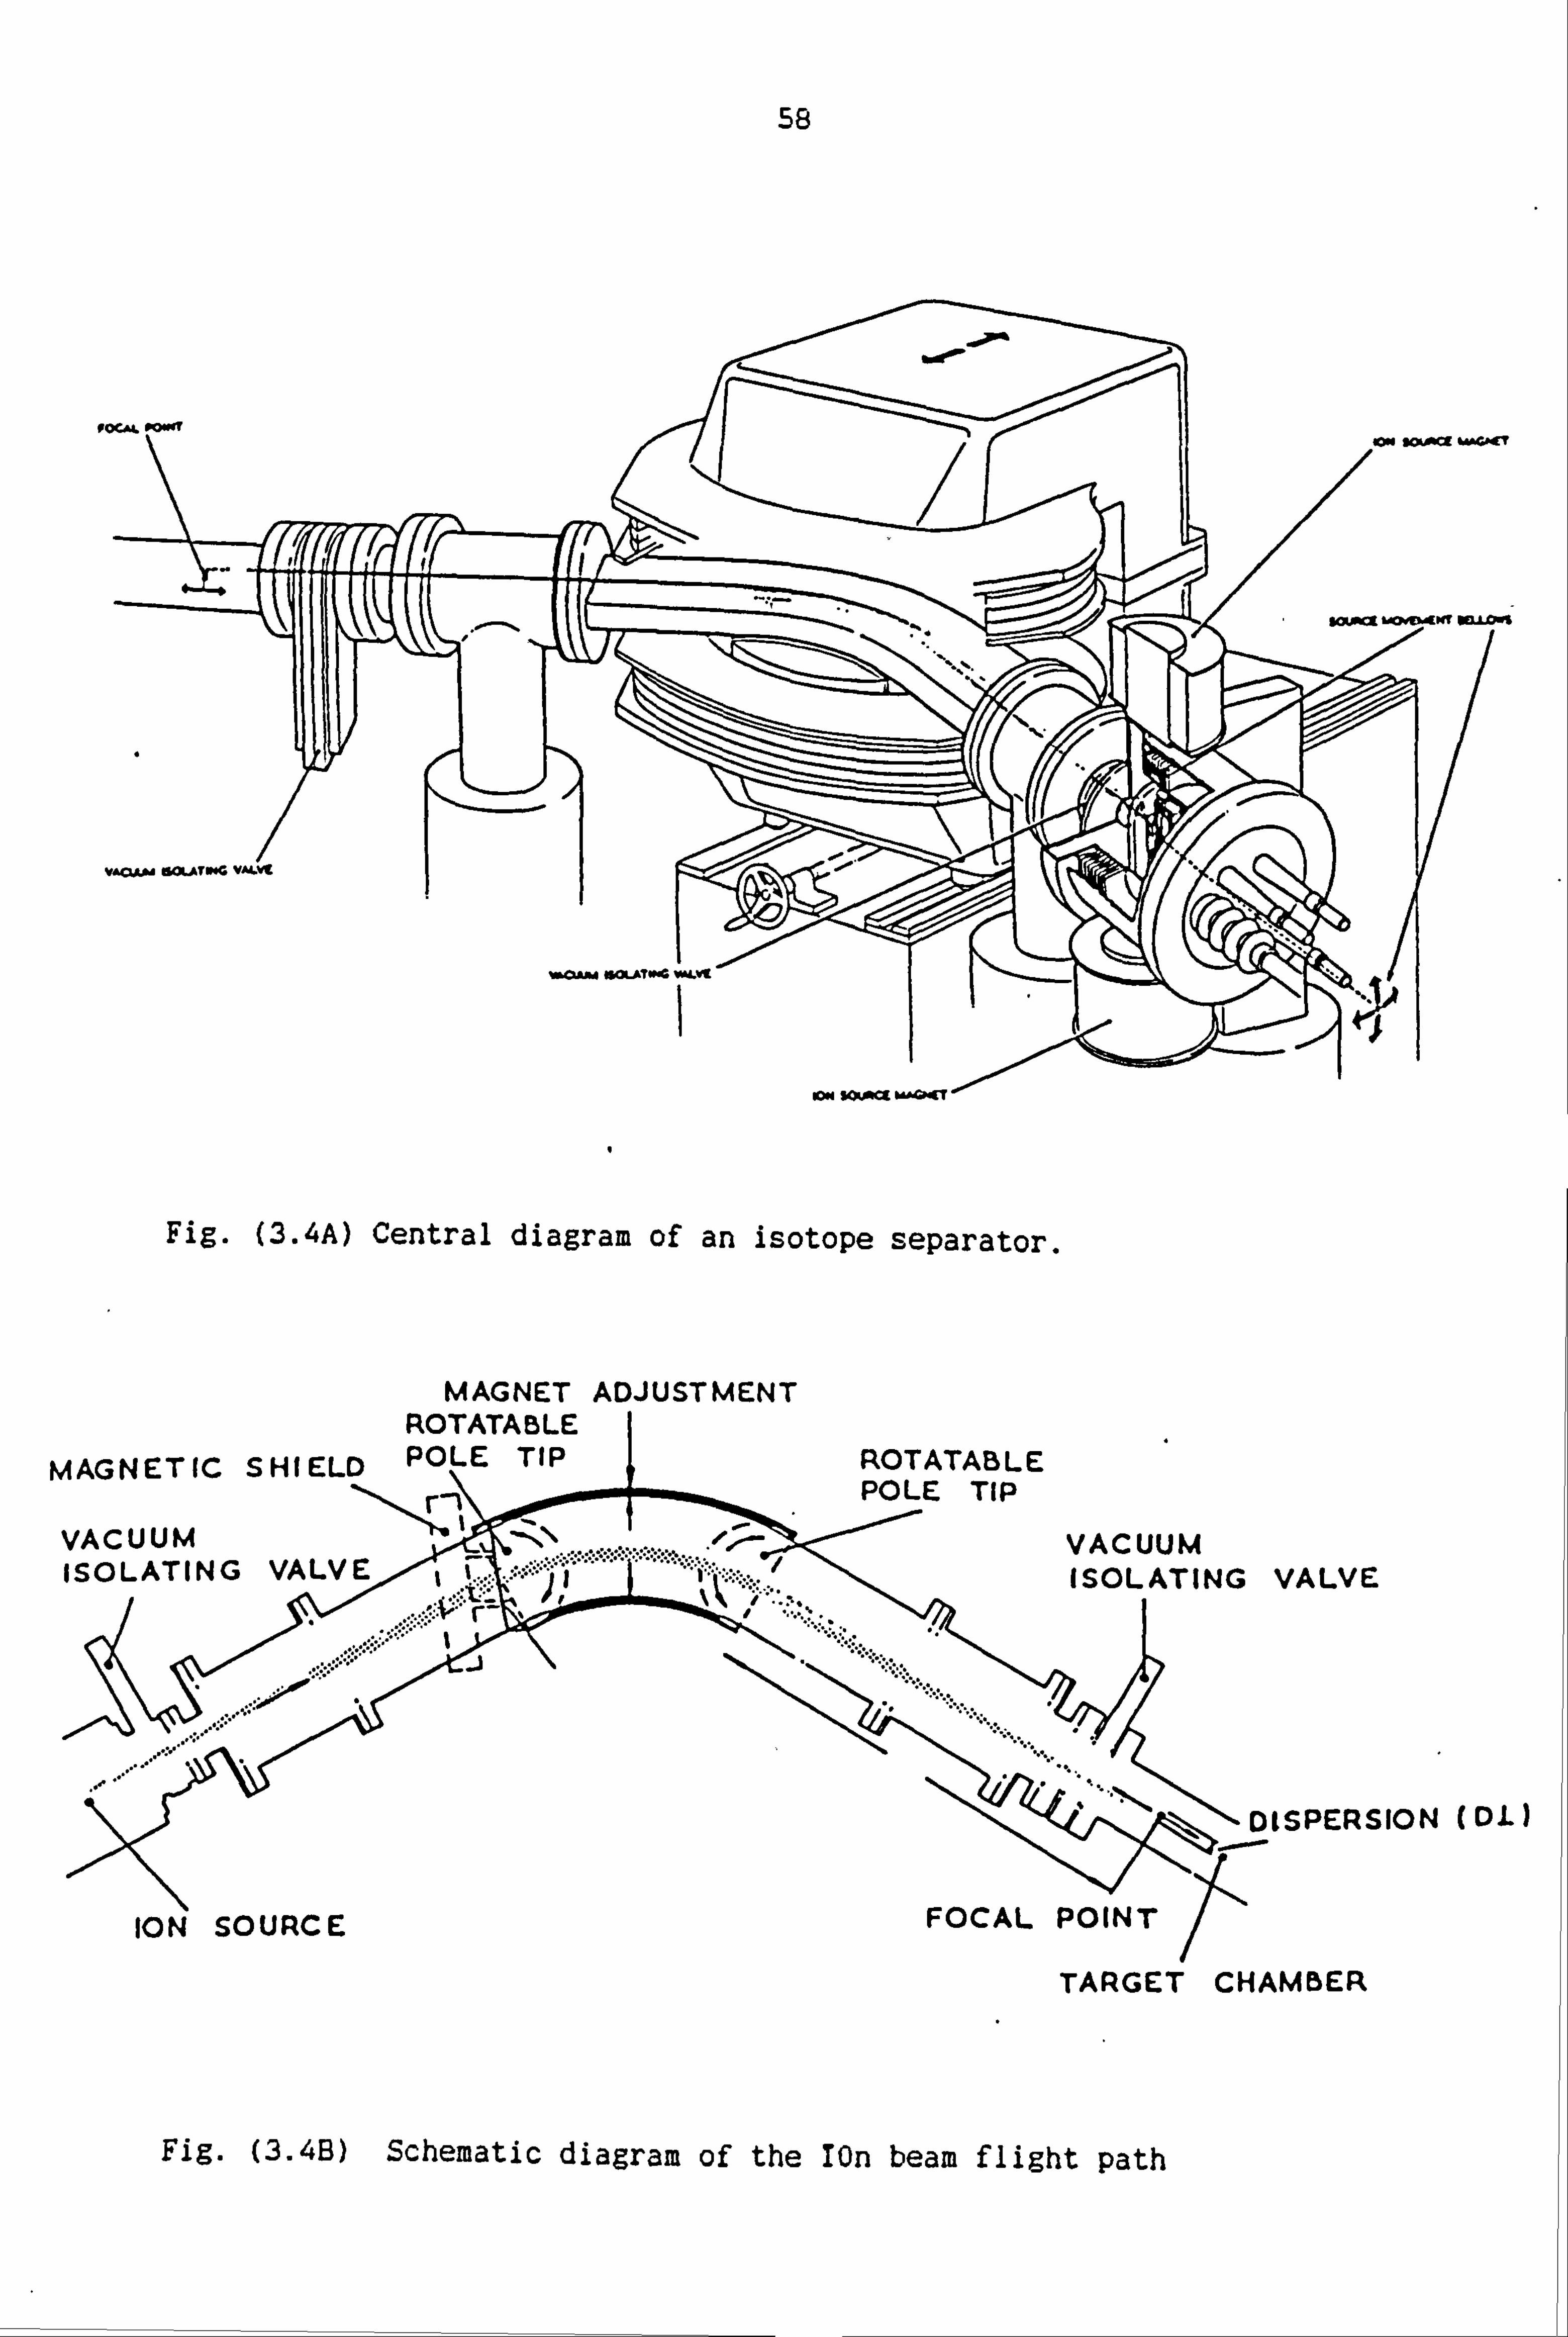
58
PC
V
Fig. (3.4A) Central diagram of an isotope separator.
CT
P"
MAGNET ADJUSTMENT ROTATABLE
MAGNETIC SHIELD POLE TIP ROTATABLE POLE TIP
VACUUM VACUUM ISOLATING VALVE ISOLATING VALVE
DISPERSION (DL)
ION SOURCE FOCAL POINT
TARGET CHAMBER
Fig. (3.4B) Schematic diagram of the rOn beam flight path
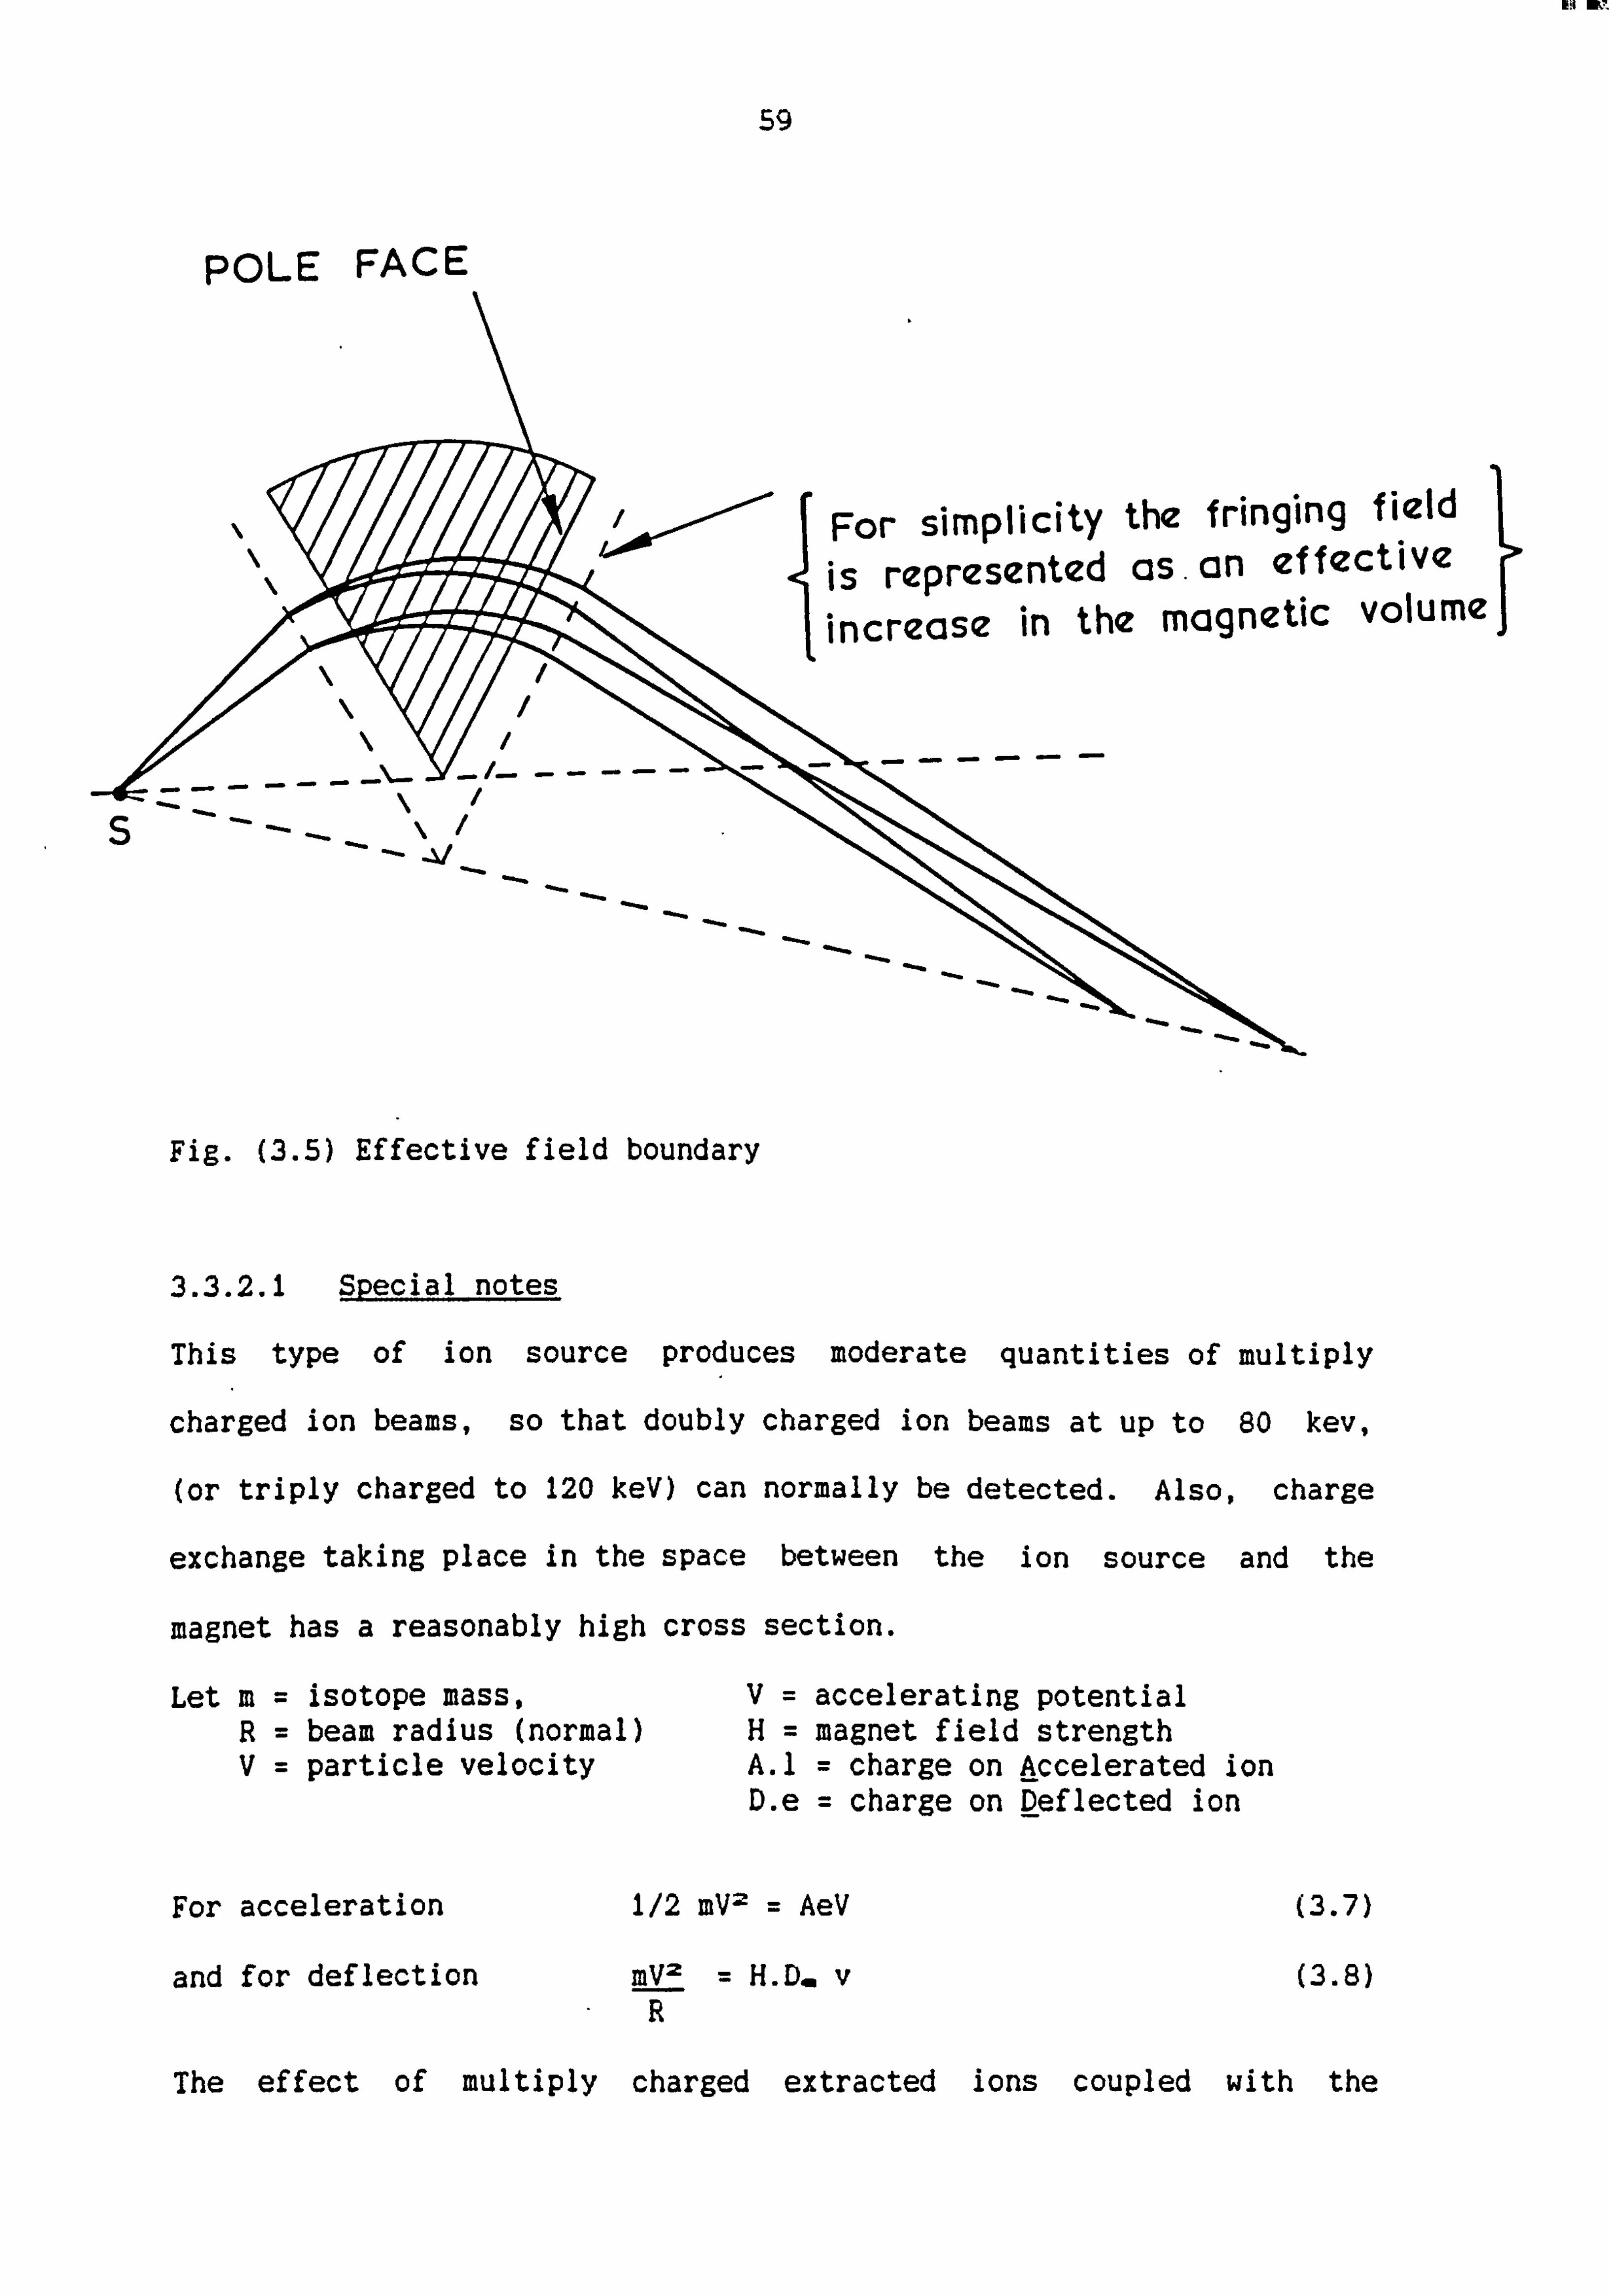
Ei m7,
POLE FACE
59
For simplicity the fringing field
is represented as. an effective increase in the magnetic volume
S---\I ---
-
---
Fig. (3.5) Effective field boundary
3.3.2.1 Special notes
This type of ion source produces moderate quantities of multiply
charged ion beams, so that doubly charged ion beams at up to 80 kev,
(or triply charged to 120 keV) can normally be detected. Also, charge
exchange taking place in the space between the ion source and the
magnet has a reasonably high cross section.
Let m isotope mass, V accelerating potential R beam radius (normal) H magnet field strength V particle velocity A. 1 = charge on Accelerated ion
D. e = charge on Deflected ion
For acceleration 1/2 mV2 = AeV (3.7)
and for deflection mV2 = H. D. v (3.8) R
The effect of multiply charged extracted ions coupled with the
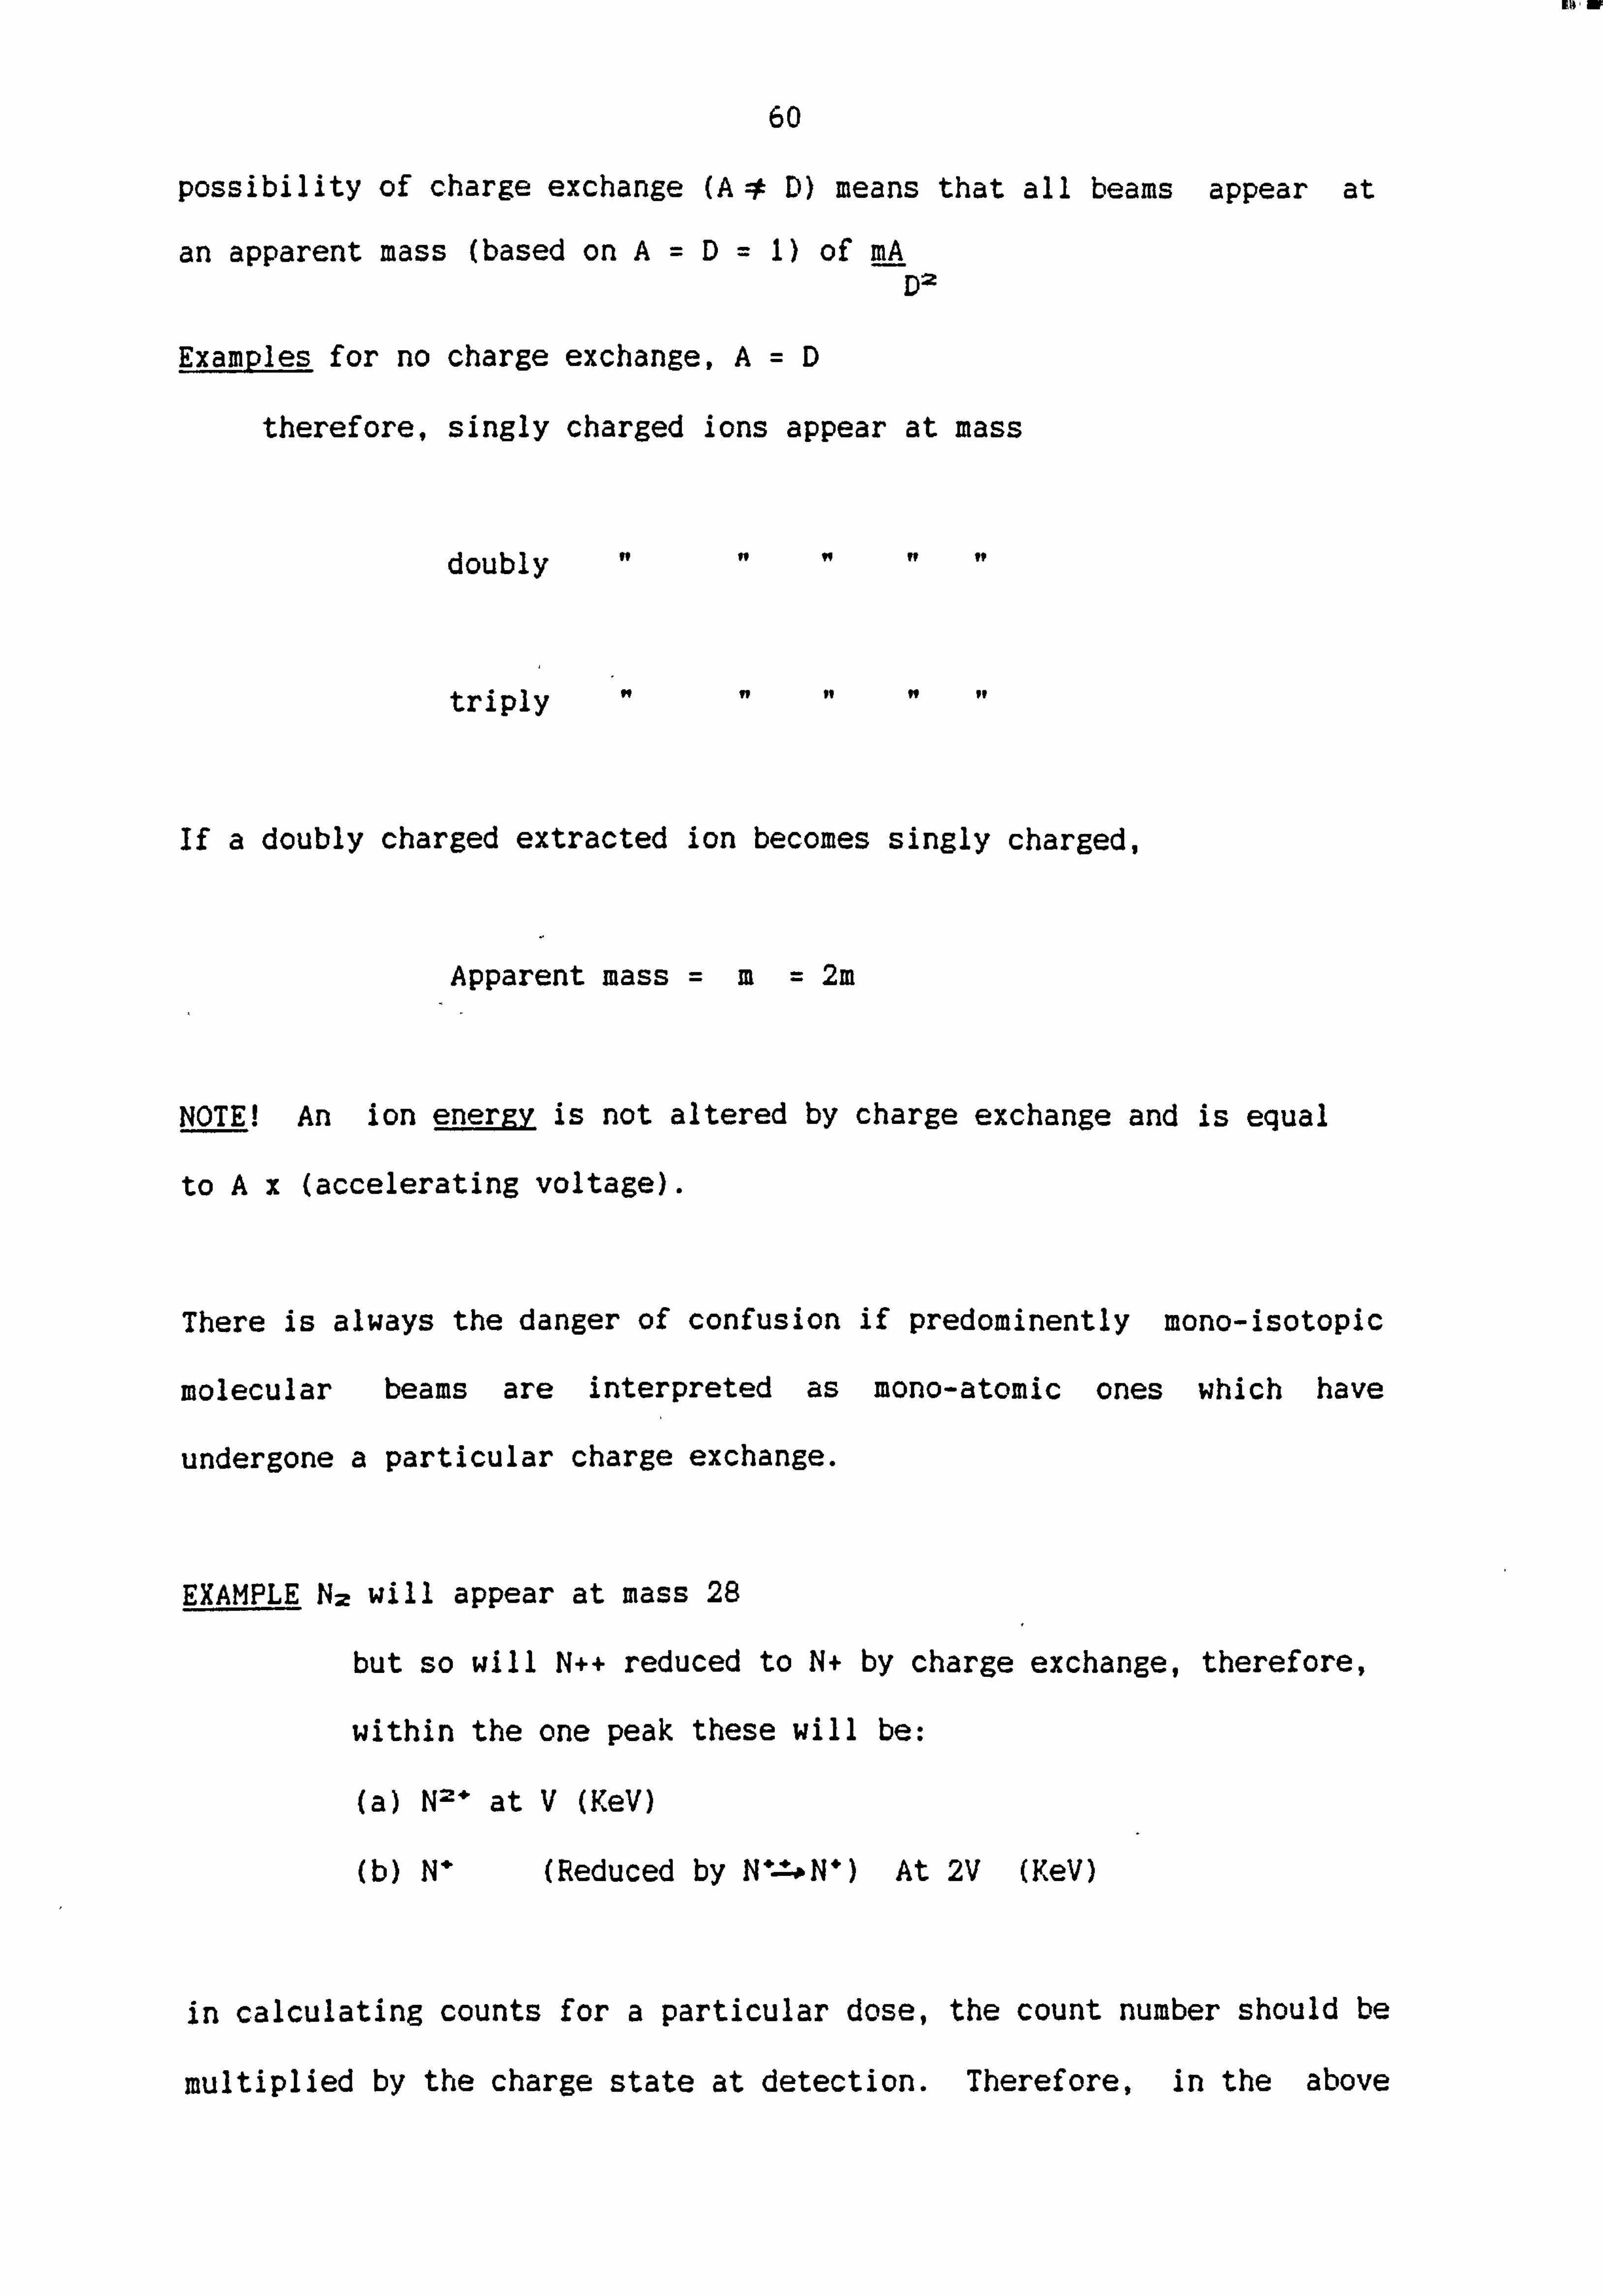
114, w
60
possibility of charge exchange (A D) means that all beams appear at
an apparent mass (based on A=D 1) of mA D2
Examples for no charge exchange, A=D
therefore, singly charged ions appear at mass
doubly it
triply 11 it
If a doubly charged extracted ion becomes singly charged,
Apparent mass =m= 2m
NOTE! An ion energy is not altered by charge exchange and is equal
to Ax (accelerating voltage).
There is always the danger of confusion if predominently mono-isotopic
molecular beams are interpreted as mono-atomic ones which have
undergone a particular charge exchange.
EXAMPLE Nz will appear at mass 28
but so will N++ reduced to N+ by charge exchange, therefore,
within the one peak these will be:
(a) N2+ at V (KeV)
(b) N* (Reduced by N+=oN+) At 2V (KeV)
in calculating counts for a particular dose, the count number should be
multiplied by the charge state at detection. Therefore, in the above

61
example, if the peak at mass 28 was assumed to be:
(a) N2 singly charged at V and run to dose D
It could also be -
-(b) N* From (Nt-"PN*) At 2V run to a dose D/2
However, generally, molecular species dissociate at the target into
single atoms with shared energy. Therefore
(a) would enter the target A and run to a dose 2D
Thus if both N24' & N** are generated at the ion source and it was
assumed that only N2* entered the target, we would have at mass 28
Assumption - N2* At energy V dose D
But Possibility -N At energy Y dose 2D z
or Possibly - N* At energy 2V dose D/2
3.4 Van de Graaff
The high energetic -electron bombardment experiments performed in the
execution of this work were carried out using the High Voltage Ltd.
AN2000 Van de Graaff accelerator at Salford University. This machine,
like the isotope separator described in section 3.3, has an ion beam
flight path evacuated to ý 10-6 torr, but may be divided into four
sections. Fig. (3.6) presents a simplified plan of the Van de Graaff
and its ancillary equipment.
lair w
62
3.4.1 The high voltaRe terminal
The high voltage terminal is supported on a resistive column, built of
equispaced metal planes. Adjacent planes are connected to each other
by resistors of the order of 2000 M-a, thus ensuring a relatively
uniform electric field gradient along the ions acceleration path. The
terminal itself can sustain a potential of up to 2 MV., but below 500
M the ion beams produced become progressively more difficult to
control due to their increased sensitivity to parameters such as the
beam focussing and small variations in the terminal potential. For
this reason, acceleration energies in the range 2 to 3 MeV. have been
selected for this present work. I
The high voltage terminal contains the R. F. ion source, a selection of
gases which may be accelerated, a high voltage probe used to eject ions
from the source into the flight tube, and the ion beam focus power
supply. Power for all these facilities is provided by an alternator
housed within the upper pulley of the Van de Graaff charging belt. The
support column and terminal are encased in a pressure vessel containing
a mixture of nitrogen and carbon dioxide at -370 p. s. i., which provides
effective electrical insulation. A corona discharge is maintained
through this gas to stabilize the terminal potential as described
briefly in section 3.4.3.
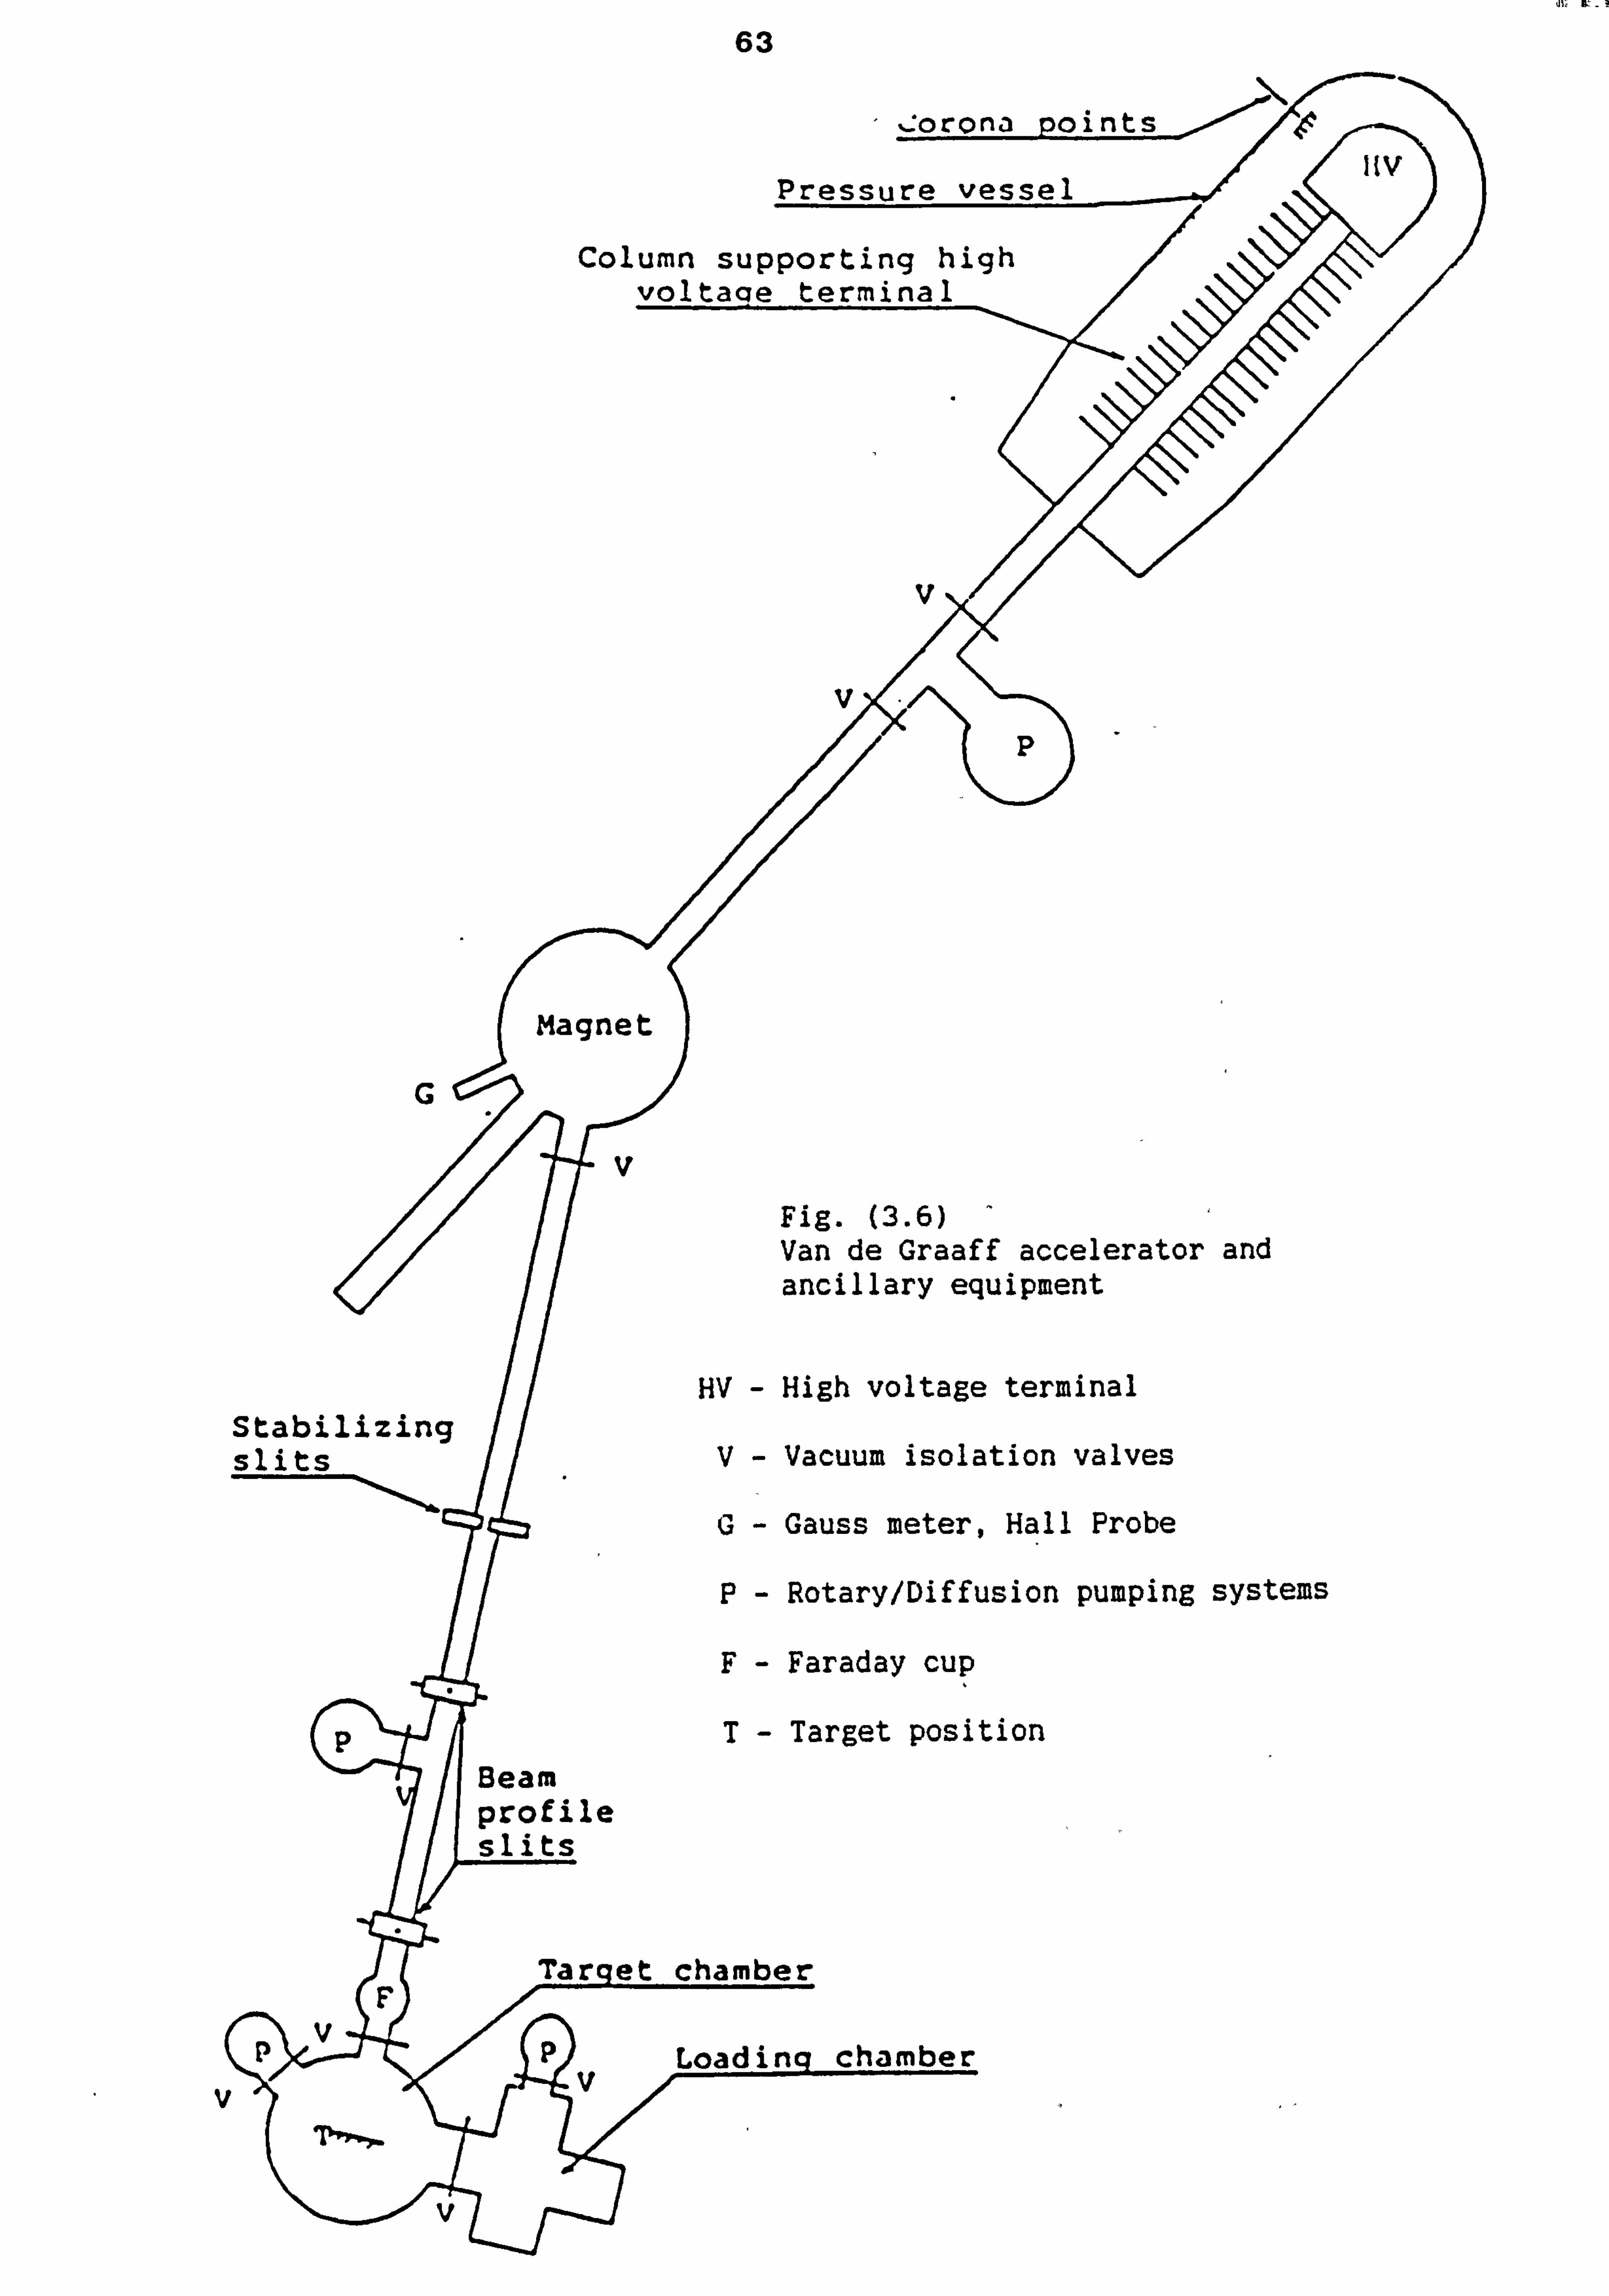
63
, : orona point
Pressure vessel
Column supporting high voltaoe terminal
v XY
Magnet
V
Fig. (3.6) Van de Graaff accelerator and ancillary equipment
Stabilizing slits
p Beam profile slits
Ta r
v p
v
HV - High voltage terminal
V- Vacuum isolation valves
G- Gauss meter, Hall Probe
P- Rotary/Diffusion pumping systems
F- Faraday cup
T- Target position
m
Loadinq cham
liv
V

0m
64
3.4.2 Maznetic analyser
A high stability (0.01%) power supply is used for the analysing magnet
associated with this equipment, and the magnetic field may be set to
within 0.1 gauss in the range 0 to 12 k. gauss. These facilities enable
ion beam energies to be reproduced accurately by using the appropriate
magnetic field.
3.4.3. Ion beam flight path
The ion beam flight path between the magnet and target chamber is
described here as it contains a number of important features. A pair
of energy stabilization slits are located in the evacuated beam line.
These slits extend into the ion beam at each side and intercept high
and low energy ions respectively. Assuming the analysing magnetic flux
to be stable, any motion of the ion beam to either side of its normal
trajectory must be associated with a variation in the accelerating
potential. The result of this change in trajectory is a variation in
the magnitude of the-currents measured on the stabilizing slits. To
maintain stability, a feedback loop is incorporated. These currents are
passed through a differential amplifier, output of which is used to
alter the corona current in such a manner as to restore the terminal
potential to its original level.
As the stabilizers are water cooled, they also serve a secondary purpose
of greatly reducing the ion beam width. The helium beams employed
throughout this work were normally used in a defocussed state, which
resulted in a beam of '3 cm. diameter. The stabilizers reduced the
beam width to -5 mm.
The helium beam profile at this point was stil I too large for

65
convenient use, hence two sets of beam defining slits, included in the
beam line, were employed to reduce the beam to its final size of 2 mm.
high and 0.5 mm. wide. These slits were well separated along the beam
line, their spatial difference being -2 m.
The final item before beam entry into the target chamber is a Faraday
cup. This device was used to collect and measure the ion current as
the initial beam was set up and stabilized to the appropriate value for
use (5 nA to 30 nA). To permit the ion beam access to the target, the
cup, supported through a sliding vacuum seal, was lifted out of the ion
beam path. It is also inserted to monitor the ion beam current while
targets are being changed.
3.4.4 Target Chamber
Access to the target chamber is gained through a side loading chamber
which acts as an air lock, in a similar manner to the isotope separator
target chamber system. However, in the case of the Van de Graaff, the
air lock has its own complete pumping system to enable equalisation of
pressures before opening to the target chamber. (Fig. (3.7))
Targets were mounted in stainless steel sample holders but were
insulated from the holder and held in place by isolated spring clips
which act as the current path for monitoring the ion beam. In the
target chamber, the holder slides into a three axis goniometer, of
which the rotation about each axis may be controlled to 0.01 deg. When
positioned in the goniometer, a contact made to the spring clip was
used for current measurement. Contact to the holder itself enabled the
application of a 500 V. negative potential to the holder which served
to suppress secondary electron emission from the target.
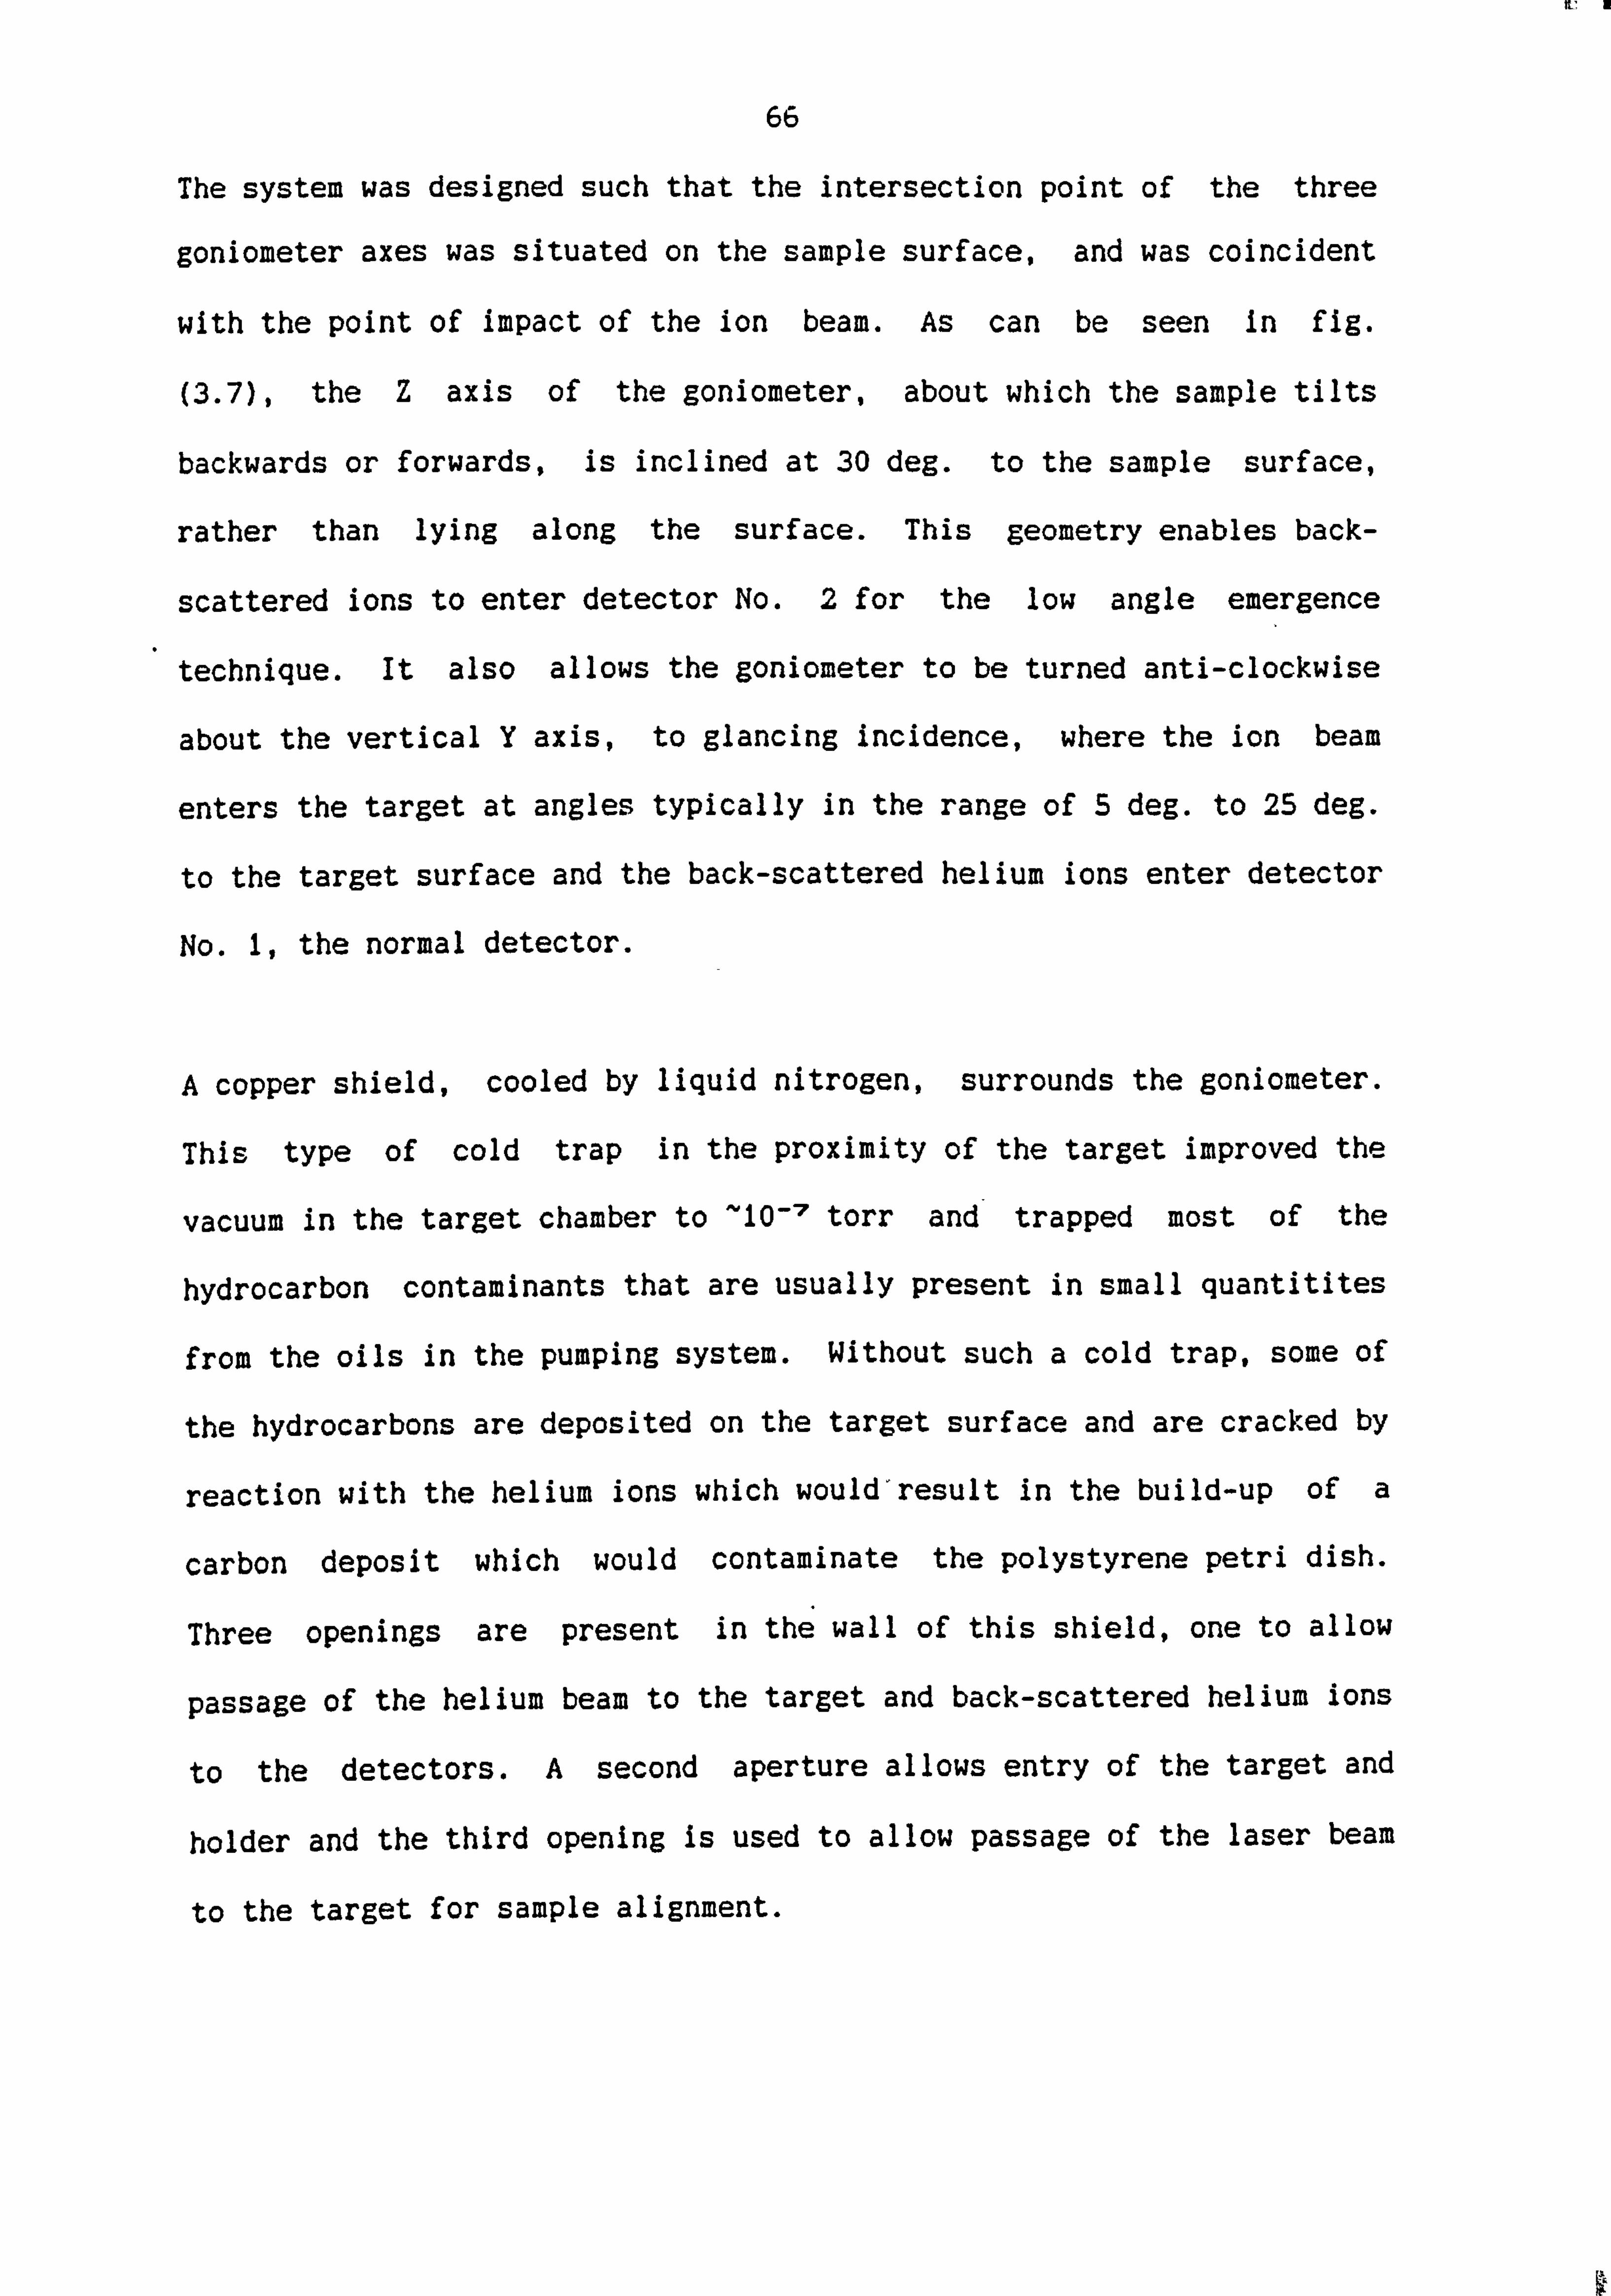
tV a
66
The system was designed such that the intersection point of the three
goniometer axes was situated on the sample surface, and was coincident
with the point of impact of the ion beam. As can be seen in fig.
(3.7), the Z axis of the goniometer, about which the sample tilts
backwards or forwards, is inclined at 30 deg. to the sample surface,
rather than lying along the surface. This geometry enables back-
scattered ions to enter detector No. 2 for the low angle emergence
technique. It also allows the goniometer to be turned anti-clockwise
about the vertical Y axis, to glancing incidence, where the ion beam
enters the target at angles typically in the range of 5 deg. to 25 deg.
to the target surface and the back-scattered helium ions enter detector
No. 1, the normal detector.
A copper shield, cooled by liquid nitrogen, surrounds the goniometer.
This type of cold trap in the proximity of the target improved the
vacuum in the target chamber to -10-7 torr and trapped most of the
hydrocarbon contaminants that are usually present in small quantitites
from the oils in the pumping system. Without such a cold trap, some of
the hydrocarbons are deposited on the target surface and are cracked by
reaction with the helium ions which would'result in the build-up of a
carbon deposit which would contaminate the polystyrene petri dish.
Three openings are present in the wall of this shield, one to allow
passage of the helium beam to the target and back-scattered helium ions
to the detectors. A second aperture allows entry of the target and
holder and the third opening is used to allow passage of the laser beam
to the target for sample alignment.
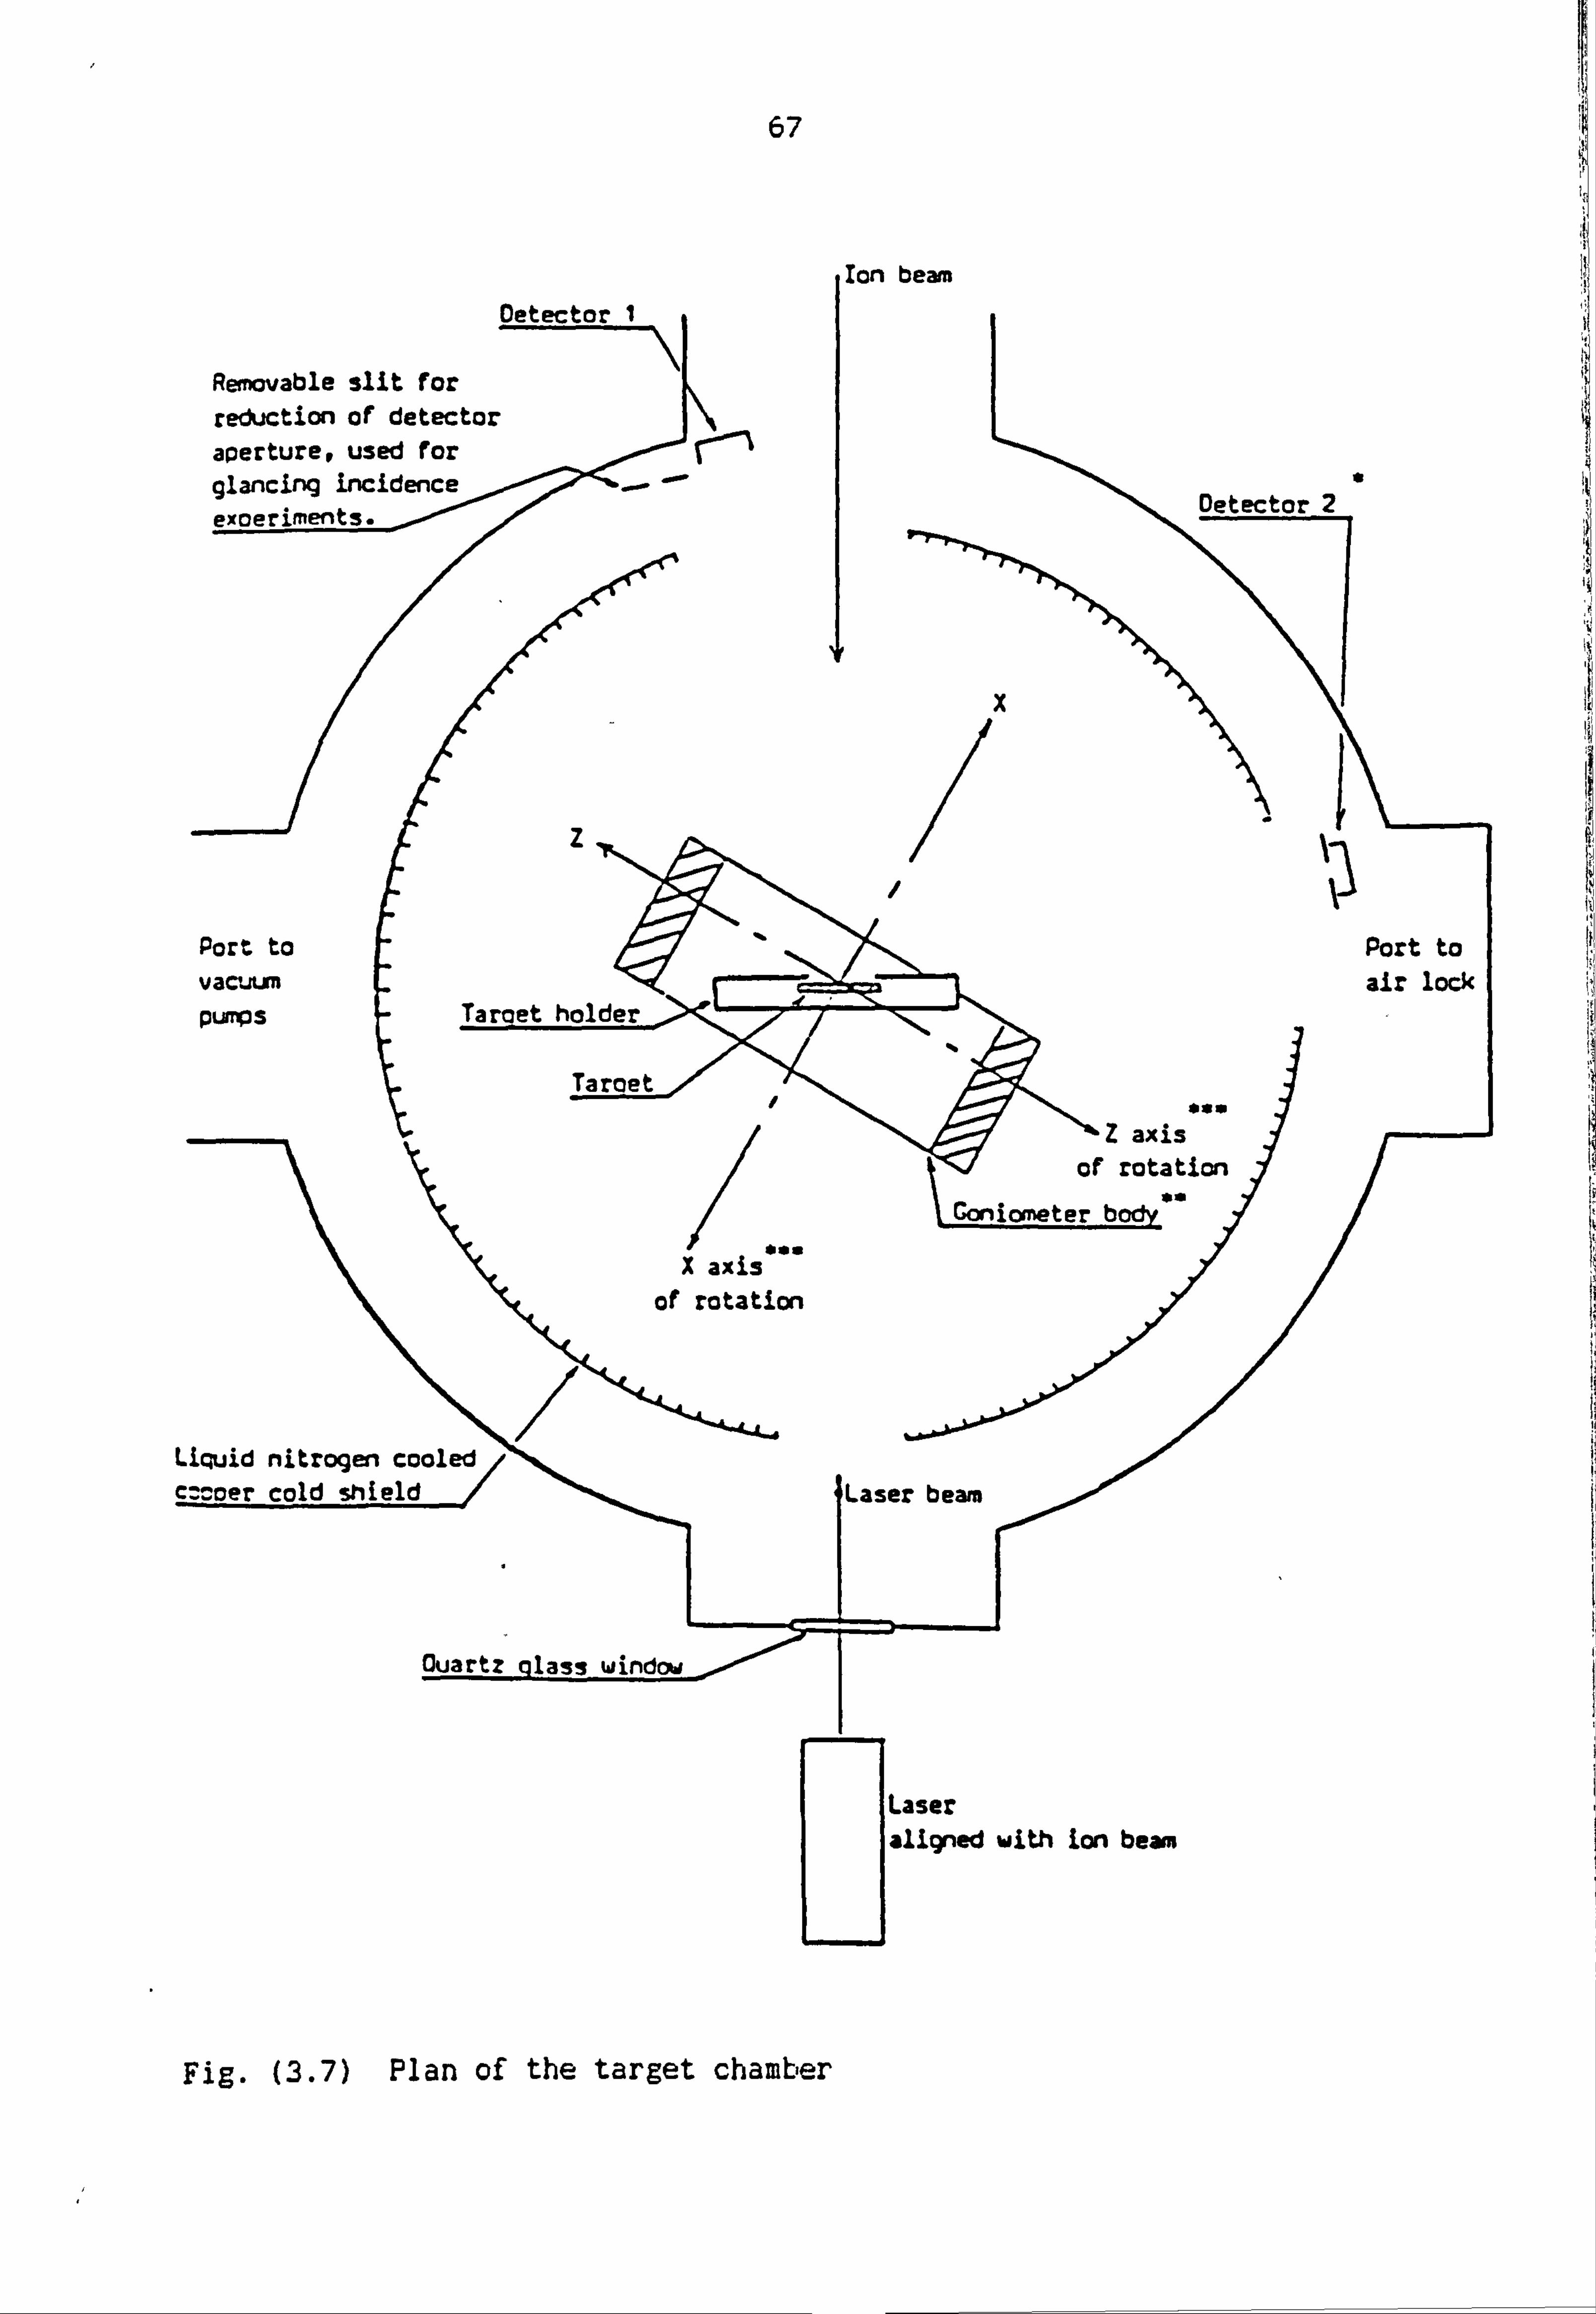
67
I
Removable slit for
reduction of detector
aperture, used for I glancing lncidl! enýce Pxosriments.
Port to
vacuum pumps
Liquid nitrogen cooled
ron beam
beam
U
Laser aligned with Lon beam
I
Fig. (3-7) Plan of the target chamber
*
Part to
air lock
1' /
68
3.5 D. C. Plasma ion bombardment
To ion-bombard any substrate in a low energy region, one may use ion-
plating rig, except that the evaporation source is not required. Ion
plating is a hybrid vacuum coating process that combines the benefits
of vacuum evaporation and sputtering. The term, ion plating, is
generally applied to high energy plasma deposition methods in which the
surface to be coated is subjected to a small flux of high energy ions.
A much larger number of continuous bombardment of the substrate by
these energetic ions and atoms of both the coating material and the
support gas, results in a wide variety of effects. In the ion
bombardment experiments, there is no material to be vaporised. The
working gas in the vacuum chamber will be ionized by a D. C. voltage
between the two electrodes as shown in Figure (3.8). The ionized gas
will form a plasma.
A plasma is defined as a region of high temperature gas containing
large numbers of free electrons and ions. By a proper application of
electrical potential, electrons can be extracted from the plasma to
provide a useful energy beam.
Surfaces in contact with plasmas are bombarded by electrons, ions and
photons. The electron and ion bombardment is particularly important.
Less is known about the influences of the plasma radiation. The
relative number of ions and electrons which are present on a surface
depends on whether it is biased as a cathode or anode, or is
electrically isolated. It is also related to the rate of gas flow and
magnitude of applied voltage.
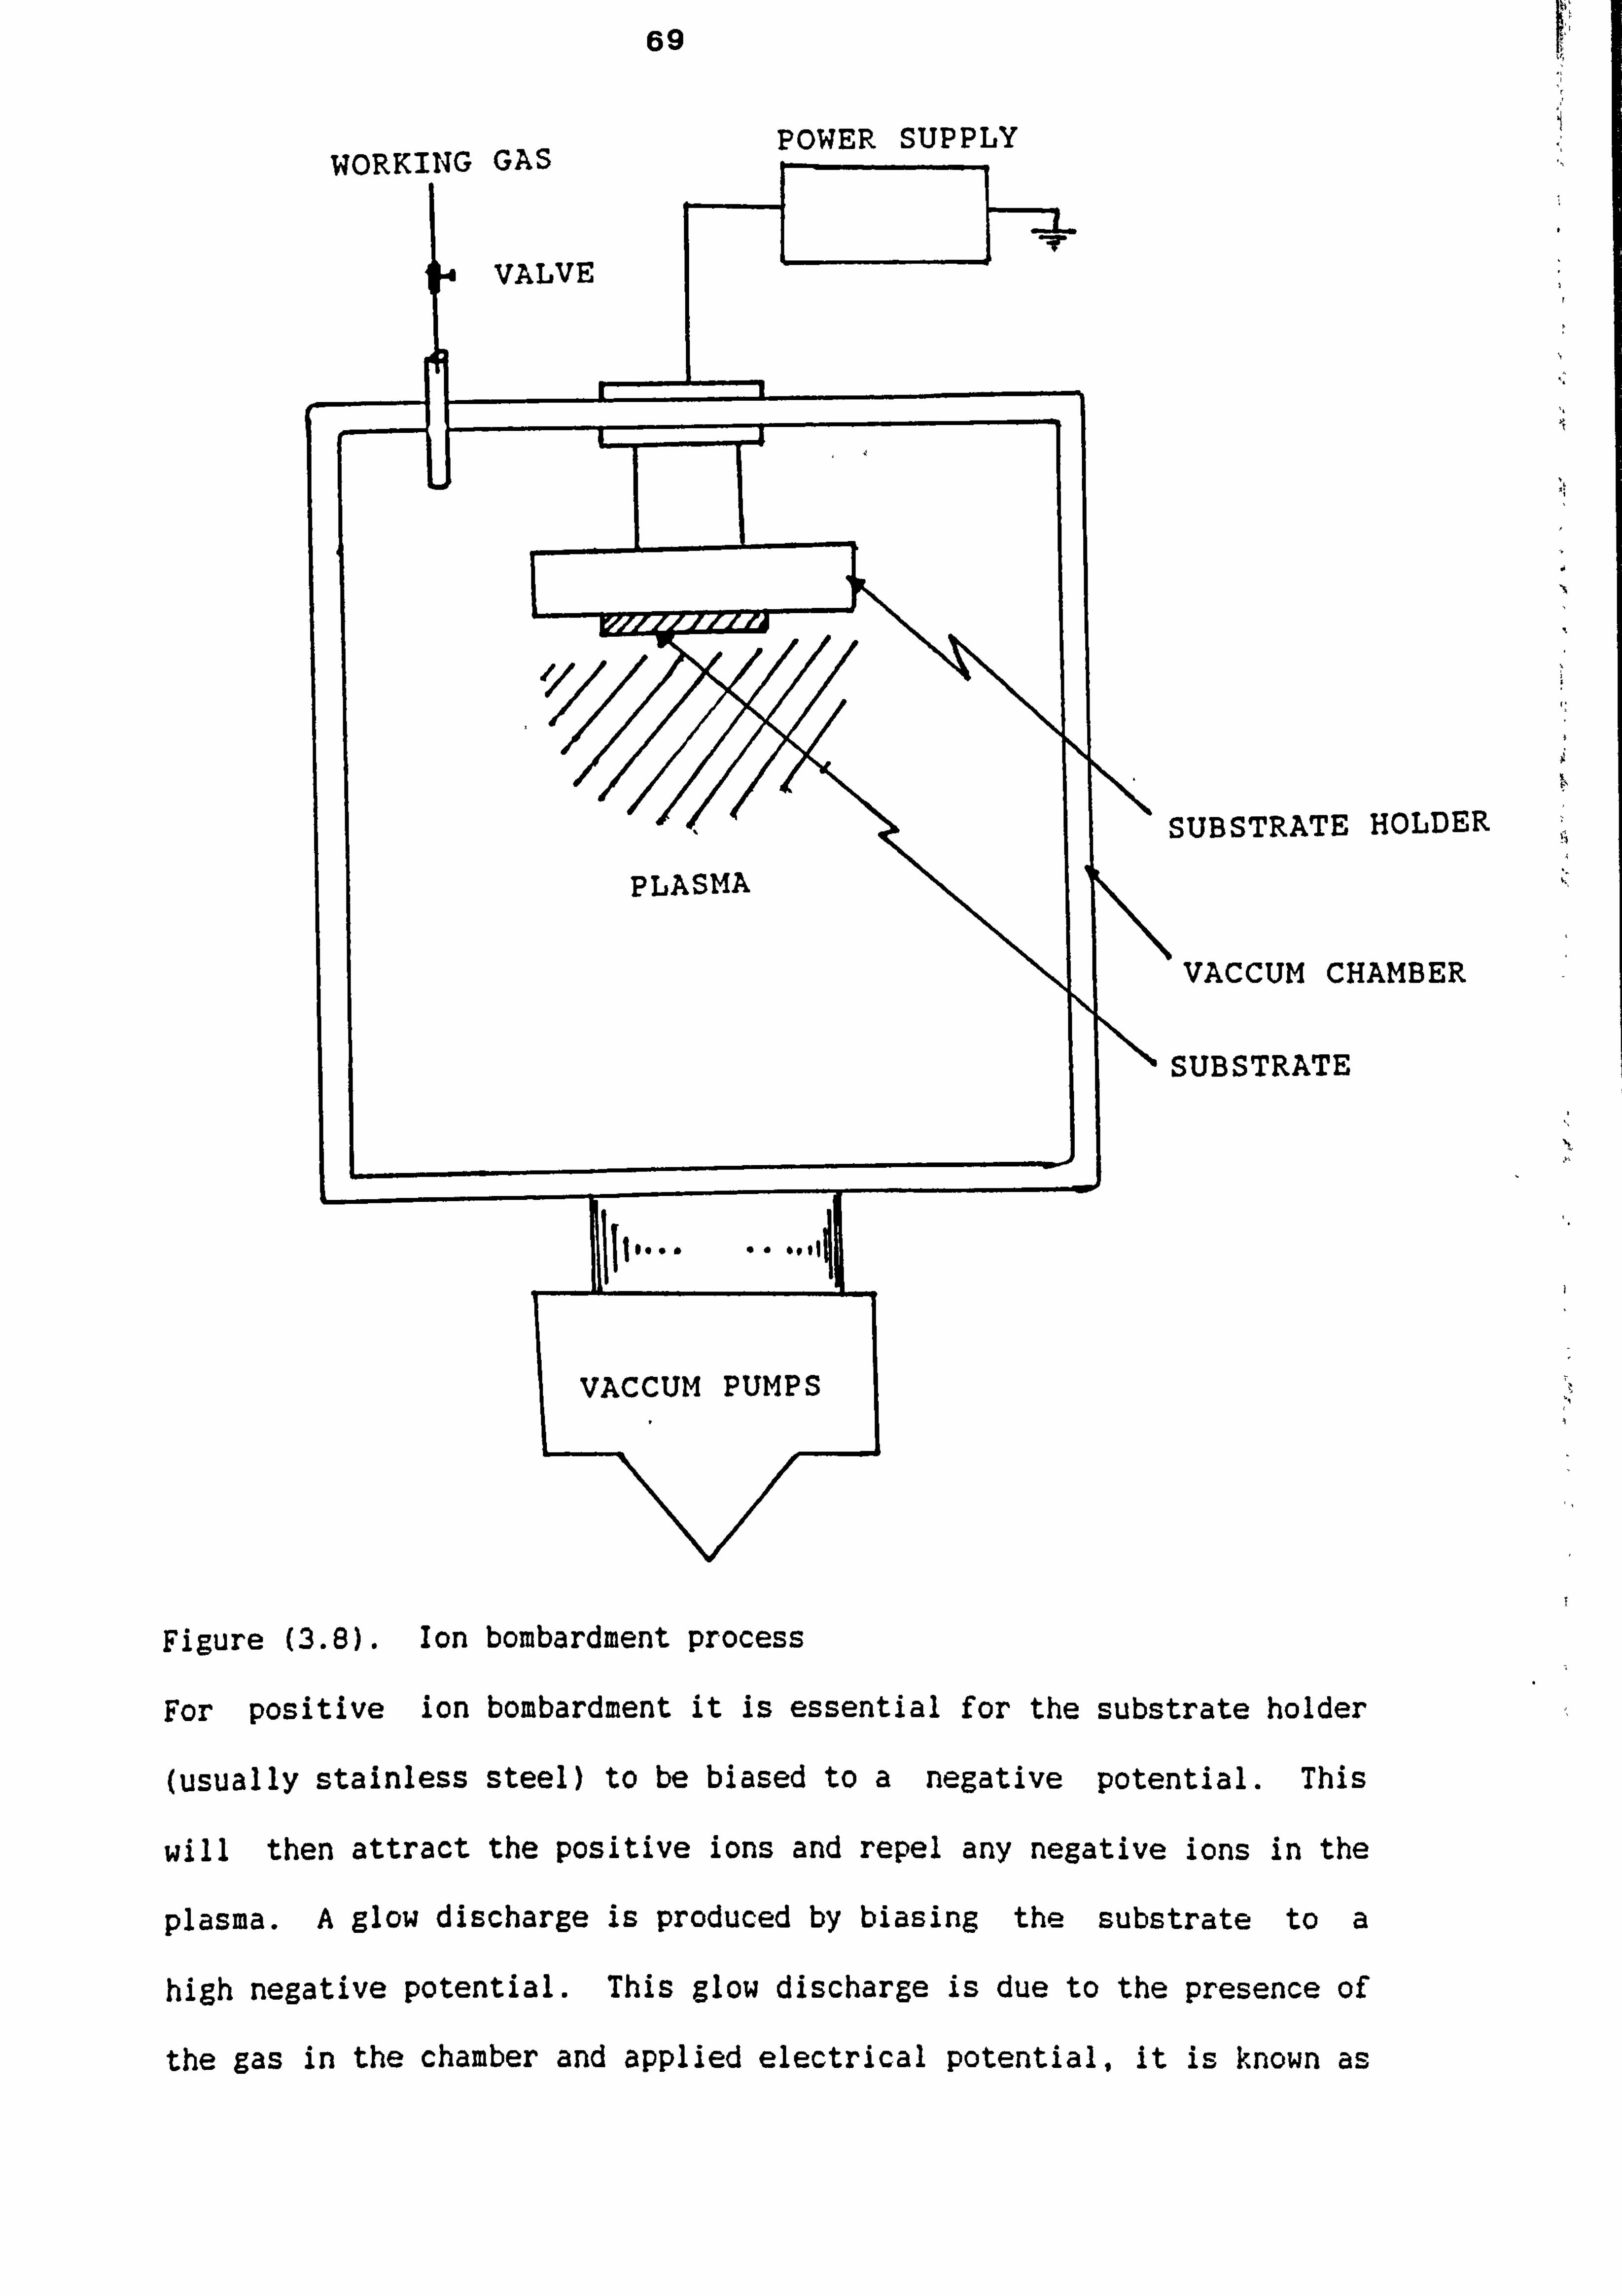
69
SUBSTRATE HOLDER
VACCUM CHAMBER
SUBSTRATE
Figure (3.8). Ion bombardment process
For positive ion bombardment it is essential for the substrate holder
(usually stainless steel) to be biased to a negative potential. This
will then attract the positive ions and repel any negative ions in the
plasma. A glow discharge is produced by biasing the substrate to a
high negative potential. This glow discharge is due to the presence of
the gas in the chamber and applied electrical potential, it is known as
T
r. 1kc POWER SUPPLY
70
a gas discharge, and is explained as follows.
3.5.1 Gas discharge
It has been known for a long time that if a D. C. voltage is applied
between two electrodes in a vacuum chamber containing a gas at a
pressure greater than about 0.1 Pa,, then, a discharge can be initiated
between the electrodes. The primary source of ionization of the
discharge gas is the electron-atom collision, where collision between
electrons and gas atoms results in the ionization of gas atoms and the
emission of more electrons.
+ G- --> G* 2e-
where GO is a ground state gas atom and G is a singly charged gas ion.
At low voltage, only a few ionized particles will exist which can
contribute to the current. As the voltage increases, the charged
particles gain sufficient energy to produce additional charged
particles by impact ionization. This can lead to a linear growth of
discharge current. As the voltage increases further, an avalanche
process takes place due to the ion bombardment of the cathode and the
release of secondary electrons. The secondary electrons are then
accelerated in the field of the cathode and due to collisions with the
residual gas atoms and molecules, produce new ions. The ions are again
accelerated back to the cathode and produce new secondary electrons.
This process continues until a self-su. staining discharge is achieved.
In this case, the gas starts to glow, the voltage falls and the current
rises abruptlY.

REFERENCES
1) EL-KAREH, A. B., EL-KAREH, J. C. J. "Electron Beams, Lenses and Optics", London: Academic, 1970.
2) SCHILLER, S., HEISIG, V., PANZER, S. Electron Beam Technology, New York: John Wiley & Sons, 1982.
3) WATSON, P. K. "The Transport of Electrons in Polystyrene", Electrical Insulation and Dielectric Phenomena, New York, 45th Meeting, 1976, P. 10.
4) WATSON, P. K. "The Transport of Low Energy Electrons in Polystyrene", 52nd Conf. on Elect. Ins. and Dielectric Phenomena, 1983, p. 421.

PART 2
EXPERIMENTAL WORKS AND OBSERVATIONS

CHAPTER 4
THIN FILM ELECTRODES
71
4.1 Introduction
The complete range of measurements reported in this thesis was obtained
using several types of electrodes, the development which is also a part
of the investigation (M Jaberansari, 1985 [11). The details of these
and the appropriate techniques for making the electrodes constructed
for this work are discussed in detail under the following sub-sections
1- Wire electrodes and problems associated with wire electrodes, 2-
Preparation of electrodes by evaporation technique, 3- Preparation of
electrodes by vacuum sputtering technique.
4.2 Wire electrodes and problems associated with wire electrodes
So far many experiments have been performed on biological systems by
using wire electrodes. Different metal wires of different diameters
(mm) have been tried. Experiments on pearl chain formation and
cellular rotation have generally used either platinum or gold wire
electrodes which could easily be made into spherical head shaped
electrodes, thus generating a more controlled non-uniform electric
field, but wires made of silver were equally successful, and cheaper
than gold or platinum. Sometimes it was necessary to inject a very
high electric field into the chamber by means of a sharp pointed
electrode. Tungsten wires have a fibrous structure, therefore, to
achieve a sharp point configuration, it was necessary to use an etching
process which is discussed by Jaberansari [1].
In this experiment the wire types of electrodes described above were
found not to be ideal for observing the cullular behaviour under a
phase contrast microscope. In general, two drawbacks were encountered
in experiments using wire electrodes:
72
1) Due to electrode thickness the chamber needed to be of a certain
depth and that increases the magnification and focussing problem of the
cells near the electrodes under the light microscope. This problem was
greatly reduced by redesigning the electrode chamber so that the
electrodes are located as near to the upper surface of the chamber as
possible.
2) The individual cells could only be observed for a short period of
time, because the cells settled in the chamber under gravity. To
overcome this problem a density gradient layer was prepared to support
the yeast cells whilst observing them under the microscope. The
density gradient layer was obtained by mixing 0.1 M lactose (0.18 gram
Lactose in 5 ml of distilled water) and 0.5 M xylose (0.375 gram xylose
in 5 ml of distilled water).
All these problems were overcome by altering the electrode design and
making the electrodes in a different way. To reduce the depth of the
chamber the diameter of the electrodes was reduced. This problem was
initially solved by painting the pattern of the electrodes in either
silver or platinum liquid (Johnson Matthey Ltd. ) over a microslide by
means of a very fine brush. Once the picture of the electrode was
drawn, i. e. that is either 3 electrode configuration electrode (each
electrode 1201* apart or 2 electrodes system (two parallel electrodes).
The glass slide was carefully placed in an oven and then heated to
400'OC. until the adherent metal film was formed. This method has an
advantage over the other in producing. a very thin strongly adherent
metallic coating; the depth of the chamber can be very small and hence
the magnification can be increased. However, due to errors in drawing
the electrodes diagram by hand on a glass slide, it was decided to
73
prepare a mask and then evaporate the metal through the mask in a high
vacuum system. This process was an ideal way for making the electrodes
as far as this experiment was concerned, because both the thickness of
the electrodes (near to 0.1 um) as well as the shape of the electrodes
could be controlled to a high degree of precision and also the metal
could be evaporated uniformly over the mask.
4.3 Preparation of electrodes by thin film vacuum
4.3.1 Preparation of mask.
This is the most difficult part of the electrode preparation and
requires patience and time to perfect the technique.
The procedure is given below: -
1) Cut a microscope glass slide size piece of a beryllium copper (BeCu)
metal foil with a thickness of I mm. (Note: beryllium is highly
toxic)
2) Clean BeCu in the detergent "decon 90" for approximately one minute
in an ultrasonic cleaner and then rinse in water
3) Clean the BeCu in chromic acid for 1 to 3 seconds then rinse again
in water
4) Electrolytically etch the BeCu in hydrochloric acid with a carbon
rod as cathode and the BeCu as the anode and then rinse.
5) Spin coat the prepared BeCu mask with Kodak resist 747 at
approximately 2000 r. p. m. for 60 seconds

74
6) Dry the mask by blowing hot air over it using a hand-held hot air
dryer
7a) Expose the mask on Kodak resist under U. V. illumination for 8
second exposure
7b) After exposure, mount the mask in a vertical position and spray
with "KTRF developer" for I minute at room temperature immediately
follow this by a spray with "KTRF rinse" for 30 seconds. The mask
is then allowed to dry in a vertical position in a stream of clean
air for 10 minutes followed by heating in the oven at 80-C for 5
minutes. At this stage the image is checked with the aid of a low
power microscope.
8) The mask frames and the rear surfaces of the BeCu were again coated
with cellulose lacquer, except for one corner of each frame so that
an electrical connection could be'made in a plating bath. Since
the masks had been well cleaned before being coated with
photoresist, it was only necessary to give them a short cleaning
before being plated.
9) For nickel plating, an Ni anode is used and the BeCu forms the
cathode. The current density adjusted to 30 mA cm-2 , the plating
bath consists of nickel chloride and is used at a temperature of
WIC., the time of electroplating is 20 minutes.
10) After plating, the masks were rinsed in water and then immersed in
acetone to remove the cellulose lacquer from the rear surface. The
photo-resist is then removed by soaking in "penstrip Y-1547 " for a
75
few minutes. The rear surface is again painted with cellulose
lacquer and allowed to dry. The mask was then immersed in a
vertical position in CR-20 etchant. When the etch is completed,
the masks were thoroughly washed in running water. Finally the
lacquer was again removed from the rear surface in acetone. Figure
(2.7) shows the typical masks used for the electrodes described in
this chapter.
Once the mask had been prepared, metal could be evaporated or sputtered
through the mask in a vacuum chamber which was available for use in the
Laboratory.
4.3.2 Pre-cleaning of the glass slide
Since the metal needed to be either evaporated or sputtered onto the
microscope slide inside a vacuum chamber, the microscope slide needed
to be cleaned in a special way. This ensured greater adhesion of the
metal electrode to the glass microscope slide and in turn increases the
electrode life.
First the glass slide was immersed in a detergent (decon 90) solution
in an ultrasonic bath. The ultrasonic bath was switched on for 8
minutes, then, the glass slides were removed using a pair of clean
forceps. The distilled water was sprayed over the glass slide which
was then placed vertically in a clean room cabinet and left to dry.
4.3.3 Evaporation process
Any substrate such as a microscope glass slide may be covered by a thin
film metal (in any desirable pattern by using a mask) by an evaporation
process. In the evaporation process vapour is produced from the
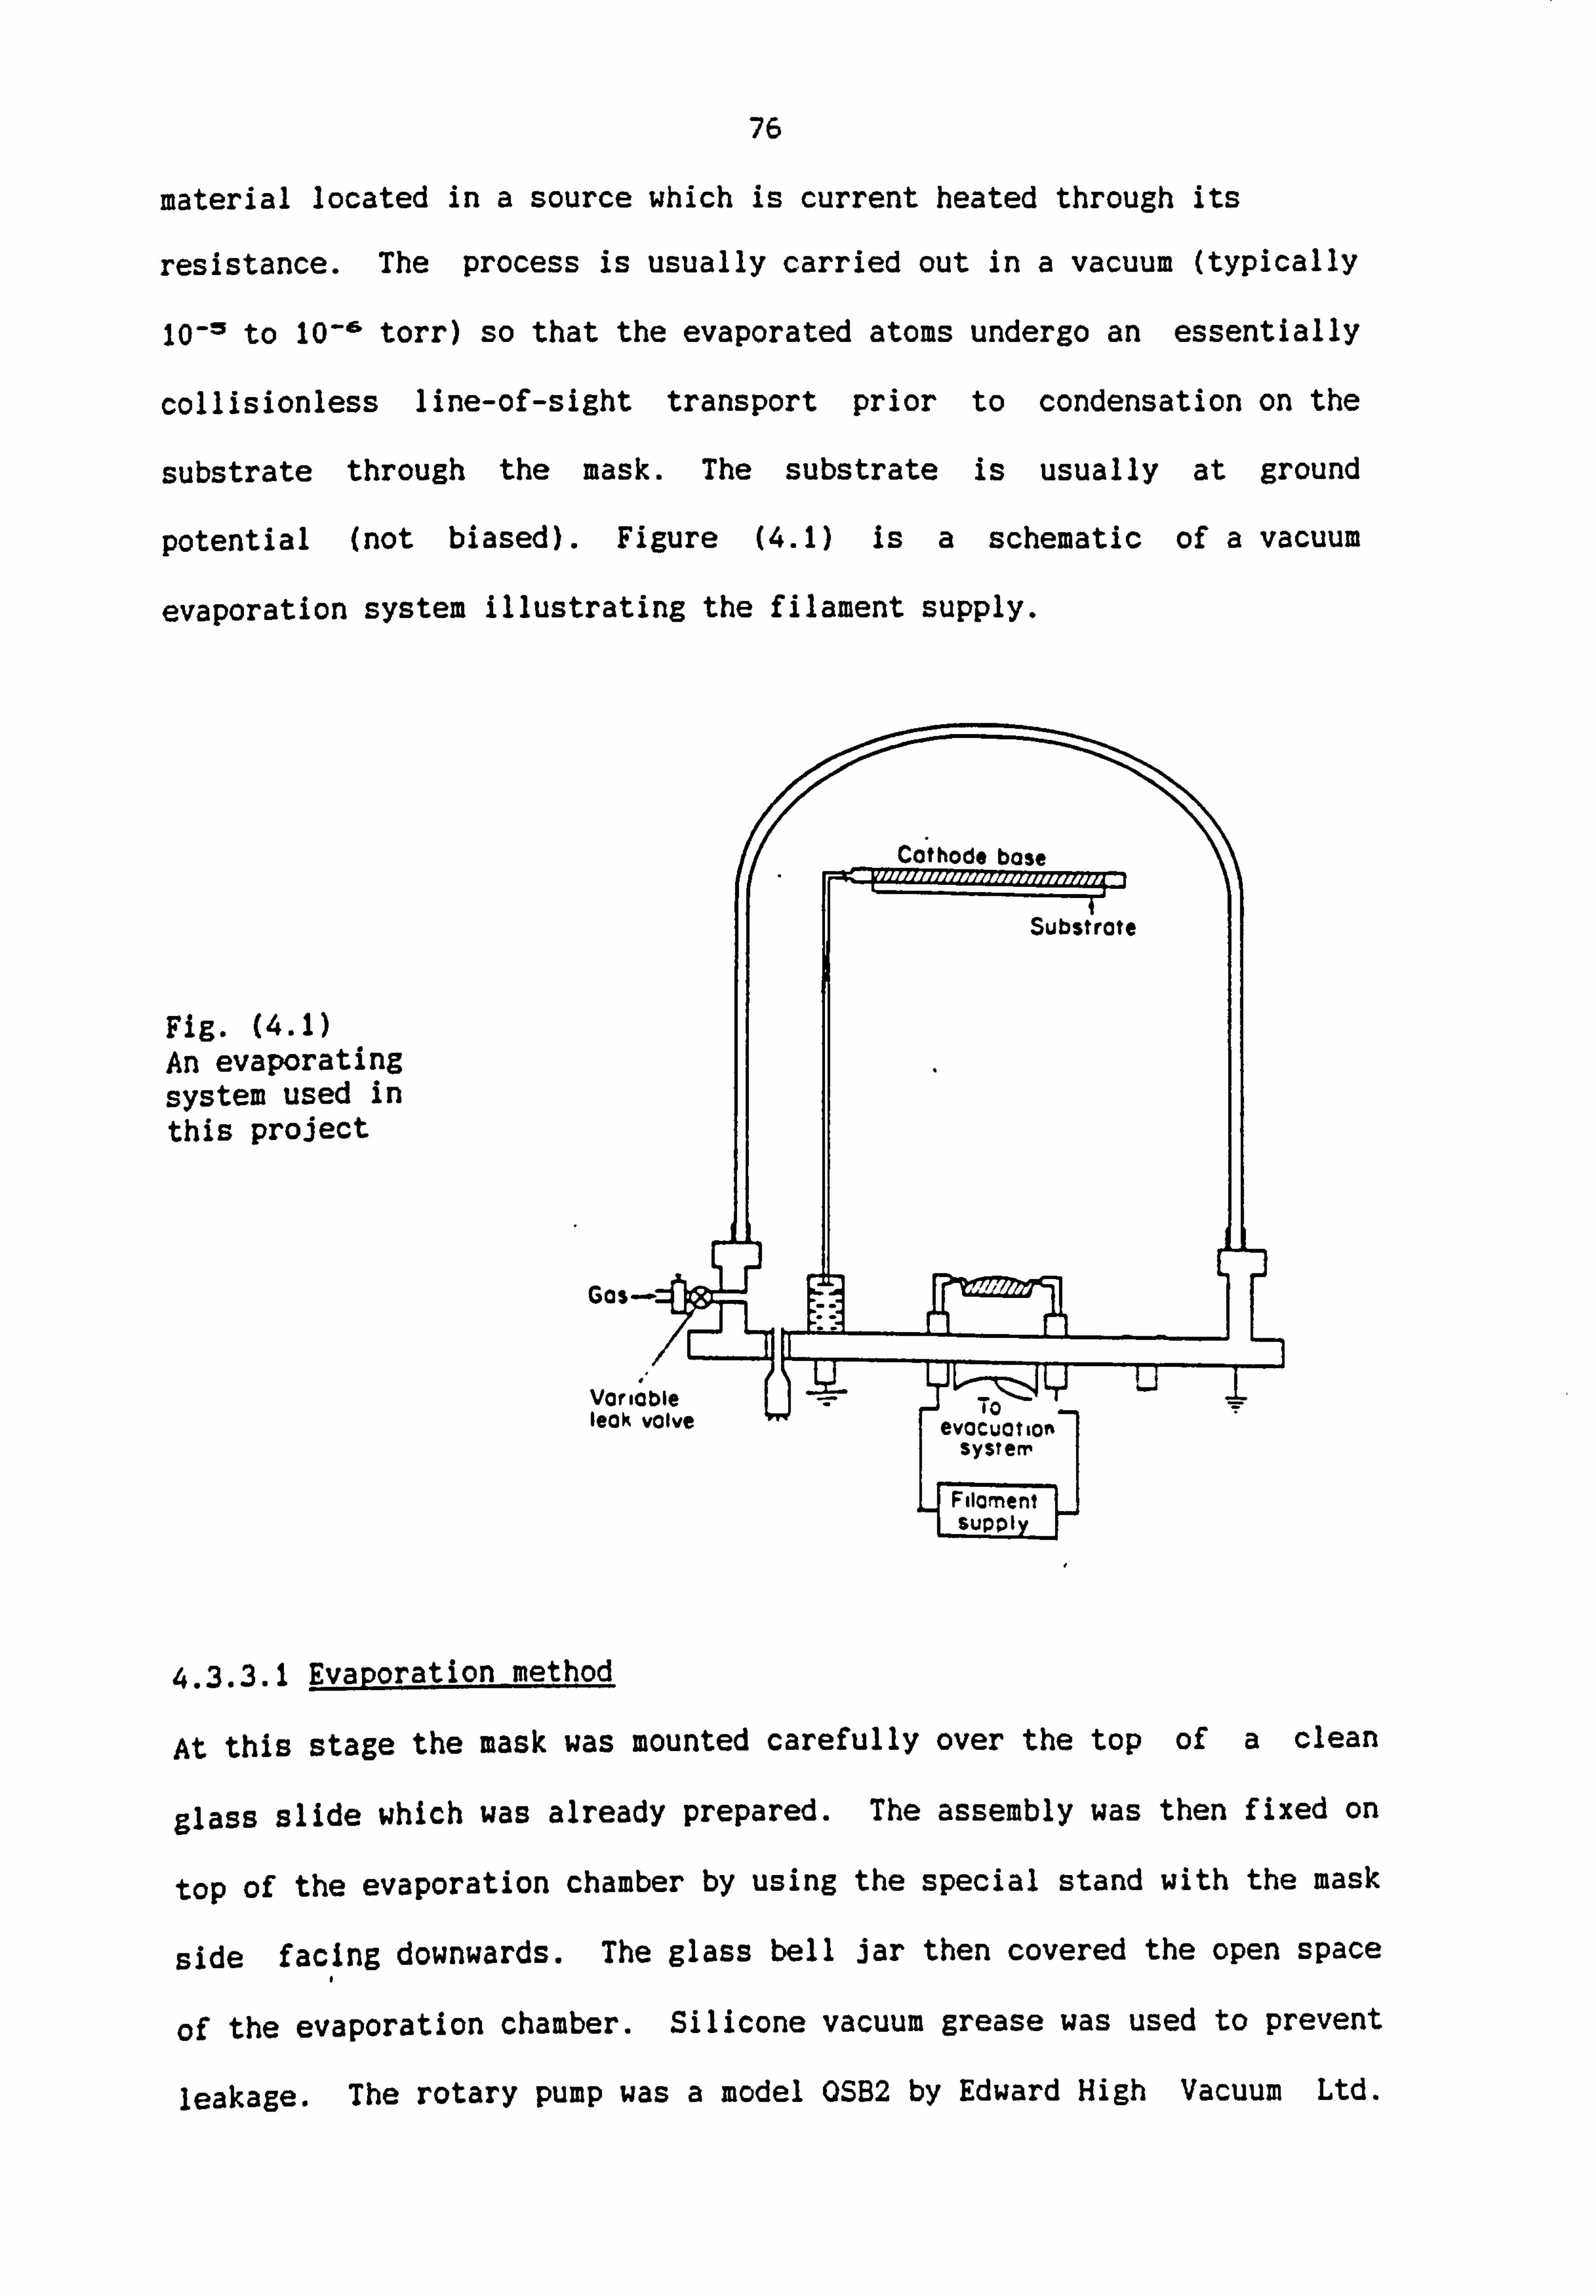
76
material located in a source which is current heated through its
resistance. The process is usually carried out in a vacuum (typically
10-5 to 10-0 torr) so that the evaporated atoms undergo an essentially
collisionless line-of-sight transport prior to condensation on the
substrate through the mask. The substrate is usually at ground
potential (not biased). Figure (4.1) is a schematic of a vacuum
evaporation system illustrating the filament supply.
Fig. (4.1) An evaporating system used in this project
4.3.3.1 Evaporation method
At this stage the mask was mounted carefully over the top of a clean
glass slide which was already prepared. The assembly was then fixed on
top of the evaporation chamber by using the special stand with the mask
side facing downwards. The glass bell jar then covered the open space
of the evaporation chamber. Silicone vacuum grease was used to prevent
leakage. The rotary pump was a model OSB2 by Edward High Vacuum Ltd.
77
and, it -was--then -switched on (in conjunction with a diffusion pump,
model ED75 by Speedivac Ltd. ) already connected into the system), and
it was left on for some hours and the vacuum was checked by a guage
(model 2A, Pirani-Penning Ltd. ) meter until a good vacuum of 10-5 torr
(Itorr-Imm of Hg) was achieved. The metal to be used (gold, platinum,
silver or aluminium) for the evaporated electrodes was placed in the
boat at the beginning of the procedure, and when the vacuum was
satisfactory it was evaporated by increasing the current through the
boat or coil from a 0-30 A power supply. After the evaporation of
the metal over the microscope slide the pump is isolated with a flap
valve and air is let into the chamber. The glass slide with the
electrodes was then ready for the experimentation. The following
photographs show some samples of the electrodes prepared by this
technique.
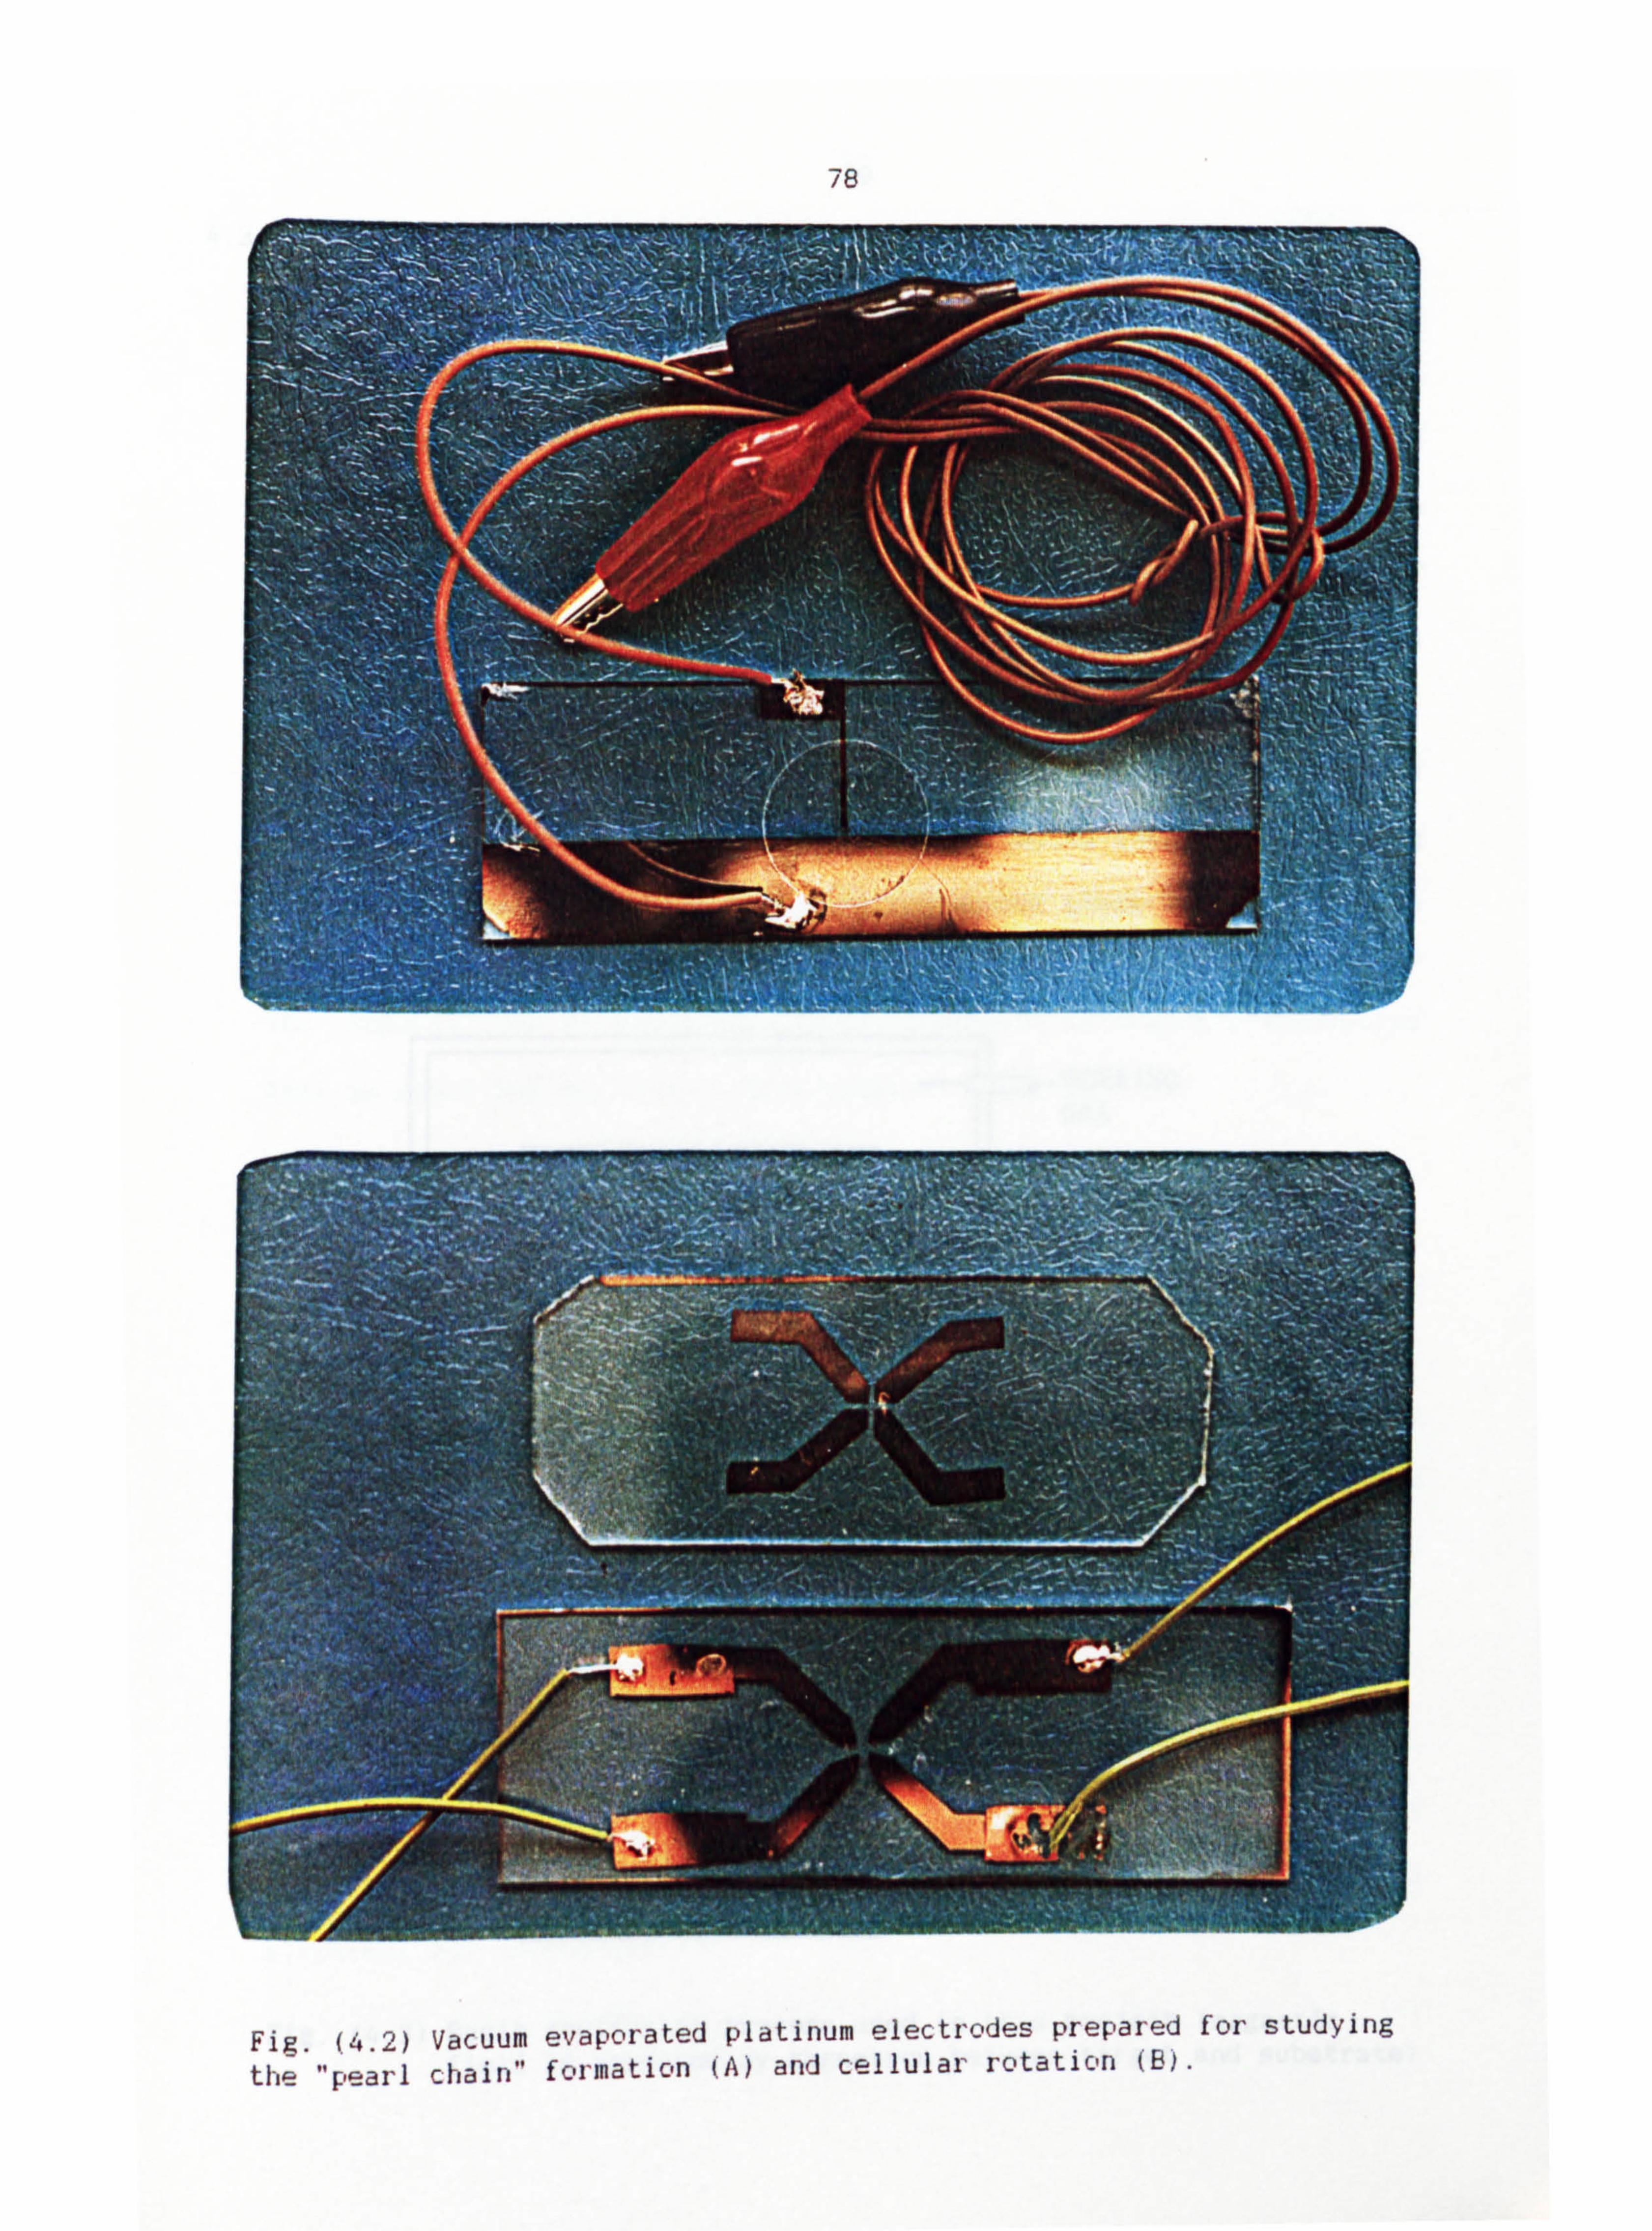
78
Fig. (4.2) Vacuum evaporated platinum electrodes prepared for studying
the "pearl chain" formation (A) and cellular rotation (B).
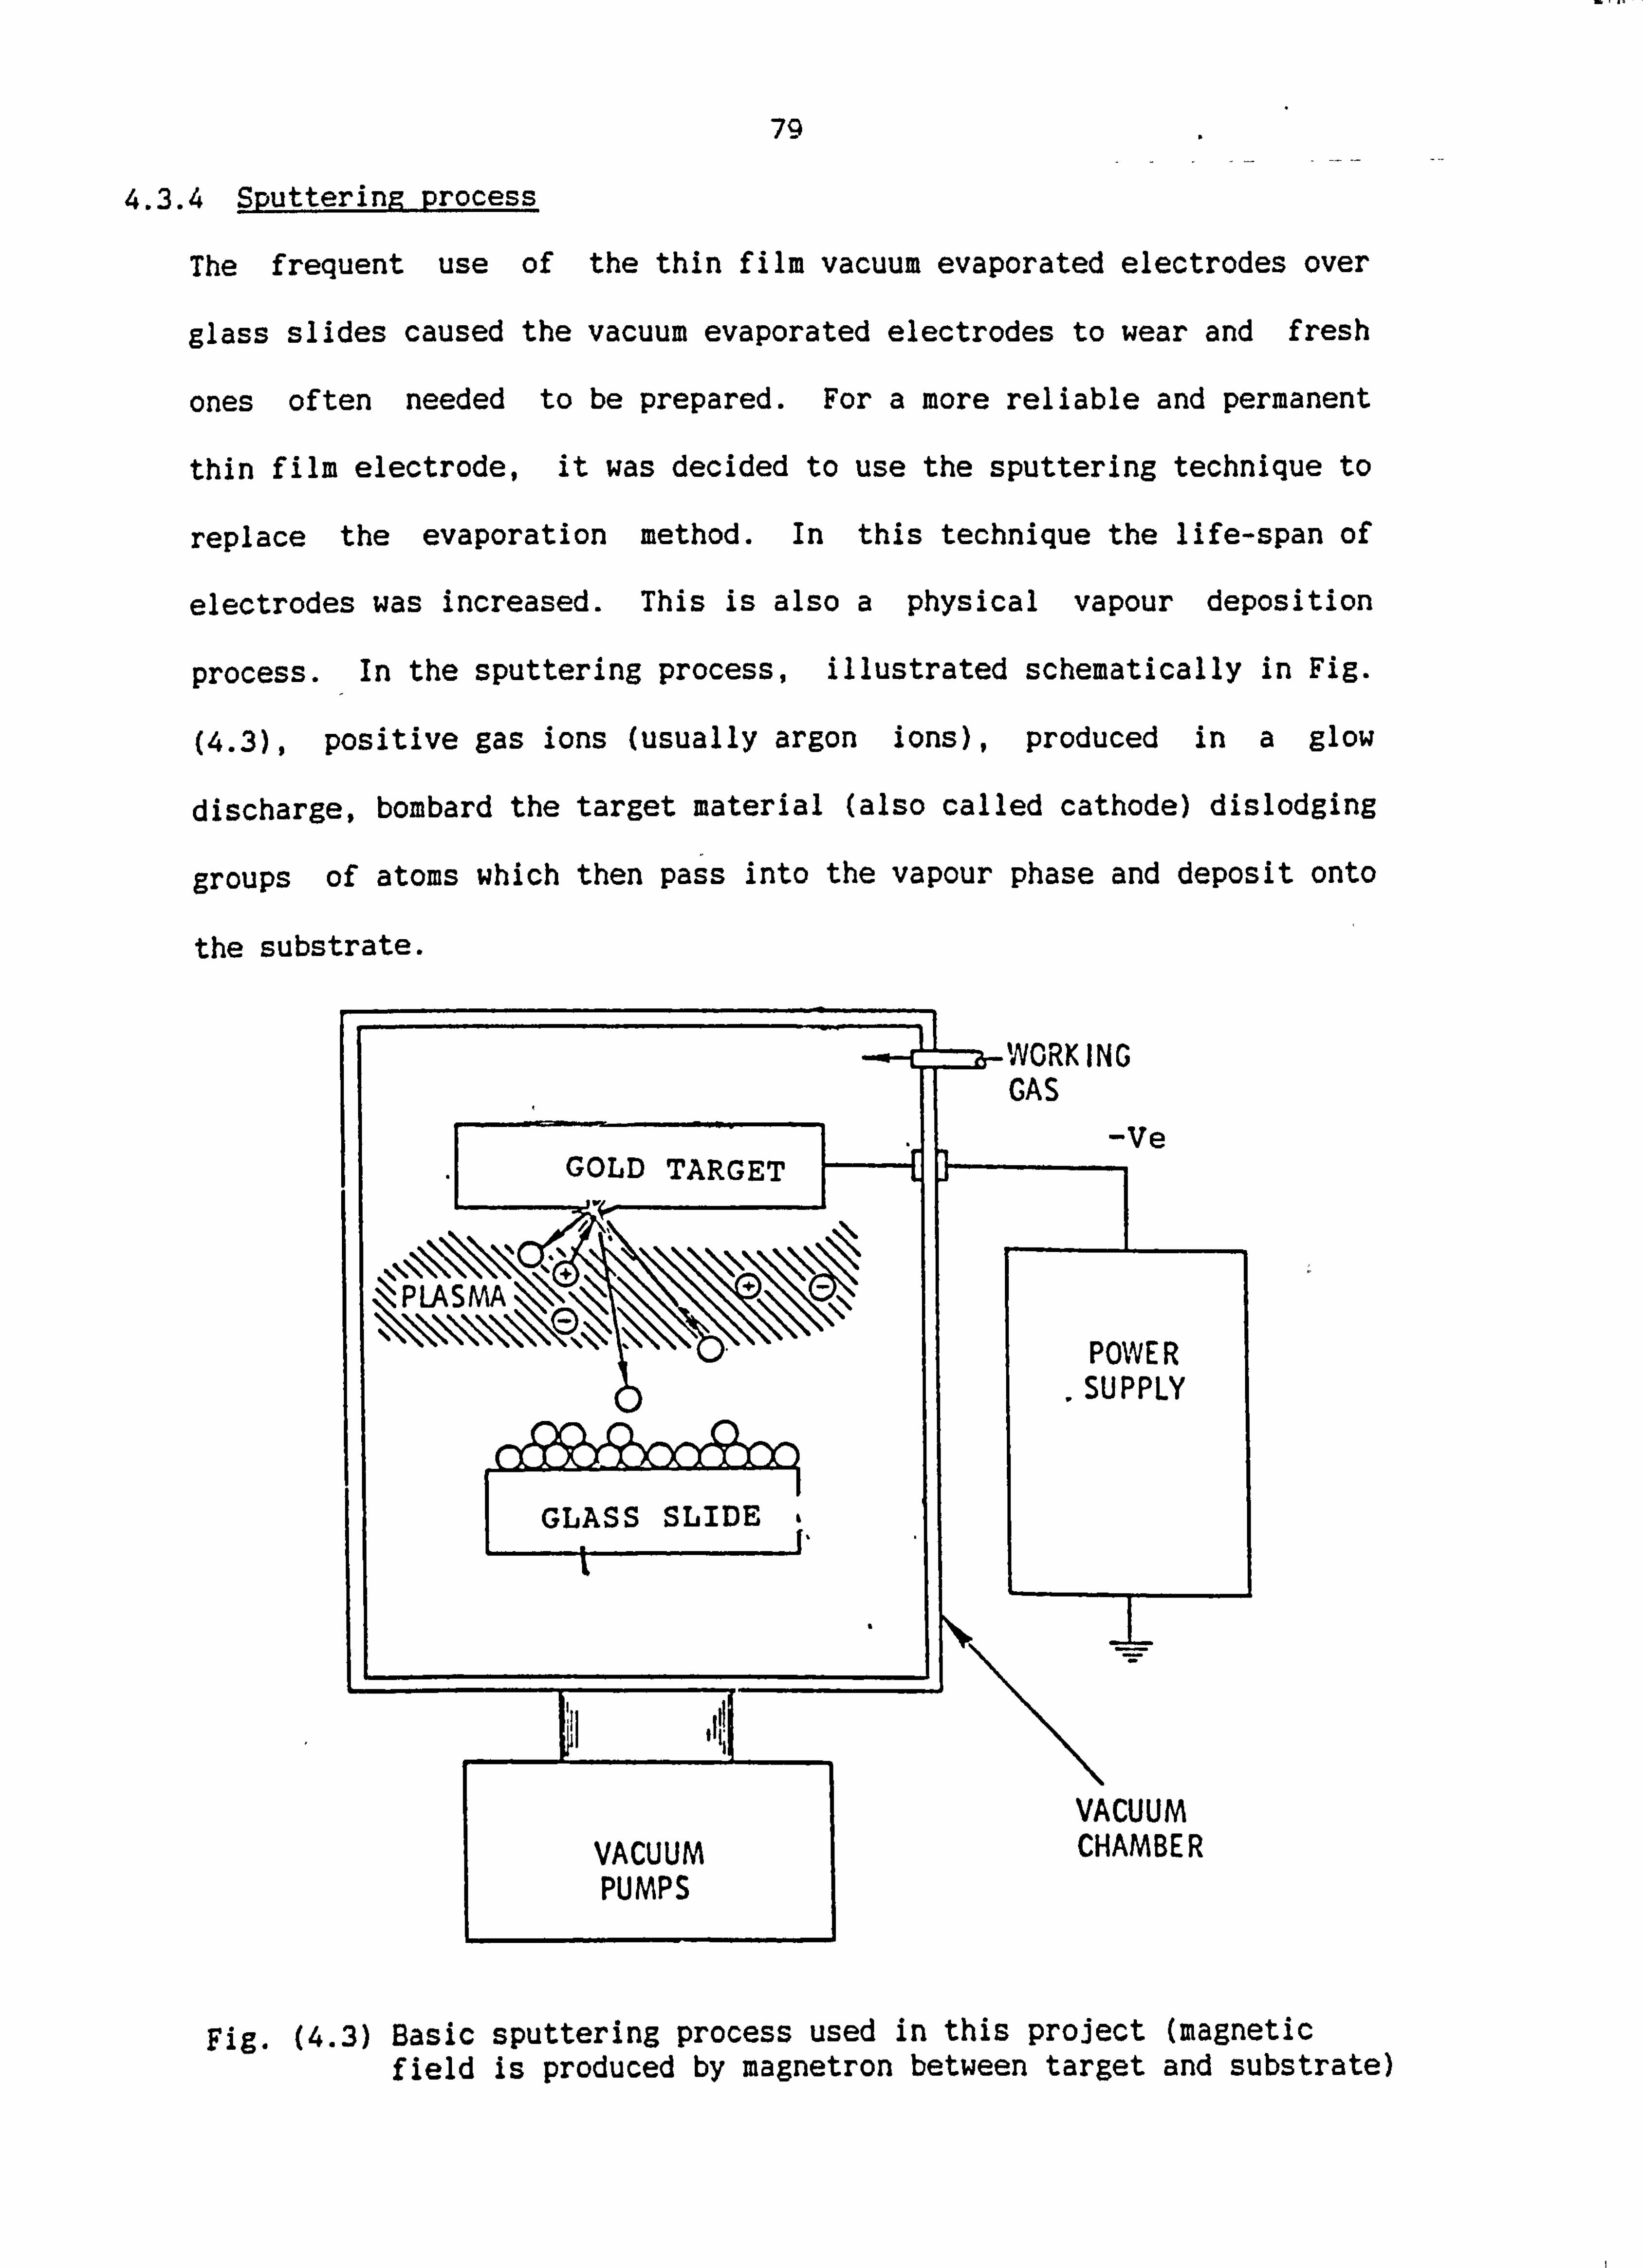
79
4.3.4 Sputtering process
The frequent use of the thin film vacuum evaporated electrodes over
glass slides caused the vacuum evaporated electrodes to wear and fresh
ones often needed to be prepared. For a more reliable and permanent
thin film electrode, it was decided to use the sputtering technique to
replace the evaporation method. In this technique the life-span of
electrodes was increased. This is also a physical vapour deposition
process. _In
the sputtering process, illustrated schematically in Fig.
(4.3), positive gas ions (usually argon ions), produced in a glow
discharge, bombard the target material (also called cathode) dislodging
groups of atoms which then pass into the vapour phase and deposit onto
the substrate.
GOLD TARGET
, ýPLASM
GLASS SLIDE
INORK ING GAS
-Ve
POWE R SUPPLY
VACUUM VACUUM CHAMBER PUMPS
I
Fig. (4.3) Basic sputtering process used in this project (magnetic field is produced by magnetron between target and substrate)
80
4.3.4.1 Sputtering method
This method used the same rig as the evaporation rig with a few minor
changes. One of the electrodes, which is the source of coating
material and is called the 'target', was attached to a high negative
potential power supply (from 10-5000 V. ). The other electrode which
has been referred to as the substrate holder, was situated opposite the
target. After evacuating the vacuum chamber to a suitable pressure (1
x 10-s torr) it was back-filled with an argon gas to a pressure of 0.1-
10 Pa. A magnetic field was produced by magnetron between target and
substrate (R. F. ). The negative potential between the target and the
substrate will ionize the gas. These energetic ions will bombard the
target (in this experiment, a gold 'target'), knock out the gold ions
and deposit them on the glass slide (substrate) through a pre-prepared
mask as described earlier in this chapter.
4.3.4.2 Advantages
Since the gold ions (low energy) are more energetic they will bombard
and adhere to the surface of the substrate (microscope glass slide),
whereas, in the evaporation process all the deposited atoms were
neutralised (only thermal energy). The sputtering process increased
the life-span of the electrodes. It is important to note that in a
sputtering process we create an energetic ion which "shallow bombards"
the substrate.
It is possible to get atoms as well as ions but, the majority of
particles are ions some of which may undergo further collisions with
electrons and form atoms.
UN
81
4.4 Electrode effect
Previous work done by other researchers on this subject always reported
the use of either platinum or gold electrodes. But they never
mentioned the reason for the use of such materials. In the present
work electrodes of aluminium, gold, nickel, platinum, silver and
tungsten were examined in conjunction with the cellular rotation
experiments.
At very low conductivities, the bright
silver electrodes gave best results, in
conductivities of the suspension media,
superior. Often it was found that,
reproduce results with this electrode.
satisfactory at all due to the an
changed in colour from silver to grey.
platinum and then gold and
that order; at medium and high
the platinum electrodes were
it was just not possible to
Aluminium electrodes were not
odisation of the aluminium which
Electrodes of nickel generated bubbles of gas in the field of view
inside the test cell suspension and hence made it impossible to see any
of the cells with the microscope. This could be due to electrode
polarization which affected the electrode presented very much at low
frequencies.
4.5 Electrode-cleaning
Before beginning an experiment with a given electrode system, the
electrodes should be as smooth as possible and they must certainly be
very clean. After each experiment there is the problem of removing the
collected cells from the electrodes. Merely turning off the applied
field will not dislodge all of them from the electrodes. The best and
simplest method is to rinse the slide with a high pressure jet of

82
deionized water from a hard plastic squeeze bottle. This usually
removes all of the old cells. The electrodes can be dried in a current
of air so as to avoid errors in the sample concentration. It should be
remembered that any attempt to clean the electrodes with any form of
paper tissue would remove or scratch the thin film vacuum evaporated
electrodes and result in an open-circuit.

REFERENCES
1) JABERANSARI, M. "Dielectrophoretic, Electrodynamic and Magnetic Resonance Phenomena In Yeast Cells, M. Sc. Thesis. Salford University, 1985.

CHAPTER 5
ELECTRONIC CIRCUIT DESIGN AND APPLICATIONS

83
a
5.1 Introduction
This chapter introduces some of the circuits designed in the course of
the research. Circuits were designed to produce the electric rotating
fields, to supply a fixed regulated voltage, to measure-the charge by a
charge sensitive amplifier, to experiment on the effect of -ve ions
formed by an air ionizer and to observe the pearl chain formation from
lone ceils by using a computer controlled oscillator.
5.2 Three-phase voltage Renerator circuit
A three-phase voltage generator circuit such as the one shown in figure
, (5.1) can be used to produce a rotating electric field. This generator
uses one single-phase supply source and its three-phase output is to be
connected to a chamber having the three electrode assembly. This
circuit can be adjusted to operate at any frequency between 0.1 Hz to
80 KHz.
An external R. C. oscillator (type TG200, Levell Ltd. ) was used as the
reference phase output and as an input to the phase shifting network.
Phose I
Figure (5.1) The circuit diagram of a three-phase oscillator
84
The phase shifting circuit comprises two operational amplifiers
operating in the inverting mode, one for each phase output.
Each amplifier provides a phase change of 180 deg. between its input
and output signals. The additional phase shift required is obtained
from the series connected variable capacitor/variable resistor phase
shifting network which is adjusted to set the phase angle of the output
with respect to the reference input. The second amplifier operates on
the same principle but its input is obtained from the phase 2 output,
which is then referred to as its reference signal.
Both amplifiers have their gains set to ensure that all three-phase
outputs are of identical amplitude and this is achieved by replacing
the amplifier feedback resistor with variable resistors.
This circuit produces the three-phase outputs at equal amplitudes of 25
volts which could be amplified to provide higher voltages or power
outputs as required.
An oscilloscope was used to set the phase difference to 120- between
each adjacent phase of the three-phase system. However, for an easier
and more accurate measurement of the phase differences a summing
amplifier was designed which gave zero output when-the amplitudes and
phases were correctly adjusted, since each phase is 120- out of phase.
Alternatively, if one of the phases is inverted and their sum obtained
by the addition in summing amplifier, the magnitude of the output
signal will be twice the magnitude of the input signal.

as
5.2.1 Three-phase rotating'electric'field
Now consider three electrodes arranged 120- apart in a chamber
containing the biological cells. Each electrode is supplied from one
phase of a three-phase supply generator. For three source voltages
separated in time-phase by 120"', the phasor diagram of the source
voltage is as shown in Fig. (5.2)
Reference line
Fig. (5.2) The phasor diagram in terms of the maximum value of each phasor
*6 120" -. ,x 120*
r
120 (b)
Consider the instant at which the voltage in electrode I is at maximum.
Then its two rotatin'g'field components I and II will at that instant be
directed along the, axis OA. The voltage at electrode II is 120- behind
its maximum value and therefore, each of its component rotating fields,
3 and 4, has to travel 120- before pointing along the axis OB. Hence,
one of them will at that instant point along OA, and the other along OC
as shown, similarly the rotating fields 5 and 6, due to the voltage at
electrode III, have each'to travel 240- before pointing together along
OC, hence field 5 is' along OA, and 6 along OB. - Collecting the
clockwise fields -we see that these are 120- apart and therefore
neutralize one another at every instant, the counter-clockwise fields
all point in the same direction and they therefore combine to produce a
pure rotating field.

86
In this case, the direction of rotation is the same as the direction of
the phase-sequence, first electrode I has its maximum voltage, then II,
and then III. Thus, to reverse the direction of rotation of fields,
the phase sequence must be reversed.
Let each of the phases in Fig. (5.2) produce an alternating field of
maximum strength V along its axes, then, as with alternating voltage,
one has the fundamental equation giving the instantaneous value with
respect to time.
v=V sin A
where w= 2)rf
Take as zero time the instant that the rotating vector giving the field
vi, is directed along OA, then:
v, = V, sin wt V2 = V2
sin (w'X -120-) v: 3 = Vo sin (w It -240c)
or
v, V, sin wX
v2 -V2 (1/2 sin wr + (31,12/2 cos wICI
va -V3 (1/2 sin wT' - (31,12/2 cos wt)
Now resolve these along OA and a perpendicular axis, and denote by
and Y the total component in these two directions. Then:
X=v, + v2cos 120- + v3 cos 240-
Y= 0+ V2Sin 12012 + v3sin 240-
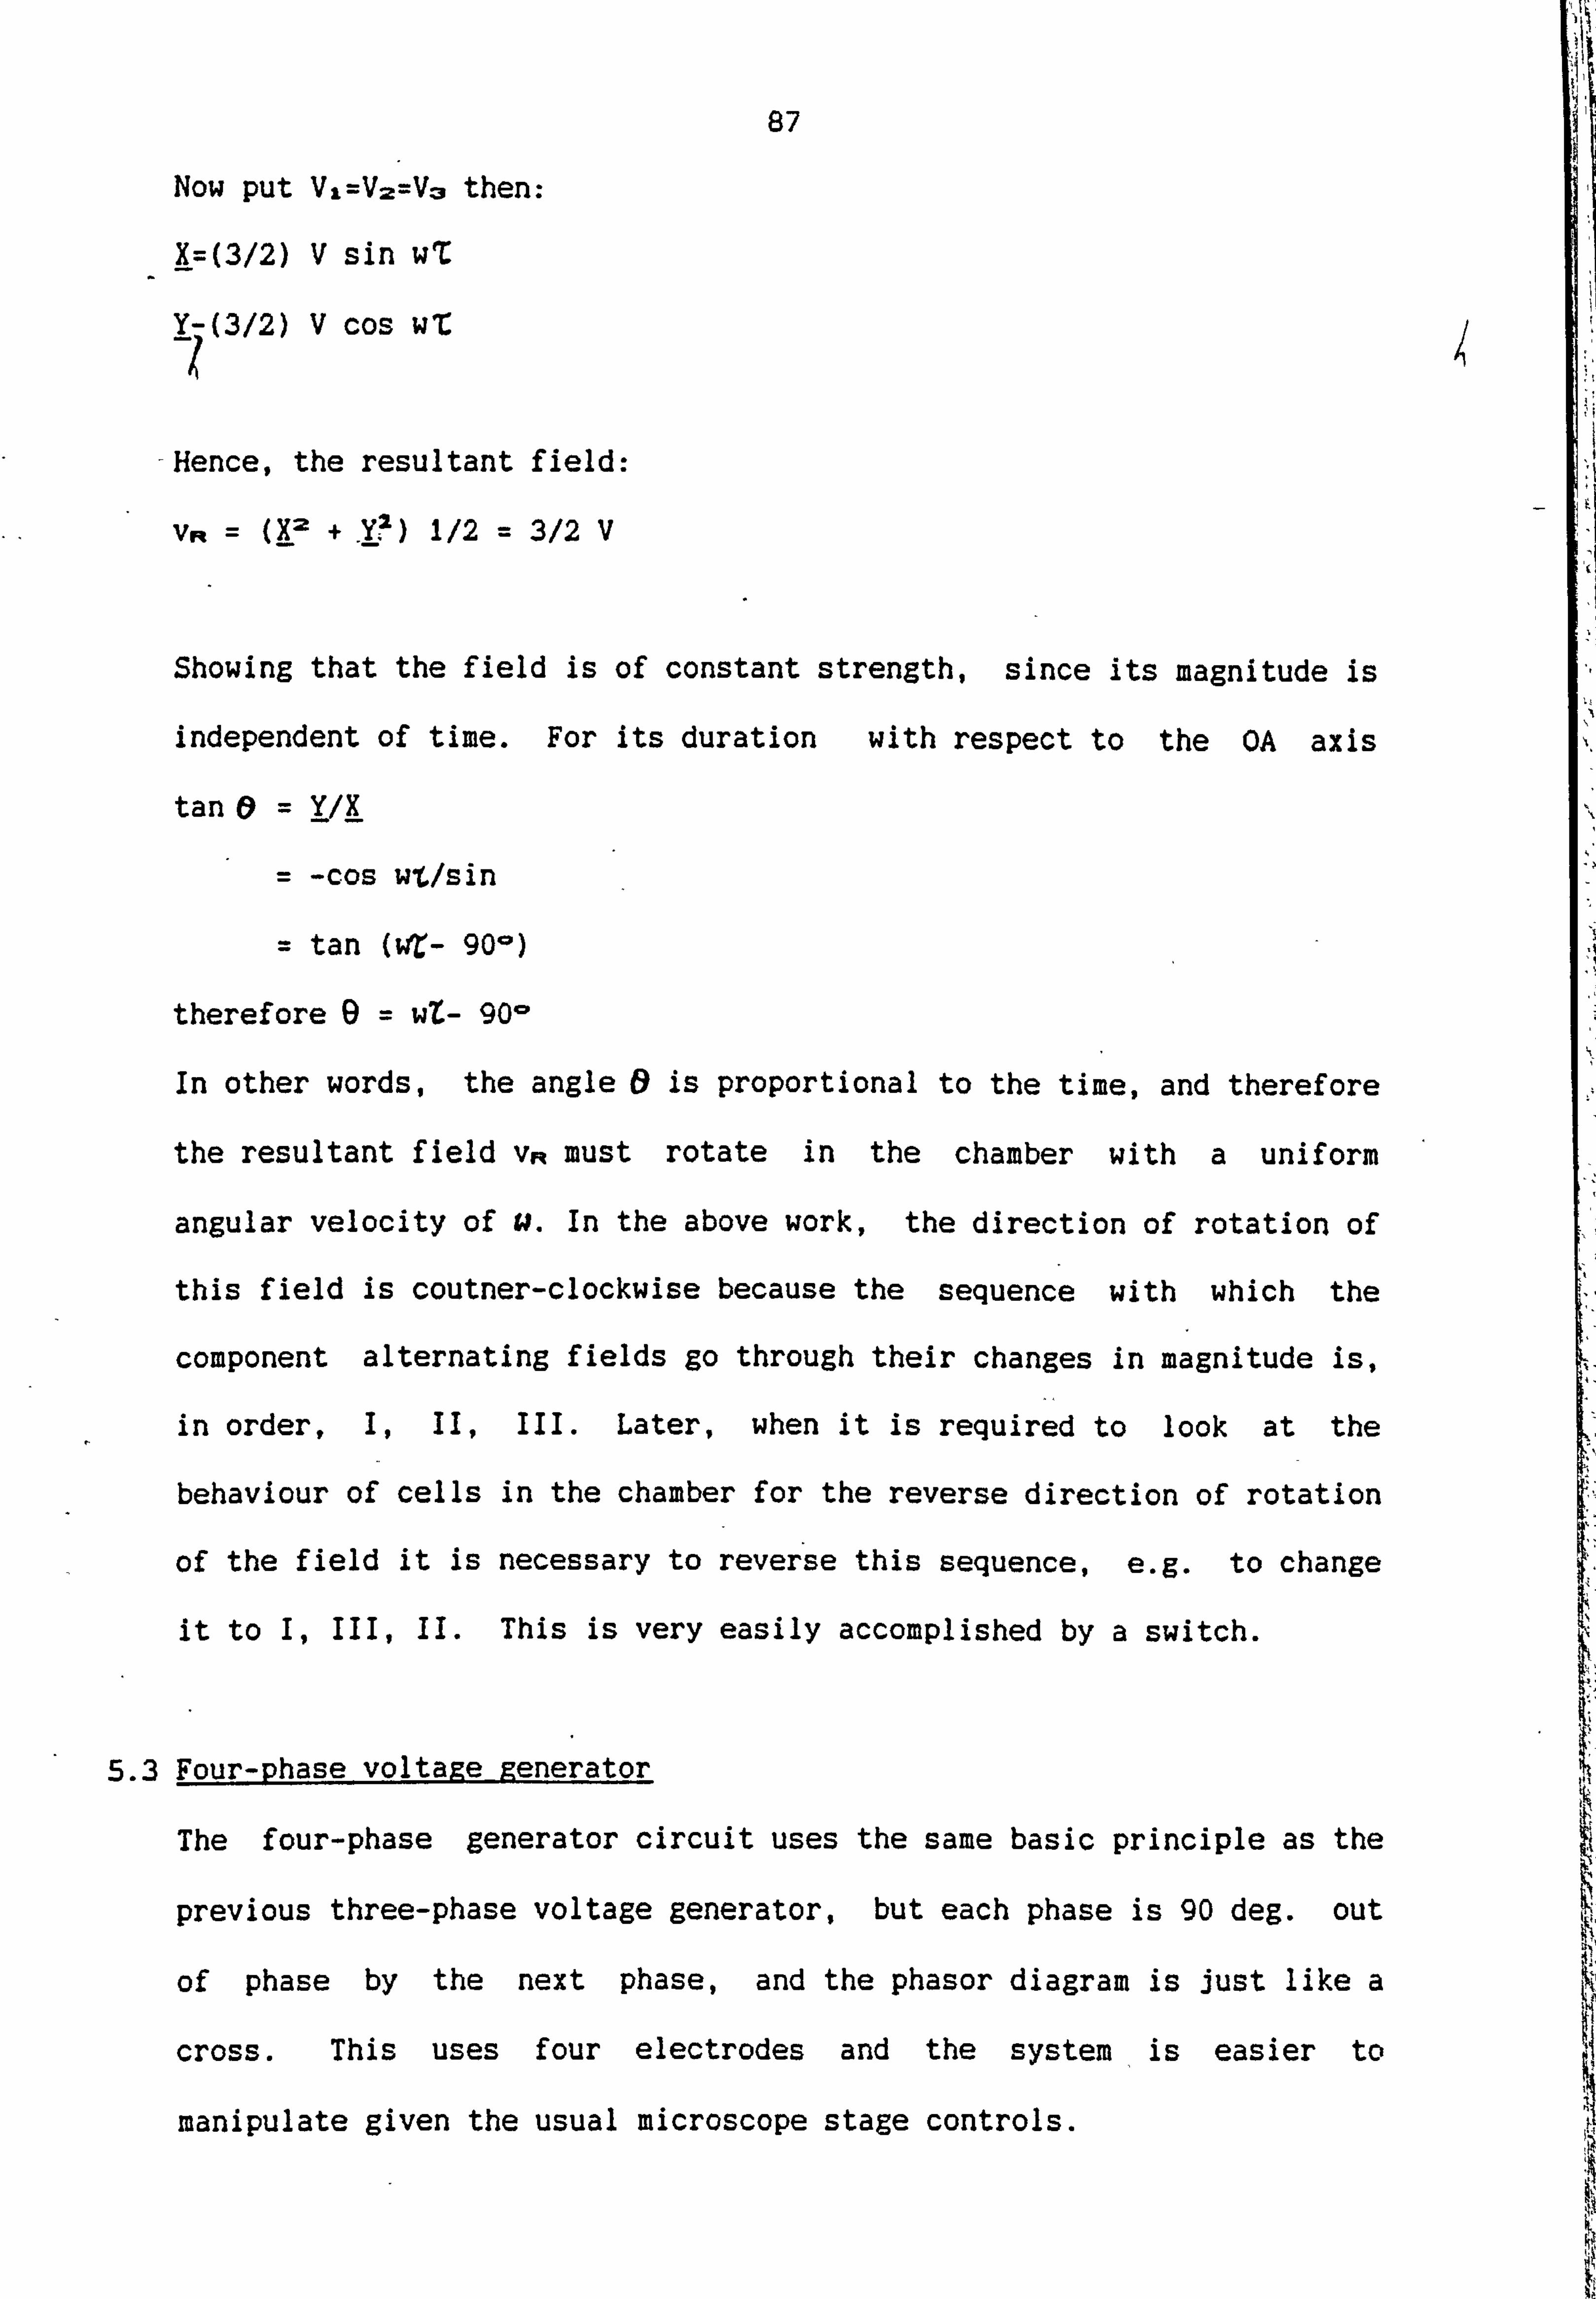
87
Now PUt VI=V2=V3 then:
! =(3/2) V sin wT
Y-(3/2) V cos wT. I
-Hence, the resultant field:
wt = Q2 +. Yý) 1/2 = 3/2 V
Showing that the field is of constant strength, since its magnitude is
independent of time. For its duration with respect to the OA axis
tan 0= IIX
= -cos wt/sin
= tan (wr- 900)
theref ore 0= wl: - 90-
In other words, the angle t9 is proportional to the time, and therefore
the resultant field vR must rotate in the chamber with a uniform
angular velocity of 14. In the above work, the direction of rotation of
this field is coutner-clockwise because the sequenc e with which the
component alternating fields go through their changes in magnitude is,
in order, I, II, III. Later, when it is required to look at the
behaviour of cells in the chamber for the reverse direction of rotation
of the field it is necessary to reverse this sequence, e. g. to change
it to I, III, II. This is very easily accomplished by a switch.
5.3 Four-phase voltage generator
The four-phase generator circuit uses the same basic principle as the
previous three-phase voltage generator, but each phase is 90 deg. out
of phase by the next phase, and the phasor diagram is just like a
cross. This uses four electrodes and the systeml is easier to
manipulate given the usual microscope stage controls.
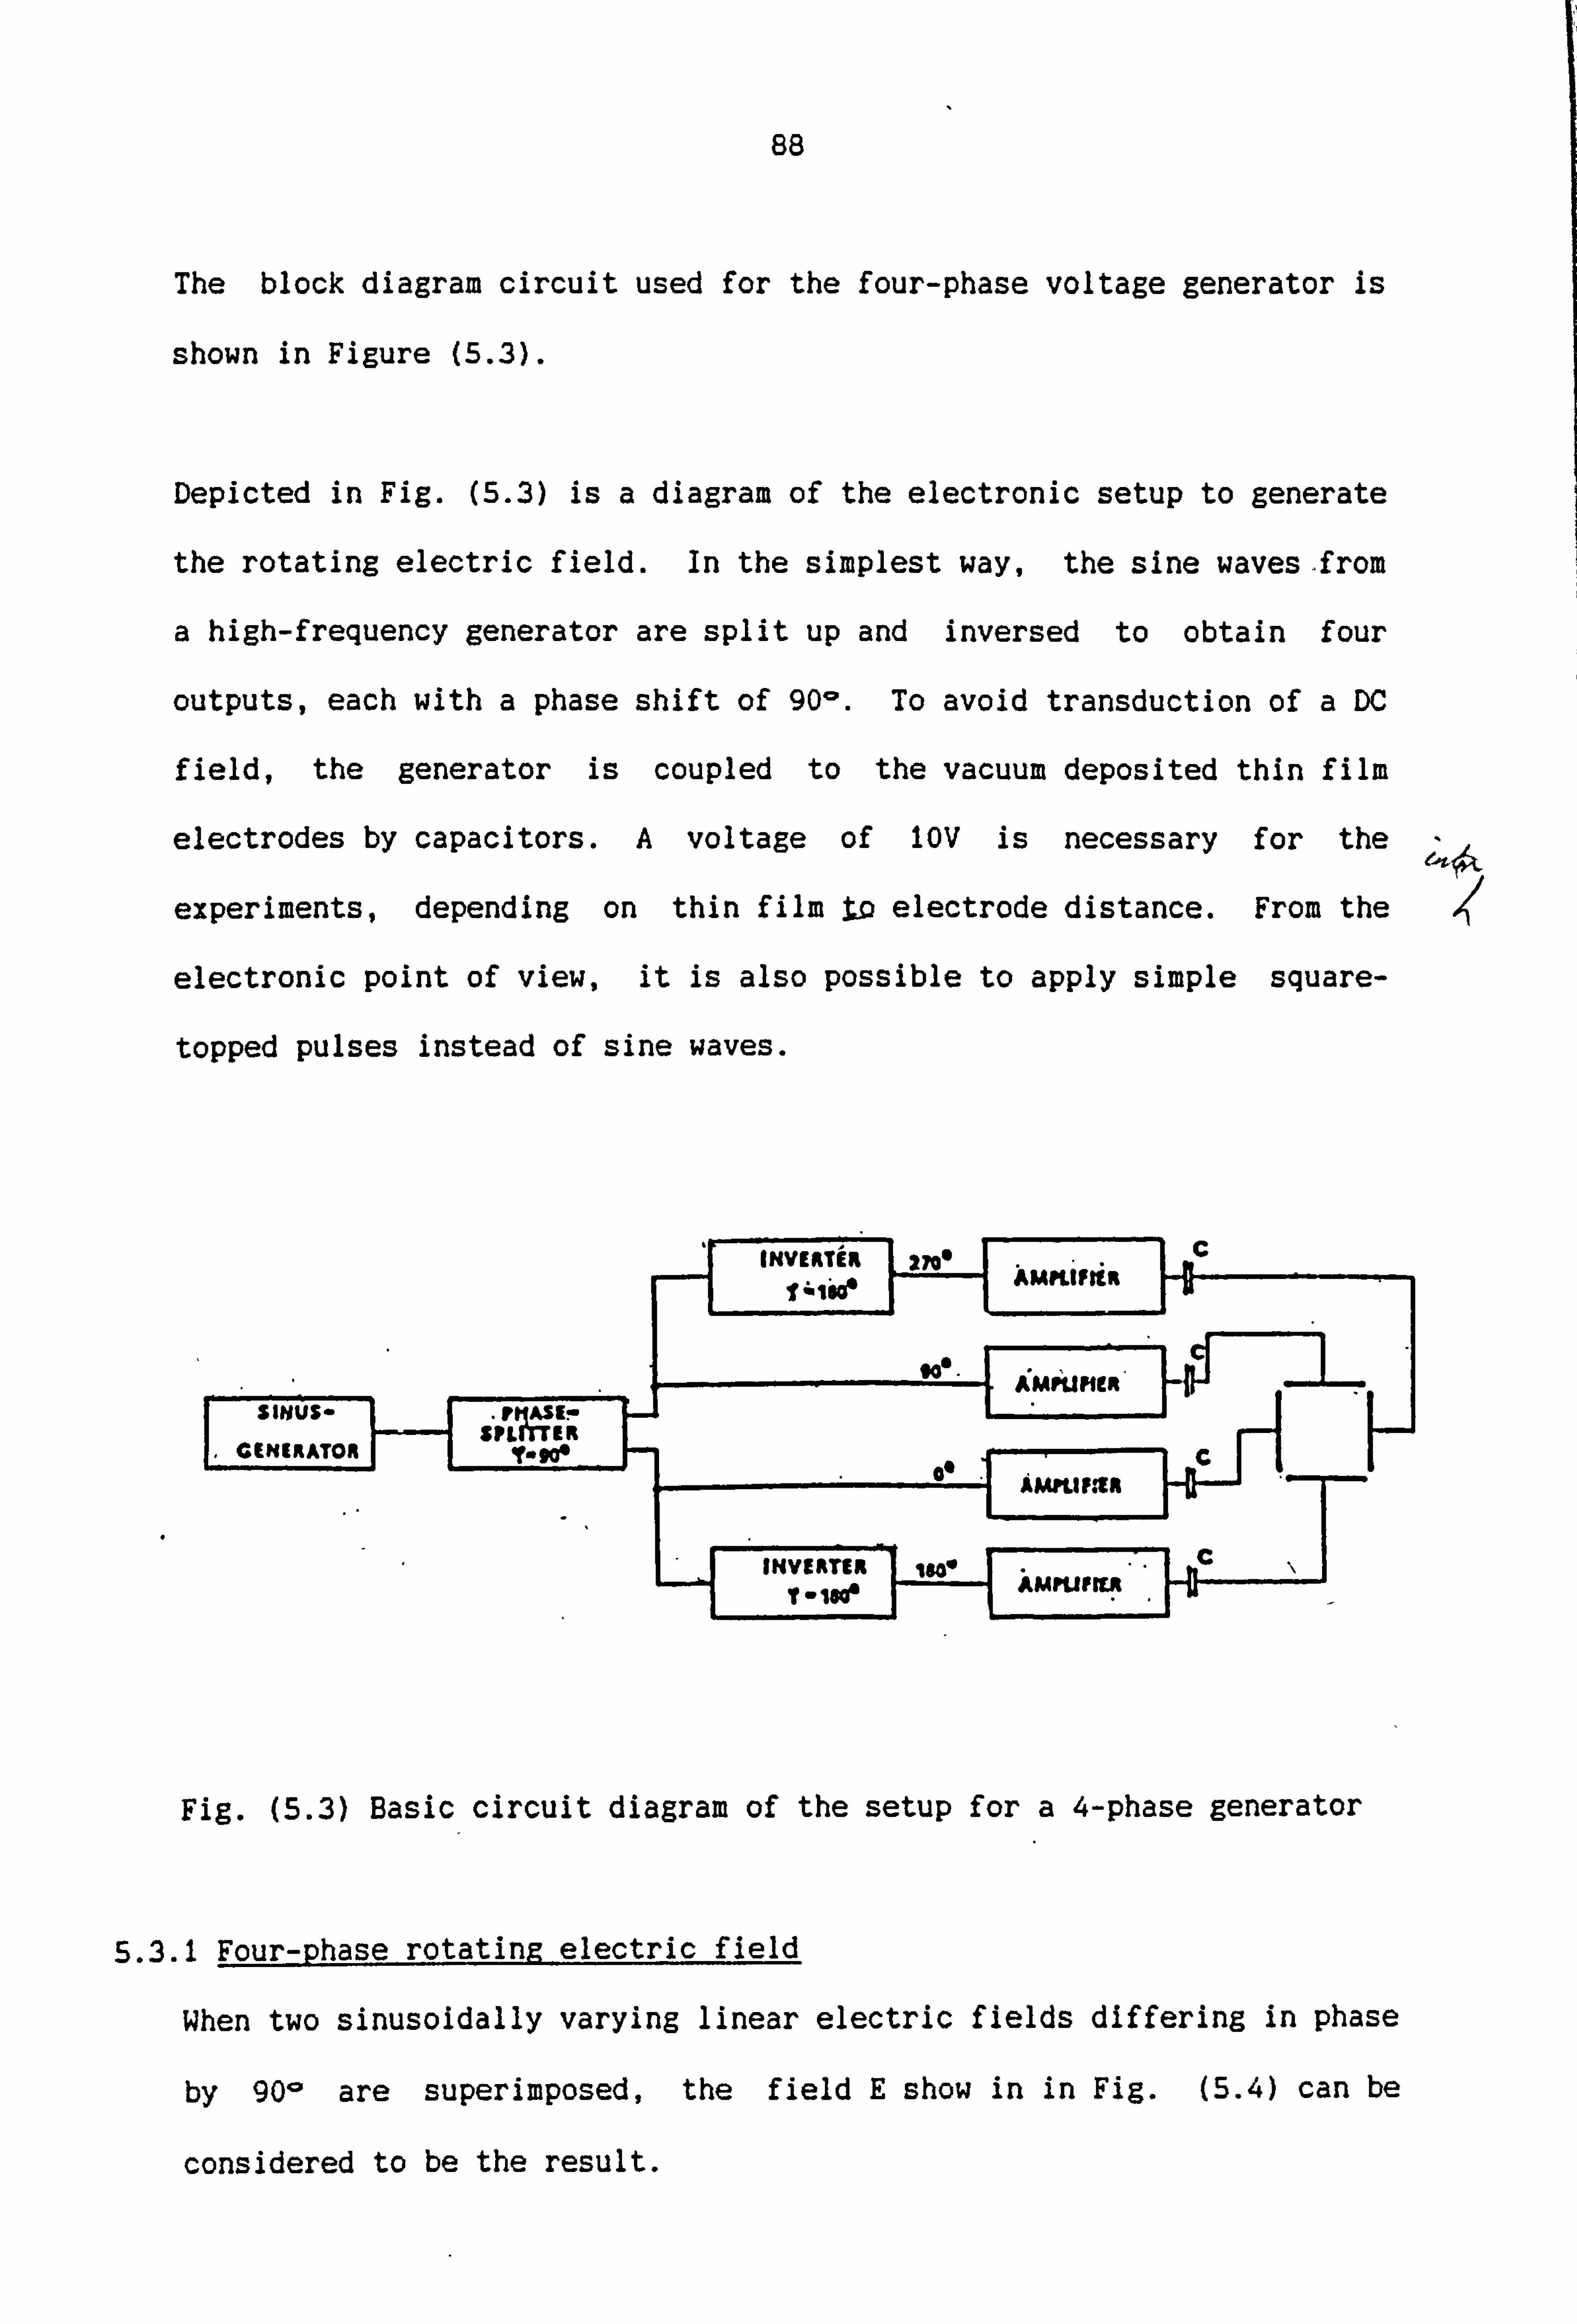
88
The block diagram circuit used for the four-phase voltage generator is
shown in Figure (5.3).
Depicted in Fig. (5.3) is a diagram of the electronic setup to generate
the rotating electric field. In the simplest way, the sine waves, from
a high-frequency generator are split up and inversed to obtain four
outputs, each with a phase shift of 90-. To avoid transduction of a DC
field, the generator is coupled to the vacuum deposited thin film
electrodes by capacitors. A voltage of IOV is necessary for the
experiments, depending on thin film tP electrode distance. From the
electronic point of view, it is also possible to apply simple square-
topped pulses instead of sine waves.
INVERIIR 700 AMFLIFIiR
imiumelt SINUS- -II--- ___j sI twglý*
CENERATOR If.; p
0 Te_
mH - -- -'I AMPLIF-. tn
INVIRTiiý[ Joe
Ise impum
Fig. (5.3) Basic circuit diagram of the setup for a 4-phase generator
5.3.1 Four-phase rotating electric field
When two sinusoidally varying linear electric fields differing in phase
by 90- are superimposed, the field E show in in Fig. (5.4) can be
considered to be the result.

89
Fig. (5.4) The superp orthogonal vectors and field, VR, instant in
Dsition of two linear field the resultant at a given time Vx
If both fields have peak amplitude V (V cm-1) and frequency f(Hz), then
vv =V Cos wt
and
v. =V cos (wC- 90-) =V sin wT
where
w= 2nf.
The amplitude of the resultant is given by:
VR2 = V2(COSIWT + sin 2 Wr)
Therefore
v. =V (independent of T. ).
The angle 0 in Fig. (5.4) is given by:
V sin Wt tan --------- = tan WZ.
V Cos WC
Therefore
0= wl
The resultant field rotates f times per second but has constant
instantaneous amplitude V, which is the peak value of the component
fields. The increase in average amplitude is due to the addition of
two f ields.
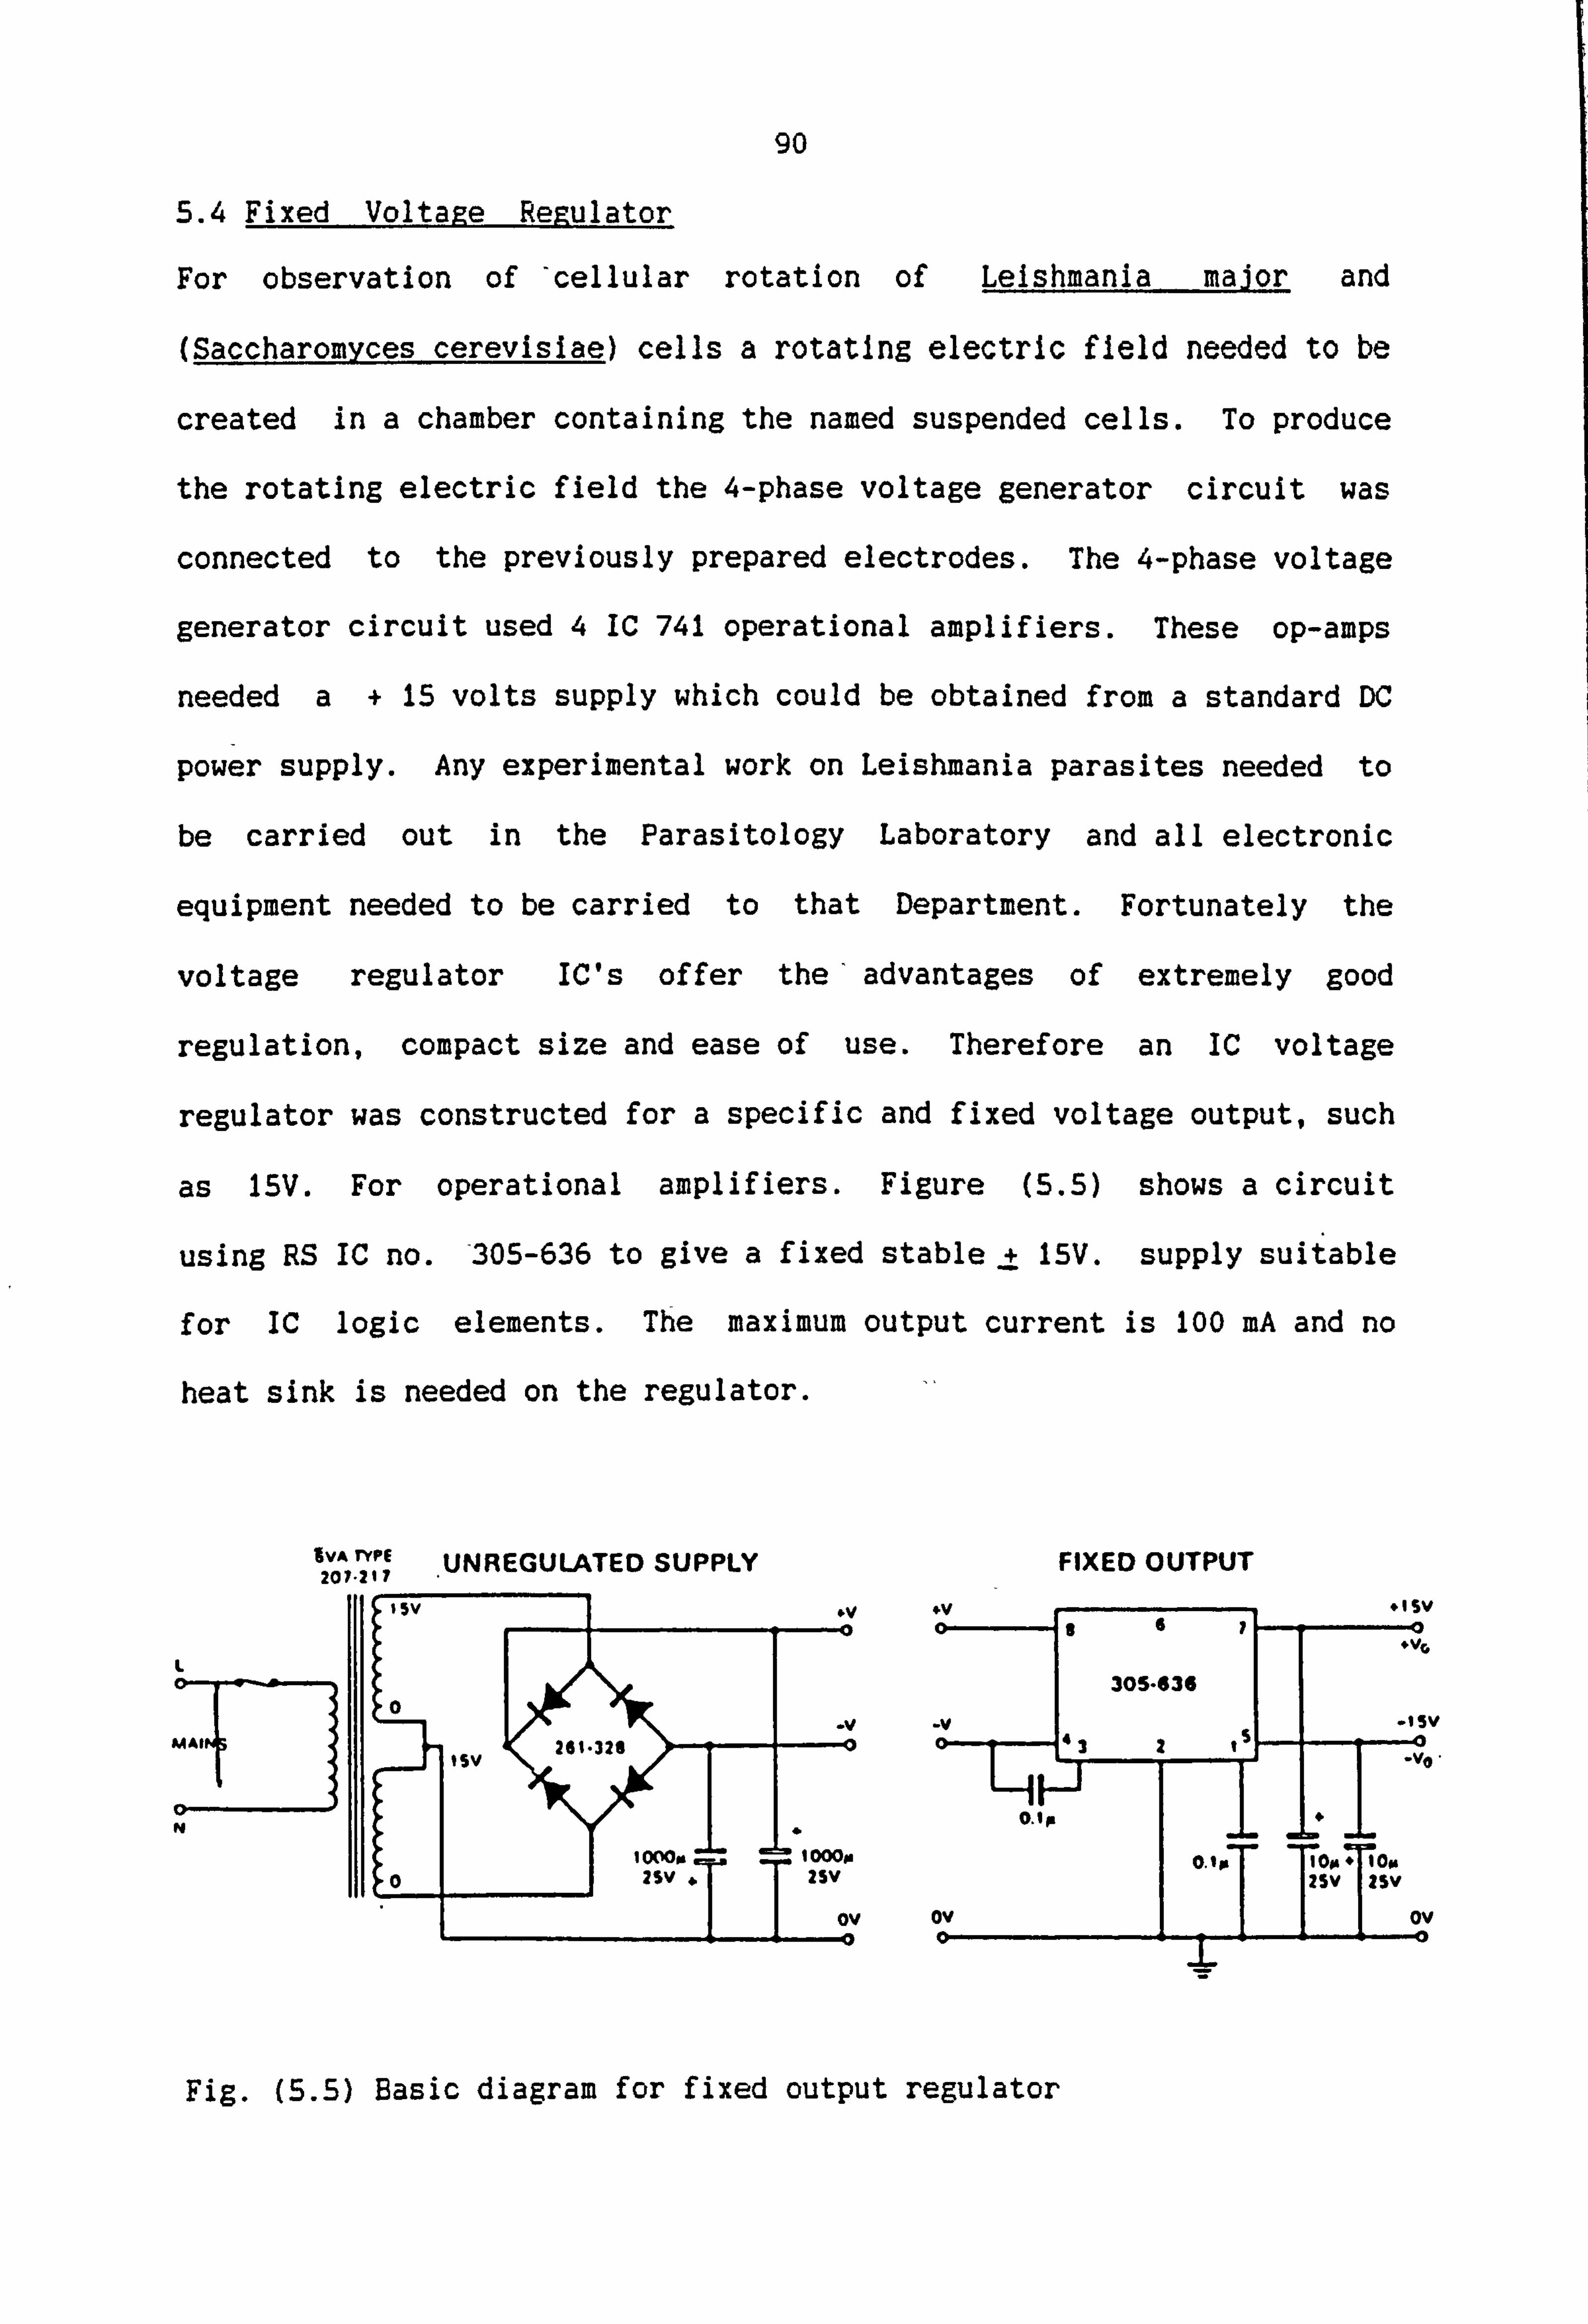
90
5.4 Fixed Voltage egulator
For observation of 'cellular rotation of Leishmania major and
(Saccharomyces cerevisiae) cells a rotating electric field needed to be
created in a chamber containing the named suspended cells. To produce
the rotating electric field the 4-phase voltage generator circuit was
connected to the previously prepared electrodes. The 4-phase voltage
generator circuit used 4 IC 741 operational amplifiers. These op-amps
needed a+ 15 volts supply which could be obtained from a standard DC
power supply. Any experimental work on Leishmania parasites needed to
be carried out in the Parasitology Laboratory and all electronic
equipment needed to be carried to that Department. Fortunately the
voltage regulator IC's offer the' advantages of extremely good
regulation, compact size and ease of use. Therefore an IC voltage
regulator was constructed for a specific and fixed voltage output, such
as 15V. For operational amplifiers. Figure (5.5) shows a circuit
using RS IC no. '305-636 to give a fixed stable. ± 15V. supply suitable
for IC logic elements. The maximum output current is 100 mA and no
heat sink is needed on the regulator.
IVA rYPE 207-217
15V
L01
PAAl
IT"-] N
10
UNREGULATED SUPPLY
--I
Isv 261-326
= 000 0T
FIXED OUTPUT
olsv 060
*Vf, 305-636
-V -V -15V 3
10000 0.1 v sv 2sv PT Tz' sop Top ov ov ov
Fig. (5.5) Basic diagram for fixed output regulator

91
BALANCED OUTPUT The transformer may be a standard 6VA type
. 13V 7
(RS No 207-217) and the full wave Ske
#VC
rectifier (RS No. 261-398) gave the 30S-436 lot
unregulated DC voltage for the voltage eke
regulator IC. -ISV
5.5 Charpe-sensitive amplifier
The electron beam charge used in the experiments of chapter (7) could
be measured in real time, while the electron beams are being injected
into the target petri dish, by using a charge sensitive amplifier.
This gave a direct reading of the surface potential of the sample and
its variations with time.
I
A charge-sensitive amplifier (charge-to-voltage converter) will give an
output voltage proportional to, the quantity of charge transferred to
the input. The operational integrator circuit is very useful in this
application, the input resistor being removed and the input terminal
connected straight to the inverting input (Fig. 5.8).
Because of the high input impedance of the op amp, negligible current
flows into the inverting input, so that the input current i, resulting
from charge q, flows only into capacitor C. Thus q is transferred to
capacitor C.
Now, point E is a "virtual earth", so that the p. d. across C is v. ft
Therefore, with charge q on C.
VQ-Utý
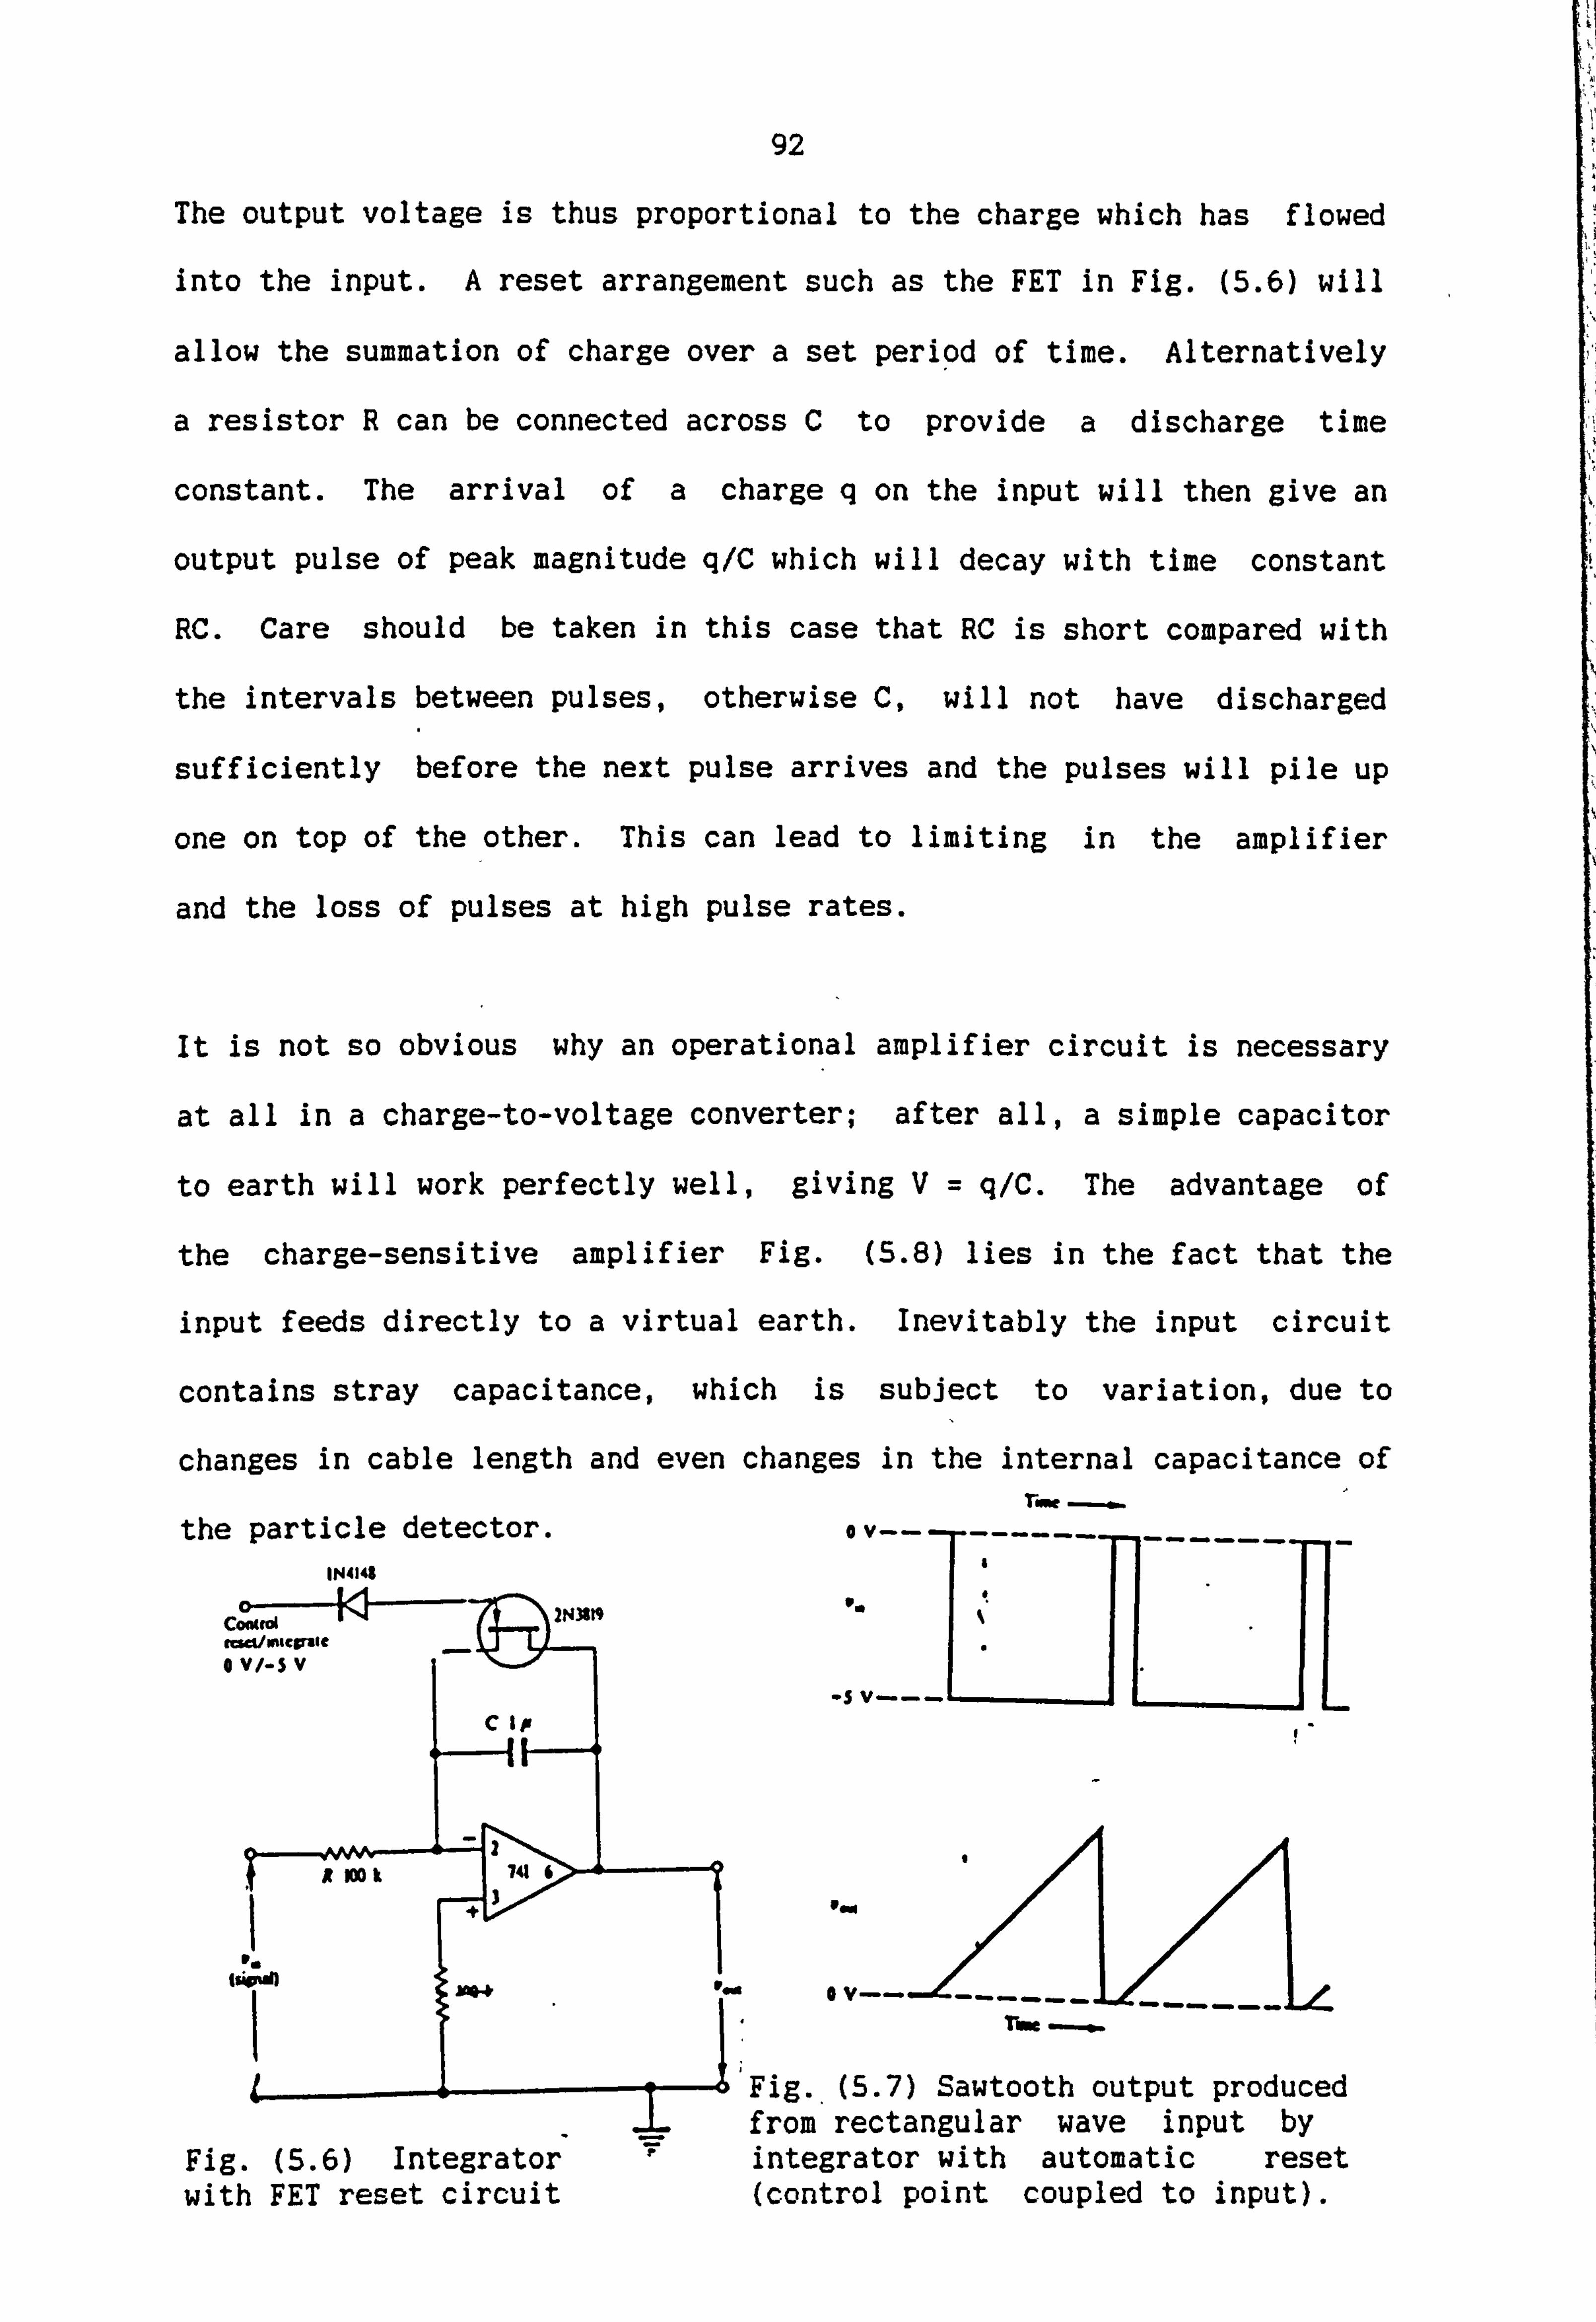
92
The output voltage is thus proportional to the charge which has flowed
into the input. A reset arrangement such as the FET in Fig. (5.6) will
allow the summation of charge over a set period of time. Alternatively
a resistor R can be connected across C to provide a discharge time
constant. The arrival of a charge q on the input will then give an
output pulse of peak magnitude q/C which will decay with time constant
RC. Care should be taken in this case that RC is short compared with
the intervals between pulses, otherwise C, will not have discharged
sufficiently before the next pulse arrives and the pulses will pile up
one on top of the other. This can lead to limiting in the amplifier
and the loss of pulses at high pulse rates.
It is not so obvious why an operational amplifier circuit is necessary
at all in a charge-to-voltage converter; after all, a simple capacitor
to earth will work perfectly well, giving V= q/C. The advantage of
the charge-sensitive amplifier Fig. (5.8) lies in the fact that the
input feeds directly to a virtual earth. Inevitably the input circuit
contains stray capacitance, which is subject to variation, due to
changes in cable length and even changes in the internal capacitance of raw
the particle detector. IN4148
COCK(d 2N31119
CuCL/InICSMIC V/-$ V
.S V---I CIP
P,
-II R 100 k 741 6
+39,0
0 V--
row
Fig. (5.6) Integrator with FET reset circuit
Fig.. (5.7) Sawtooth output produced from rectangular wave input by integrator with automatic reset (control point coupled to input).
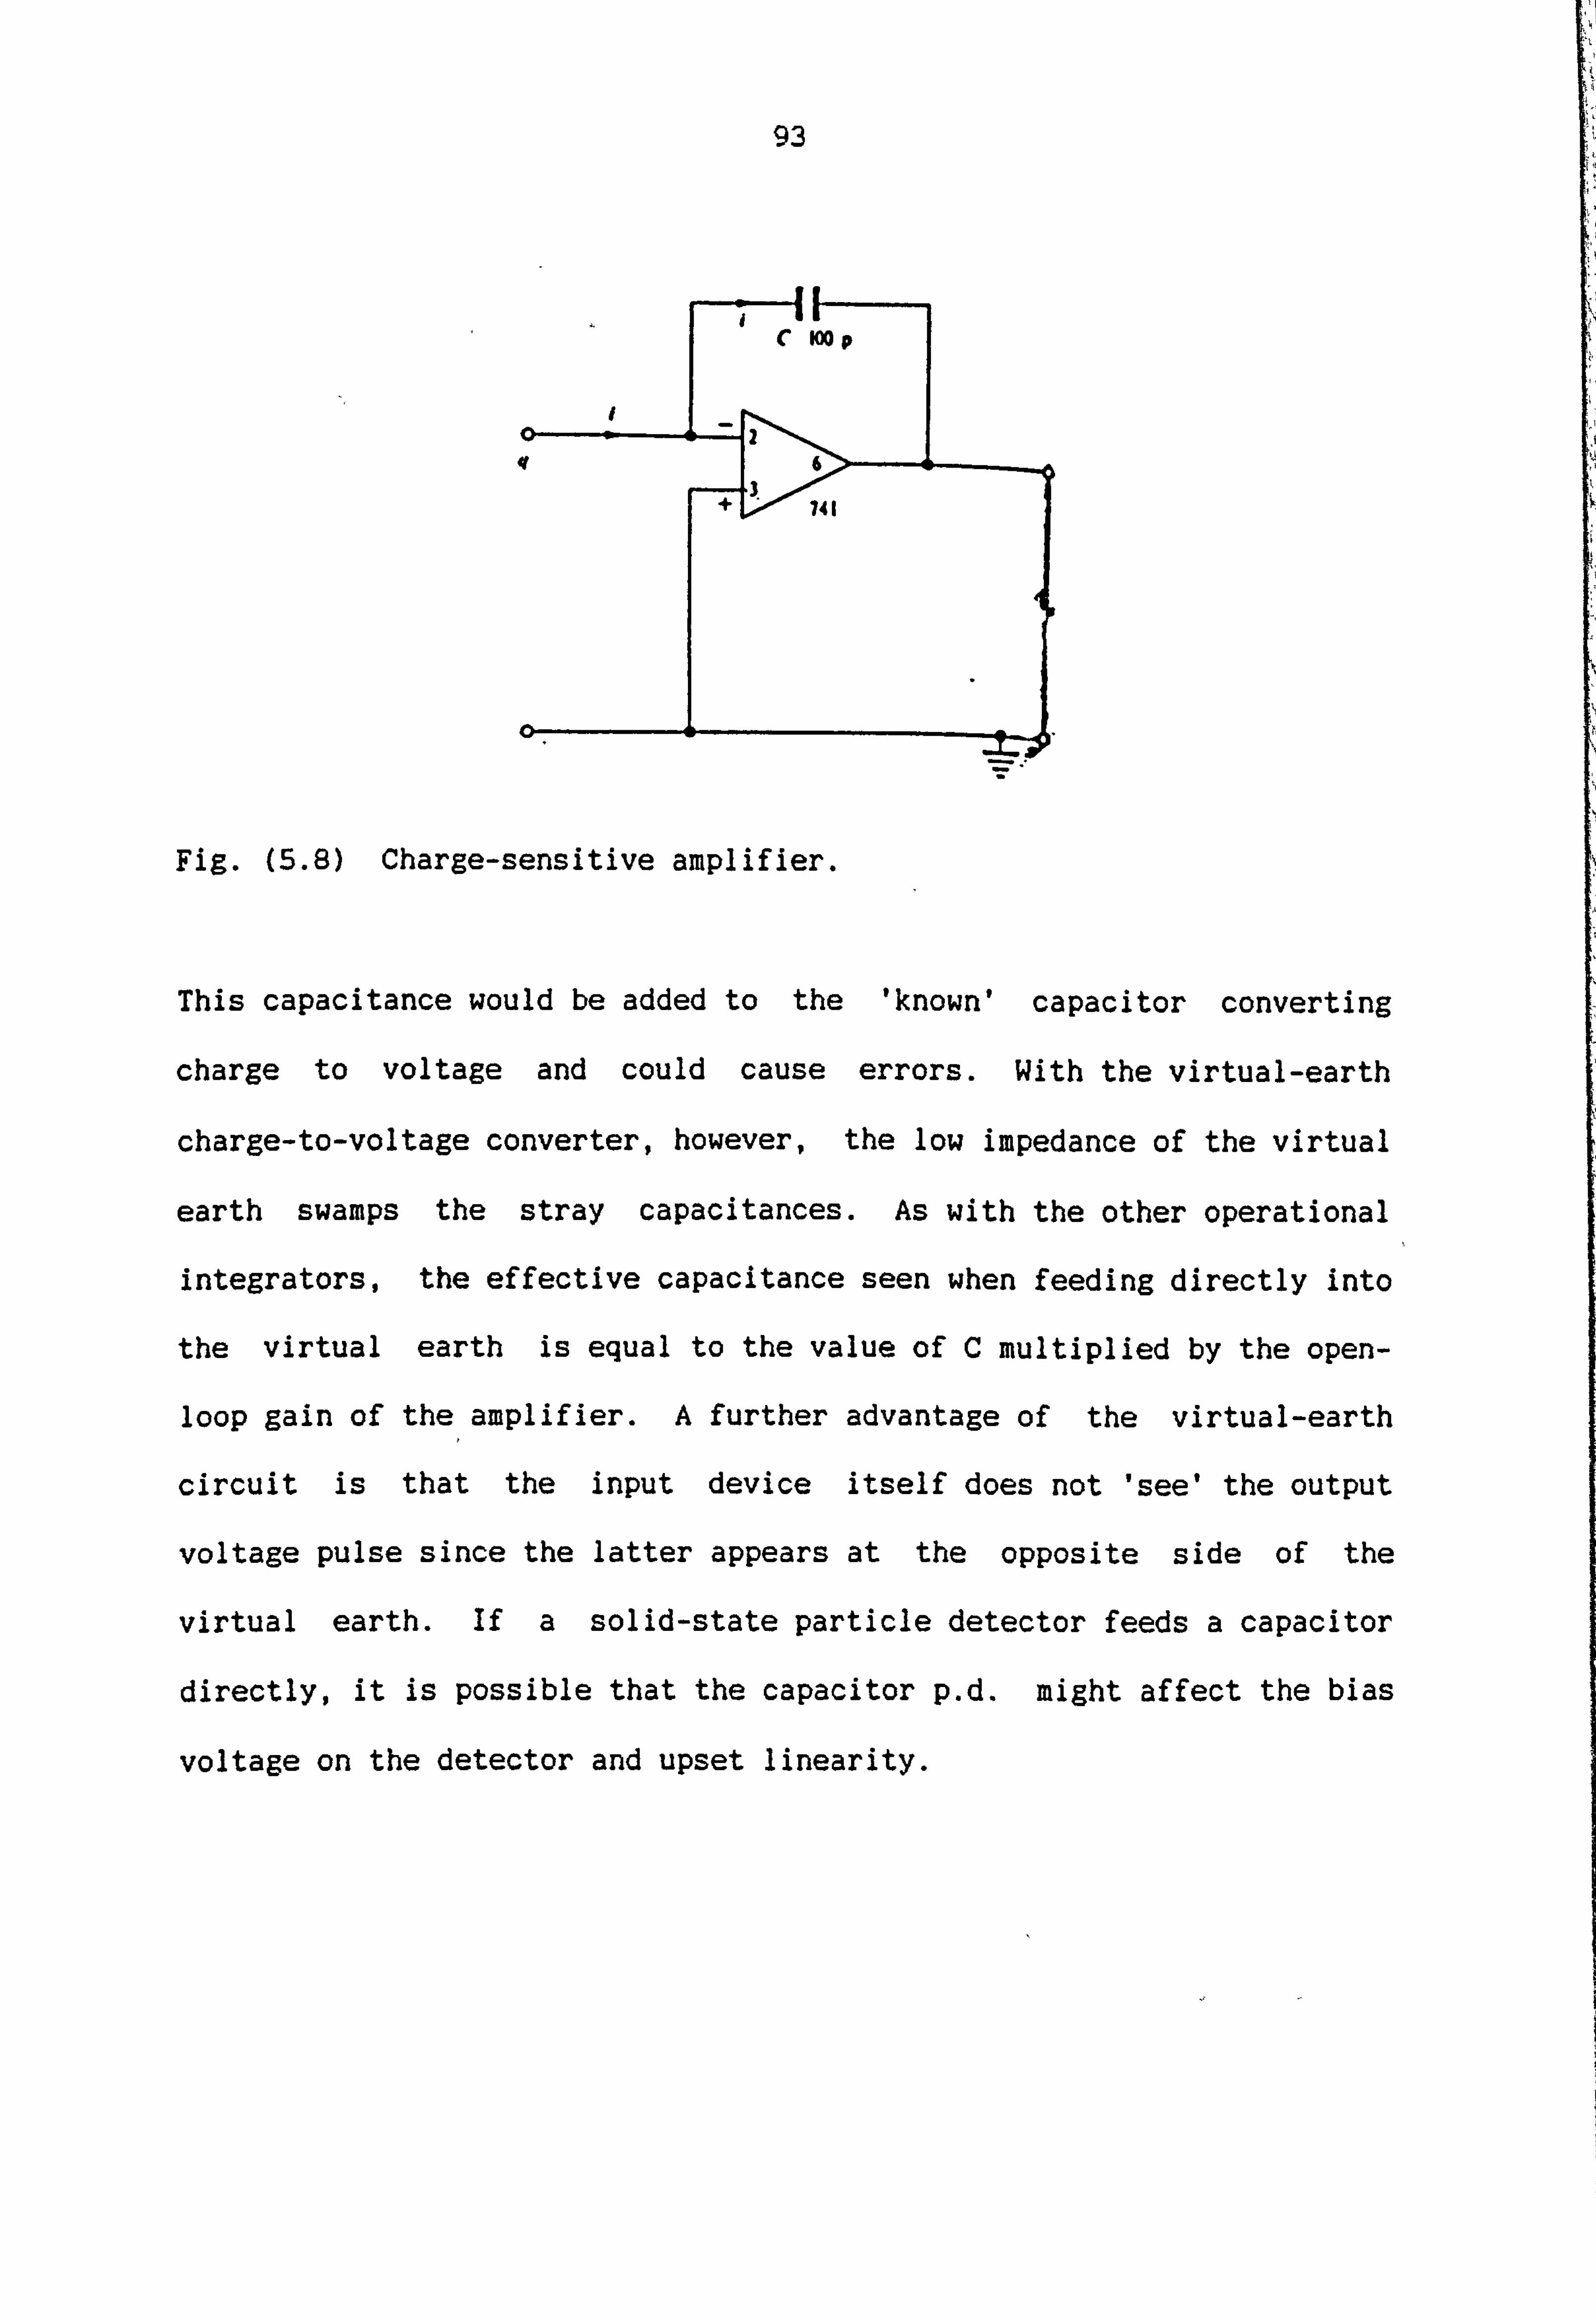
93
Fig. (5.8) Charge-sensitive amplifier.
This capacitance would be added to the 'known' capacitor converting
charge to voltage and could cause errors. With the virtual-earth
charge-to-voltage converter, however, the low impedance of the virtual
earth swamps the stray capacitances. As with the other operational
integrators, the effective capacitance seen when feeding directly into
the virtual earth is equal to the value of C multiplied by the open-
loop gain of the amplifier. A further advantage of the virtual-earth
circuit is that the input device itself does not 'see' the output
voltage pulse since the latter appears at the opposite side of the
virtual earth. If a solid-state particle detector feeds a capacitor
directly, it is possible that the capacitor p. d. might affect the bias
voltage on the detector and upset linearity.

94
5.6 Ioniser
Air ions are electrically charged molecules which occur naturally in
the air. They are formed when cosmic rays, ultra-violet light,
radioisotopes or other forms of radiation interact with air molecules
which either lose an electron (to form a position ion) or gain an
electron (to form a negative ion). Ions are also formed by waterfalls,
waves, lightning, hot dry winds and thunderstorms. The natural levels
of ions and the balance between positive and negative ions vary
considerably from place to place and change very quickly. For example,
just before a thunderstorm the concentration of positive ion goes up,
just after the storm the concentration of negative ion goes up. An air
ioniser is an electrical appliance which produces negative ions (it
also produces positive ions but this can be suppressed unless wanted
too). A variety of ionisers are now available commercially, but all
work on the same principle as the one designed and built for this
project.
Ionisers are mainly used to clean the air. When lots of negative ions
are in the air, smoke, pollen and dust particles in the air become
negatively charged. It is thought that they are then attracted to
surfaces which are positively charged or earthed. The reduction in the
number of particles in the air likely to cause an allergic response
could be the way ionisers make people who are sensitive to dust and
pollen feel better. The method used is to apply a high negative
voltage, several kV in fact, to a sharply pointed emitter. The
negatively charged air is repelled from the emitter resulting in an ion
breeze. There have been several published designs for air ionizers
over the past few years, but no apology is made for offering yet
another.
95 9
5.6.1 Circuit Desir; n of an ioniser
Previous circuits have, almost without exception, been split into three
stages., First of all, the mains voltage is reduced to 12V or so, then
rectified and smoothed. Next there is an oscillator driving a
transformer to step the voltage back up to a few hundred volts again.
Finally, there will be a ladder of rectifiers and capacitors to step
the voltage up to a few kV. In the present design as shown in Figure
(5.10)ý the ladder runs directly from the mains. This cuts out the
first two stages of the usual ioniser circuit. Larger capacitors will
be needed and the final circuit can be run continuously (at 5OHz) for
the experiments in this project without problems.
one advantage of the circuit at either 50 or 60 Hz (mains) instead of
any other frequency like 50kHz is that 1N4007 rectifiers can be used.
Ordinary rectifiers are not too keen to work at high frequencies, the
main reason being their painfully slow reverse recovery time, which
begins to degrade circuit performance at frequencies as low as 2kHz in
the case of a 1N4007. The results of applying a sine wave of
increasing frequency to the circuit is shown in Fig. (5.9). ,

96
At low frequencies, the output
is a half-wave rectified sine
wave, as you would expect.
At 2kHz, s small reverse
conduction spike is already
visible, and by 1OkHz
conduction does not stop until
the input is at about -1.8V.
From then on, the situation
gets progressively worse. By
MHz, whatever the 1N4007 is
doing, it certainly is not
rectifying
(NOT TO SCALEI
SOME
T . 5v \
fbi 2kml
-ns
. gel
ZMHB
z., V\ . 5v
0.1 ItAlft
-zv
I INPUT dkl OUTPUT
Fig. (5.19) The performance of the rectifier diminishes with frequency
The circuit is a standard Cockroft-Walton ladder network which steps up
the mains voltage to -10KV or so (open circuit voltage). When the A. C.
input is switched on, cie., ci-7, cis . ..... c3o gradually charge up until
each has a P. d. of 2Vp (2 x main peak voltage), and since these are in
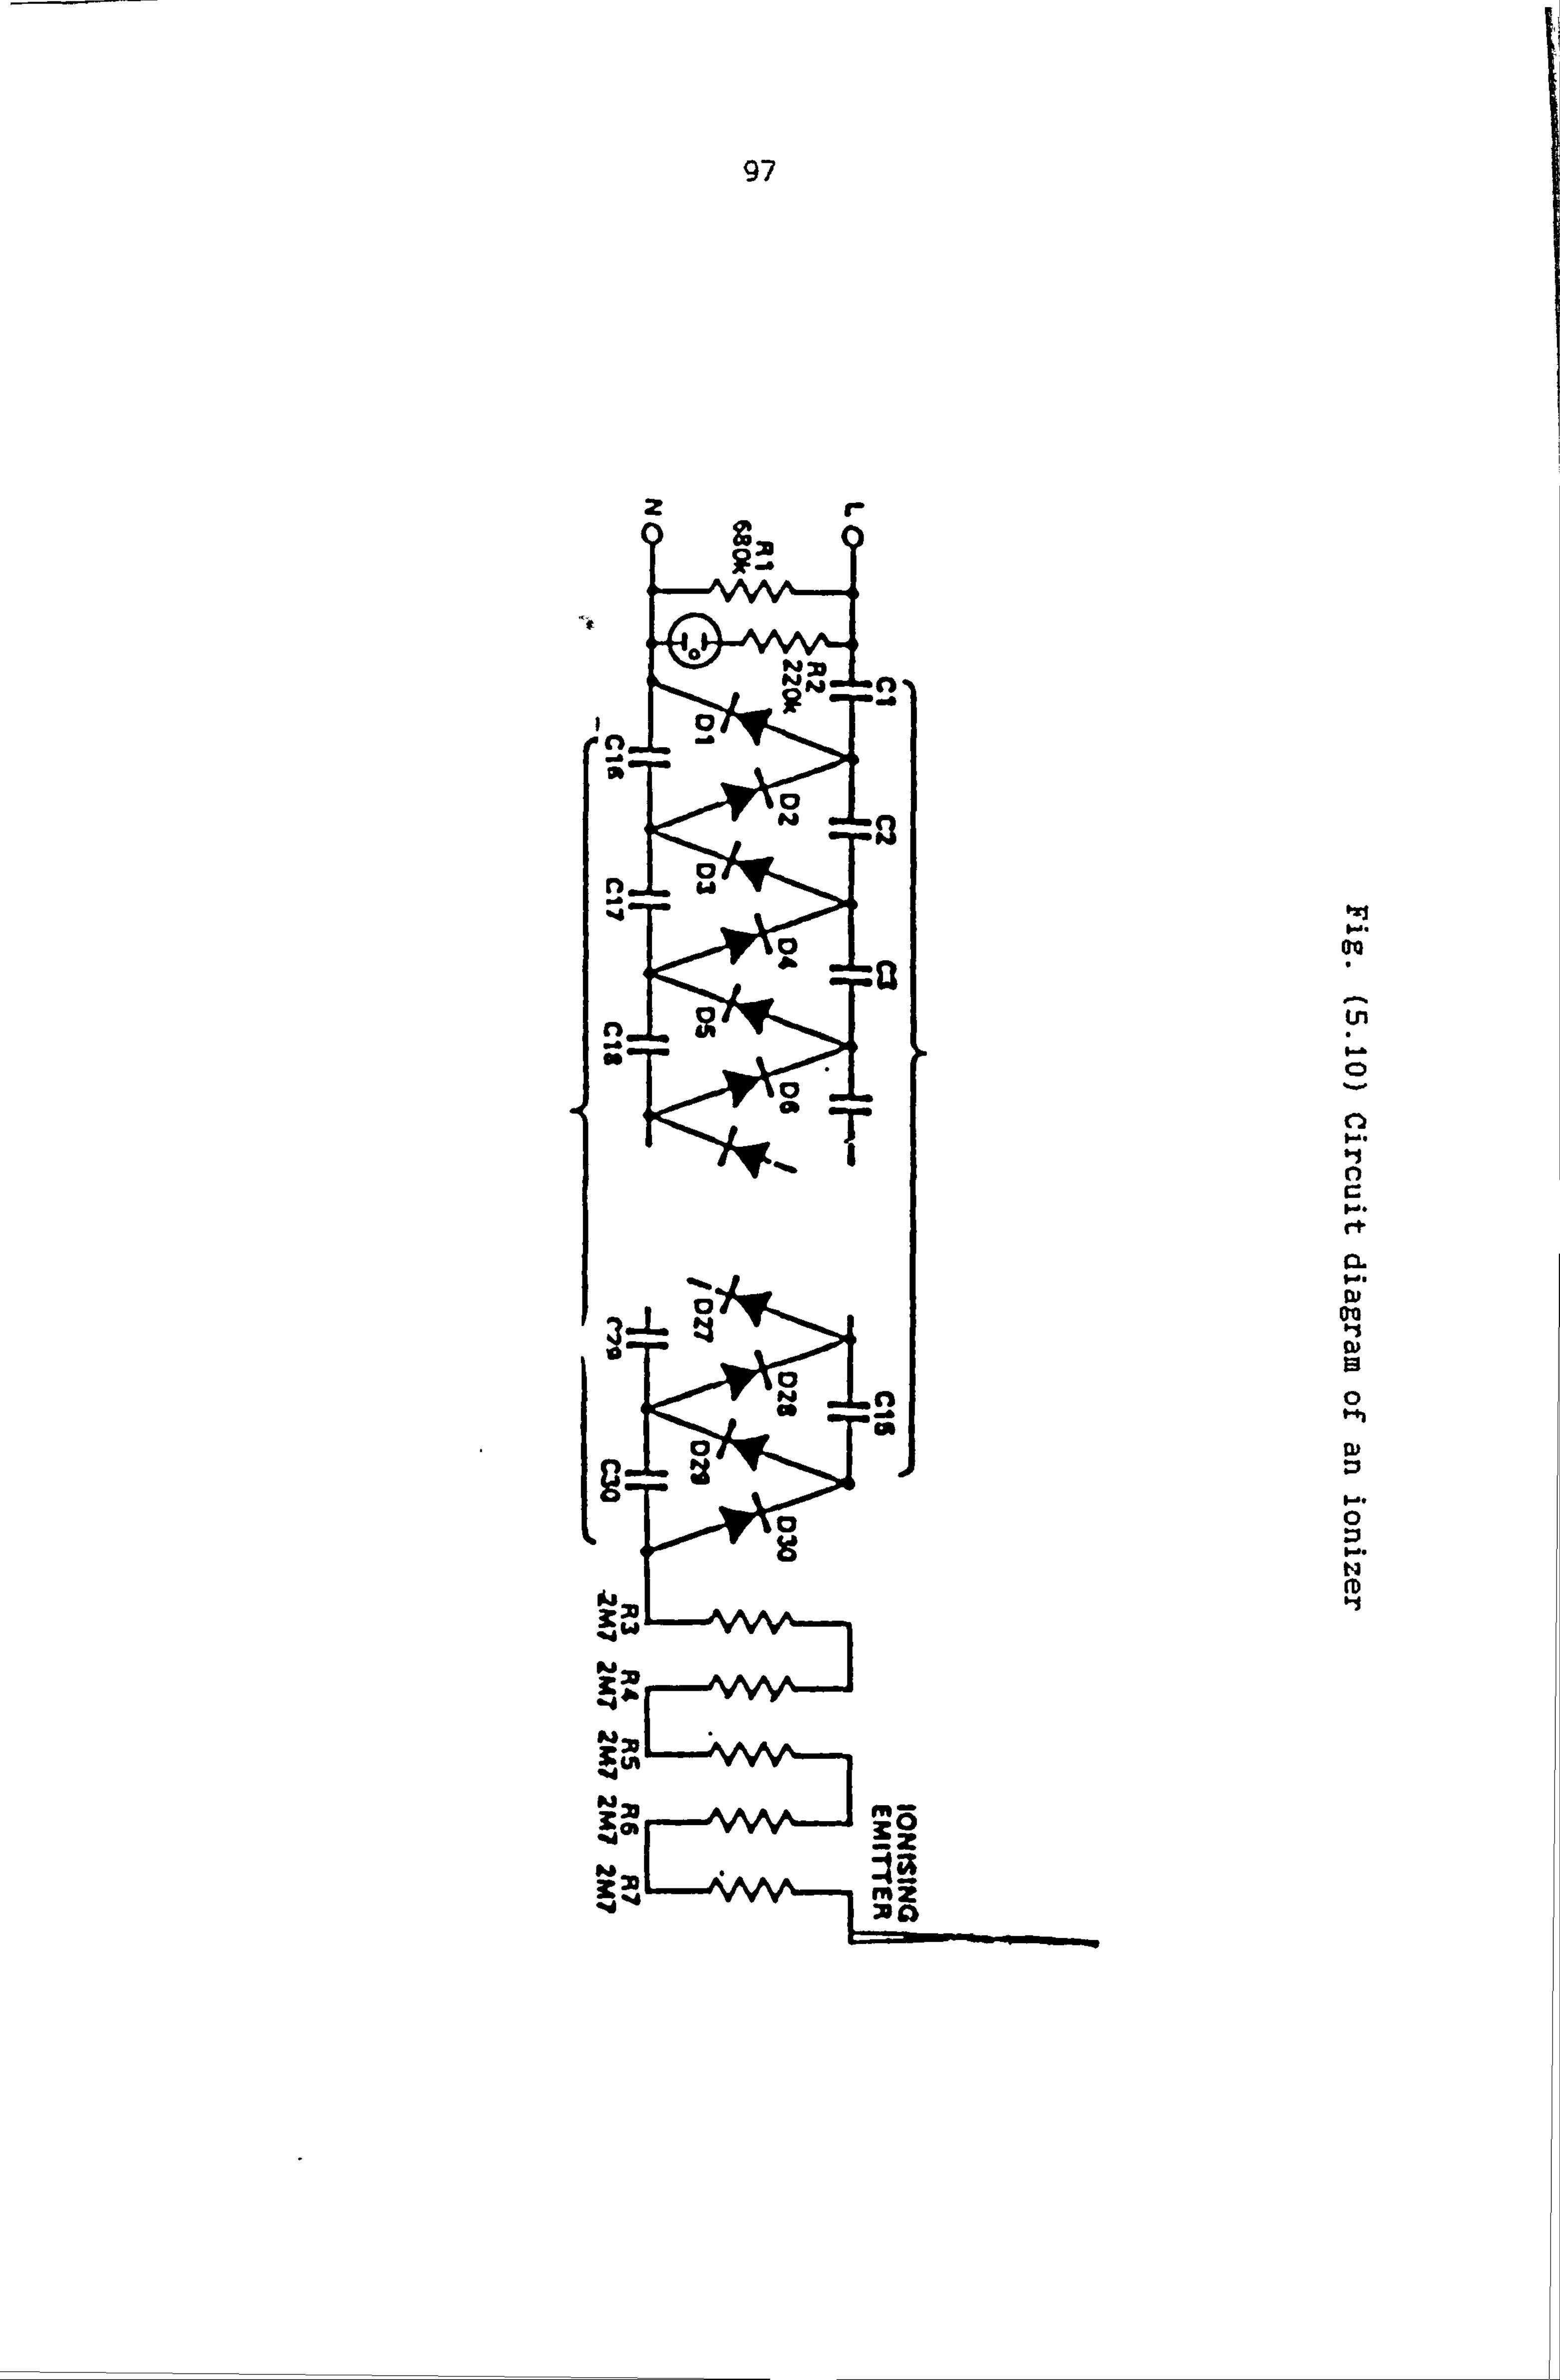
0
C) a
I, .4
C)
II
9T
m
"m
x., 4 "m r. in ba
Pi 33 mcm bi
a
197
a eQ
Ln I-
c"t,
0) M
0
0
N
2r

98
series the output is 30 Vp. Capacitors cl, c2, ca ..... cle act as A. C.
coupling capacitors, transmitting the A. C. wave to rectifiers Di, D3,
Ds, so that Ct, &, C, 79 Cis ..... C3o receive their charge. Therefore the
charge will be transferred backwards and forwards from one row of
capacitors to the other on each main cycle, but always moving further
up the chain because of the action of rectifiers. When all the
capacitors are fully charged, there will be a voltage across each of
them equal, in theory, to the peak-to-peak voltage of the mains.
In practice, the regulation of this type of circuit is very poor, and
the full voltage will never be measured because of leakage, corona
discharge, and so on. This nA ionizing current is quite enough to drop
the output voltage to about 4kV, which by a strange coincidence is the
ideal output voltage for an air ionizer. Voltages above this level
tend to produce ozone rather than ions, whereas voltages much- lower
will not ionize the air efficiently. Touching the emitter directly is
enough to reduce the voltage to almost nothing.
Having said that, a word of warning is in order. Although the circuit
as a whole has a very high output resistance, individual, capacitors do
not. The capacitors will retain their charge for some time after the
ionizer is unplugged and a painful shock can be received from the back
of the PCB unless a leakage resistor is included to discharge them.
This ioniser can also be made to emit + ions than negative electrons if
the polarity of the diodes are reversed.

99
5.6.2 Testing
A simple tester can be made from a 10 nF capacitor and a neon bulb (see
Fig. (5.11)). The ioniser is plugged in and if all is well, its own
neon lamp will glow; a few seconds later a soft hiss will be heard from
the emitter, and the neon bulb on the tester will begin to flash when
its free lead is about 1/2" from the emitter; the bulb flashes faster
as it is brought closer. (The flashing will not be bright so it will
not show up in direct sunlight). It is also very important for. the
emitter to be sharp pointed otherwise there will be no corona discharge
and no hiss will be heard.
Ion
Figure (5.11) Abbreviated circuit of ionizer and a simple tester.
5.6.3 Measurements
Measurements have been made and interpreted from the following
standpoint. If negative ions were infinitely long living and moved at
a constant speed away from the ioniser in still air, the concentration
would vary inversely as the square of the distance from the ioniser.
However, some negative ions will combine-with positive charges so that
not all will reach the boundaries of the room, either as negative ions
or attached to negatively charged dust particles. The mobility of
negative ions in atmospheric air is approximately 1.7 cm/s per volt/cm
of electric field strength, the field being increased by the ions
themselves. Typically 1013 ions distributed symmetrically about the
centre of a sphere of 1m radius would create a field of 10OV/cm at a
distance of 1m from the centre and therefore an ion velocity exceeding

100
1m/s might be expected 1m from the ioniser. Since the mean free path
of negative ions in atmospheric air is only a fraction of a mm a very
large number of collisions of ions with neutral molecules will take
place.
The approach wa s therefore adopted of measuring negative ion flux, i. e.
ions/cm - using the apparatus shown in Fig. (5.12) that measures the
charge arriving at the metal plate. The results are shown in
Figs. (5.13) and (5.14)
2 METAL PLATE 10 CM
VARIABLE
IONISER r- DISTANCE
SUPPORT IIISULATING -LI I PICOI SUPPORT AMMETER
BENCH
Fig. (5.12) Apparatus used to measure negative ion flux.
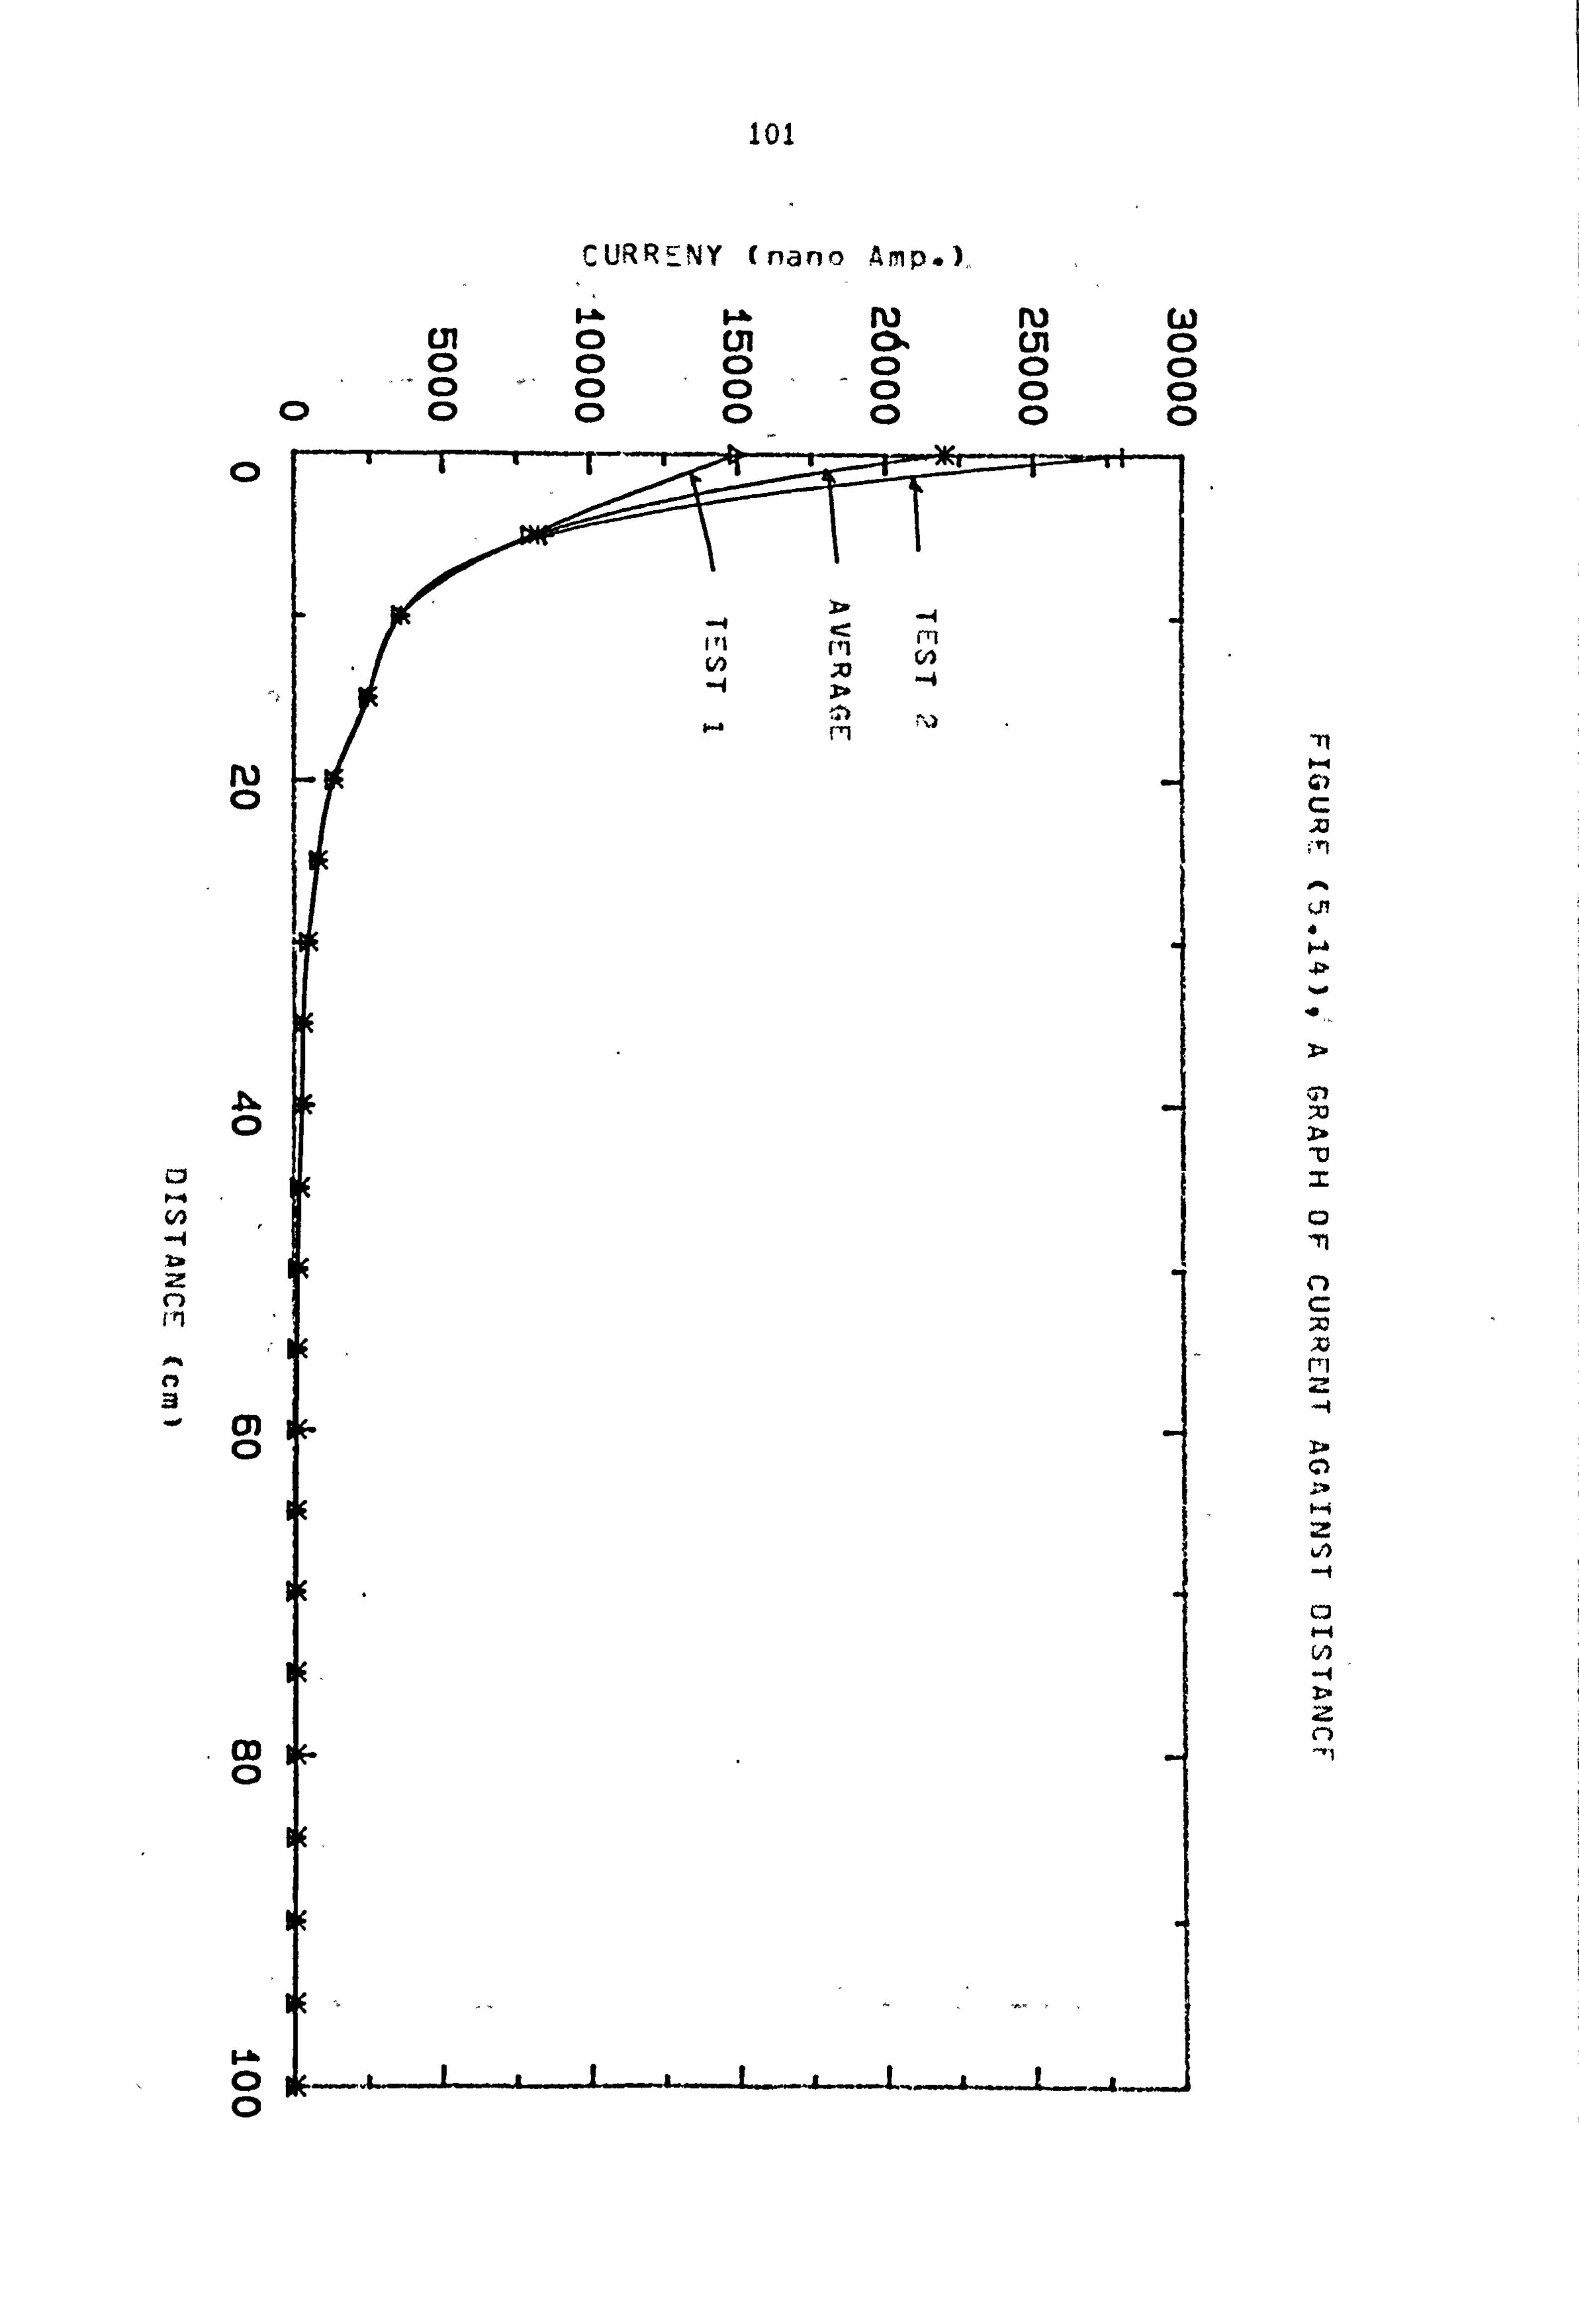
101
0
ru 0
0
C,,
z r) 1"1
"1
3
cn 0
OD 0
0 0
CURRENY (nano Amp. ),,
ru rU cm 0 Ul 0. (31 0 0 C) 0 0 C) 0 11 C) 10'- 0 0 0
00
frl 0
In
z
4-4
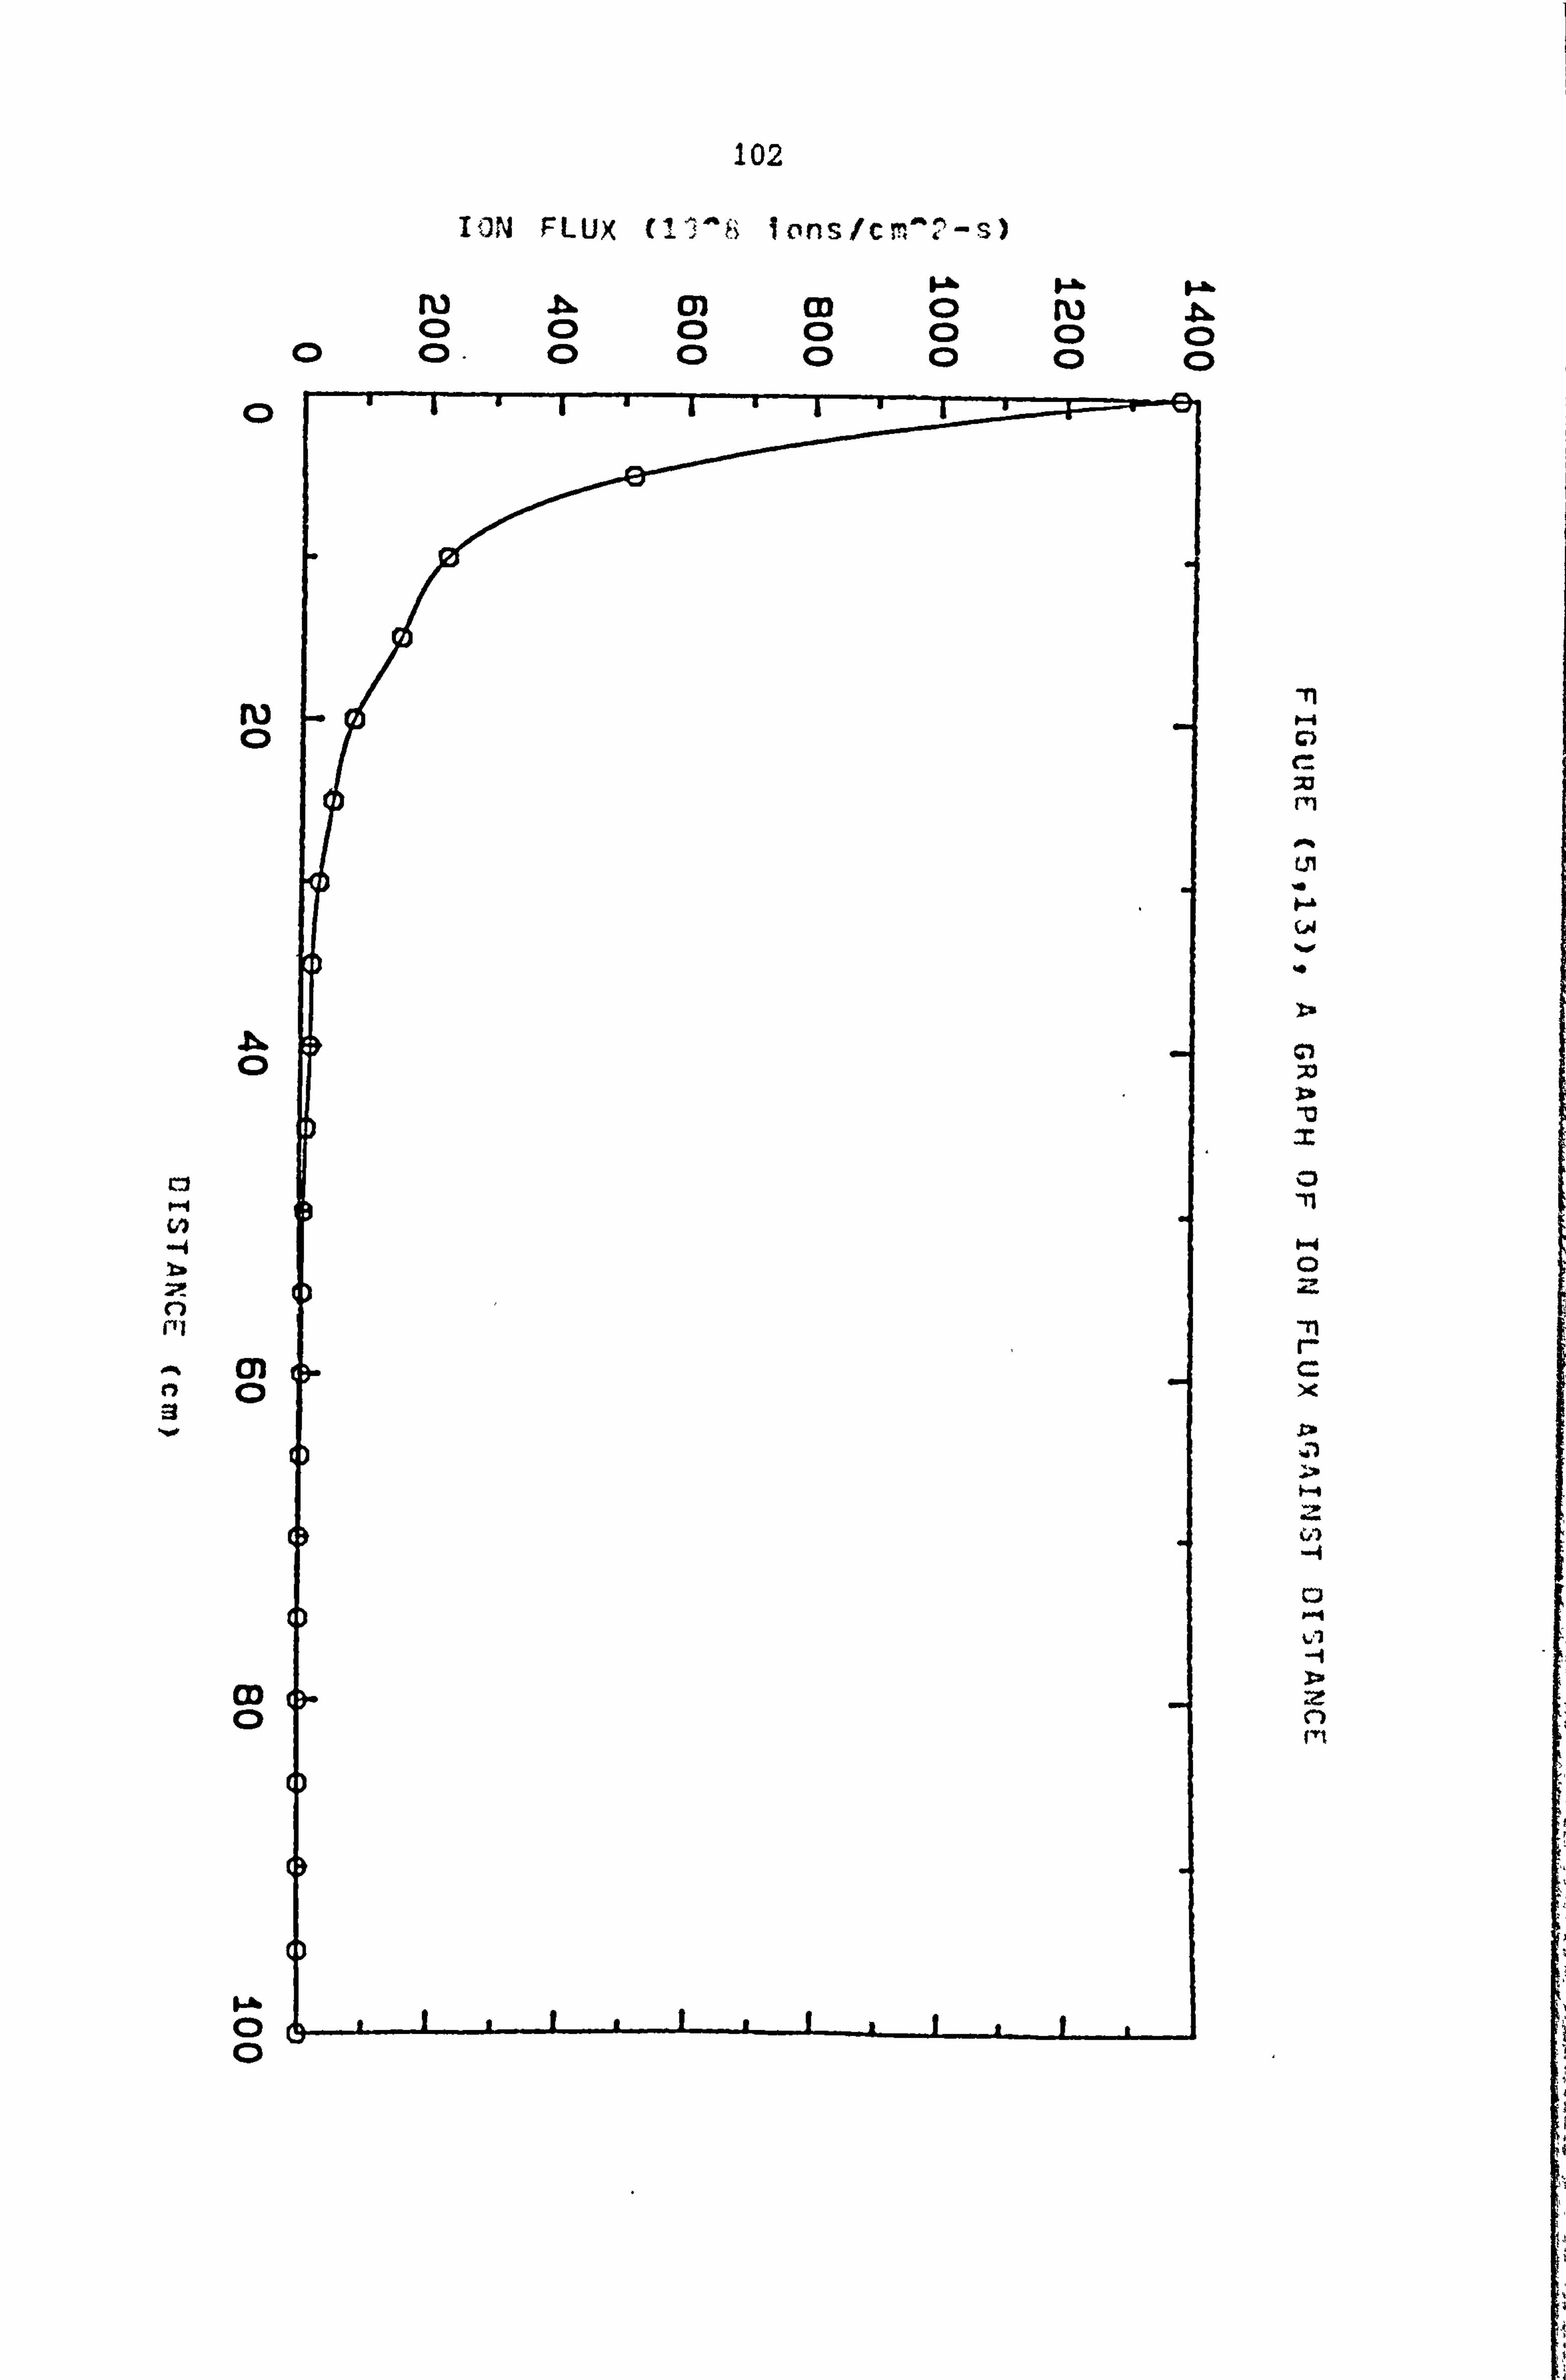
102
PON FLUX (11'8 lOns/cr, ýý-s)
0
rU 0
0
ri
CD 0
0 0
ý-&
ru b. cn CO F-Al-
ru Cl 00 (D C) C) 00 0
-n
C
L4 %. o
X
-n
X
103
5.7 COMPUTER CONTROLLED OSCILLATOR
It has already been shown that alternating non-uniform electric fields
acting on neutral particles can cause pearl chain formations. This Is
known as dielectrophoresis and has been described in Chapter (2).
Previous work on pearl chain formation for different oscillator
frequencies using a single pair of electrodes showed a marked drop in
yield over the region of between 2.55 kHz to 3 kHz. This drop is very
strongly resonant, and any small change of oscillator frequency would
change the number of lone cells in pearl chains. This drop of yield is
consistent with resonance conditions in which the geomagnetic field
strength satisfies the proton magnetic resonance condition.
Unfortunately proton NMR observations are not easy to obtain because
they are sharply resonant when working with a manually tuned
oscillator. The aim of the work described in this Chapter of the
project to design a computer controlled oscillator to ease and help the
work ofýother researchers, working in this laboratory.
The oscillator needs to be computer controlled since the experimenter -
needs to study the number of pearl chain formations of lone cells.
There are a variety of ways to design a computer controlled oscillator:
Two different methods were tried but the author believes the second
method has a lot more potential to offer, the reasons being that it is
simpler and easier to change, it is driven from the keyboard of a BBC
microcomputer, the results may be stored in the memory of the computer
by a slight change to the program, so the experimenter may go back to
all the frequencies at which the experiments were done and finally, a
hard copy printout may be obtained.

104
Each of these two methods are described, briefly, as follows.
Initially an oscillator was constructed by using a programmable crystal
oscillator, an 8-bit synchronous up/down counter; an Eprom and an 8-bit
D/A coverter. The programmable crystal oscillator (RS stock no. 301-
858) is a standard 16 Pin-, package and could be used to generate 57
different outputs. Two different base frequency oscillators of 600 kHz
and 1 MHz were available giving an output frequency from 0.005 Hz up to
1 MHz. The connections for this crystal oscillator are given in RS
Data sheet 5027 (Nov. '84). The counter was an 8-bit synchronous 74193
up/down counter with pre-set inputs and was driven from the previously
mentioned crystal oscillator. The outputs of the 8-bit 74193 up/down
counter were input to an Eprom 2708. The Eprom was previously
programmed to generate the sine output value of any input binary
values. The data was programmed into the memory by using the Eprom
programmer device in the microprocessor laboratory. There are many
different types of Eprom. For example, the 2716 Eprom is an excellent
device and requires only a 5V power supply however, its cost is quite
high for this laboratory use therefore the smaller, but much less
expensive, 2708 was chosen for this experiment.
lk
The final digital sine wave output values were converted to an analog
waveform by using a D/A IC (MC140828). Unfortunately this method had a
few problems; each time the clock needed to be programmed, or to obtain
any other waveform, the Eprom needed to be erased and re-stored with a
new set of data to generate the desired waveform. This proved somewhat
time consuming and the author decided to use a BBC computer to generate
the desired waveform.
105
A nonlinear sine wave waveform was generated by programming a BBC
microcomputer. Obviously, any desired non-linearity can be produced
with a microcomputer and a D/A converter. Basically the desired values
for each point on a waveform may be stored in a table in the memory and
then sent out to the DA''converter (CMOS 4066) in proper order.
Complex waveforms require lengthy tables which are somewhat tedious to
produce. As an example of this powerful technique, a sine wave was
chosen. Fig. (5.15) shows a program which plots and outputs the
continuous sine wave digital values using the (2geFE60-61) function.
The program is written in BBC Basic language. It has less than 50
statements and can be made to work on any frequency between 400-1600
Hz. It is important to note that the output digital values from the
output port needed to be input to a D/A convertor. ss described in the
next part of this Chapter.
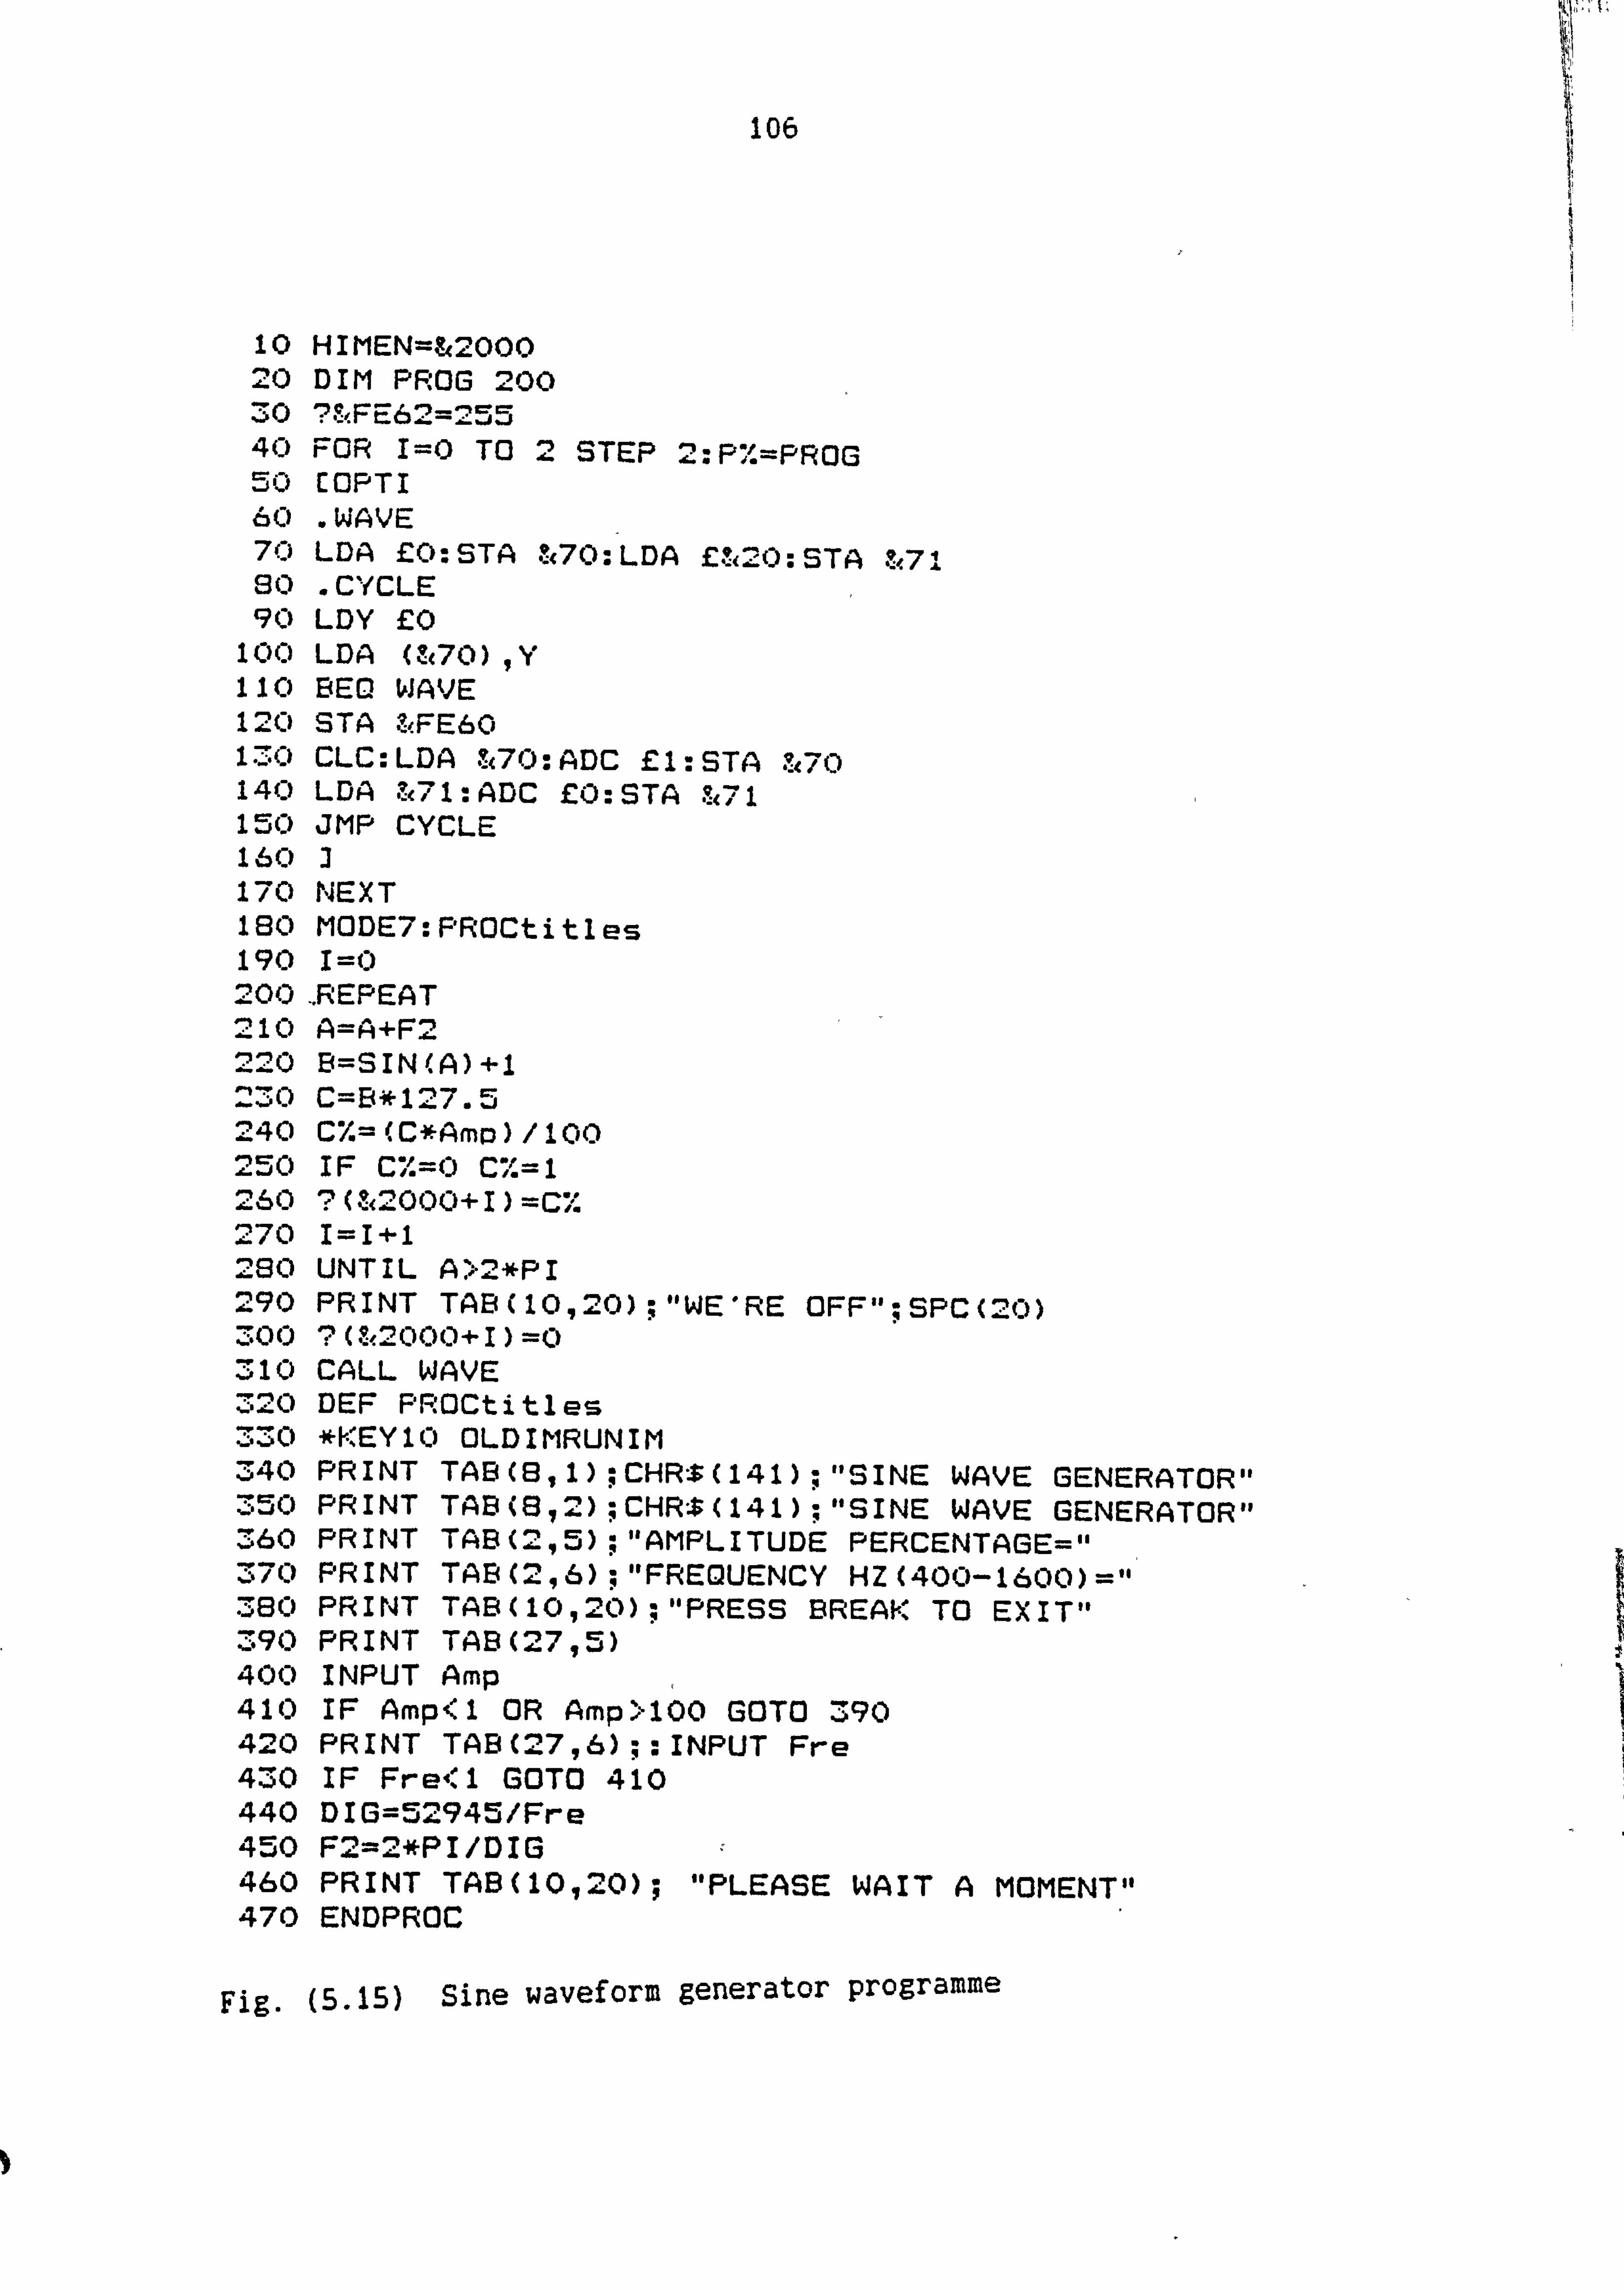
106
10 HIMEN=&2000 20 DIM PROG 200 30 "&FE62=255 40 FOR I=O TO 2 STEP 2: Pwl. =PROG 50 EOPTI 60 WAVE 70 LDA EO: STA &70: LDA 0(2-0: STA &741 80 CYCLE 90 LDY EO
100 LDA Q(70)9Y 110 BED WAVE 120 STA &FE60 17.0 CLC: LDA &70: ADC El: STA &70 140 LDA &71: ADC EO: STA Z(-? l 150 JMP CYCLE 160 3 170 NEXT
leo MODE7: PROCtitles 190 1=0 200, REPEAT 210 A=A+F2 220 B=SIN(A)+l 230 C=B*127.5 240 C%=(C*Amp)/100 250 IF C'fl. =O C', ". =l 260 7(&2000+I)=C% 270 I=I+l
2eo UNTIL A>2-*PI 290 PRINT TAB(10,20); "WE'RE OFF"; SPC(20) 300 ? (&2000+I)=0 310 CALL WAVE 320 DEF PROCtitles 330 *KEY10 OLDIMRUNIM 340 PRINT TAB(B. 1); CHR$(141); "SINE WAVE GENERATOR" 350 PRINT TAB(8jd-1); CHR$(141); "SINE WAVE GENERATOR" 360 PRINT TAB(21,5); "AMPLITUDE PERCENTAGE=" 370 PRINT TAB(2,6); "FREQUENCY HZ(400-1600)=" 380 PRINT TAB(10,20); "PRESS BREAK TO EXIT" 390 PRINT TAB(2795) 400 INPUT Amp 410 IF Amp<l OR Amp>100 GOTO 390 420 PRINT TAB(27.6);: INPUT Fre 430 IF Fre4. 'l GOTO 410 440 DIG=52945/Fre 450 F2=2*PI/DIG 460 PRINT TAB(10120); "PLEASE WAIT A MOMENT" 470 ENDPROC
Fig. (5-15) Sine waveform generator programme

107
5.7.1 Using a D/A converter with a microcomputer
Digital to analog (D/A) conversion is basically simple: each bit is
given its appropriate analogue value and the outputs summed up in an
analog order. There are many D/A converter IC's, such as the MC1408
(see Appendix (2)). However, this part of the experiment used two 4066
MOSS 'chips because of their ready availability. Figure (5.16) shows
the 8-bit D/A converter designed for direct connection to the output
port of the BBC micro'.
3ý 0000000 ,Z
ri 0 oo e ri rn - D7
X-bit D6 binary
,D5 D4 digital D3 illptif D"
DI DO
8x 15 k 1113 14 1S 1816 1 12 1113 1415 8ý Static protection resistors
ICI 12 13 -19 110 12 13 9 4066
Power supplies IC 1. IC2 (4066) +5V pin 14
OVpIn 7 IC3(741) +5Vpin 7
-SVpin 4
0000 +5V 0a +12V
0o -5V Power available from aux power socket of BBC Micro
+5V 2-20
1k VREF
6 1112 vI 6k4
T IC2
_110
4066 2
3 IC3
>n
741
6k4
Fig. (5.16) Experimental 8-bit digital to anaIogue coverter
ý0=: Xll.

108
It was designed to be powered by + 5V supplies which are available from
the BBC Micro auxiliary power socket. The two 4066 CMOS chips provided
eight analogue switches which connected the appropriate input resistors
to the virtual earth adder according to the logic state of the input It
bits. Calibration was determined by the reference voltage VREP and
adjusted by RVI. Each input resistor value was determined by the
inverse of the 'weight' of the bit which switches it. Thus the 'LSB'
resistor'(IM28 ) was 128 times the value of the 'MSB' resistor (10k ).
The feedback resistor was chosen here so that the analogue output
voltage Vo is given by
Vo Vne: v. x Dim 100
where Dim is the decimal equivalent of the digital value (0 to 255)
With this circuit connected to an output port, a binary countup or
countdown produces a linear ramp analogue output. Sine and cosine
functions have already been displayed on an oscilloscope by using the
computer to generate the function in the first place, as described
earlier in this Chapter.
It is useful to note that the analogue output is proportional to the
product of the digital input and the reference voltage. Most D/A
converters have therefore an inherent ability to multiply an analogue
voltage by a digital input. Some D/A converters are optimised for this
application such as the multiplying D/A converter (MDAC), which is
useful for the accurate digital control of analogue gain in a variety
of applications.
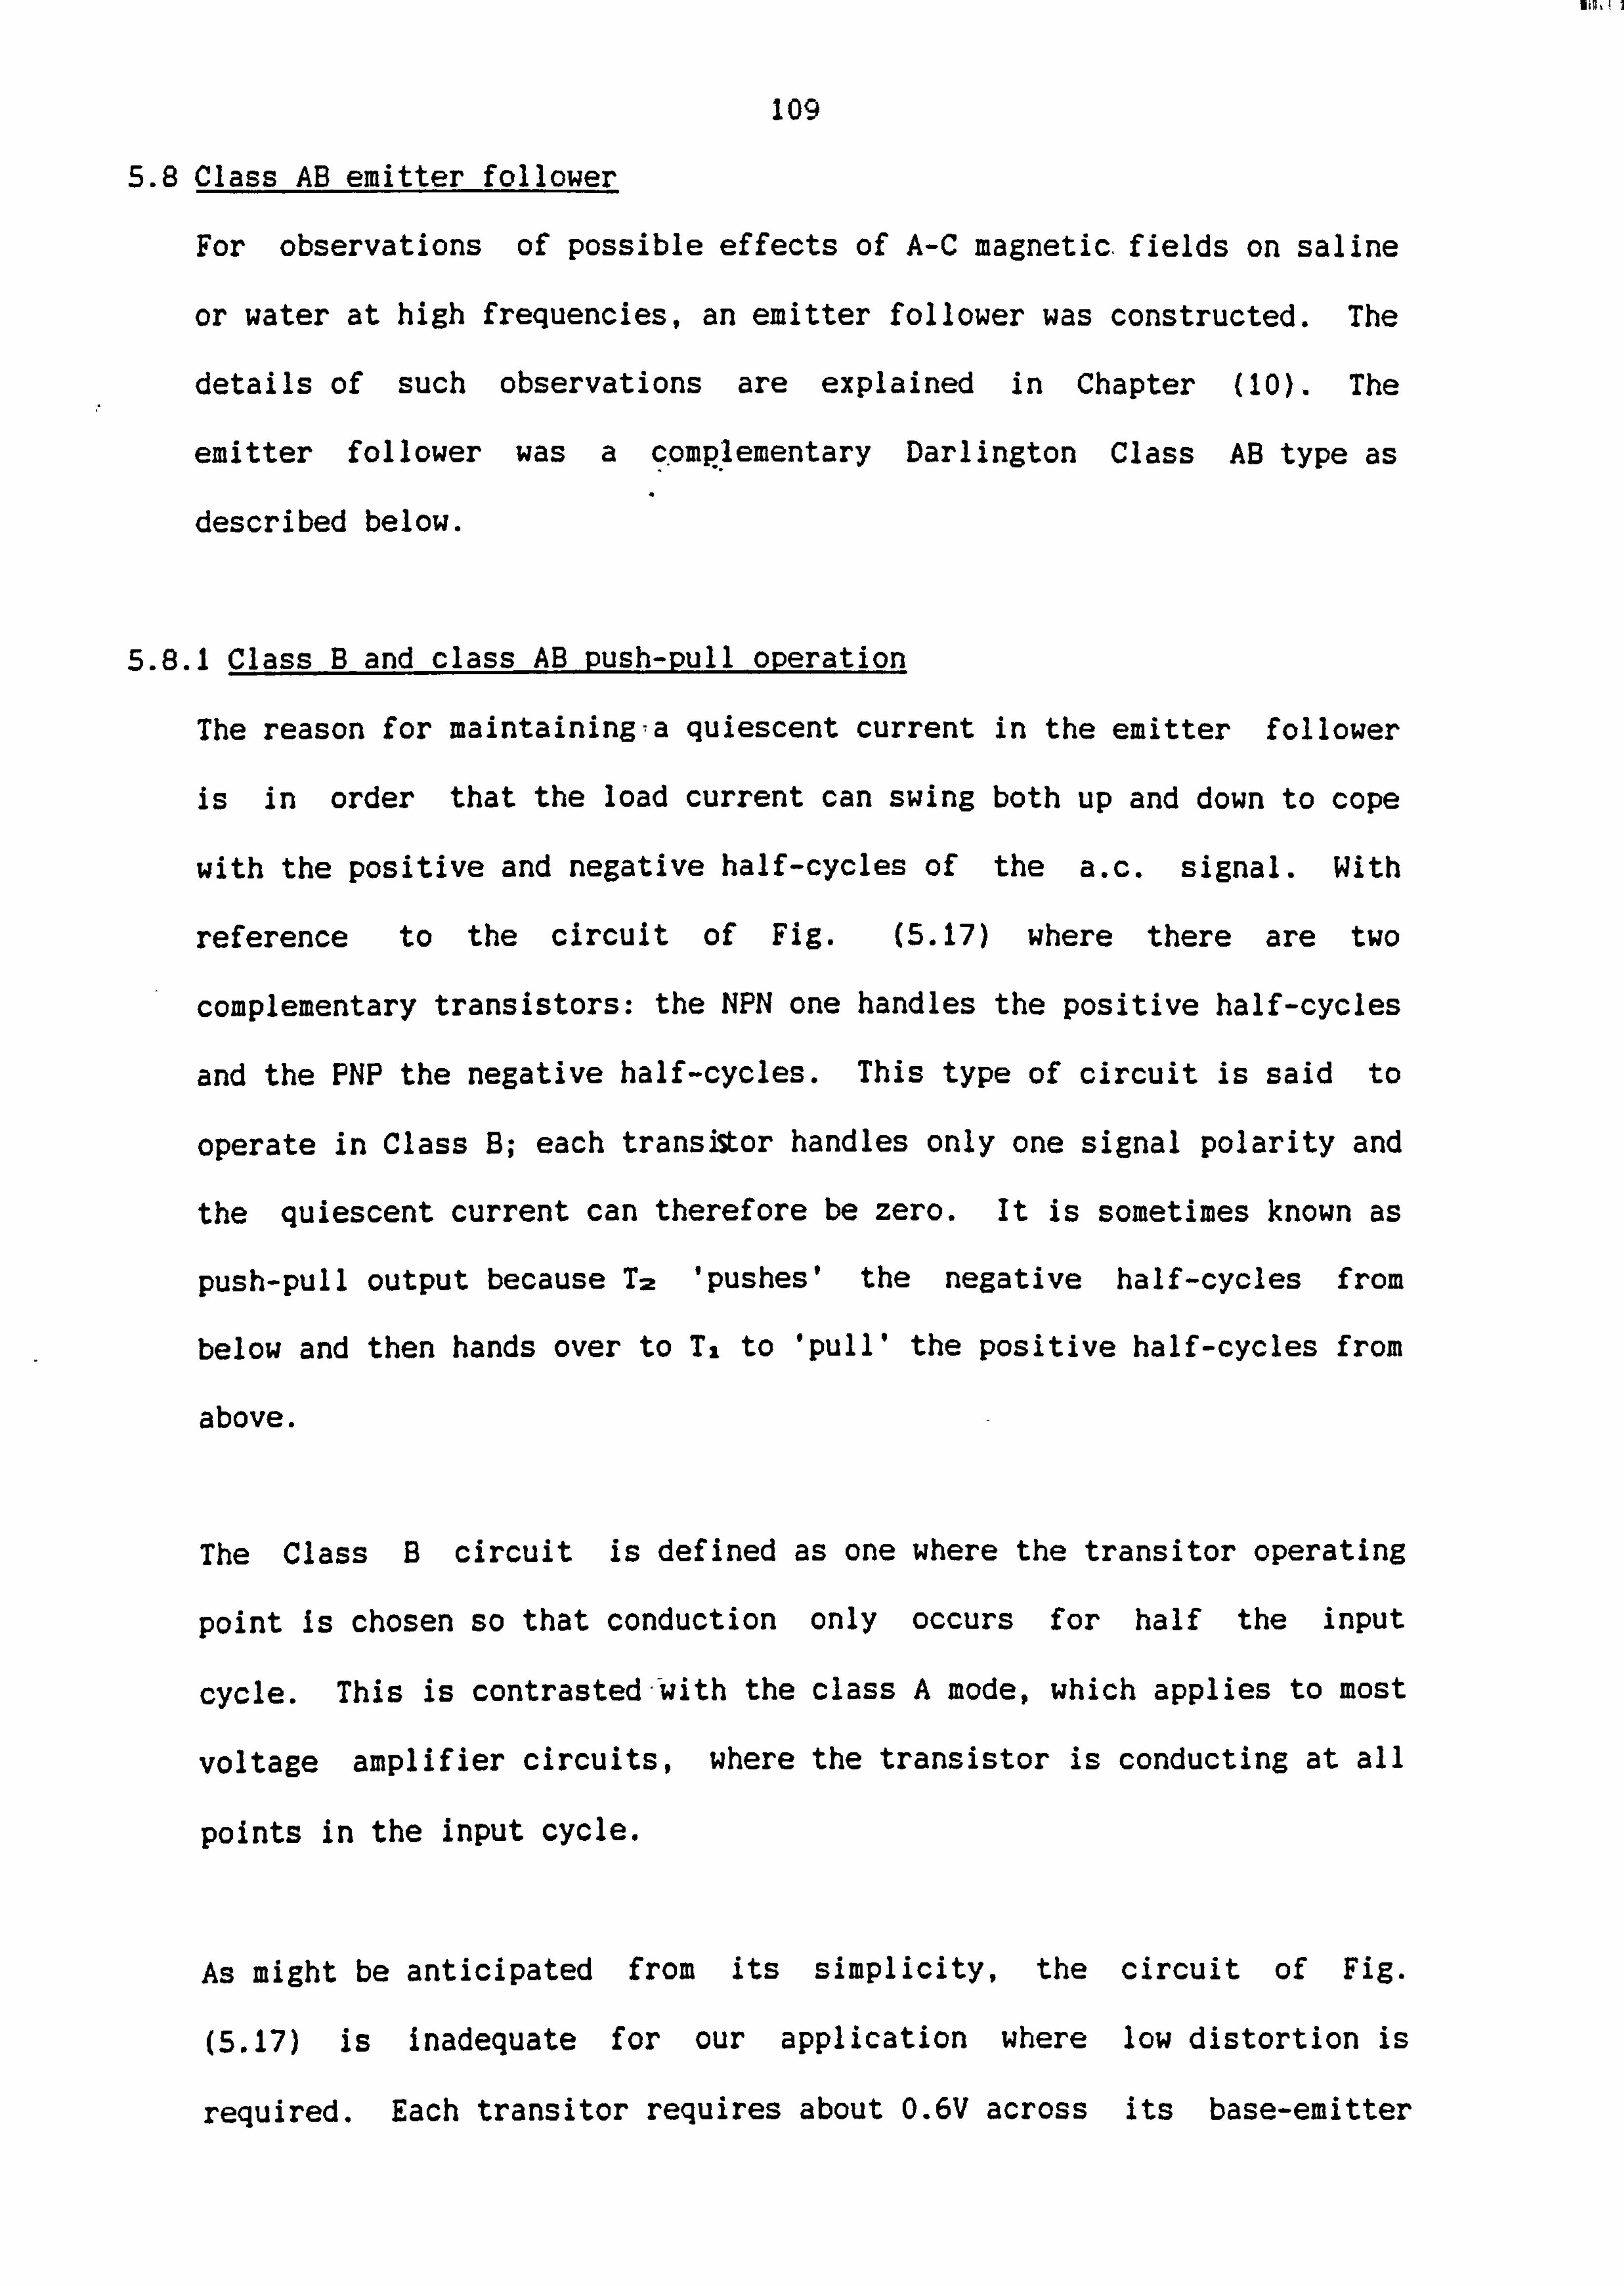
gig, 11
109
5.8 Class AB emitter follower
For observations of possible effects of A-C magnetic. fields on saline
or water at high frequencies, an emitter follower was constructed. The
details of such observations are explained in Chapter (10). The
emitter follower was a c. ompýlementary Darlington Class AB type as
described below.
5.8.1 Class B and class AB Push-pull operation
The reason for maintaining-, a quiescent current in the emitter follower
is in order that the load current can swing both up and down to cope
with the positive and negative half-cycles of the a. c. signal. With
reference to the circuit of Fig. (5.17) where there are two
complementary transistors: the NPN one handles the positive half-cycles
and the PNP the negative half-cycles. This type of circuit is said to
operate in Class B; each transistor handles only one signal polarity and
the quiescent current can therefore be zero. It is sometimes known as
push-pull output because T2 'pushes' the negative half-cycles from
below and then hands over to T, to 'pull' the positive half-cycles from
above.
The Class B circuit is defined as one where the transitor operating
point is chosen so that conduction only occurs for half the input
cycle. This is contrasted-with the class A mode, which applies to most
voltage amplifier circuits, where the transistor is conducting at all
points in the input cycle.
As might be anticipated from its simplicity, the circuit of Fig.
(5.17) is inadequate for our application where low distortion is
required. Each transitor requires about 0.6V across its base-emitter
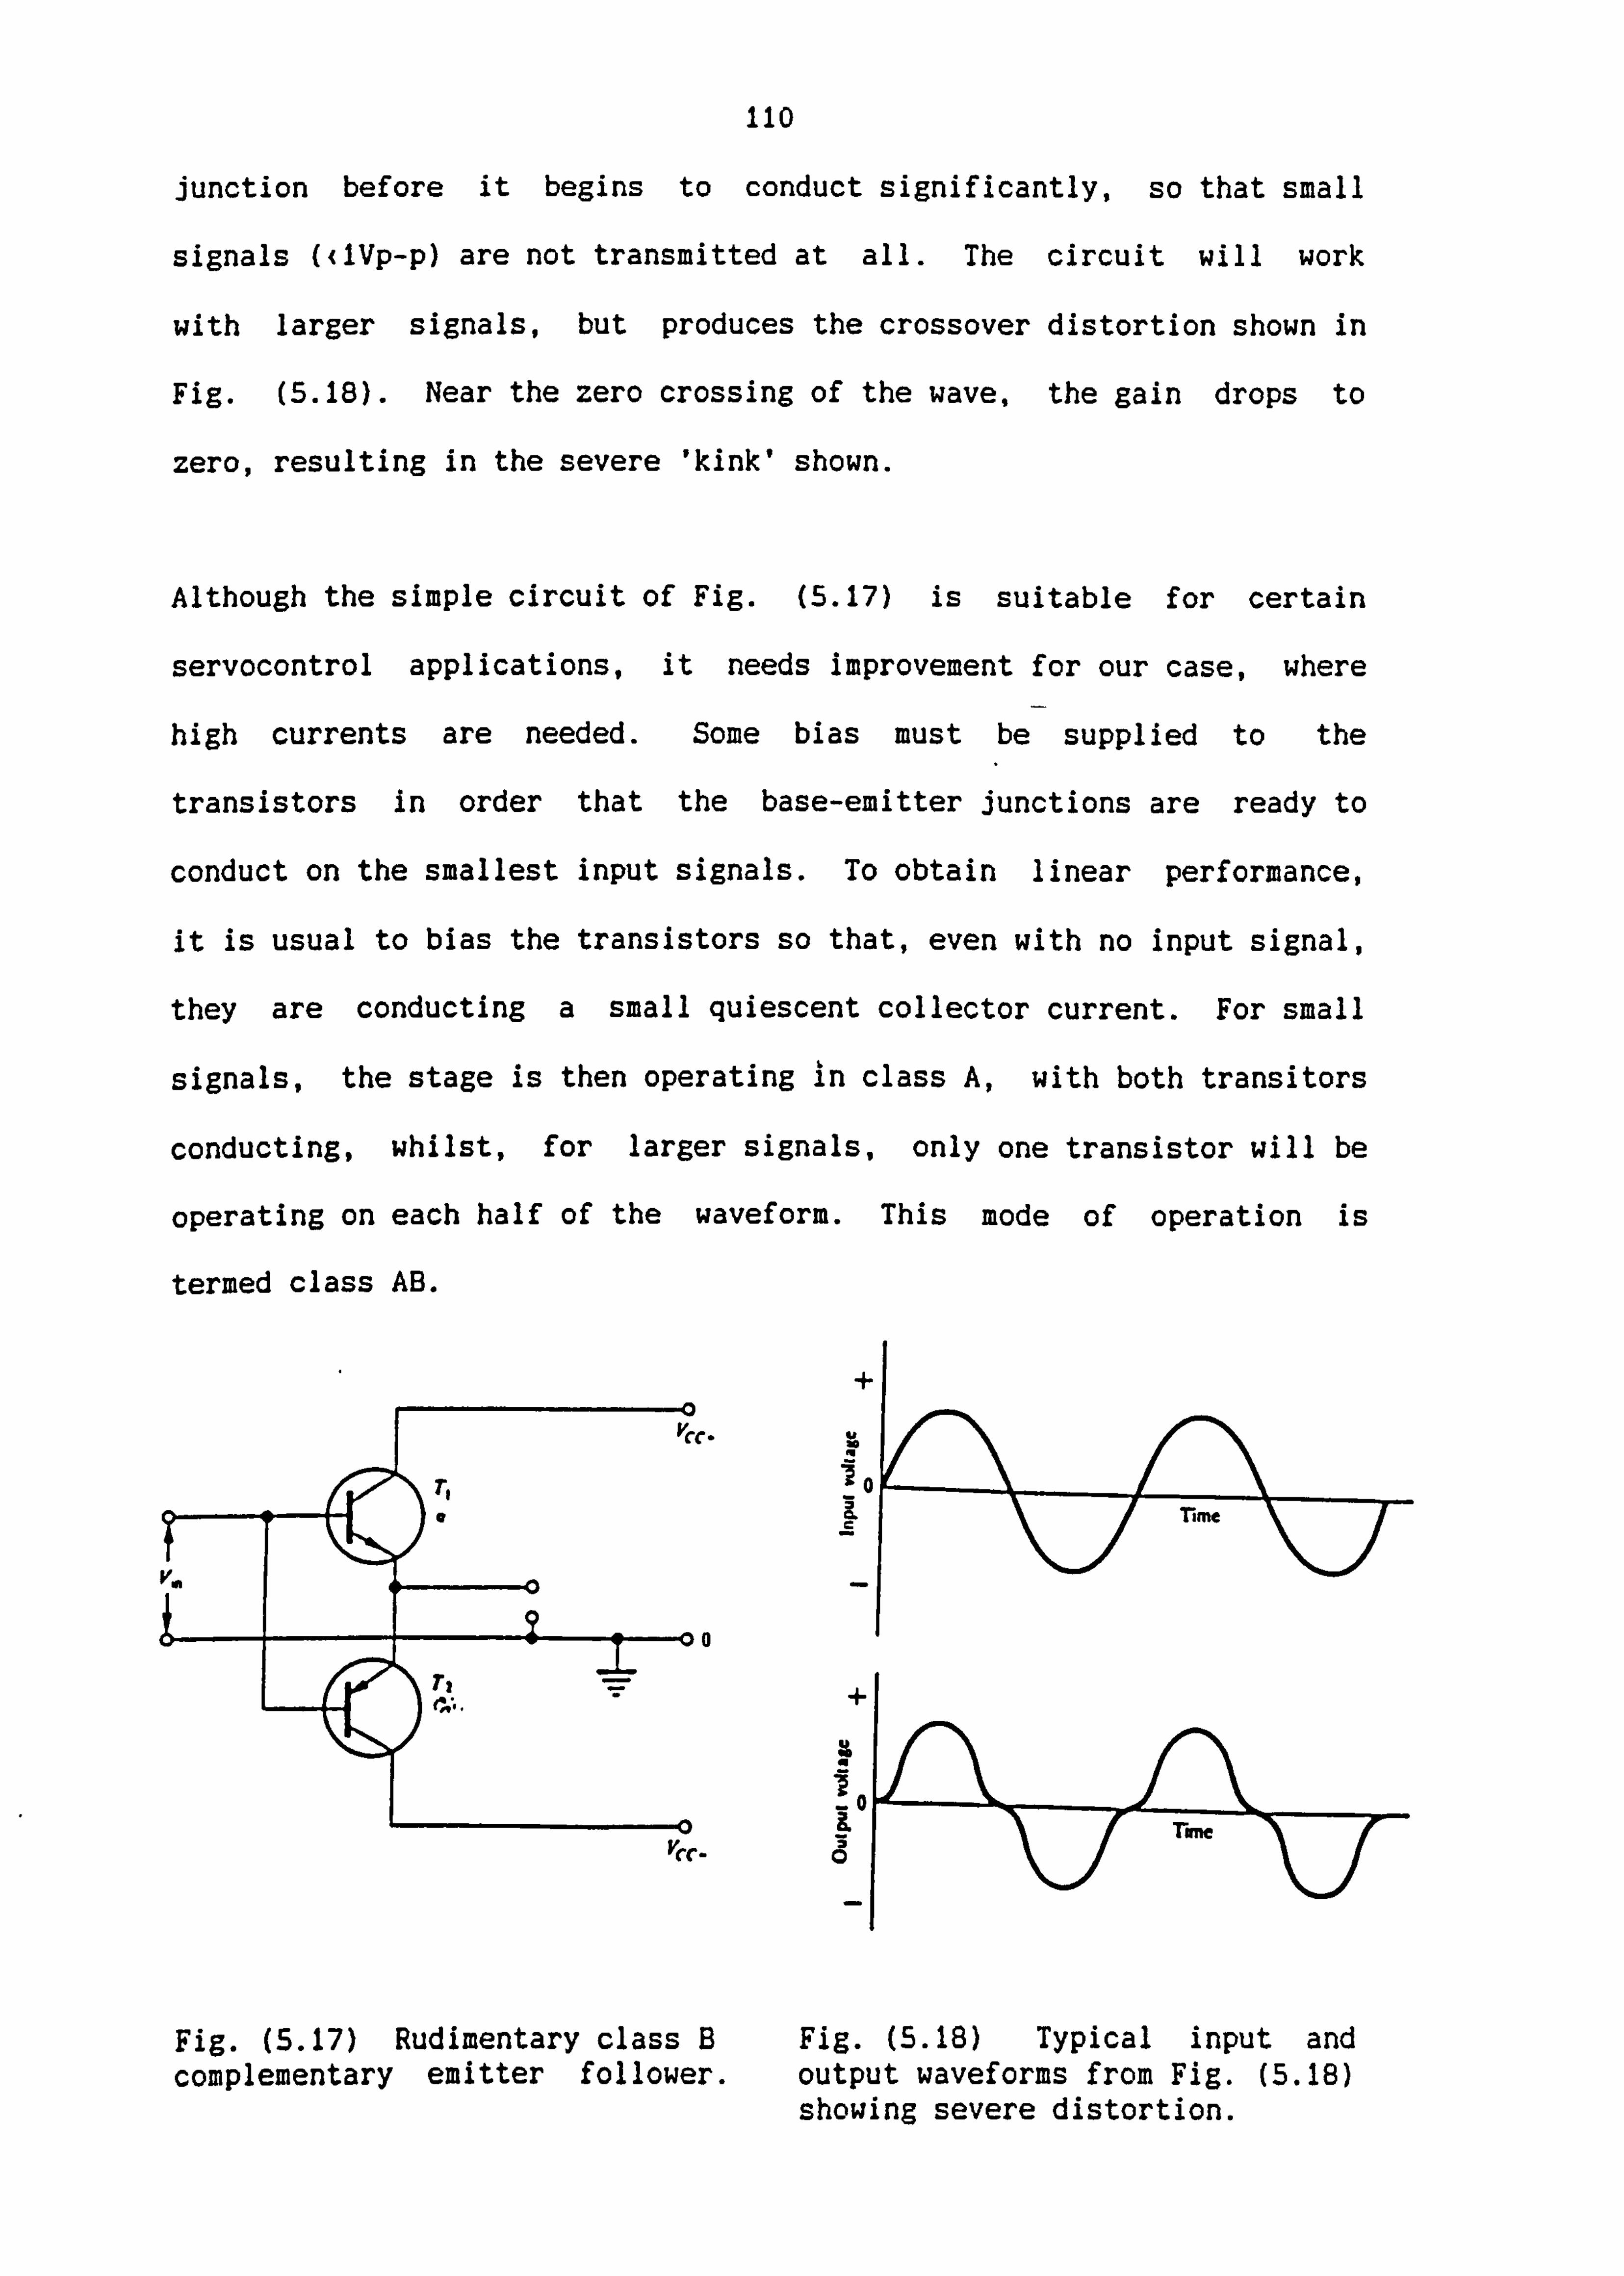
110
junction before it begins to conduct significantly, so that small
signals ((lVp-p) are not transmitted at all. The circuit will work
with larger signals, but produces the crossover distortion shown in
Fig. (5.18). Near the zero crossing of the wave, the gain drops to
zero, resulting in the severe 'kink' shown.
Although the simple circuit of Fig. (5.17) is suitable for certain
servocontrol applications, it needs improvement for our case, where
high currents are needed. Some bias must be supplied to the
transistors in order that the base-emitter junctions are ready to
conduct on the smallest input signals. To obtain linear performance,
it is usual to bias the transistors so that, even with no input signal,
they are conducting a small quiescent collector current. For small
signals, the stage is then operating in class A, with both transitors
conducting, whilst, for larger signals, only one transistor will be
operating on each half of the waveform. This mode of operation is
termed class AB.
+
0
vcc_
+
0
Fig. (5.17) Rudimentary class B Fig. (5.18) Typical input and complementary emitter follower. output waveforms from Fig. (5.18)
showing severe distortion.
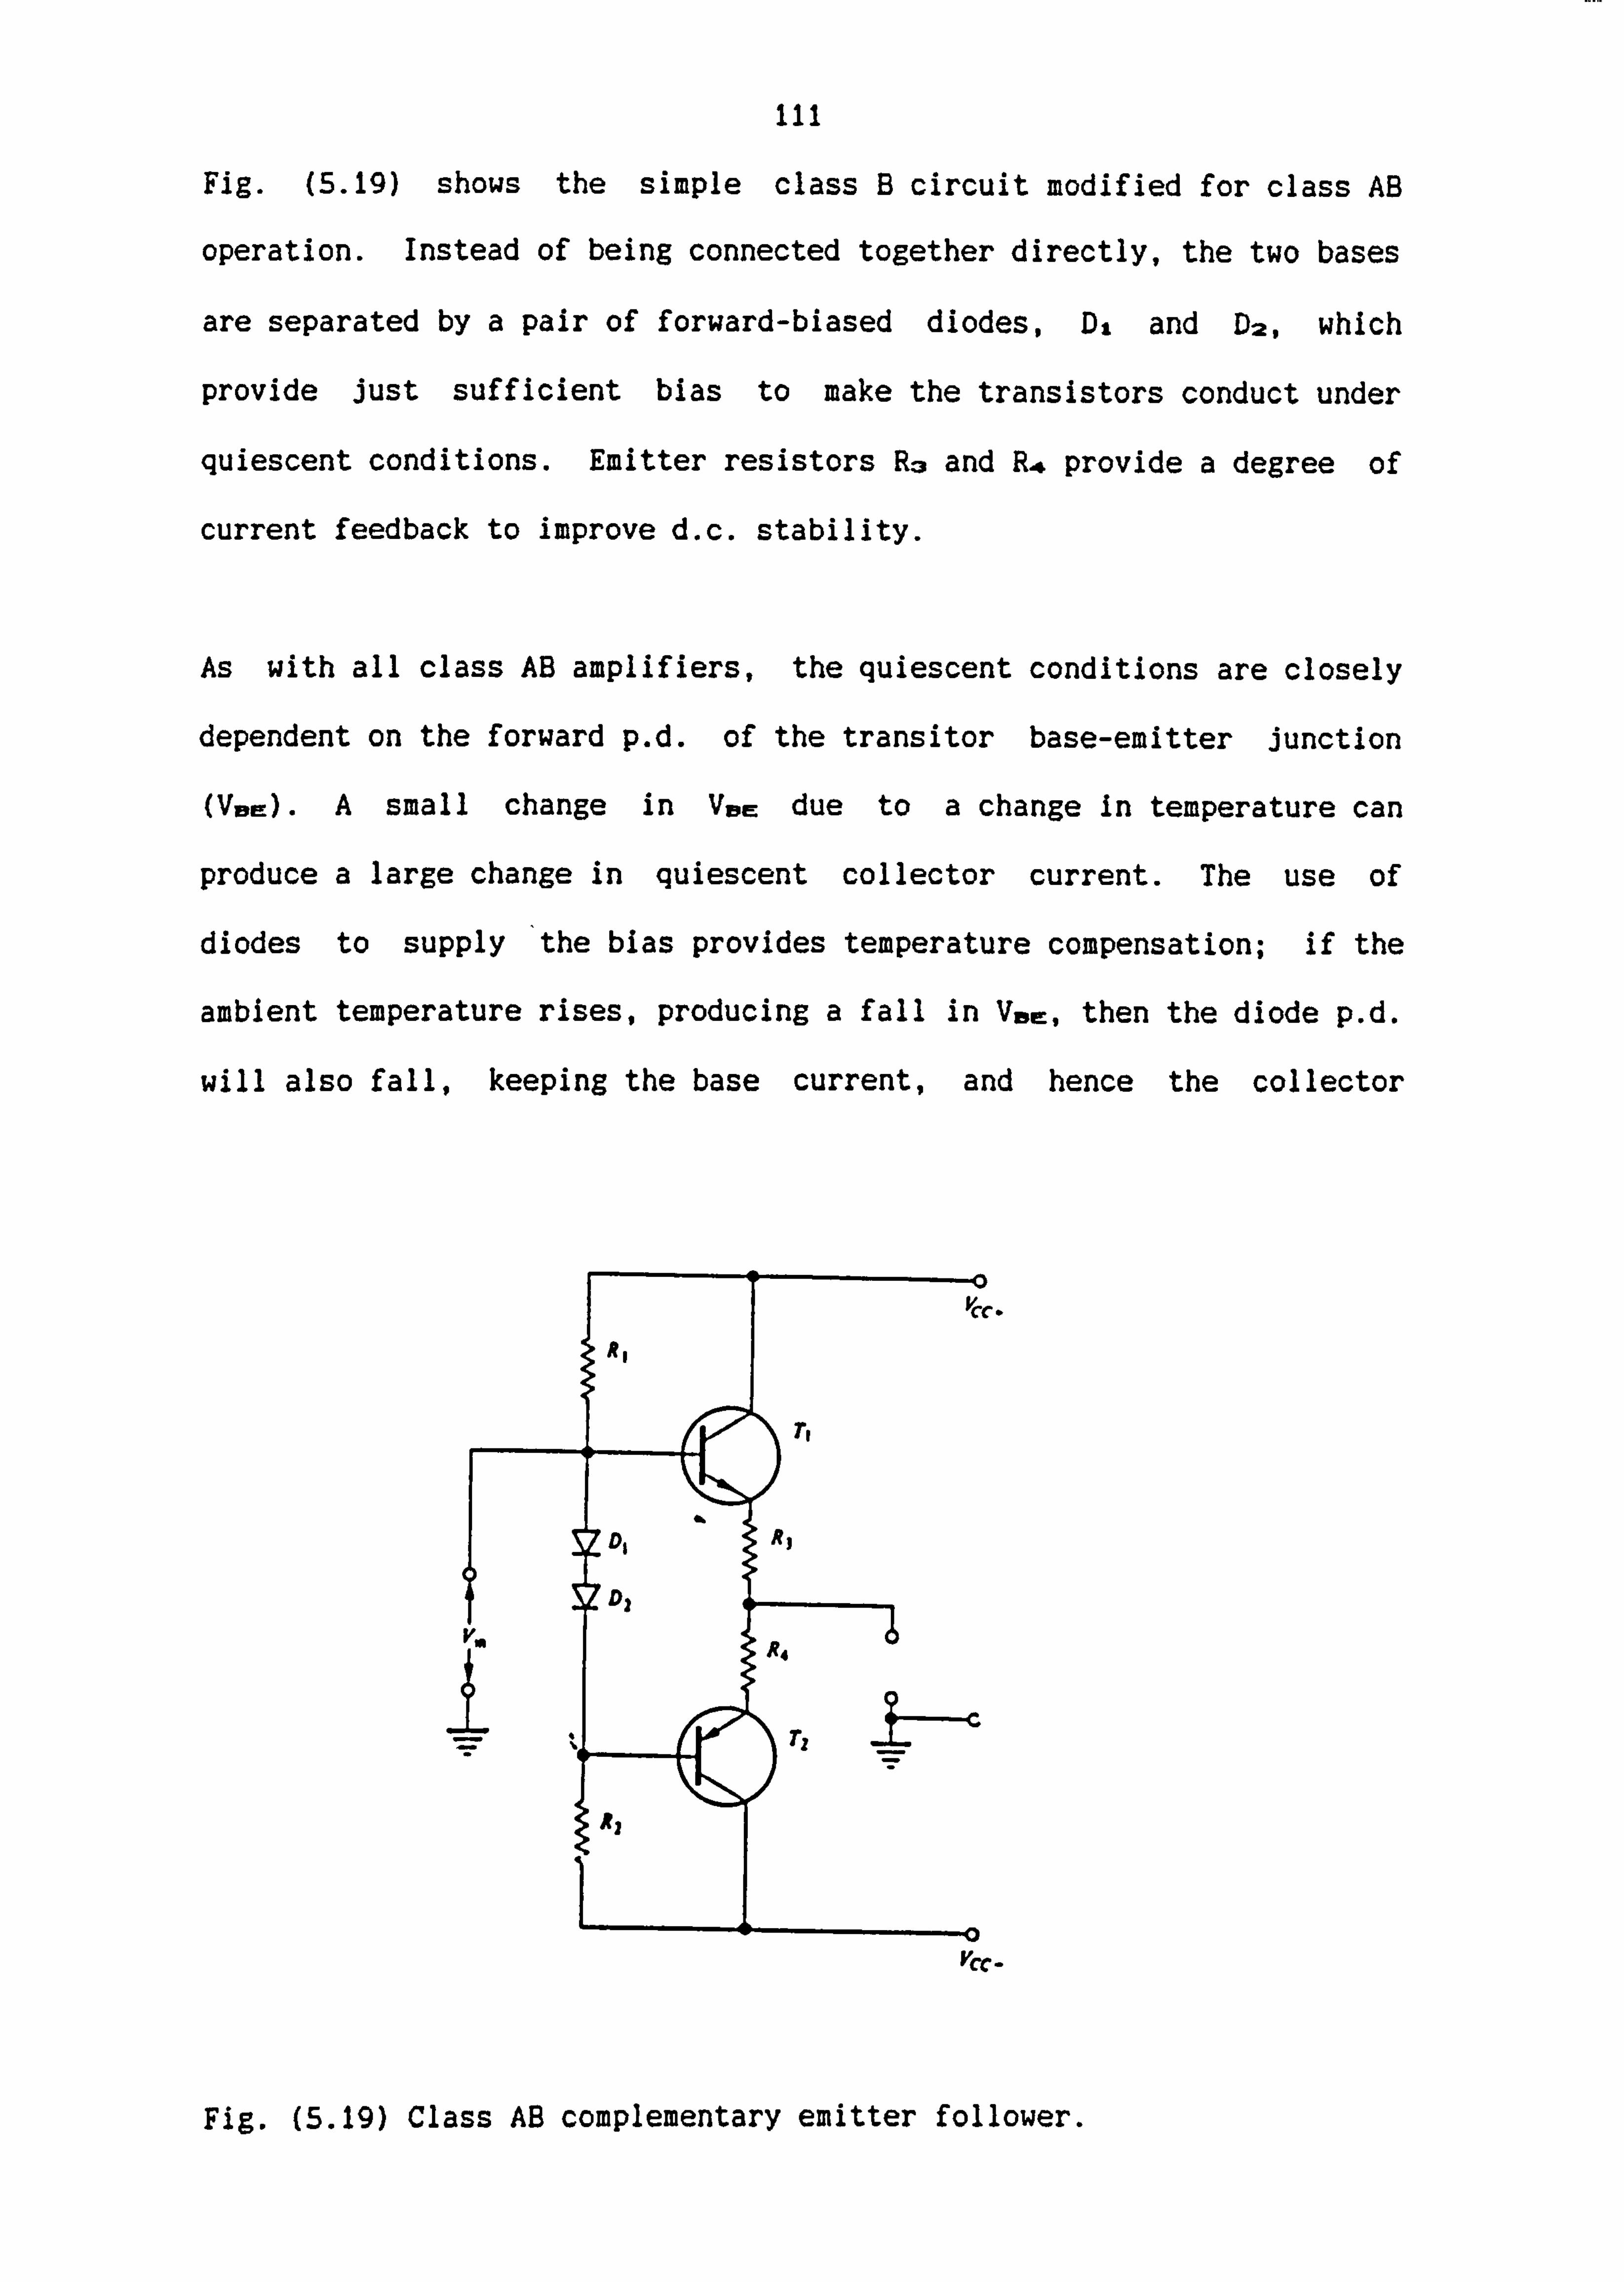
ill
Fig. (5.19) shows the simple class B circuit modified for class AB
operation. Instead of being connected together directly, the two bases
are separated by a pair of forward-biased diodes, D, and D2, which
provide just sufficient bias to make the transistors conduct under
quiescent conditions. Emitter resistors R3 and R4 provide a degree of
current feedback to improve d. c. stability.
As with all class AB amplifiers, the quiescent conditions are closely
dependent on the forward p. d. of the transitor base-emitter junction
(VoE). A small change in Vve due to a change in temperature can
produce a large change in quiescent collector current. The use of
diodes to supply the bias provides temperature compensation; if the
ambient temperature rises, producing a fall in Vae, then the diode p. d.
will also fall, keeping the base current, and hence the collector
vcr -
Fig. (5.19) Class AB complementary emitter follower.
112
current relatively constant. Ideally, the diodes o1re sited close to
the transistors in order to be subject to the same temperature
fluctuations.
In order to accommodate variations in transistor VBF- it is desirable to
be able to adjust quiescent current manually to the required value.
The modification of Fig. (5.20(a)) provides this facility. The bias
voltage is derived from a transistor (T3) in a 'Vim multiplier' circuit
shown in isolation in Fig. (5.20(b)). This latter part of the circuit
is really a small voltage amplifier, with its own VDF- as input and
having negative feedback applied via the potential divider R, and R,.
Here feedback fraction R, /(R. + R, ). The output VolAs, is
therefore given by
zVjm = Vag(R. + R,,, ) 0 R,,
In the circuit of Fig. (5.20(a)), potentiometer Re, is adjusted for a
quiescent current. Temperature compensation is again present because
the Vve of T3 will change by the same factor as the Vom of T, and Tz
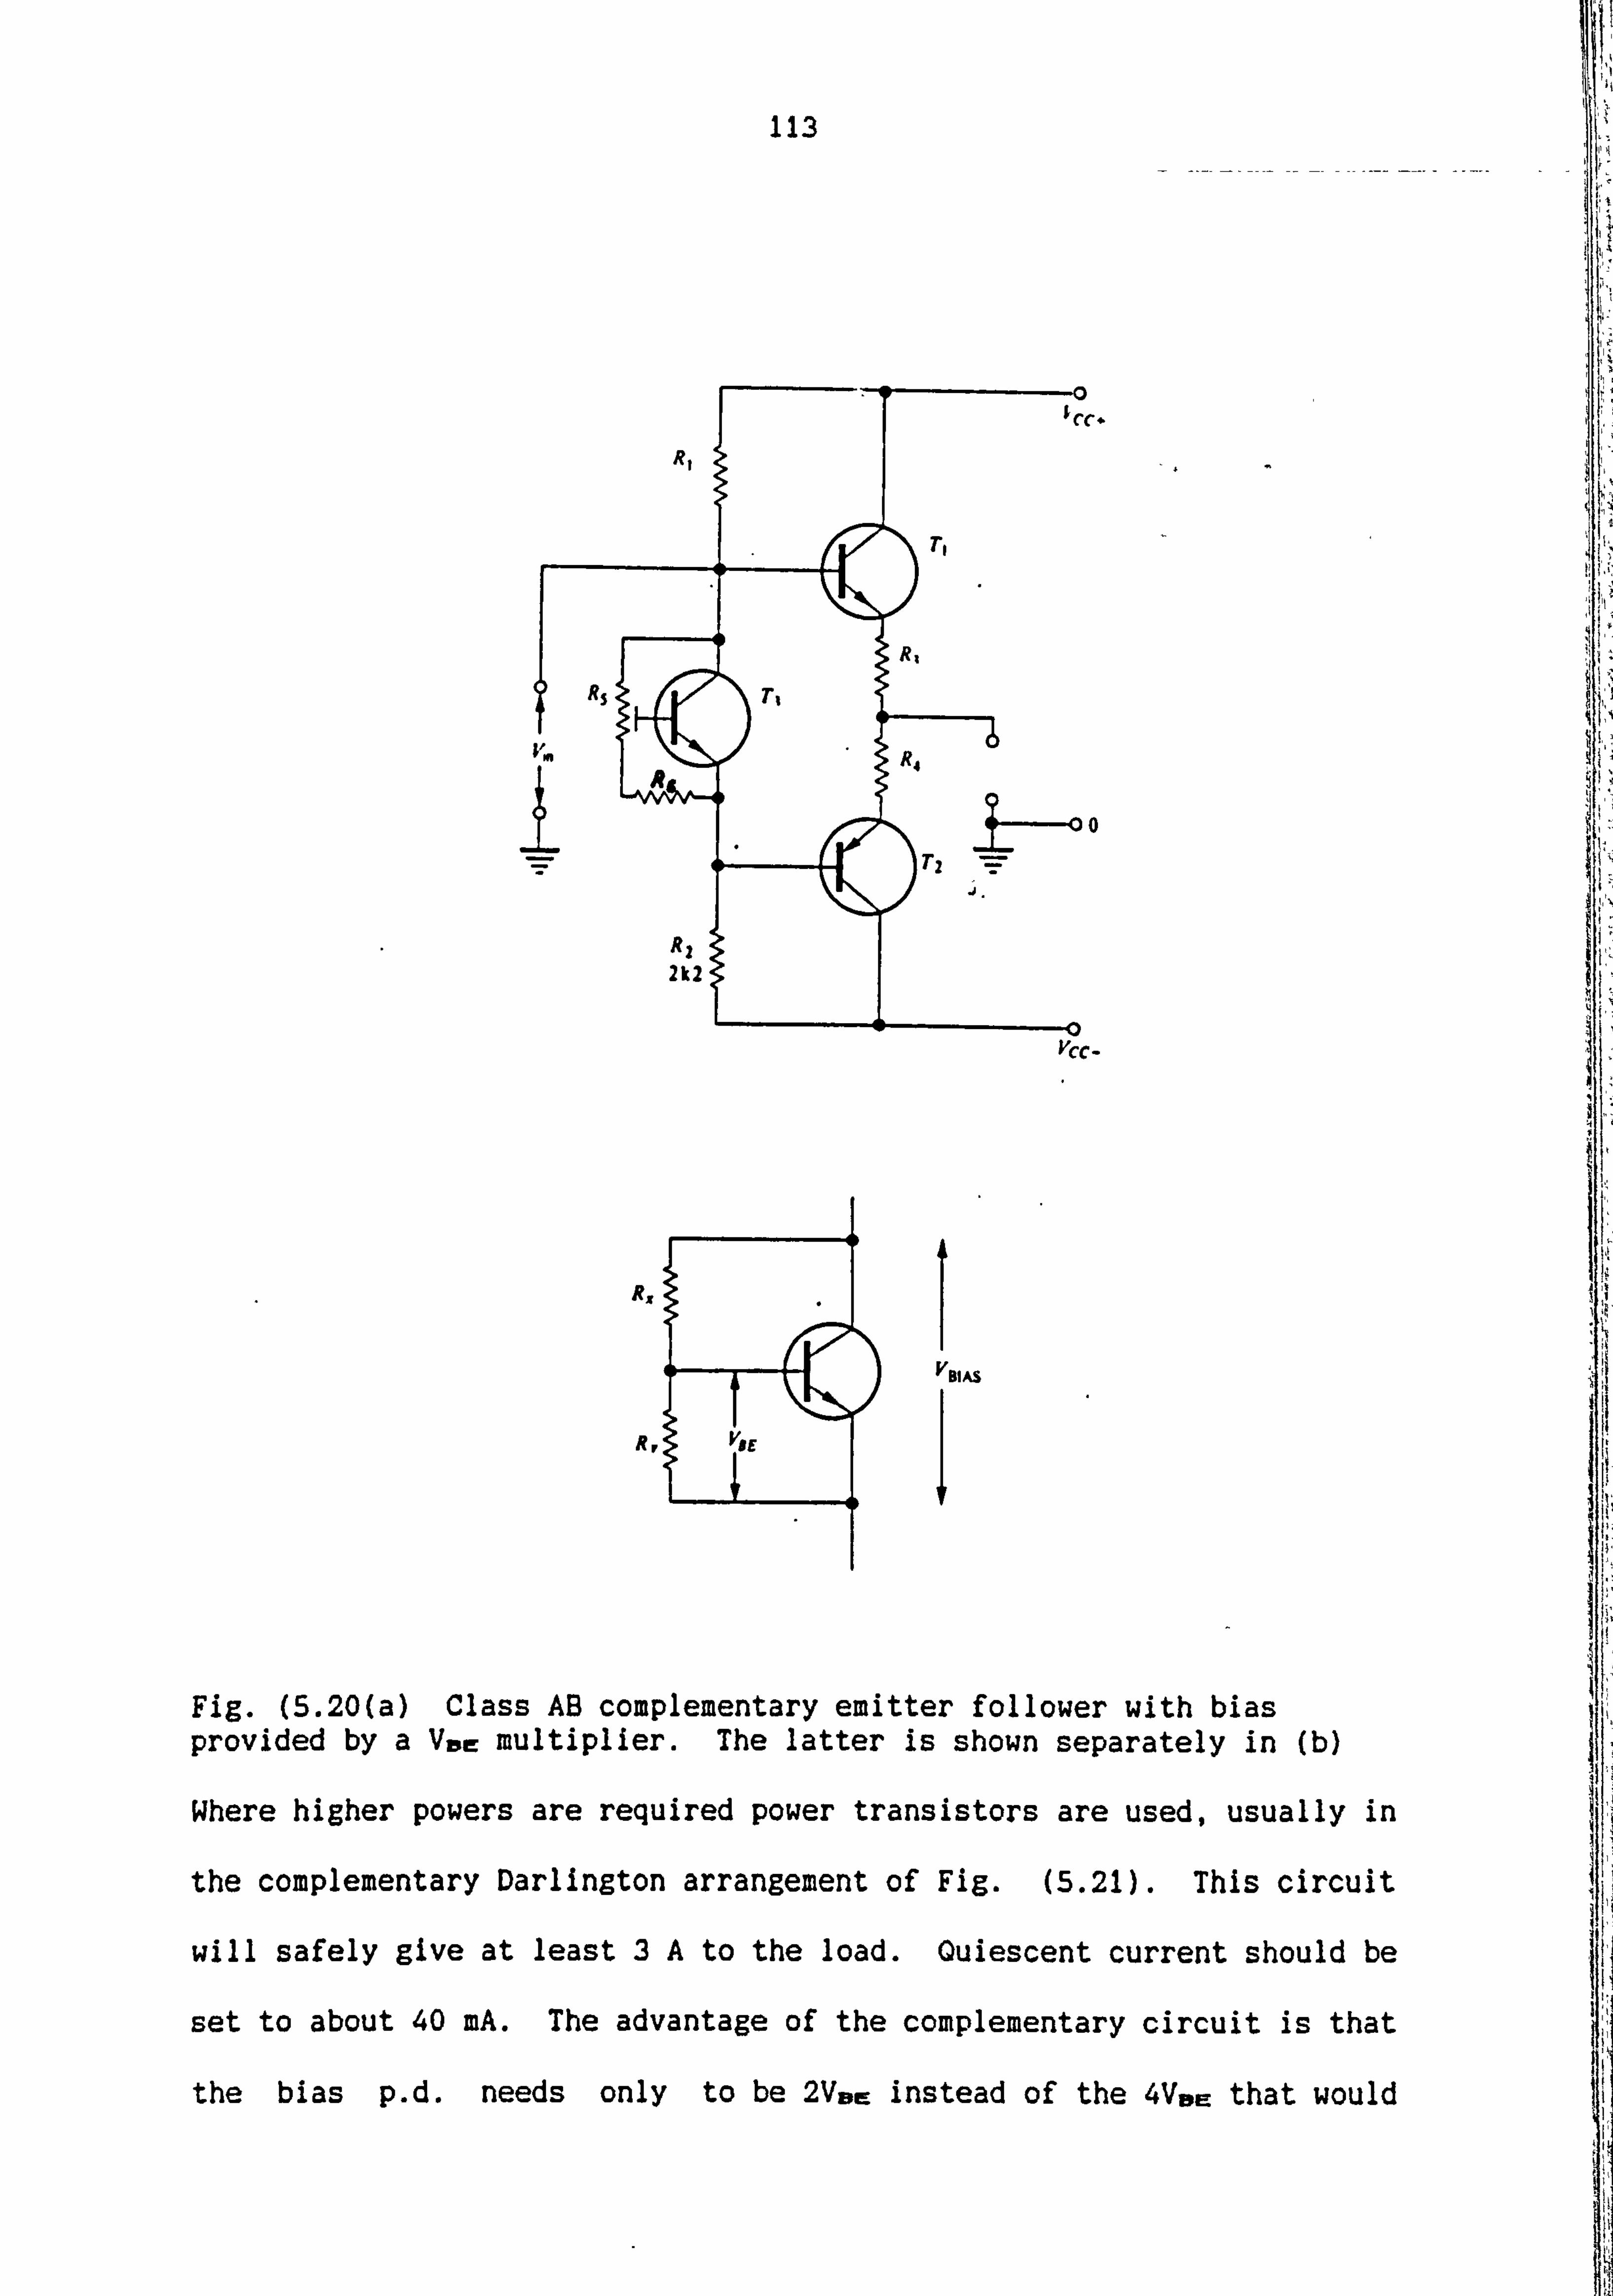
113
r* .
0
Ycc-
R.,
R,
VBIAS
I
Fig. (5.20(a) Class AS complementary emitter follower with bias provided by a Vne multiplier. The latter is shown separately in (b)
Where higher powers are required power transistors are used, usually in
the complementary Darlington arrangement of Fig. (5.21). This circuit
will safely give at least 3A to the load. Ouiescent current should be
set to about 40 mA. The advantage of the complementary circuit is that
the bias p. d. needs only to be 2VDm instead of the 4VOE that would
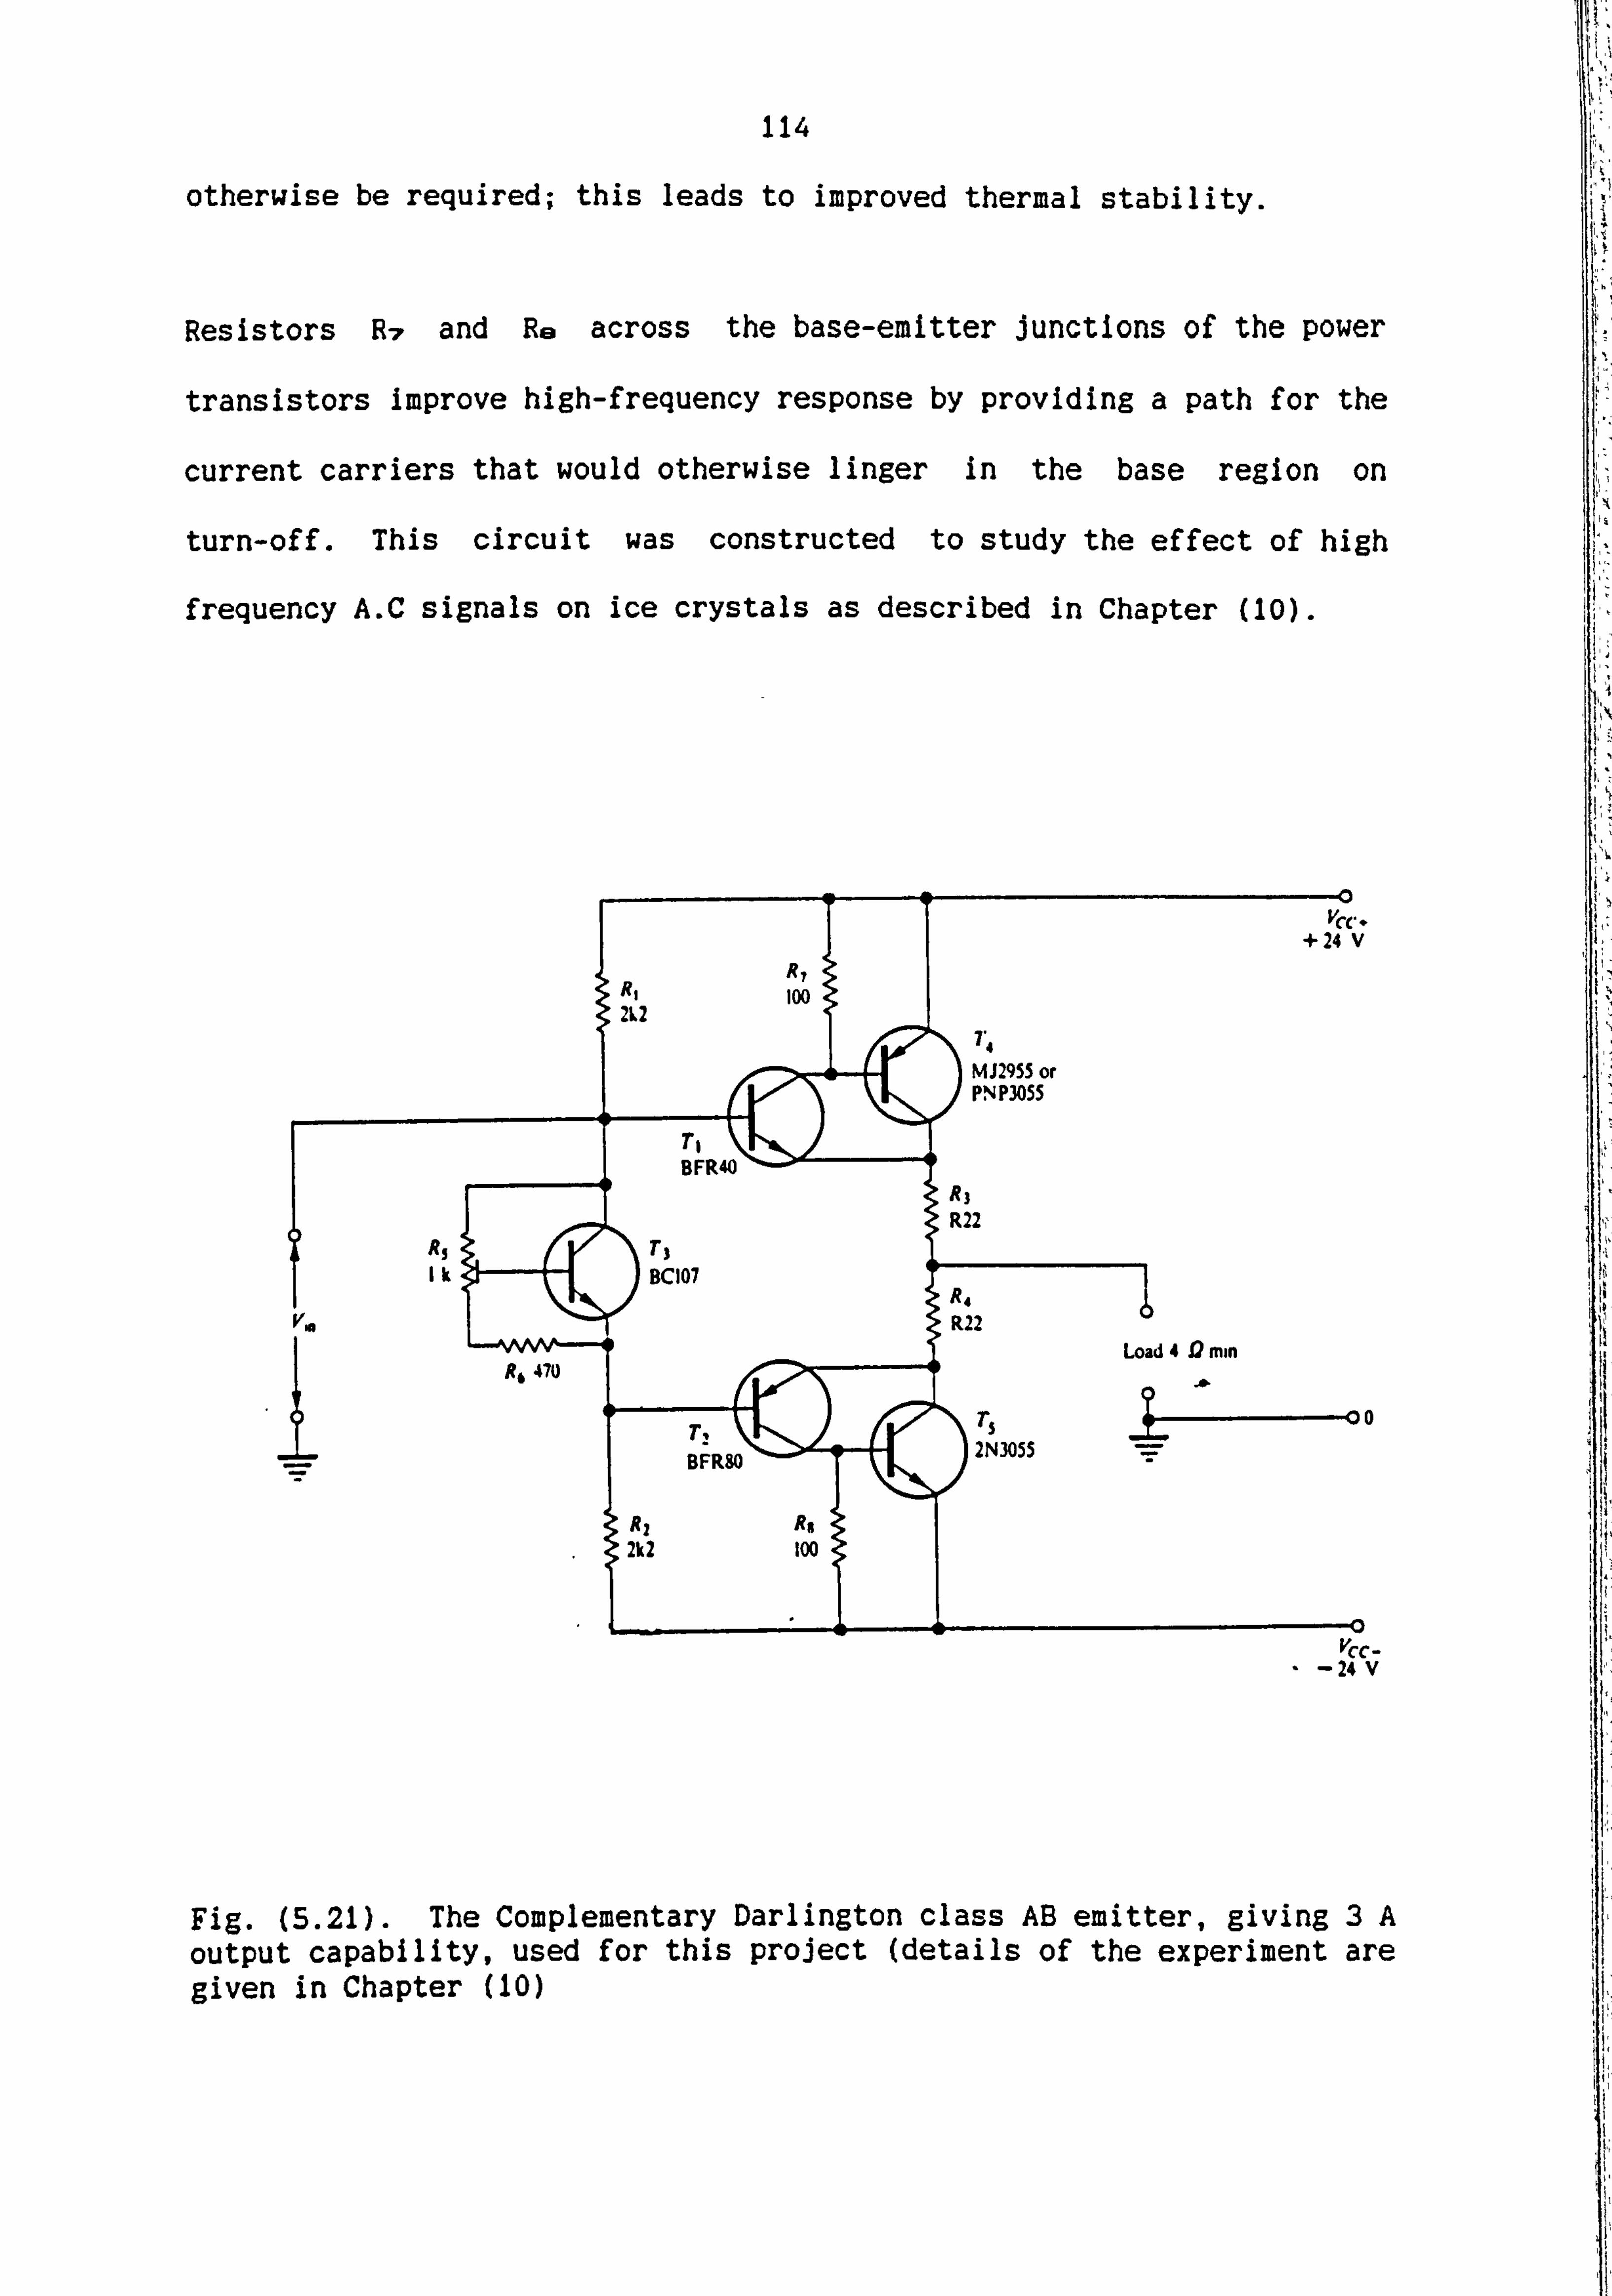
114
otherwise be required; this leads to improved thermal stability.
Resistors R7 and Re across the base-emitter junctions of the power
transistors improve high-frequency response by providing a path for the
current carriers that would otherwise linger in the base region on
turn-off. This circuit was constructed to study the effect of high
frequency A. C signals on ice crystals as described in Chapter (10).
Vcc- -24 V
Fig. (5.21). The Complementary Darlington class AB emitter, giving 3A output capability, used for this project (details of the experiment are given in Chapter (10)

CHAPTER 6
CONSTRUCTION OF THE ELECTRON BEAN GUN
115
6.1 Introduction
This part of the programme alms to study the effects on cellular
adhesion of Leishmania parasites JL. major) cells of e-bombardment of
polystyrene petri dishes. The first step was the construction and
operation of an electron gun.
It was also intended to focus the electron beam produced by such a gun
into a fine beam for localised bombardment of the polystyrene petri
dishes. The electron gun as constructed had to be a low energy
electron gun in view of the fact that at high voltage X-rays are
generated in the apparatus which are hazardous to persons nearby and
difficult to screen in a confined space. However, measurements were
taken using a gun which did cover high energy levels as well as low. -
This high power electron gun differs in design from that constructed
for low energy, and, whilst existing in the Department, was not always
easily made available for this project.
6.2 Requirements for constructing the electron Run
An electron gun is a device which accelerates, controls and focusses a
beam of electrons. The requirements of any electron gun are:
a) An electron source which usually consists of a heated filament of
tungsten on tantalum acting as a cathode and a source of free
electrons.
b) A potential difference to accelerate the free electrons from the
source towards the anode, this potential difference is maintained
between the source and the anode.
116
c) An electron optical system which accepts a broad beam of electrons
and focuses them onto a target.
The electron gun is operated in a high vacuum below 10-1 torr where the
control of the beam is easier and the density higher.
There are many varieties of electron gun which could be used for beam
generation at different energies. Simpson and Kuyarr [I] have designed
an electron gun which supplies 10A of current at 30 eV. They used a
multi-stage technique in which electrons are extracted from a source
and are subsequently decelerated to the required final energy.
The present gun design is similar to one designed by Pierce [21, which
supplies (100-150) mA current at (2-10) KeV. This gun has high
efficiency ' 99.5-99.99% and operates with a space-charge limited
cathode which produces a uniform current density over the beam.
The electron gun used in this projectiýbased on a two piece gun of the
above design and is shown in Fig. (6.1).

117
H. T. ELECTRODE
TUNGSTEN FILAMENT
CRYSTAL SERAMIC
+K VOLTS
ee ee ee ýý
I/I
-20OVI
I
-200V
Itittit
eeee
-IS2T; ýAýLESS
STEEL DISC
MOLYBDENUM
LOW VOLTAGE ELECTRODE
STAINLESS STEEL WIRE
ot- 200 V
e e e
OR +200V
eeee
+200V
Fig. (6.1) Schematic diagram of an electron gun constructed in this project
There are two electrodes, one based to several thousand volts positive
(HT), while the other is held at ground or + 200 volts.
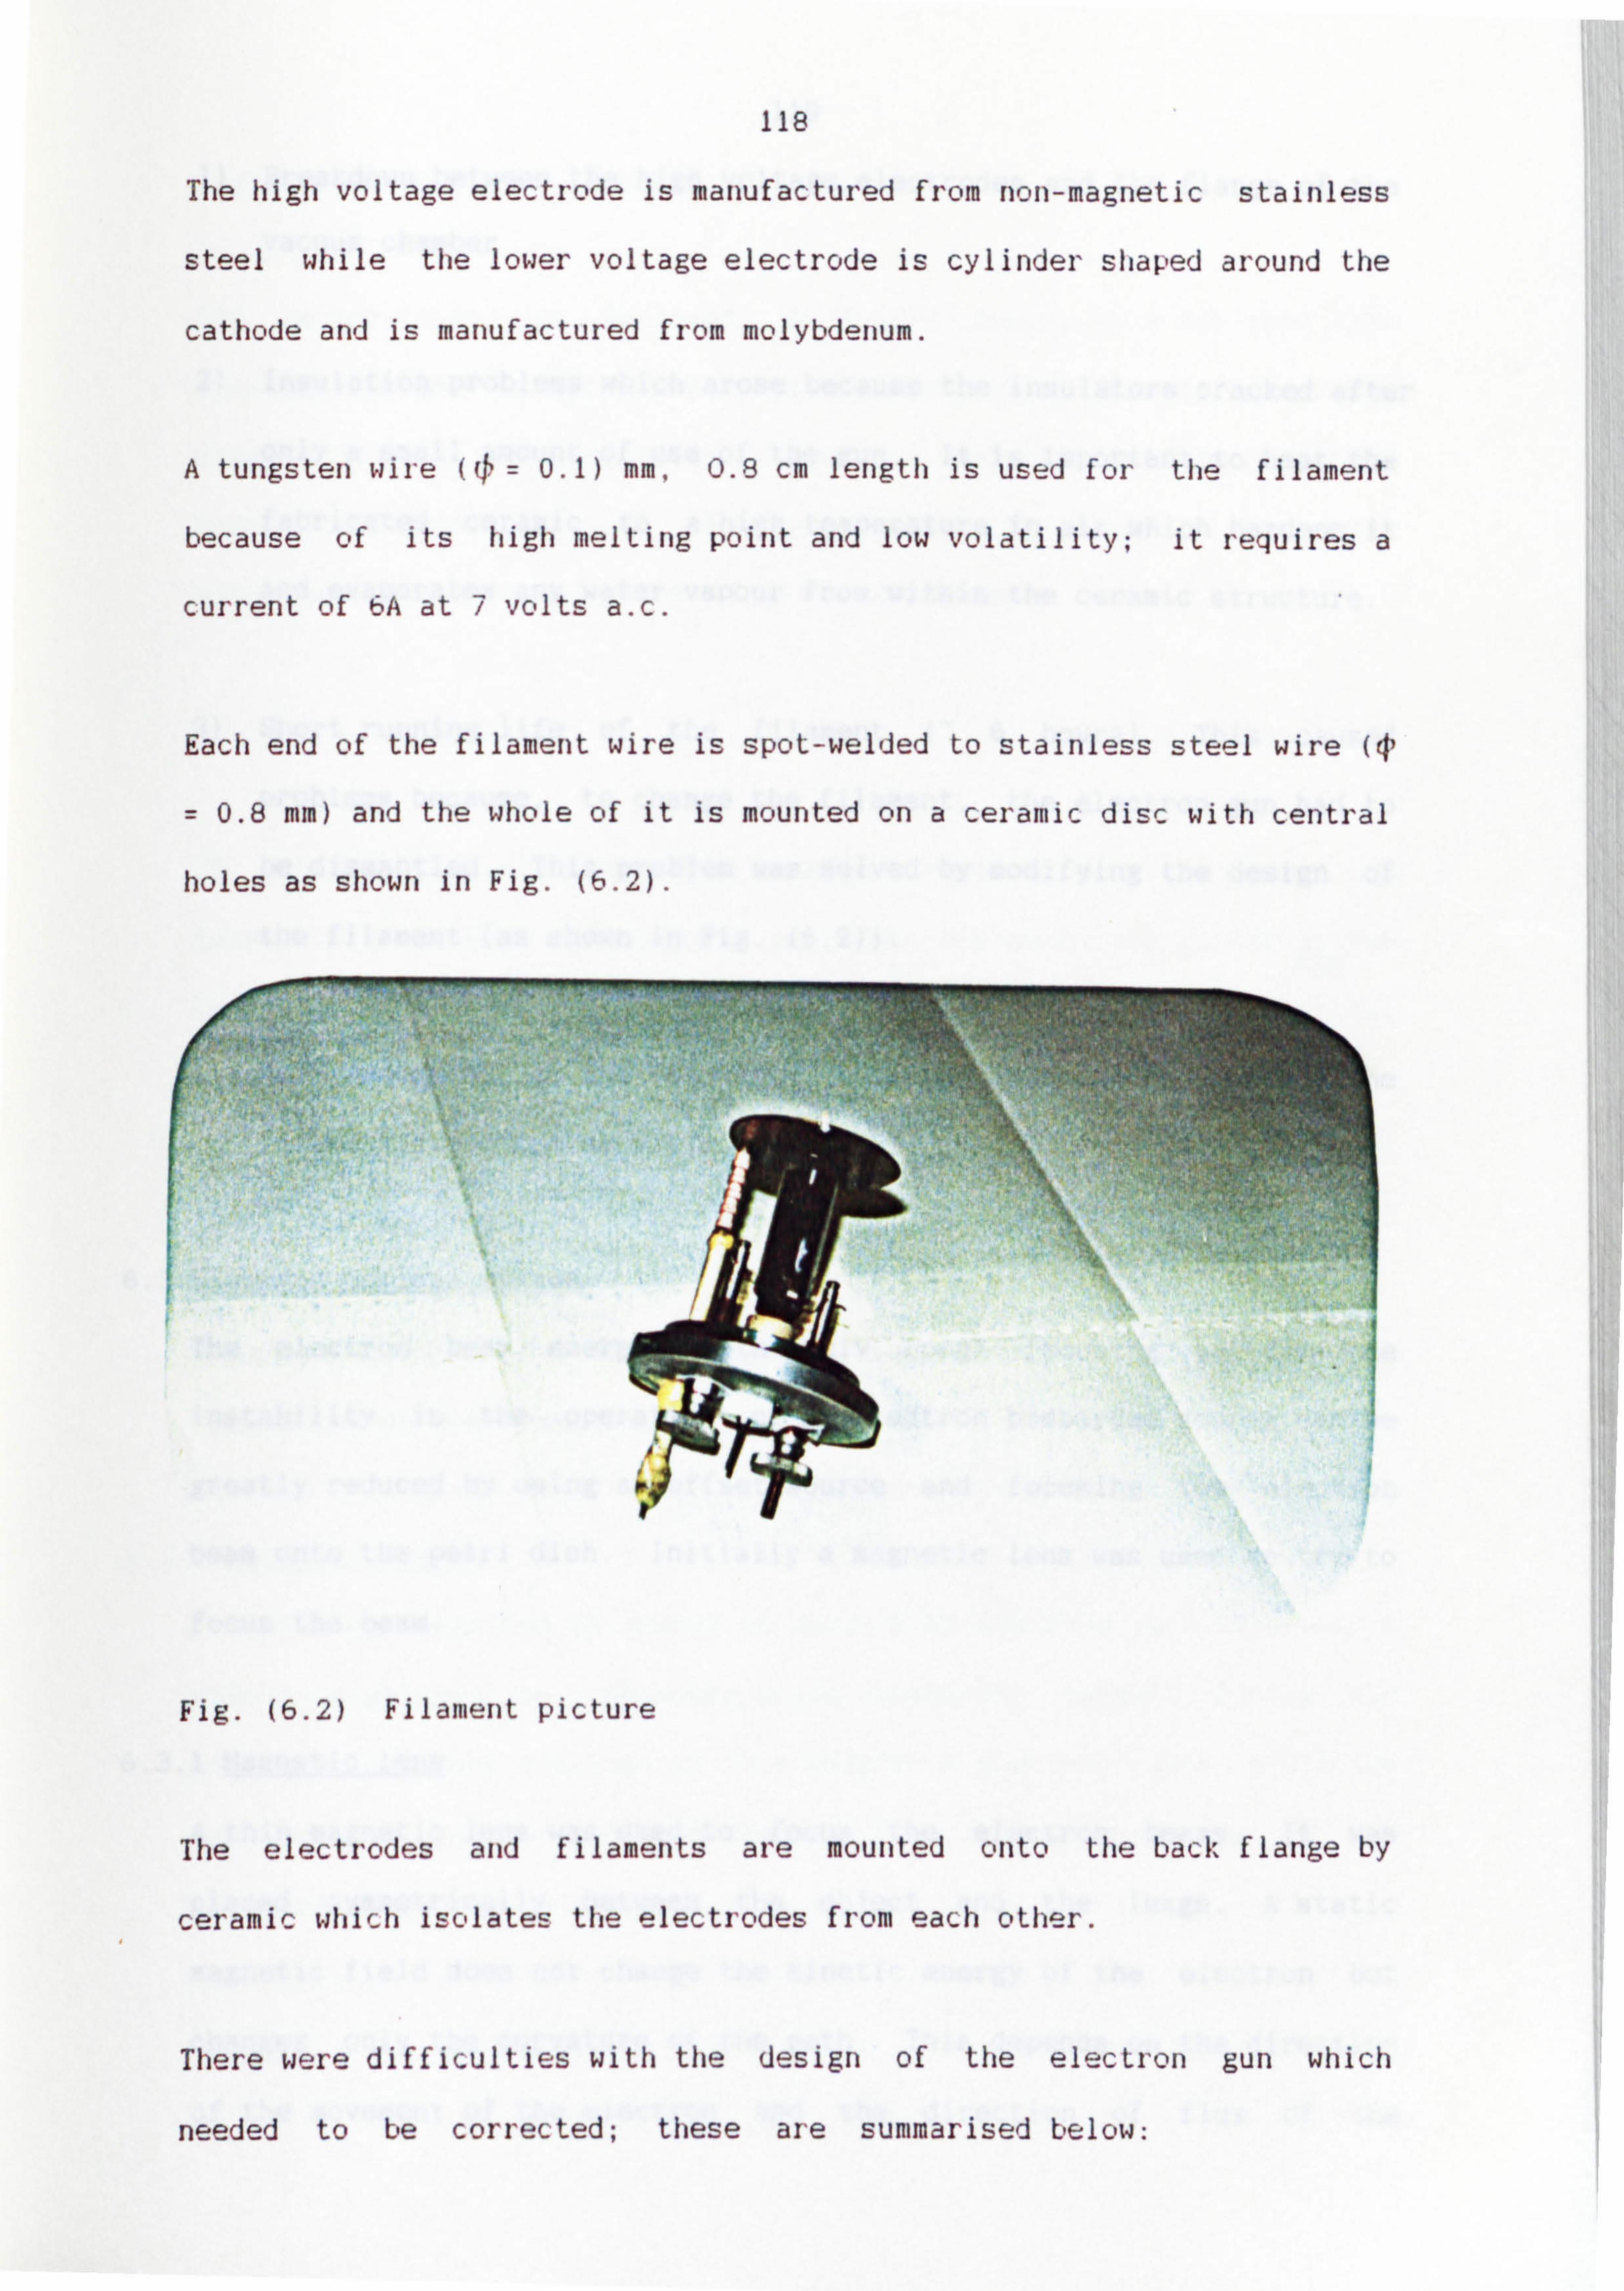
118
The high voltage electrode is manufactured from non-magnetic stainless
steel while the lower voltage electrode is cylinder shaped around the
cathode and is manufactured from molybdenum.
A tungsten wire Q=0.1) mm, 0.8 cm length is used for the filament
because of its high melting point and low volatility; it requires a
current of 6A at 7 volts a. c.
Each end of the filament wire is spot-welded to stainless steel wire (4)
= 0.8 mm) and the whole of it is mounted on a ceramic disc with central
holes as shown in Fig. (6.2).
Fig. (6.2) Filament picture
The electrodes and filaments are mounted onto the back flange by
ceramic which isolates the electrodes from each other.
There were difficulties with the design of the electron gun which
needed to be corrected; these are summarised below:

119
1) Breakdown between the high voltage electrodes and the flange of the
vacuum chamber
2) Insulation problems which arose because the insulators cracked after
only a small amount of use of the gun. It is important to heat the
fabricated ceramic to a high temperature in air which hardens it
and evaporates any water vapour from within the ceramic structure.
3) Short running life of the filament (- 6 hours). This caused
problems because, to change the filament, the electron gun had to
be dismantled. This problem was solved by modifying the design of
the filament (as shown in Fig. (6.2)).
4) Heat produced by the filament. This was improved by changing the
filament structure as explained in (3)
6.3 Electron optical system
The electron beam emerges with only rough focusing because the
instability in the operation of an electron bombarded source can be
greatly reduced by using an offset source and focusing the electron
beam onto the petri dish. Initially a magnetic lens was used to try to
focus the beam.
6.3.1 Magnetic lens
A thin magnetic lens was used to focus the electron beams. It was
placed symmetrically between the object and the image. A static
magnetic field does not change the kinetic energy of the electron but
changes only the curvature of the path. This depends on the direction
of the movement of the electron and the direction of flux of the
120
magnetic field (See section (3.3.2.1)).
800 ampere-turns was employed. A single copper wire was used with
diameter 0.8 mm. It was wound on a cylinder yoke, having an inner
diameter 8.4 cm, outer diameter 10.2 cm and length 4 cm. The number of
turns was nominally 400 (8 layers each 50 turns). The total
magnetomotive force H" generated by the coil was
nI. Equation (6.1)
If all the flux along the axis is concentrated between the object and
image, it gives high efficiency, hence the dimensionless factor Br has
been termed the focusing efficiency under given geometrical
conditions, where B is the flux density of the magnetic field, r is the
radius of curvature of the path of electrons, n is the number of turns,
I is the current andM is the permeability.
This expression indicates the number of ampere-turns required to focus
rays of given momentum (Er)e.
6.3.2 Phosphor screen
The electron beam had an energy of about 5 kV and this is sufficient to
make a bright spot on a phosphor plate bombarded target. During the
experimental work outlined in this chapter a phosphor coated plate was
used to check the focus of the electron beam. The preparation of the
phosphor screen is as follows:
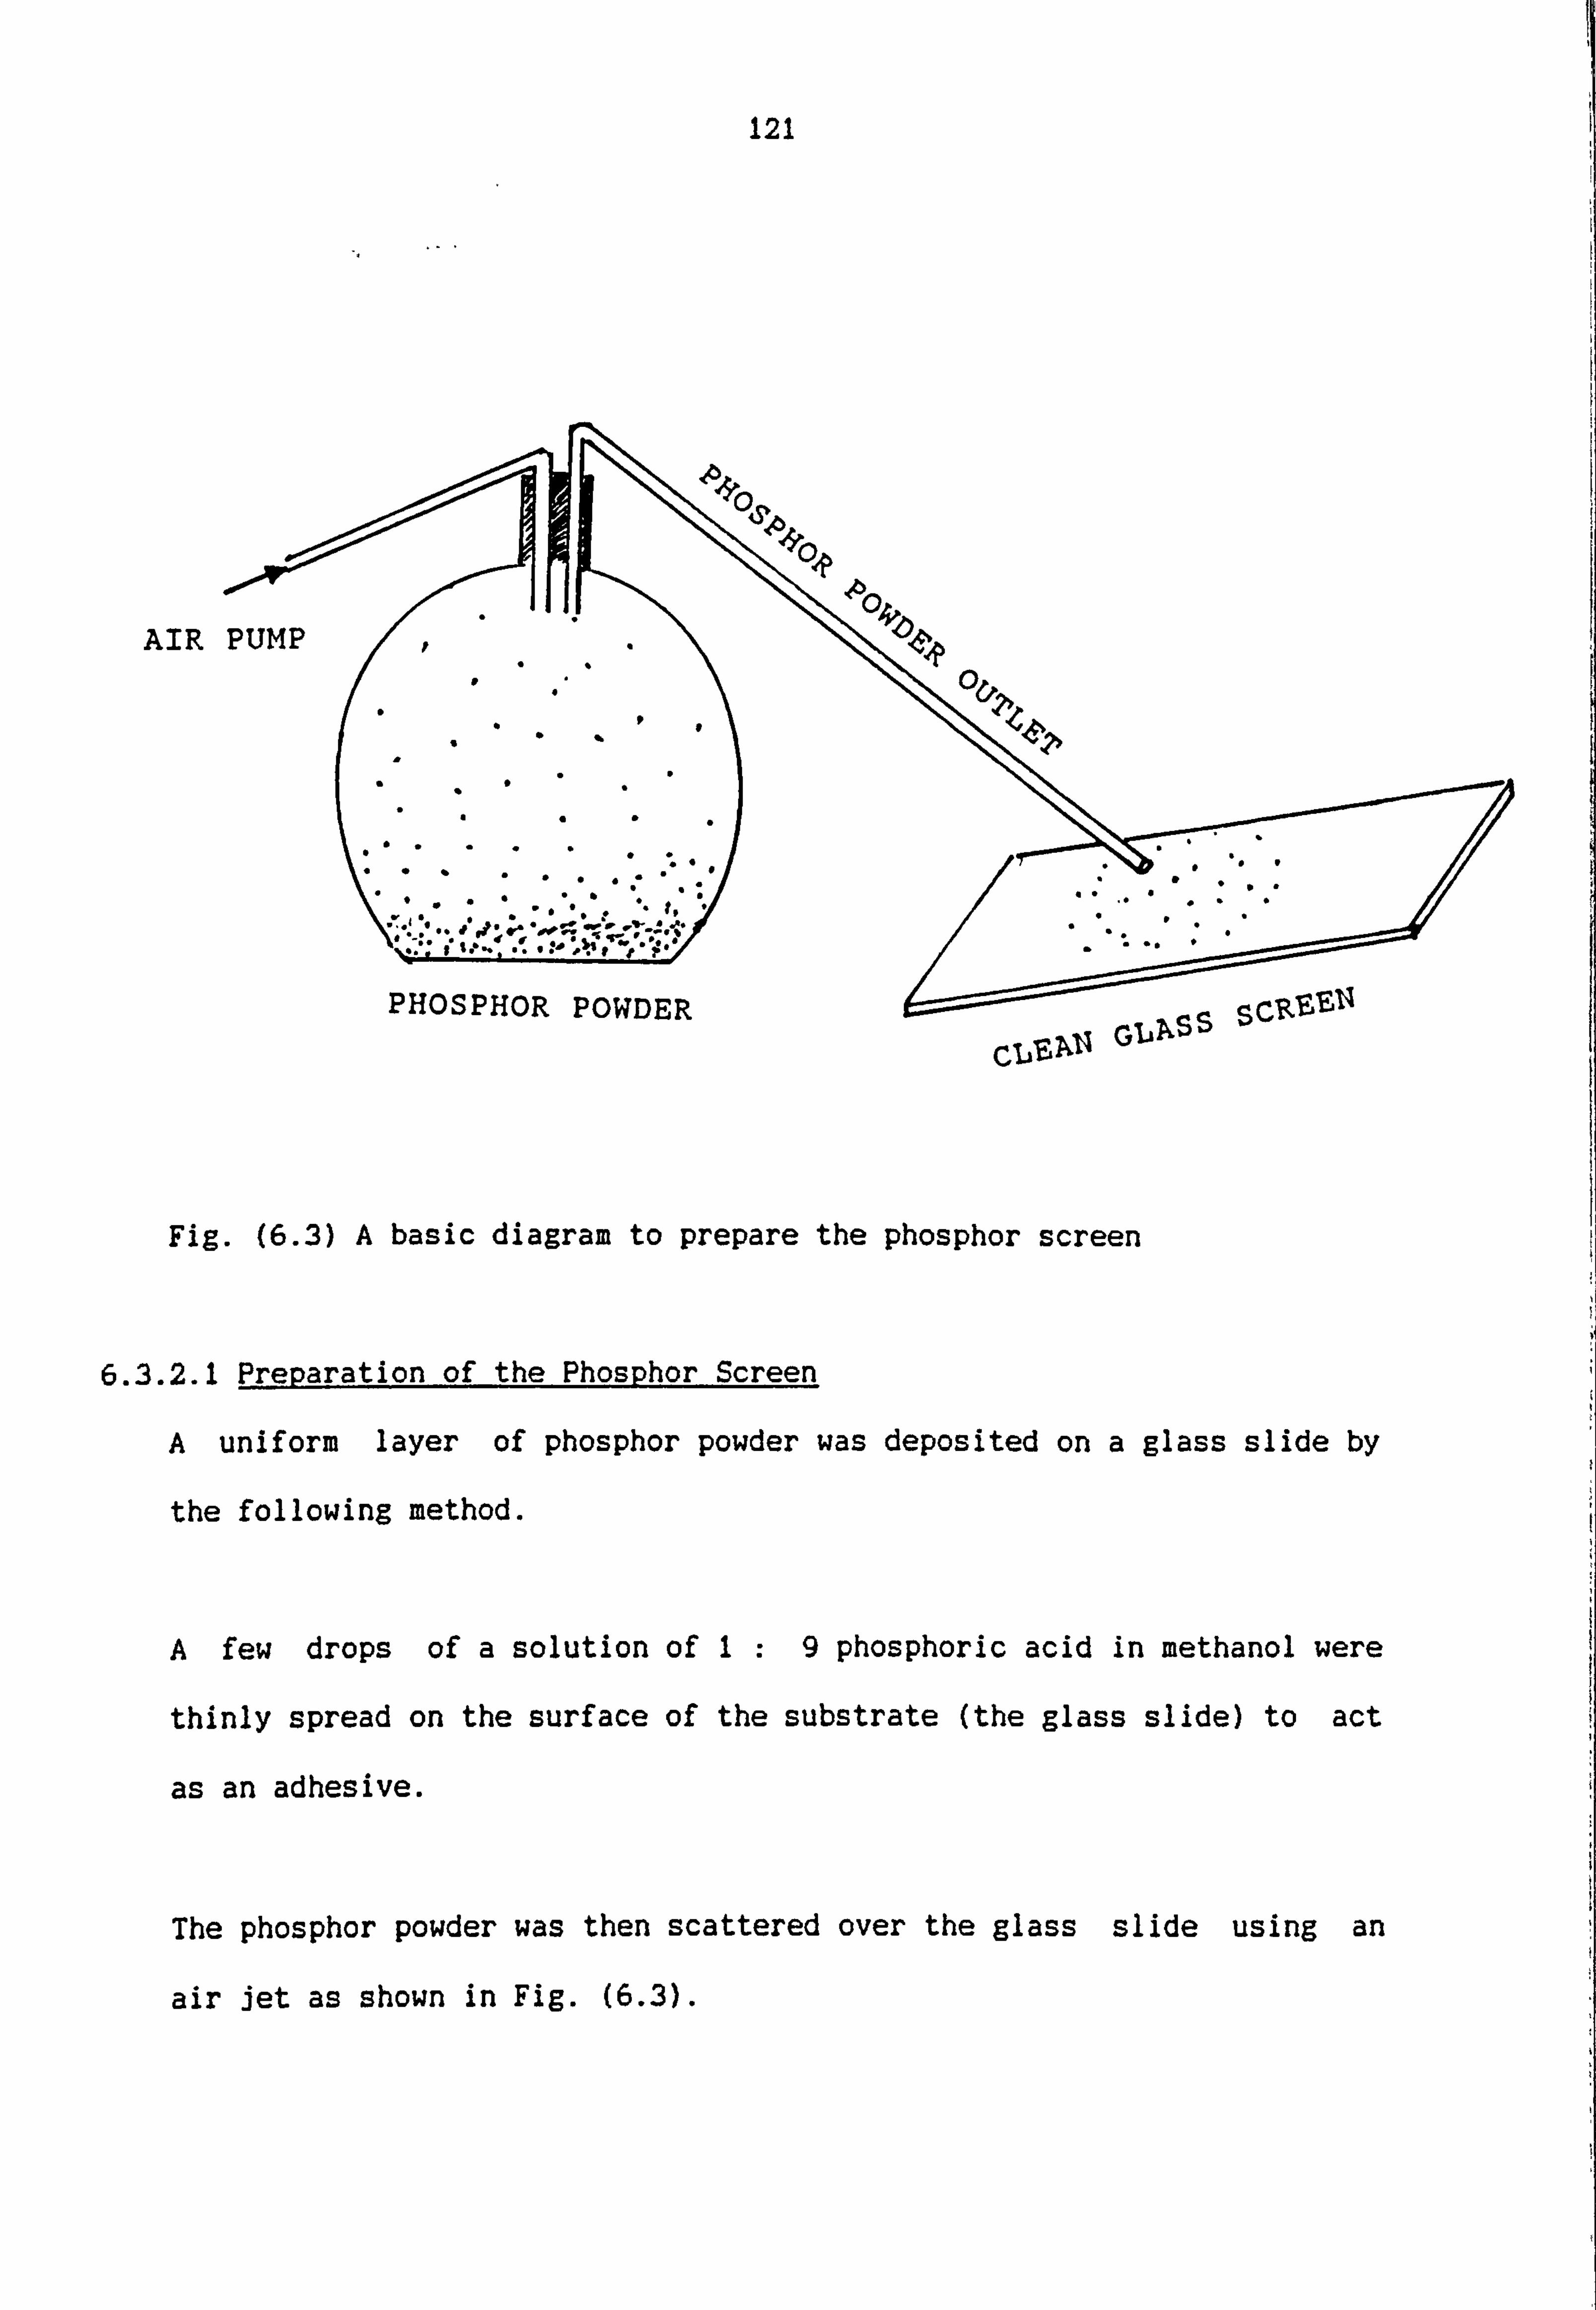
121
AIR PUMP
PHOSPHOR POWDER
Oz.
=ý-ý xs s SCP,. 'E'Ell
c"E Ij ; ýx11 GL
Fig. (6.3) A basic diagram to prepare the phosphor screen
6.3.2.1 Preparation of the Phosphor Screen
A uniform layer of phosphor powder was deposited on a glass slide by
the following method.
A few drops of a solution of 1: 9 phosphoric acid in methanol were
thinly spread on the surface of the substrate (the glass slide) to act
as an adhesive.
The phosphor powder was then scattered over the glass slide using an
air jet as shown in Fig. (6.3).
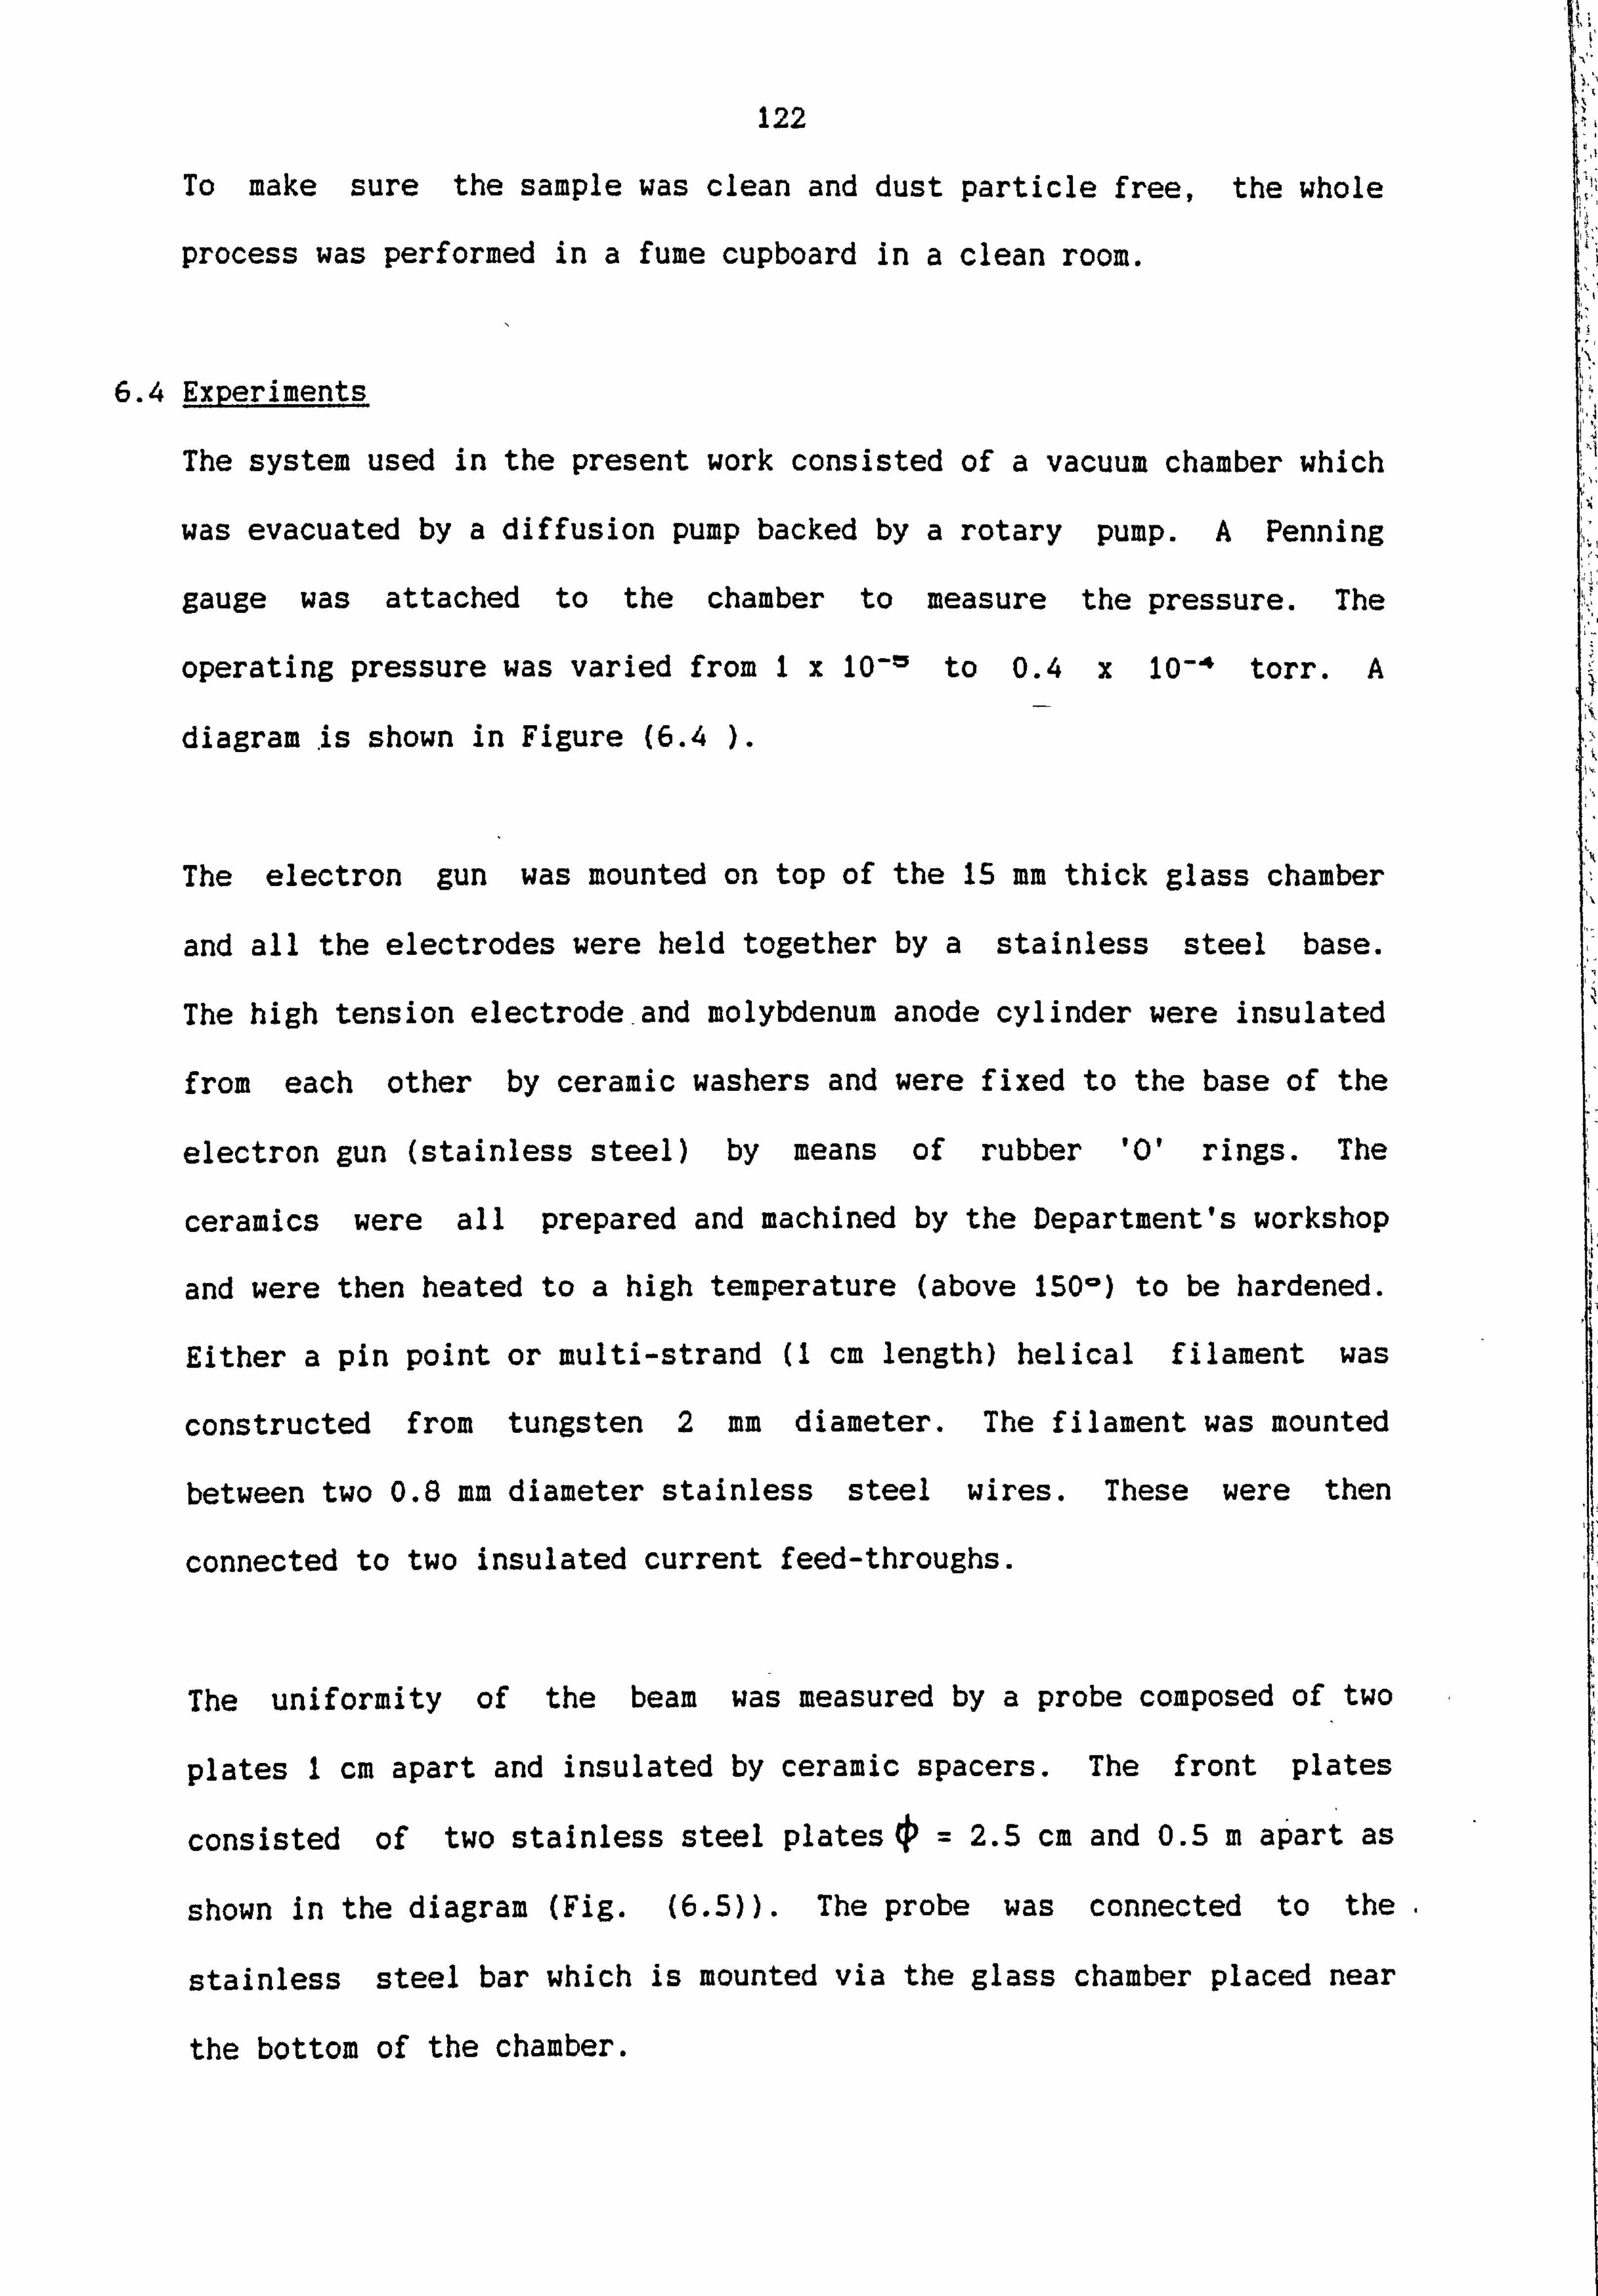
122
To make sure the sample was clean and dust particle free, the whole
process was performed in a fume cupboard in a clean room.
6.4 Experiments
The system used in the present work consisted of a vacuum chamber which
was evacuated by a diffusion pump backed by a rotary pump. A Penning
gauge was attached to the chamber to measure the pressure. The
operating pressure was varied from 1x 10-15 to 0.4 x 10⁻⁴ torr. A
diagram is shown in Figure (6.4
The electron gun was mounted on top of the 15 mm thick glass chamber
and all the electrodes were held together by a stainless steel base.
The high tension electrode-and molybdenum anode cylinder were insulated
from each other by ceramic washers and were fixed to the base of the
electron gun (stainless steel) by means of rubber '0' rings. The
ceramics were all prepared and machined by the Department's workshop
and were then heated to a high temperature (above ISO-) to be hardened.
Either a pin point or multi-strand (1 cm length) helical filament was
constructed from tungsten 2 mm diameter. The filament was mounted
between two 0.8 mm diameter stainless steel wires. These were then
connected to two insulated current feed-throughs.
The uniformity of the beam was measured by a probe composed of two
plates 1 cm apart and insulated by ceramic spacers. The front plates
consisted of two stainless steel plates ý=2.5 cm and o. 5 m apart as
shown in the diagram (Fig. (6.5)). The probe was connected to the
stainless steel bar which is mounted via the glass chamber placed near
the bottom of the chamber.
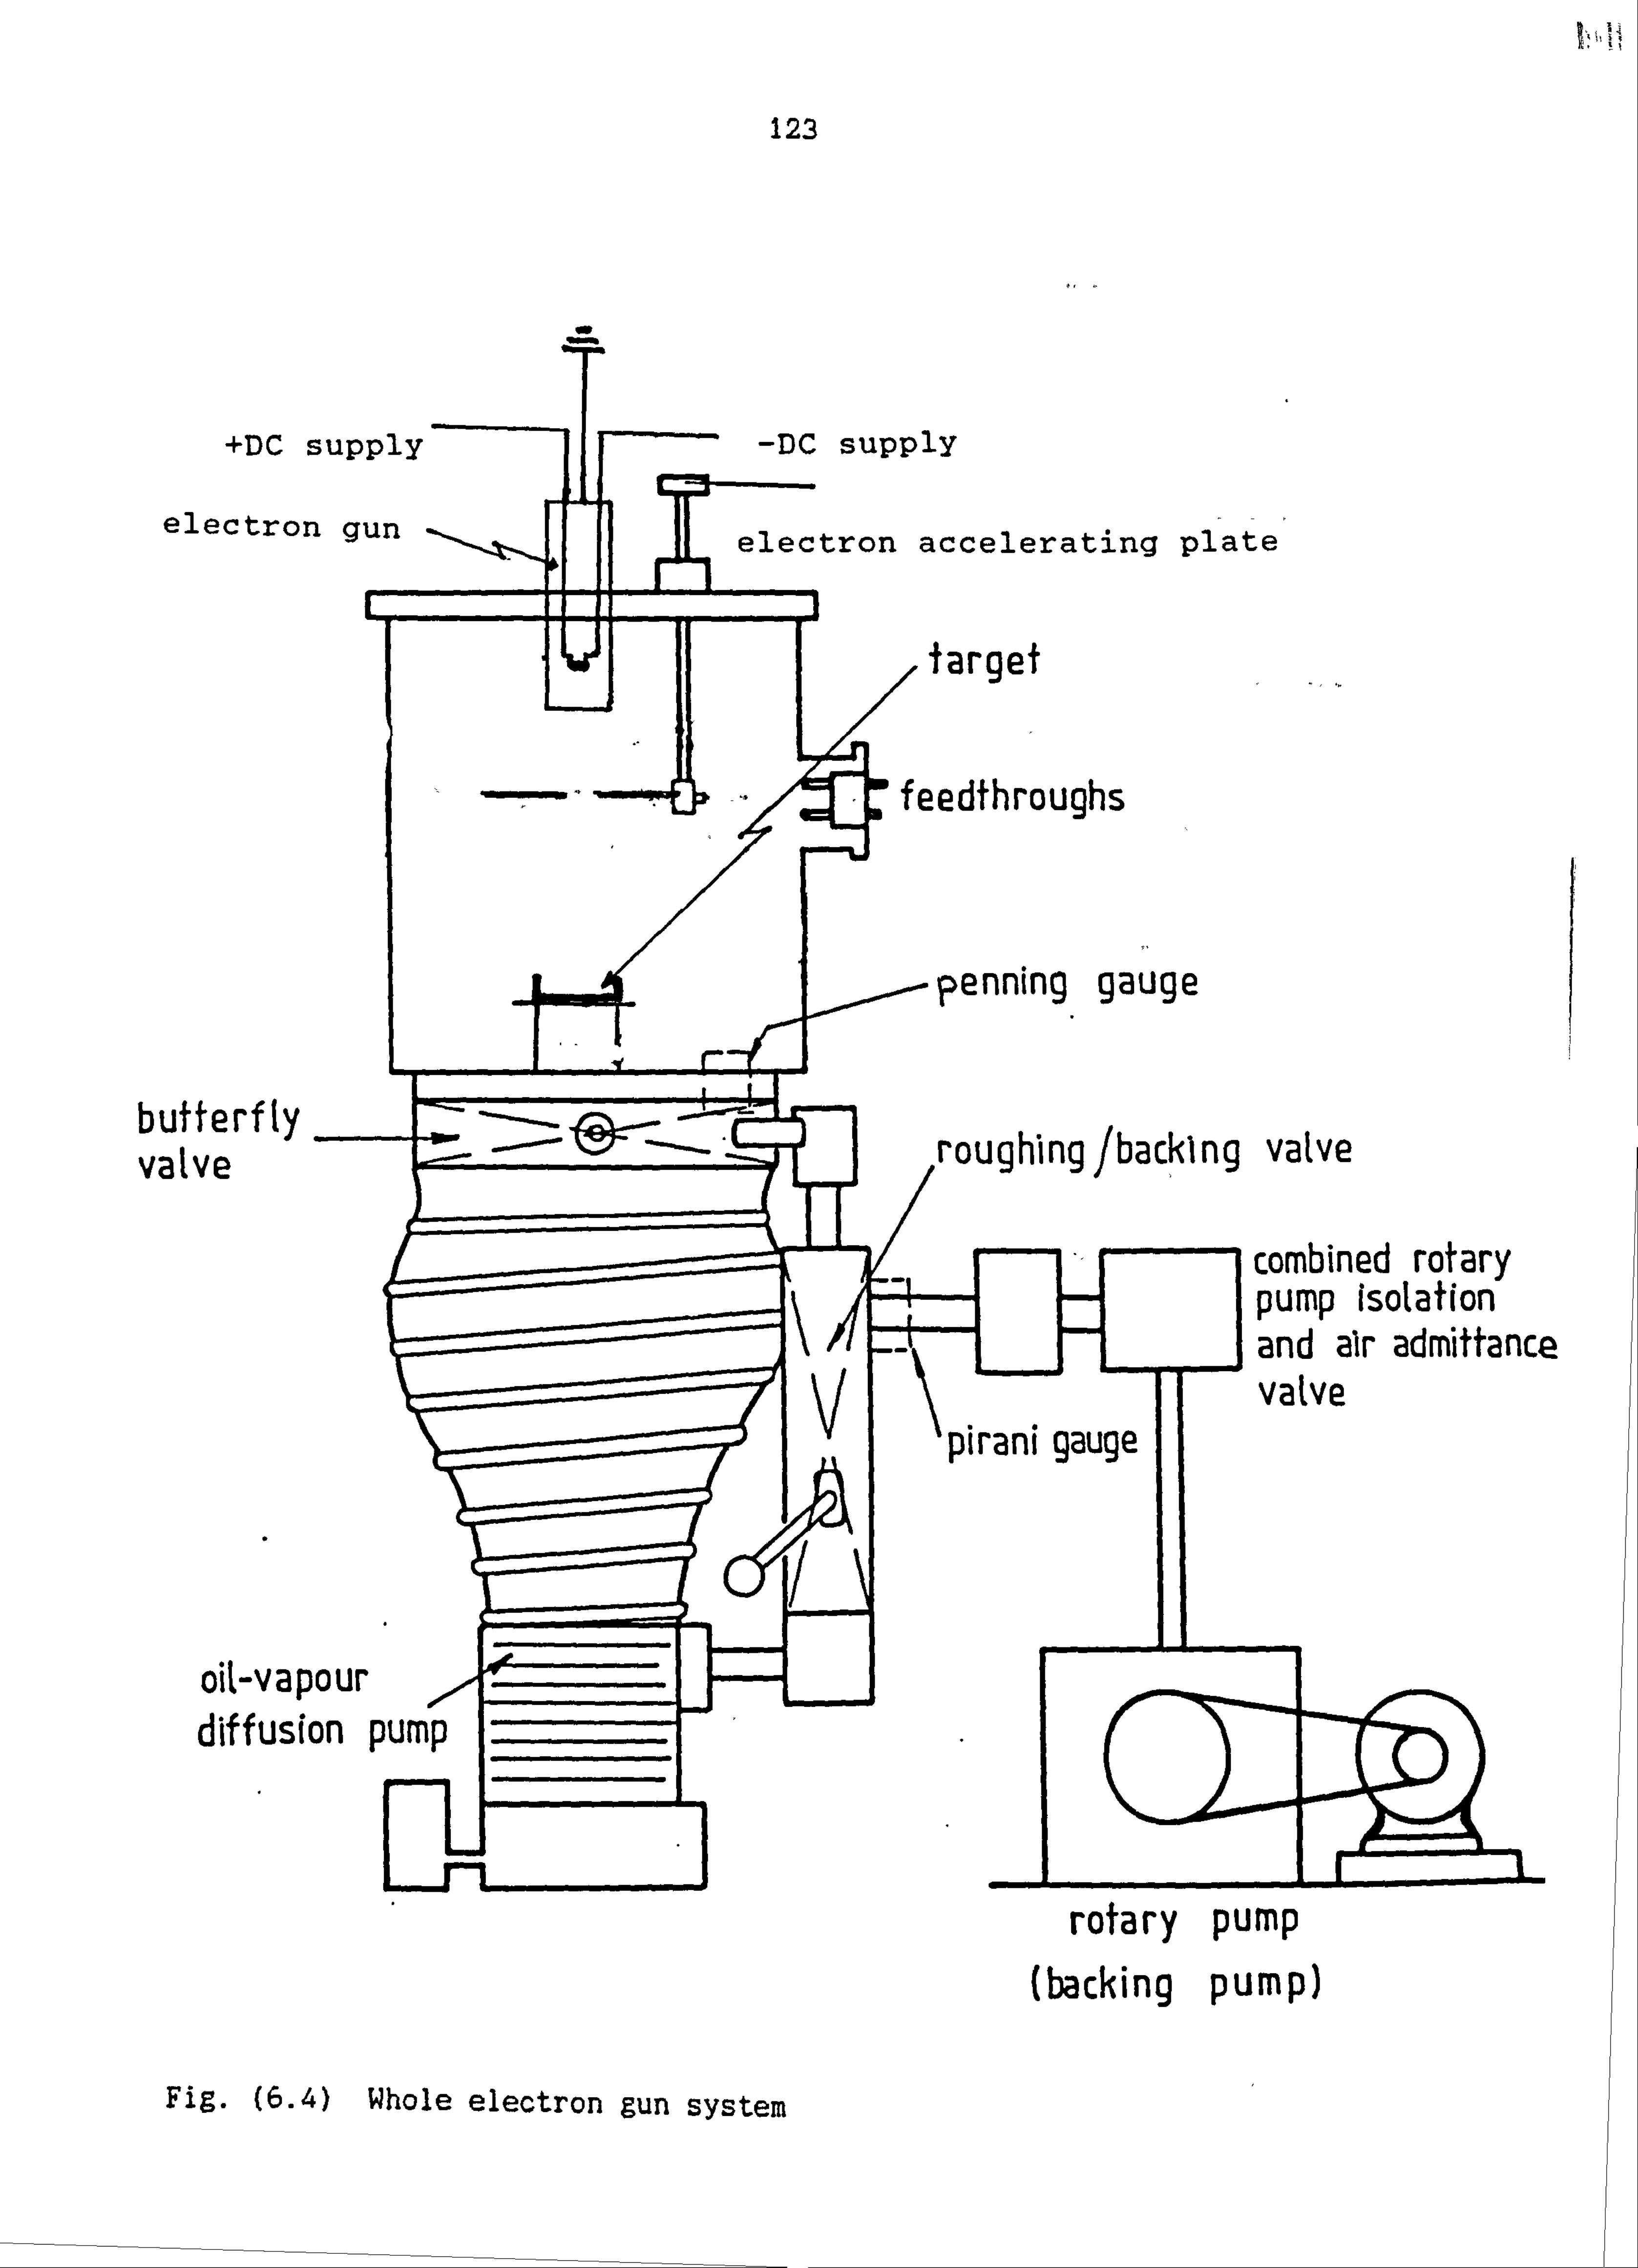
i1
or
+DC supply
electron gun
123
-DC supply
electron accelerating plate
fargef
feedthroughs
penning gauge
butterf ty valve
oil-vapour diffusfon pump
roughling /backing valve
combined rotary pump Isolation and a1r admittance valve
\ýiraWi
gauge
rotary pump (backing pump)
Fig. (6.4) Whole electron gun system
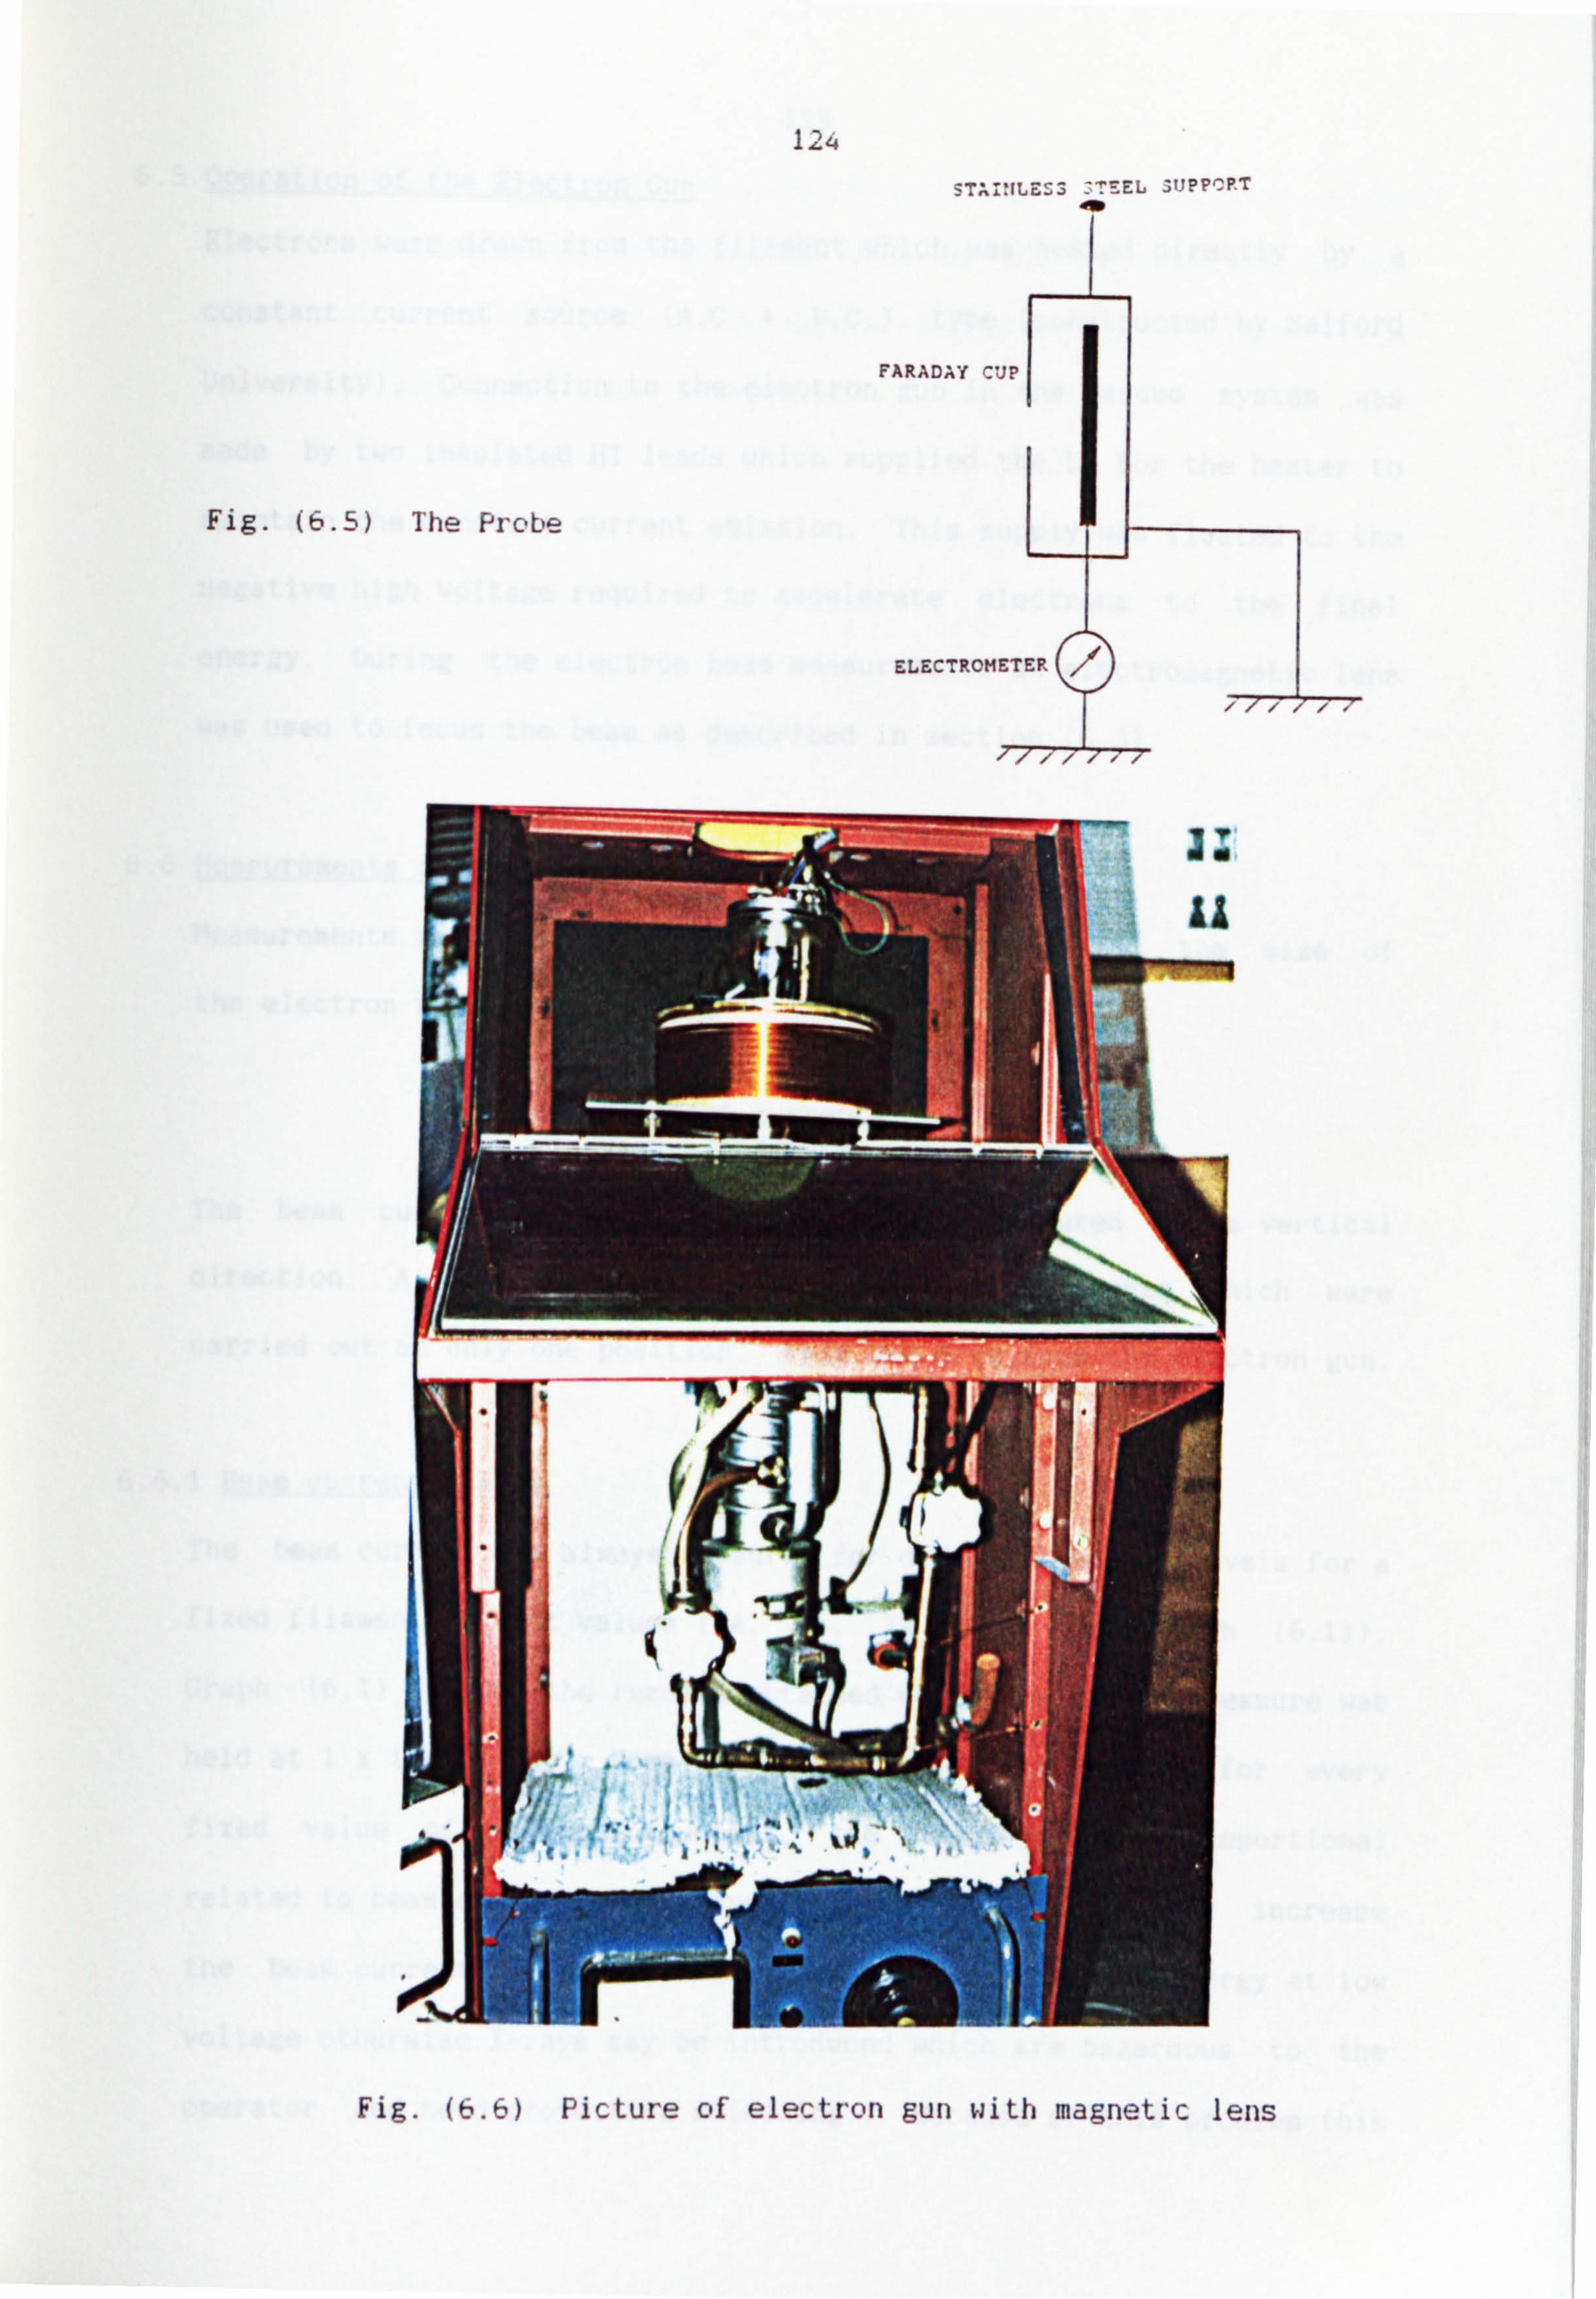
-54 4-
STAI. NLESS3 : TEEL 5t3PPCPT
FARADAY C
Fig. (6.5) The Probe
ELECTROH
Fig. (6.6) Picture of electron gun with magnetic lens
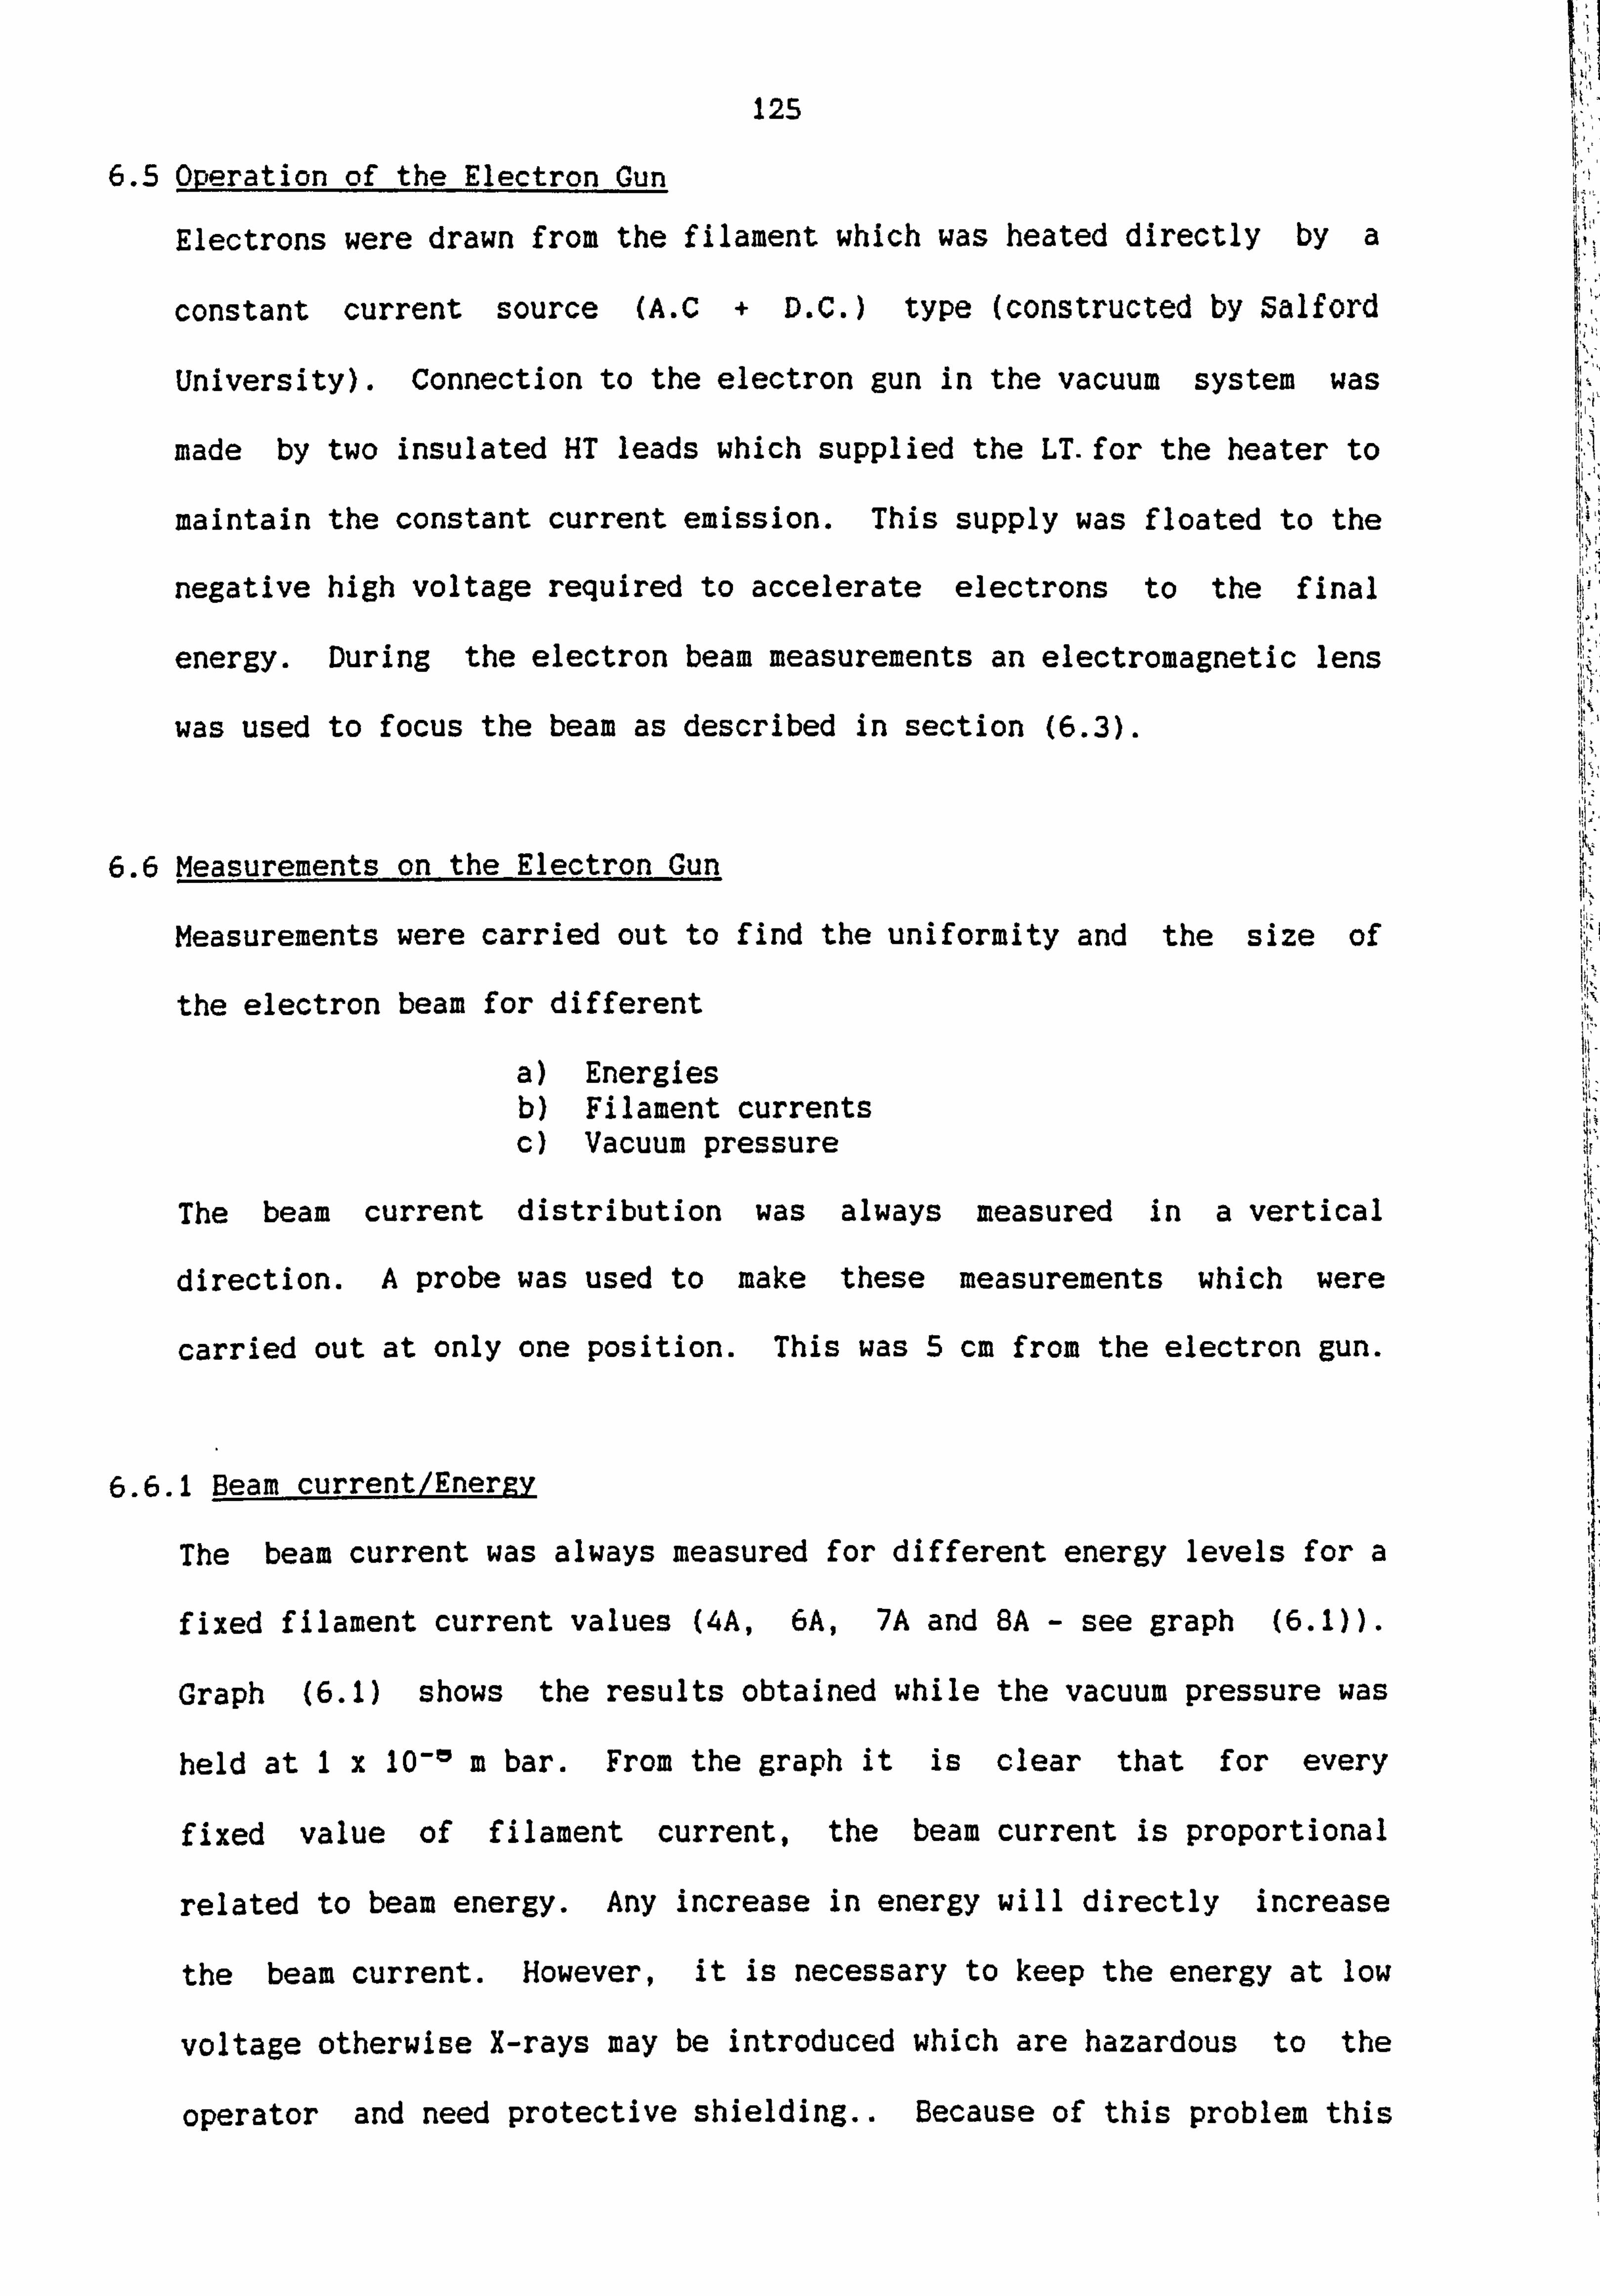
125
6.5 Operation of the Electron Gun.
Electrons were drawn from the filament which was heated directly by a
constant current source WC + D. C. ) type (constructed by Salford
University). Connection to the electron gun in the vacuum system was
made by two insulated HT leads which supplied the LT. for the heater to
maintain the constant current emission. This supply was floated to the
negative high voltage required to accelerate electrons to the final
energy. During the electron beam measurements an electromagnetic lens
was used to focus the beam as described in section (6.3).
6.6 Measurements on the Electron Gun
Measurements were carried out to find the uniformity and the size of
the electron beam for different
a) Energies b) Filament currents c) Vacuum pressure
The beam current distribution was always measured in a vertical
direction. A probe was used to make these measurements which were
carried out at only one position. This was 5 cm from the electron gun.
6.6.1 Beam current/EnerRy
The beam current was always measured for different energy levels for a
fixed filament current values (4A, 6A, 7A and BA - see graph (6.1)).
Graph (6.1) shows the results obtained while the vacuum pressure was
held at 1x 10-0 m bar. From the graph it is clear that for every
fixed value of filament current, the beam current is proportional
related to beam energy. Any increase in energy will directly increase
the beam current. However, it is necessary to keep the energy at low
voltage otherwise X-rays may be introduced which are hazardous to the
operator and need protective shielding.. Because of this problem this
126
electron gun was used only for energies up to SkV. For energies above
SkV different electron gun was used, this was already available in the
Department and it had a stainless vacuum chamber with a1 inch thick
lead glass window for X-ray shielding.
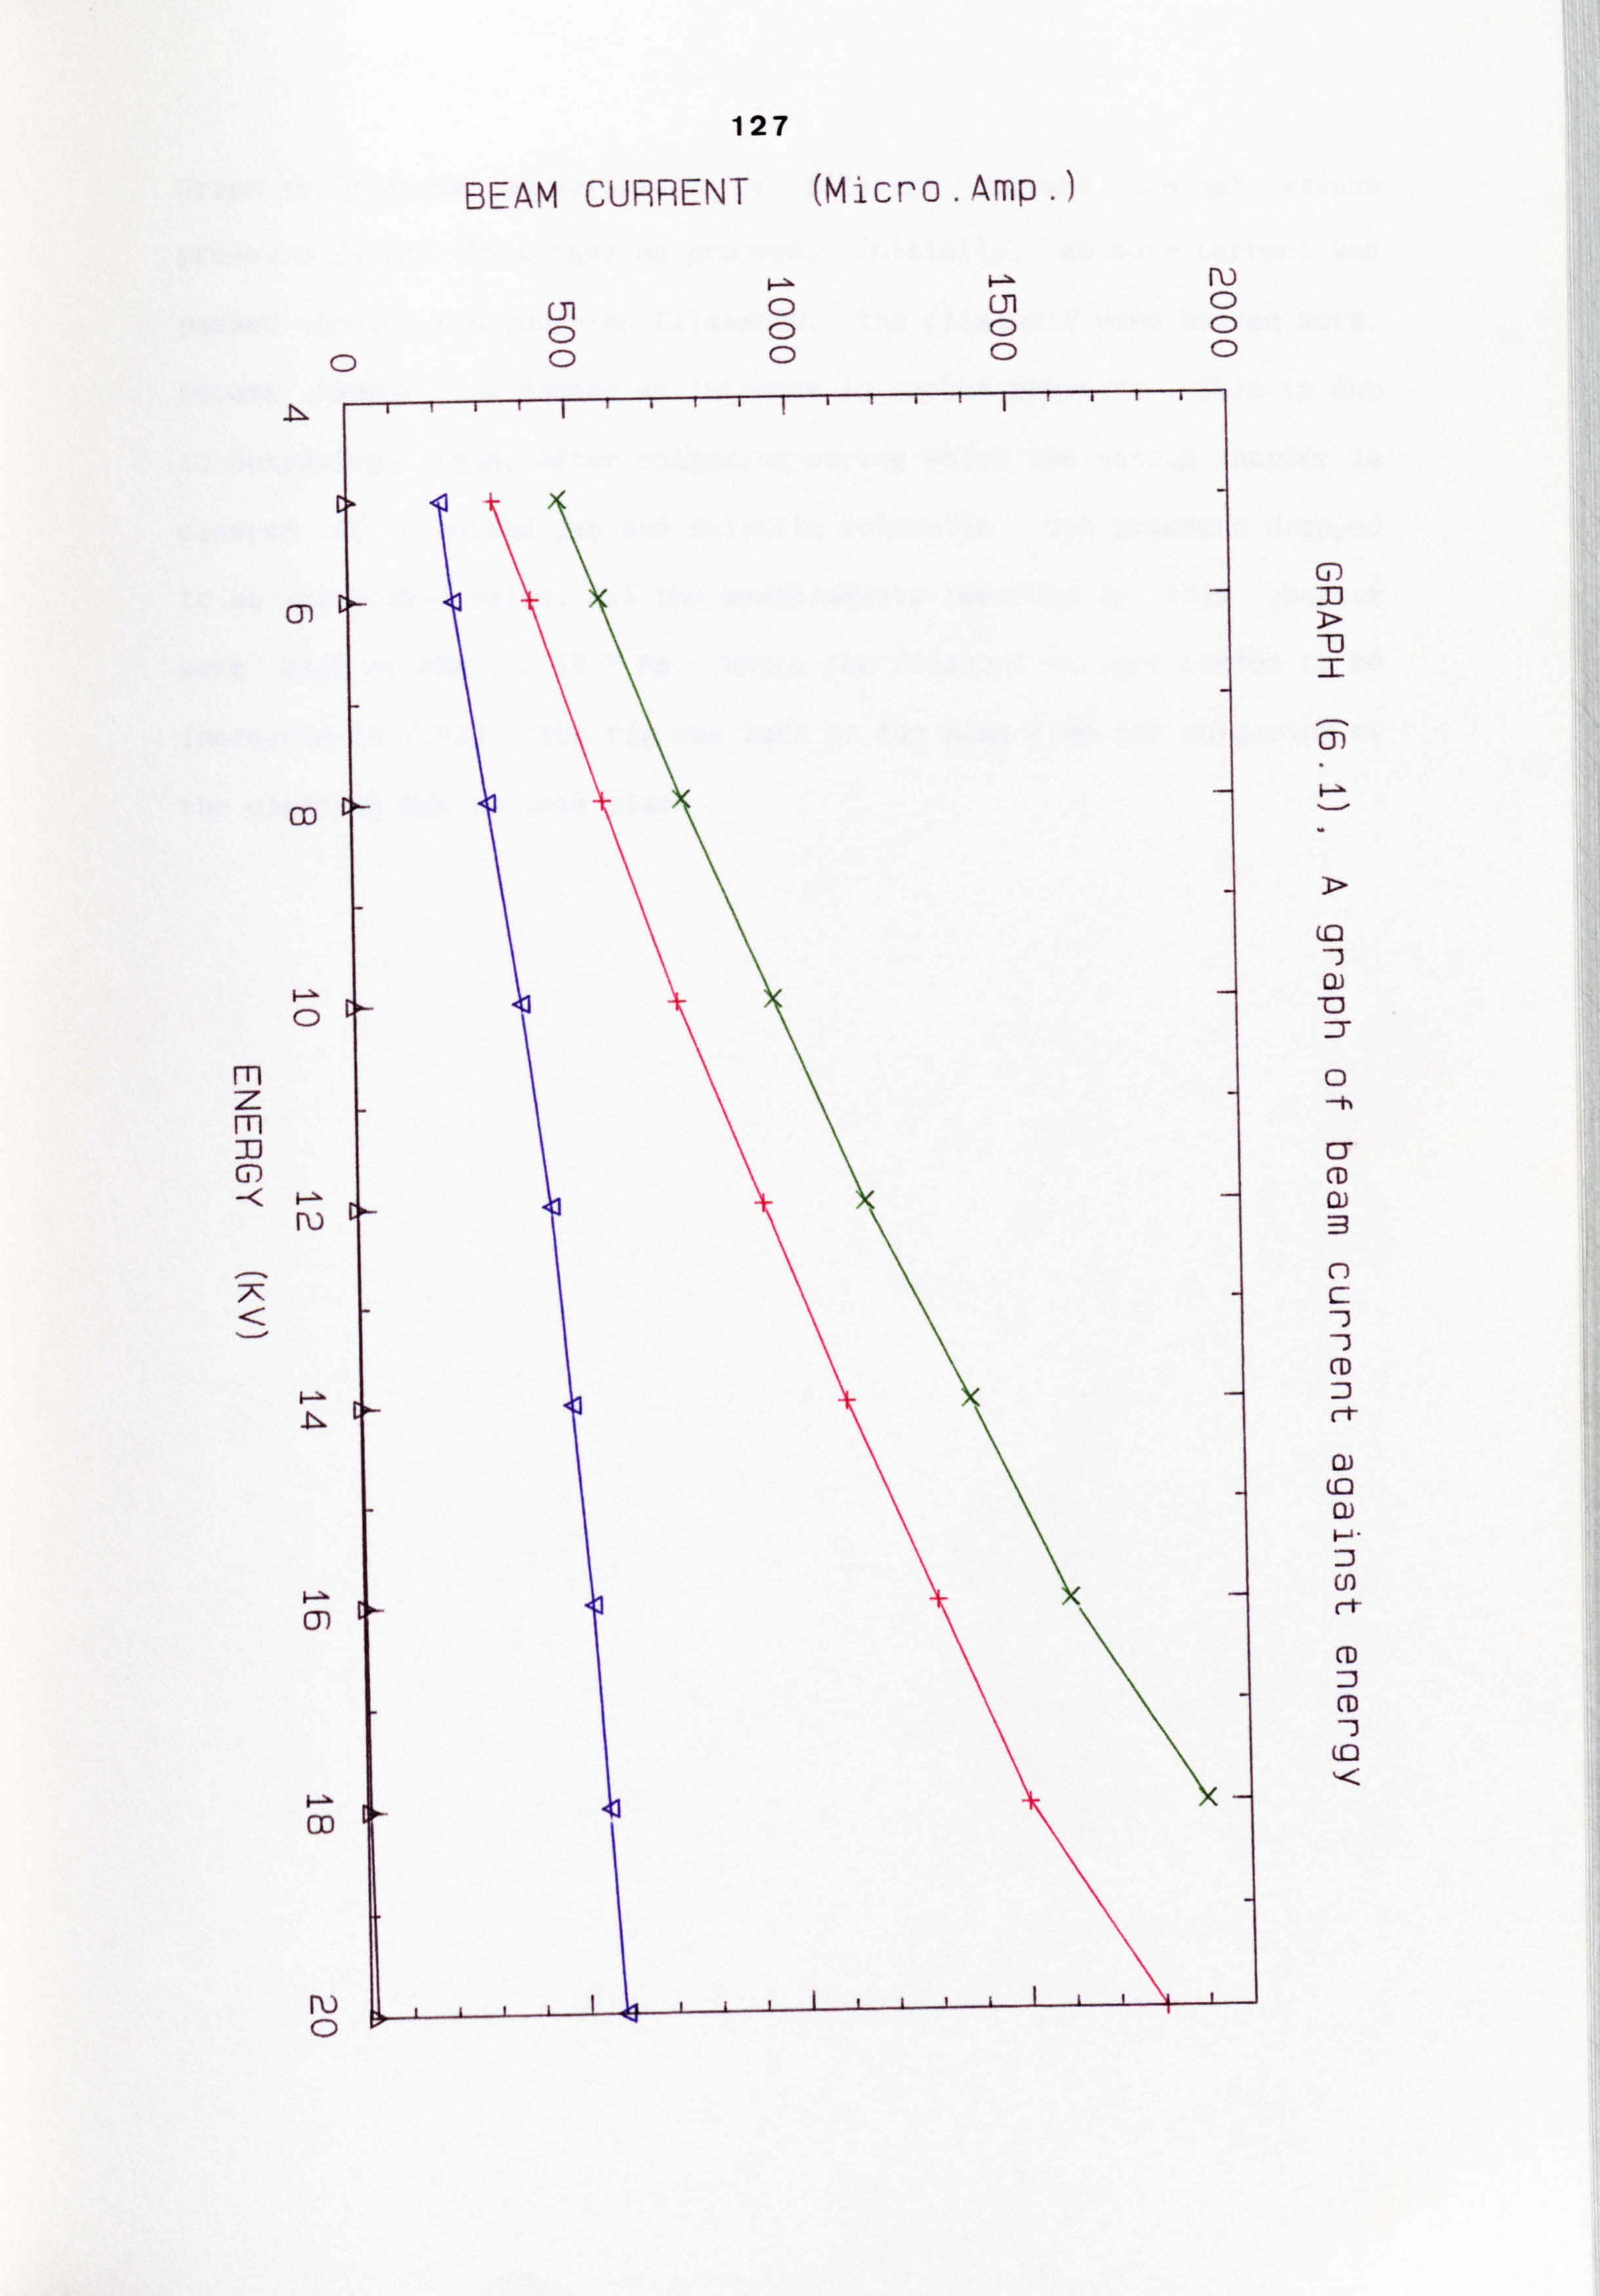
1! ý,
CT)
CD
0
m z m
Cj)
1-ý OD
R) 0
127
BEAM CURRENT (Micro. Amp. )
"0 F
UD
0 -t)
CY CD
n c
CD :3 rt
CD (n- Cl)
co r-t-
CD
CD I
LID
Ln 0 C)

128
Graph (6.2) shows the variation of filament current against vacuum
pressure during the outgasing process. Initially, as more current was
passed through the tungsten filaments, the filaments were heated more,
became redder and caused an increase in vacuum pressure. This is due
to outgasing; then, after outgasing during which the vacuum chamber is
cleared of absorbed gas and volatile molecules, the pressure dropped
to an acceptable value. All the measurements reported in this chapter
were made at the Ix 10-5 Pa. Where the filament current needed to be
increased to 7 Amp, the rig was left on for some time for outgasing of
the electron gun to take place.
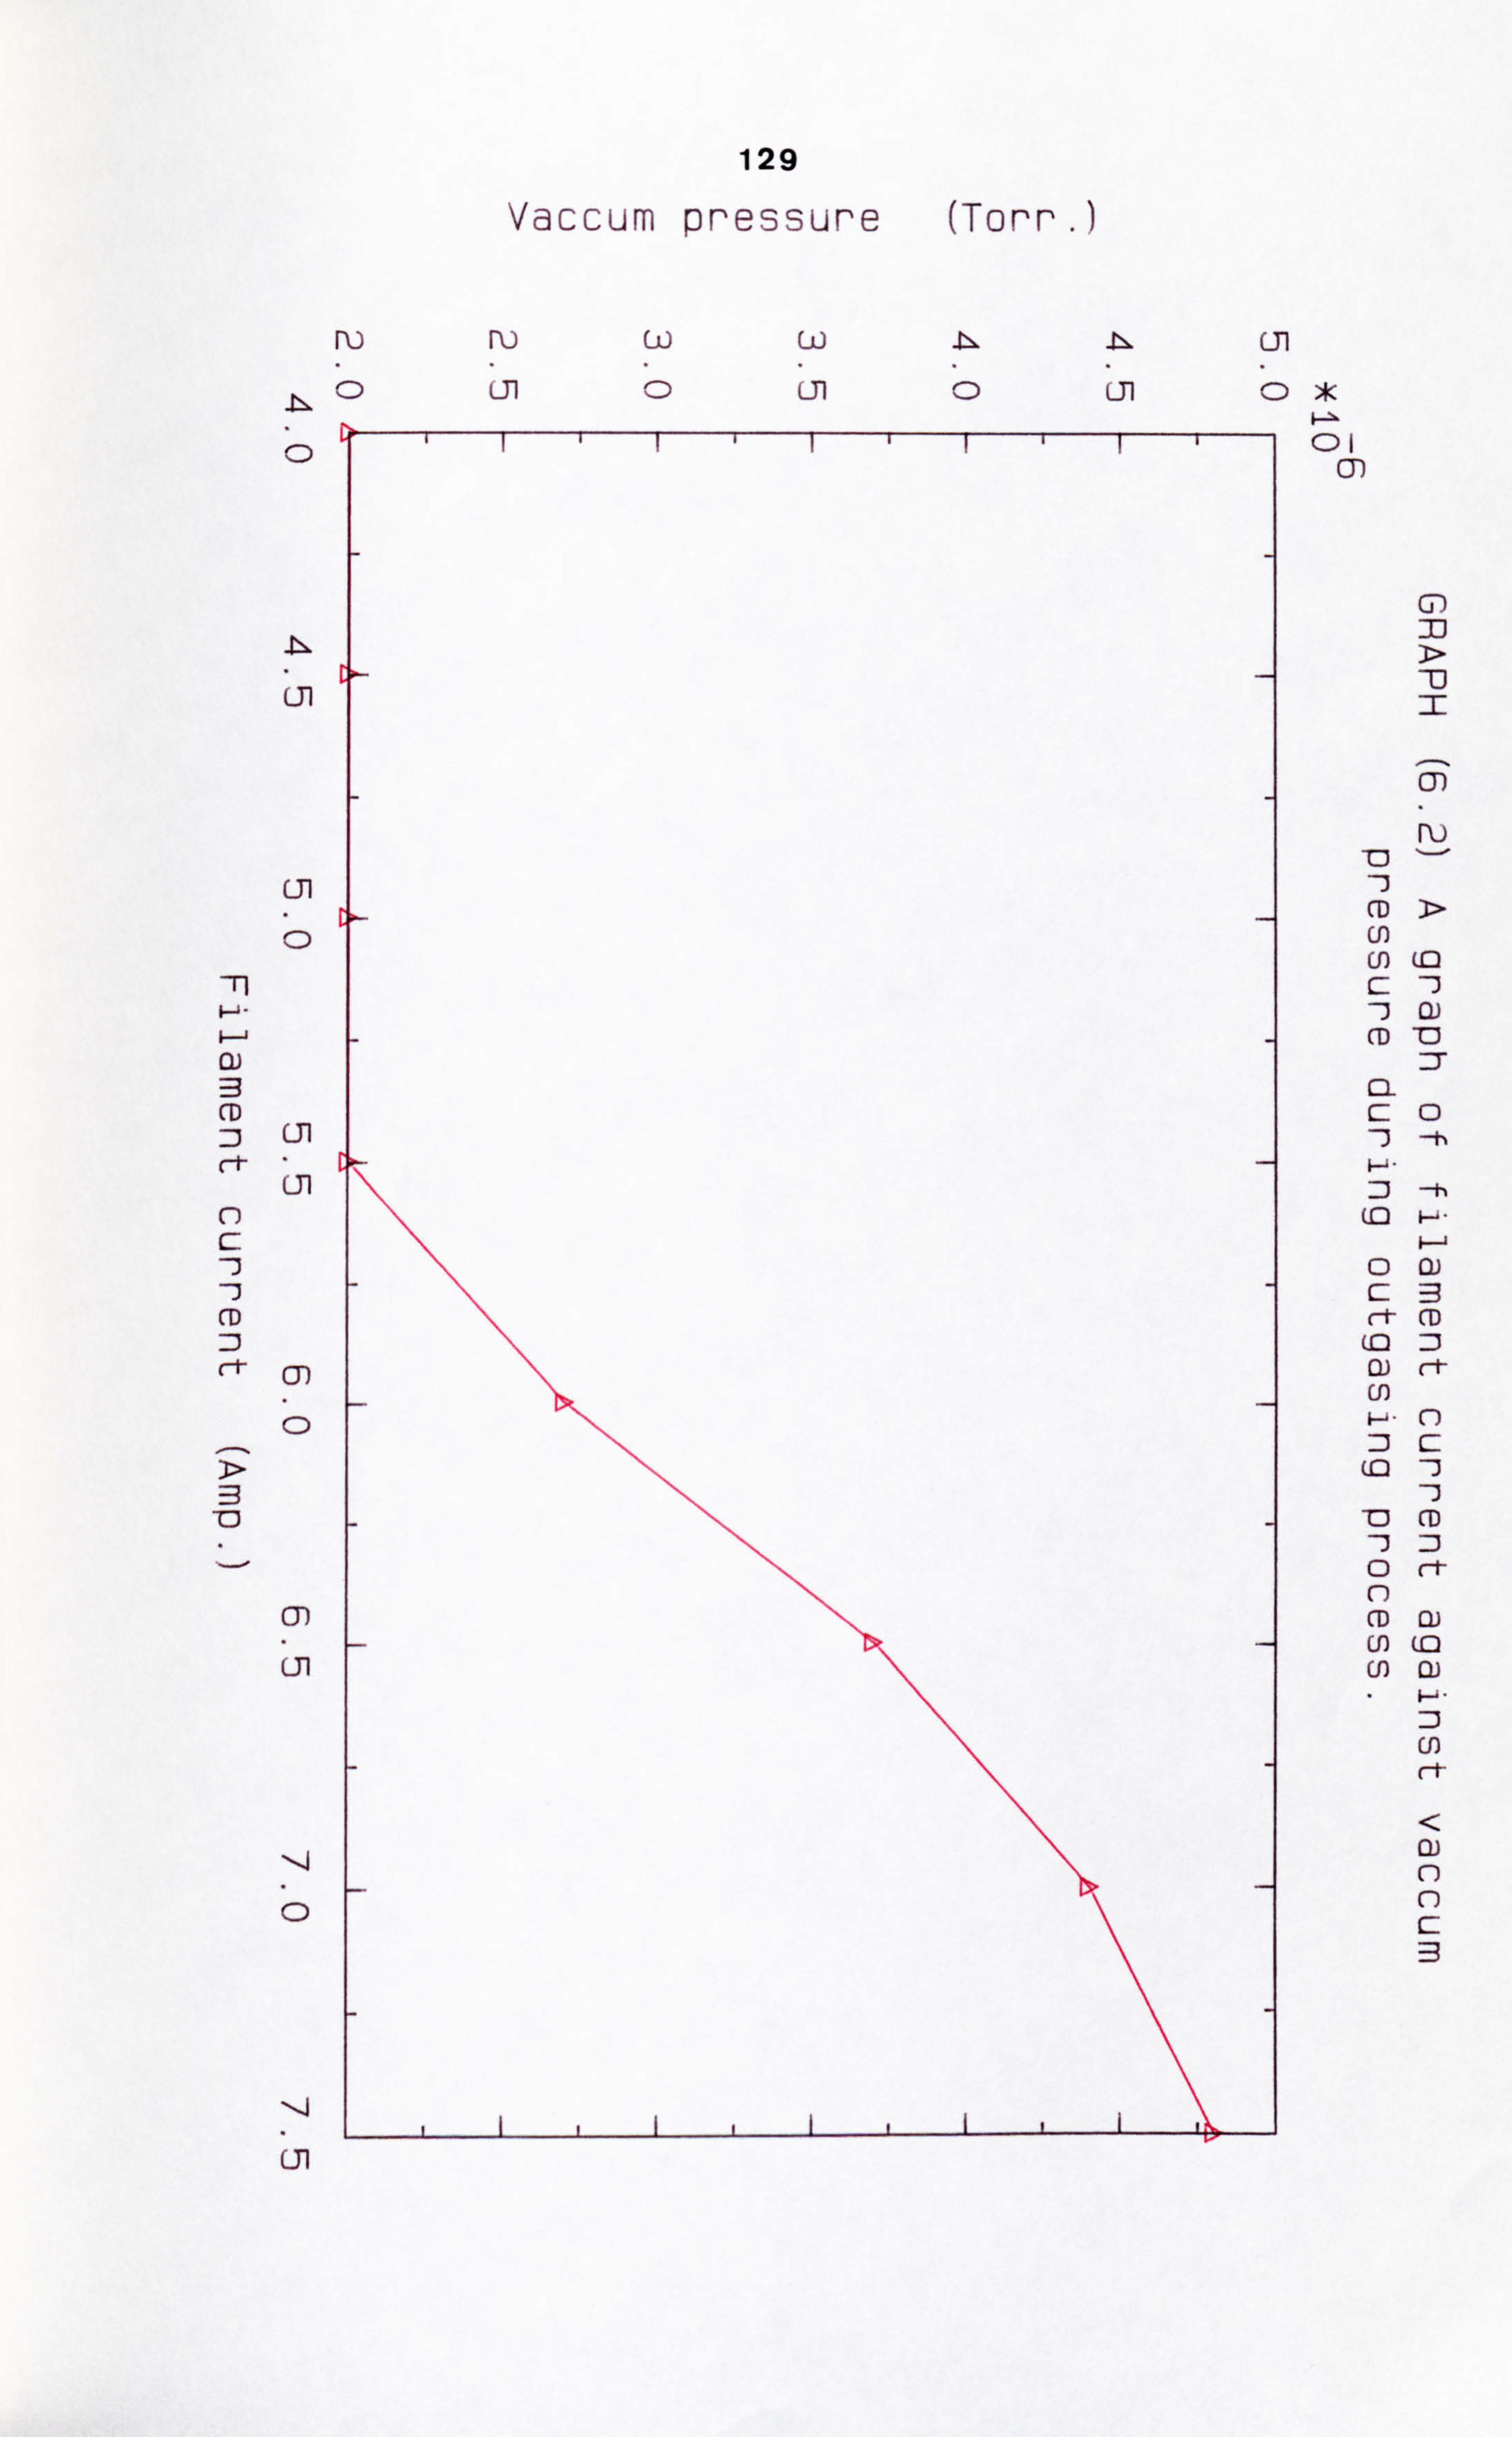
129
Vaccum pressure
ru ww
C)
Ui
cil
0* - 01
01
m
y)
Ul
CD Zi Ul C-t- *
cli C)
CD
CD
C)
CD
Cil
0
(Torr
cli
CD > U) cn (0 C: 3
(D -0
cl c0
--h
-h
0 0) C: 3 f-t- (D
UD :D CD f-t- Cf)
n :3
-0 CD --3 Z) 0 rt- n CD 0) U) Lo U) cu
U)
n n C: B
01

130
6.6.2 Beam current vs Filament current
In this part of measurement the energy levels were always held fixed at
5,10,15 and 20 kV as seen in Graph (6.3) . Again the vacuum pressure
was kept at 1x 10⁻¹ Pa and the beam current was measured as the
filament current was increased from 4A to 7.5 A in steps of 0.5 Amp.
as shown in Graph (6.3). For a filament current of less than 4 Amp,
there was zero beam current. Further increase in filament current
produced a measurable beam currdnt which was greatly increased as the
filament current was increased above 5.5 A. However, electrical
breakdown between the vacuum flange and the high voltage electrodes.
resulted when the filament current increased to more than 7A at an
anode voltage of 20 M
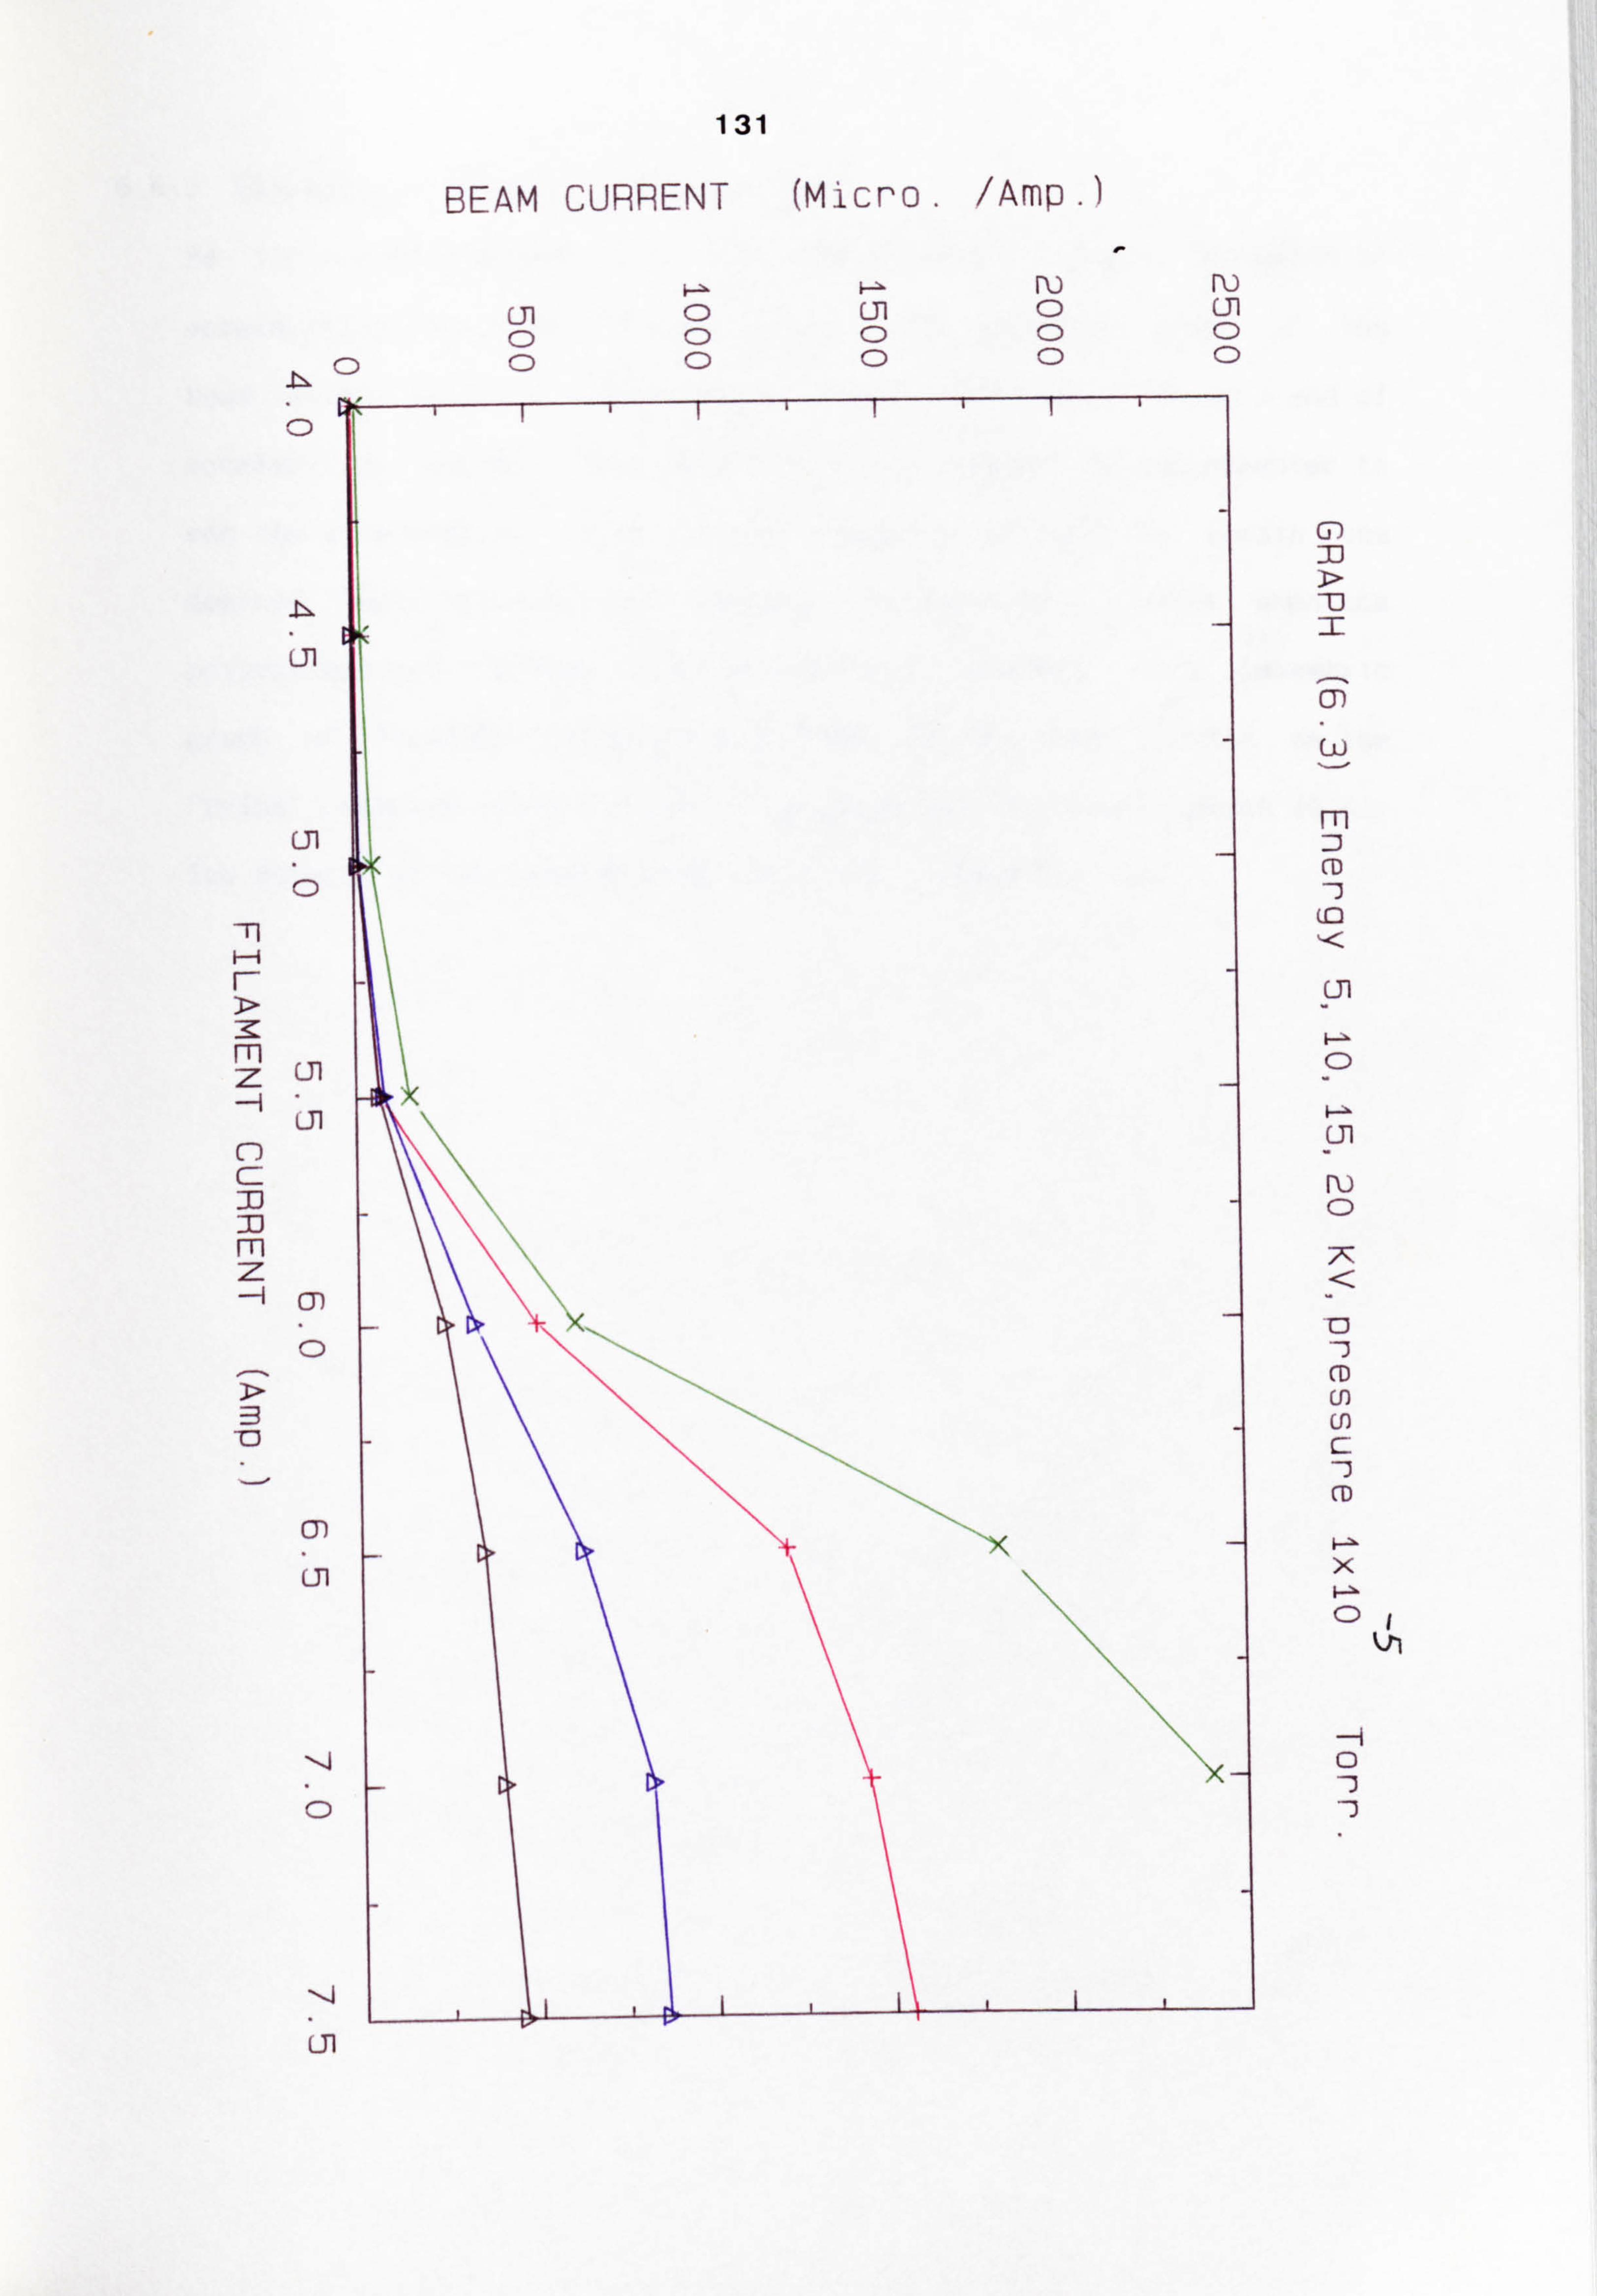
0
bi
Cil
0
-Tl
m 7 Ul
JI
c 33 :D m z
CD
LTI
Ln
131
BEAM CURRENT (M-1cro. /Amp. )
G-)
F
m
Cl)
m
CD -3
Cil
0
Cil
R) 0
Cf) Cf)
x
0
-
0
Ul 0 0

132
6.6.3 Filament current/Enerzy/Beam current
As the previous graphs show, the beam current is largely dependent on
accelerating energy and filament current. An isometric graph of the
beam current is given for different values of filament currents and of
accelerating energy. This isometric graph enables the experimenter to
set the accelerating energy and the filament current to obtain the
desired beam current. This graph was especially useful when the
polystyrene petri dishes were electron beam bombarded. This isometric
graph of filament current/energy/beam current was plotted on the
"Prime" computer using Fortran 77 language and is shown in Graph (6.4).
The details of the program used are given in Appendix (3).

133
(A)
L) Z> zo
WIN
a
a
C C
0
0
tii )-3 (D :Y 0) tý ý3 (D
(D
(D (D :i :i rt Uli
p- P) 0
0 (D rt 0 m ft 0 tli
(D 0
(D H- zi H (D i» hi 51 (Q (D l< zi . rt
(D 0 ct
CN

REFERENCES
1) SIMPSON, J. A. and KUYATT, C. E. Rev. Sci. Instrum., 1963,34, p. 265.
2) BAKISH, R. "Introduction to Electron Beam Technology", John Wiley & Sons, 1962.

CHAPTER 7
CHARGE IMPLANTATION EXPERIMENTAL: EQUIPMENT AND PROCEDURE

134
7.1 Introduction
It has already been shown that the physiology of the cells may be
varied after being placed in a charged environment. However, this is
strongly dependent upon the nature of the charge and whether it is
negatively or positively charged. This Chapter reviews briefly
experimental details of electron beam injection techniques and
procedure, and the charge decay process in polystyrene insulators.
Following this, it outlines some main experimental results obtained
using positive ion bombarded polystyrene petri dishes. This is firstly
for high energy He+ ion beams produced in the Van de Graaff and
secondly for medium energy N+ ion beams using the isotope separator,
and finally for low energy N+ ions generated by a D. C. plasma ion
system in the experimenters own laboratory.
7.2 Electron Bombardment and Injection
For the experiments described in this section, two kinds of electron
gun were used, high and low energy electron guns.
The high energy electron gun was a commercial electron gun designed and
manufactured by Oxford Applied Research Ltd. The low energy electron
gun was constructed by the writer during this research programme.
Details of its design and construction were given in Chapter (6).
These electron guns both have electrostatic acceleration and focussing.
The electron beam could be deflected with either magnetic or electric
fields to enable the beam to be guided into the work chamber through
the aperture of the electron gun. The targets to be bombarded were
polystyrene petri dishes produced by Sterilin Co. (Teddington,
Middlesex, TW11 8OZ, England, UK. Part no. 1.206.475). Polystyrene
has a density of 1.05 g/cm3. and these petri dishes are commercially

135
available in different sizes and are vacuum compatible. The dishes
were covered with a mask which was made of aluminium. The mask was
similar to a matchbox cover, as shown in Fig. (7.1). AI cm diameter
window was located centrally to allow the electron beam to irradiate a
circular path in the centre of the petri dish (as illustrated in Fig.
(7.2fl.
POLYSTYRENE PETRI DISH
HOLE
Fig. (7.1) An aluminium mask where the polystyrene petri dish could slide in with the open side of the dish facing towards the 1 cm diameter window of the mask. This would allow the electron beam to
pass through the window into the surface of the petri dish.
ELECTRON MAGNETIC BEAM
LEN, 5 TARGET
Fig. (7.2). The electron beam is directly hitting a circular path along the surface of a polystyrene petri dish, through 1 cm centrally located
mask. The electron beam sits inside the polystyrene and charges the
surface of the dish negatively.
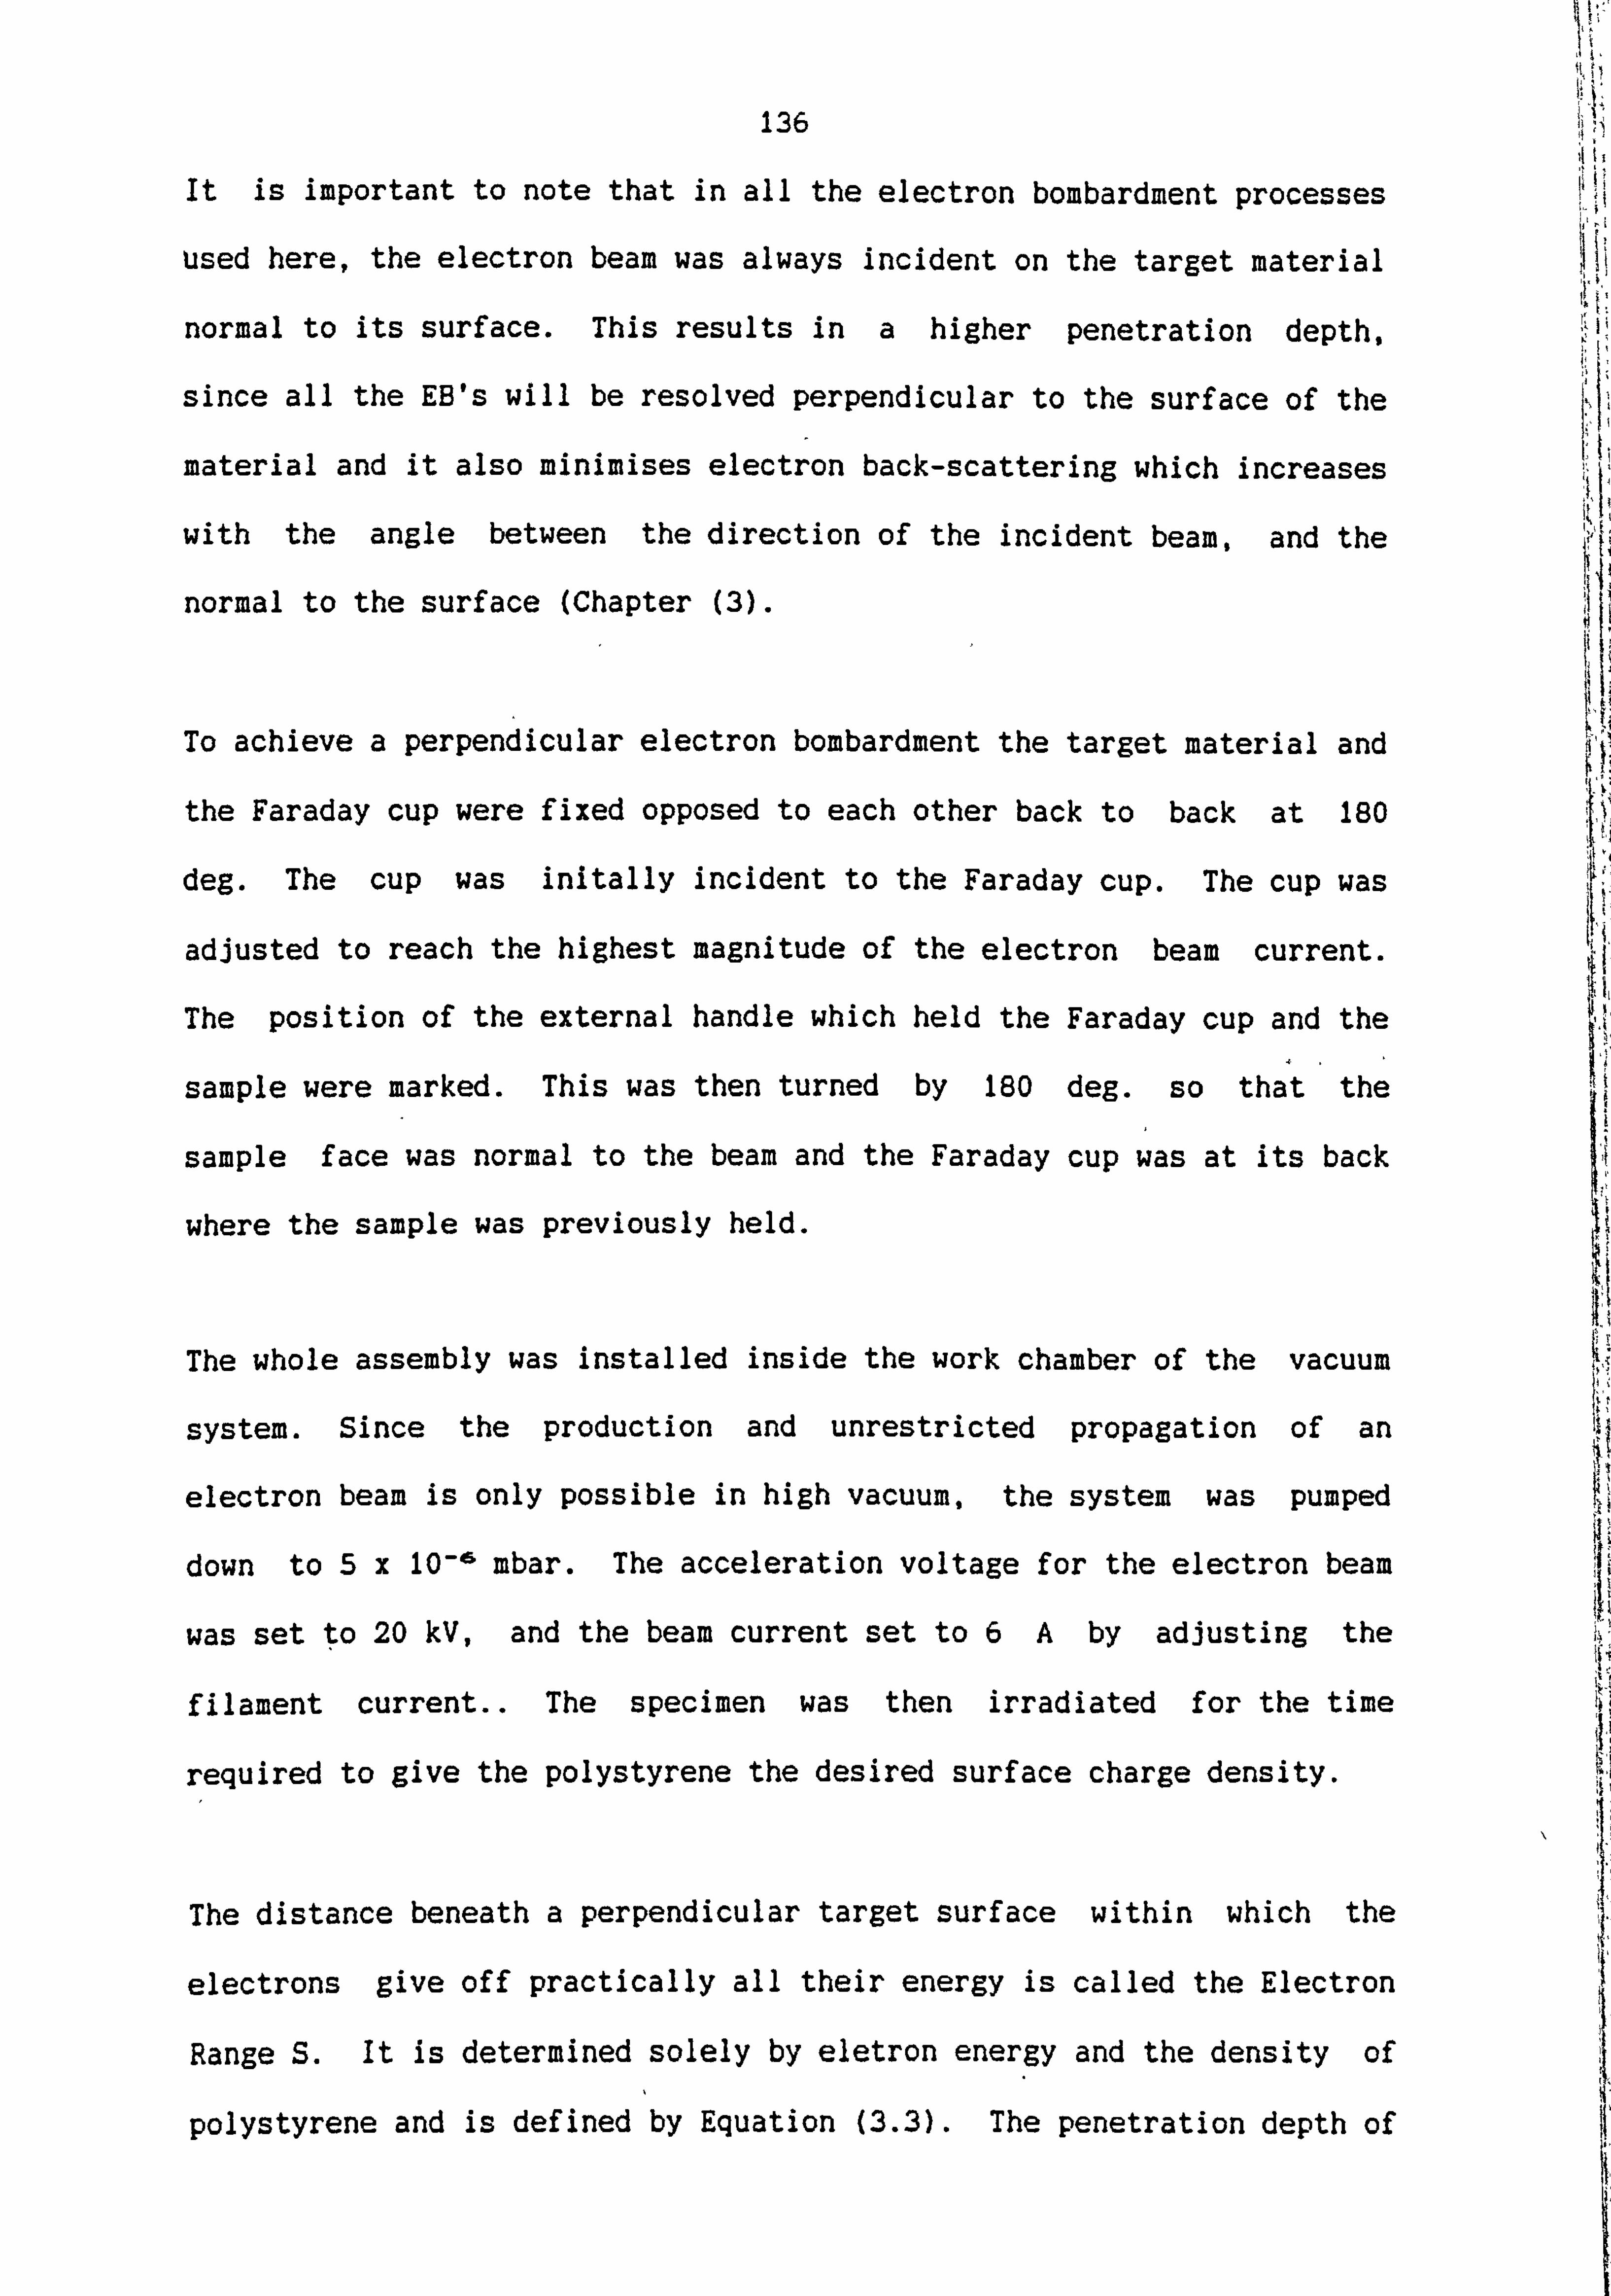
136
It is important to note that in all the electron bombardment processes
used here, the electron beam was always incident on the target material
normal to its surface. This results in a higher penetration depth,
since all the EB's will be resolved perpendicular to the surface of the
material and it also minimises electron back-scattering which increases
with the angle between the direction of the incident beam, and the
normal to the surface (Chapter (3).
To achieve a perpendicular electron bombardment the target material and
the Faraday cup were fixed opposed to each other back to back at 180
deg. The cup was initally incident to the Faraday cup. The cup was
adjusted to reach the highest magnitude of the electron beam current.
The position of the external handle which held the Faraday cup and the
sample were marked. This was then turned by 180 deg. so that the
sample face was normal to the beam and the Faraday cup was at its back
where the sample was previously held.
The whole assembly was installed inside the work chamber of the vacuum
system. Since the production and unrestricted propagation of an
electron beam is only possible in high vacuum, the system was pumped
down to 5x 10⁻¹ mbar. The acceleration voltage for the electron beam
was set to 20 kV, and the beam current set to 6A by adjusting the
filament current.. The specimen was then irradiated for the time
required to give the polystyrene the desired surface charge density.
The distance beneath a perpendicular target surface within which the
electrons give off practically all their energy is called the Electron
Range S. It is determined solely by eletron energy and the density of
polystyrene and is defined by Equation (3.3). The penetration depth of
'I It, 101
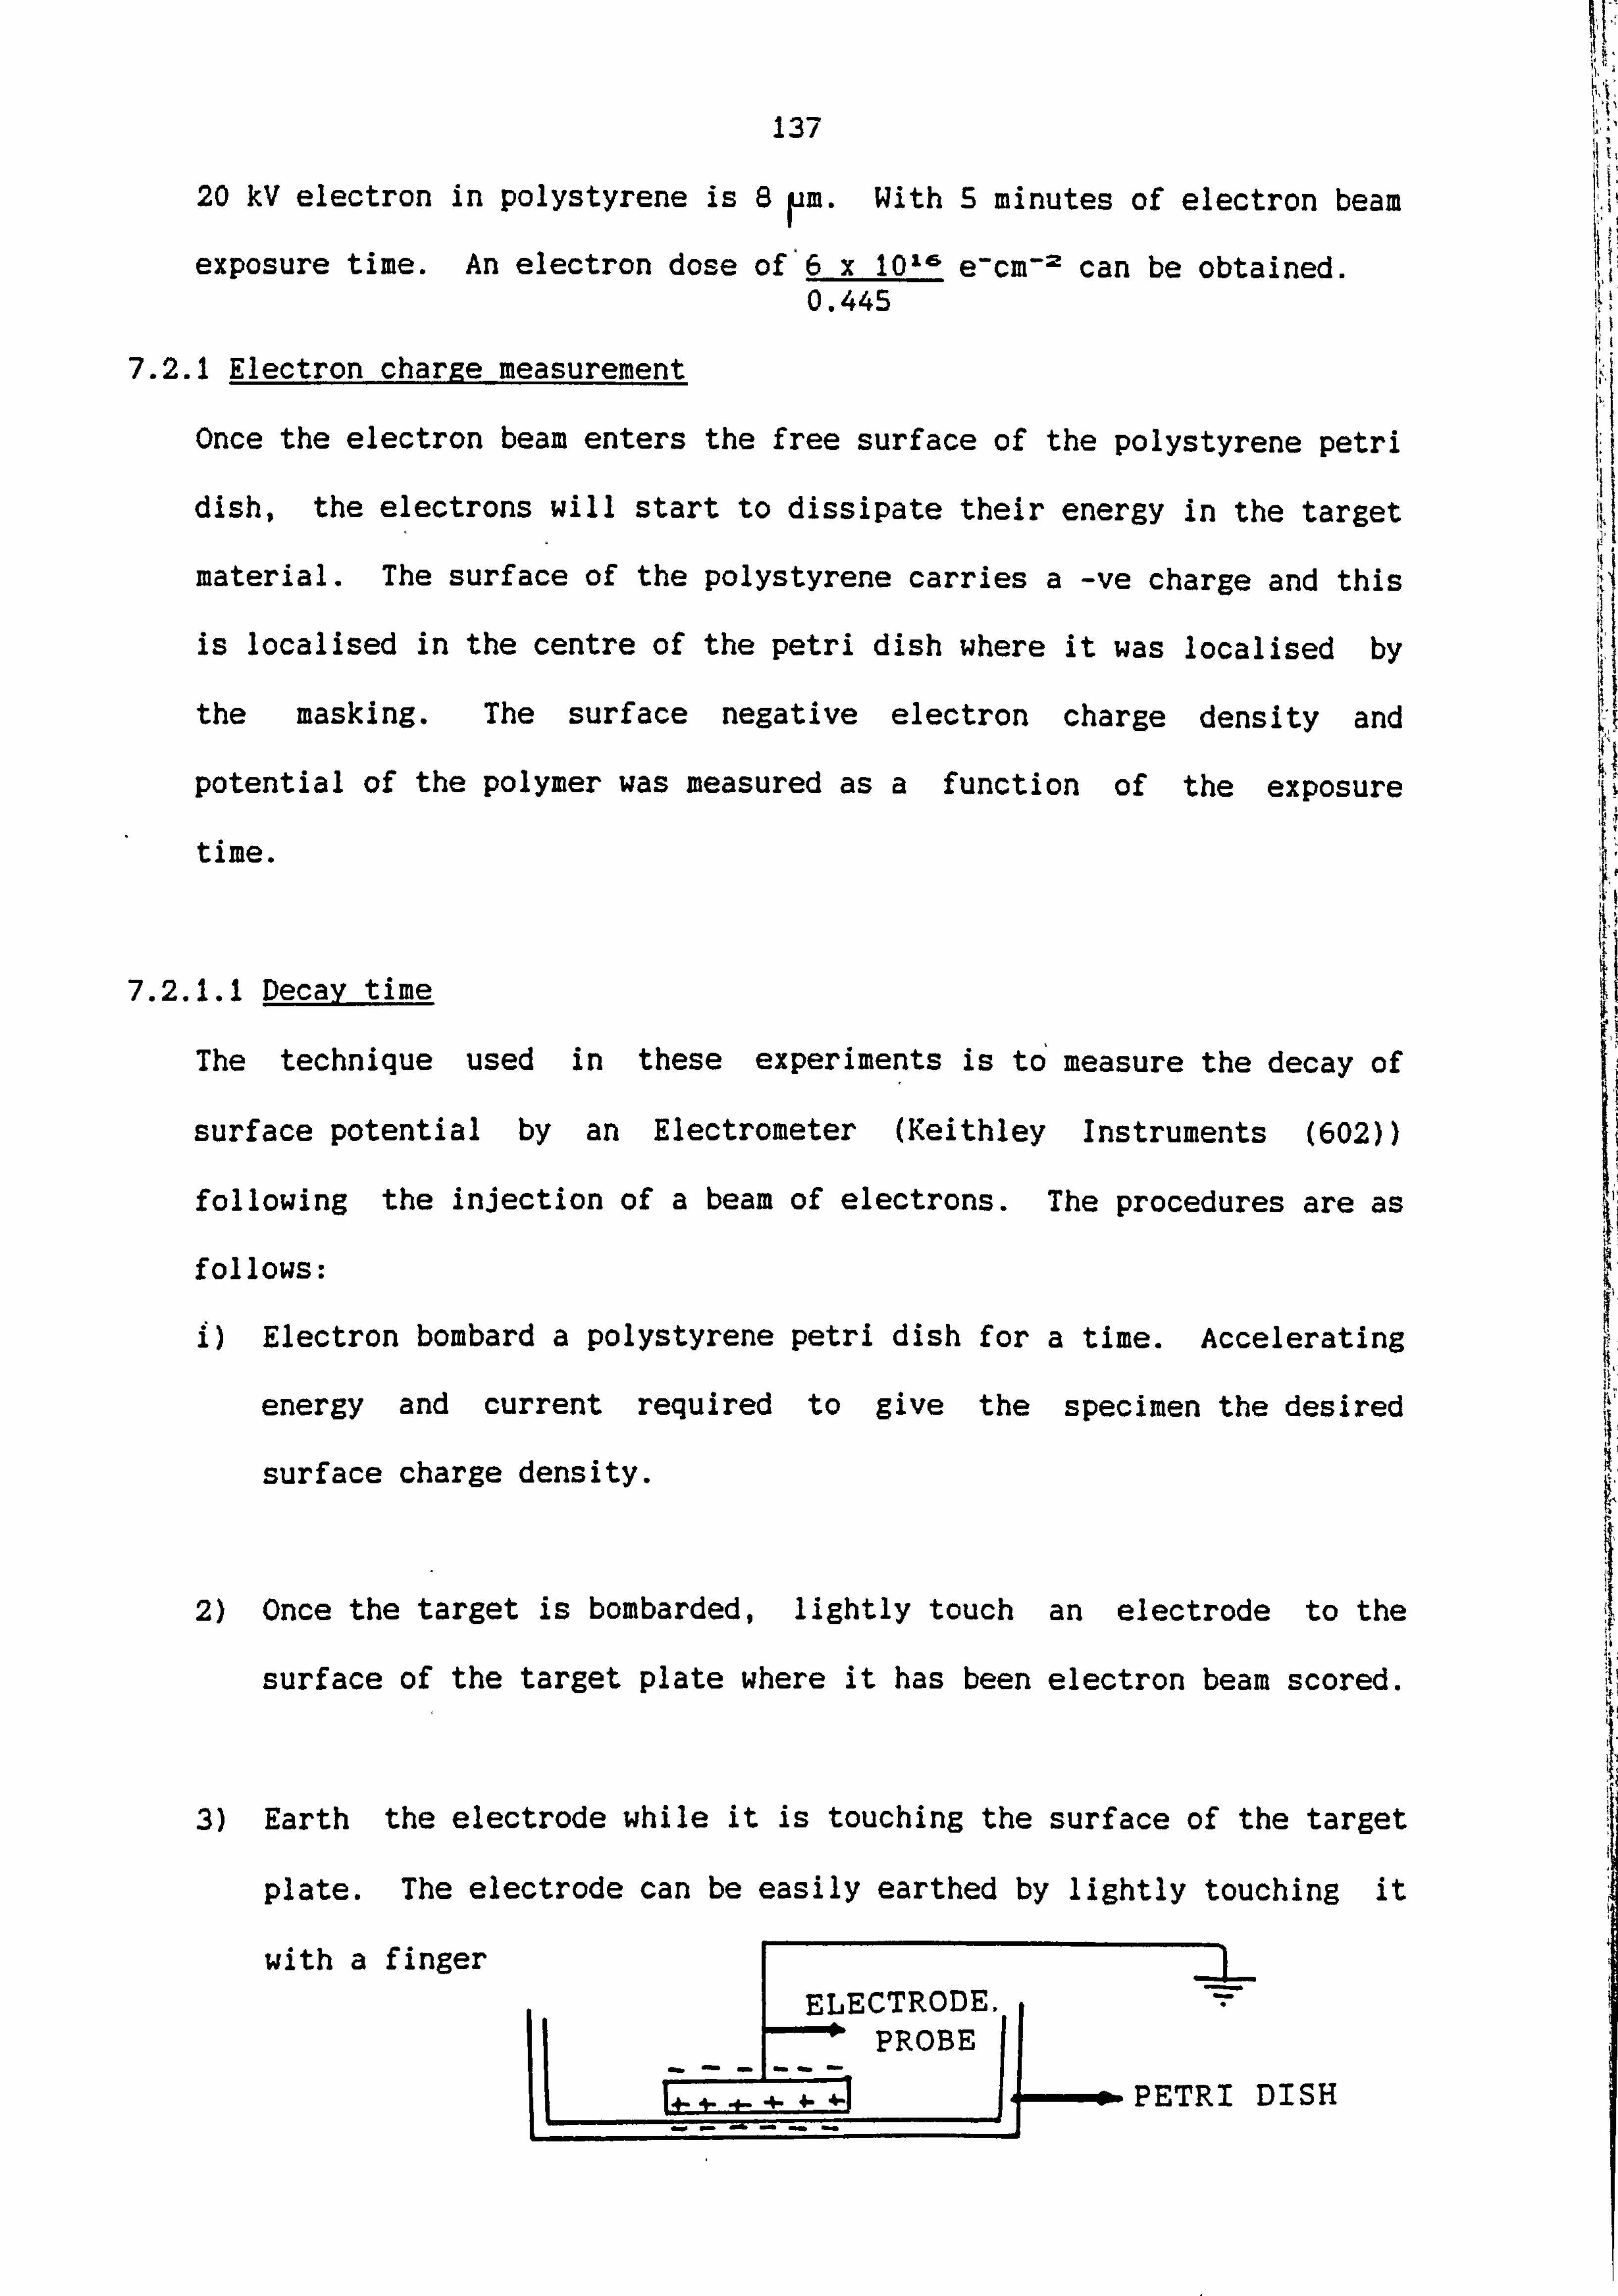
137
20 kV electron in polystyrene is 6Pm. With 5 minutes of electron beam
exposure time. An electron dose of'6 x 10¹¹ e -CM-2 can be obtained. 0.445
7.2.1 Electron charge measurement
Once the electron beam enters the free surface of the polystyrene petri
dish, the electrons will start to dissipate their energy in the target
material. The surface of the polystyrene carries a -ve charge and this
is localised in the centre of the petri dish where it was localised by
the masking. The surface negative electron charge density and
potential of the polymer was measured as a function of the exposure
time.
7.2.1.1 Decay time
The technique used in these experiments is to measure the decay of
surface potential by an Electrometer (Keithley Instruments (602))
following the injection of a beam of electrons. The procedures are as
follows:
1 Electron bombard a polystyrene petri dish for a time. Accelerating 7)
energy and current required to give the specimen the desired
surface charge density.
2) Once the target is bombarded, lightly touch an electrode to the
surface of the target plate where it has been electron beam scored.
3) Earth the electrode while it is touching the surface of the target
plate. The electrode can be easily earthed by lightly touching it
with a finger ELECTRODE.
0' PROBE
L PETRI DISH
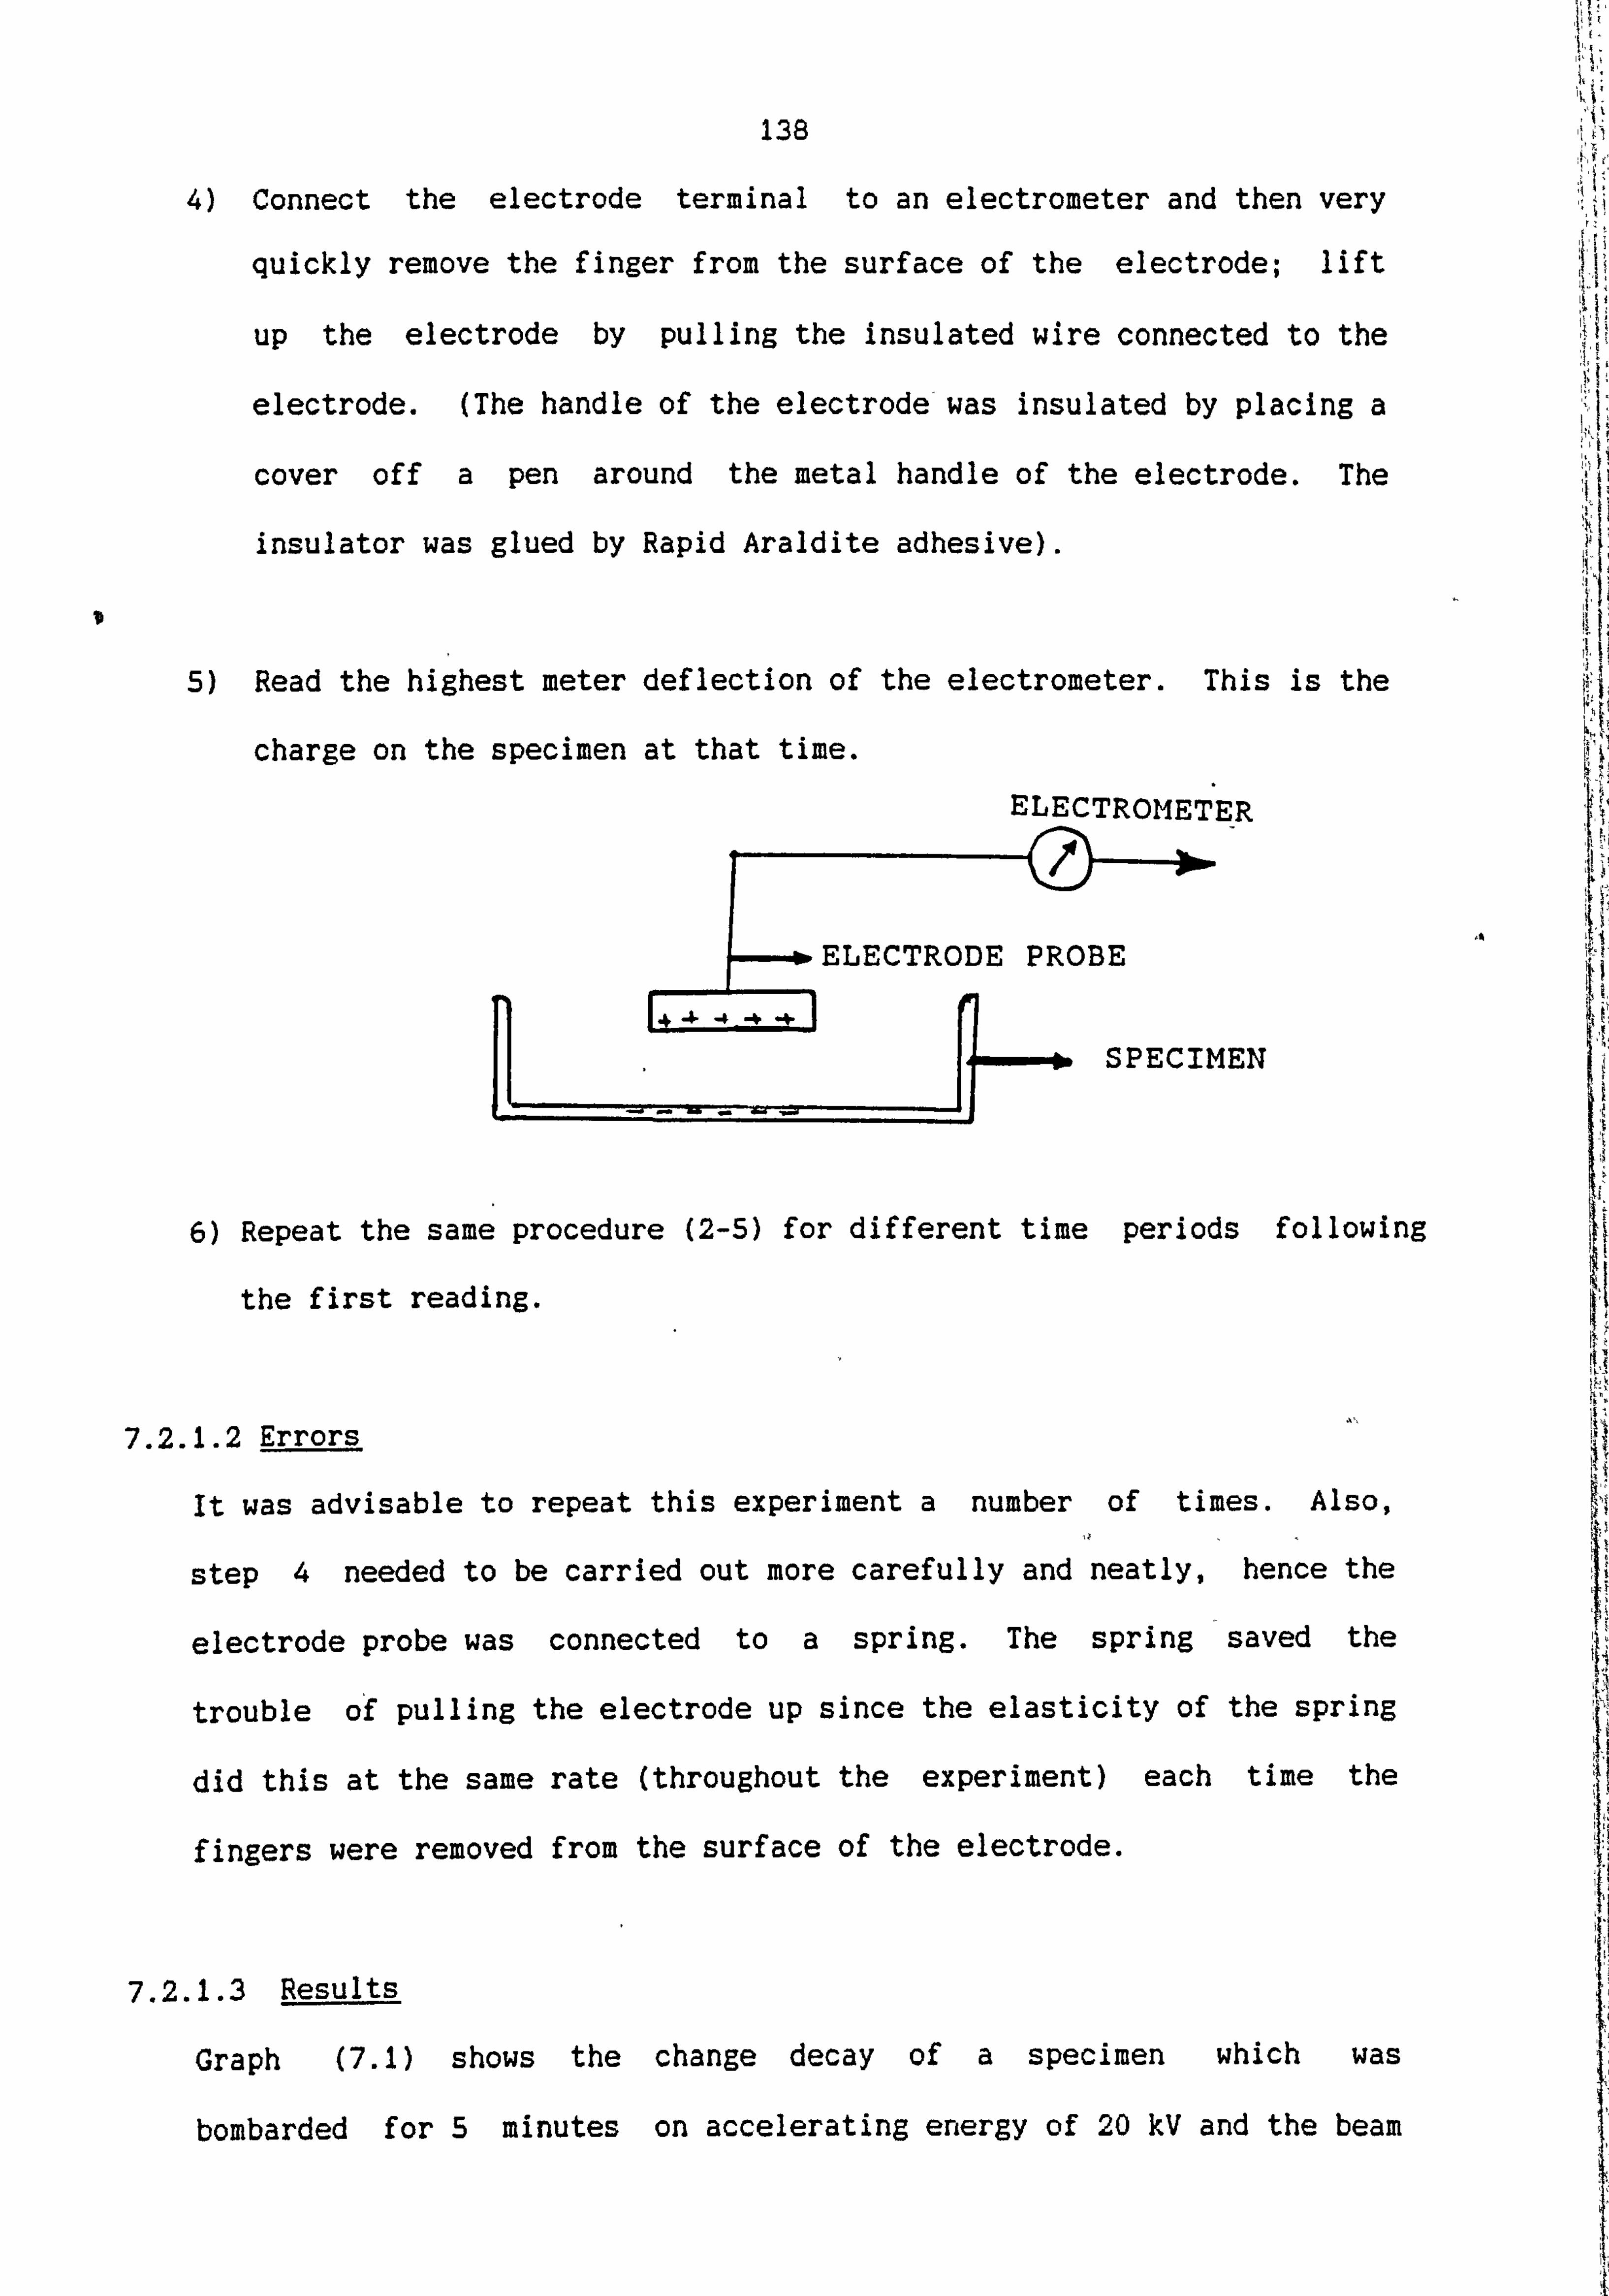
138
4) Connect the electrode terminal to an electrometer and then very
quickly remove the finger from the surface of the electrode; lift
up the electrode by pulling the insulated wire connected to the
electrode. (The handle of the electrode-was insulated by placing a
cover off a pen around the metal handle of the electrode. The
insulator was glued by Rapid Araldite adhesive).
11
5) Read the highest meter deflection of the electrometer. This is the
charge on the specimen at that time.
ELECTROMETER
ELECTRODE PROBE
SPECIMEN
6) Repeat the same procedure (2-5) for different time periods following
the first reading.
7.2.1.2 Errors
It was advisable to repeat this experiment a number of times. Also,
step 4 needed to be carried out more carefully and neatly, hence the
electrode probe was connected to a spring. The spring saved the
trouble of pulling the electrode up since the elasticity of the spring
did this at the same rate (throughout the experiment) each time the
fingers were removed from the surface of the electrode.
7.2.1.3 Results
Graph (7.1) shows the change decay of a specimen which was
bombarded for 5 minutes on accelerating energy of 20 kV and the beam
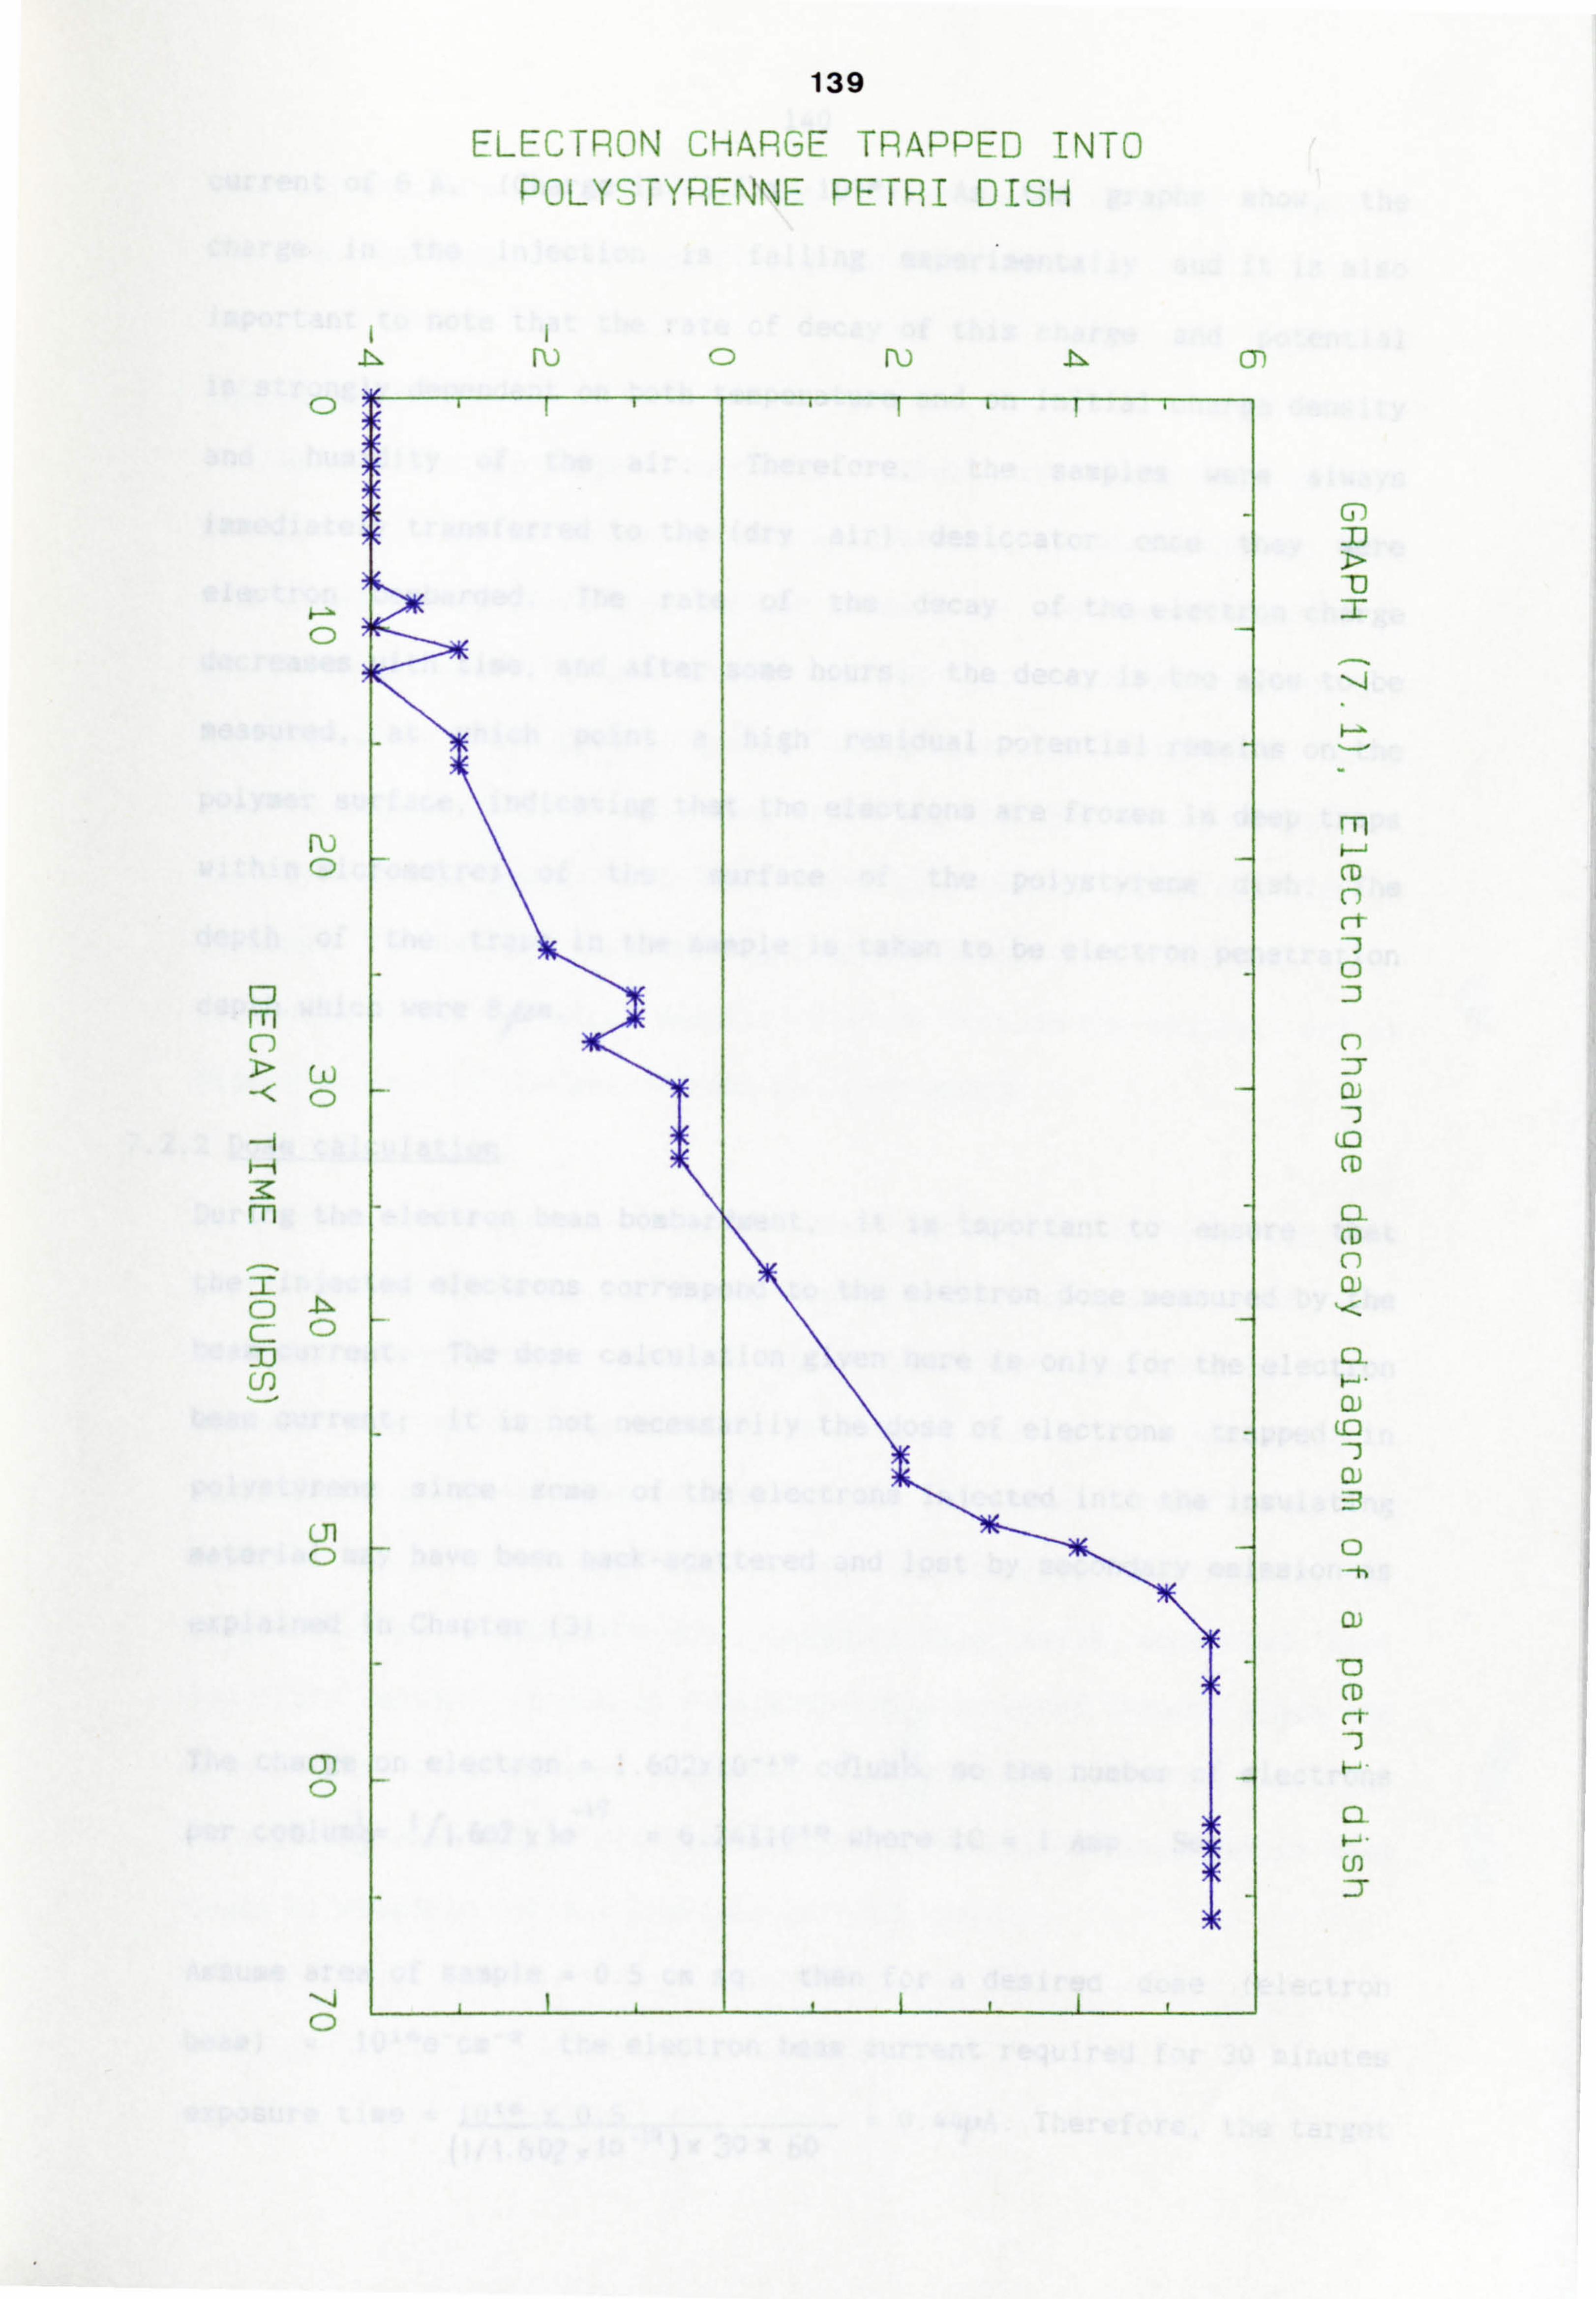
139
FLIF - Fý-., ýN J-1 AP -,, -7 EFAPPFD1NF
POLYSTYRENNE PETRI DISH
rD
4-- fD
R) (D
0 m C-)
Ln
Cil 0
C
---j 0
iI -N PI)
G-)
rn i--- (D
0 J
n
CD
cl (D n 0)
0)
0) 3
0 -h
(D
_T

140
current of 6 A. (Charge is 13.5 x 10"5). As the graphs show, the
charge in the injection is falling experimentally and it is also
important to note that the rate of decay of this charge and potential
is strongly dependent on both temperature and on initial charge density
and humidity of the air. Therefore, the samples were always
immediately transferred to the (dry air) desiccator once they were
electron bombarded. The rate of the decay of the electron charge
decreases with time, and after some hours, the decay is too slow to be
measUred, at which point a high residual potential remains on the
polymer surface, indicating that the electrons are frozen in deep traps
within micrometre! of the surface of the polystyrene dish. The
depth of the traps in the sample is taken to be electron penetration
depth which were 8 ý#M.
7.2.2 Dose calculation
During the electron beam bombardment, it is important to ensure that
the injected electrons correspond to the electron dose measured by the
beam current. The dose calculation given here is only for the electron
beam current; it is not necessarily the dose of electrons trapped in
polystyrene since some of the electrons injected into the insulating
material may have been back-scattered and lost by secondary emission as
explained in Chapter (3).
The'charge on electron = 1.602xIO-19 c(Yluid6', so the number of electrons
per coalu+- 1/1-602 )e Io 6.24X10¹⁸ where 1C =1 Amp. Sec.
Assume area of sample = 0.5 cm sq. then for a desired dose (electron
beam) 10116e- CM-2 the electron beam current required for 30 minutes
exposure time =_)w 30 X 60 0.44pA. Therefore, the target
(1/ 1-602 -w I
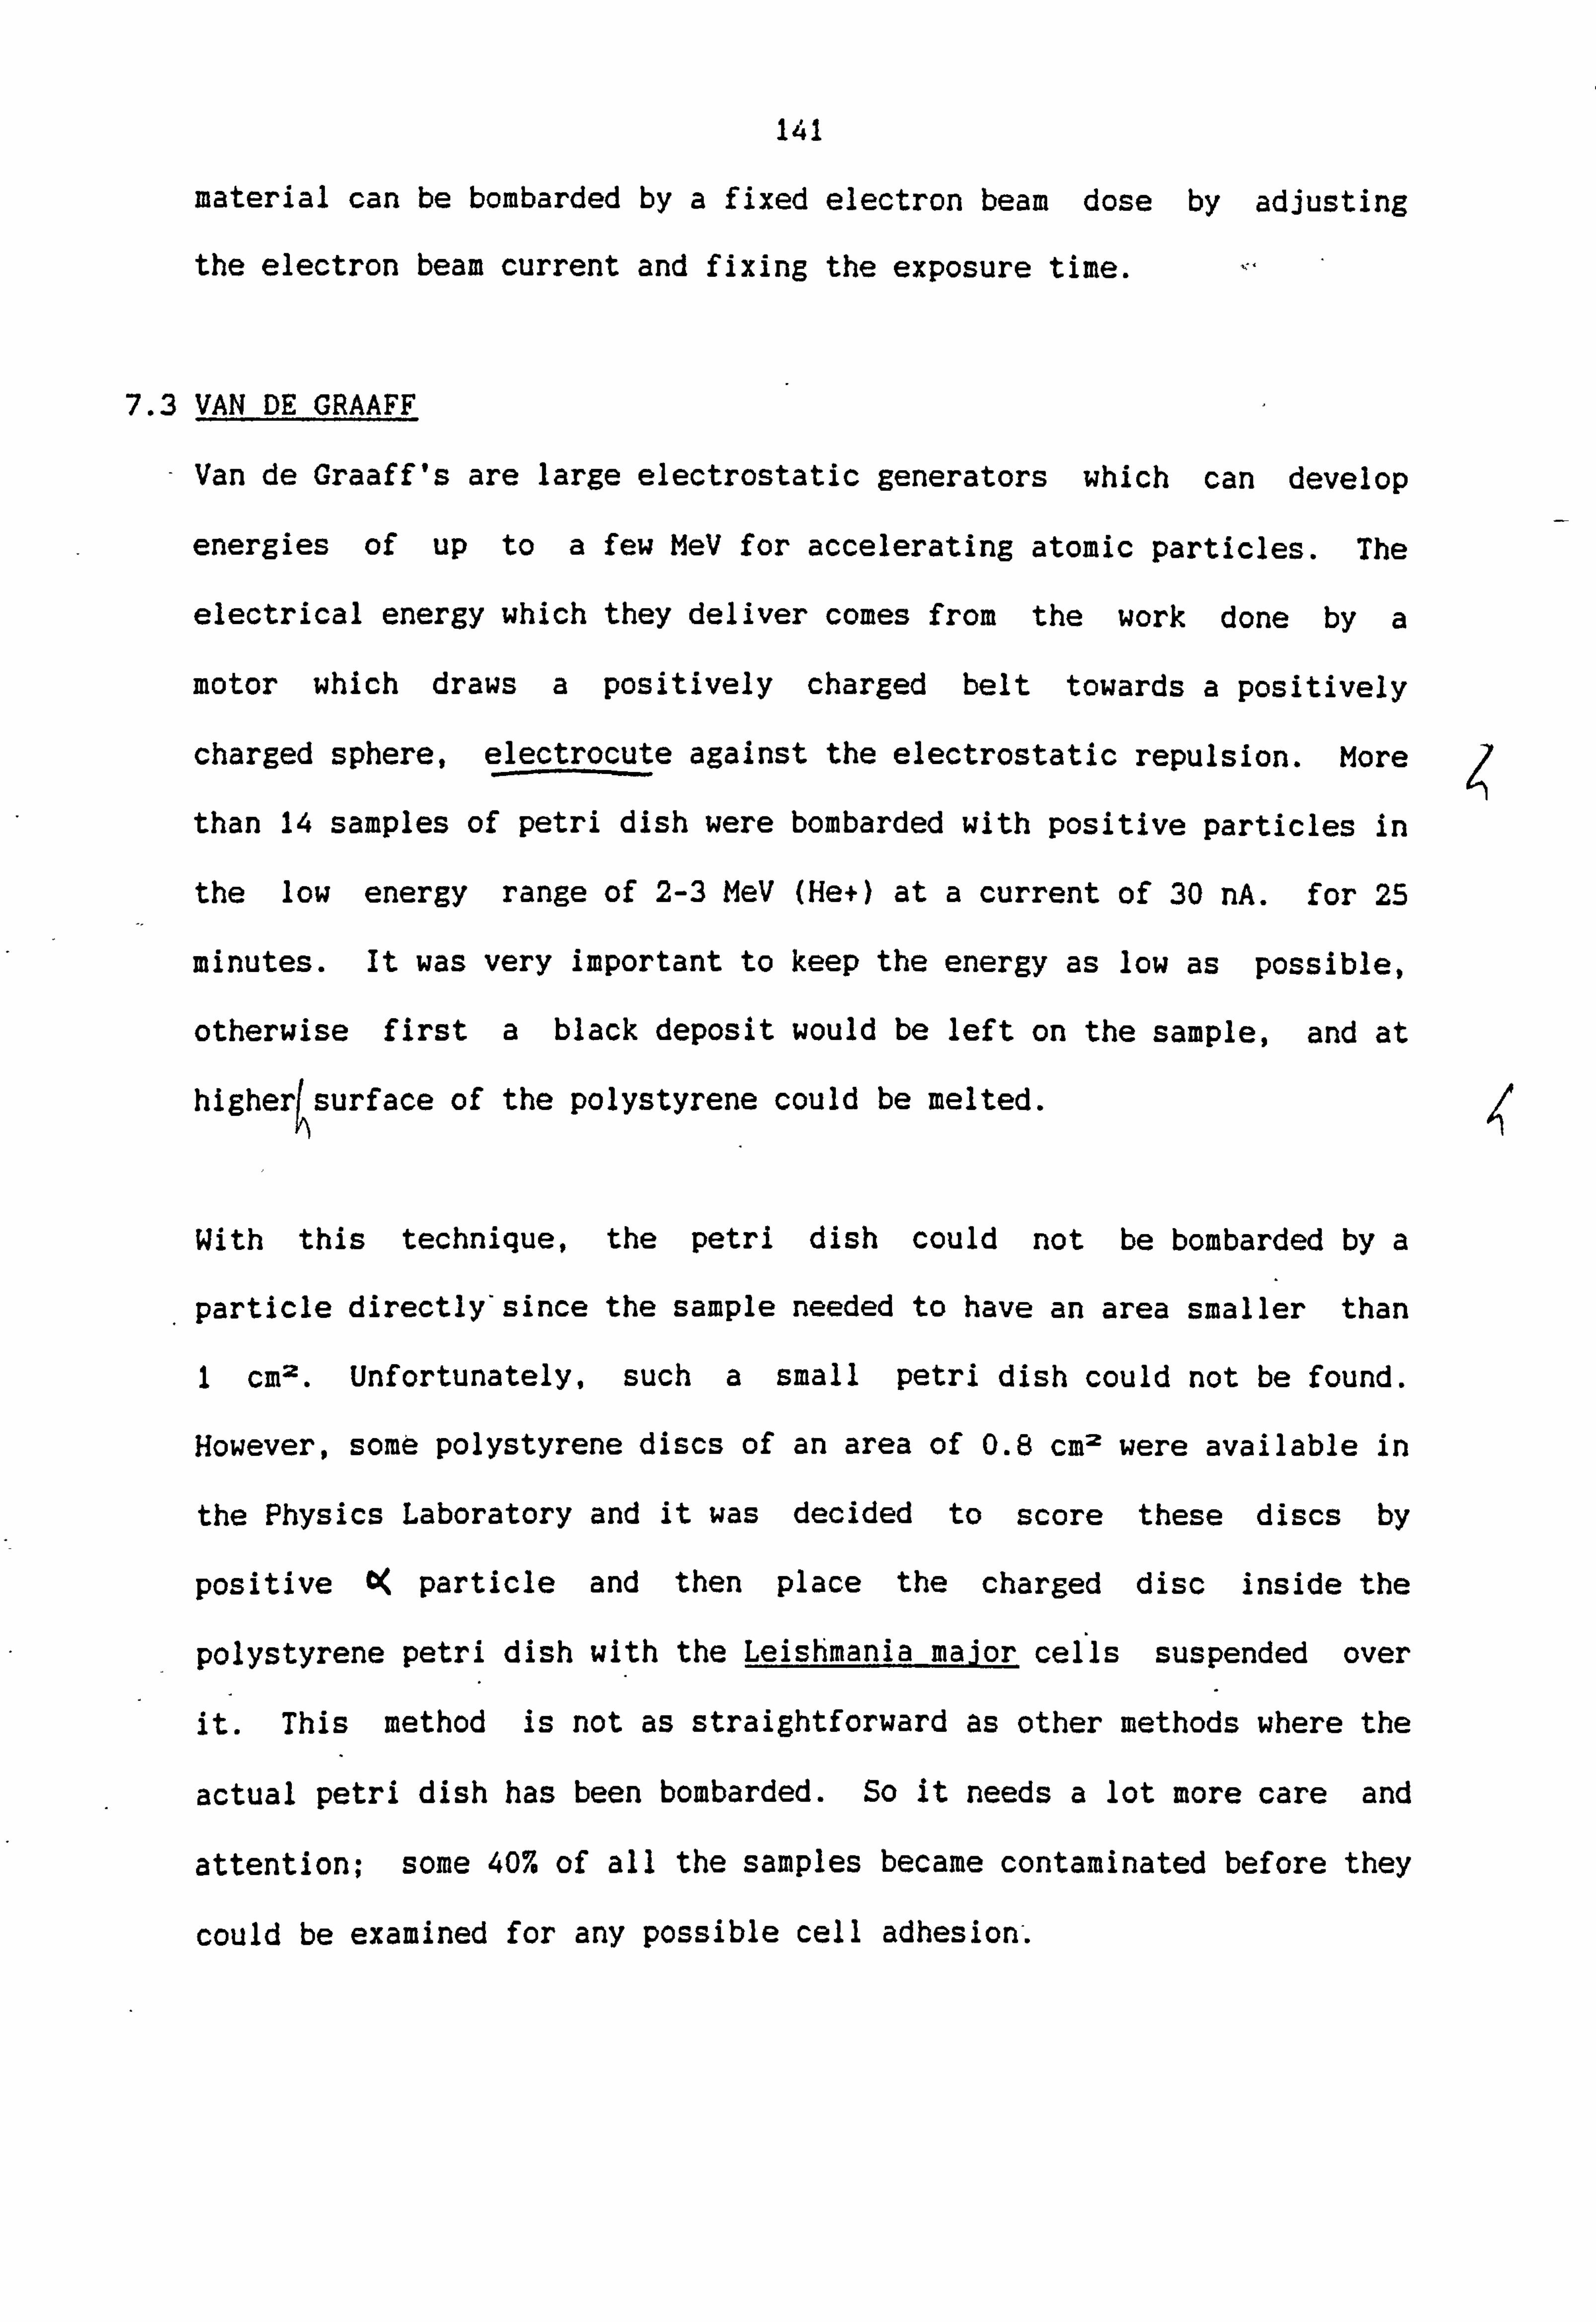
141
material can be bombarded by a fixed electron beam dose by adjusting
the electron beam current and fixing the exposure time.
7.3 VAN DE GRAAFF
Van de Graaff's are large electrostatic generators which can develop
energies of up to a few MeV for accelerating atomic particles. The
electrical energy which they deliver comes from the work done by a
motor which draws a positively charged belt towards a positively
charged sphere, electrocute against the electrostatic repulsion. More
than 14 samples of petri dish were bombarded with positive particles in
the low energy range of 2-3 MeV (He+) at a current of 30 nA. for 25
minutes. It was very important to keep the energy as low as possible,
otherwise first a black deposit would be left on the sample, and at
higherýsurface of the polystyrene could be melted.
With this technique, the petri dish could not be bombarded by a
particle directly'since the sample needed to have an area smaller than
1 cm2. Unfortunately, such a small petri dish could not be found.
However, some polystyrene discs of an area of 0.8 cm2 were available in
the Physics Laboratory and it was decided to score these discs by
positive CK particle and then place the charged disc inside the
polystyrene petri dish with the Leishmania major cells suspended over
it. This method is not as straightforward as other methods where the
actual petri dish has been bombarded. So it needs a lot more care and
attention; some 40% of all the samples became contaminated before they
could be examined for any possible cell adhesion-.

142
7.4 Isotope Separator
The Isotope Separator available in this University is the Harwell Mk. 4
type. Basically it consists of a high current tungsten filament.
Nitrogen gas entering the chamber is ionized, and leaves the source
through a rectangular slit, primarily attracted by an extractor plate
at 2 to 5 kV w. r. t. earth. This produced a high intensity N+ ion beam
for extended periods of time. When in operation, the pressure measured
in the region of the ion source was allowed to rise to the range 5x
10-5 to 2x 10⁻⁴ Pa which enabled a plasma to be maintained.
Although designed to operate at up to 40 kV, and single charged
nitrogen ions, 10,20,30 kV energy were used throughout this research,
it is possible for this type of ion source to produce lower intensity
beams of double or triply charged ions at up to 80 Kev or 120 keV
respectively.
A magnetic separation unit deflects the (N+) ion beam, at the same time
separating the beam into its separate ionic components according to the
projectile mass and energy. This field was adjusted until the required
ion species entered the polystyrene petri dishes inside the target
chamber. The target chamber used to perform the N+ ion implants had a
side loading chamber capable of being evacuated by rotary pump. This
allowed a small number of polystyrene petri dishes to be ion implanted
every day, thus avoiding the necessity of allowing the target chamber's
atmospheric pressure to increase during the target insertion.
Permanent magnets mounted above and below the target chamber provided a
magnetic field which prevented the emission of secondary electrons from
the target during the experiment.
0
143
To produce a uniform implant in polystyrene petri dishes, the N+ ion
beam was swept across the target by superimposition of a sinusoidal
wave form on top of the 30 M acceleration voltage. At this energy,
the ion beam will scan approximately 6 cm. Hence, providing the target
is relatively small compared to this scan, and is situated centrally in
the scan, thenthe (N+) ion beam dwell time on each part of the target
is fairly constant.
However, care had to be taken using this type of N+ ion beam scanning
because, although the original (N+) ion beam is analysed into its
separate components by the magnet, all the components will be scanned.
This may lead to contaminated ions of a suitable mass and charge
reaching the target at the end of each sweep of the beam, and although
the concentration of such ions in the beam may be very low, the
extended dwell time on target of this component can cause measurable
quantities to be implanted.
Using a circular aperture in front of the target, the total area swept
by the ion beam (the implant area) was defined to be a circle with a
diameter of 1 cm (precisely V14 cm2. Hence, by alteration of the
measured beam current to the required level, the dose rate, in units of
ions /CM2 /sec had been set to a desired value of lols .
In the case of this present work, more than 47 samples were N+ ion
implanted with total currents of 10,20,3OpA at energies of 10,20,30
kev to give a total dose of ' 101-1. as this rate of implantation was
concomitant with the prevention of excessive target heating for
exposure times up to 10 minutes. The total flux of ions implanted, in
units of ions/cm', was controlled by the inclusion of a current
144
integrator in the beam current measurement circuit. This device gave a
pulsed output after the passage of a pre-set amount of electrical
charge. As this charge is proportional to the number of ions that have
been implanted, the number of pulses required for the implantation of a
given flux may be calculated. A pulse counter was used to interpose a
shutter into the ion beam path after implantation of the requisite
number of ions.
Following the ion implantation of N+ on polystyrene petri dishes they
were carefully inserted into de sicator (dry air) and were then taken
to the Parasitology Laboratory in the Department of Biology where they
were ready for use in the experiment. The results of possible
attachment of Leishmania major cells to these N+ ion bombarded petri
dishes is discussed in Chapter (9)
7.5 D. C. Plasma Ion-Bombardment System
As we have said in Chapter (3) the ion-bombardment system can use the
ion-plating system with no evaporation sources. There was already an
ion-implanting system available in the laboratory and it was easily
converted for use in the ion-bombardment process. The basic features
of a simple ion plating unit used in this project are shown in Fig
(7.3). There are three main units as follows:

145
Ionization gouge inlet
Ground shield
TMI 7 Substrate
High voltage 17-2 Cathode dark supply space
Viewing Plasma o "window
Current monitor
High current vocluum feedthroughs pump
Fig. (7.3) Schematic diagram of a D. C. plasma bombardment pet-up
A- The vacuum and gas control unit
The reproducibility of ion bombardment required a high vacuum system
and a working gas (plasma). In the ion bombardment processes, suitable
pressures were achieved by using a mechanical rotary pump to rough out
the vacuum chamber from atmospheric pressures down to about 10-1 pa and
then a silicon oil diffusion pump with a liquid nitrogen trap to reduce
the pressure in a short time to 10-4 Pa. Gas used in the ion
bombardment process was nitrogen. The gas flow rate could be monitored
using a suitable flow meter and the flow rate could be controlled using
a fine needle valve or a mass flow controller combined with a magnetic
isolation valve.

146
B- The gas discharge chamber
The conventional ion bombardment process was carried out in a gaseous
discharge and it is essential that the whole substrate (polystyrene
petri dish)'sees the same discharge conditions. It is therefore of
prime importance to have a uniform environment to achieve uniform
electric field distribution and uniform plasma. The system was already
designed symmetrically and if the system is not symmetric, the electric
field will be distorted and there will be a plasma density variation
due to wall losses.
C- The high voltage electrode
As the ion bombarded substrate is usually held at high voltages, it is
necessary to use a reliable electrode that can operate successfully at
different ranges of voltages and temperatures. The system was
previously designed with a substrate holder with a high breakdown
voltage by having a PTFE insulator. Since most of the input power
appears as substrate heating, it was necessary to use the existing
cool-down system for the substrate and the holder which circulated
cooling water through.
The H. V. - d. c. power supplies used in conventional ion bombardment were
capable of supplying a negative voltage of O-SkV to the cathode. This
was not a highly smoothed or regulated power supply but was suitable
for this work. It is important to make sure that the output cable is
strong enough to withstand the maximum d. c. output voltage.
Samples were bombarded by N+ ions in an energy range of 700 to M.
The beam current was started at 150 mA (when the voltage was IkV) and
was gradually reduced to 25 mA as the voltage was dropped to 700 volts.

147
The positive ion was nitrogen and the plates were exposed from as much
as 15 minutes to 90 seconds (700 volts). It is important to point out
that at an energy level of 1keV. with a beam current of 150 mA for an
exposure time of 15 minutes, the surface of the polystyrene was turned
to pale yellow in colour, only at the place where the beam was
bombarded. (The target plate was always covered by a mask with a window
of 1 cm. in diameter in the centre of the polystyrene petri dish).
However, this did not happen as the energy of the beam was dropped to
below 800 volts regardless of the beam current. Therefore, it was
decided to get some infra-red measurements on comparison of bombardment
and non-bombardment of polystyrene petri dishes which have been exposed
to D. C. plasma +ion beams.
7.5.1 Ion bombardment method by D. C. plasma ion
The ion bombardment process was carried out in a nitrogen gas discharge
(similar gas to ion separator). The substrate was continuously
bombarded by the energetic singly charged nitrogen positive ions and
neutrals of the gas subjected to the action of the ultraviolet
radiation emitted from the positive column of the abnormal glow
discharge. When the atoms of the polystyrene petri dish material are
subjected to ion-bombardment of N+ ions, the surface of the polystyrene
would be fractionally ionized.
7.5.2 Infra-red-Measurement
Infra-red spectrum of the samples were taken by the 1710 Fourier
Transform spectrometer. It comprises an optical unit, a visual display
unit (VDU) and control keyboard, a microprocessor control and data
processing system, together with a printer (model PPI). Spectra are
computed from a program by Fourier transformation. The instrument has

148
a single beam and the spectra of a non-bombarded polystyrene petri dish
(control) is obtained from the ratio of spectra with the control in the
beam against a background spectra obtained without a sample. The
control spectra is stored in the instrument and is shown in graph
(7.3).
The control spectra is inverted and which is controlled from the
keyboard. There are three spectra data memories, A, B or C, in which
the inverted control spectra can be stored. A new spectra of +ion
irradiated polystyrene petri dish is obtained. The new spectrum is
added to the inverted control spectrum which is stored in one of the
memories and the difference between the two spectra is obtained as
shown in Figure (7.4). Facilities are provided for absorbance expansion,
digital smoothing and quantitative analysis.
I
Unfortunately the graph (7.4) does not give any definite answer to the
ion charge effect and more likely the change of colour in the
polystyrene petri dish is either due to UV from ions in plasma or
thermal decomposition during the collision of high energy N+ ions with
polystyrene atoms.
ot
105

01
1.5 1. Ll
Err. ri
Z,
n 0 :3 ct 0
C6
0m w. n 5 ct M
0 f-% A)
*a 0
(A ct
v (D
12. p
149
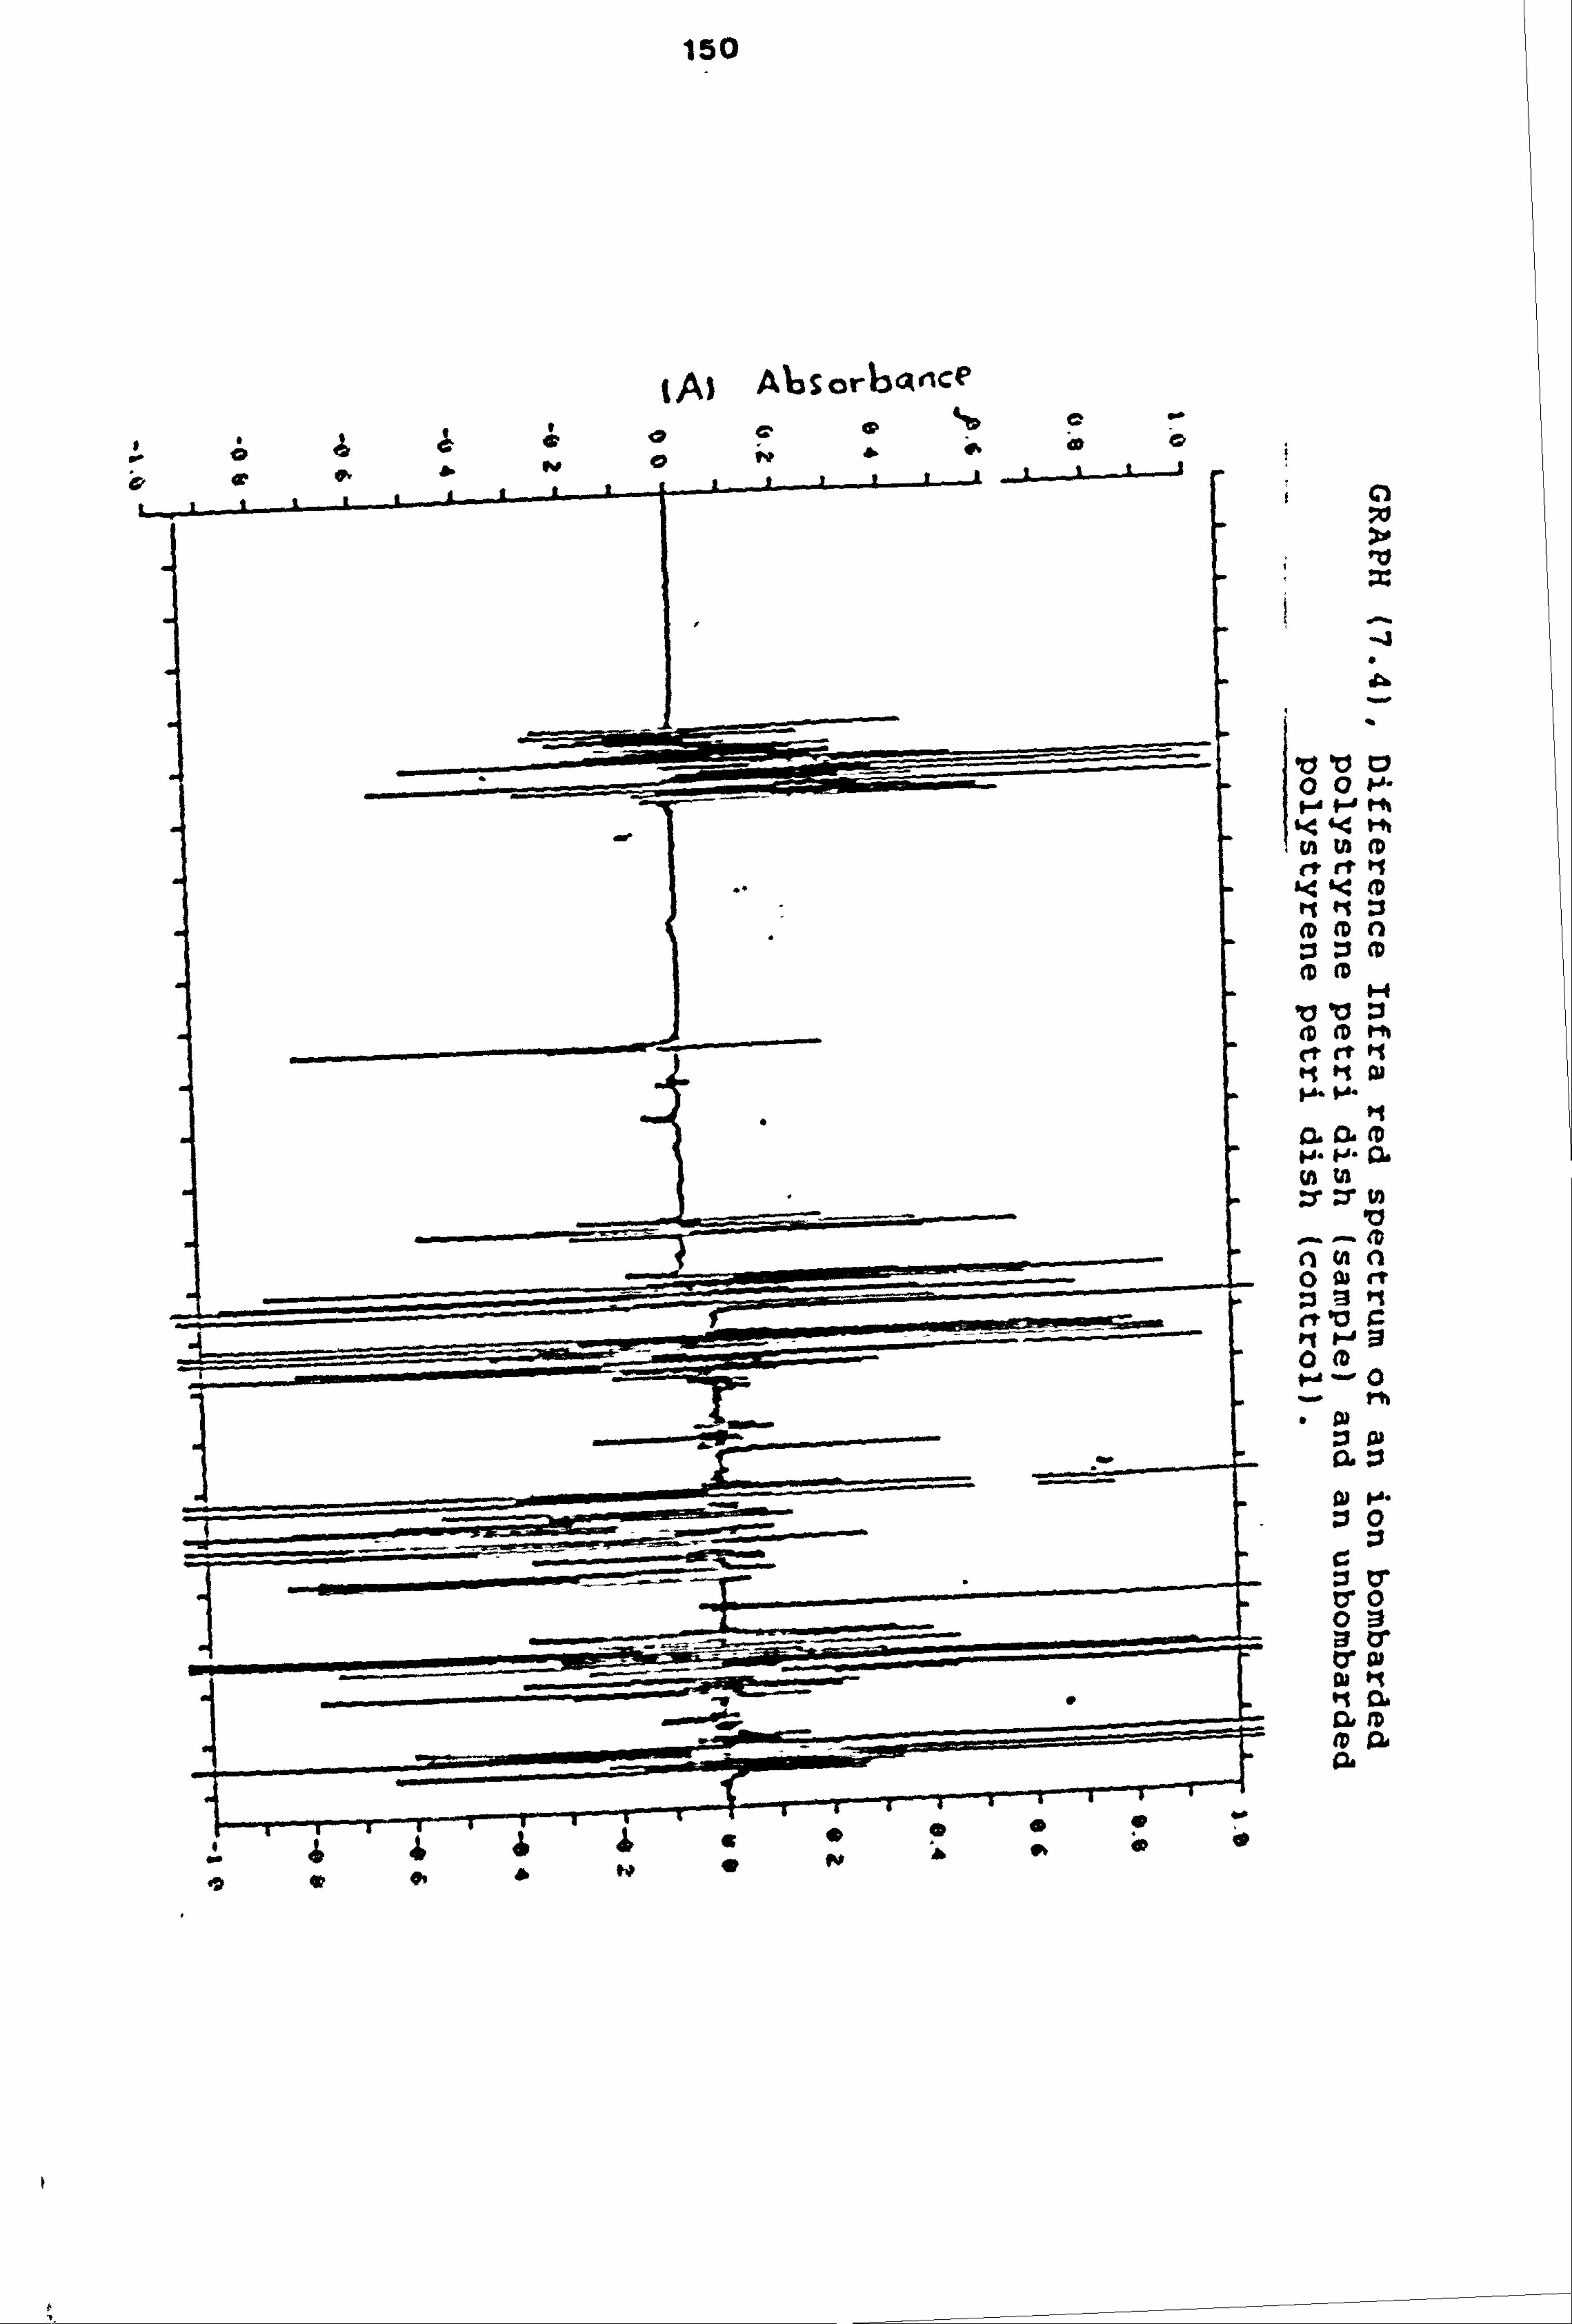
150
tA) AloSorbcxnc'P
4ý ý& 41 p. ' 0
C aC
C)
-4
10 10 W 0 of-- t- W I'% i. e. 44 1-tt
:3m (D
11 " IV
a a. (D ý- H. 0,
zr to
0 :3 e-t V J= #1 1-1 0 0
0
:30
v0 0 ;1 R Cr 0,
00 ID
-2 0 09 &

REFERENCES
1) TUAN? U. C.. SHAN; WU. M. O. and SHUHUA. 0. "Effect of N+ Ion Implantation on Wheat Growth, Institute of Nuclea Sci. & Tech., Chengdu, China. 1985.

CHAPTER 6
EXPERIMENTS WITH CELL OSCILLATION AND ROTATION

151
8.1 Introduction
Frohlich (1) has considered that enzymes and other biological systems
night possess a metastable state with high electric dipole moment,
which would become established when the system Is forced Into large
vibrations through the supply of random energy In excess of some
critical value, and result In the coherent excitation of a single mode
of oscillation, the excitation of a metastable highly polar state and
the possibility of limit cycles.
There are now many published reports that living cells produce natural
A. C. fields (2]. Pohl and Braden 131 concluded that the presence of
natural r. f. electrical oscillation In living cells is well
established. They are present in a wide variety of organisms, and vary
with the physiological state of the organism. This A. C. field pattern
produced by living cells Is nade evident by a gentle dielectrophoretic
force on tiny dielectric particles t4j. Previous works on pearl chain
formation of yeast cells (Saccharomyces -cerevislae)
has proved that
there will be a repulsion force between some of the cells along the
pearl chain as the proton sagnatic resonance conditions are satisfied
exactly with a frequency and a combination of steady and swept magnetic
fleldz (5).
In this project, the natural A. C. field is shown by subjecting either
Leishmania major parasites or yeast Q, ýL) cells to rotating electric
fields.
Pohl and Ziamerman (6-7) were two of the early scientists who observed
the rotation of lone cells while they were studying the pearl chain
formation. (Pearl chain formation is the collection of lone cells).
IS2
This Is an effect of alternating non-uniform electric field
idielectrophoresis) on neutral particles.
In the spinning studies of the given living cells to the rotating
electric field, It was observed that the rotation of these cells
responded rather sharply and In a resonant manner at several
frequencies, hence the term "cellular spin resonance" (CSR). This
thesis reports on a resonance frequency at which nearly all cells
simultaneously spin perpendicular to their axis In the field. the
frequencies of the applied field can be In the order of magnitude
higher than the actual spin rate. The CSR varies with the conductivity
of the medium, with the square of the applied field, with the cell type
and phase of the cell life cycle, and age of the colony. Living cells
respond readily and Individually and are sharply resonant. Dead cells
show no response.
There Is no CSR In D. C. signals, frox the behaviour of the CSR In
sinusoidal A. C, signals, it appears likely that one cause of CSR at
least that In high frequency electric fields Is the presence of natural-
r-j. Oscillationj arising from the cells. The cell resonance
frequencies observed vary from species to species for yeast cells
(S-acchAr2pYcr, s-cerevls1. aq) It Is 12 kHz, (Lelshmanja major) parasites
It Is 10 kj4z,
The present work reports on fie sharply resonant character of the
spinning response of (ýaccharoxyctj cerevislo ) and LeIghmania major
cells to applied frequencies.
All the measurements reported In this chapter made use of either
153
platinum or gold vacuum deposited thin film metal electrodes. The
electrodes were 50pax thick which will generate a very strong field at
the edges. The use of such electrodes allows the observations to be
carried out at high optical magnification so that a single cell can be
observed directly In the centre of the chamber and far from the
electrodes and other cells. It can be seen rotating or spinning in the
rotating electric field, with a rotating frequency of about 10 Hz
(strobe Illux. ) - something that no other researcher cited In this area
has managed to observe. This method also provides a simple and
straightforward method for obtaining the dielectric properties of
Individual cells (8]. However, before we describe the CSR of both
Leishmania parasites and yeast cells, attention needs to be directed to
some Interesting effects of non-uniform electric fields on these
biological organisms In Hz. and sub-Hz. ranges.
8.2 Action of Non-uniform Electric Fields-on-Leishmania-and Yeast Cells I
Dielectrophoresis - the action of alternating non-uniform electric
fields on neutral particles has recently been receiving Increased
attention. The most obvious effect Is the "pearl chain" formation of
cells (or yield) along the field lines In the space between and at the
surface of the electrodes.
In the experimental study of pearl chain formation of cells, numerous
experimental techniques are now available. It Is our purpose here to
add a new and simple physical technique to the array of methods
available for the study of pearl chain formation in sub-audio range.
Recently Pethig et al (14) has employed an optical technique for
studying the dielectrophoretic behaviour of colloidal particles at low
154
frequences. He has shown that the large. low frequency,
dielectrophoretic response for their particle is associated with
surface charge and surface conductivity effects. The "pearl chain"
fornation technique used In this work consists of placing a suspension
of cells between two parallel plate vacuum sputtered metal electrodes
prepared as explained In Chapter (4).
Cells of Saccharomyceg-cerevlsiae and Leishmania-maJor cells In media
of low conductivity were prepared by centrifuging freshly harvested
cells from the growth medium. rejecting the supernatant liquid,
rediluting the cells with 0.25 M sucrose in delonised water,
centrifuging again, until the overall resistivity of the suspension was
at least 200 kA/cm. This conductivity was checked by a conductivity
measuring bridge (Type MC3. Switchgear Ltd. ). The preparation was then
examined for observation and concentration measurements.
It Is Important for all the cells to be synchronised In respect of cell
division cycles so the cells are In some period of growth while the
experiment Is taking place. The procedure for cell synchronisation Is
described in Chapter (1).
8.2.1 Observati2n of Pearl Chlins at-Sub-audio-Frequences
Observations of pearl chain at Hz. and sub-Hz. range frequencies for
given calls revealed the oscillatory motion of "pearl chains". For
this experiment a low frequency function generator (model 202A Hewlett
Packard Ltd. ) was connected to a pair of thin film vacuum metal
electrodes and the *pearl chains" were observed under the microsope.
The Worlty of the "pearl chains" were oscillating "back and forth"
towards each electrode except for a minority which were oscillating in
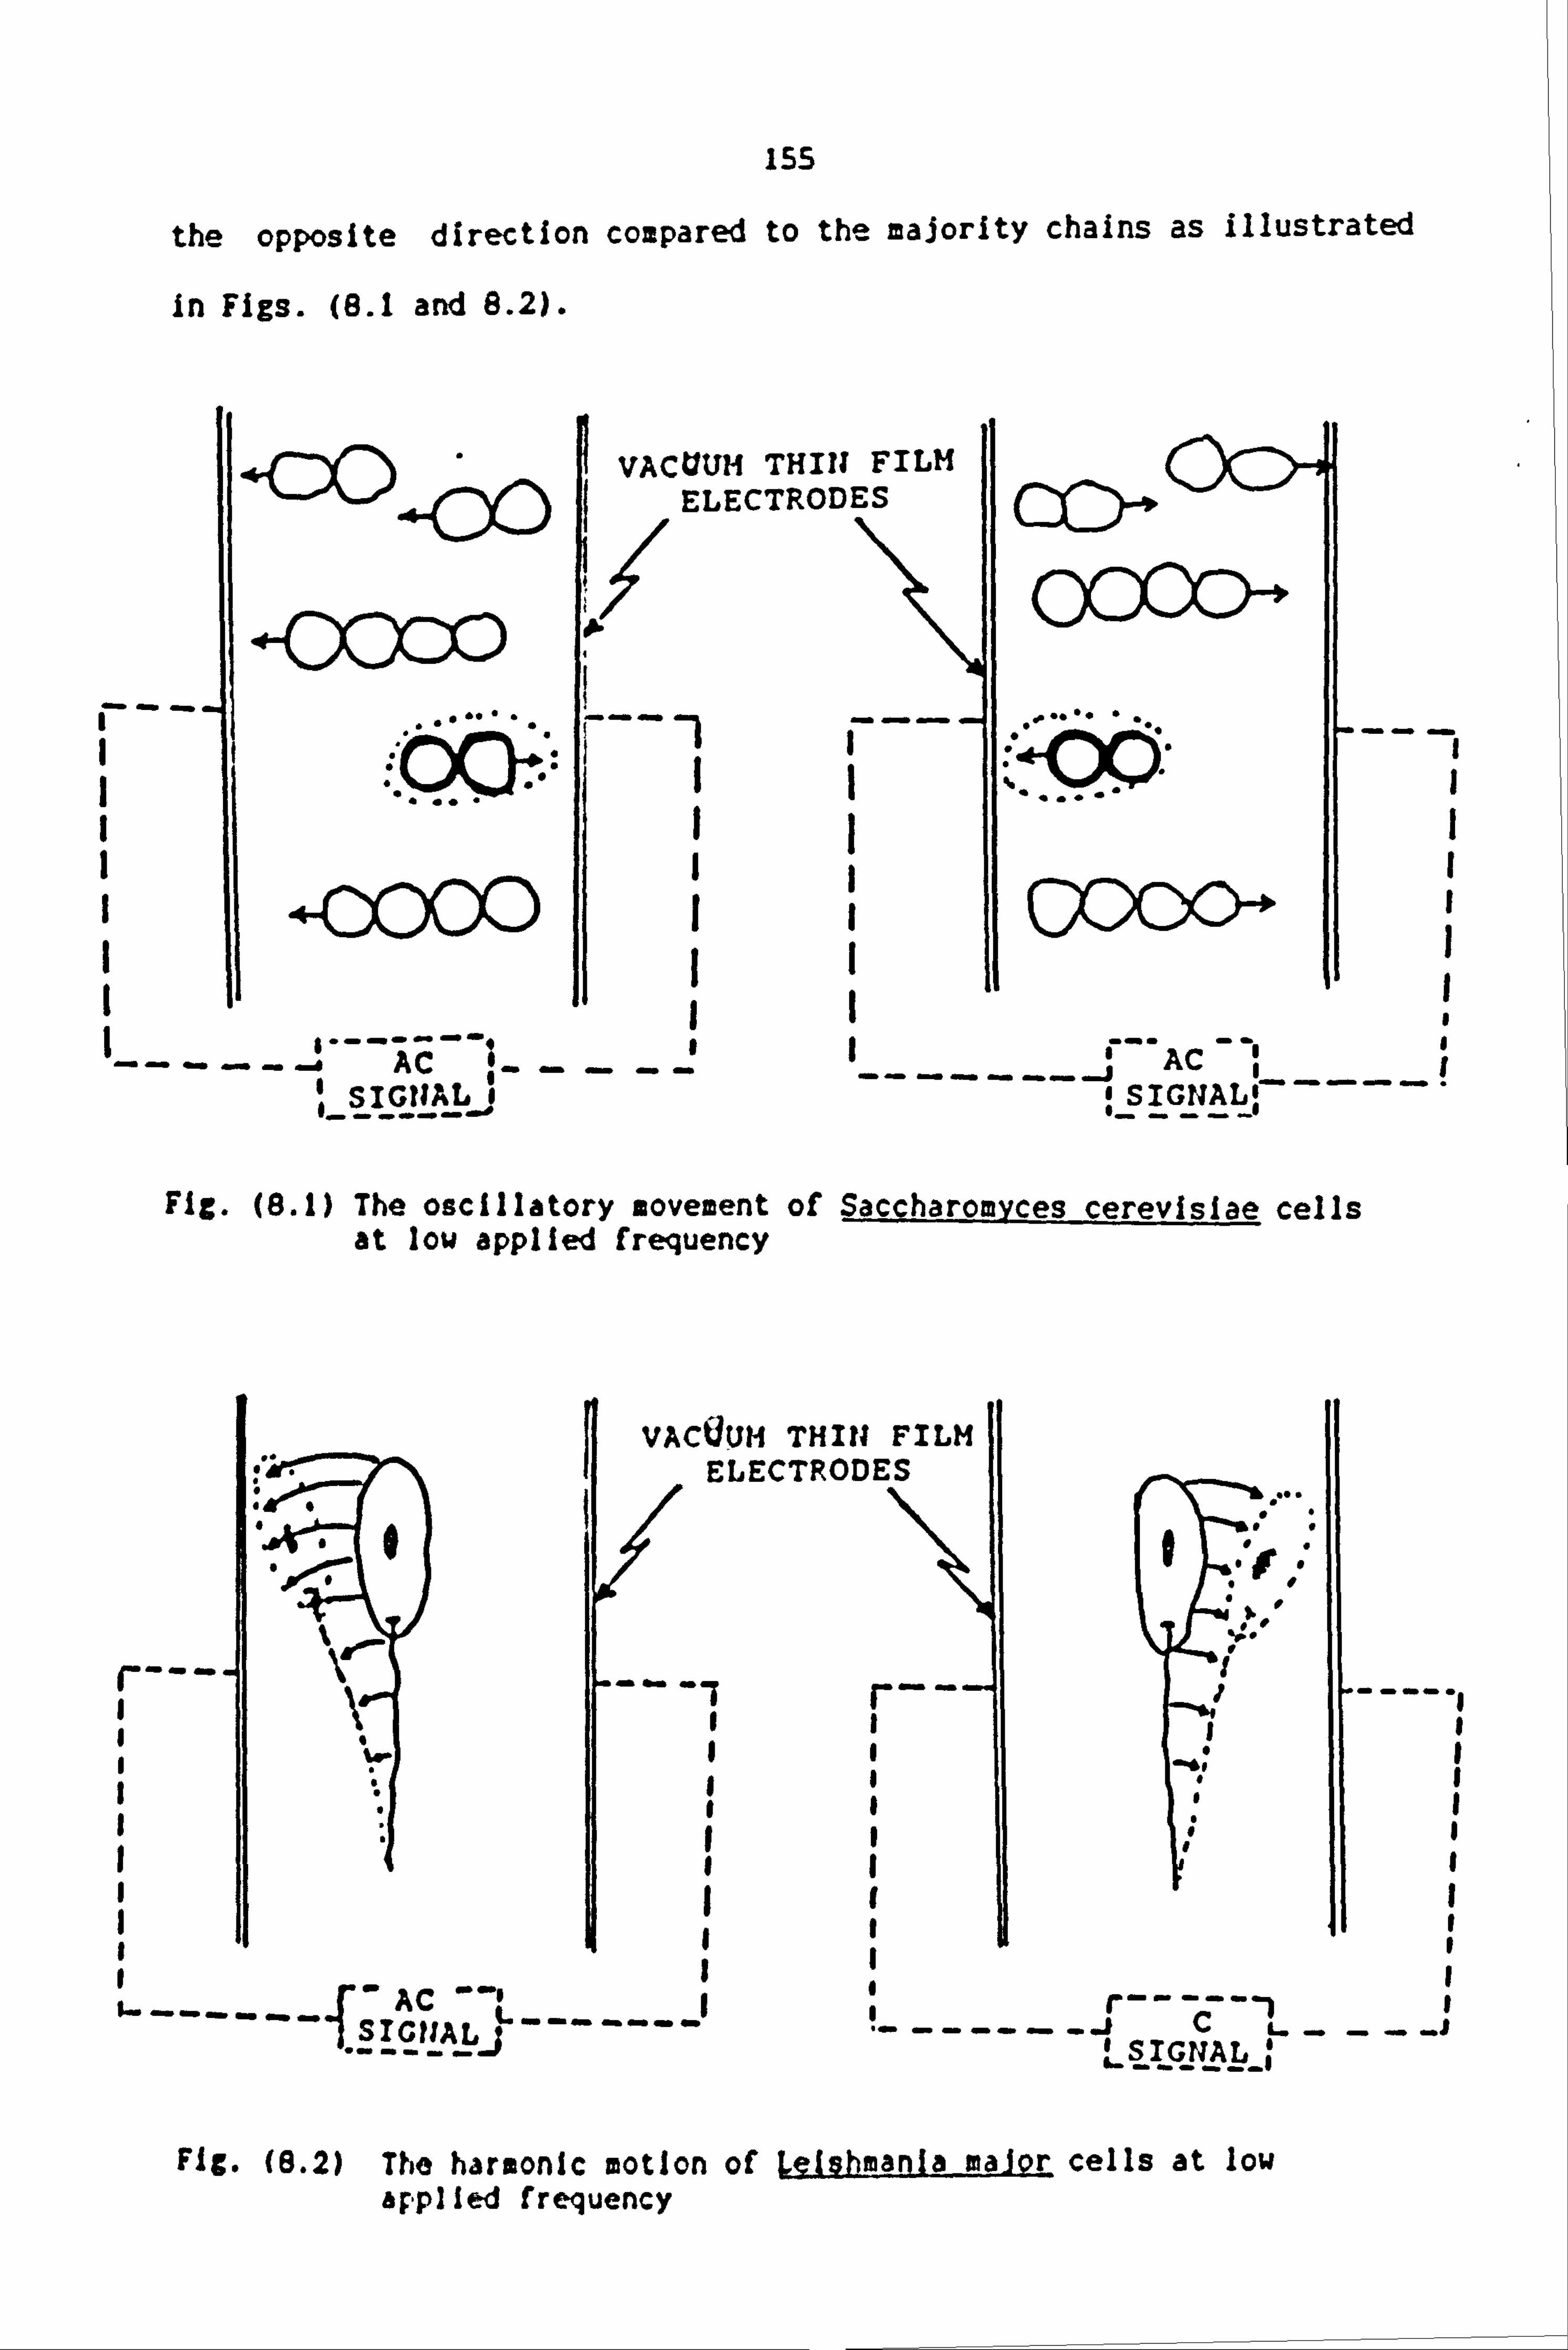
155
the opposite direction compared to the majority chains as Illustrated
In Figs. (8.1 and 8.2).
<DD ' -*. -(DO
4-0000
r. 4OZXYD I I I
---- ._---1--
I I
--
VACUUM THIN FILM ELECTRODES CD-01
AC :j ICýNAIýll-
Fig. (8.1) The oscillatory movement of Saccharomyces cerevislae cells at low applied frequency
AC
VACUUM THIN FILM ELECTRODES
I II I" Ii I I I-., I,
I I. I' I
I ii I I r"
II I
r_- I "'
ISI II II
L: jIGNAL I
Fig. (8.2) The harmonic motion of Lefshmania major cells at low applied frequency
156
This alternating movement of chains of cells implies that there are the
charge phenomena of electrophoresis associated with the cells.
Different groups of cells In the same suspension appear to have
different surface charges. The behaviour of a chain of cells at, low
frequency is known to be an electrophoresis effect. As described in
Chapter (2) the electrophoresis force is directly proportional to the
field and to the charge, and Its polarity reverses the effect while the
dielectrophoresis force (equation (2.7)) is directly proportional to
the square of the field. across the electrodes, and Is independent of
any sign of change of the charge across the electrodes.
One Interesting point about the oscillatory motion of parasites is the
way In which Leishmania pajo cells move back and forth In a sub-audio
frequency range. Lejahmanta major cells do not have the sphere shaped
body of yeast Q. &J cells. They have an elongated unflagellate
measuring 4 to 40! ou a In total length; they are free-swimming and are
attached to the anterior sites (cell body) of the organism, Their
oscillation can best be described as a simple harmonic motion where the
anterior sites of the organism (cell body) would look as a small mass
attached to the end of a 40.. A, 2 length of wire (flagellum), where the
other end of the wire (flagellum) is fixed (pivoted) with no
oscillation. and the call body oscillator swings to-and-fro along the
arc of a circle off centre of the free end of the flagellum.
Any Increase In voltage amplitude of the waveform generator for a fixed
frequency of the sub-audio waveform generator would Increase the angle
of the oscillation of the cell body. Obviously the angle of the
oscillation decreases If the voltage of the generator Is reduced. Very
similarly to yeast cells, as the frequency Increases, the frequency of
157
oscillation increases and they are very nearly related. As a typical
example, when the frequency of the oscillation was kept at 0.5 Hz., the
Leishmania cells were oscillating at 0.6 Hz. However, when the
frequency of the oscillation was increased to 3 Hz. it similarly
increased the oscillation of the cell to 2.89 Hz. At a waveform
frequency of 11 Hz. the cells were still oscillating very rapidly
although they appeared to be stationary because the amplitude of
oscillation is small while its frequency has increased..
Graph (8.1) shows more such results for Leishmania major parasite
cells.
During the work reported in this chapter, a rotational phenomena of the
cells about an axis through their centres was noticed. Here the cells
spin on an axis normal both to the magnetic field lines and to the
surface of the slide, at a rate of a few revolutions per second. This
can be seen to occur with certain cells at almost any applied frequency
and anywhere in the field, irrespective of whether the cell is attached
to an electrode, attached to another cell, or floating freely in the
medium. It is not unusual to see several cells of a long attached
chain rotating individually in their places. This implies that the
contact is non-adhesive.
From the preliminary observations of the cell rotation, it was clear
that it definitely needed further investigation, and the results of
these investigations are presented in the next part of this chapter.
8.3 Experiments involving cell rotation
Previous investigations (2] have shown that the live microscopic

158
FR. EQUENCY OF OSCILLATION
CD Ri -N CT) CD
m
m Z
CD ri
-i
U) ý_i G-) Z
r-
co
Q
(H
0 P3
(D
cn 0 C-tl 0 0 >ý 7D (D 70 ci
n
(D ci
M 3D
ID T-
0 U) n
CL) C-t- 0
0 rt ý-J- 0 0
0 --h
n (D
CO
159
particles and suspended cells can rotate (6-7) at certain frequencies
in an alternating electric field.
Experiments on cellular rotation have usually been performed on a
single rotating cell in the centre of the electrodes. The biological
variances play a more important role than in the "pearl chain"
formation where there is a collection of cells which may also interact
co-operatively. Due to this fact, this experiment was the most
laborious part for this programme of research. Investigations were
time-consuming, as the state of rotation is very labile and the
rotating cells may suddenly develop a tendency to stick to the
electrodes without rotation, to aggregate with other cells or just to
disappear into the inter-electrode space.
From the present experiments a graph was plotted (Graph (8.2)]
showing: - frequency of rotation of Leishmania major and yeast
(Saccharomyces cerevisiae) cells as a function of the frequency of the
alternating field, the frequency of rotation of the given cells as a
function of applied voltage. In a pearl chain formation, rotation of
given cells can be used to distinguish between living and dead cells.
8.3.1 Procedure
Rotational experiments were carried out under the Olympus (model BHB
413LS) phase contrast microscope. The experimental set-up consisted of
an electrode chamber, with either three or four symmetrically arranged
vacuum sputtered metal electrodes as described in Chapter (4). Each
individual electrode was connected to an output of a polyphase rotating
field generator. This was done by fine wires 30 cm long which had one
miniature crocodile ciip attached to each end of the wires. The

160
circuits that produce the rotating electric fields are discussed in
Chapter (5). All the experiments were performed at room temperature.
Yeast cells (Saccharomyces cerevisiae) were grown on sterile liquid
medium (Appendix M) for various periods until the reached the
expontental phase. The cellular suspension was then centrifuged at
200g for 2 minutes, and the supernate rejected. The cells were re-
suspended in deionized water and again sedimented by centrifugation at
200g for 2 minutes, and the supernate again rejected. This
purification, or washing was repeated 4 times, the final suspension
typically having a specific resistivity in excess of 200 KJIr_m. This
suspension was then diluted with deionized 0.25M sucrose in water and
used in the CSR studies.
For cell rotation experiments Leishmania major. promostigotes, cultured
in Schneiders Drosophila medium, were rinsed twice in phosphate
buffered saline (PBS) PH 7.2 by centrifution (10OOg-- 10 mins) and re-
suspended in 10% (w/v) glucose in distilled water to reduce the I
conductivity of the medium without subjecting the cells to hypo-
osomotic shock.
8.3.2 Problems associated with CSR studies
In this experiment it was observed that once the magnitude of the
voltage applied to electrodes was increased at high frequency (>60
kHz), the rotation speed of cells were also increased in the same
direction. Therefore it was not possible to measure the frequency of
cellular rotation by a naked eye through the eyepiece. and it was
decided to do stroboscopic measurements as described below.
161
The principle of stroboscopic measurements rests on a comparison of the
known flashing speed of a lamp with the unknown speed of rotating yeast
cells. If a rotating yeast cell with a nearly constant speed is viewed
through an optical microscope when illuminated by a flashing light of
controllable frequency. The continuous train of flashes coming from
the stroboscope was shone into the mirror of an optical microscope
(Olympus model HSC) and was thereby directed to the electrode chambers.
The eye then perceives conditions of motion of this cell which depend
upon its speed relative to the frequency of the light source, i. e. upon
the particular positions, during its rotation, at which the yeast cell
is seen.
When the rate of viewing is identical with the rate of rotation of
yeast cells, movement of the cell appears to be arrested, since any
given point on it is in the same position each time it is illuminated.
If the rate of viewing through the eyepiece is slightly lower than the
rate of rotation, the body appears to rotate at a slow speed in its
actual direction of rotation. This is because any given point on the
cell advances slightly each time it is seen, owing to the longer time
between observations.
Should the rate of viewing be slightly faster than the rate of
rotation, the cell appears to rotate at a slower speed in reverse
because the interval between observations is shortened and thus each
successive view is of points on the cell which follow each other into
the field of vision in the direction opposite to the actual rotation.
In practice, the cells never seemed to be stationary and they always
had a very slow rotation even at the minimum rotation which was always

162
looked for. This is probably because the cells do not all have the
same and uniform rotation speed.
8.3.3 Sources of error
One of the most likely sources of the error is the accidental change in
the conductivity of the suspension, especially when working with low
conductivities. This can occur when the suspension comes in contact
with any surface where ions are present. Ions can be easily
transferred from fingers to the suspension. It is good practice for
the experimenter to wear sterilized plastic gloves during the
experimental procedure.
Another source of the error, is enhanced evaporation due to draughts in
the laboratory. It was found advisable whenever the experiment was in
progress, to have all the windows and doors closed. Any change in
conditions was especially troublesome. Any draught occurring in the
middle of the experiment might increase evaporation and by surface
tension effects move the position of the cell in the chamber. The CSR
experiments in particular, were performed using a single cell
throughout.
Draughts either resulted in evaporation from the edges of the cover
slips and hence gave rise to concentration gradients in the suspension
of the cells, or resulted in thermal gradients due to heating or
cooling of the slide.
8.3.4 Results
During the course of this experiment, several phenomena were noticed
concerning the rotation of yeast cells. These were associated with (a)
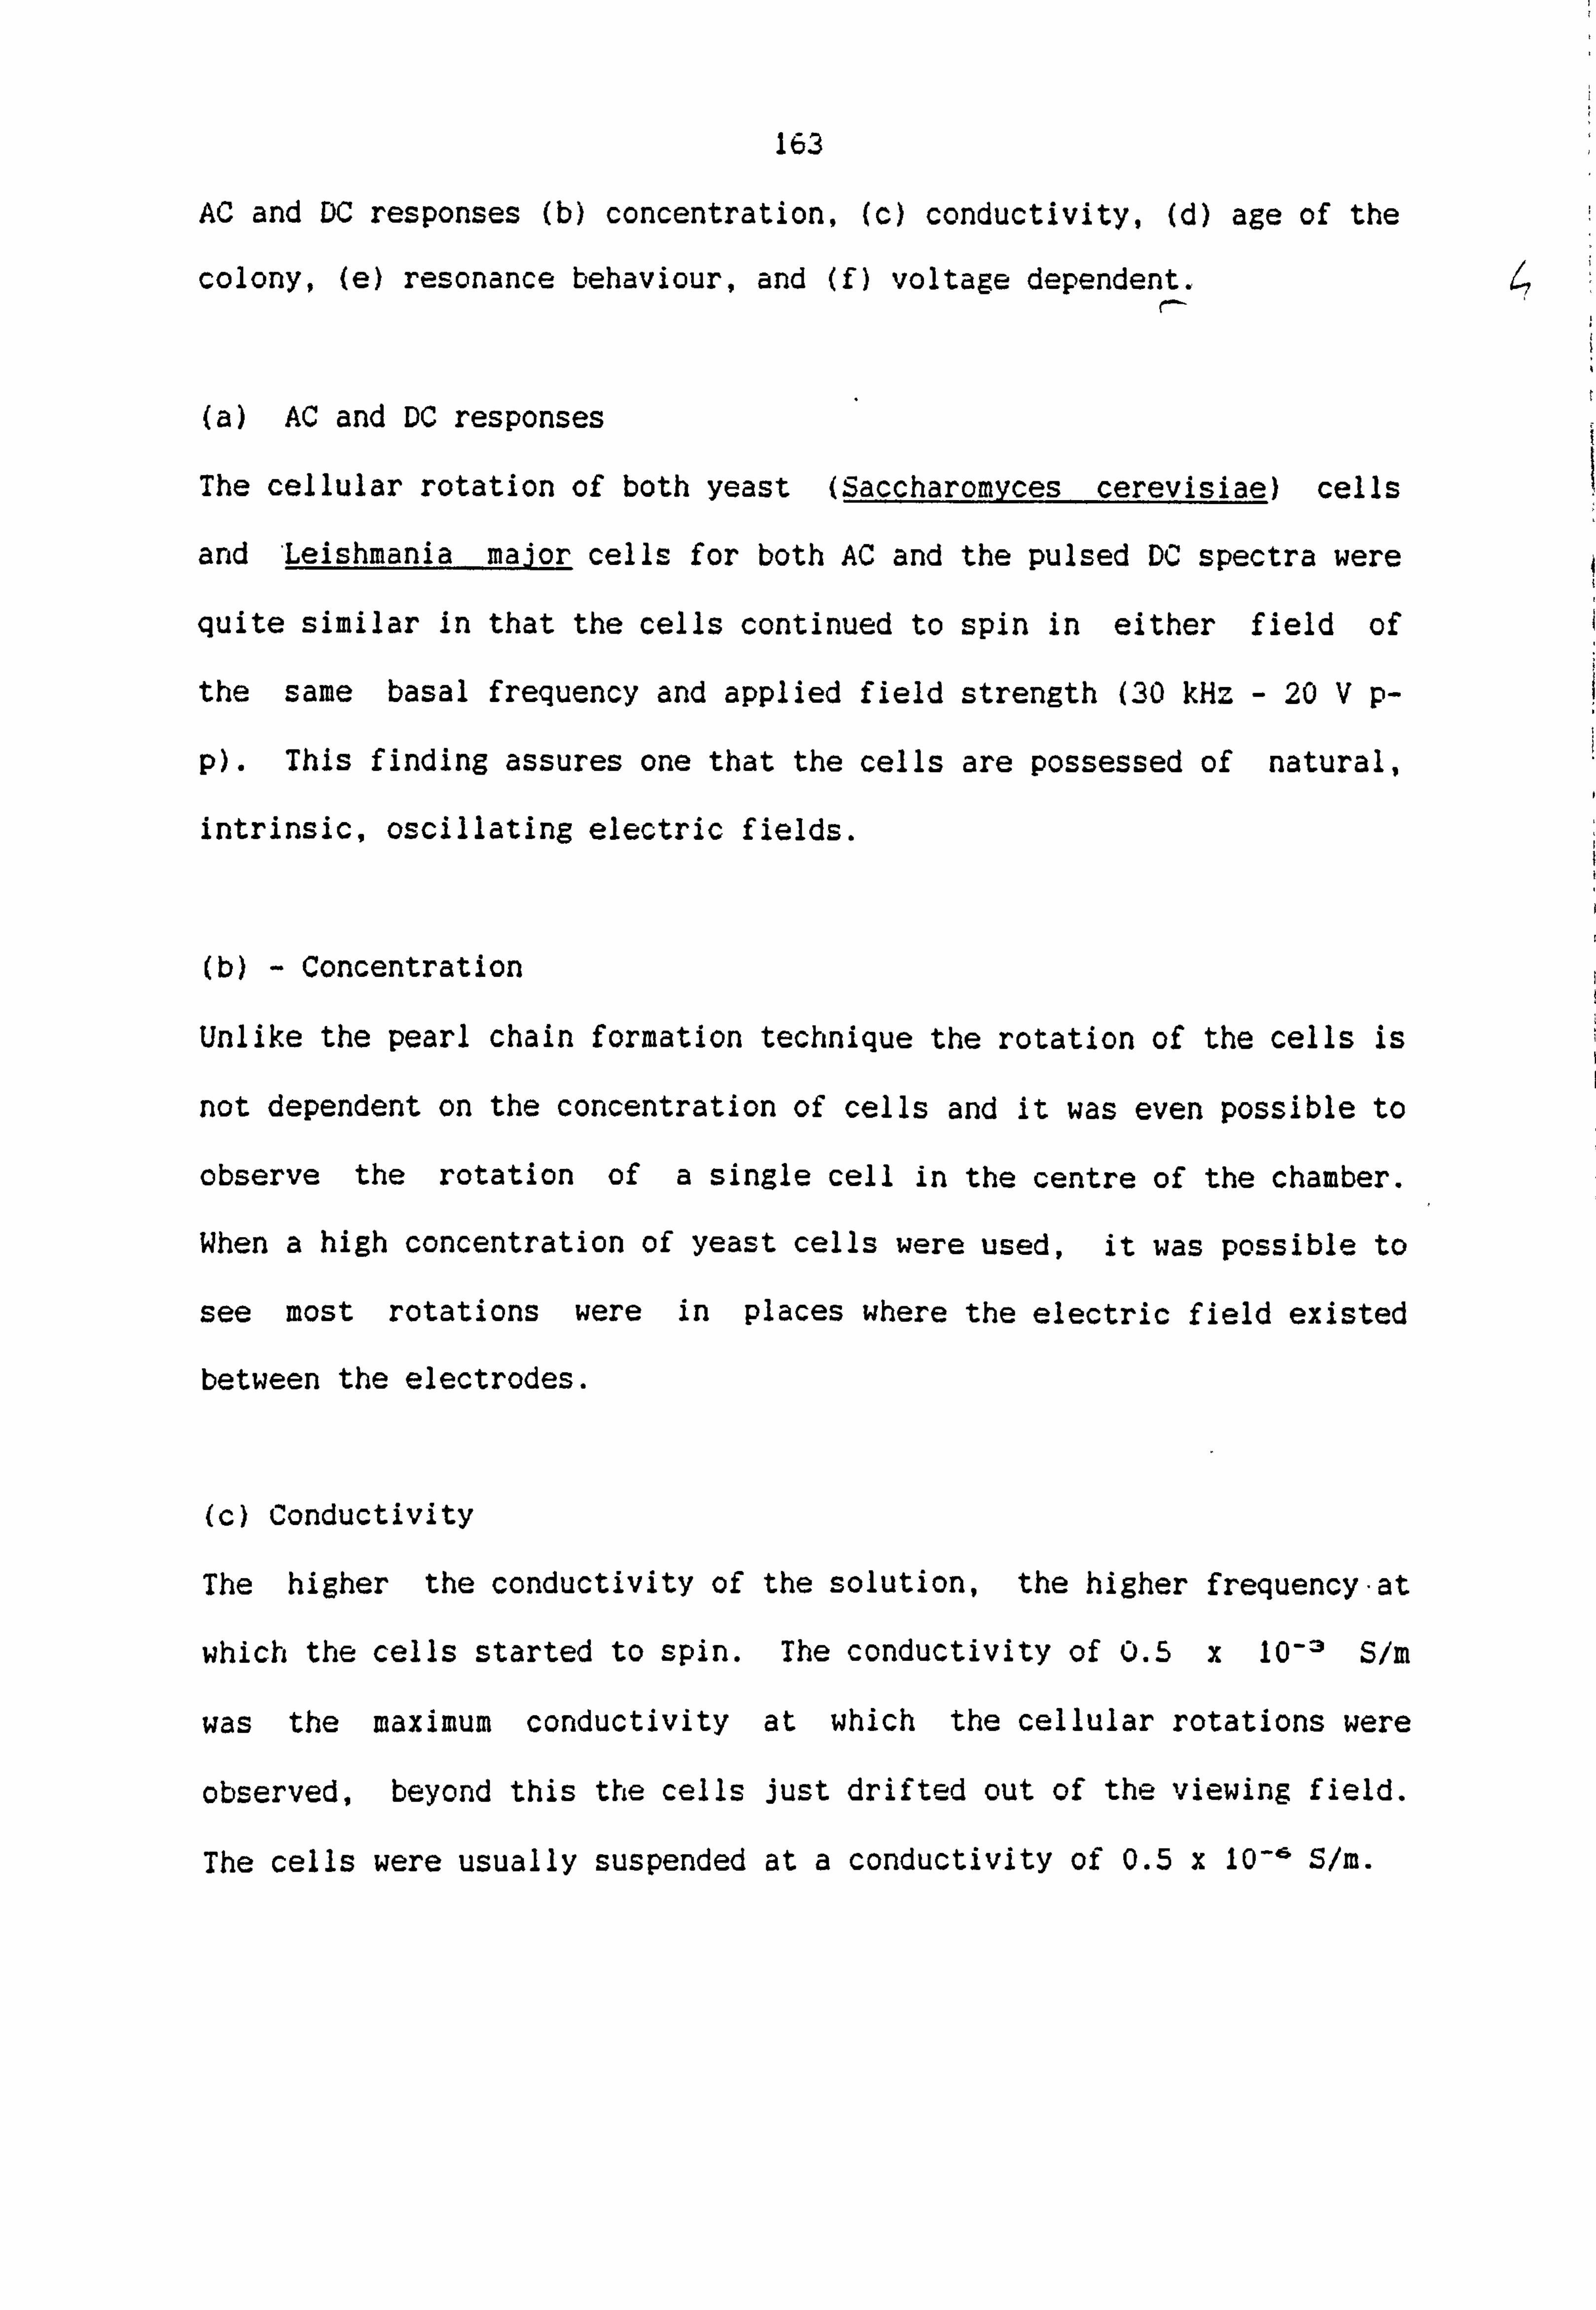
163
AC and DC responses (b) concentration, (c) conductivity, (d) age of the
colony, (e) resonance behaviour, and (f) voltage dependent.
(a) AC and DC responses
The cellular rotation of both yeast (Saccharomyces cerevisiae) cells
and 'Leishmania major cells for both AC and the pulsed DC spectra were
quite similar in that the cells continued to spin in either field of
the same basal frequency and applied field strength (30 kHz - 20 V p-
p). This finding assures one that the cells are possessed of natural,
intrinsic, oscillating electric fields.
(b) - Concentration
Unlike the pearl chain formation technique the rotation of the cells is
not dependent on the concentration of cells and it was even possible to
observe the rotation of a single cell in the centre of the chamber.
When a high concentration of yeast cells were used, it was possible to
see most rotations were in places where the electric field existed
between the electrodes.
(c) Conductivity
The higher the conductivity of
which the cells started to spin.
was the maximum conductivity
observed, beyond this the cells
The cells were usually suspended
the solution, the higher frequency-at
The conductivity of 0.5 x 10⁻¹ S/m
at which the cellular rotations were
just drifted out of the viewing field.
at a conductivity of 0.5 x 10-'6 Slm.
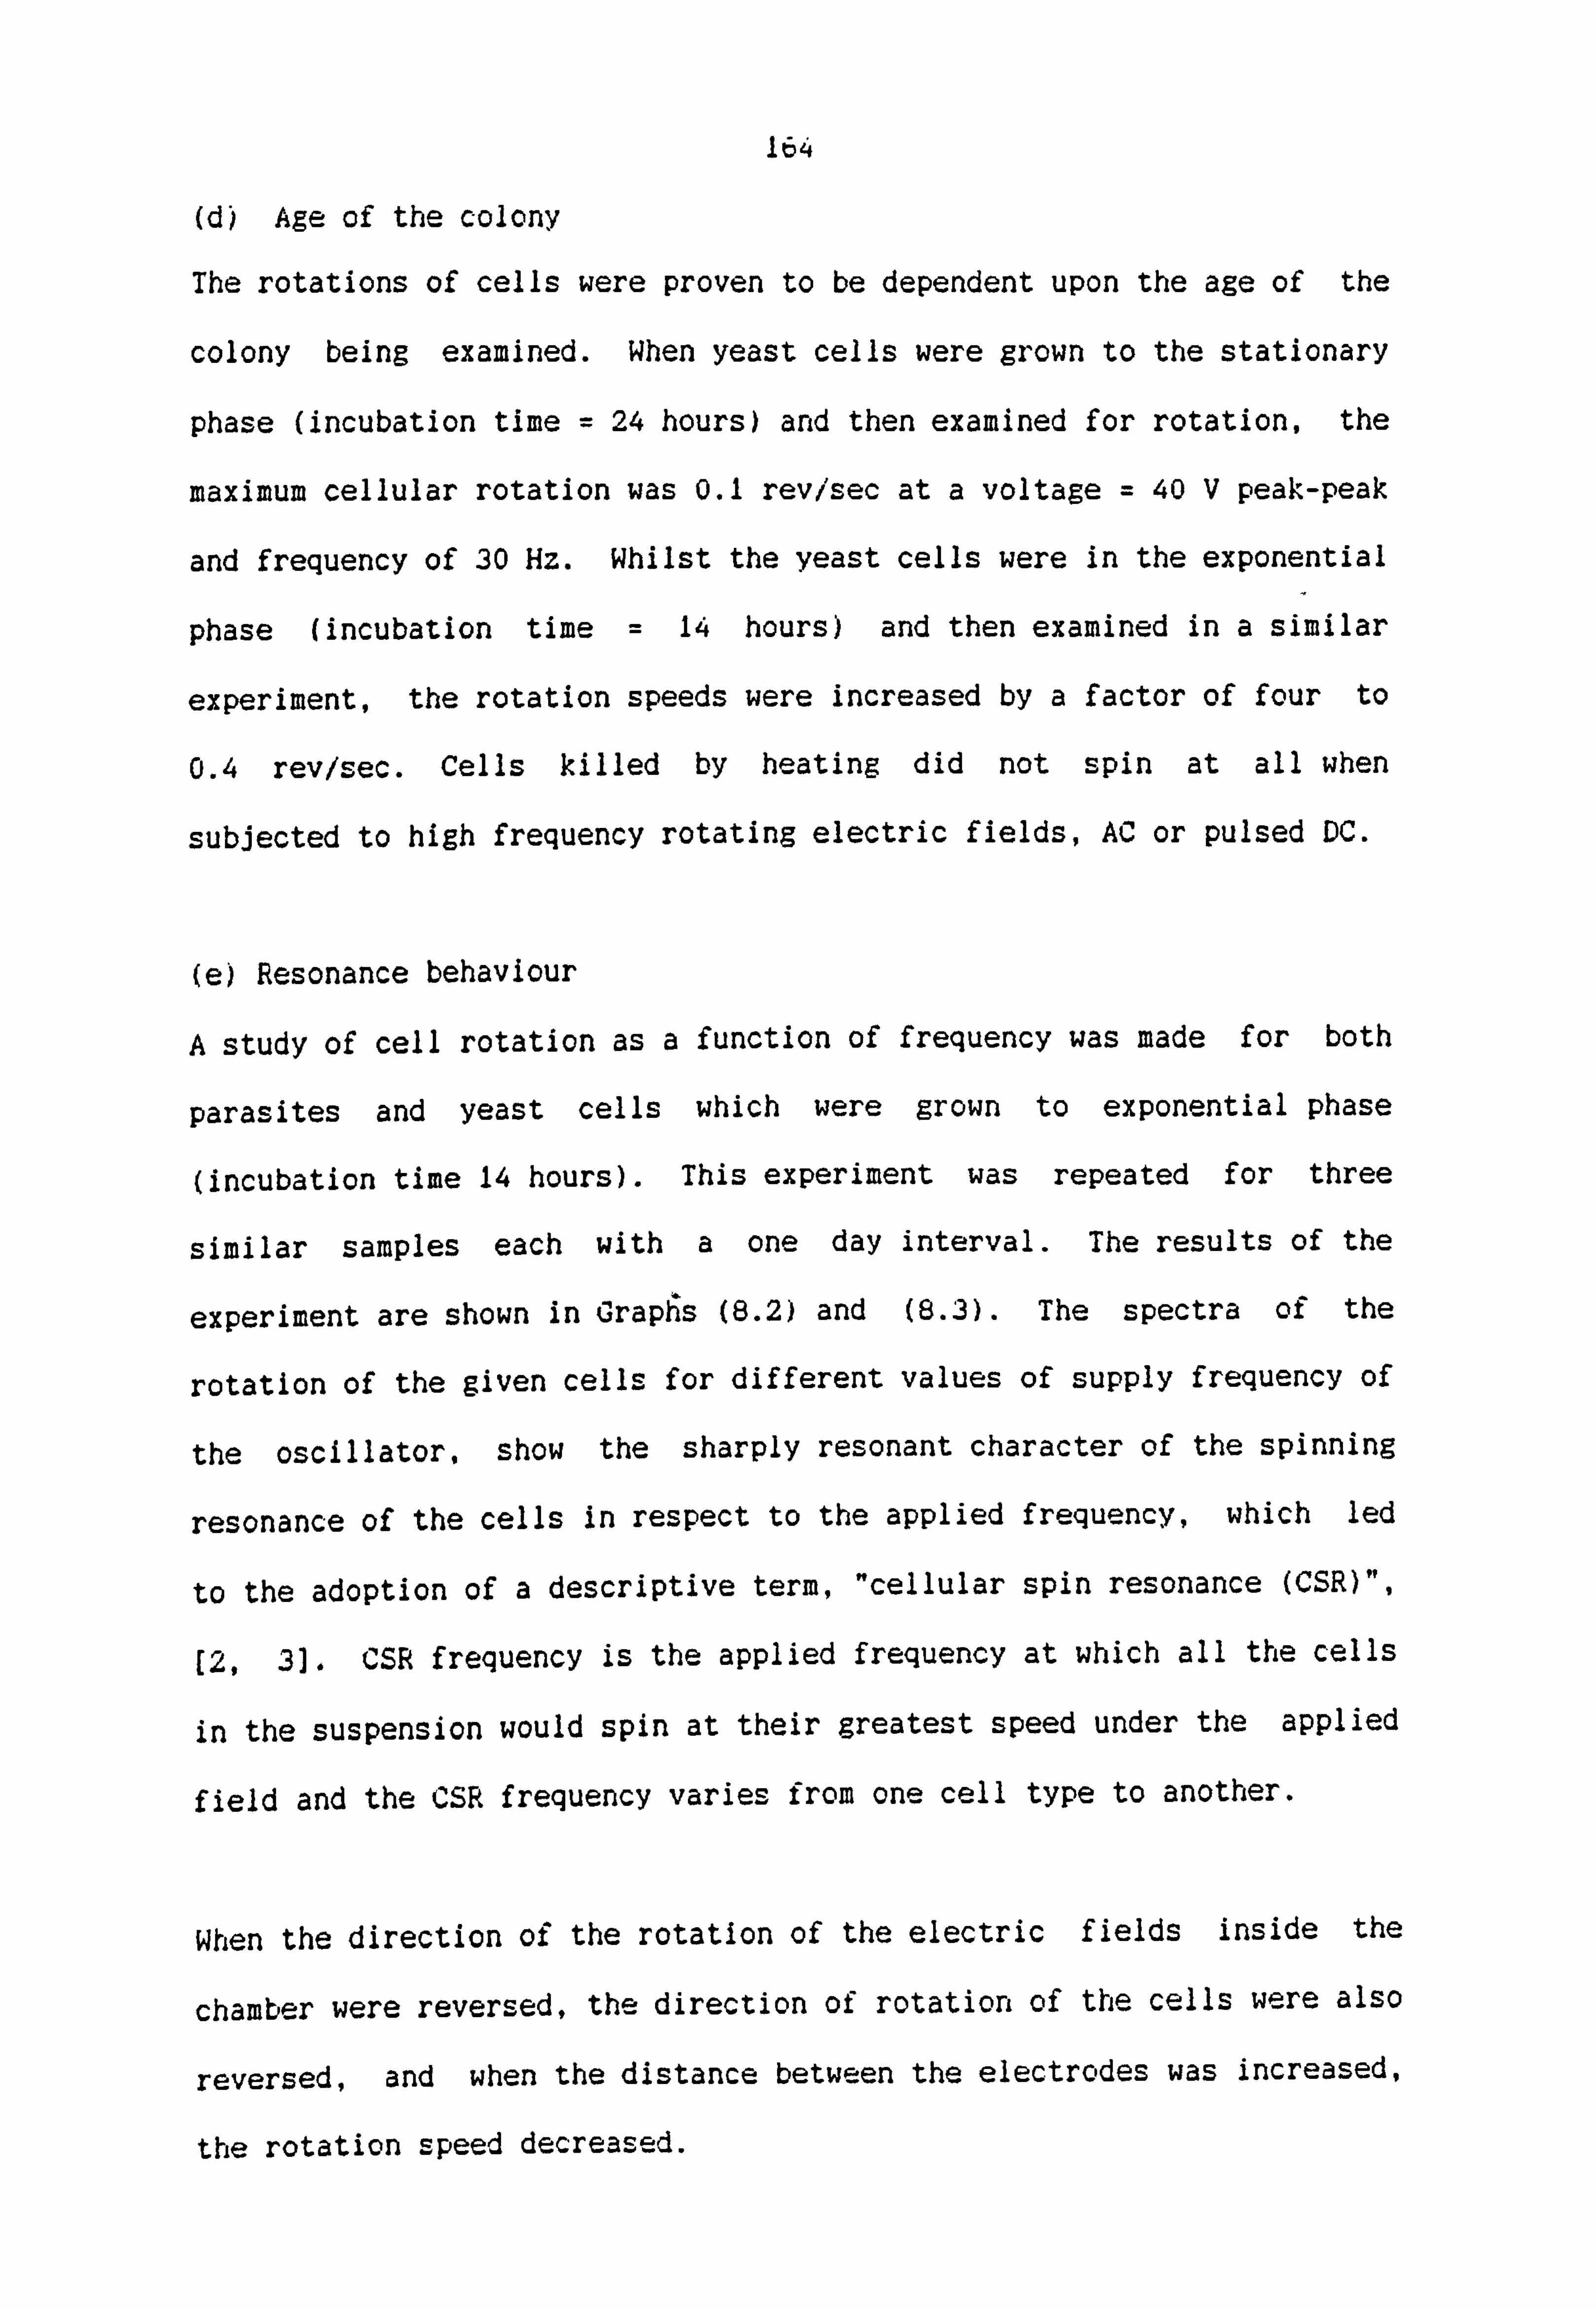
164
(d) Age of the colony
The rotations of cells were proven to be dependent upon the age of the
colony being examined. When yeast cells were grown to the stationary
phase (incubation time = 24 hours) and then examined for rotation, the
maximum cellular rotation was 0.1 rev/sec at a voltage = 40 V peak-peak
and frequency of 30 Hz- Whilst the yeast cells were in the exponential
phase (incubation time = 14 hours) and then examined in a similar
experiment, the rotation speeds were increased by a factor of four to
0.4 rev/sec. Cells killed by heating did not spin at all when
subjected to high frequency rotating electric fields, AC or pulsed DC.
(e) Resonance behaviour
A study of cell rotation as a function of frequency was made for both
parasites and yeast cells which were grown to exponential phase
(incubation time 14 hours). This experiment was repeated for three
similar samples each with a one day interval. The results of the
experiment are shown in Graphs (8.2) and (8-3). The spectra of the
rotation of the given cells for different values of supply frequency of
the oscillator, show the sharply resonant character of the spinning
resonance of the cells in respect to the applied frequency, which led
to the adoption of a descriptive term, "cellular spin resonance (CSR)",
[2,31. CSR frequency is the applied frequency at which all the cells
in the suspension would spin at their greatest speed under the applied
field and the CSR frequency varies from one cell type to another.
When the direction of the rotation of the electric fields inside the
chamber were reversed, the direction of rotation of the cells were also
reversed, and when the distance between the electrodes was increased,
the rotation speed decreased.
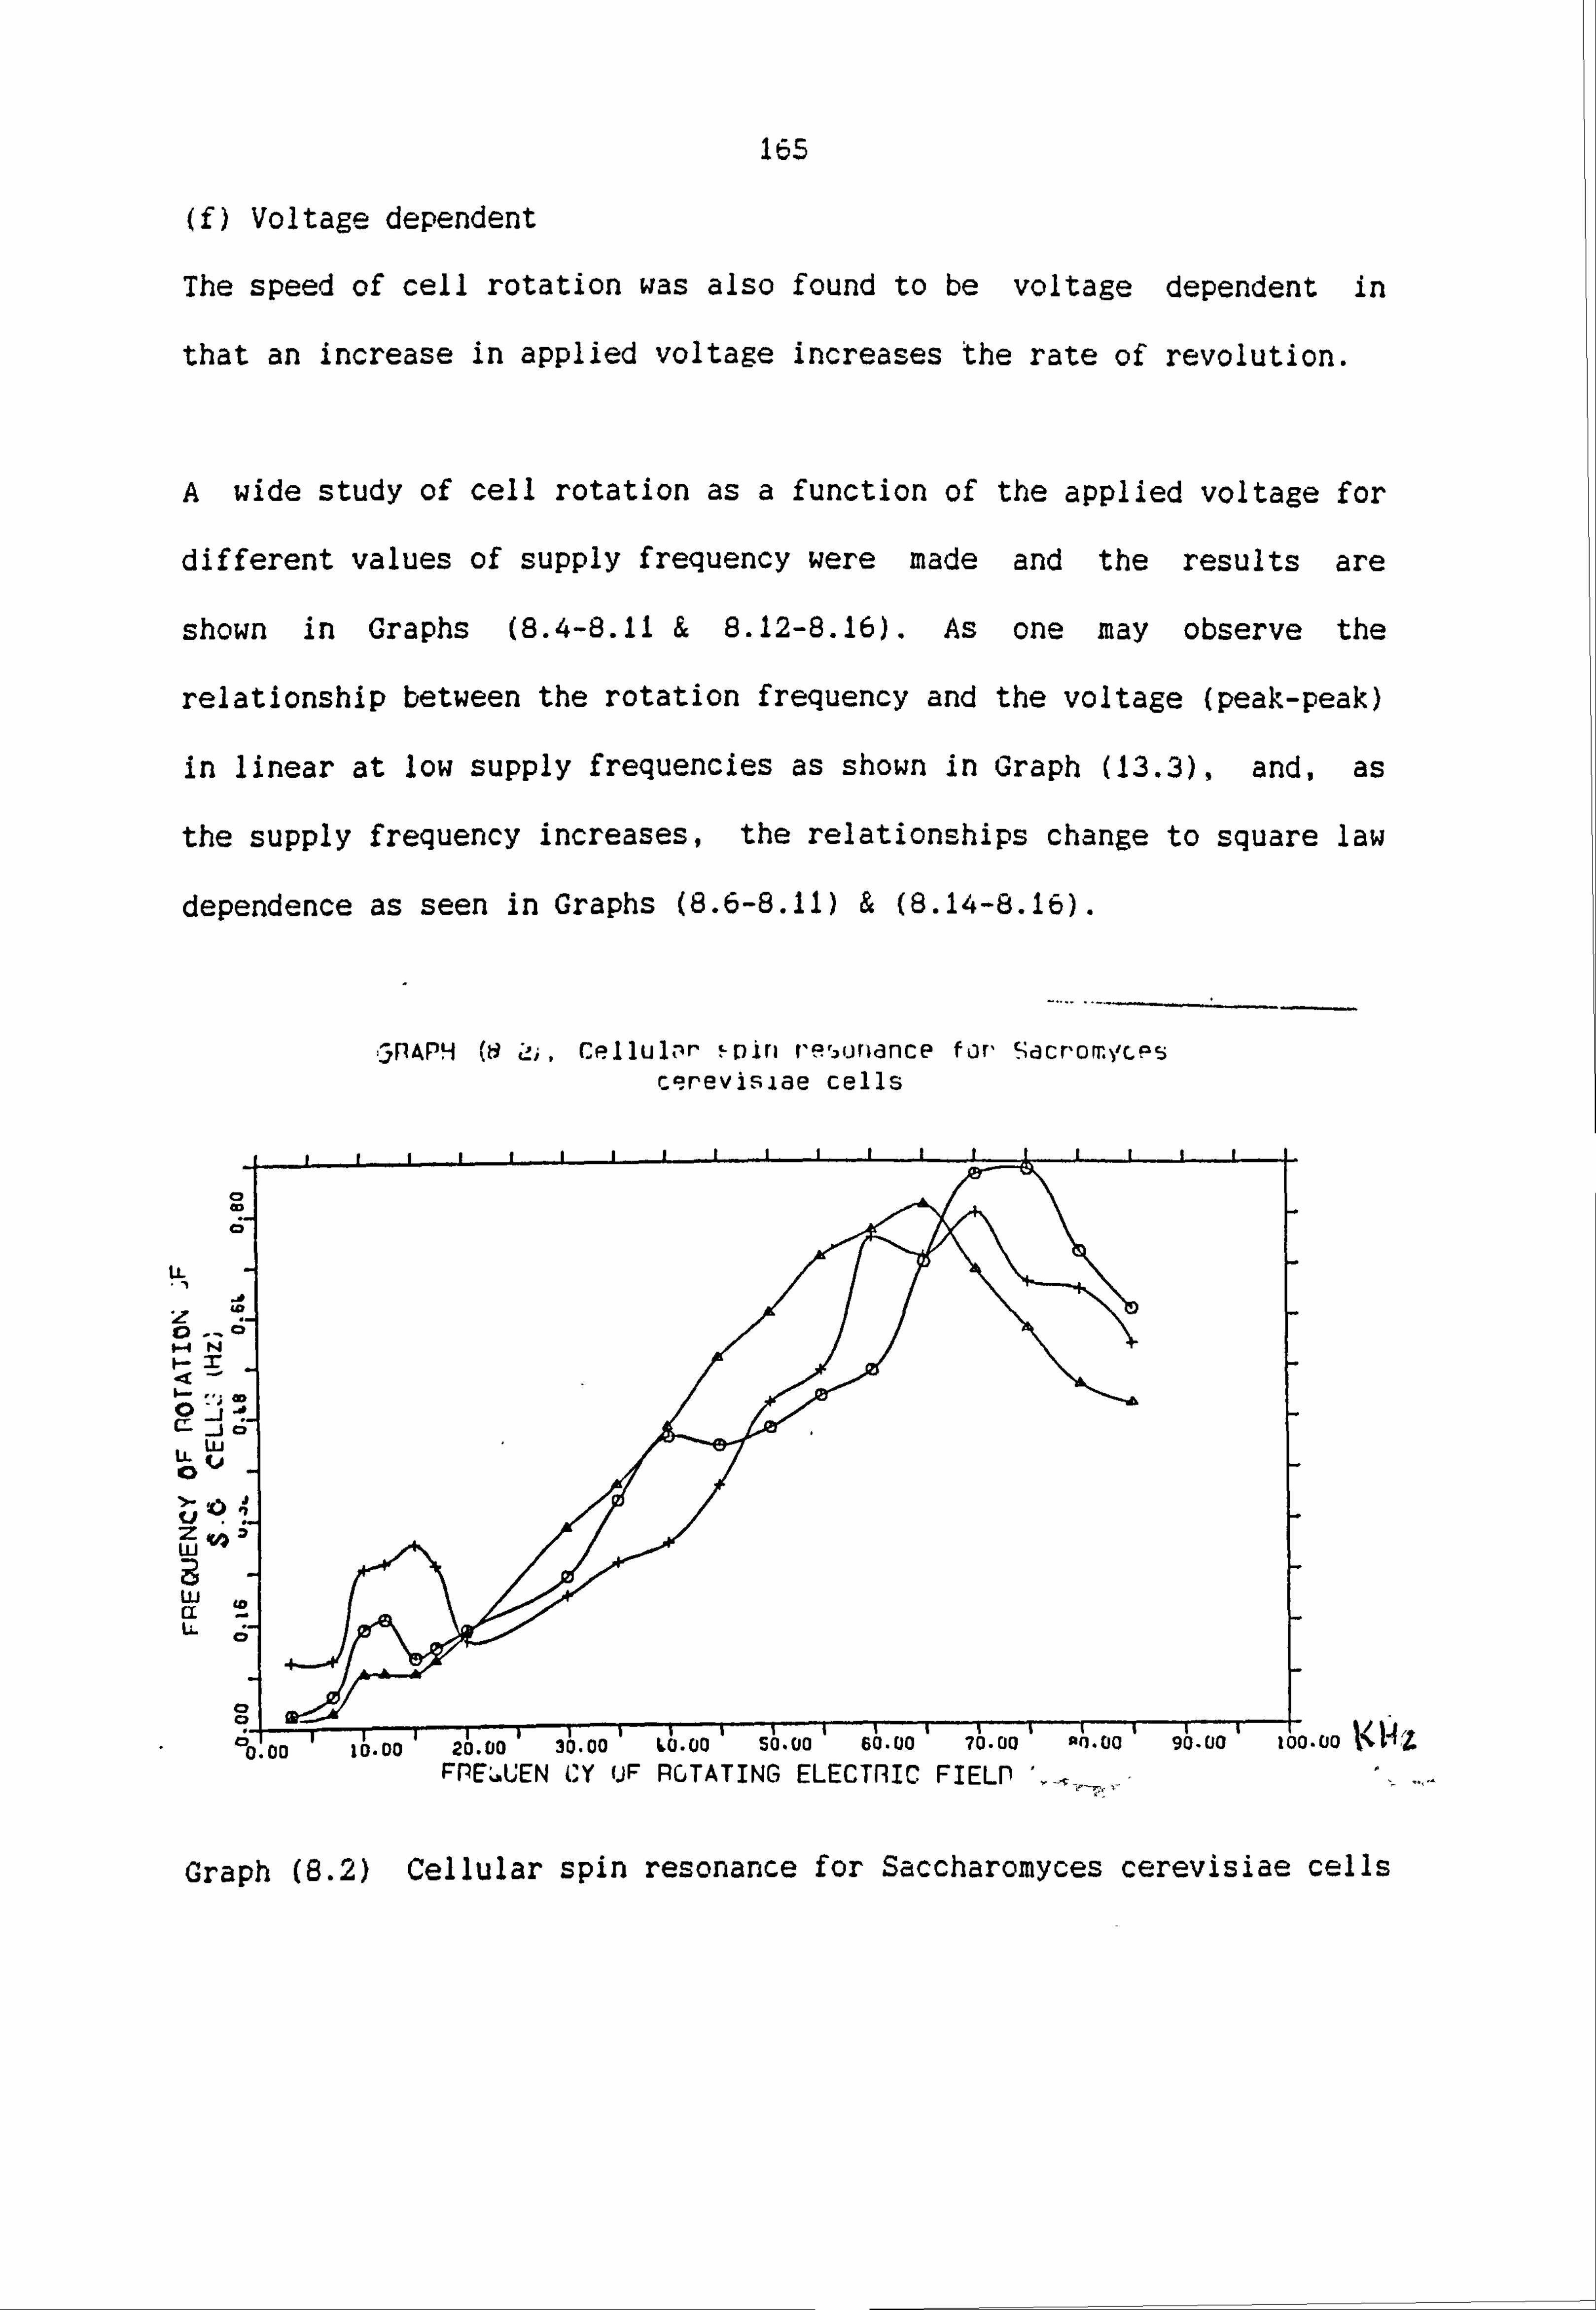
165
(f) Voltage dependent
The speed of cell rotation was also found to be voltage dependent in
that an increase in applied voltage increases the rate of revolution.
A wide study of cell rotation as a function of the applied voltage for
different values of supply frequency were made and the results are
shown in Graphs (8.4-8.11 & 8.12-8.16). As one may observe the
relationship between the rotation frequency and the voltage (peak-peak)
in linear at low supply frequencies as shown in Graph (13.3), and, as
the supply frequency increases, the relationships change to square law
dependence as seen in Graphs (8.6-8.11) &
3pAP4 (o z!; , cp 1 lu Jir ý- v in re,., oriance f or, cacrorr. Vcps cerevisiae cells
LL
Q
X
4D 0
LL
z
w
ui a LL C; 7
, c). c)t) 20.00 30,00 Vi. 00 50.00 60.00 70.00 Ilf)-00 90.00
FPE4UEN CY (JF ROTATING ELECTRIC FIELP Do
Graph (8.2) Cellular spin resonance for Saccharomyces cerevisiae cells
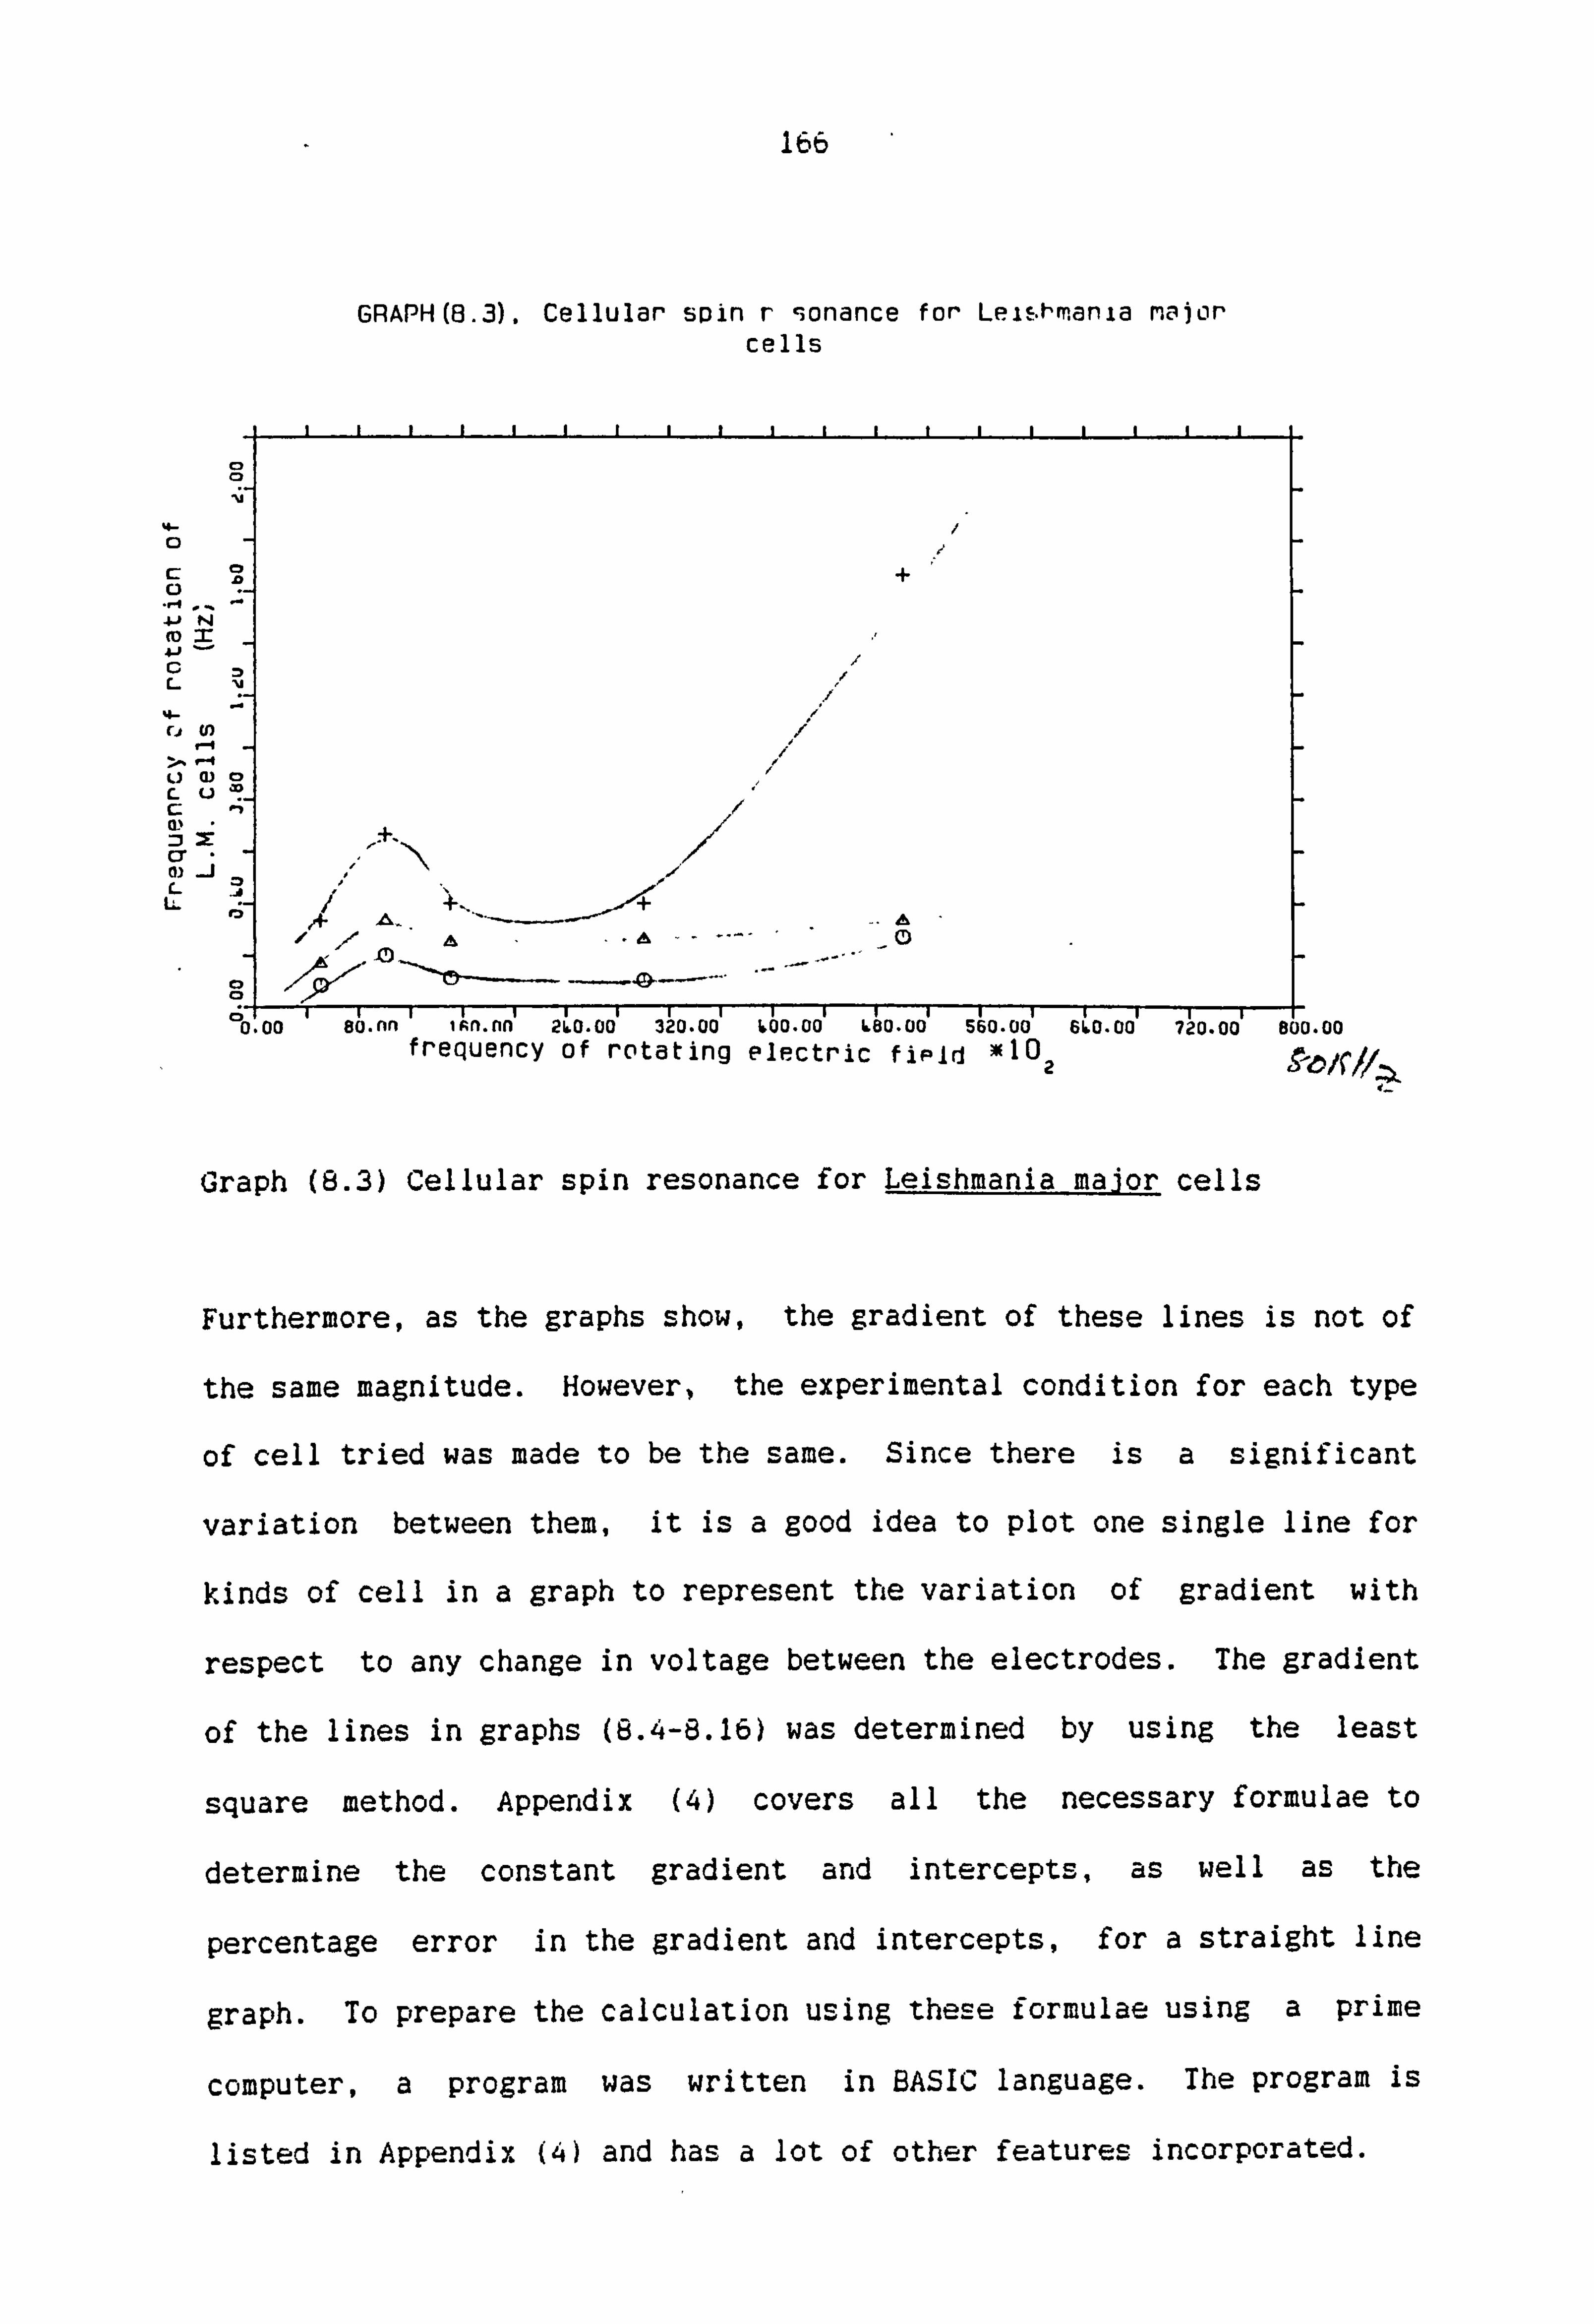
166
GRAPH(8.3). Cellular spin r vionance for Leishmania major cells
%4- 0
c:
(0 a:
4-
U CD C. u
or 0) 1
/ /
' +
III ---r- . 00 660-00 720.
jo
:; D- oo, 80'. nn ,i An. nn' 260.00' 312U - 001 600-00 L80.00 frequency of rotating electric fiPId )KIO
Graph (8.3) Cellular spin resonance for Leishmania major cells
00-00
swrllý
Furthermore, as the graphs show, the gradient of these lines is not of
the same magnitude. However, the experimental condition for each type
of cell tried was made to be the same. Since there is a significant
variation between them, it is a good idea to plot one single line for
kinds of cell in a graph to represent the variation of gradient with
respect to any change in voltage between the electrodes. The gradient
of the lines in graphs (8.4-8.16) was determined by using the least
square method. Appendix (4) covers all the necessary formulae to
determine the constant gradient and intercepts, as well as the
percentage error in the gradient and intercepts, for a straight line
graph. To prepare the calculation using these formulae using a prime
computer, a program was written in BASIC language. The program is
listed in Appendix (4) and has a lot of other features incorporated.
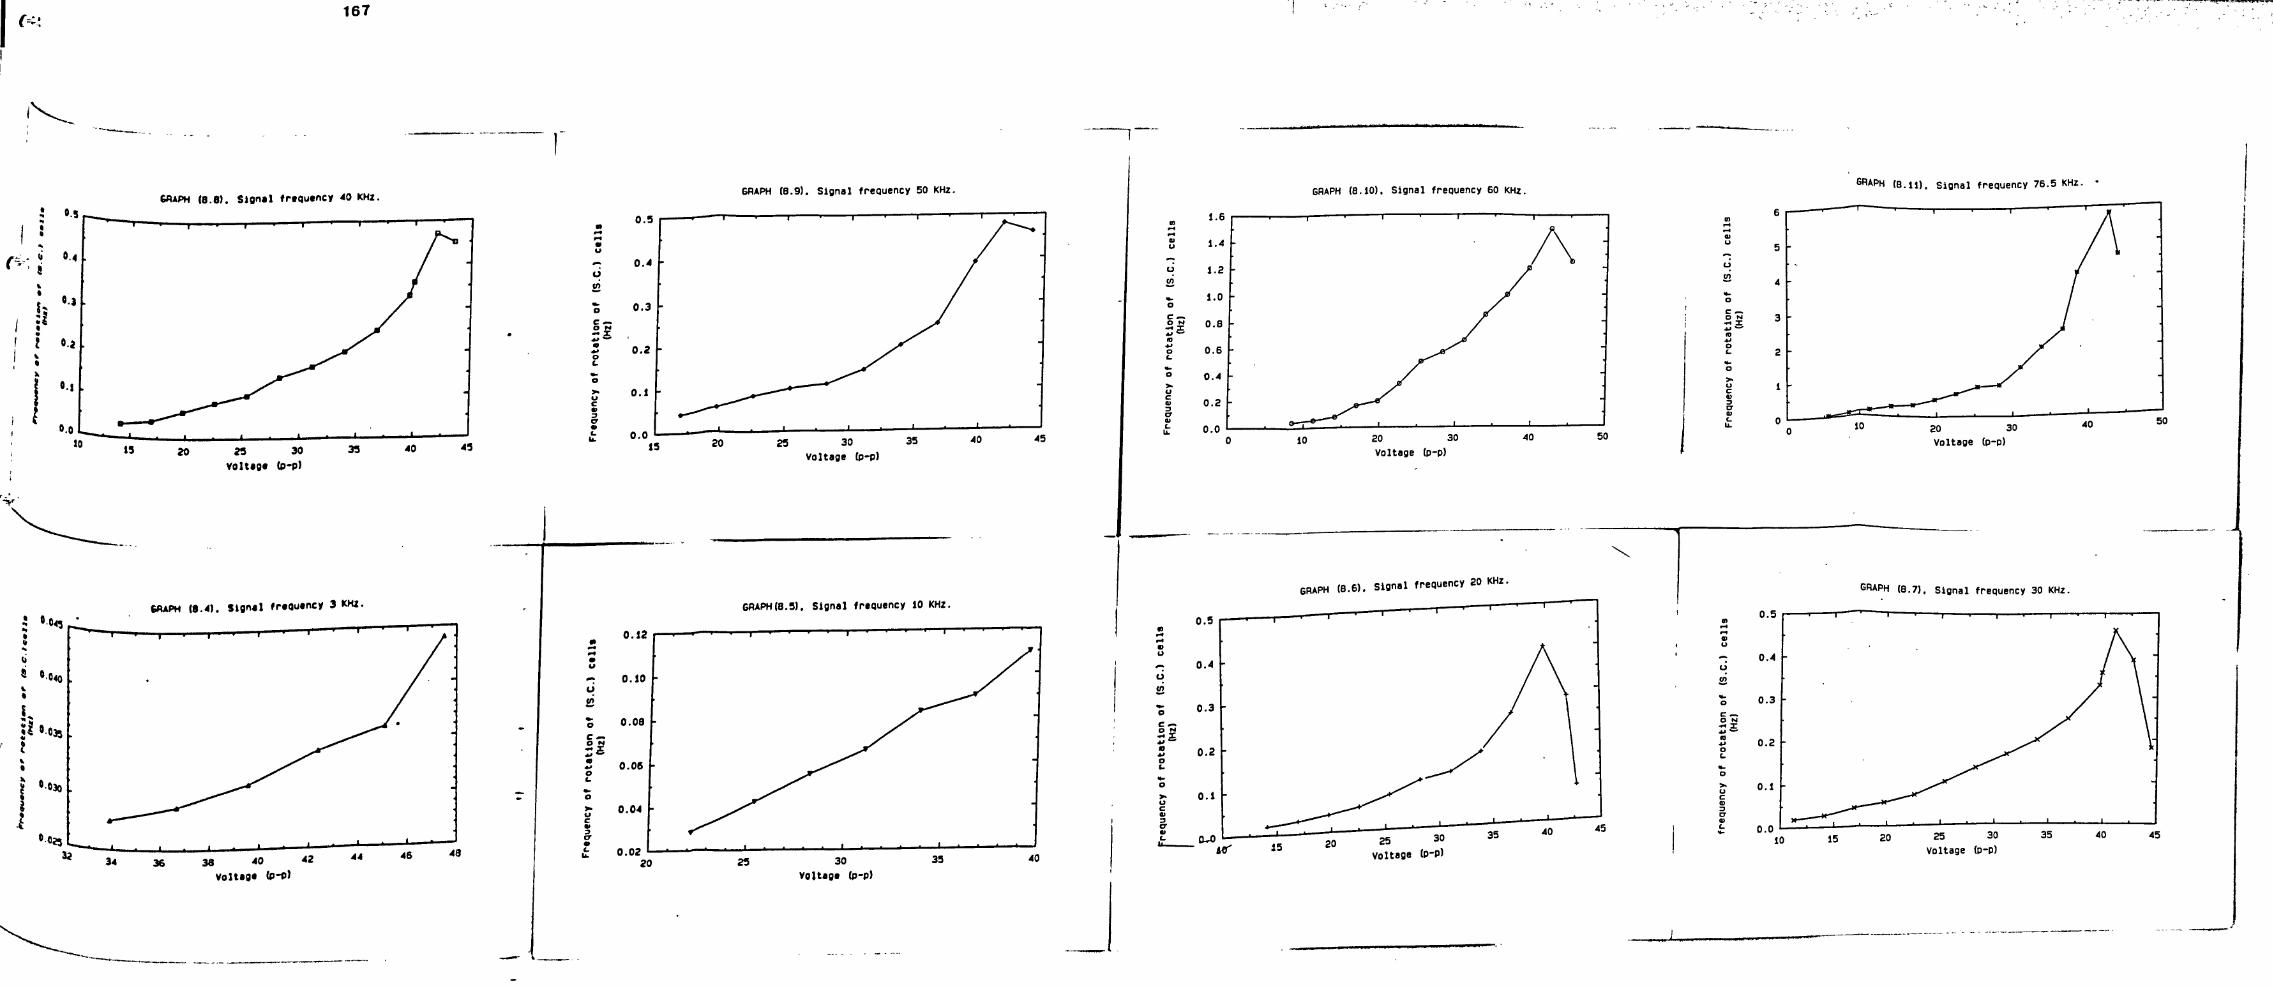
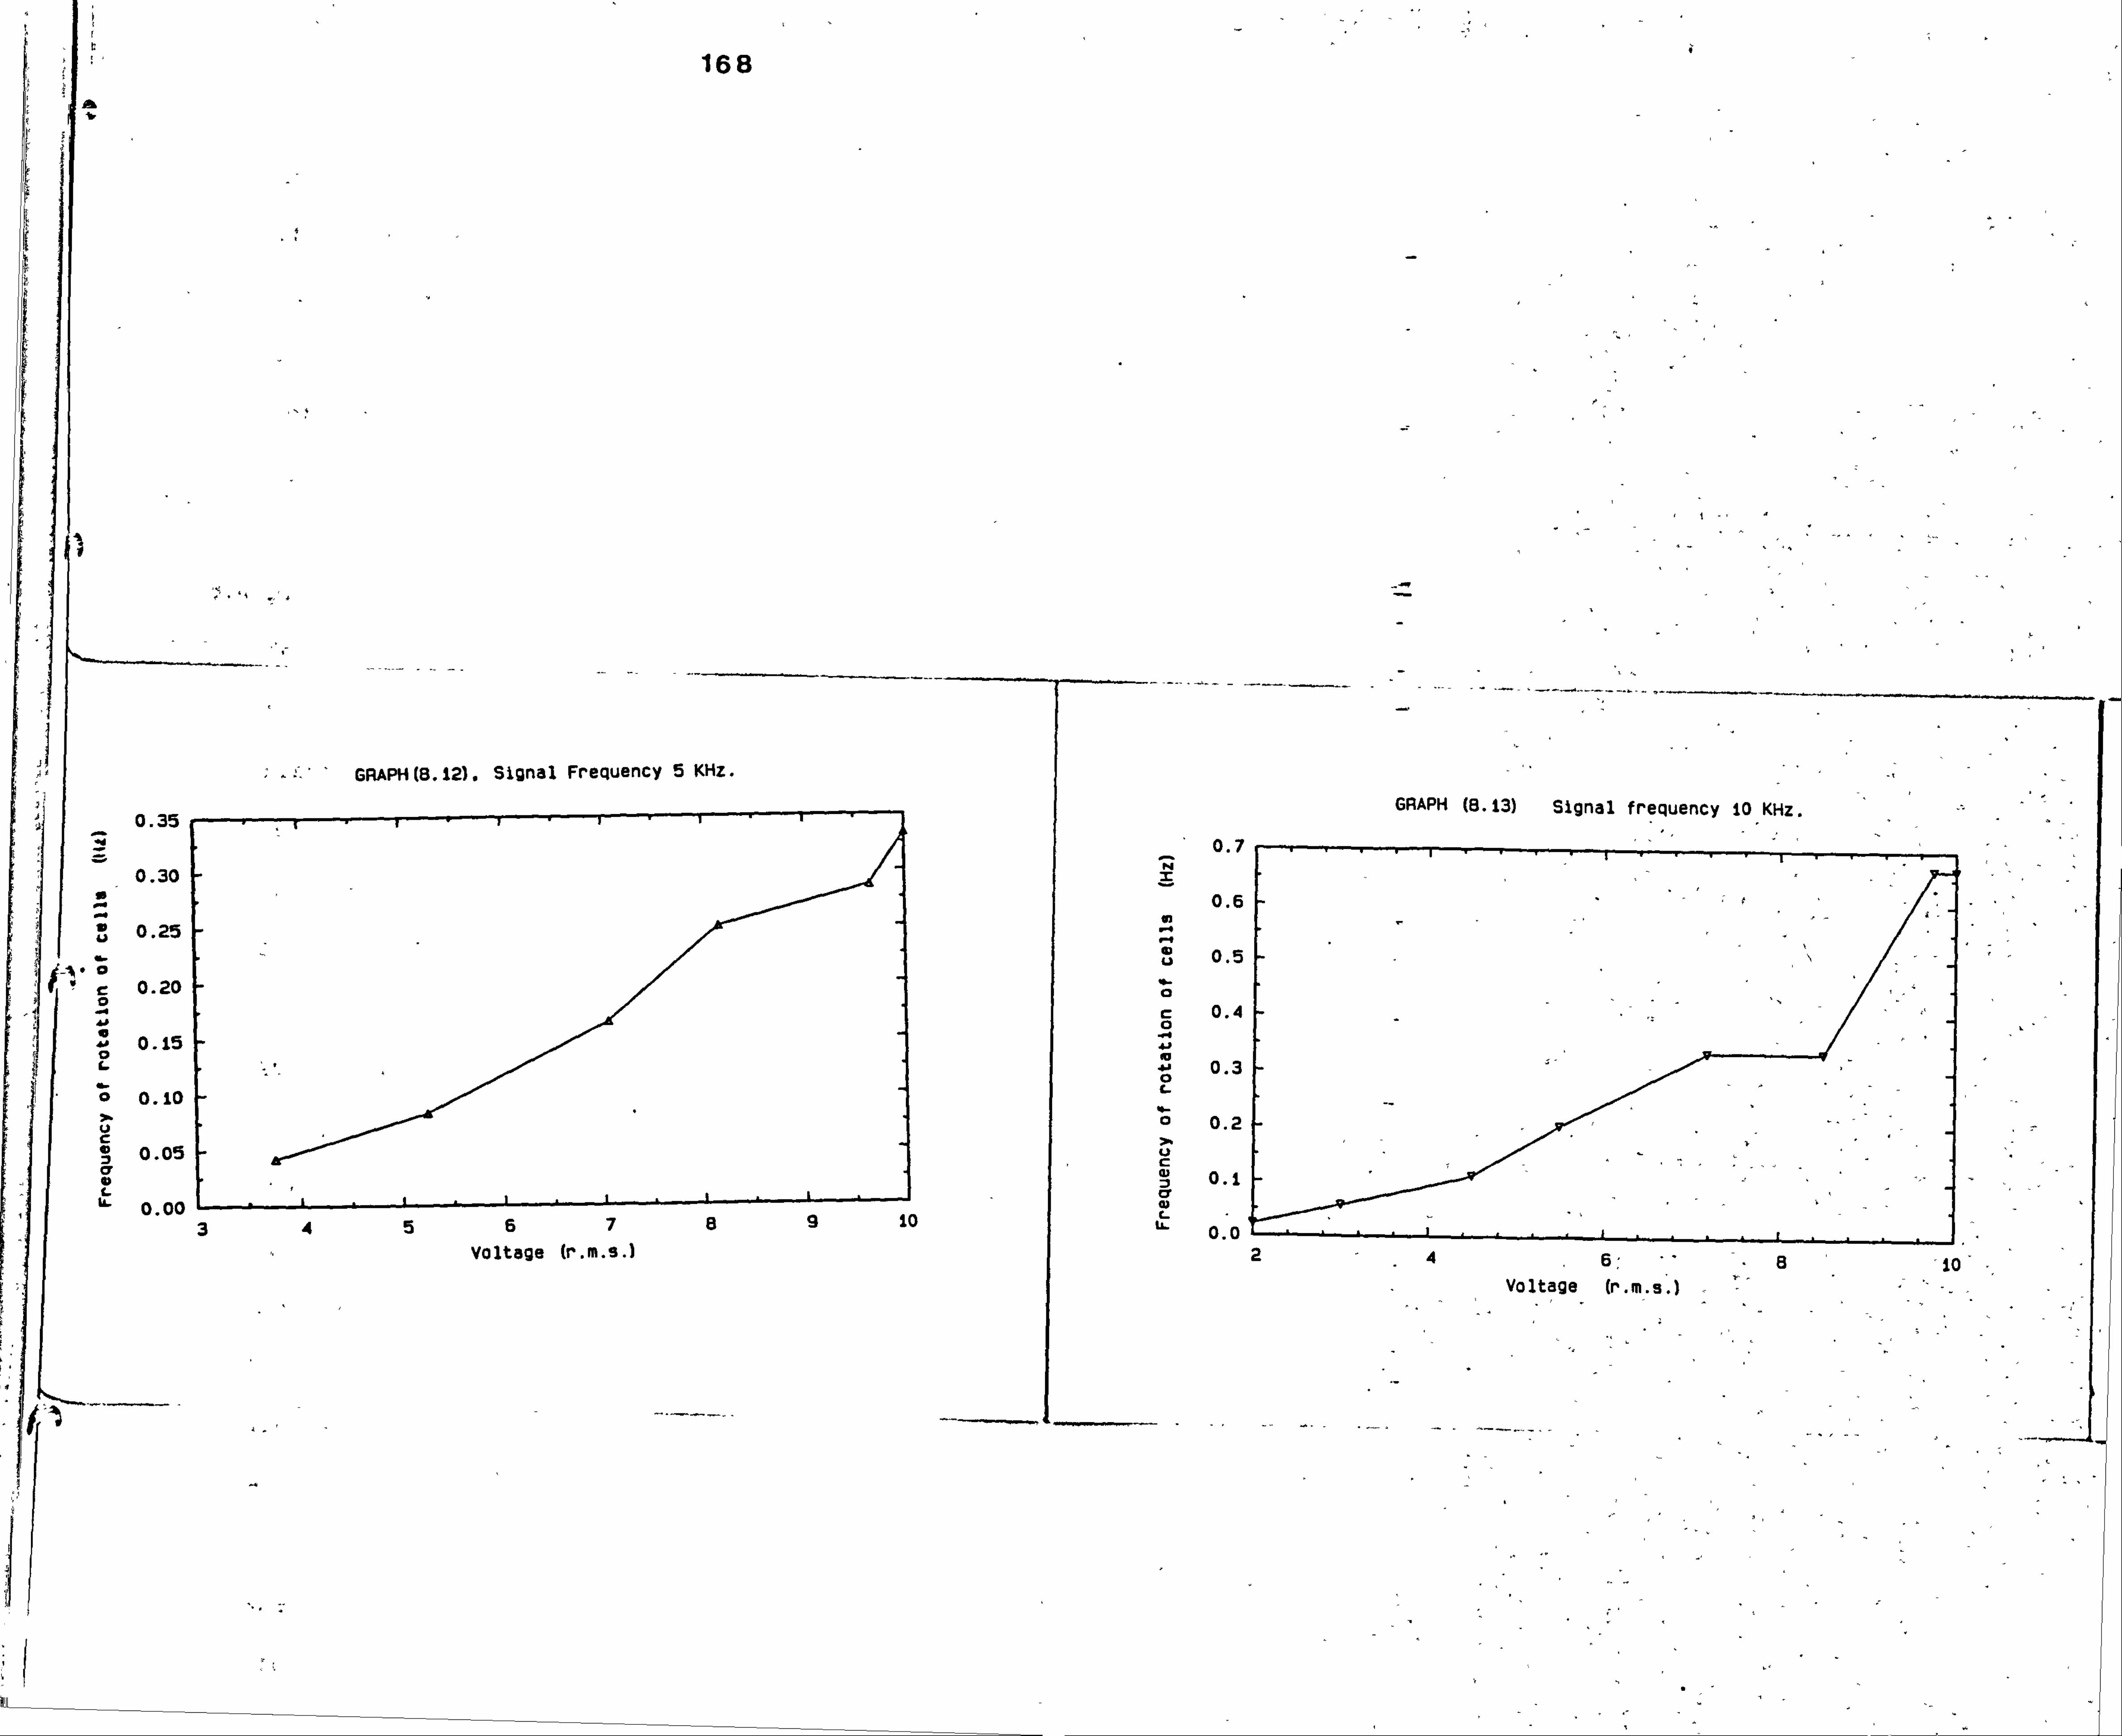
168
0.35
0.30
0.25
0.20
0.15
0.10
0.05
9% nn
GRAPH(B. 12). Signal Frequency 5 KHz.
GRAPH (8.13) Signal frequency IO. KHZ.
0.7
6789 10
Voltage (r. m. s. )
f, ýI- -- -
0.6
0.5
C, 0.4
Z
0 0.3
0 0.2
0.1 cr tu
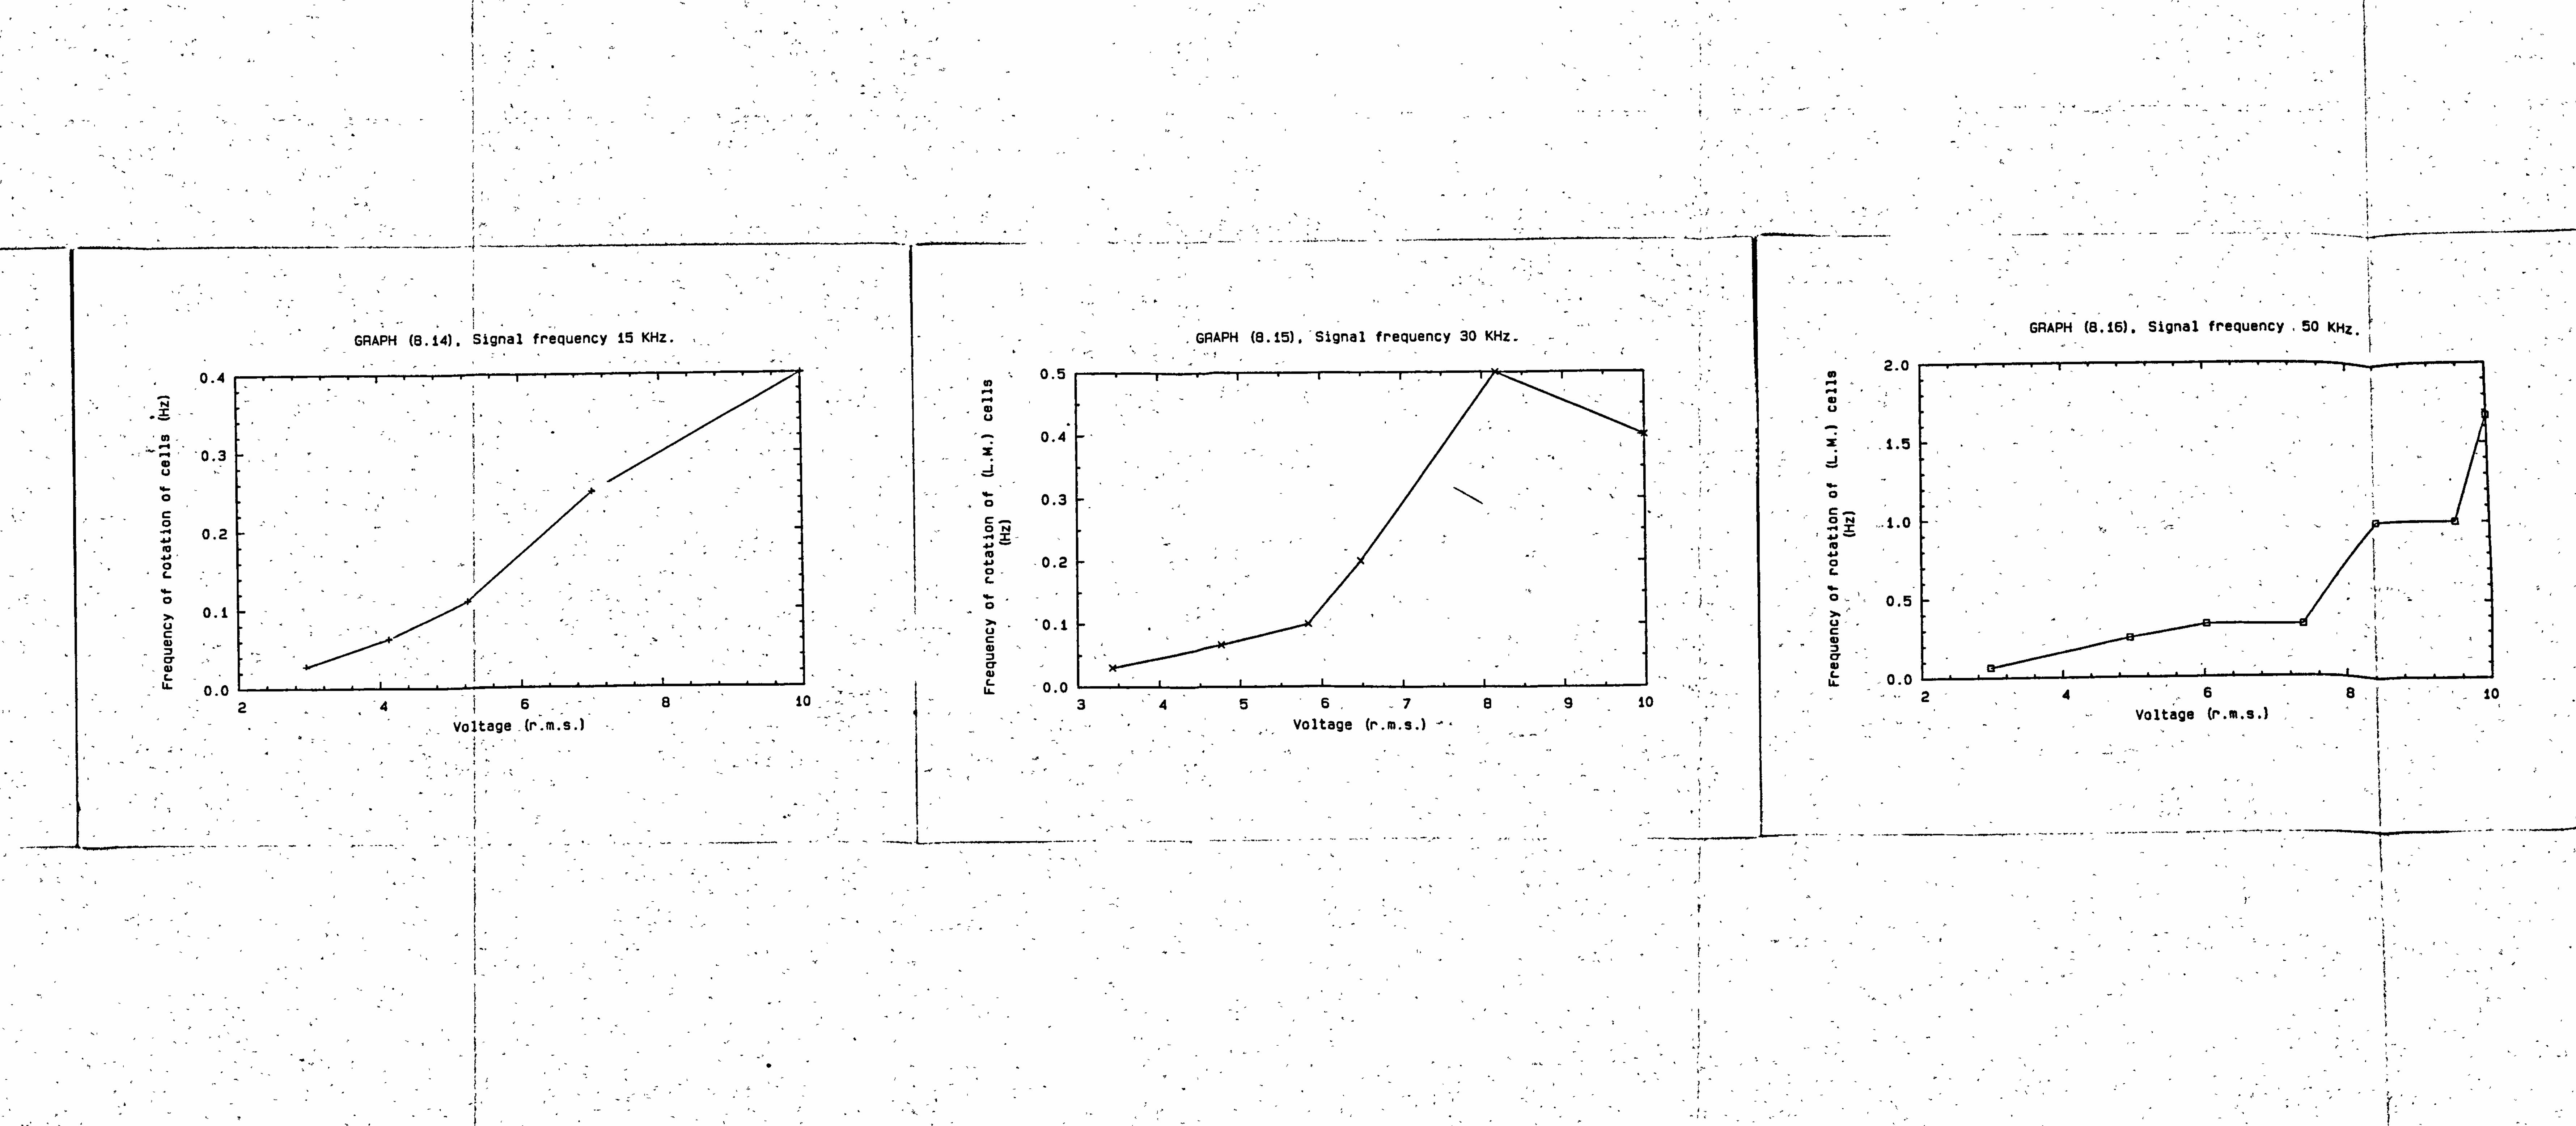
(H GRAPH (8.14). Signal frequency 15 KHZ. -Signal frequency 30 KHz. GRAPH (8,15). Signal frequency 50 1 Z. GRAPH (8.15).
0.4
- 11 a), .
'0.3 u
0
0 0.2
0.1
cr w LL
0.5
0.4
0.3
0- -0.2 C- 0
. 0.1
cr a)
ýL- nn
. 1.5
0Z _1.0 -
0.5
LA- - 0.0 1-
-4 6 10 567 13 9 10 34
Voltag a (r. m. s. ) Voltage (r. m. s. )
4
6 10 voltage (r. m. s. )

169
Once the program has been loaded, it will ask the user to input a set
of data points. These data points can either be 'input' at a terminal
on real time, or they can be transferred from a file already 'exited'
in the user's file. Graph (6.17) shows the variation of gradient for
both yeast (S. C. ) cells and Leishmania major cells for any change in
voltage between the electrodes.
8.4 Discussion
The use of sputtered thin film metal electrodes allows the obervations
to be carried out at high optical magnifications so that a single cell,
right in the centre of the chamber far from the electrodes and other
cells, can be seen rotating or spinning in the rotating electric field.
This provides a simple and straightforward method for obtaining the
dielectric properties of individual cells.
At Hz. and sub-Hz. frequencies, the alternating movement of pearl
chains towards each of a parallel plate electrode confirms the idea
that there are charged phenomena associated with the cells, and
different groups of cells in the same suspensions which appear to have
different surface charges at different times.
The use of a rotating electric field can simplify and improve the
accuracy of cellular spin experiments.
When increasing the distance between the electrodes the rotation
frequency decreases. This is on the contrary to effect of voltage
between the electrodes. Furthermore, if two cells of different radius
are examined under the same conditions, the cell with the smaller
radius will rotate with a higher speed than the larger one. Further
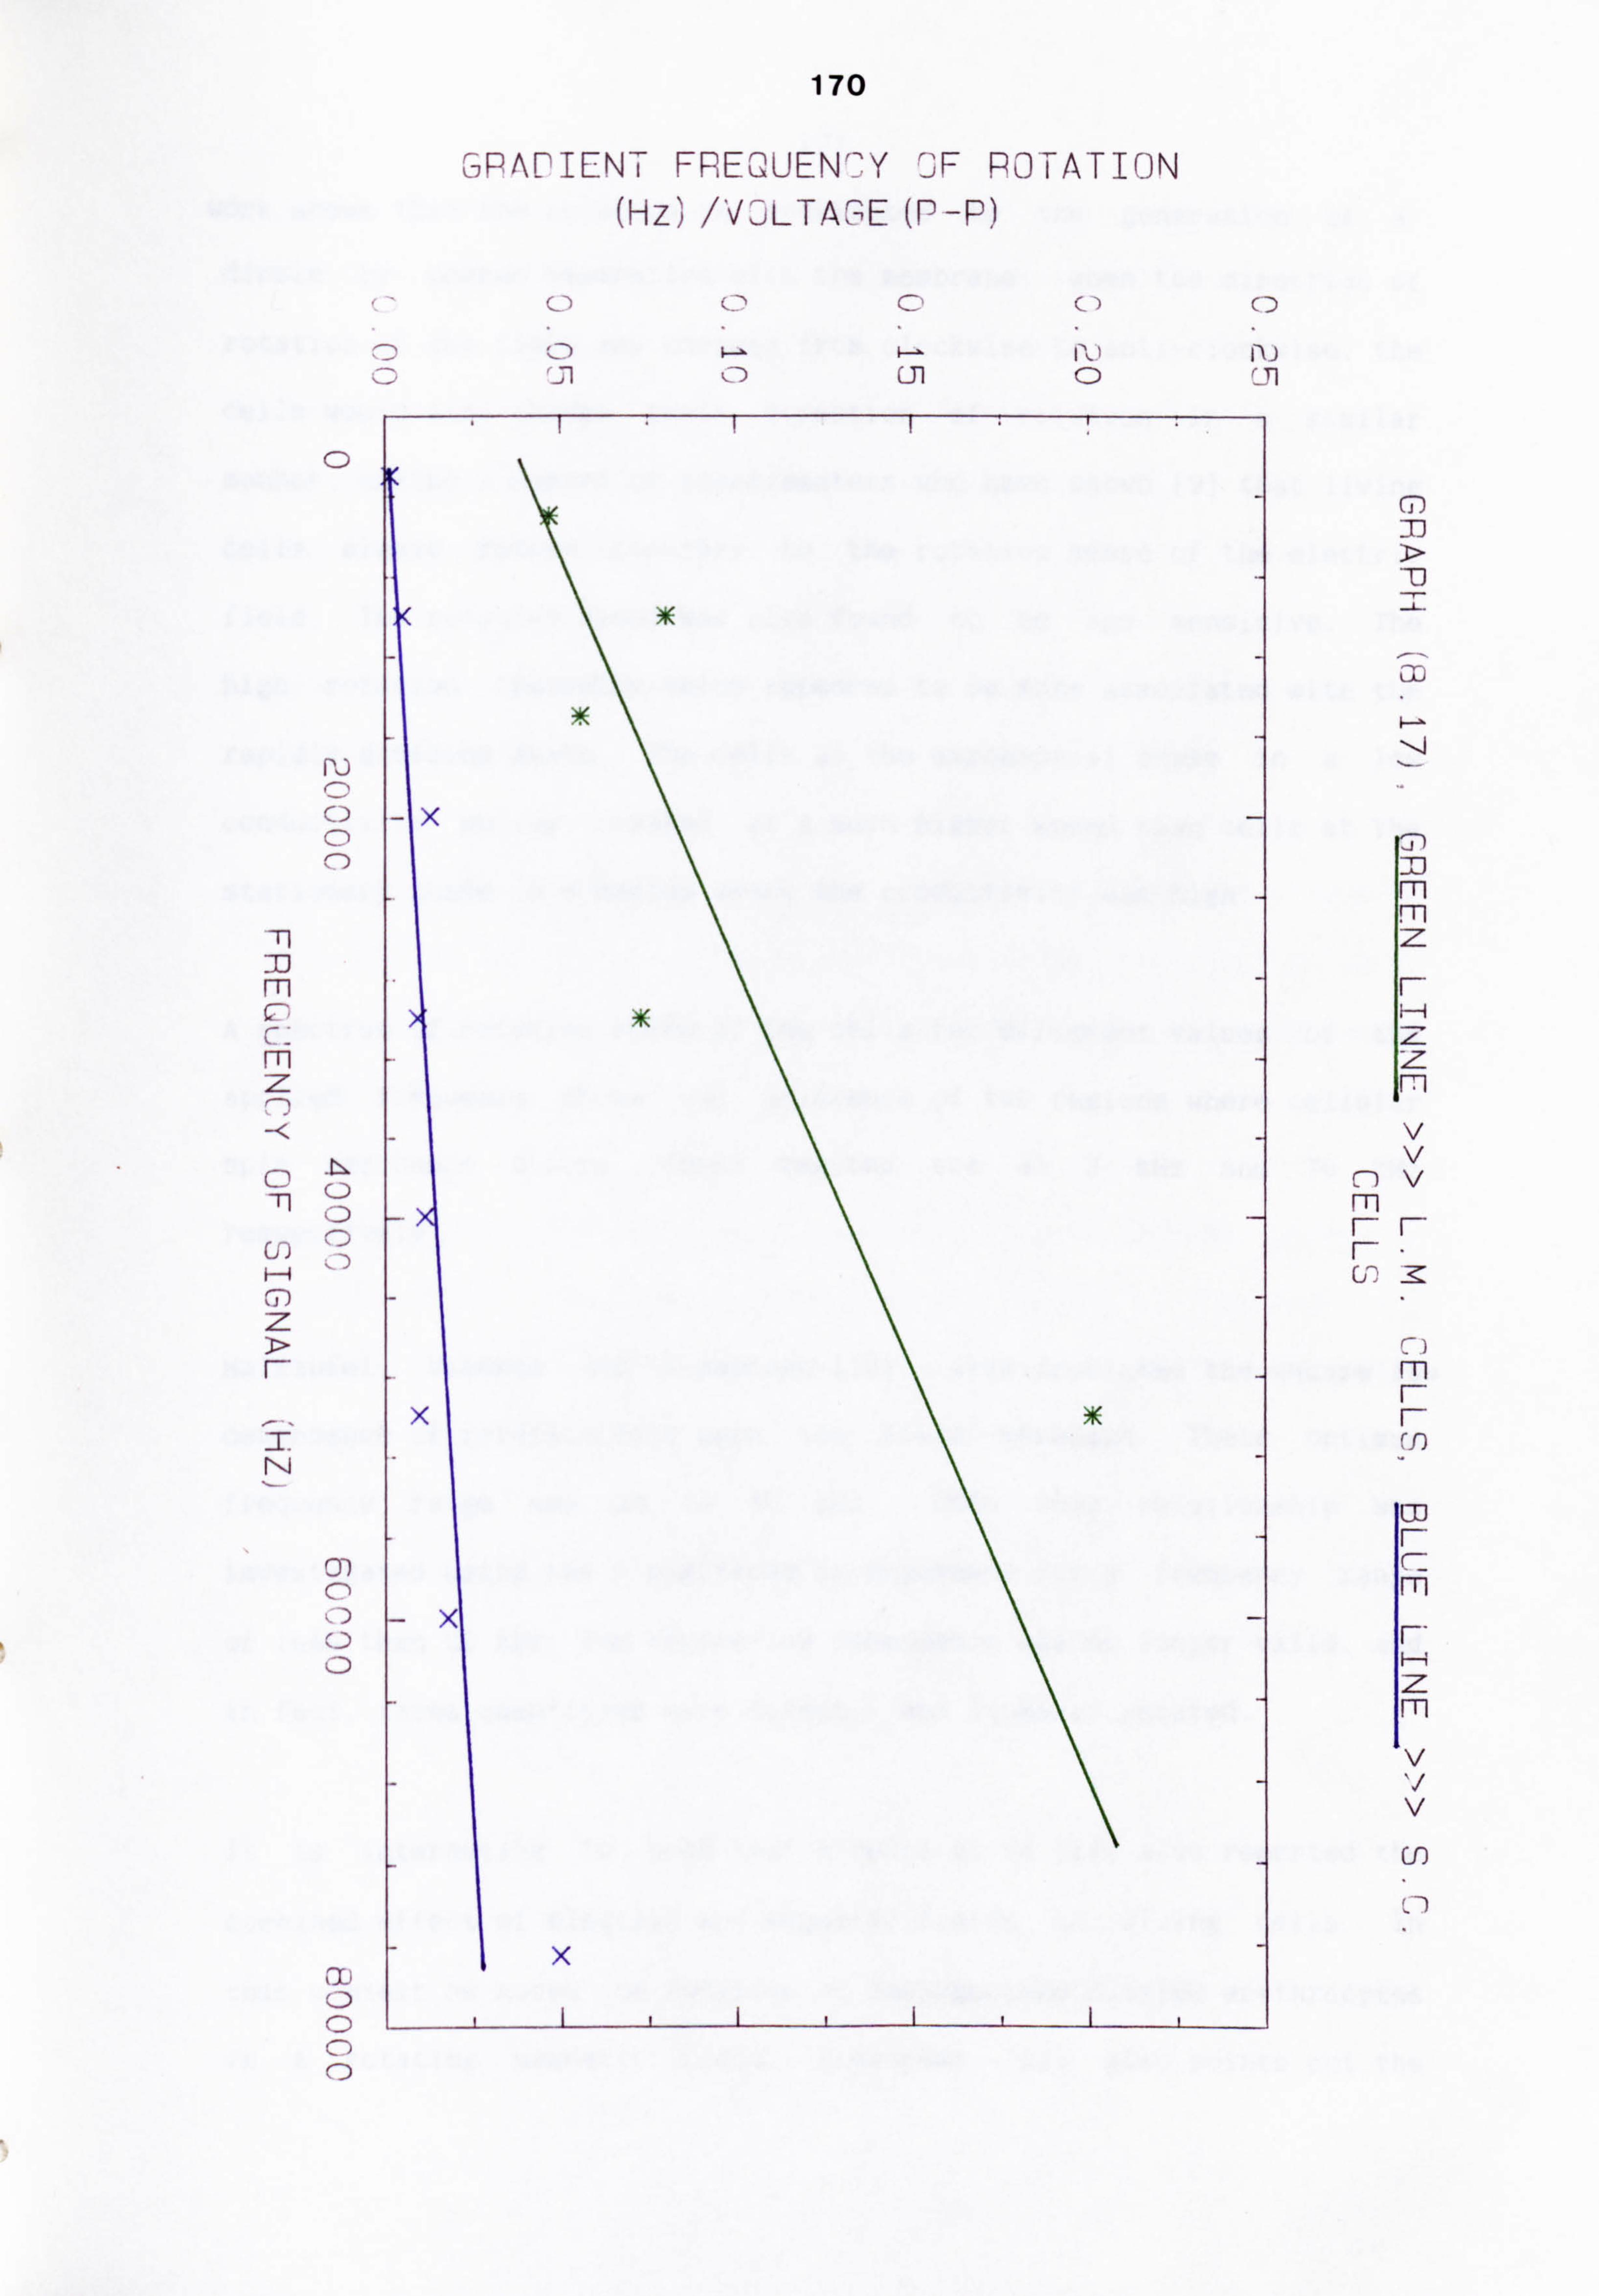
170
FREQUEN" oPAPIEN-1 Y '-JF ROTATION (Hz' ) I'V3LTA, "E (rl-P)
Q
C)
fl
71 M m
m z 17
Tl
U)
z
a7, N
01
C-) C
CD 0
CD
Cil
-x
x
-x
x
rn
, rn Z r-
v v
nv m
(2 _Z:
r- r- f, 0
ci r- c: FTI
r-, h---i Z m
v V v
(f)
171
work shows that the rotation is attributed to the generation of a
dipole by charge separation with the membrane, when the direction of
rotation of the field was changed from clockwise to anti-clockwise, the
cells would also change their direction of rotation in a similar
manner, unlike a number of experimenters who have shown (91 that living
cells always rotate contrary to the rotation sense of the electric
field. The rotation speed was also found to be age sensitive. The
high rotation frequency value appeared to be more associated with the
rapidly dividing state. The cells at the exponential phase in a low
conductivity medium rotated at a much higher speed than cells at the
stationery phase in a medium where the conductivity was high.
A spectrum of rotation speed of the cells for different values of the
applied frequency shows the existence of two regions where cellular
spin resonance occurs. These regions are at 3 kHz and 70 kHz
respectively.
Halzapfel, Vienken and Zimmerman [101, also predicted the square law
dependence of rotation rate upon the field strength. Their optimum
frequency range was 20 to 30 kHz. When this relationship was
investigated using the 4 electrode arrangements for a frequency range
of less than 20 kHz, the square-law dependence was no longer valid, and
in fact, these quantities were directly and linearly related.
It is interesting to note that Ribeiro et al (111 also reported the
combined effect of electric and magnetic fields on living cells. In
this context he noted the rotation of deoxygenated sickled erythrocytes
in a rotating magnetic field. Zimmerman [121 also points out the
172
occurrence of rotating fields and the generation of cell rotation by
rotating fields were linked with the occurrence of magnetic fields.
The evidence that living cells naturally produce oscillating electrical
fields in the rf region is by now quite strong, and proceeds from a
variety of pieces of experimental evidence.
i) CSR is observable with sharp resonance in living cells but not dead
cells (see, however, Zimmerman, et al. (131.
ii) Living cells continue to exhibit CSR in either AC or pulsed DC
fields. If the cells possessed induced-polarization dipoles only,
they would be expected to librate but not spin in high frequency
pulsed DC fields.
The presence of natural electrical oscillations in living cells is
well-established. They are present in a wide variety of organisms, and
vary with the physiological state of the organism. The above evidence
pin-points the rf range as also being of importance.
'A
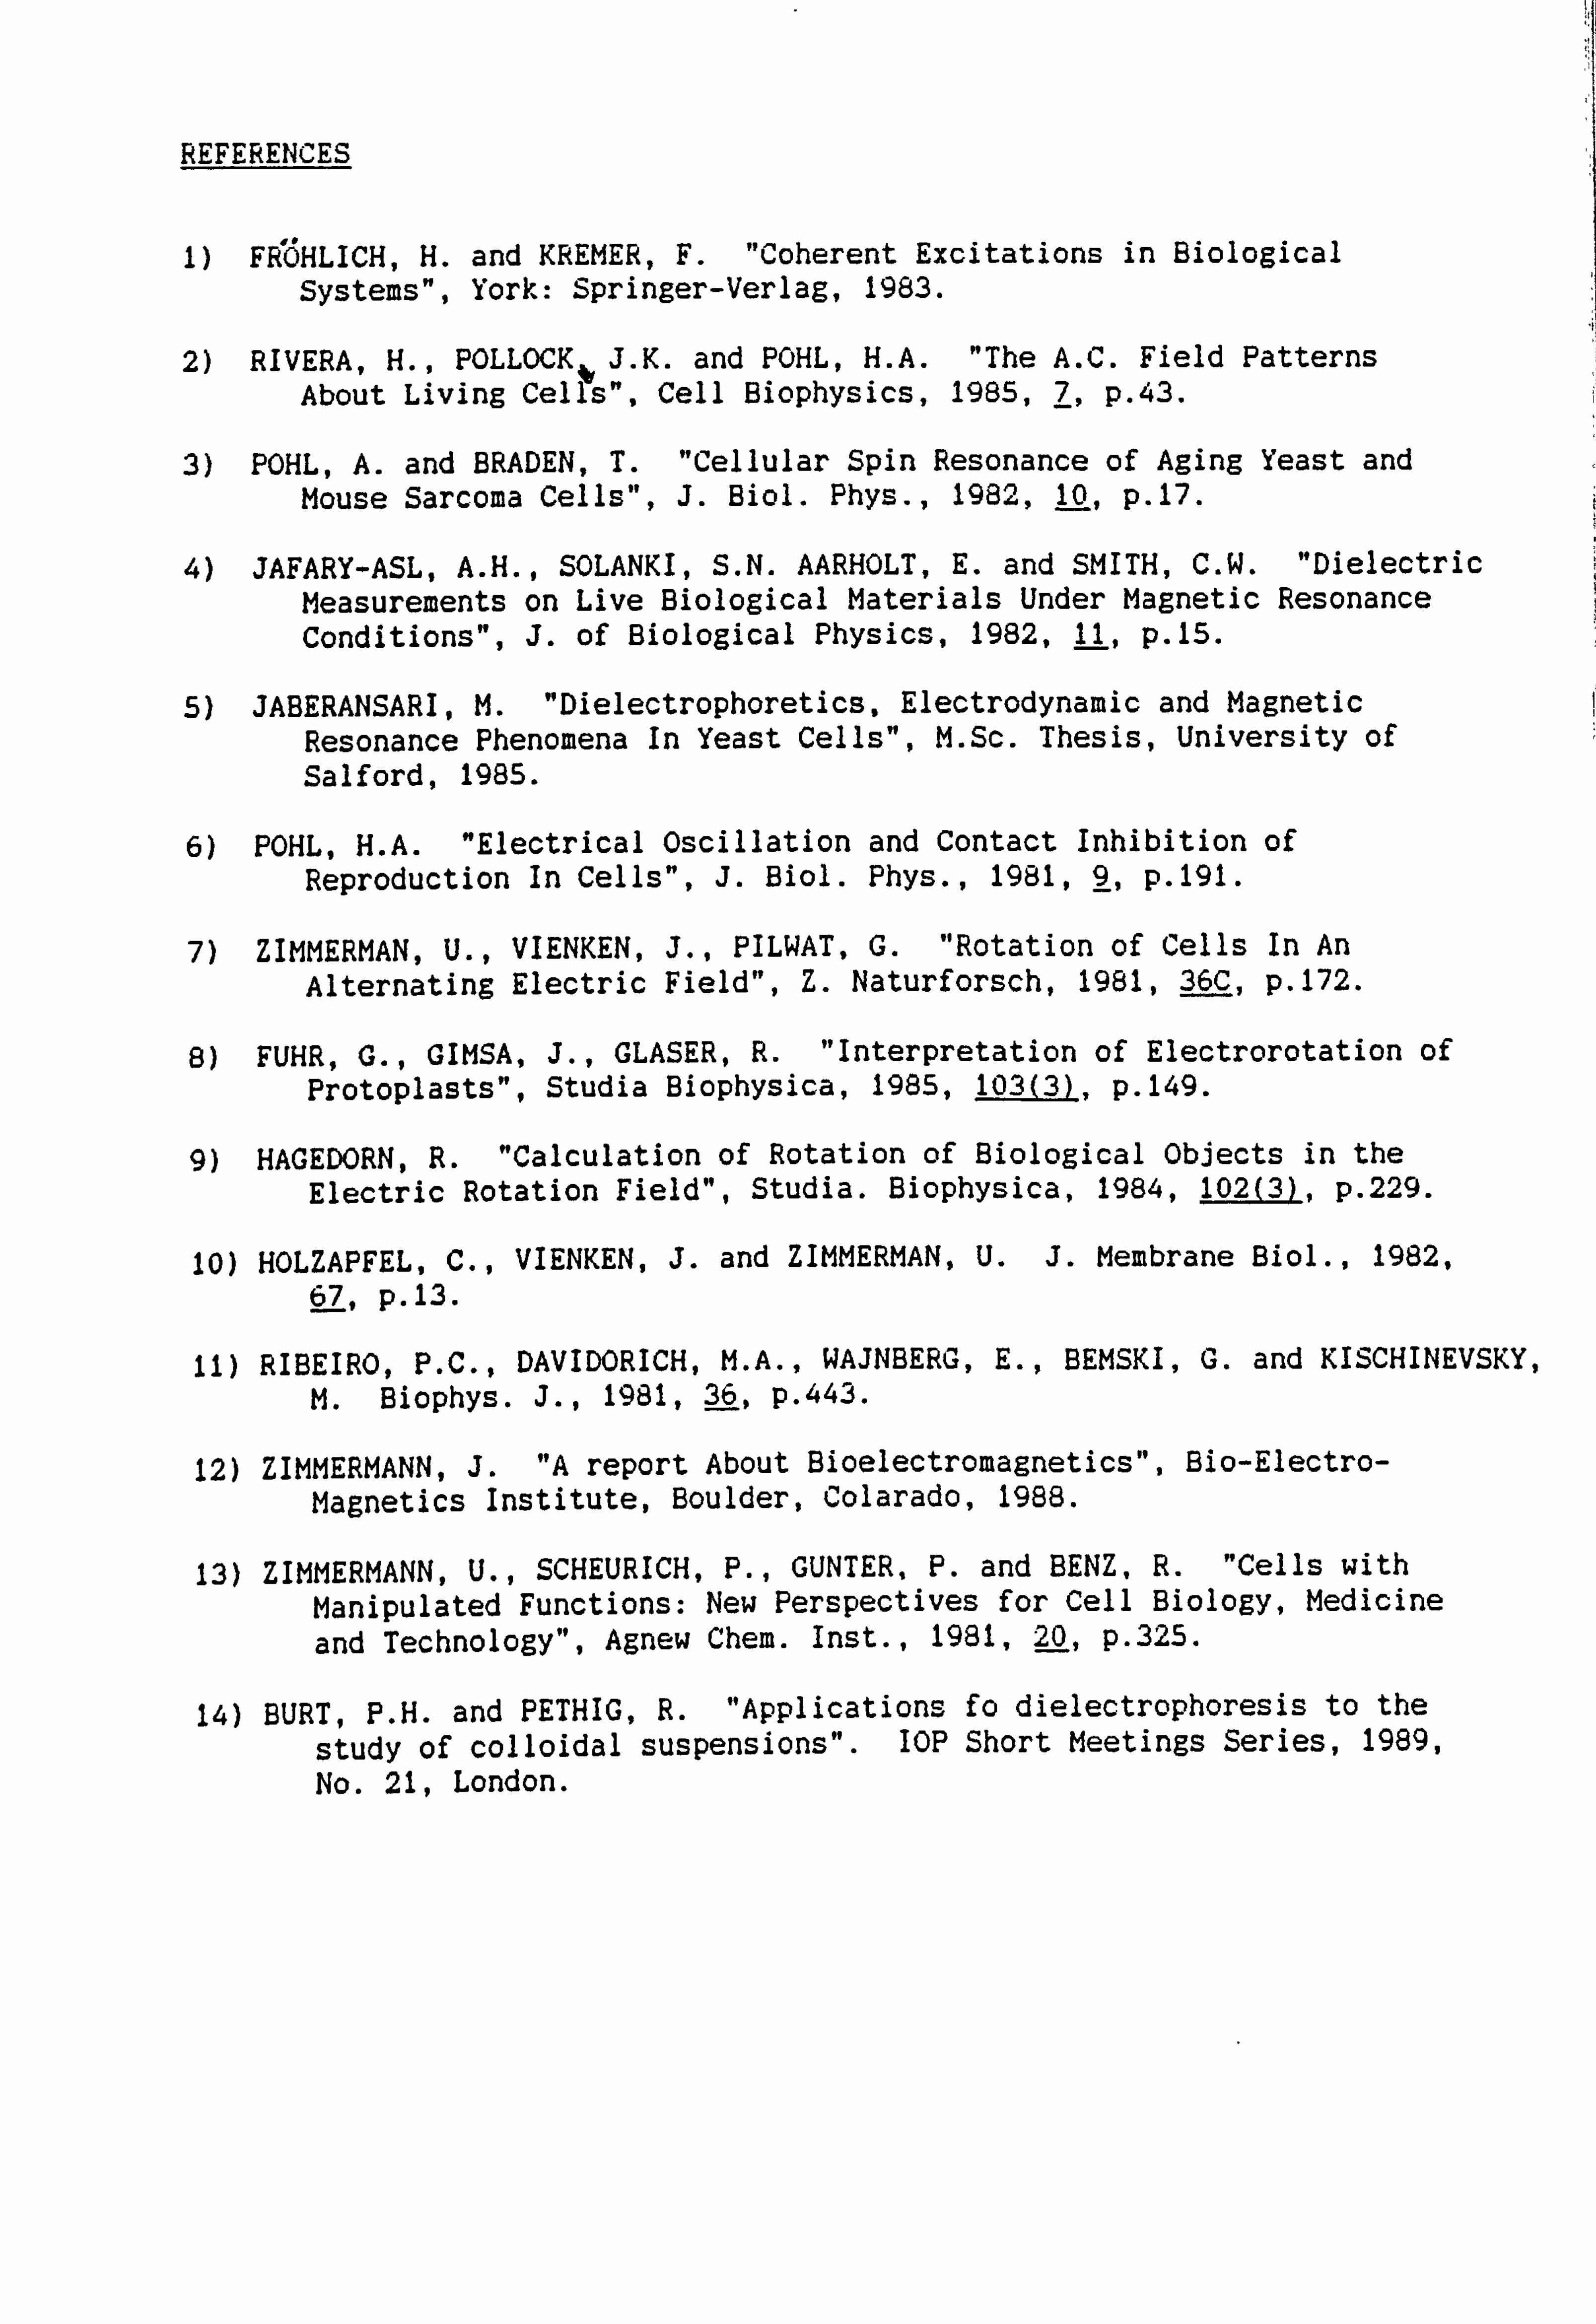
REFERENCES
1) FI&LICH, H. and KREMER, F. "Coherent Excitations in Biological Systems", York: Springer-Verlag, 1983.
2) RIVERA, H., POLLOCK J. K. and POHL, H. A. "The A. C. Field Patterns About Living Cel? S", Cell Biophysics, 19B5,7, p. 43.
3) POHL, A. and BRADEN, T. "Cellular Spin Resonance of Aging Yeast and Mouse Sarcoma Cells", J. Biol. Phys., 1982,10, p. 17.
4) JAFARY-ASL, A. H., SOLANKI, S. N. AARHOLT, E. and SMITH, C. W. "Dielectric Measurements on Live Biological Materials Under Magnetic Resonance Conditions", J. of Biological Physics, 1982,11, p. 15.
5) JABERANSARI, M. "Dielectrophoretics, Electrodynamic and Magnetic Resonance Phenomena In Yeast Cells", M. Sc. Thesis, University of Salford, 1985.
6) POHL, H. A. "Electrical Oscillation and Contact Inhibition of Reproduction In Cells", J. Biol. Phys., 1981,9, p. 191.
7) ZIMMERMAN, U., VIENKEN, J., PILWAT, G. "Rotation of Cells In An Alternating Electric Field", Z. Naturforsch, 1981,36C, p. 172.
8) FUHR, G., GIMSA, J., GLASER, R. "Interpretation of Electrorotation of Protoplasts", Studia Biophysica, 1985,103(3), p. 149.
9) HAGEDORN, R. "Calculation of Rotation of Biological Objects in the Electric Rotation Field", Studia. Biophysica, 1984,102(3), p. 229.
10) HOLZAPFEL, C., VIENKEN, J. and ZIMMERMAN, U. J. Membrane Biol., 1982, 67, p. 13.
11) RIBEIRO, P. C., DAVIDORICH, M. A., WAJNBERG, E., BEMSKI, G. and KISCHINEVSKY, M. Biophys. J., 1981,36, p. 443.
12) ZIMMERMANN, J. "A report About Bioelectromagnetics", Bio-Electro- Magnetics Institute, Boulder, Colarado, 1988.
13) ZIMMERMANN, U., SCHEURICH, P., GUNTER, P. and BENZ, R. "Cells with Manipulated Functions: New Perspectives for Cell Biology, Medicine and Technology", Agnew Chem. Inst., 1981,20, p. 325.
14) BURT, P. H. and PETHIG, R. "Applications fo dielectrophoresis to the
study of colloidal suspensions". IOP Short Meetings Series, 1989, No. 21, London.

CHAPTER 9
CELLULAR ATTACHMENT
173
9.1 INTRODUCTION
It is well acknowledged that while many cell lines can grow in
suspension, other cell lines and most primary cells require a
substratum, on which they can adhere and spread for growth. In 1968
Stoker et al, (1) demonstrated such anchorage dependence of growth by
adding glass fibrils 500 tim in length to cells held in soft agar or
methyl cellulose suspension. In the absence of fibrils, or in the
presence of silica fragments smaller than the cells themselves, the
cells did not grow. When the fibrils were added the cells attached to
them, spread, and grew into colonies. This indicates that the cells
must attach and spread in order to grow.
Cell adhesiveness plays a role in'developmental process such as c6ll
migration during embryogensis and morphogeneses in response to
particular extracellular matrices. It plays a role in homeostatic
processes such as tissue and organ stability, thrombosis, inflammation,
and wound healing, and it plays a role in the pathology of various
disease states. [21
Polystyrene dishes have been used for cell cultures for at least the
past twenty years. Many cell types adhere to, and move on, the
surfaces of such materials and present a morphology that is very
similar to that seen when the cells are grown on glass. However, it is
known that when the polystyrene is subjected to a chemical surface
treatment it becomes suitable for cell attachment.
Polystyrene surfaces, as pressed by the manufacturer, are unsuitable
for cell attachment. This has been attributed to the surface chemistry
of the polystyrene, and many different suggestions have been made as to

174
the precise chemistry involved in the non-adhesive nature of
polystyrene. (2,31
Several processes appear to be In use commercially for making the
dishes suitable for cellular adhesion (41 though, regrettably, little
information has been published by manufacturers about their own
techniques. Martin and Rubin (5) reported that treatment of
polystyrene with concentrated sulfuric acid followed by exposure to 0
ultraviolet light (used by them for ste? lization), converted the
surfaces of the dishes into a state suitable for the adhesion of
fibroblasts. Maroudas (6) suggested that this treatment leads to the
sulfonation of the polystyrene with a consequent increase in the number
of charged groups per unit area. However, it seems likely that the
treatment used by commercial manufacturers is a corona discharge, which
might induce mild oxidation of the surface of the plastic or
destruction of any mould release agent used in manufacture. Klemperer
and Knox [31 found that treatment with chromic acid, which might
produce hydroxyl, aldehyde, or carboxyl groups on the surface, led to
increased cell adhesion. They suggested that cell adhesion required
the presence of charged groups, which might be either carboxyl or
sulfonate. However, in 1973 and 1980, Curtis et al [71 and Gingel et
al [81 respectively, reported that the attachment to surface decreases
rather than increases as the surface charge density is raised. This
evidence appears to be a direct contradiction to the idea that charged
groups on the surface are responsible for cell adhesion. Moreover, the
two studies on modification of polystyrene both used the crystal violet
dye method for measuring the surface density of charged groups. This
method is suspect because it requires the binding of several hundred
dye molecules per NO of the surface in order to detect one charged

175
group. Furthermore, measurements of the surface charges produced by
sulfonation, by Gingell et al (81, using electroendosomosis, gave a low
value of only 1.33 esu cm-2. Thus there are two reasons for doubting
whether the presence of charged groups on polystyrene is required for
cell adhesion. In addition the results of work by Martin and Rubin (5)
suggested that there is a correlation between cell attachment and the
number of negative charges on the surface, therefore it can be assumed
that the charged groups are all anions: and surfaces bearing cations
which are very adhesive for cells.
This chapter investigates the cases of the attachment of Leishmania
maJor cells to scratched polystyrenes or charged substrate, and
includes measurements of attachment on electron and positive ion
charged surfaces using Leishmania major cells. Perhaps somewhat
arbitrarily this research is felt to be very relevant to reaching an
understanding of the mechanism of cell adhesiveness.
9.2 Scratched plastic as a substrate for attachment
During cultivation of some flagellates (121, in Schneider's Drosophila
medium and Grace's insect tissue culture medium, some flasks were
initially inadvertently scratched with the tip of a metal needle or a
pasteur pipette, or a diamond, and Leishmania major cells were cultured
in them. All Leishmania major cells were attached to the scratched
area (after 46 hours) and formed colonies. Attachment led to an
increase in the division rate of the major cells. After 13 days the
number of Leishmania cells cultured in scratched flasks was
approximately increased to about five times compared with unscratched
controls. An example of attachment of Leishmania major cells to a
scratched polystyrene is shown in Fig (9.1). Fig. (9.3) magnifies the
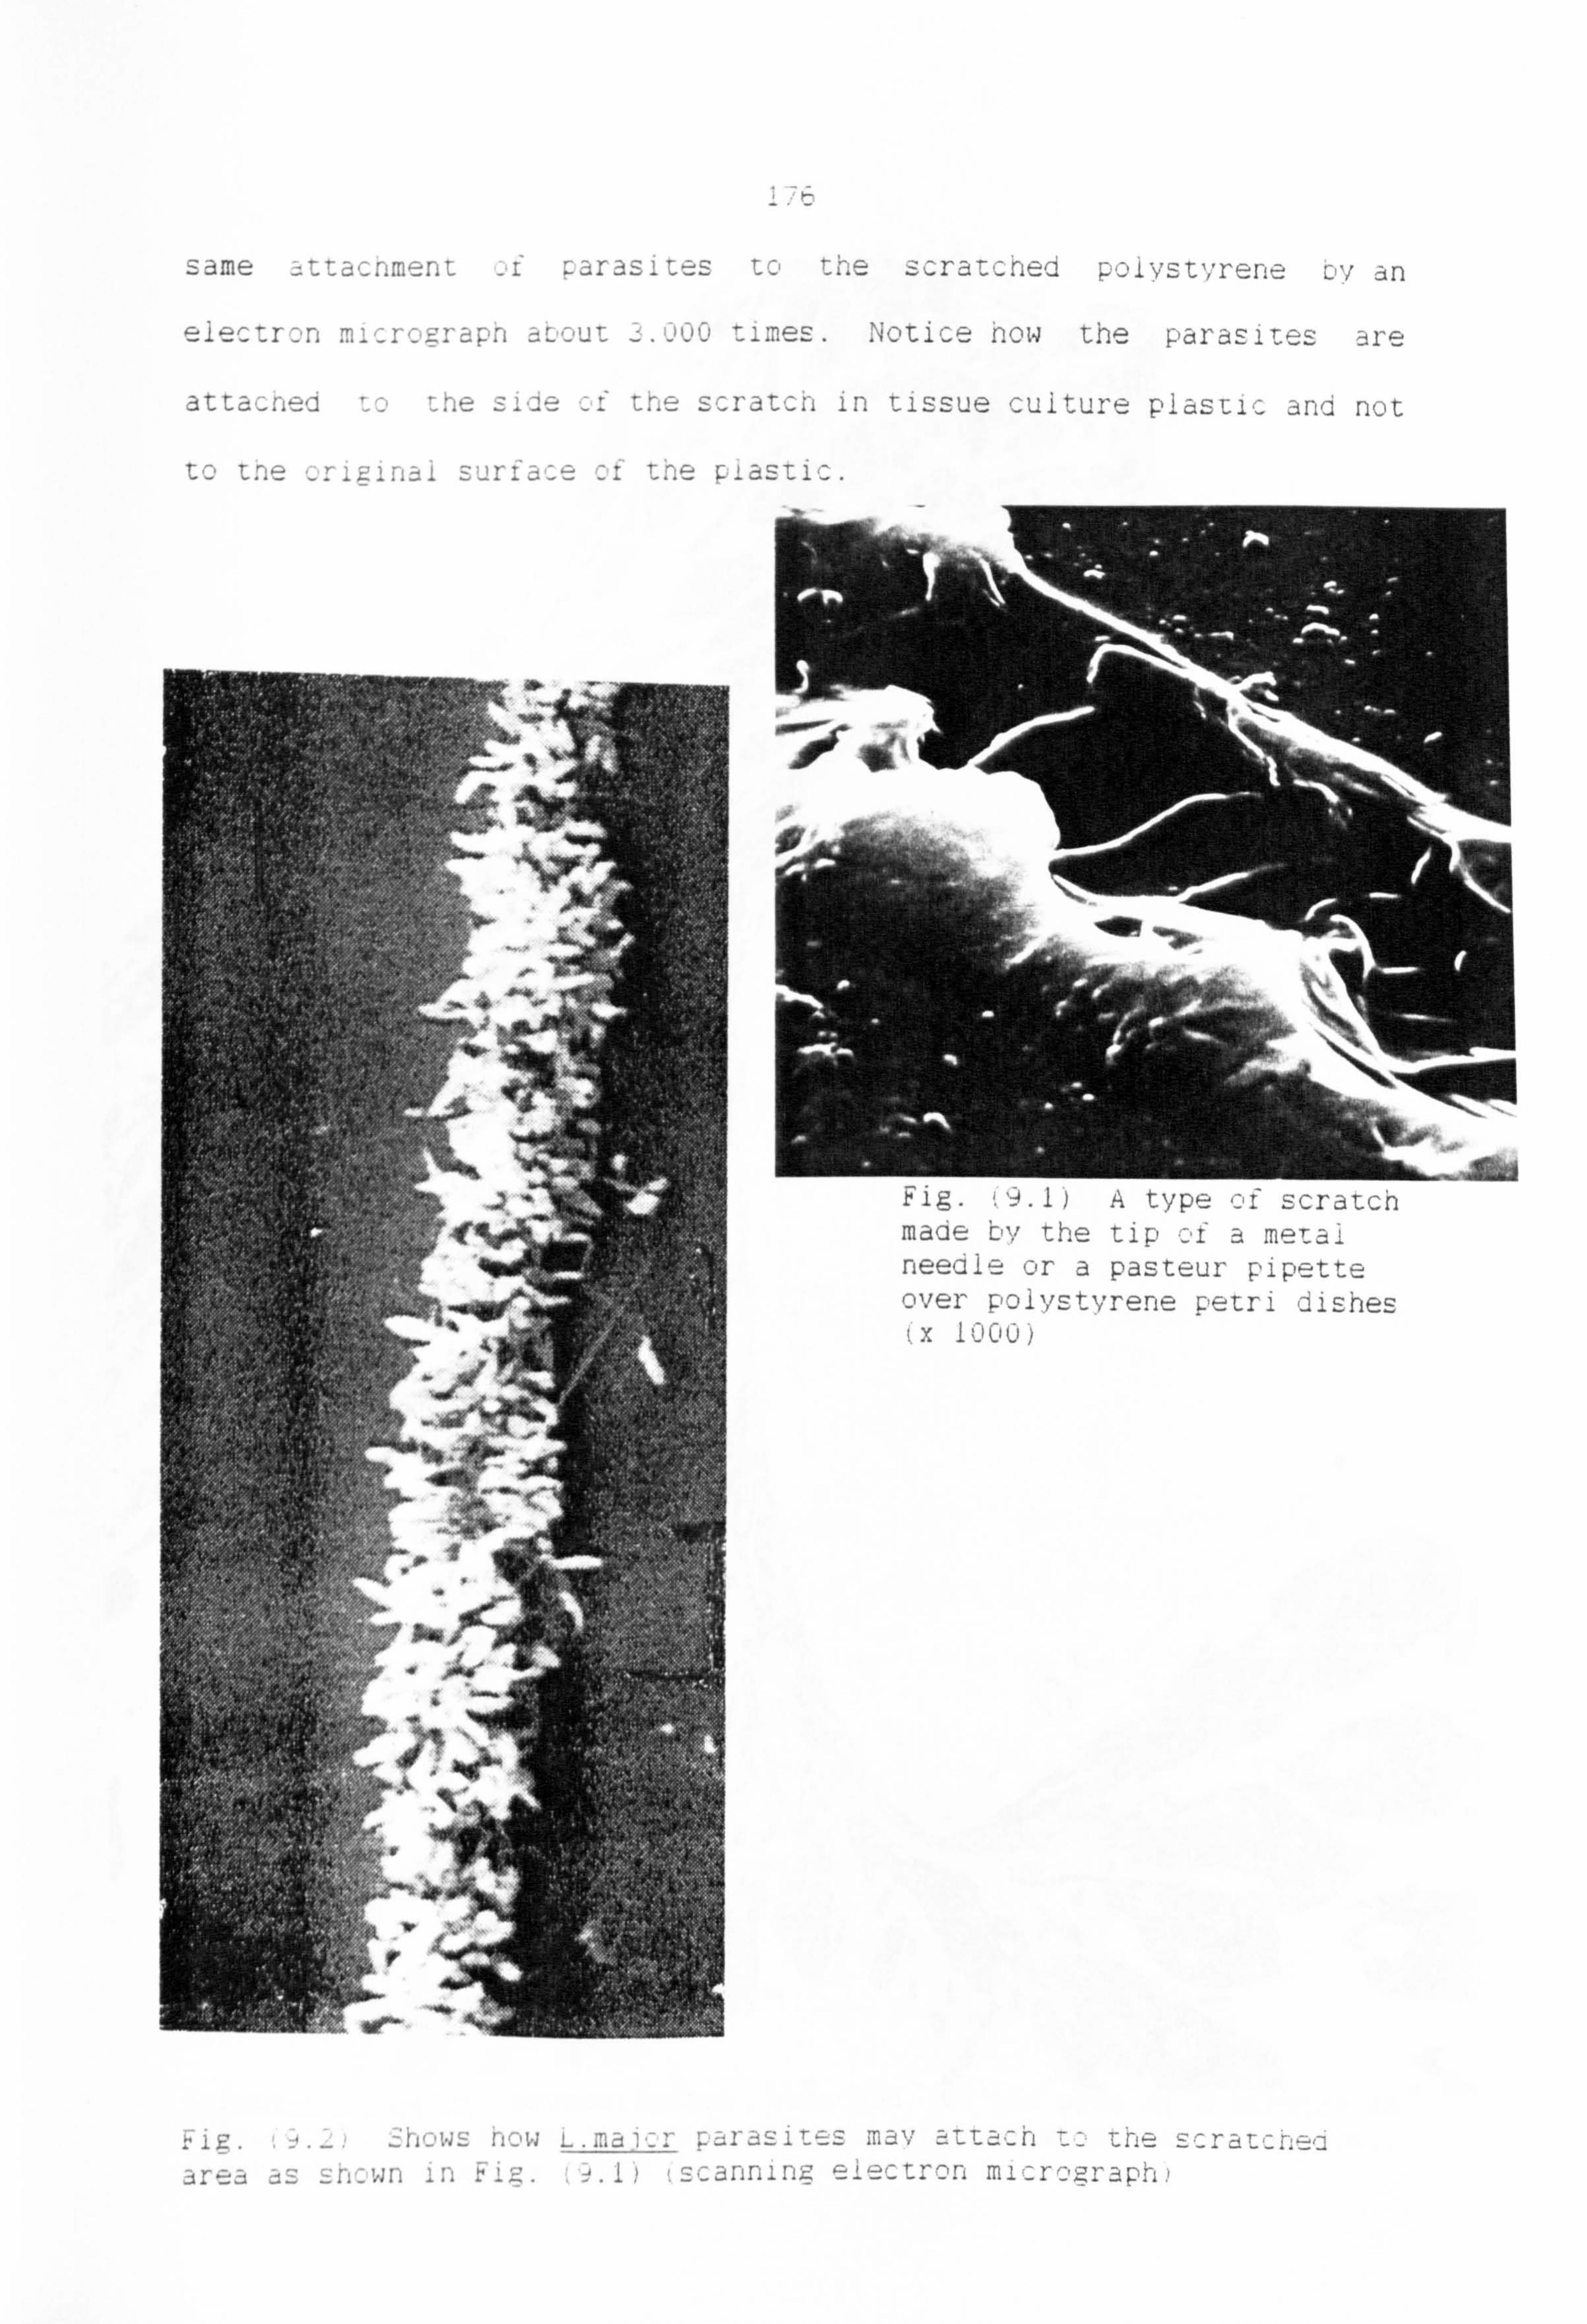
same -ttacnment -. f ýarasites to the Scra-cched poivstvrene c:, v an
elecl-r--, ri mi,, -rý:, ý: rapn -aL---, ut --imes. Notice how the parasites are
attac-ned - --, -he -t' the scrat, --, -, in tissue cuiture piasuic and not
isri:.
4.
sr-,, -wn in iiýz. --. i) ýscanniriF- eiecr-rcri mi, --rc, graph!
mace bv the r-ip a me-ýa-! needie or a pasteur pipe-tte over ý,: )ivstvrene petri dishes ýx
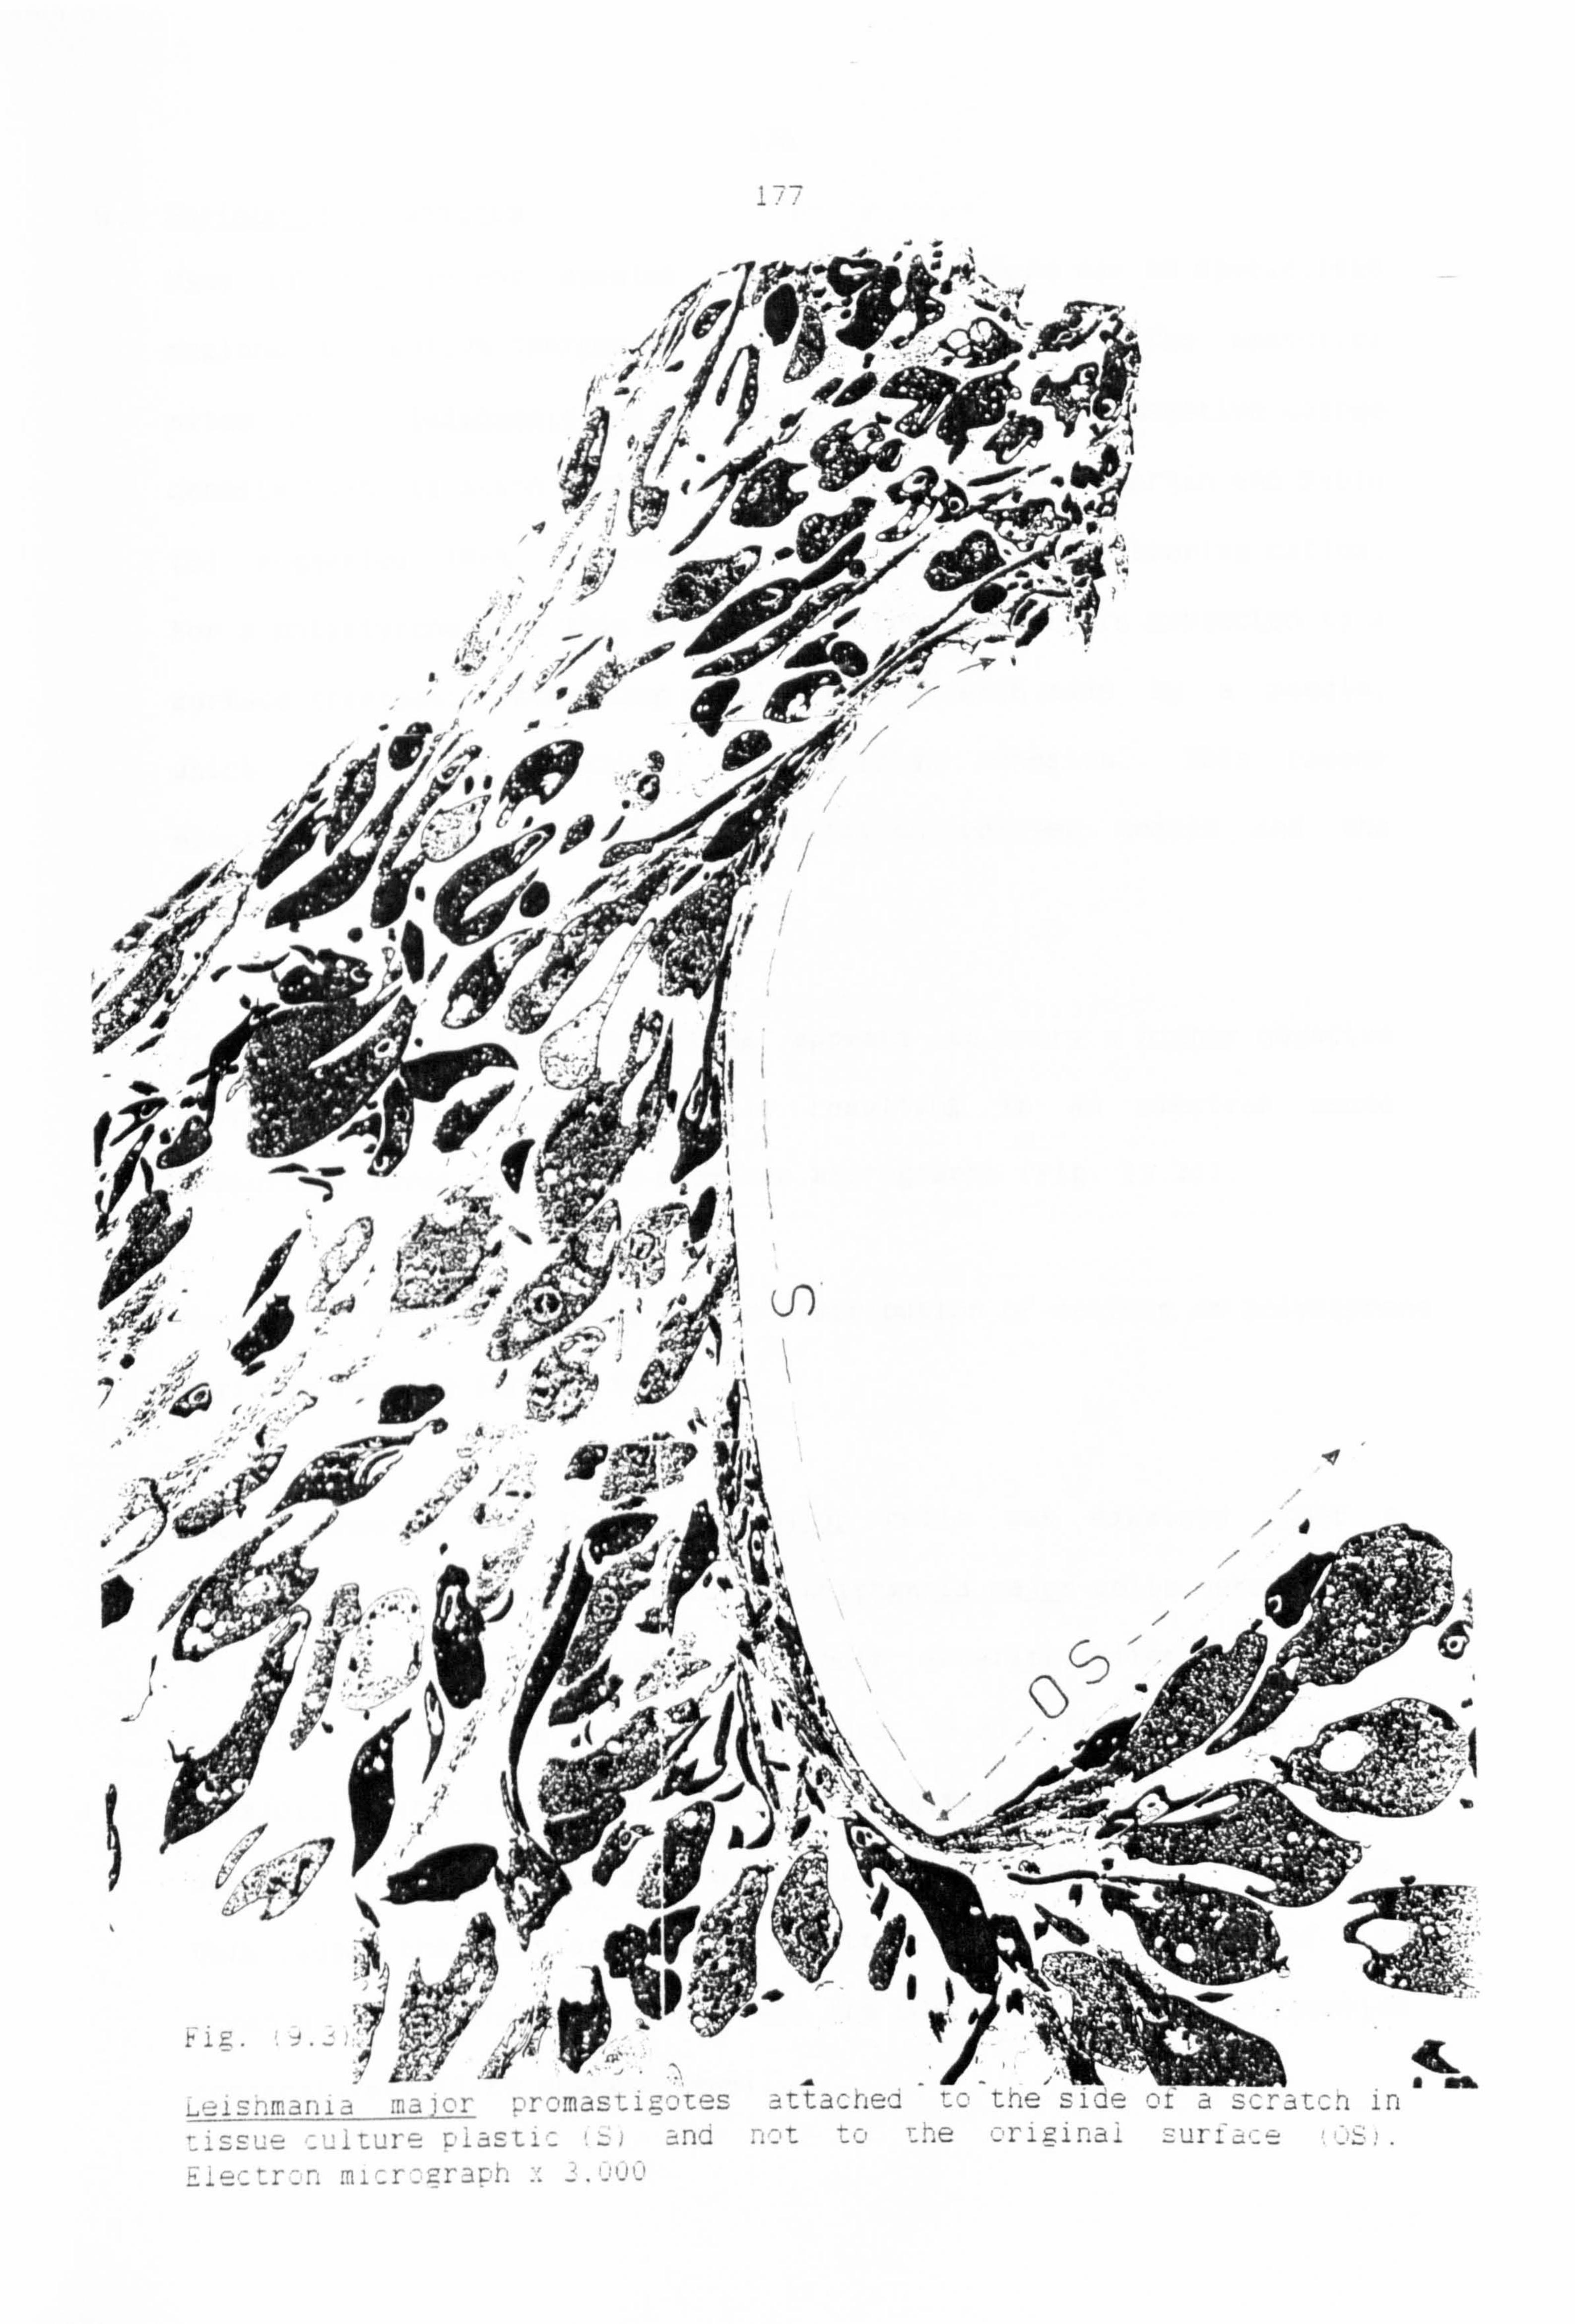
, -92
4W
lk
war
4L a oft II nn, s
zi sL1 ! ý, e r13LI
41-
r" 41
:
178
9.3 Surface of substratum
Many of the recent studies indicate that there may be specialised
regions of negative charges on the cell surface [9). The posterior
sites of a Leishmania major cells may have higher negative charge
density than its anion sites. Also, as said before, Martin and Rubin
(5) suggested that the substratum may have a surface bearing cation.
For a polystyrene dish this will only be true when it is subjected to a
surface treatment, something similar to a scratch made by a needle,
which would be suitable for cellular adhesion. This causes
electrification of polystyrene by friction between needle and the
polystyrene surface.
The surface of these scratches appears to carry a higher nýgative
charge than the surrounding plastic resulting in an electron dense
subsurface layer visible in electron micrographs (Fig. (9.3)).
However, the possible role of the distribution of cations on polystyrene
surfaces require further study.
When adhesion of Leishmania major cells was examined under a
microscope, it was noticed that all Leishmania major cells were adhesed
to the surface of the scratch by their anterior sites. A typical
example of them is shown in picture (9.3). This tells us of the
possibility that the posterior sites of a L. major cells has a higher
density of negative charge compared to its anterior sites, and hence,
this causes the anterior sites to be attached by the surface of the
scratch (unlike charges attract) and the posterior sites to be repelled
comparatively (like charges repel).

179
Whether or not this attachment is a result of a substrate surface
charge, which is probably negative, remains to be seen. (101 Eukaryotic.
cells usually carry an overall negative charge and thus might not be
expected to attach to like charge substrates. In bacteria, which
adhere to epithelial surfaces in vertebrates, the attaction between
hydrophobic molecules on the bacterial surface and the hydrophilic
phospholipid molecules in the lipid bilayer membrane of the epithelial
cells, probably overcomes a similar charge repulsion.
9.4 The physical Implications of the attachment of L. major cells to electron bombarded surfaces
The treatment of polystyrene petri dishes to give electrostatically
charged surfaces showed that attachment may be mediated through an
electrostatic charge phenomenon at least as a contributary mechanism.
Clearly, the L. major cells have decided that the electron charged
surface is a good place to stick. Such an observation suggests that
'in vivo' in the insect host, a combination of mechanisms must be
involved. Some host surfaces certainly carry negative charge within
which can be visualised using cationic ferritin. (101 To investigate
the polystyrene surface effect, a small piece of polystyrene was
dissolved in toluene. Once the solution was liquified and prepared, a
very small amount of it was poured by pipette over the base of a
prepared flat glass beaker. The beaker was then spun rapidly in a
photomist spinner at 1000 revolution/sec. This formed a nice uniform
thin film polystyrene over the glass. The thin film polystyrene was
left overnight in a clear air room cabinet. Once the thin film was
dried, U. V- light was shone over it for the following 24 hours. The
sample was finally scratched by a sterilized diamond and the plate was
then carefully taken to the Biology Department for cell attachment
180
experiments.
Experiments carried out on these thin film polystyrenes gave the same
sort of attachment as petri dishes. However, since the polystyrene was
a thin film, it floated on the surface of the culture medium in the
beaker with the cells attached to the under surface of polystyrene.
Furthermore, to eliminate the possibility of attachment by surface
effects with polystyrene, it was decided to repeat the attaching of
parasite cells with the glass petri dishes. A glass petri dish (Labap
Laboratory Equipment (50ml capacity)) was created by electron beam
bombardment with a dose of 5x 10¹¹ e/ml The L. major cells were
cultured and left in an incubator for 48 hours. Observation of this
glass beaker revealed the same sort of cell attachment as was obtained
by polystyrene petri dishes. There was no attachment of any kind to a
control glass petri dish which had not been bombarded by an electron
beam. This strongly supports the idea that cell attachment is mediated
by a negative charge phenomena. It was then decided to repeat this
using polystyrene petri dishes.
This part of the chapter summarizes some results obtained when the
petri disches were
a) negative electron bombarded
position ion implantation
9.4.1 Electron bombardment
This experiment was tried many times for different ranges of doses of
-ve electron charge and the following effects were observed.

at t -=. -- rime! -, t -: I: tachmenlE SO% aLtachment
ei ec tr m2
1 in tne Jý: ze r3nge c, f
the surfa, --e cýf mav
The att3cnment is more -, r
Fi gure t ý. 4) i and the paras i te;
water a plasti: bottie.
-iecrr---ns i, m SOM,
starý and -an be
iess a twin tvpe
can be deta1zhed
I Alý -' 10 -ý L'' CA*.
. 40A I
lijr- -i _. mai(-, r -ells to i, -lw dos -ictr ri --nmer, T, -'Le-c petri disches ýx 100)
The r'. ee ativ t-- ei e- r- trcnL, e- amL ý-, mbardment jose range -, f C, 20
ýýresente, 2 - strc. nger zadhesion than the previous 1016-
1, -) ri rarize. This j, -ýSe- xgave t ne- strorlp-: -S, ý zatt=acnmerit
be in thiz ranpe the paras iEe a iýe ij Lý m -jiso
, ar, :, s jný it, sancif i,,,, h-Et, --fter, -rp
e attachment of ceiis to
, -, bser,., ed.
attachment ýas shown in
easily by aj-: - t of

memcrane t C, ncrease : ne area cll - i: eii-su I osr-rate -, -ýnract presumabiv to
i1 iLaTe ajni-S I -'r, ihese ceiis : 2uld not ý-e det a . -- hed
eas ii-! with sDmetriing ii ke a jet -, t water from a piastic bottie.
Usuall-, - re. ynciiing -ýrlese plarasites. a paper tissue had to be smoothlv
ruLued ver Lhem. ;;,. jbber ýýI-ves were aiwavs worn whiist ý: arrvinz
these experiments under suPerllisic, n.
,*, at -
44
'4
'i
attachment obtained in mid-region dose 10 L. maj, -, r parasites attacned strongi, to a piastic ie, trnn tombarded petri dish forming ý: ircuiar ýýoiony phase-, -- ontr ast light mi,: rc, graph ý., V-Iljý
"K ,I,
46

/ el
Fig. L. maic, r parasites scraped from tý-, e petri dish surfa-e ýFig. ('; ý. S! . The two ýýells -, n the rignt show short. greati,,,, expanaed flage. i1a. Bright field light monograph, j'iemsa stained.
Anv e- trc, n Leam : ic, se i,, lu a
t-t-17' piat-: --s were exposed tc. an -iectr, -, n amn
m, ý- r, -- ', :: 31,1 -if tnem was an doses -, I, -: -, -! " eiectrons/m-: : -. no Qniv in
attaýýrim. ent 'Ihe exaiý't ýý.: ause vf this is stili rict ., er�, ý- lear
but when a L. ma -, -, i i --ttachment was cotained. it was a strcng
attacnment. The autli-r L, eiieljes there is a need t---- extend sur-In studies
especially in this nigh dose range. Unfortunately, this did not prove
t C. C-e P, Dss iL! eE: i r,, - e there was wnlv a singie high wner; v eiectrun
machine in the w=partment and that had to be shared with manv other
researoners in ihn Universitv. Finailv. when this machine Lroke aown,
,et. D f ind týje reSDL _eS -epa
, jUr I rig ýr, e- ý -'. 'a I -.:: L I-- i -, z, rig this rese a rc; ý,.
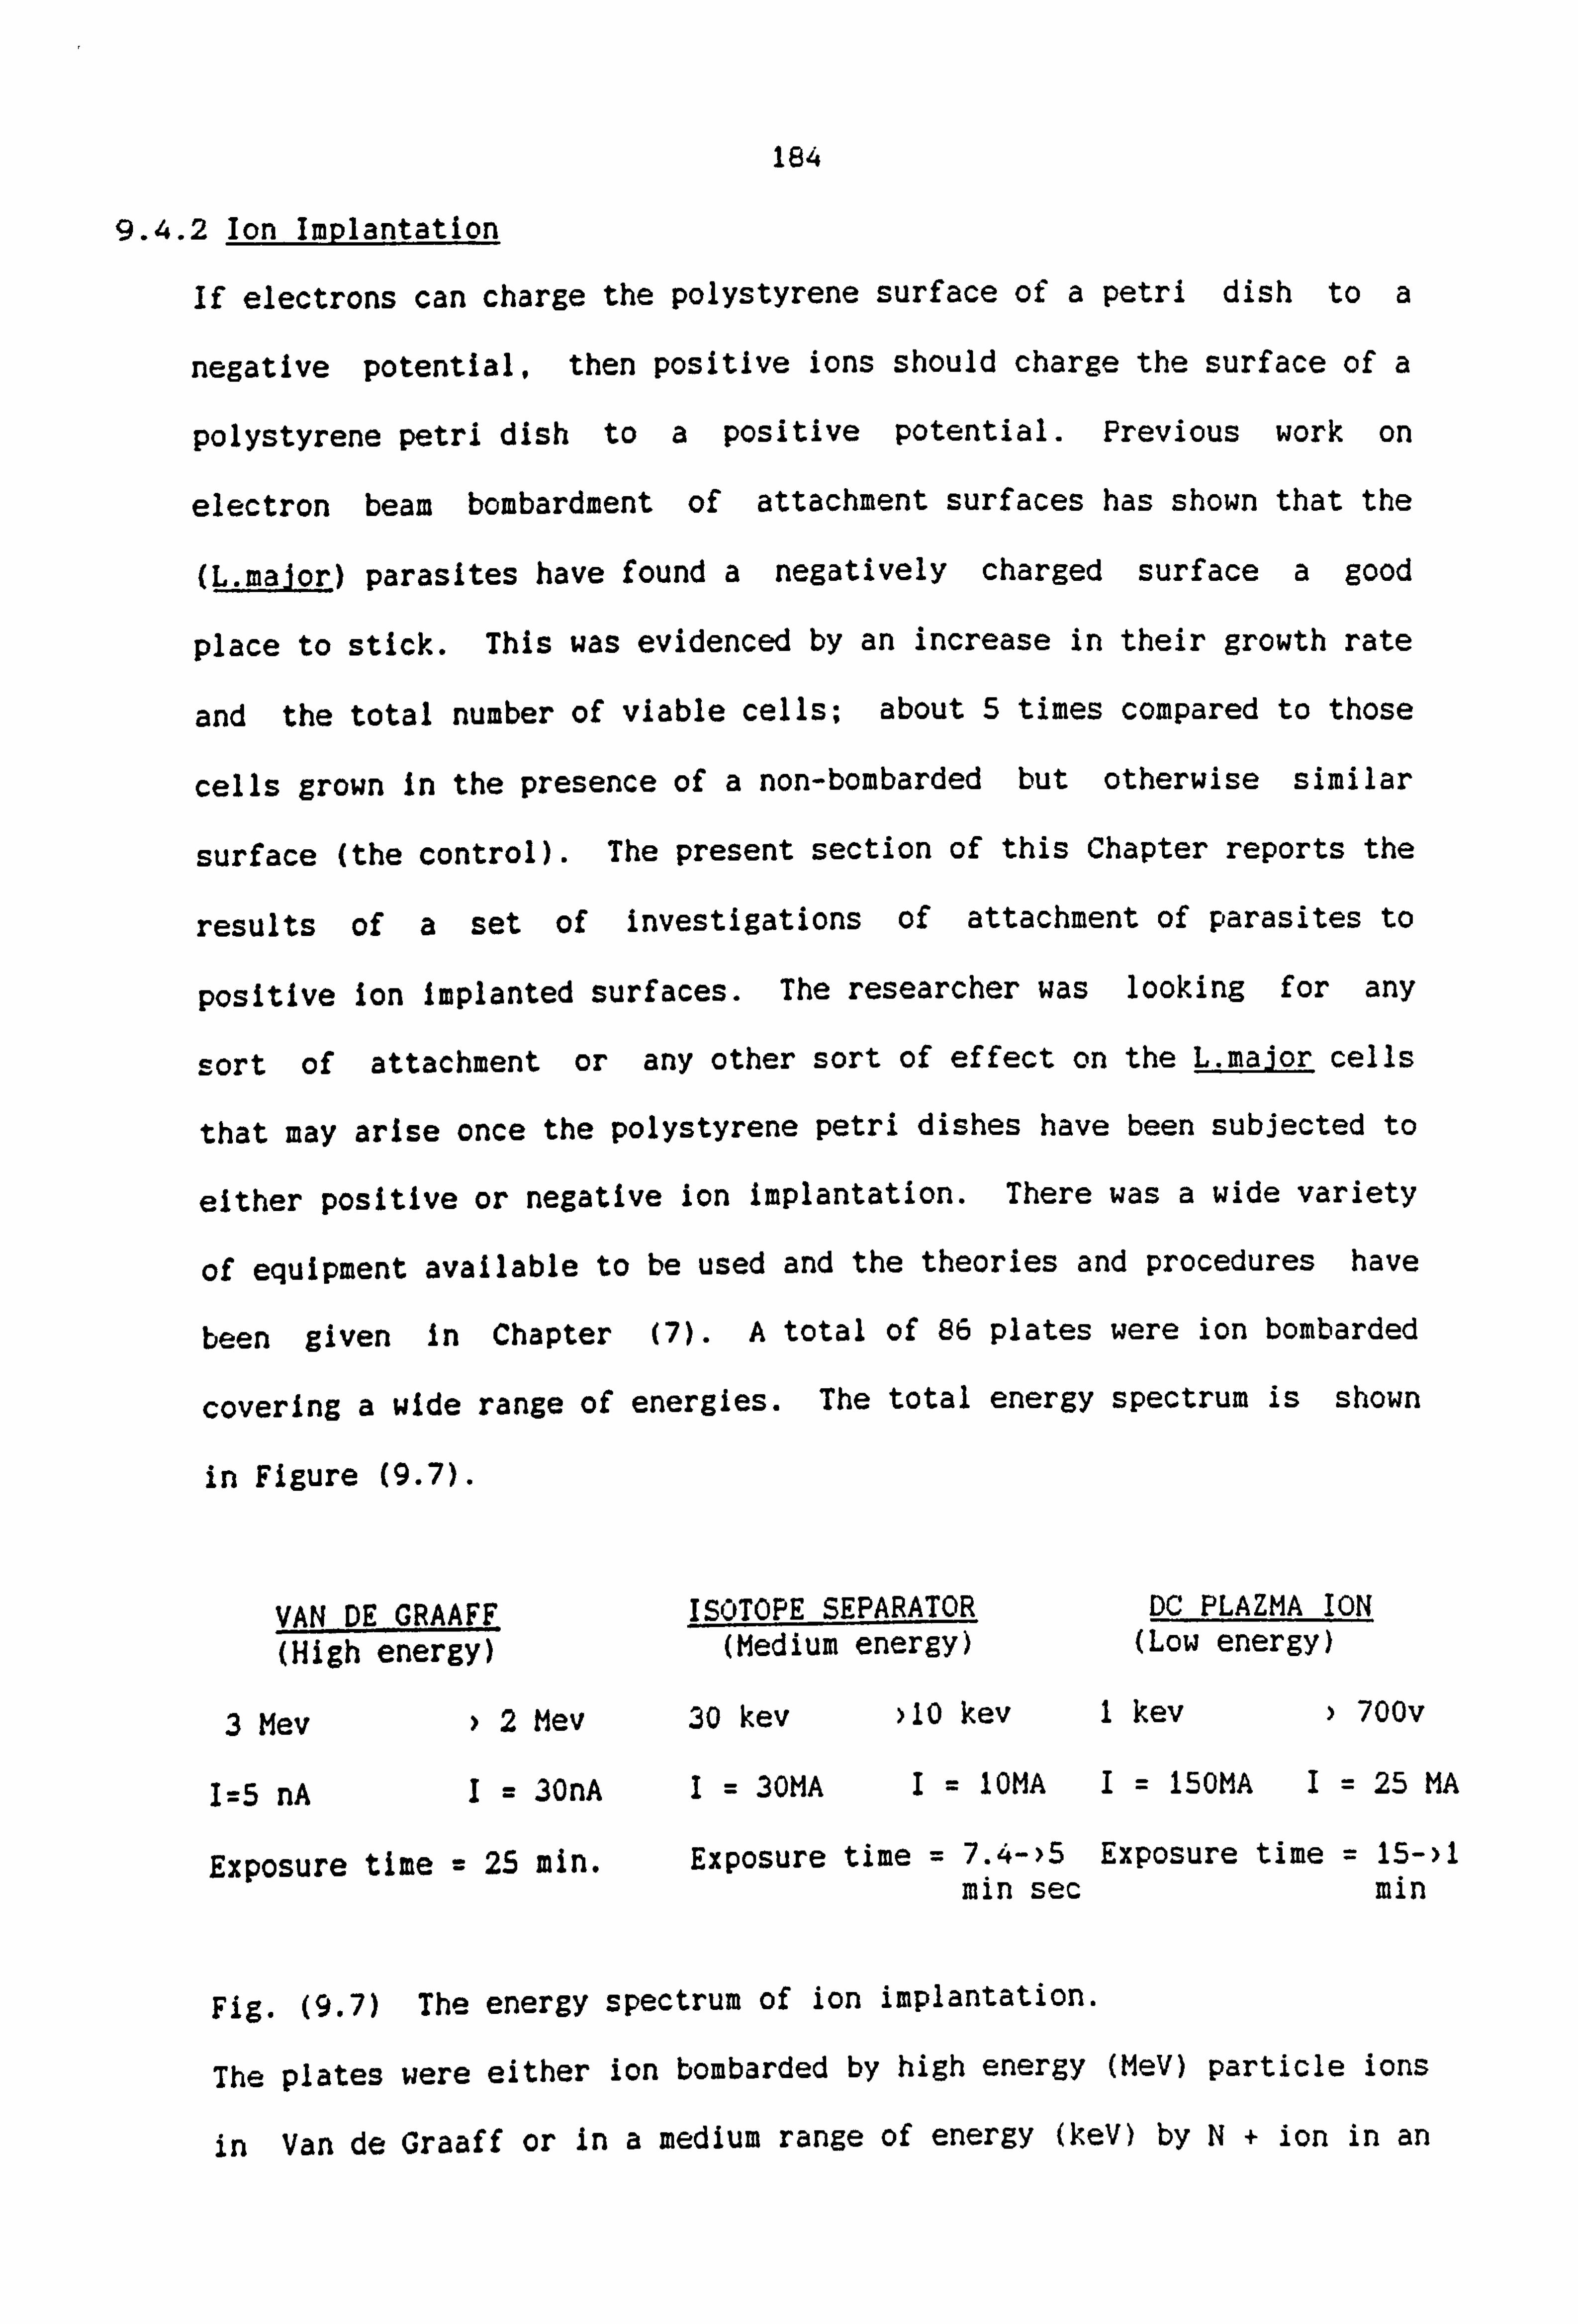
184
9.4.2 Ion Implantation
If electrons can charge the polystyrene surface of a petri dish to a
negative potential, then positive ions should charge the surface of a
polystyrene petri dish to a positive potential. Previous work on
electron beam bombardment of attachment surfaces has shown that the
(L. major) parasites have found a negatively charged surface a good
place to stick. This was evidenced by an increase in their growth rate
and the total number of viable cells; about 5 times compared to those
cells grown in the presence of a non-bombarded but otherwise similar
surface (the control). The present section of this Chapter reports the
results of a set of investigations of attachment of parasites to
positive ion Implanted surfaces. The researcher was looking for any
sort of attachment or any other sort of effect on the L. major cells
that may arise once the polystyrene petri dishes have been subjected to
either positive or negative ion implantation. There was a wide variety
of equipment available to be used and the theories and procedures have
been given In Chapter (7). A total of 86 plates were ion bombarded
covering a wide range of energies. The total energy spectrum is shown
in Figure (9-7).
VAN DE GRAAFF (High energy)
3 Mev )2 Mev
I=5 nA I= 30nA
Exposure time = 25 min.
I-SOTOPE SEPARATOR DC PLAZMA ION (Medium energy) (Low energy)
30 kev )10 kev 1 kev ) 700v
I= 30MA I= 10MA I= 150MA I= 25 MA
Exposure time = 7.4->5 Exposure time = 15->l min sec min
Fig. (9.7) The energy spectrum of ion implantation.
The plates were either ion bombarded by high energy (MeV) particle ions
in Van de Graaff or in a medium range of energy (keV) by N+ ion in an
185
ion separator or lower energy state (volts) by DC Plasma N+ ions.
Unfortunately, none of the samples which had been ion bombarded caused
any attachment of L. major parasites, regardless of the energy with
which the ion had been implanted.
The most laborious part of this research was the work on medium energy
and particle implantation. Many of the samples were often
contaminated, due to the limitations on sterilizing and cleanliness
possible and the conditions in which the samples could be cared for.
During the course work of DC Plasma Ion in low energies, the surface of
the polystyrene petri dish had a change in colour in the place where it
was subjected to ion implantation probably due to carbonisation
beginning. This had no effect on the cultured cells. Therefore, an
ion implantation will not have any effect on attachment of parasites to
the implanted substrate, regardless of ion energy state.
This result however, confirms the idea that (L. major) parasites carry a
positive charge and they will be repelled by a similar charge (in this
case, the + ion implanted surfaces) but they will be attracted by a
dissimilar charge (-ve electron bombarded surface) to which they will
attach and grow.
9.5 Effect of lonisers on Leishmania cells
It has been ascertained that ionisers will help people to feel in 'top
form'; or that ionisers help to relieve specific complaints such as
hayfever, bronchitis, asthma, migraine, headaches and sinus infections.
And they are also supposed to clean the air. The idea has been put

186
about that air with lots of negative ions makes a person feel better
than air with low levels of ions. Areas such as mountains, the seaside
and near waterfalls, have a particularly high concentration of natural
occurring ions with the balance tipped in favour of negative ions.
These tend to be popularly associated with a feeling of well-being.
Equally, many hot, dry winds, like the Sahara in the Middle East and
the Fohn in the Alps, are also associated with particularly high
concentrations of ions, but in these cases the balance is tipped in
favour of positive ions, and these winds have a popular reputation for
causing sickness, irritability and erratic behaviour in some people.
Although ions are a very small component in the air, it has been proved
that they can have an effect on living things. Evidence for this comes
from experiments on bacteria and laboratory animals. This section
reports preliminary work looking into any possible effect of air ions
on (L. major) parasites. It had already been proven that negatively
charged plates resulted in the attachment of Leishmania cells to the
charged surface of the plate and gave rise to faster growth of the
cells. Exactly what effect, if any, air ions can have on Leishmania
cells forms the subject of this section of the chapter.
Pro"o aIs
If some negative ions are good for humans perhaps they are also good,
or have an effect, on L. major parasites.
The ioniser used in this research was the one designed and built as
described in Chapter (5). The basic principle of this ioniser is the
same as the other ionisers, a high voltage is applied to a needle sharp
point of fine wire; this wire is placed inside a polystyrene petri

187
dish, pointing downwards, just above the surface of liquid medium with
Leishmania cells suspended in it. The wire needed to be sterilized by
heating, however, it still often caused contamination of the medium
possibly because it attracted contaminants from the air. This wire
generated a high concentration of positive and negative ions in a small
area above the surface of the medium around the point, the negative.
The Polarity ioniser needle is such that it attracts the positive ions
and repels the negative ions in the small volume around the point and
into the cell suspension (because the needle has negative applied
potential). Although the voltage is high, there is no risk of an
electric shock if the needle is touched, but ,_
there might be a
static discharge similar to that obtained by shuffling across a
synthetic carpet and then touching a metal object.
Some twenty plates have been tested for 48 hour exposures on the theory
that lots of negative cells could have an effect on Leishmania cells.
The test was negative in all cases and there was not a single piece of
evidence that the ions gave rise to any abnormalities in the cells or
an increase in the number of cells, except for a few contaminations
which were due to the wire not being properly sterilized. Overall,
ionisers can help to clean the air, but they had no beneficial effect
on Leishmania cells. A lot more research is necessary before we shall
know for certain whether ions have an effect on biological cells as
distinct from organisms and, if so, how they work. But this research
reports that the Leishmania cell cultures do not benefit from ionisers
and there are no attachments of L. major cells to the surface of
polystyrene petri dishes in the presence of an air ioniser.

C"'I'arze L-i Is tr i L, 7: 1 _-, n
I r, it prats C' rl iI repor ted that 1ýhe eie, -- tror-IS may be
thermaiizeci ana trappe'j in P'ý'i'ystvrerle. This ý-rcjecr_ usea an teiectron
beam t, - inject --iectrons
into the free surf3ce of ap Cý I %? M, -- 1, . _)nce
these eie, - tr:, ns J is Si paLe- a -! I . heir ez--nergv in their t3rge-r material .
the surface l. poivsvirenel carries a-ve charge. The -ha rge was
C? CaiIS ecý I F, trie -entre '_-- I tne ý'etr i jish where iL was L, 'Mtýarded
thrc, ugr, a mask but cýnce the suspensic-n of cells was pourea into the
Petri dis hes tne -harge may tend tr_, spread zz, ver the whole surface -, f
ýhe suspensic, n. shows the sort c, f ; -eii adhesicP wh i! - h may
ur -Tice t ne r, --:, r ýý e- is spread aii v e- r ; -Ie Eurf ac- 2f -E he
polystyrene.
T7 oar-asites na,, - neen 1L STrer, e
suitfnega T- ar2etr on -ver tarzec.
189
9.7 U. V. Sterlization Effect
When these petri dishes were bombarded by electrons and subsequently
sterilized by shining T. U. V. light directly over the polystyrene
surface. Unfortunately, this T. U. V. light always dissipated the
negative charge and there was no parasite attachment at all in any
electron dose range. Therefore, the plates could not be placed under
the T. U. V. light for sterilization and each step of the experiment had
to be done very carefully, and always wearing plastic gloves. This
reduced the contamination risk to an acceptable level and the effect of
electron bombardment could be easily seen. This drastic effect of the
T. U. V. is probably due to the release of the trapped electrons and the
increased conduction of the polystyrene.
It is also found to be advisable to place and keep the electron
bombarded petri dish in dry air , apparatus is a glass desiccator over
silica gel and to carry the samples about while still in a desiccator.
9.8 Advantages of 'In Vitro' Attachment
One advantage of an 'In Vitro' attachment system for culturing L. major
parasites is that it allows a detailed study of the mechanism of
attachment. The ultrastructure of attachment "foot" is remarkably
similar for both "in vitro" and "in vivo" culturing (121. Large
numbers of parasites can be obtained and cultured and more readily
studied in vitro, than when cultured in live insect hosts.
There are already some commercial culture plates available with a
microporous membrane surface for cell attachment. (Appendix (5)).
However, the attachment of Leishmania cells may easily be oberved when
the plates are scored with an electron beam in the right dose range.
190
The writer points out to those working on the culture of Leishmania
parasites that large numbers of flasks, dishes, culture dishes and
roller bottles may be "scored" or bombarded with electron beams to
improve cell growth at little expense given the basic apparatus.
9.9 Discussion
During investigation of cases of the attachment of Leishmania
promastigotes to scratches made in polystyrene petri dishes, it was
found that scratches made both with a metal stylus and with a diamond
were equally effective, thus eliminating the possibility of surface
contamination with metal and consequent chemical or ionic effects.
Polystyrene is a very good electrical insulator having a nominal
resistivity of JOA 14 ohms-m, the possibility that the attachment effects
were due to surface charging by friction when the polystyrene was
scratched, was considered. Surface charging of the polystyrene,
without gross mechanical damage as described and the resulting enhanced
attachment of the L. major is the subject of this section.
By way of a preliminary estimate, the surface density of electron
charge which was deposited into the top 114M of the polystyrene surface
and which gave attachment effects in all cases, was from 7.6 x JOA 19
electrons /MA 2 to 1.5 x
JOA 21 electrons/m^2. This is greater than the
surface charge density of 5x JOA 15
electrons /MA 2 which will give the
typical trans-membrane potential used for an electrical model of a
biological cell [131, although the depth profiles of the charge
distributions will be different in the two cases.
Clearly, the Leishmania cells have decided that the electron charged
surface is a good place to stick; presumably in some important

191
respect, it simulates their normal habitat on cuticular surfaces in the
gut of their sandfly host. However, one is reluctant to suggest a
purely electrostatic explanation because of the likely screening
effects of counterions, even if the parasite's vibrating flagellum
could act as a vibrating probe electrometer. The provision of the
promastigotes with a flagellum is more reminiscent of the possible role
of insect antennae as infrared detectors, as discussed by Callahan
(141. Furthermore, Frohlich predicts coherent electrical oscillations
in living biological systems and estimates that they may occur in the
sub-millimetre part of the electromagnetic spectrum [151. It should be
realised that although water absorbs electromagnetic radiation strongly
from the microwave to the infrared, the absorption is not infinite; the
half-value-layer absorption in this region is of the same order as the
dimensions of a biological cell [131.
REFERENCES
STOKER, M. G. P., O'NEILL, G., BERRYMAN, S. and WAXMAN, V. Int. J. Cancer, 1968,3, p. 683.
2) GRINNELL, F. "Cellular Adhesiveness and Extracellular Substrata", Int. Rev. Cytology, 1978,53, p. 65.
3) KLEMPERRE, H. G. and KNOX, P. "Attachment and Growth of BHK and Liver Cells on Polystyrene: Effect of Surface Groups Introduced by Treatment With Chromic Acid", Lab. Pract., 1977,26, p. 179.
4) AMSTEIN, C F. and HARTMAN, P. A. "Adaptation on Plastic Surface For Tissue Culture by Glow Discharge", J. Clin. Microbiol., 1975,
_2. p. 46.
5) MARTIN, G. R., and RUNNIN, H. "Effect of Cell Adhesion to the Substratum on the Growth of Chich Embryo Fribroblasts", Exp. Cel. Res., 1974, 85, p. 319.
6) MAROUDAS, N. G. "Sulphonated Polystyrene As An Optical Substratum for the Adhesion and Spreading of Mesenchymal Cells In Monvalent and Divalent Saline Solutions", J. Cell Physiol., 1977,9-0, p. 511.
7) CURTIS, A. S. G. "Cell Adhesion", Prog. Biophys. Mol. Biol., 1973,27, p. 317.
8) GINGELL, D. and TODD, I. "Red Blood Cell Adhesion, II. Interferometric Examination of the Internation with Hydrocarbon Oil and Glass", J. Cell. Sci., 1980,41, p. 135.
9) WEISS, L. and SUBJECK, J. R. J Cell Sci., 1974,14, p. 215.
10) PERRONE, J. B., DE MAIC, I. and SPIELMAN, A. "Regions of Mosquito Salivary Glands Distinguished by Surface Lectin-binding Characteristics, Insect Biochem., 1986,16, p. 313-318.
11) WATSON, P. K. "The Thermalization and Trapping of Electrons", IEEE, Transactions on Electrical Insulation, 1987, El-22(2), p. 129.
12) MOLYNEUX, D. H., WALLBANK, K. R. and INGRAM, G. A. "Trypanosomatid-vector interfaces - In-vitro studies on parasite substrate interactions", NATO ASI Series, Vol. H11,1987, p. 387
13) SMITH, C. W. "High Sensitivity Biosensors and Weak Environmental Stimuli", Industrial Biotechnology, Wales, 1986,
-6. 13) CALLAHAN, P. S.
1977. .1
14) FROHLICH, H. Questions". P. 85.
"Tuning in to Nature", London: Routledge & Kegan Paul,
"The Biological Effect of Microwaves and Related Advances in Electronics & Electron Physics, 1980,53.

CHAPTER (10)
THE EFFECTS OF MAGNETIC FIELDS
ON WATER AND ICE FORMATION

1192
10.1 INTRODUCTION,
Water is both vital and fundamental for all living organisms in order
for them to live, reproduce, and evolve. The existence of water has
not been discovered anywhere other than on earth, and over 80% of any
individual cell consists of water. In fact, water is the probably
source for all living things and some researchers into water are now
giving priority to the possibility that water may be the solution to
many medical problems.
Jhon (11 discýsses the most important sources for the cause of human
cancers. It appears that less than 5% have a physical origin, such as
radiation damage etc., that less than 5% are caused by external
viruses, and that more than 90% may come from our environment, and this
includes our water. His research reports that an attempt to overcome
the AIDS disease must maintain or promote the body's immune potential,
this might be done by changing the water environment. On the other
hand, shortages of vitamin C or mineral ions also bring about a
decrease of the immune powers in which the role of water is, again,
important. In an experiment concerning the examination of the effects
of "healers" on water described by Fenwick et al [21, all the healers
co-operating in the experiment and "healed" the samples of water as
they were directed. They said that they felt that the healing had been
successful and they expected a change in the water.
Hayashi [31 states that the role of water in cells or tissues is a key
mechanism for every disease, and changes in the properties of water in
the organs could be a mark of the beginning of disease. However, these
changes are considered to be inducers, or triggers of disease rather
than origins or causes.

193
Pohl (4] has shown the presence of the small A. C. electric fields
produced by living cells. There are also reports by Frohlich [51 about
the effects of electric and magnetic fields on biological systems which
are of course "wet". An article by Smith et al entitled "Water: Friend
or Foe? " (61 noted that when materials are wet, or have absorbed
moisture, they have different electric and magnetic properties.
There are also further reports by Smith and co-workers [7] indicating
that water may have different dielectric properties when exposed to
alternating magnetic fields. They report [81 that drinking water can
cause a problem for many multiple-allergy patients. Some patients can
only tolerate bottled spring water, triple distilled water, or water as
fruit juice. In some cases even bottled spring water needs to be
buried in the garden for a few days before it can be tolerated.
Because of the body's great need for a regular supply of water, water
intolerance becomes a severe and acute survival problem. These
important observations give us an opportunity to develop this study and
to investigate the possible effect of magnetic fields (A. C. and D. C. )
on the different states of water.
10.2 Experiments on ice formation
- Initially, water was frozen into ice cubes with one electrode on each
vertical side of the cube. There were 4 electrodes made of aluminium
foil and each electrode had an area of 4 sq. cm. They were arranged
vertically on opposite sides of the dish used to freeze the water
giving two parallel pairs of electrodes. Once the electrodes were
prepared and arranged, they were placed inside the dish touching the
sides. The dish was then filled with double distilled water. It is
most important to fill the dish very slowly, preferably by using a

194
pipette, otherwise the "electrodes could float away from the sides of
the dish. The sample was then placed inside the centre of a prepared
solenoid. The solenoid was made of 22 SWG copper wire wound to give
220 turns around an insulated cylinder of diameter of 10 cm and a
length of 30 cm. The dish was placed in the centre of the solenoid, so
that the resulting magnetic field was perpendicular to one pair of the
aluminium foil electrodes and parallel to the other pair. The whole
assembly was placed inside a freezer. A sinusoidal waveform was
supplied by a signal generator (General Radio type), which drove the
coil directly through two wires, trapped in the freezer door seal. The
oscillator was switched on for 24 hours at a voltage of 3 volts and set
to a frequency of 15 kHz. The freezer temperature was kept constant at
-20" C. The water and the resulting ice cube was exposed to a magnetic
field for 24 hours and then the capacitance and loss for different
frequencies was measured whilst still leaving the sample in the
freezer, the oscillator having been switched off. Capacitance and loss
were measured by an impedance bridge (General Radio) around the
radiated frequency of the sinusoidal waveform (14-16 kHz). This
measurement was repeated for a few experiments for both parallel and
perpendicular arrangements of the electrodes, to the axis of the
applied magnetic field. Graphs (10.1)-(10.4) show examples of the
results obtained when loss and capacitance were measured for these
electrodes.
Obviously, any effect of magnetic field should be at, or very near to,
the radiation magnetic frequency (15 kHz in this case). Unfortunately
none of these results gave any clear effect. Therefore, this had to be
regarded as a negative result. If there was any effect it was much too
small to detect and hence, the experimental method should be made to a

195
CAPACITANCE (Pico-Farad)
Cil
0- 0 0
Ul 0 0
-n 3D M C) C-- m Ul z
0
N
Ul C31 0 0
CY) 0 0 0
I I I L I I I
CY)
Ul
'I -
(D
I -T--T
/ ±1
G-)
r
(D
FT1
n
0 ci (D (f)
(D
-0 0) 1
0)
(D ý--i
r-t- 0
(D
ci
CT) -j --Ij CD
L)i 0
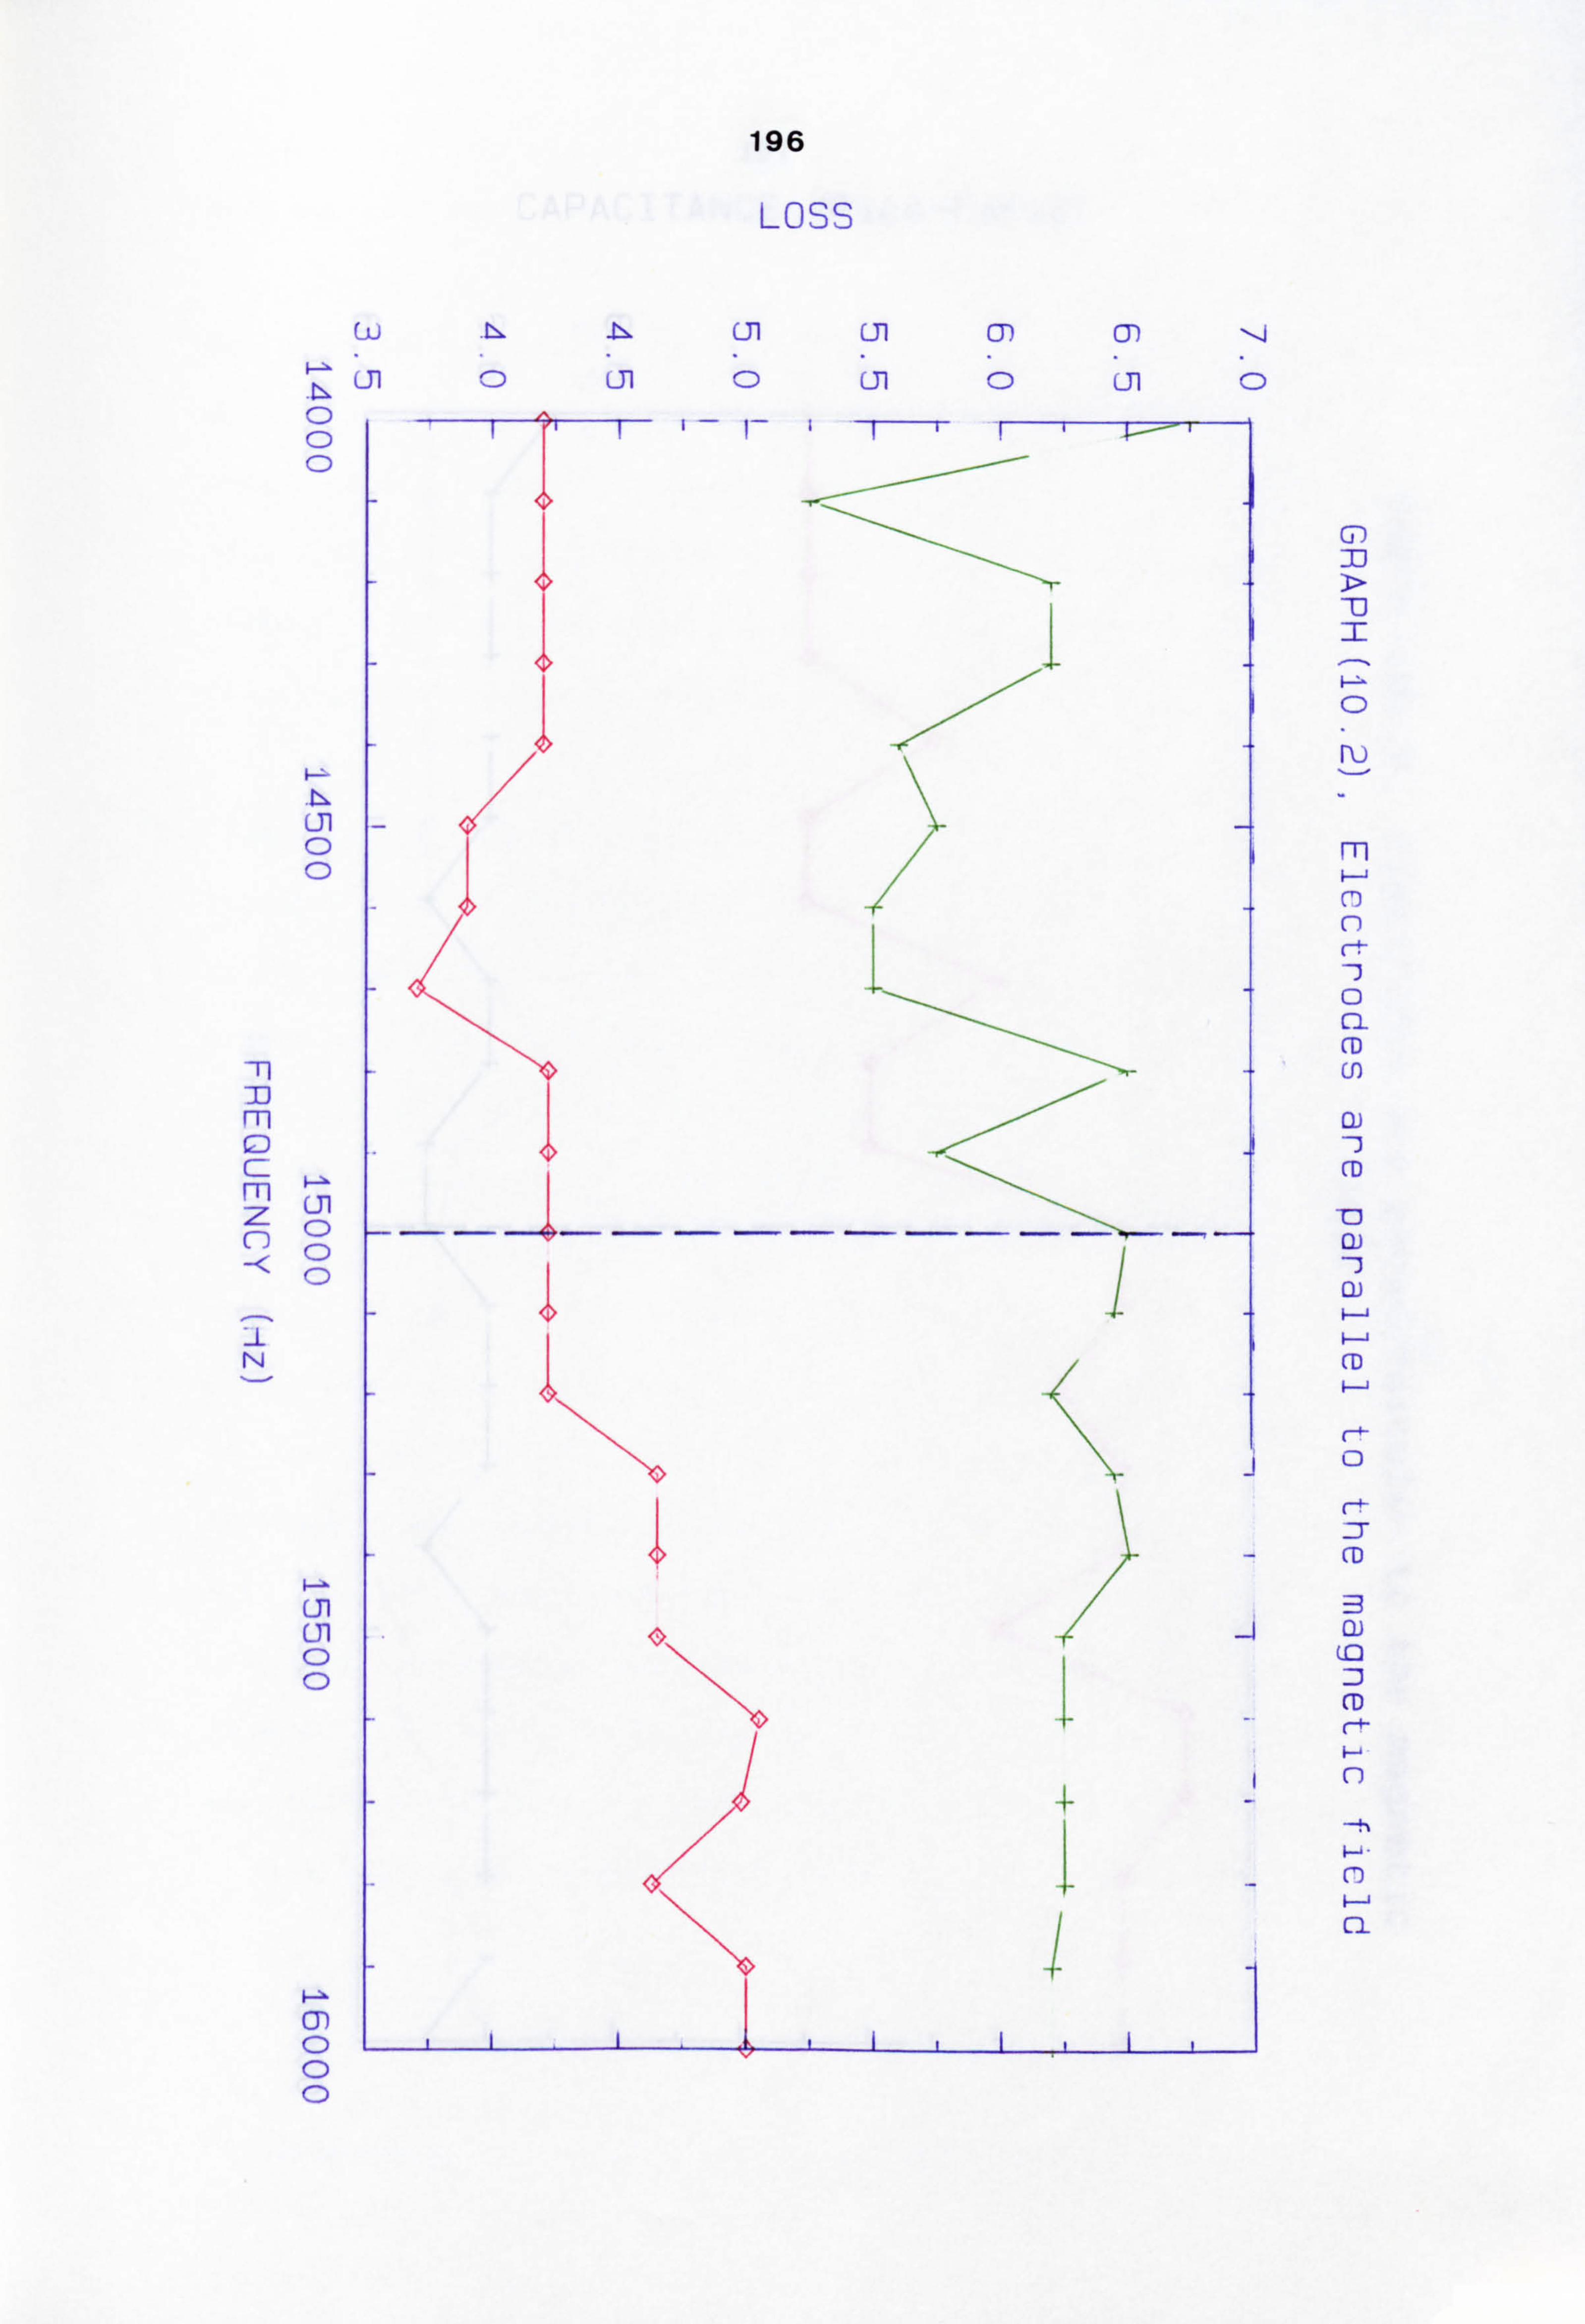
196
LOSS
C-0
0 0 0
01 0 0
71 ID m
m Ol z0 C-)
T
Lii C-11 0 0
0 0 0
-D I
I' 0
ru
71
0 ci CD CO
CI) --3 (D
r-+- 0
(D
H3 Di
co
CD
n
cl
Lii 0
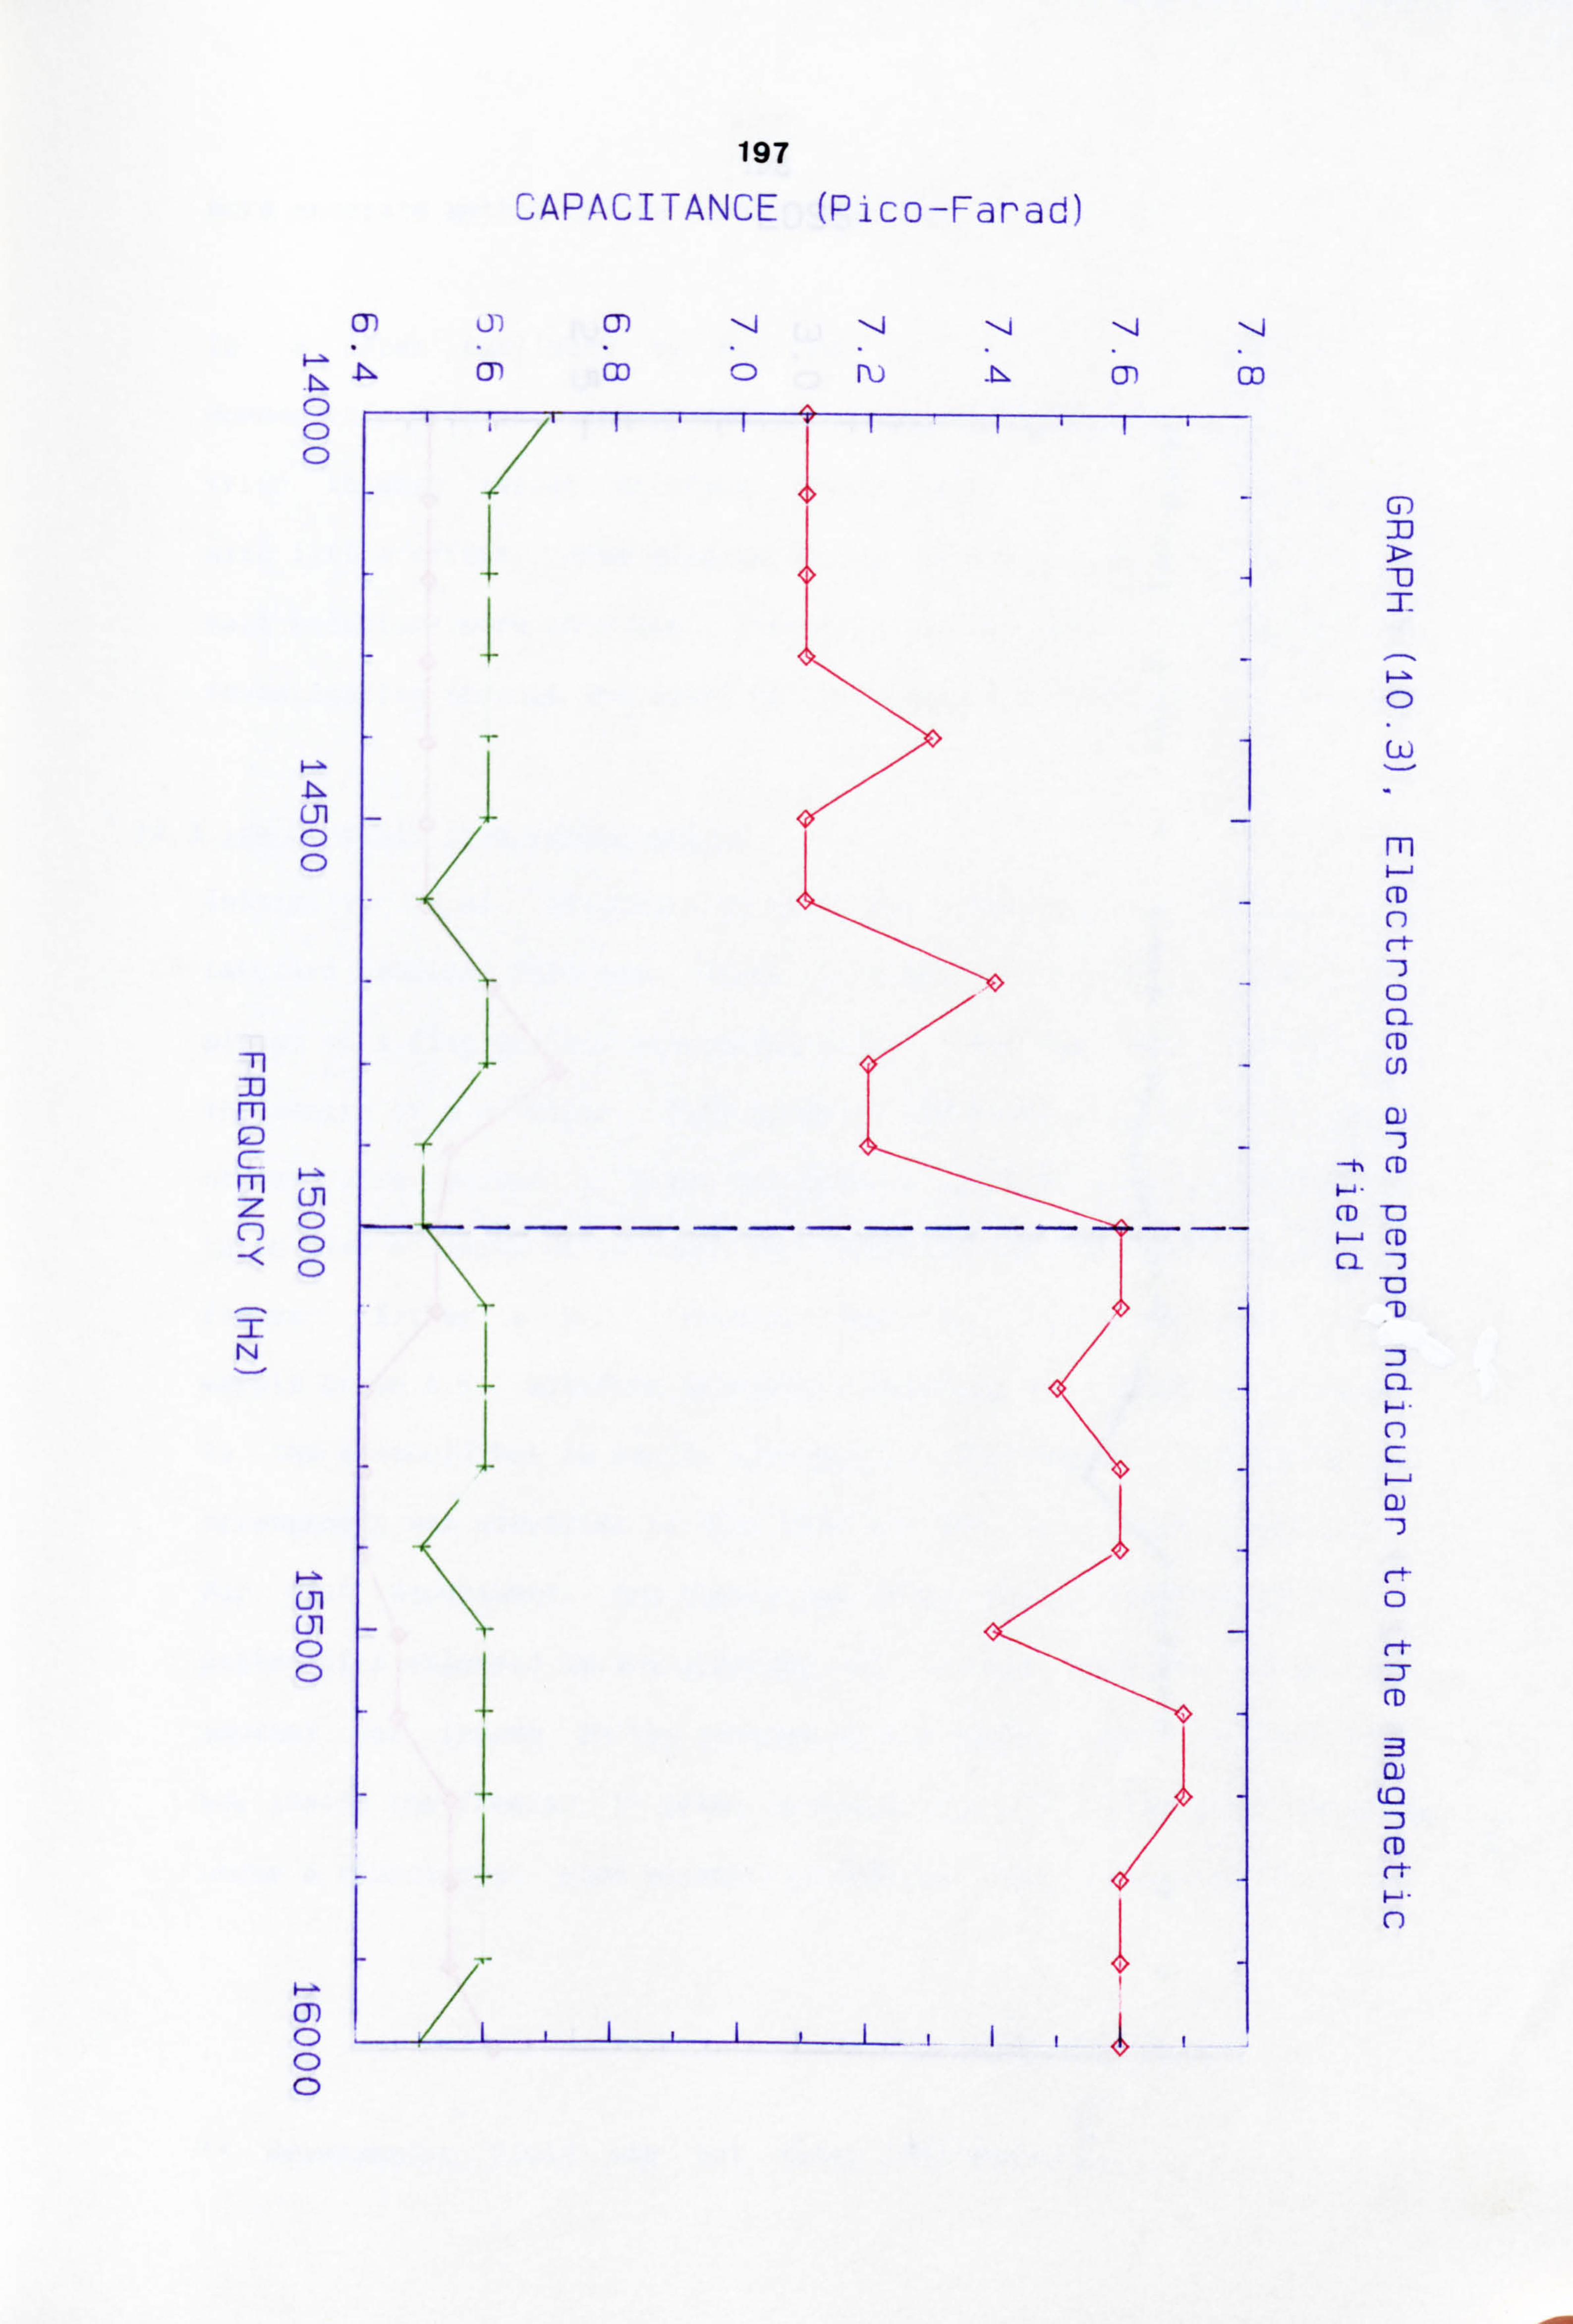
197 CAPACITANCE (Pico-Farad)
m
0 0 0
Cil 0 0
71 m m 0
Cil 0 0 0
01
III 0. 0 0
I.
Gý DD
, C) ZF
Fri
CD C-)
0 cl CD U)
0) --3 CD
CD -0 CD
'D
:D cl ý-j - n C: Cl)
0
rt :: T CD
B Cl) (0 :3 CD
n
cr Co (D CD

198
LOSS
I)i ru
0- 0 0
L31
JJ
C
I -N 0
m
-n DD m CD r_- m z z C-)
'Hý
Cn 0 0
ý-x Cil 0
0 0
Ul 0 0
m 1---j CD n
0 cl CD (f)
0) --1 CD
Cl) -CD ý- CD cl --3
ID CD :3 cl 1ý- C-) c
C-t- 0
rt- -T CD
3 CD
D CD
n
0 0 0
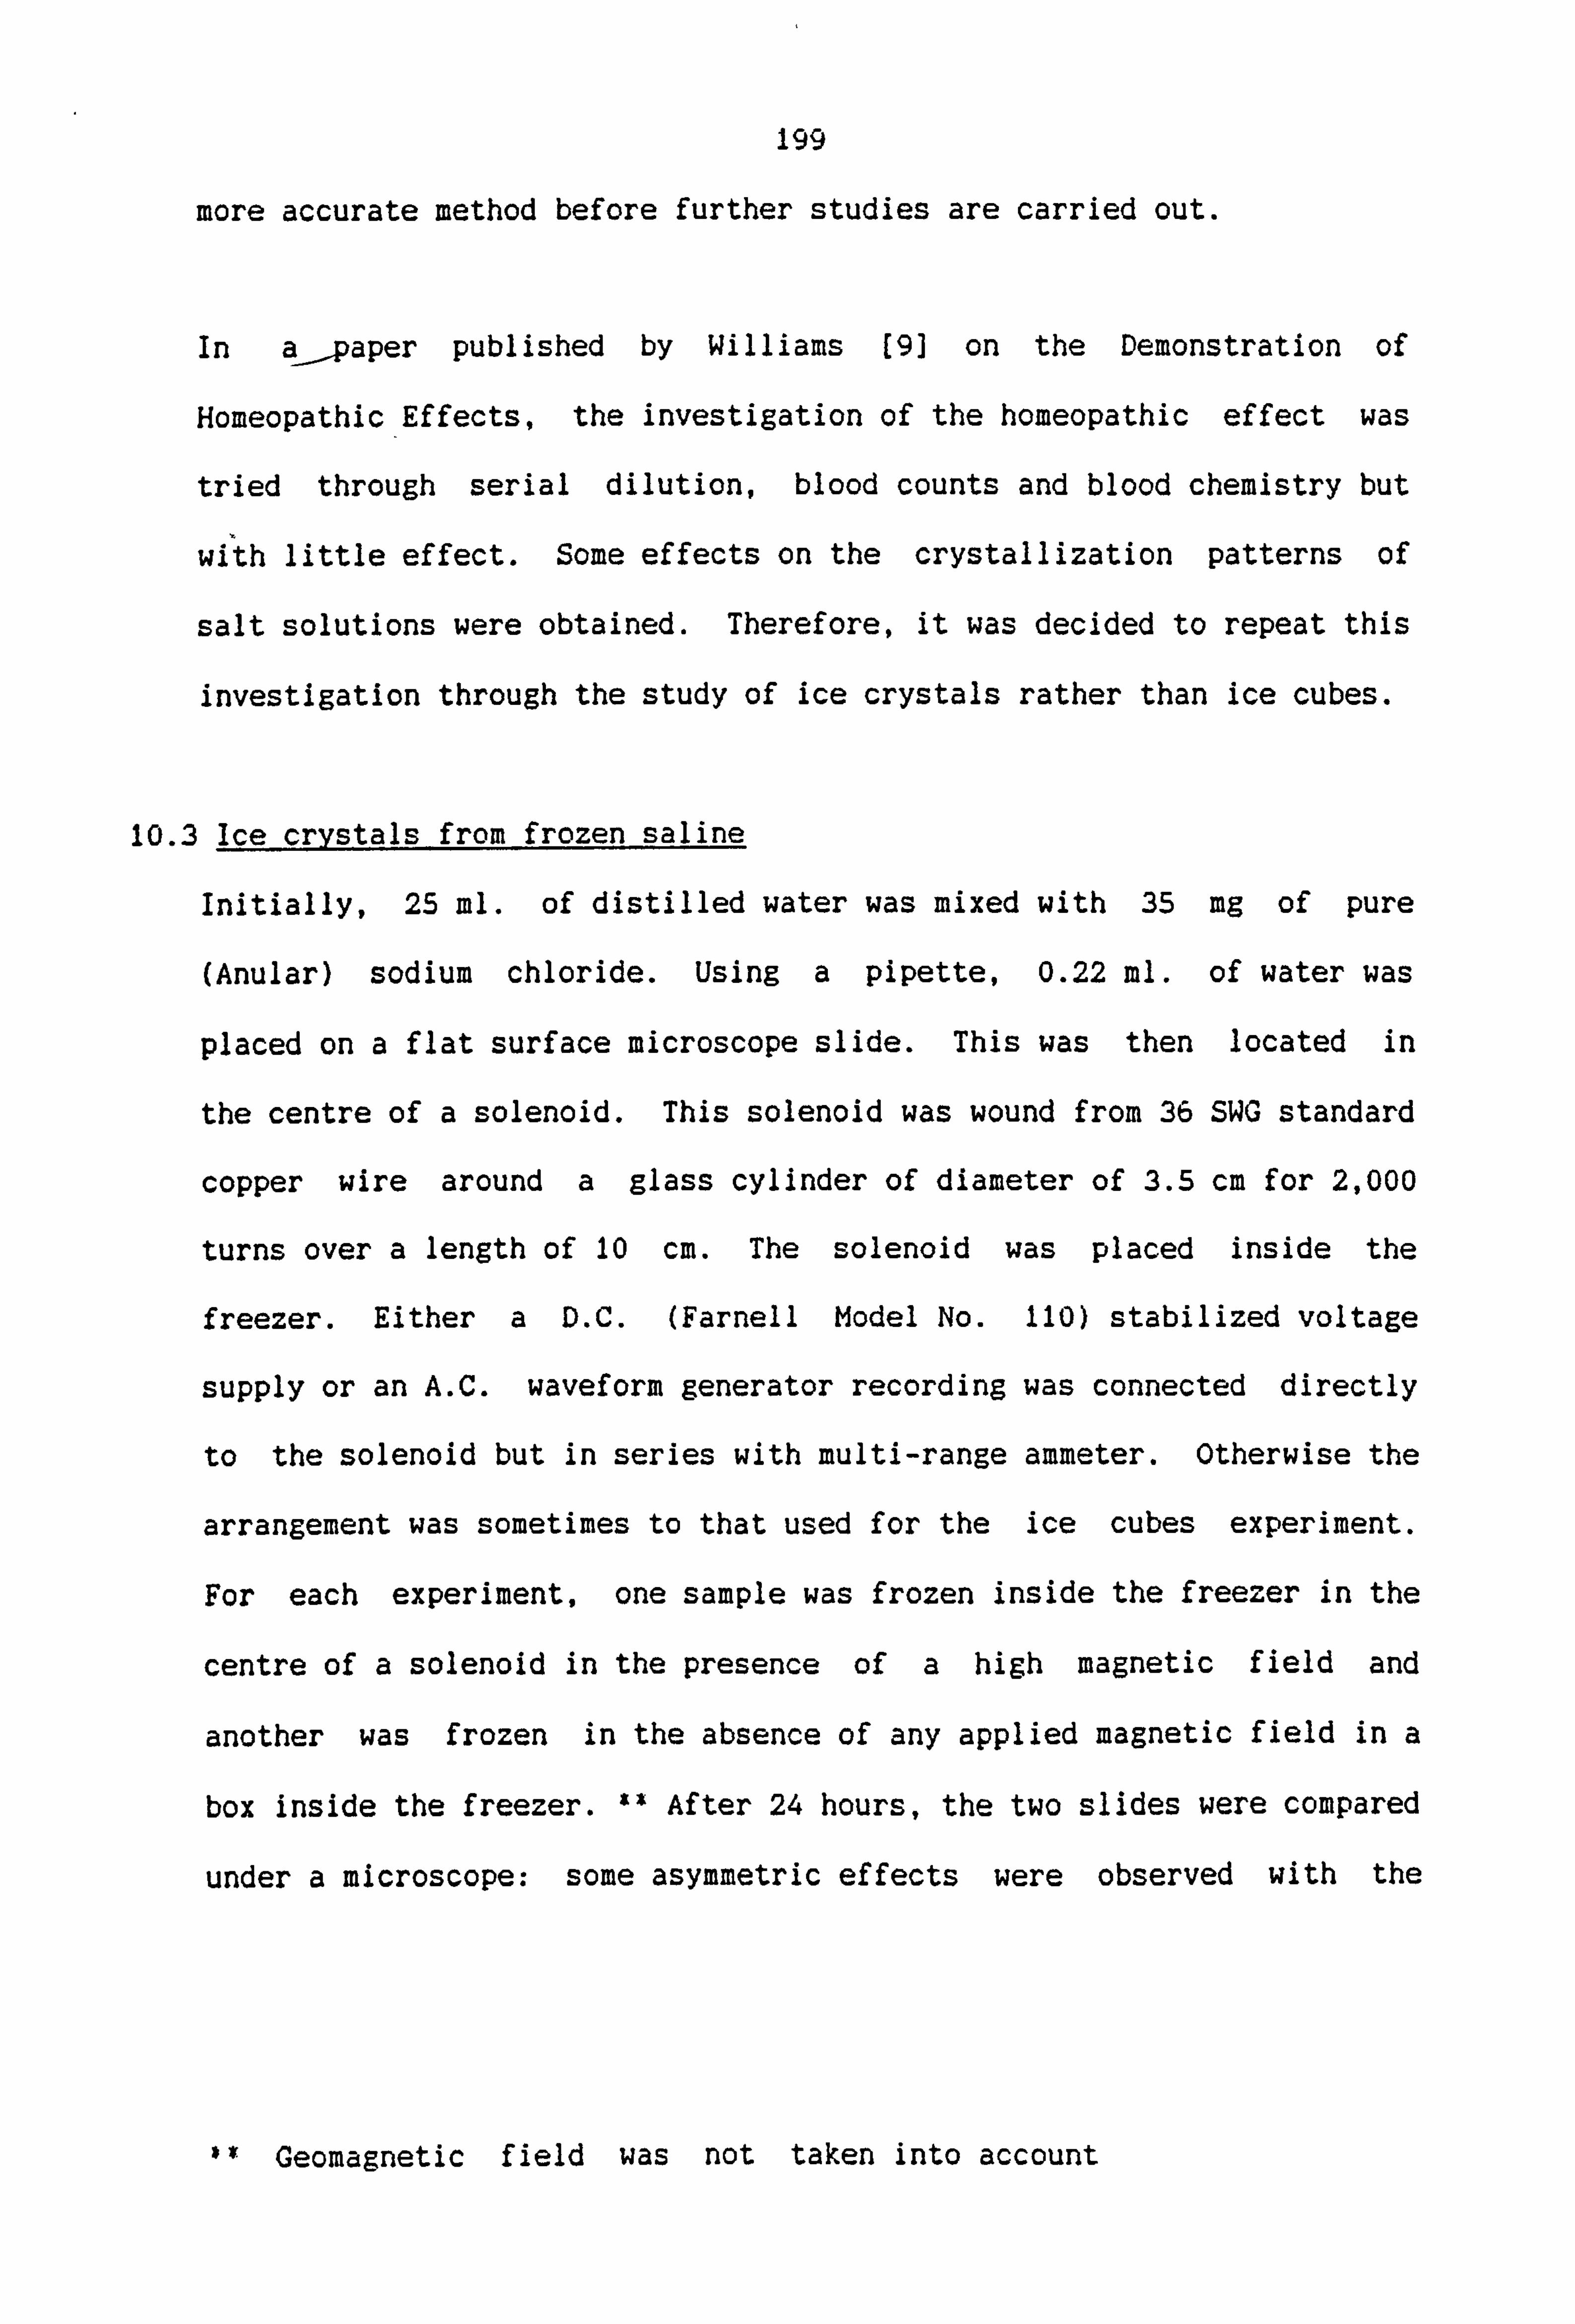
199
more accurate method before further studies are carried out.
In a paper published by Williams [9) on the Demonstration of
Homeopathic-Effects, the investigation of the homeopathic effect was
tried through serial dilution, blood counts and blood chemistry but
with little effect. Some effects on the crystallization patterns of
salt solutions were obtained. Therefore, it was decided to repeat this
investigation through the study of ice crystals rather than ice cubes.
10.3 Ice crystals from frozen saline
Initially, 25 ml. of distilled water was mixed with 35 mg of pure
(Anular) sodium chloride. Using a pipette, 0.22 ml. of water was
placed on a flat surface microscope slide. This was then located in
the centre of a solenoid. This solenoid was wound from 36 SWG standard
copper wire around a glass cylinder of diameter of 3.5 cm for 2,000
turns over a length of 10 cm. The solenoid was placed inside the
freezer. Either a D. C. (Farnell Model No. 110) stabilized voltage
supply or an A. C. waveform generator recording was connected directly
to the solenoid but in series with multi-range ammeter. Otherwise the
arrangement was sometimes to that used for the ice cubes experiment.
For each experiment, one sample was frozen inside the freezer in the
centre of a solenoid in the presence of a high magnetic field and
another was frozen in the absence of any applied magnetic field in a
box inside the freezer. 2* After 24 hours, the two slides were compared
under a microscope: some asymmetric effects were observed with the
$* Geomagnetic field was not taken into account
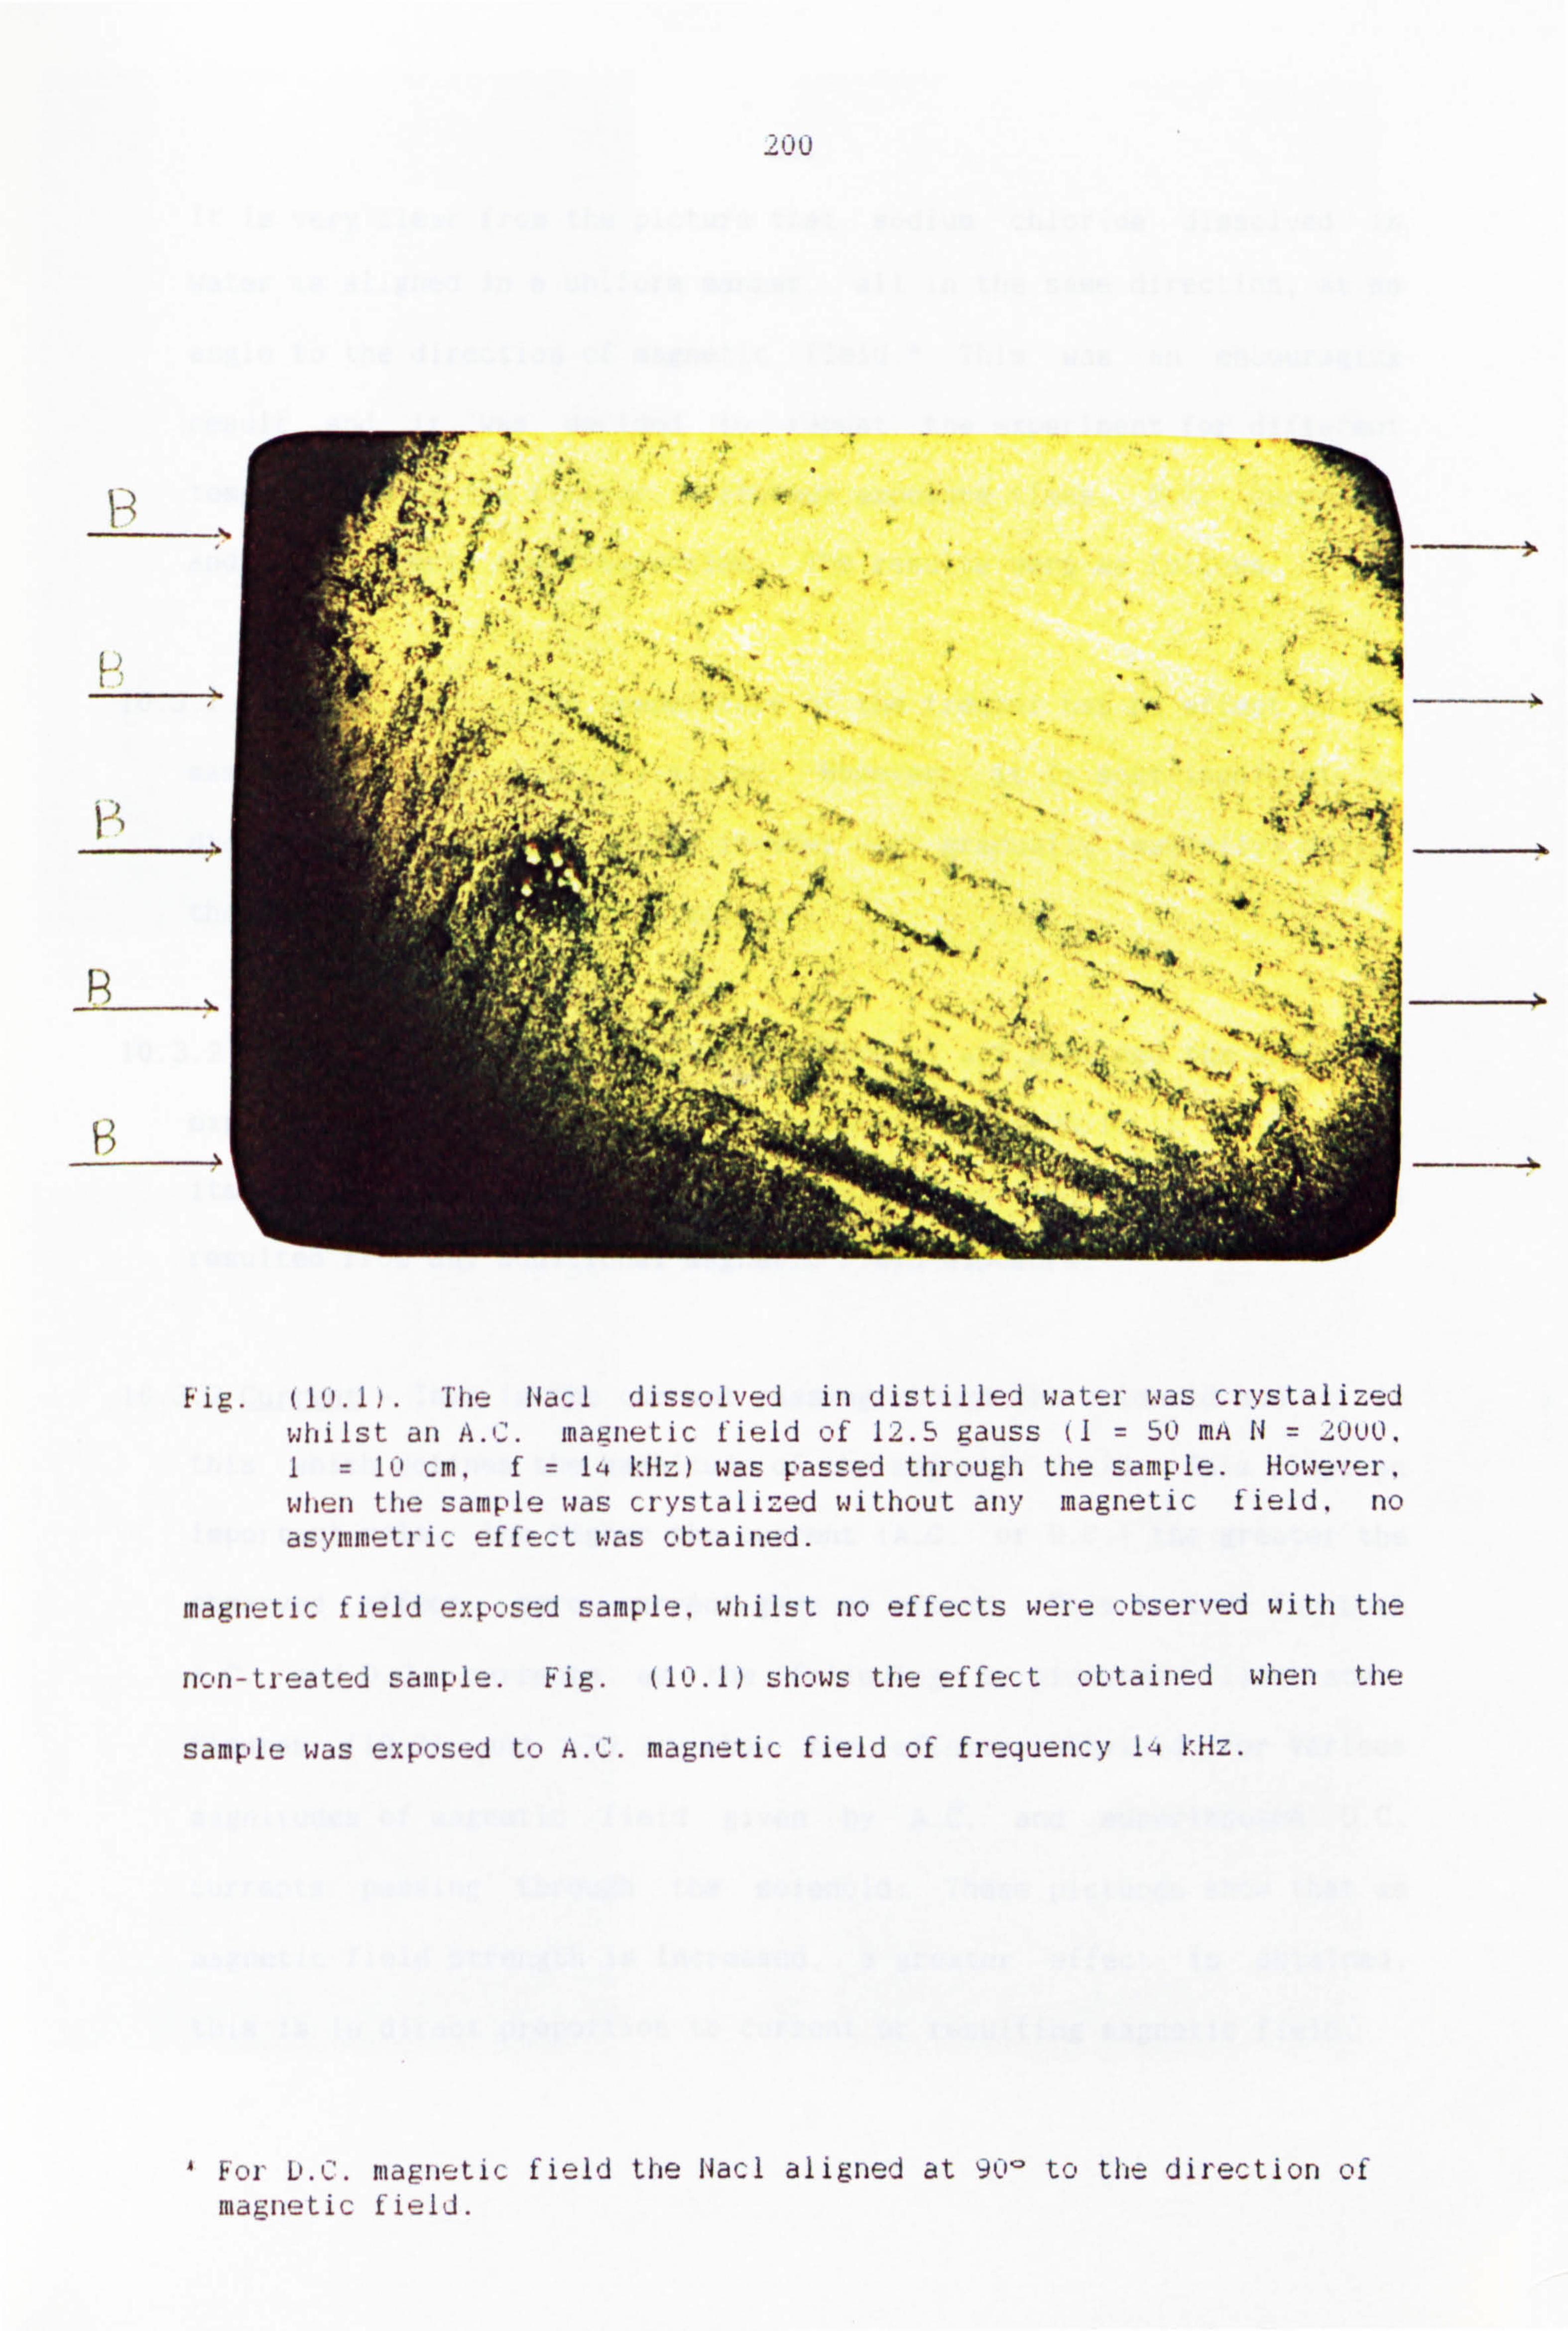
. Z. -
1'
H -,.
7! r ..: '
�. . y.
ft.
-I. e
. "'fi
.
.j.. i. ."
f.
A1; .'
:. L'4 ;.
-
:-i . '"
.-
(I "). I). -I lie 14,1(: l 'i i SEC. I ved in distilled water was crý, stalizej whilst an A. C. magnetic field of 12.5 gauss (I = 50 MA 14 = z"IRIO. I= IC, CM, f= 14 IHZ) was passed through the sample. However, when the sample was crystaliZed without any magnetic f ield. no asymmetric effect was obtained.
magnetic field exposed sample, whilst no effects were Aserved with the
nc-n-ti-eated sain, le. Fig. (10-1) shows the effect Obtained When the
sample was exposed to A. C. magnetic field of frequency 14 kHz.
For D. C. magnetic f ield the 14acl aligned at 90- to the direction of magnetic f i---Id.
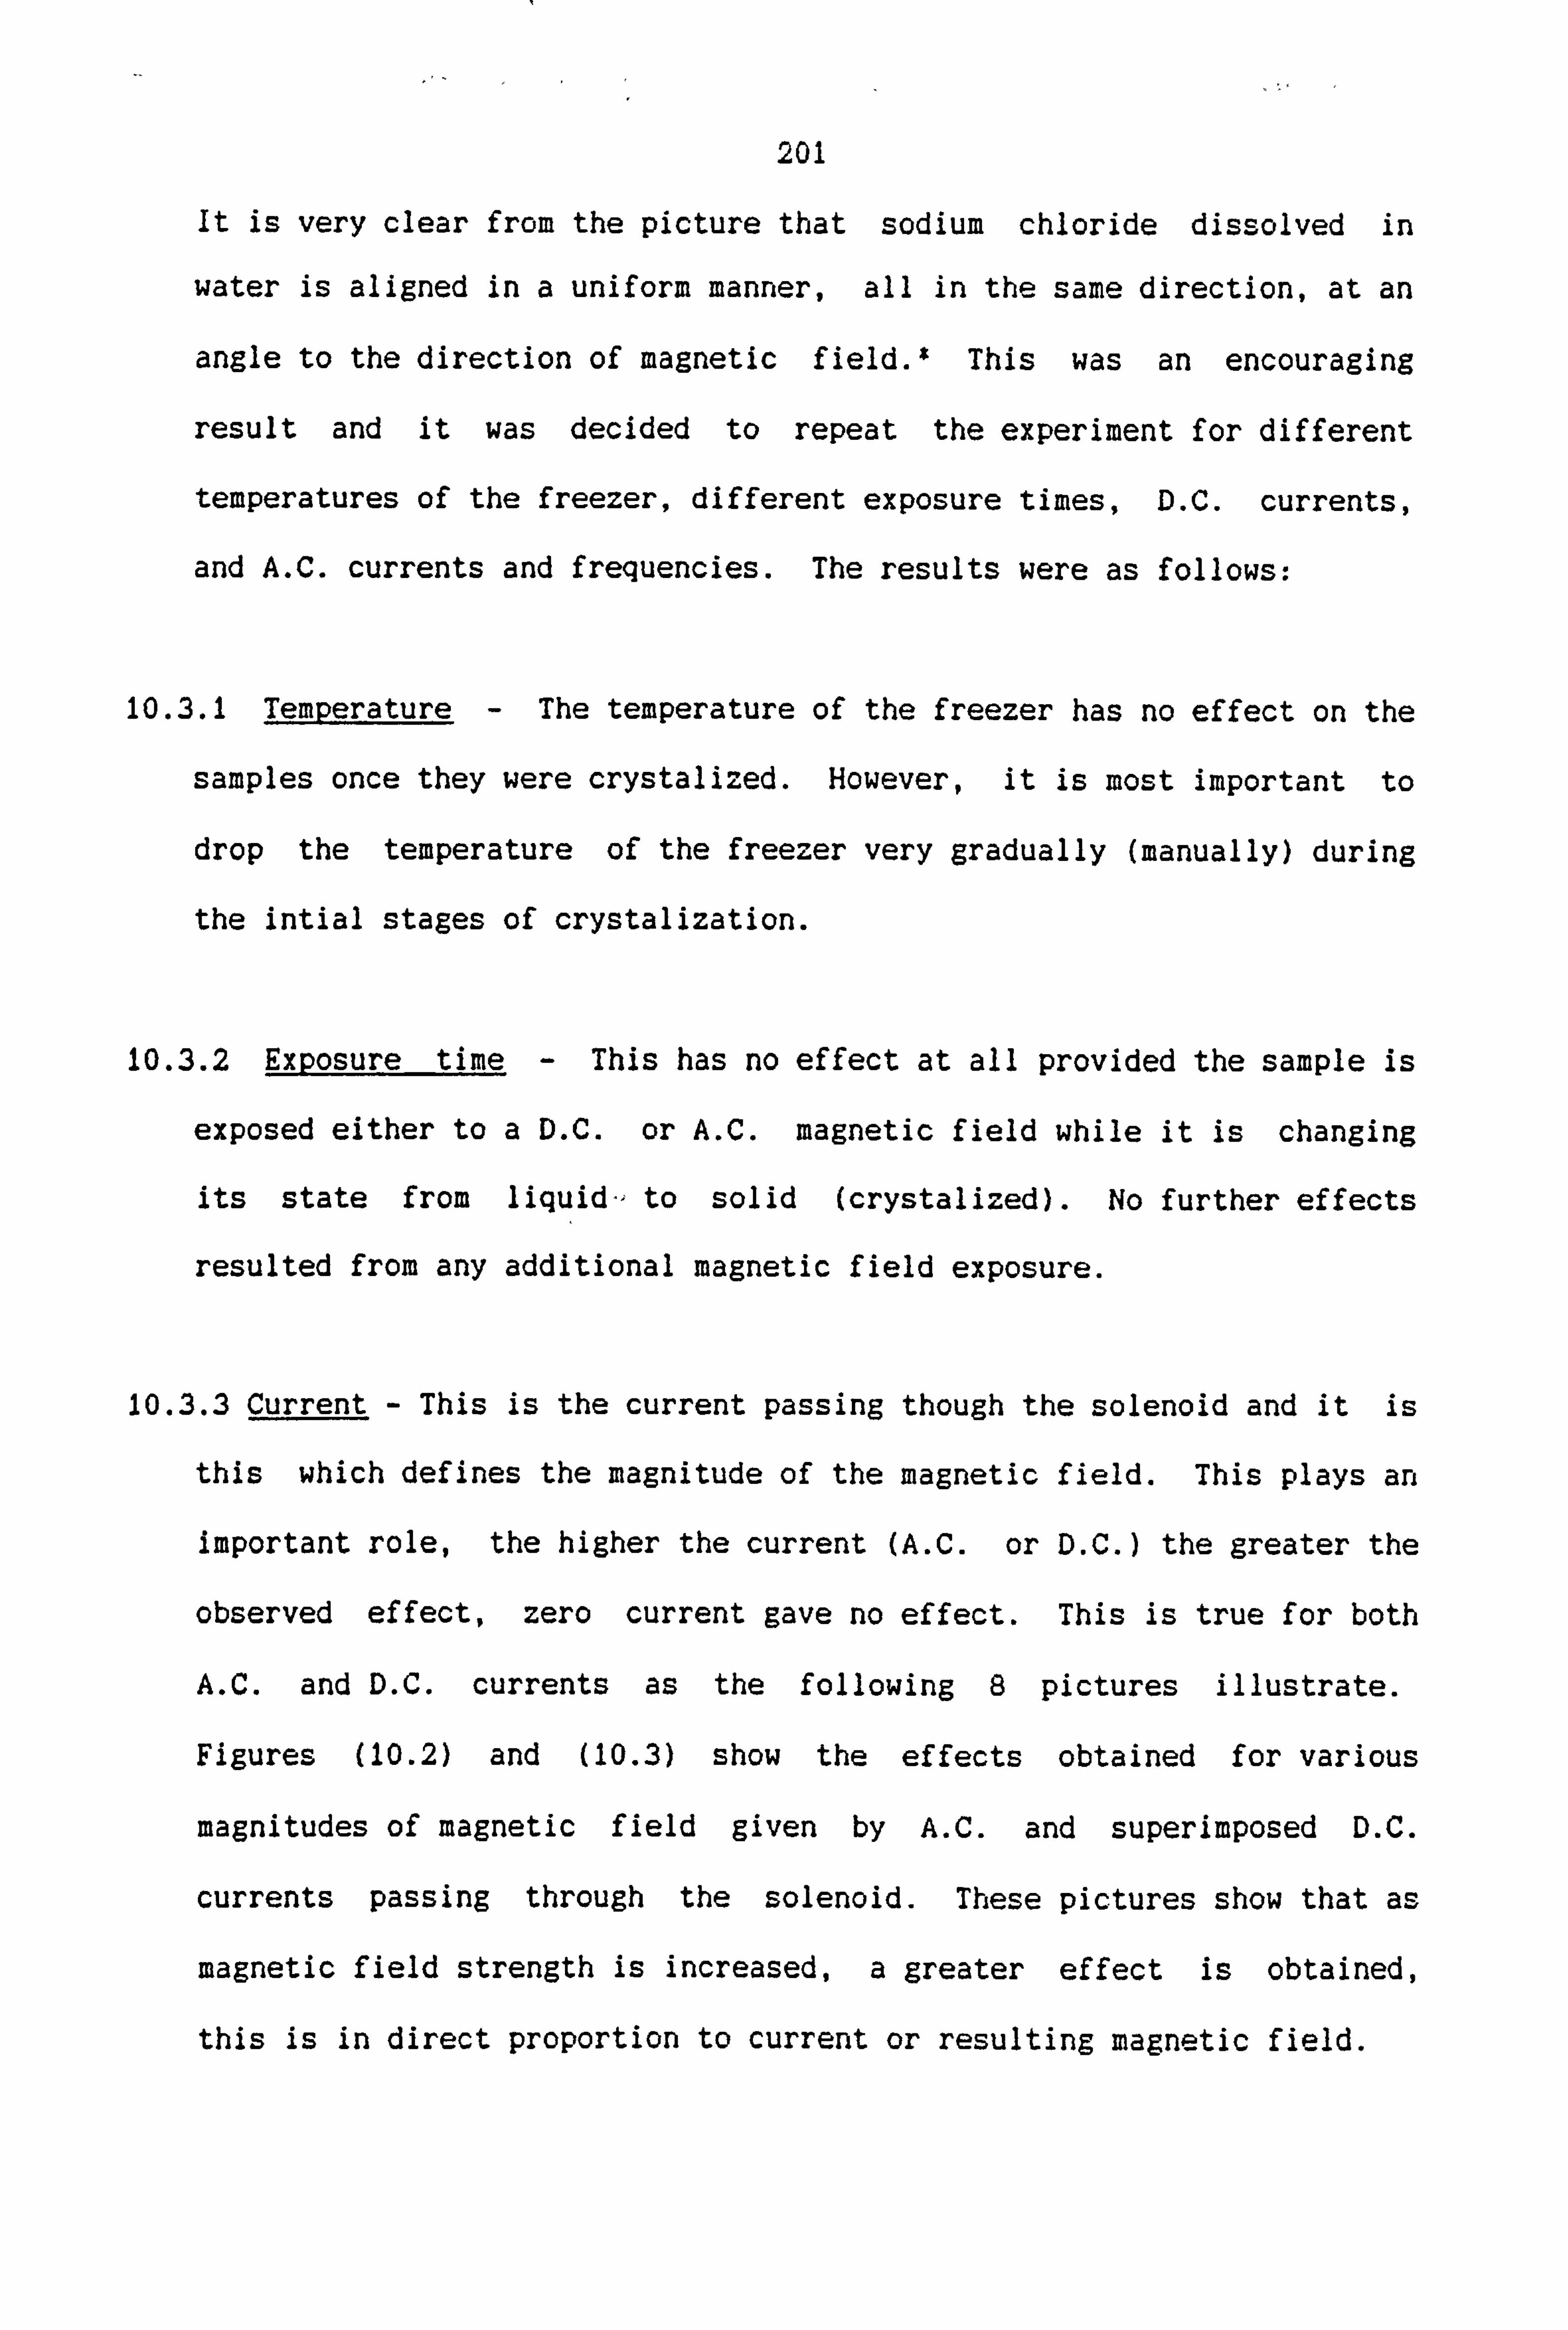
201
It is very clear from the picture that sodium chloride dissolved in
water is aligned in a uniform manner, all in the same direction, at an
angle to the direction of magnetic field. $ This was an encouraging
result and it was decided to repeat the experiment for different
temperatures of the freezer, different exposure times, D. C. currents,
and A. C. currents and frequencies. The results were as follows:
10.3.1 Temperature - The temperature of the freezer has no effect on the
samples once they were crystalized. However, it is most important to
drop the temperature of the freezer very gradually (manually) during
the intial stages of crystalization.
10.3.2 Exposure time - This has no effect at all provided the sample is
exposed either to a D. C. or A. C. magnetic field while it is changing
its state from liquid-, to solid (crystalized). No further effects
resulted from any additional magnetic field exposure.
10.3.3 Current - This is the current passing though the solenoid and it is
this which defines the magnitude of the magnetic field. This plays an
important role, the higher the current (A. C. or D. C. ) the greater the
observed effect, zero current gave no effect. This is true for both
A. C. and D. C. currents as the following 8 pictures illustrate.
Figures (10.2) and (10.3) show the effects obtained for various
magnitudes of magnetic field given by A. C. and superimposed D. C.
currents passing through the solenoid. These pictures show that as
magnetic field strength is increased, a greater effect is obtained,
this is in direct proportion to current or resulting magnetic field.
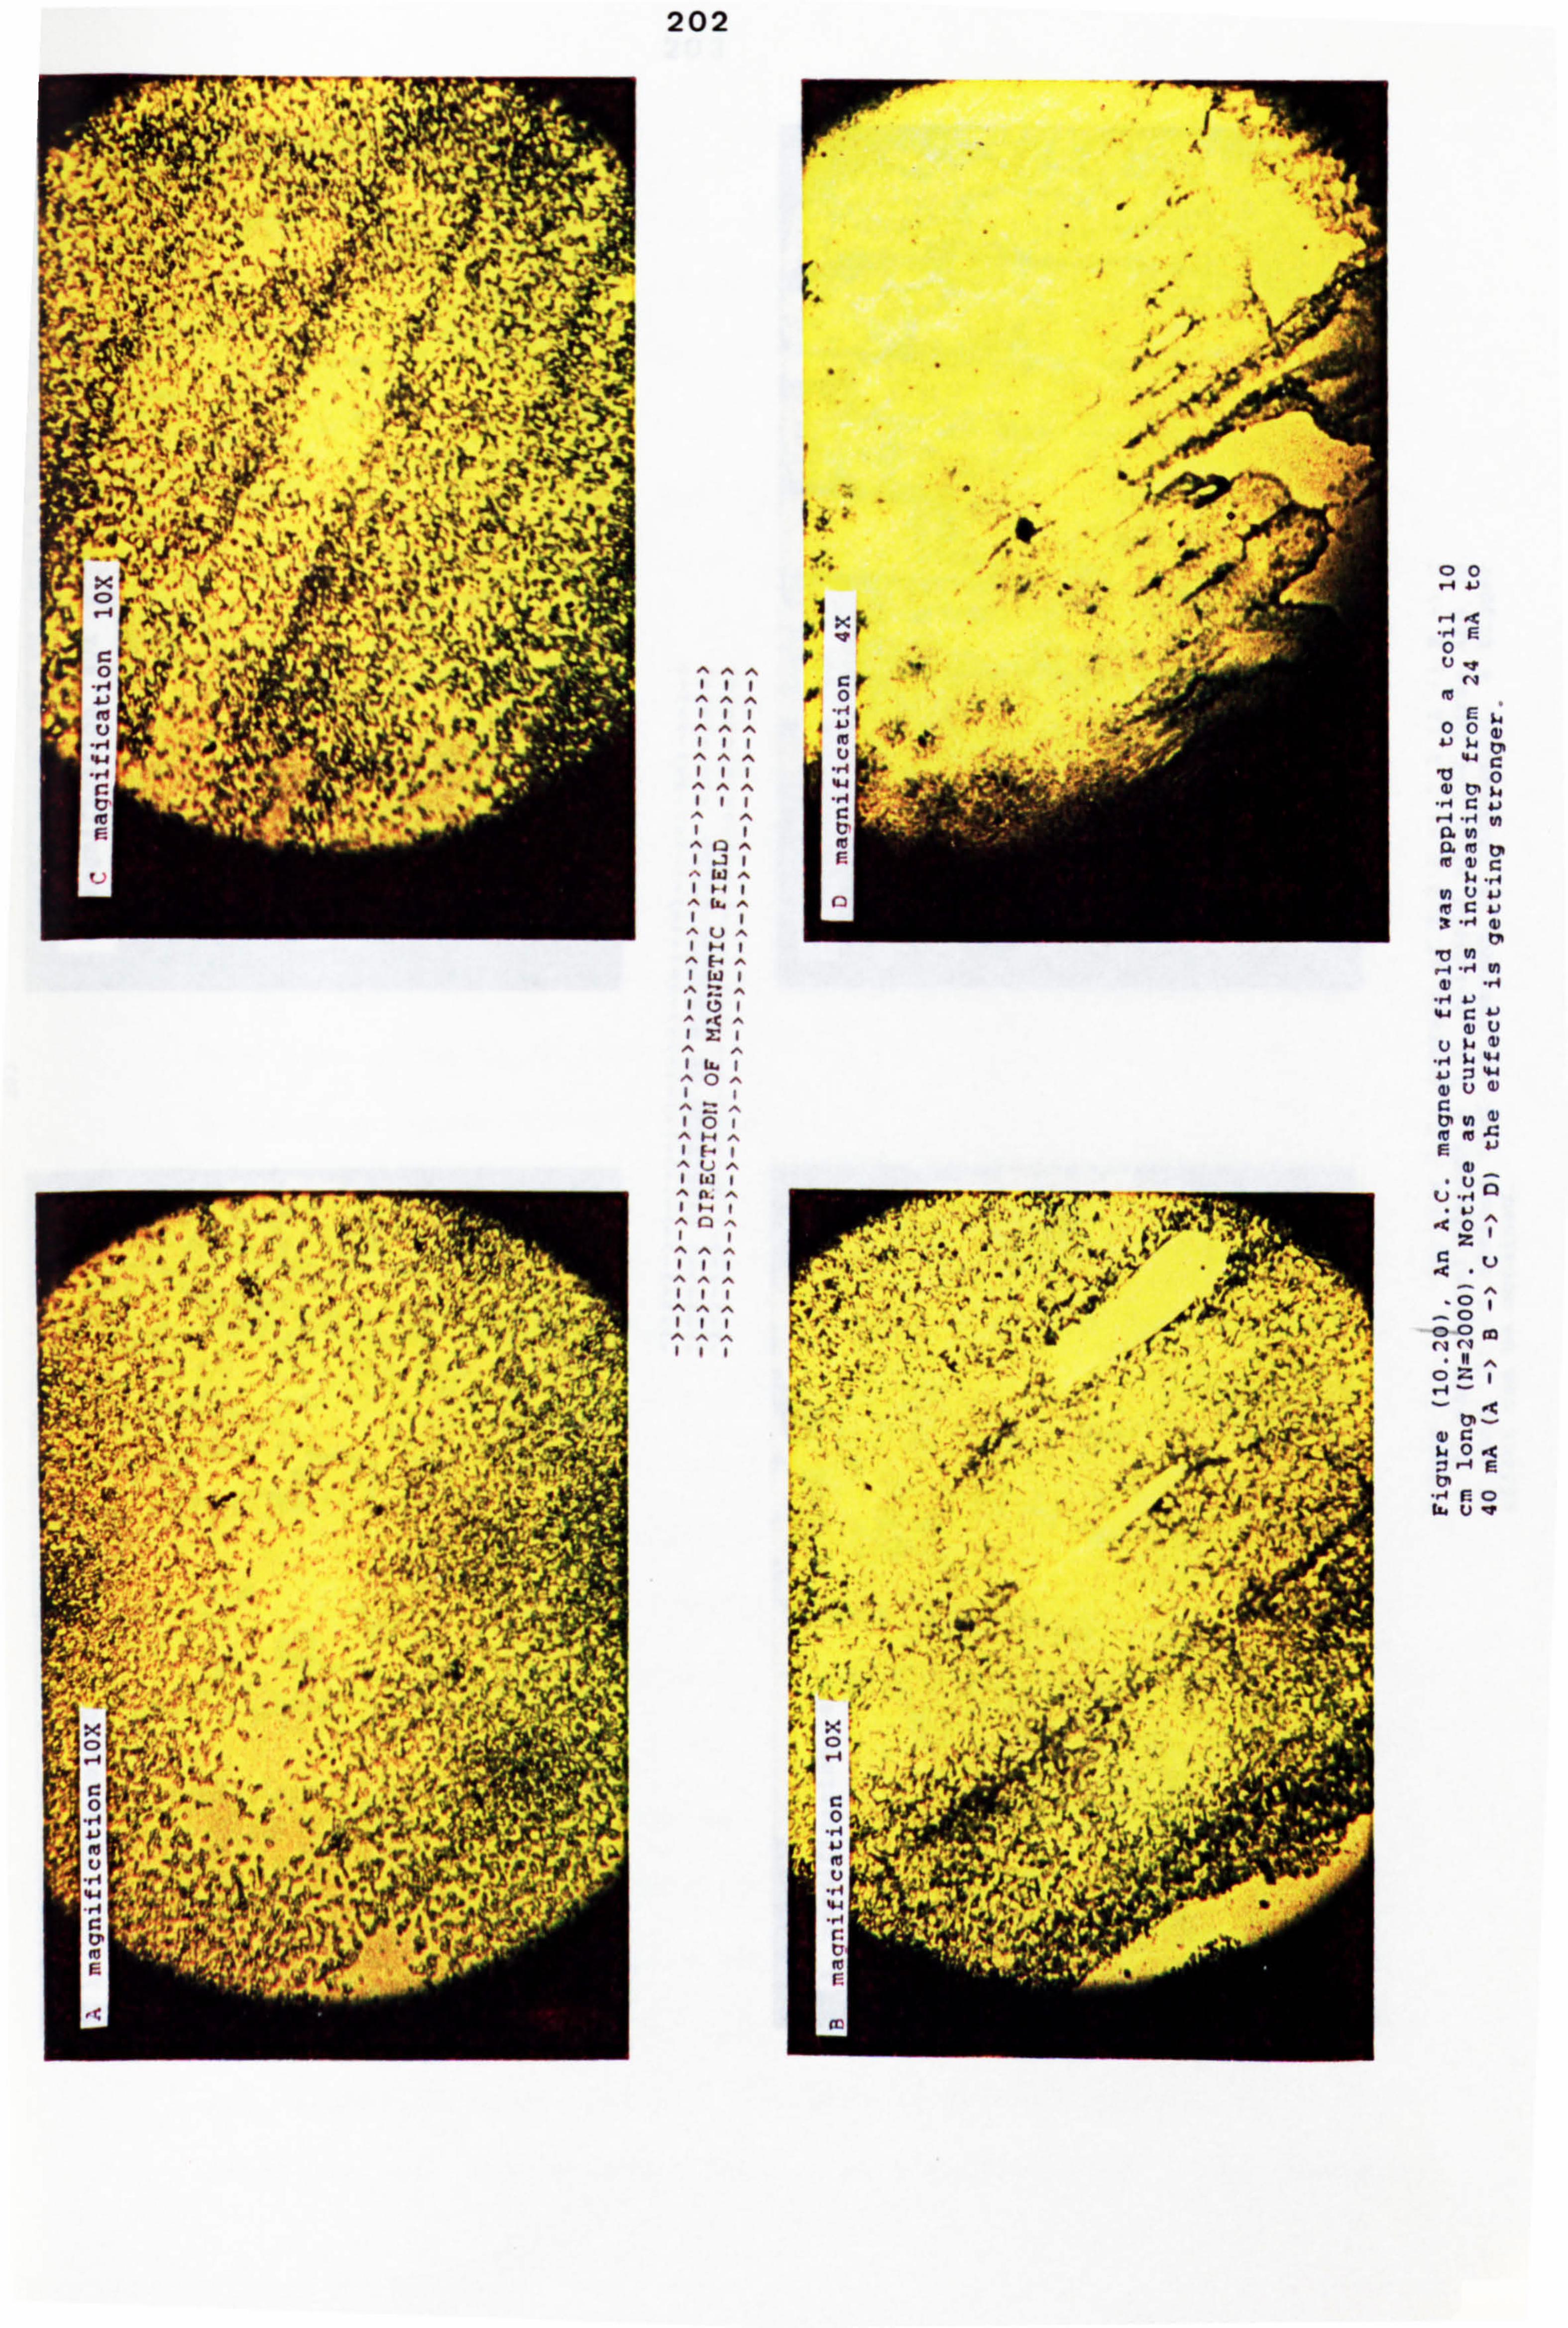
202
J
F
i U
1 v4
W
A
V
e, 00 ý4 AJ
0
00 44 c
0
-0 to UN
44
$4
41 :3 44
tj
0.4 :7 r-4 E
r:

. 03
OT? --CTIOII OF MAGNETIC FIELD
r%)
Figure (10.3), Various D-C. current of 0.2 A -) IA (A -) B -> C
-> D) were passed through a D. C. solenoid with 220 turns and 30
Cm long. It is obvious that as current is increasing, a bigger
effect can be obtained.

204
10.3.4 Frequency - In this part of the experiment, the current passing
through the coil was always kept steady at 50 mA and only the frequency
of the A. C. signal was changed for a 24 hour exposure time.
More than 50 samples were used in experiments over the frequency range
of 50 Hz-60 kHz. All the samples were from the same saline solution of
pure NaCI in distilled water which was prepared for the earlier part of
this experiment. A 50 Hz mains signal was driven by a Variac (Claude
Lyons Ltd. ) which was connected in series to a rehostat (6 kW range)
and an ammeter. For further higher frequency signals, a complementary
Darlington Class - AB emitter follower was constructed. This had a 3A
output capability (the circuit and description of this emitter follower
have been given in Section (5.8)). All the samples were observed under
an Olympus Phase Contrast Microscope (Model BH). Almost all the
samples had crystalized with the crystal alignment perpendicular to the
axis of the magnetic field. However, at certain frequencies, different
angles of the crystal alignment were observed with respect to the axis
of the magnetic field. The effects were greatest in the 6 kHz and 14
kHz ranges. All the other frequencies, including 50 Hz, gave effects
very similar to those obtained previously for D. C. currents; that is
the alignment of the crystals was perpendicular to the axis of the
magnetic fields. The effects at frequencies around 6 kHz and 14 kHz
were as shown in Figs. (10.4) and (10.5). The conclusions of the
results of these experiments on the freezing of saline samples in
magnetic fields is that there were two frequencies at which the crystal
alignments were rotated; at 6 kHz and-the alignment was - 62'0 clockwise
direction relative to an axis perpendicular to the direction of the
A. C. magnetic field. The D. C. alignment was also perpendicular to the
direction of the magnetic field. At a frequency of 14 kHz alignment
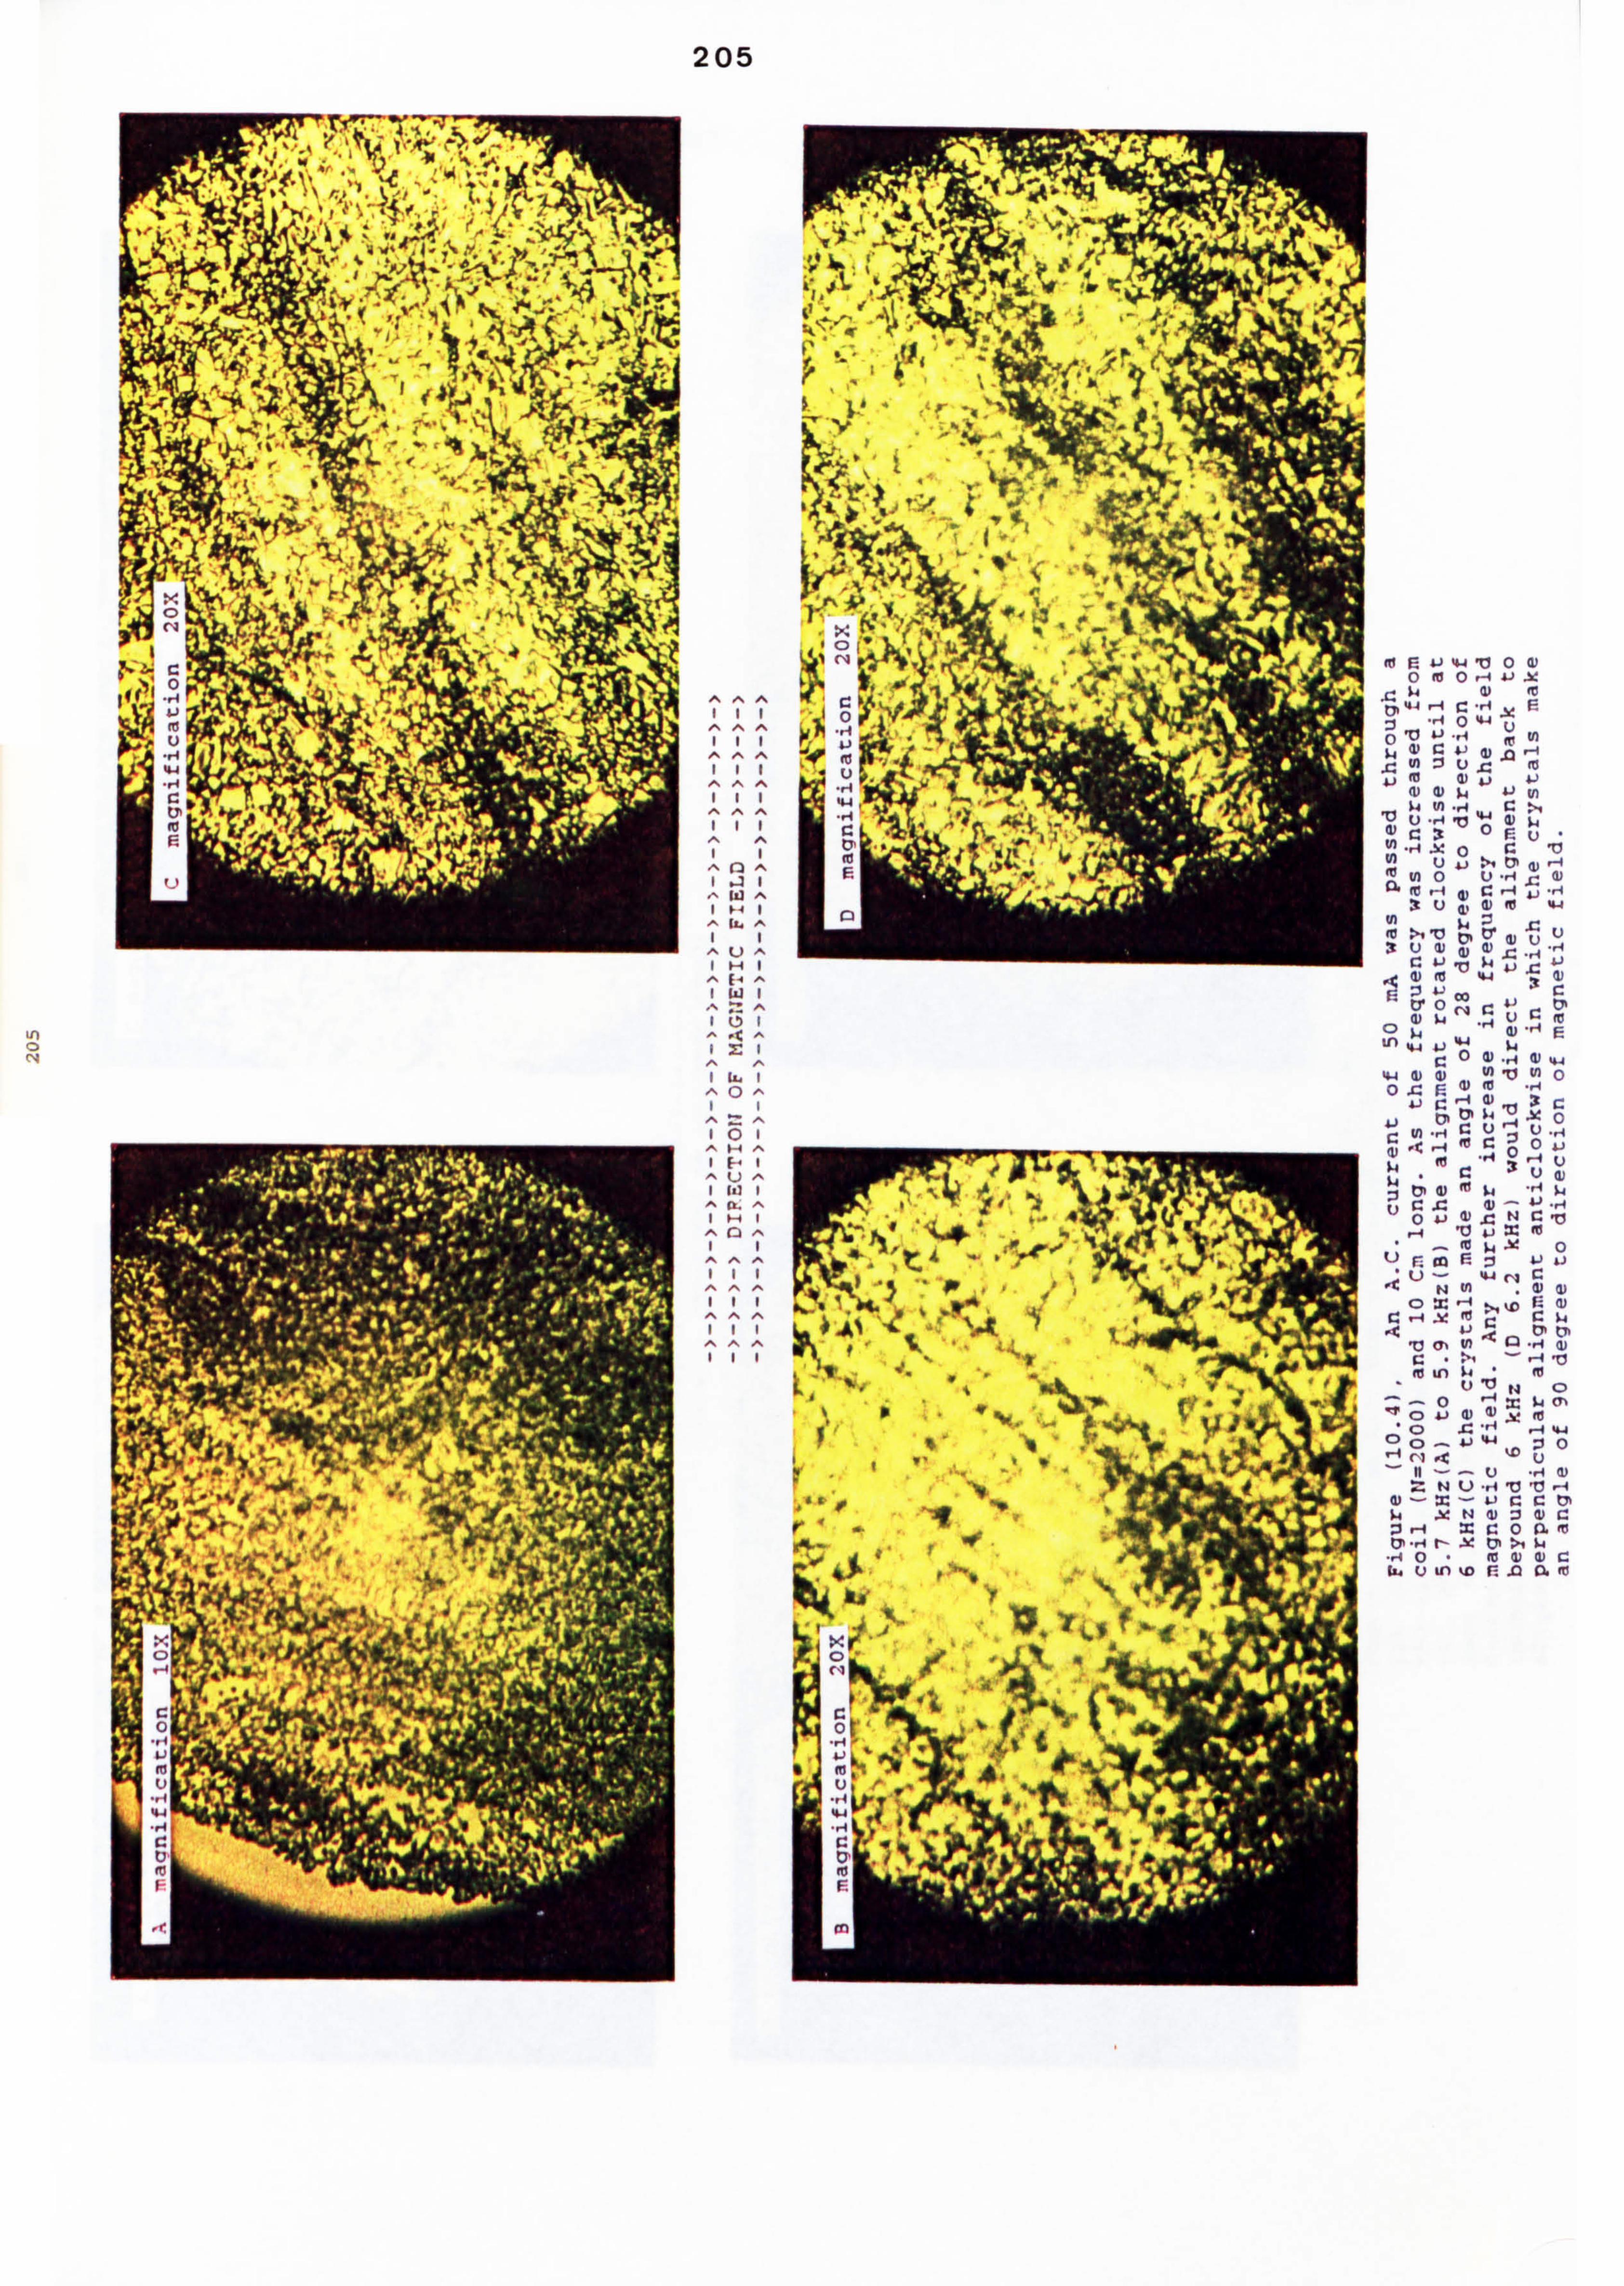
205
Ln
I (D ^
I F, I
It
II
al Ew 1W V0 a) 0m0 1ý Aj A: ý4 4) 0
14 C -4 ,E . 14 0 144 u
0 ij ., 1 4,
m U) ý4 r. 4j
.0 -4
M0 tj g ro d) tj v $4 tn
ý4 in -4 U 'r, .0 114 0W
V) tj N t% "' ul oU -4 J- W
r-4 -r4
In ý4 IV
.U (v (D J'- -4 , r aj v0c
co C-3 g: 0 -H fu
ti) ý4 E
44 si -
90 4) .4 %4 d) d) U) 'Ll tn o o c. E0a., I
r -4 CD 3: c t), 17 ý4
. 54 0 U) r. 4 g: uu
_4 to . C: 0 ji
r 14
0 tj
W (v W 14 H $4 ;jrC4,
-V _4 () 0 si 4) 4NC 'Es
0 :c $4 0
F; fn R :3o
C: 4 -54 M ý, 'D F (D
v r- w ýlc si ON LT,
U) M Ln ý4 , to
tj t4 0 o :cw (7, V0 to 4 44
:30 u
ZMQ ."V 10 1.4 a) - tc - L) 0C t3l ý4 XNw0 0) r. :j 14 =v0 pm Ol . 1-4 t- X ON >.
-4 0.00 U. Q in kD r-, .00. fu

PAG ;
NUlVI RIN-G
AS ORIGINAL
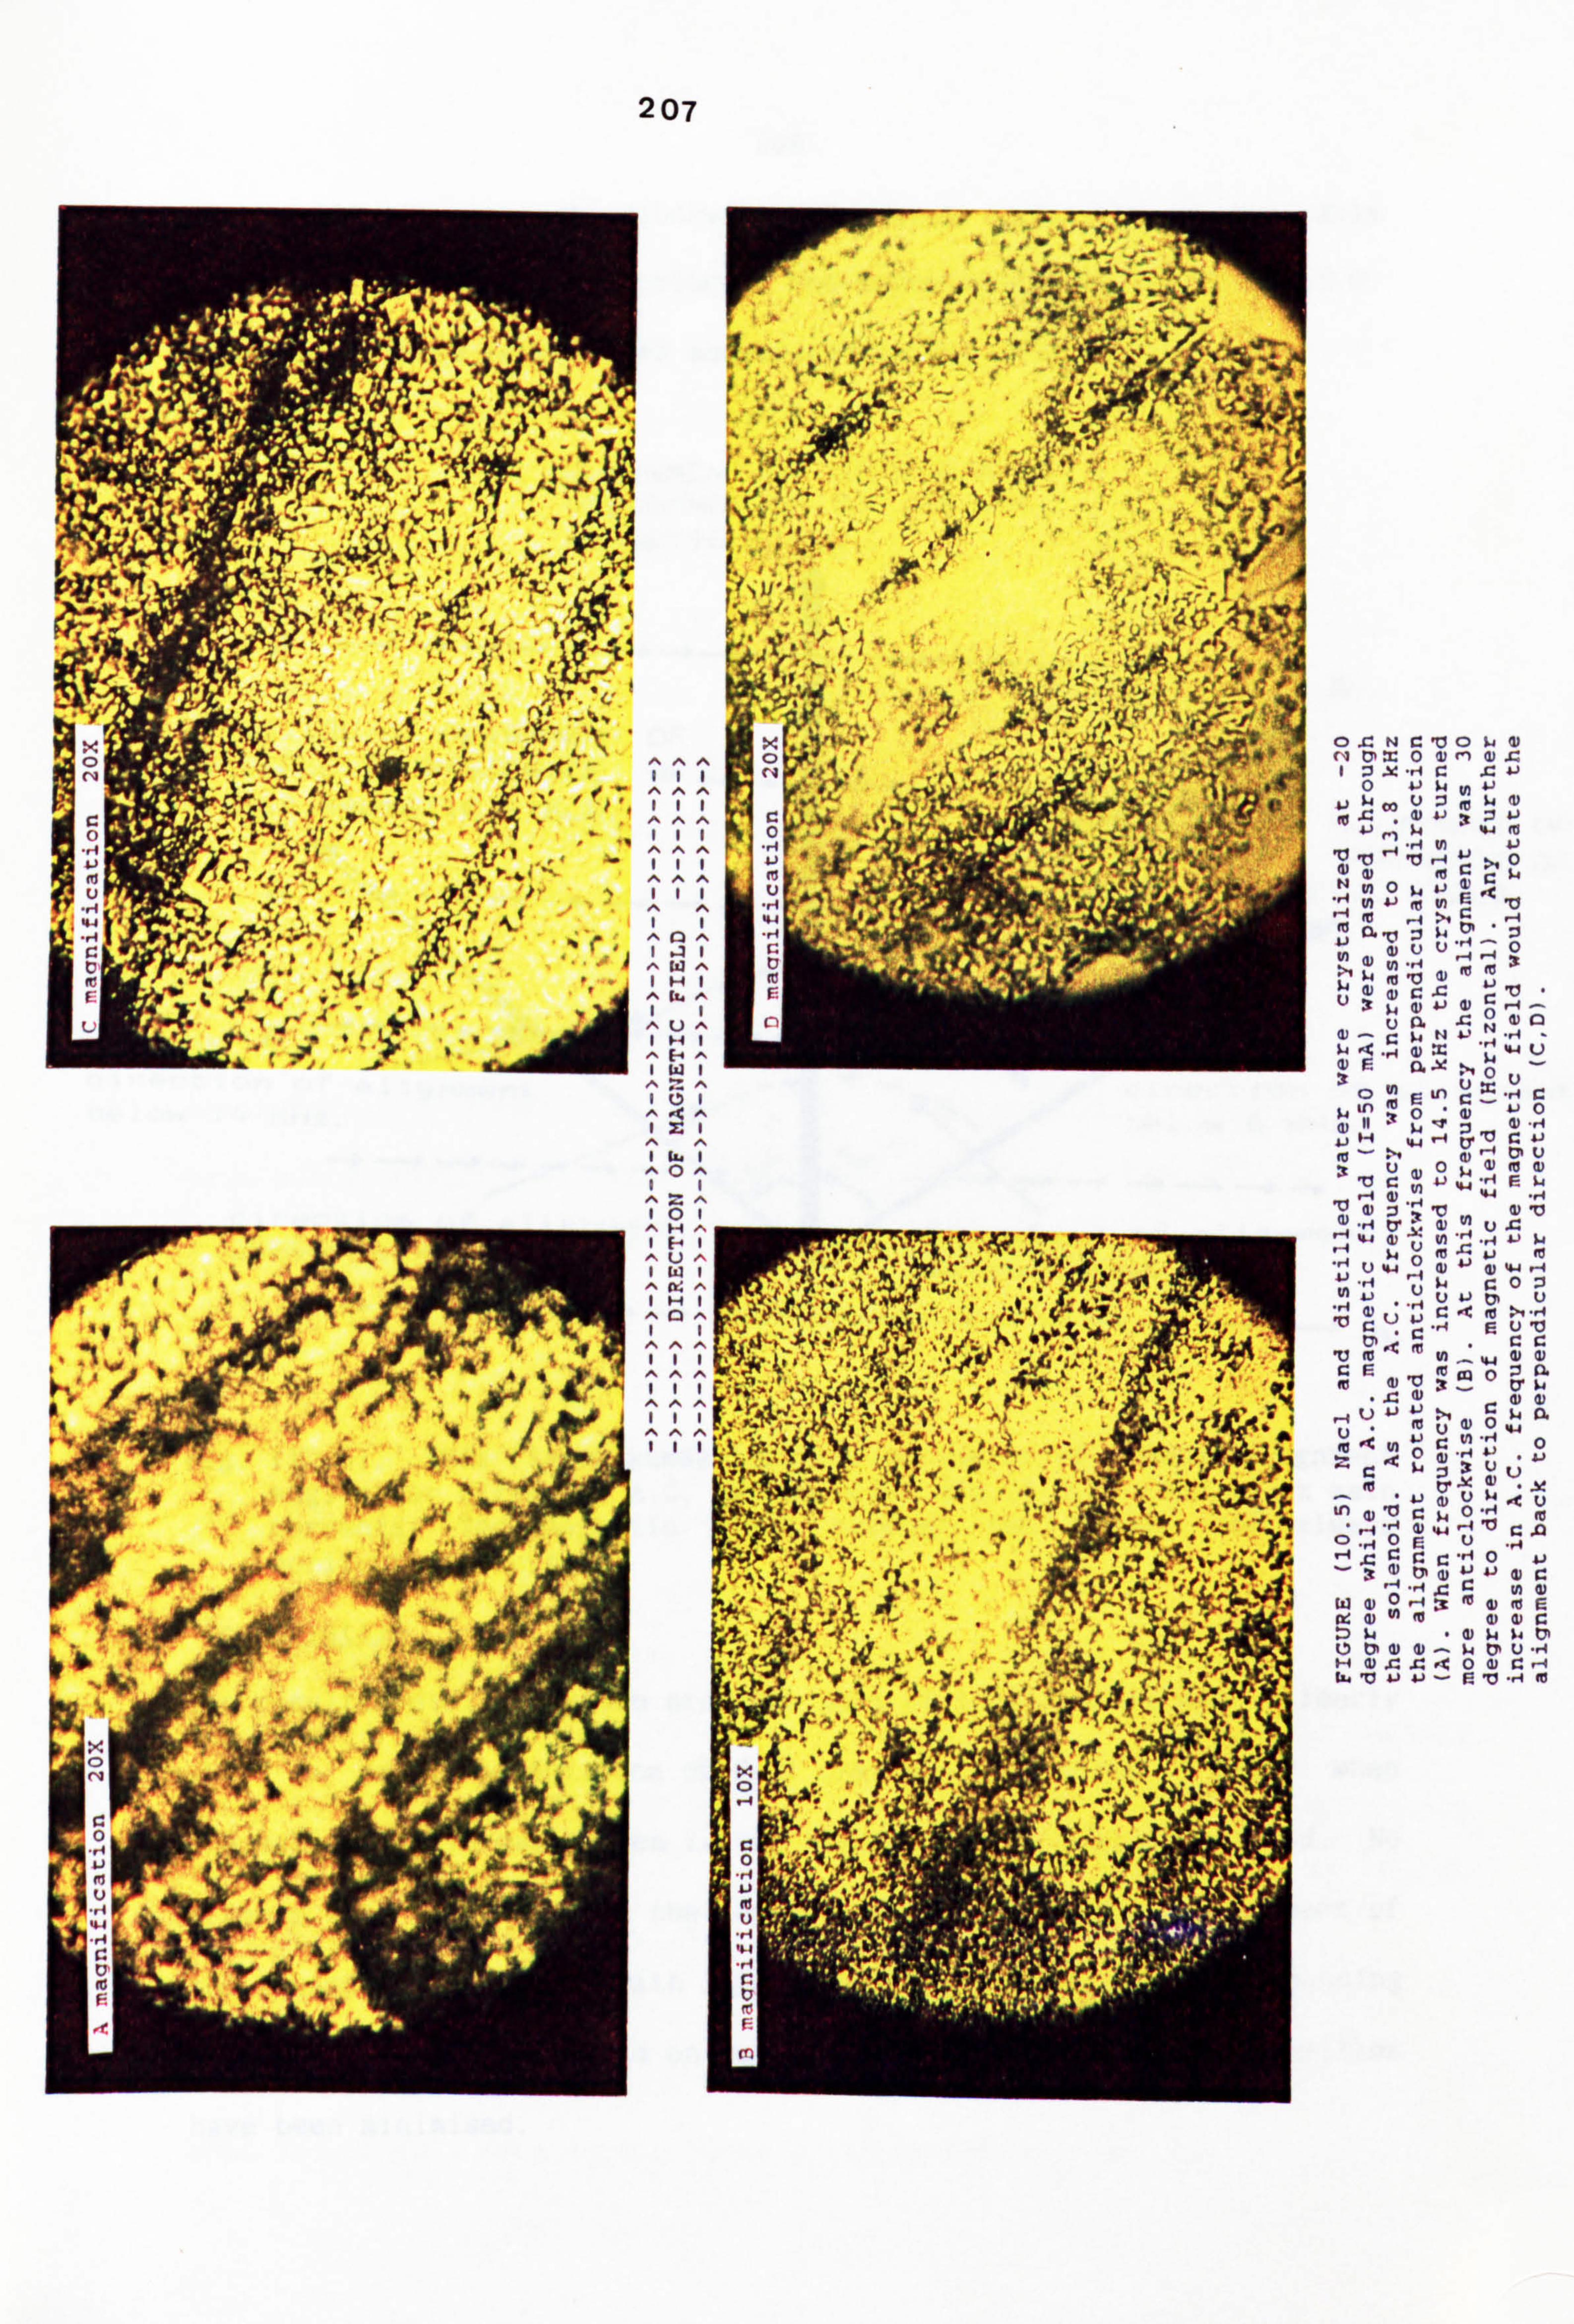
207
1 Fý
^ 0;
O. C N r-, o 0 ý4 %) Ul m0w 11) a) r- :3X4vc 0V $4 V, V
,j 14 Co :3 to W (D :t :1W
%4
'0 'TJ 1-4 0 -4
1-1 :, 0
(D %, a r. r N ul 0 tj W4
. ul V to in Ea "J 0610 :1 $4 0, * :1 Li 0 tn L)
., 4 (Ulu 4, C $4 0 "' 4,
ua .9od,
Z;
(1) - $4 MW -A , ý4 4 4) = 44 L)
0
tn 0=V fo V Ln r -4 $4 tn -V 0,4) v0
(V 11 -W 'q :, d) '1 44 tr V r.
N, 40 UWOý4q"O(D c
t" -4 E $4 0 44 . 14
(D .
(L) ý ýt 10 m
10
X
-4 ý4 v4
-, q L) %4 00 41 %64 ý4 tj
.1 $4 0 V) " ty,
(v fu >, 'Cl ru li
_4 EUV . r. U, ,cm.
rr. lu IV to - ". 1 (D 0) r. 15 V to M () :30.
(D a)
44 fe oc Lq o.., I v0
4) V 14
tn 4) 'o 0 ý4 0 `4 tv .4., 4 4) ,, -4
00E L) V
.0A. ) 2t 00) 11 Aj 4) r
,4 _4 CC0 4) w 4,0-mmorde 114 w d) al 0 ý) w d) ý-, &4 ON 0 t), d) 0- ý4 171 U 'ý4 H .940 4) c 1-1 gu V-FV -4 to
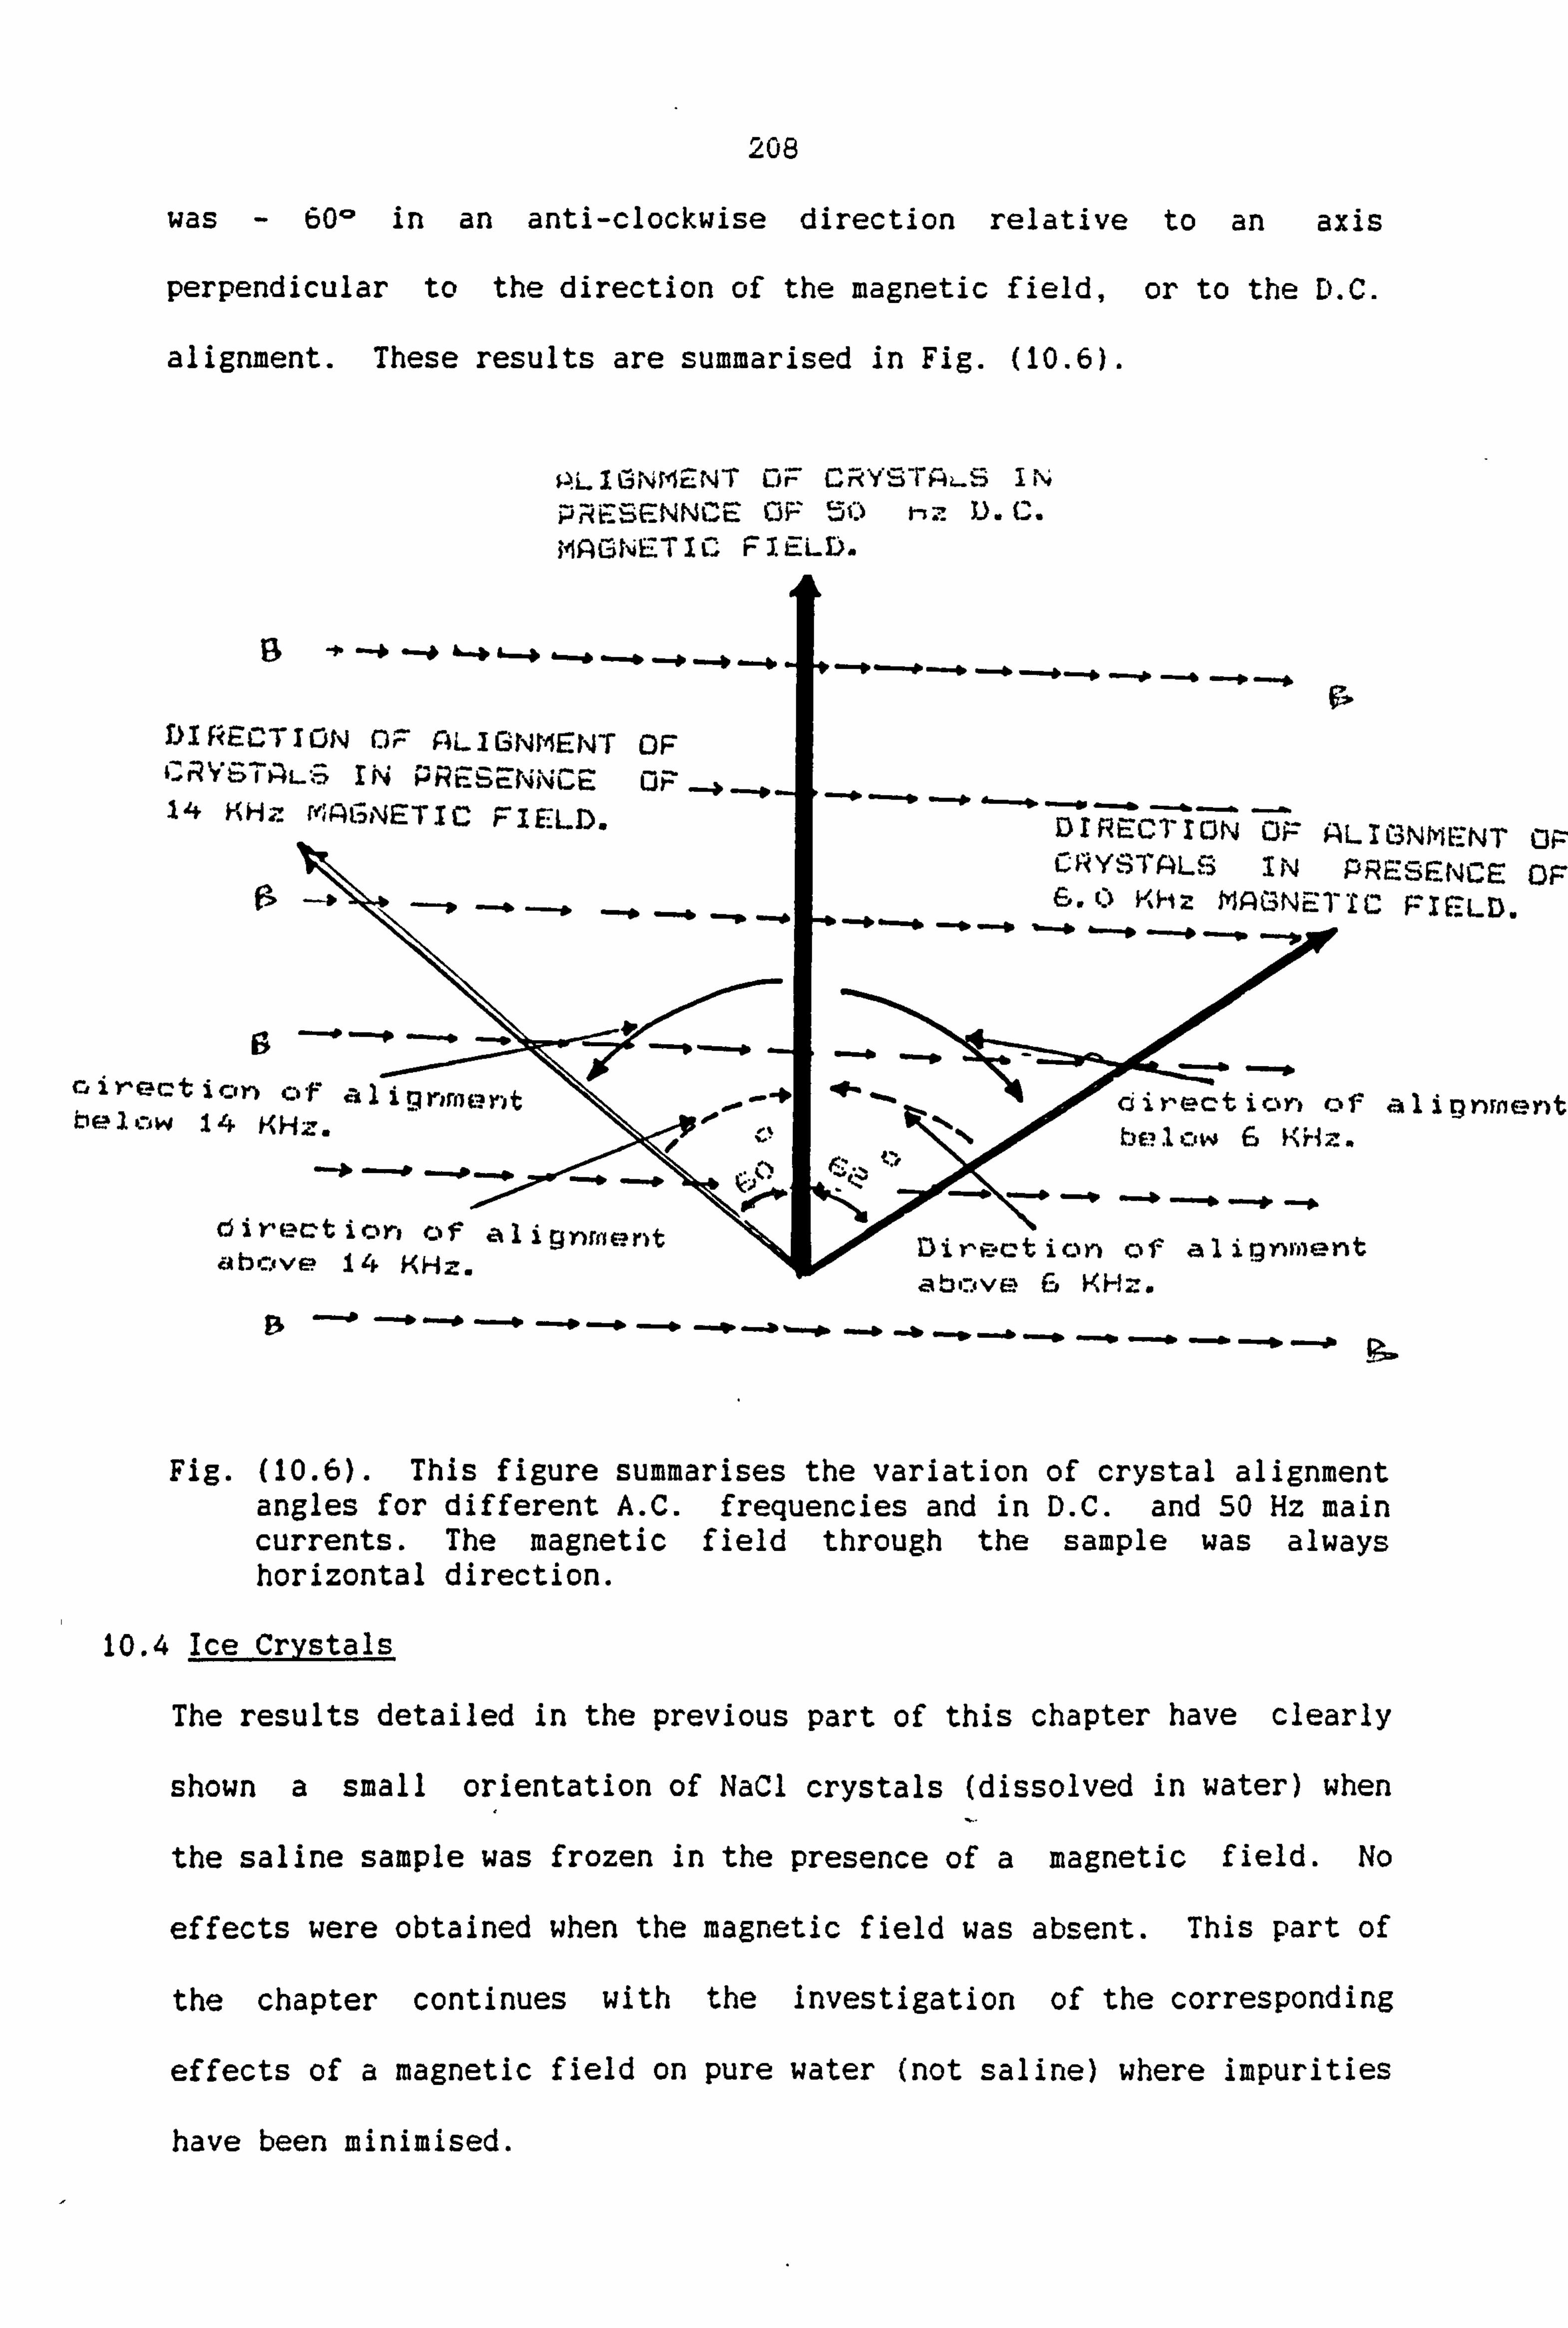
208
was - 60- in an anti-clockwise direction relative to an axis
perpendicular to the direction of the magnetic field, or to the D. C.
alignment. These results are summarised in Fig. (10.6).
PLIGNM2NT oF ii\ý PRESCNNCE OF 50 inz D. C. MAGNETIC FIELD.
_4,, " --#
DIRECTION n; ý* ALIGNMENT OF CRYGTAi-*6 IN PRESENNOE
-4, --0 ---* I-*. 14 V%Hz 111AGNETIC FIELD. DIRECTION OP ALIGNMENT OP CRYSTALS IN PRESENCE OF 6.0 KHz MAGNEETIC FIELD.
n+ cj'y'ectir-, n Of alignmen t0. irection of alignment 0 bellow 6 KHz.
p
below 14 KHz. nmE
,tcC:
direction of alignr'lent Direct, ion of alignment above 14 KHz. ireL
-C-, ý--
-, * 4 "r
abctve 6 KHz.
Fig. (10.6). This figure summarises the variation of crystal alignment angles for different A. C. frequencies and in D. C. and 50 Hz main currents. The magnetic field through the sample was always horizontal direction.
10.4 Ice Crystals
The results detailed in the previous part of this chapter have clearly
shown a small orientation of NaCl crystals (dissolved in water) when
the saline sample was frozen in the presence of a magnetic field. No
effects were obtained when the magnetic field was absent. This part of
the chapter continues with the investigation of the corresponding
effects of a magnetic field on pure water (not saline) where impurities
have been minimised.

209
The research was carried out by forming ice crystals in different
strengths of A. C. or D. C. magnetic fields. The magnetic field treated
samples were then subjected to X-ray. Both transmission and back
scatter X-ray patterns from the samples were studied.
Before describing the effects of magnetic fields on the formation of
ice crystals as observed by X-rays, a short review of the basic
principles of X-rays is given, followed by an outline of Bragg's Law;
the reflection, and transmission of X-rays. The review relates
specifically to the possible structures of ice crystals.
10.4.1 Braggs Law
Before the discovery of X-ray diffraction which enabled the
arrangements of atoms in a crystal to be determined experimentally,
crystallographers had simply assumed that the regular external shapes
of crystals were due to the atoms being arranged in regular, repeating
patterns
In 1912 three German physicists, Max Von Laue, W Friedrich and P Knipping,
found that an X-ray beam, often passing through a crystal, formed a pattern
of spots on a photographic plate. Shortly afterwards, WL Bragg and Sir
William Bragg showed how the pattern could be used to reveal the positions
of the atoms in a crystal. Together they proceeded to unravel the atomic
structure of many substances. This has been extended to include the
molecules like DNA, that play a vital part in the processes of life largely
through the work of D. C. Phillips and his group
10.4.2 Scattering of X-rays
When X-rays fall on a single plane of atoms (as in an ice crystal),
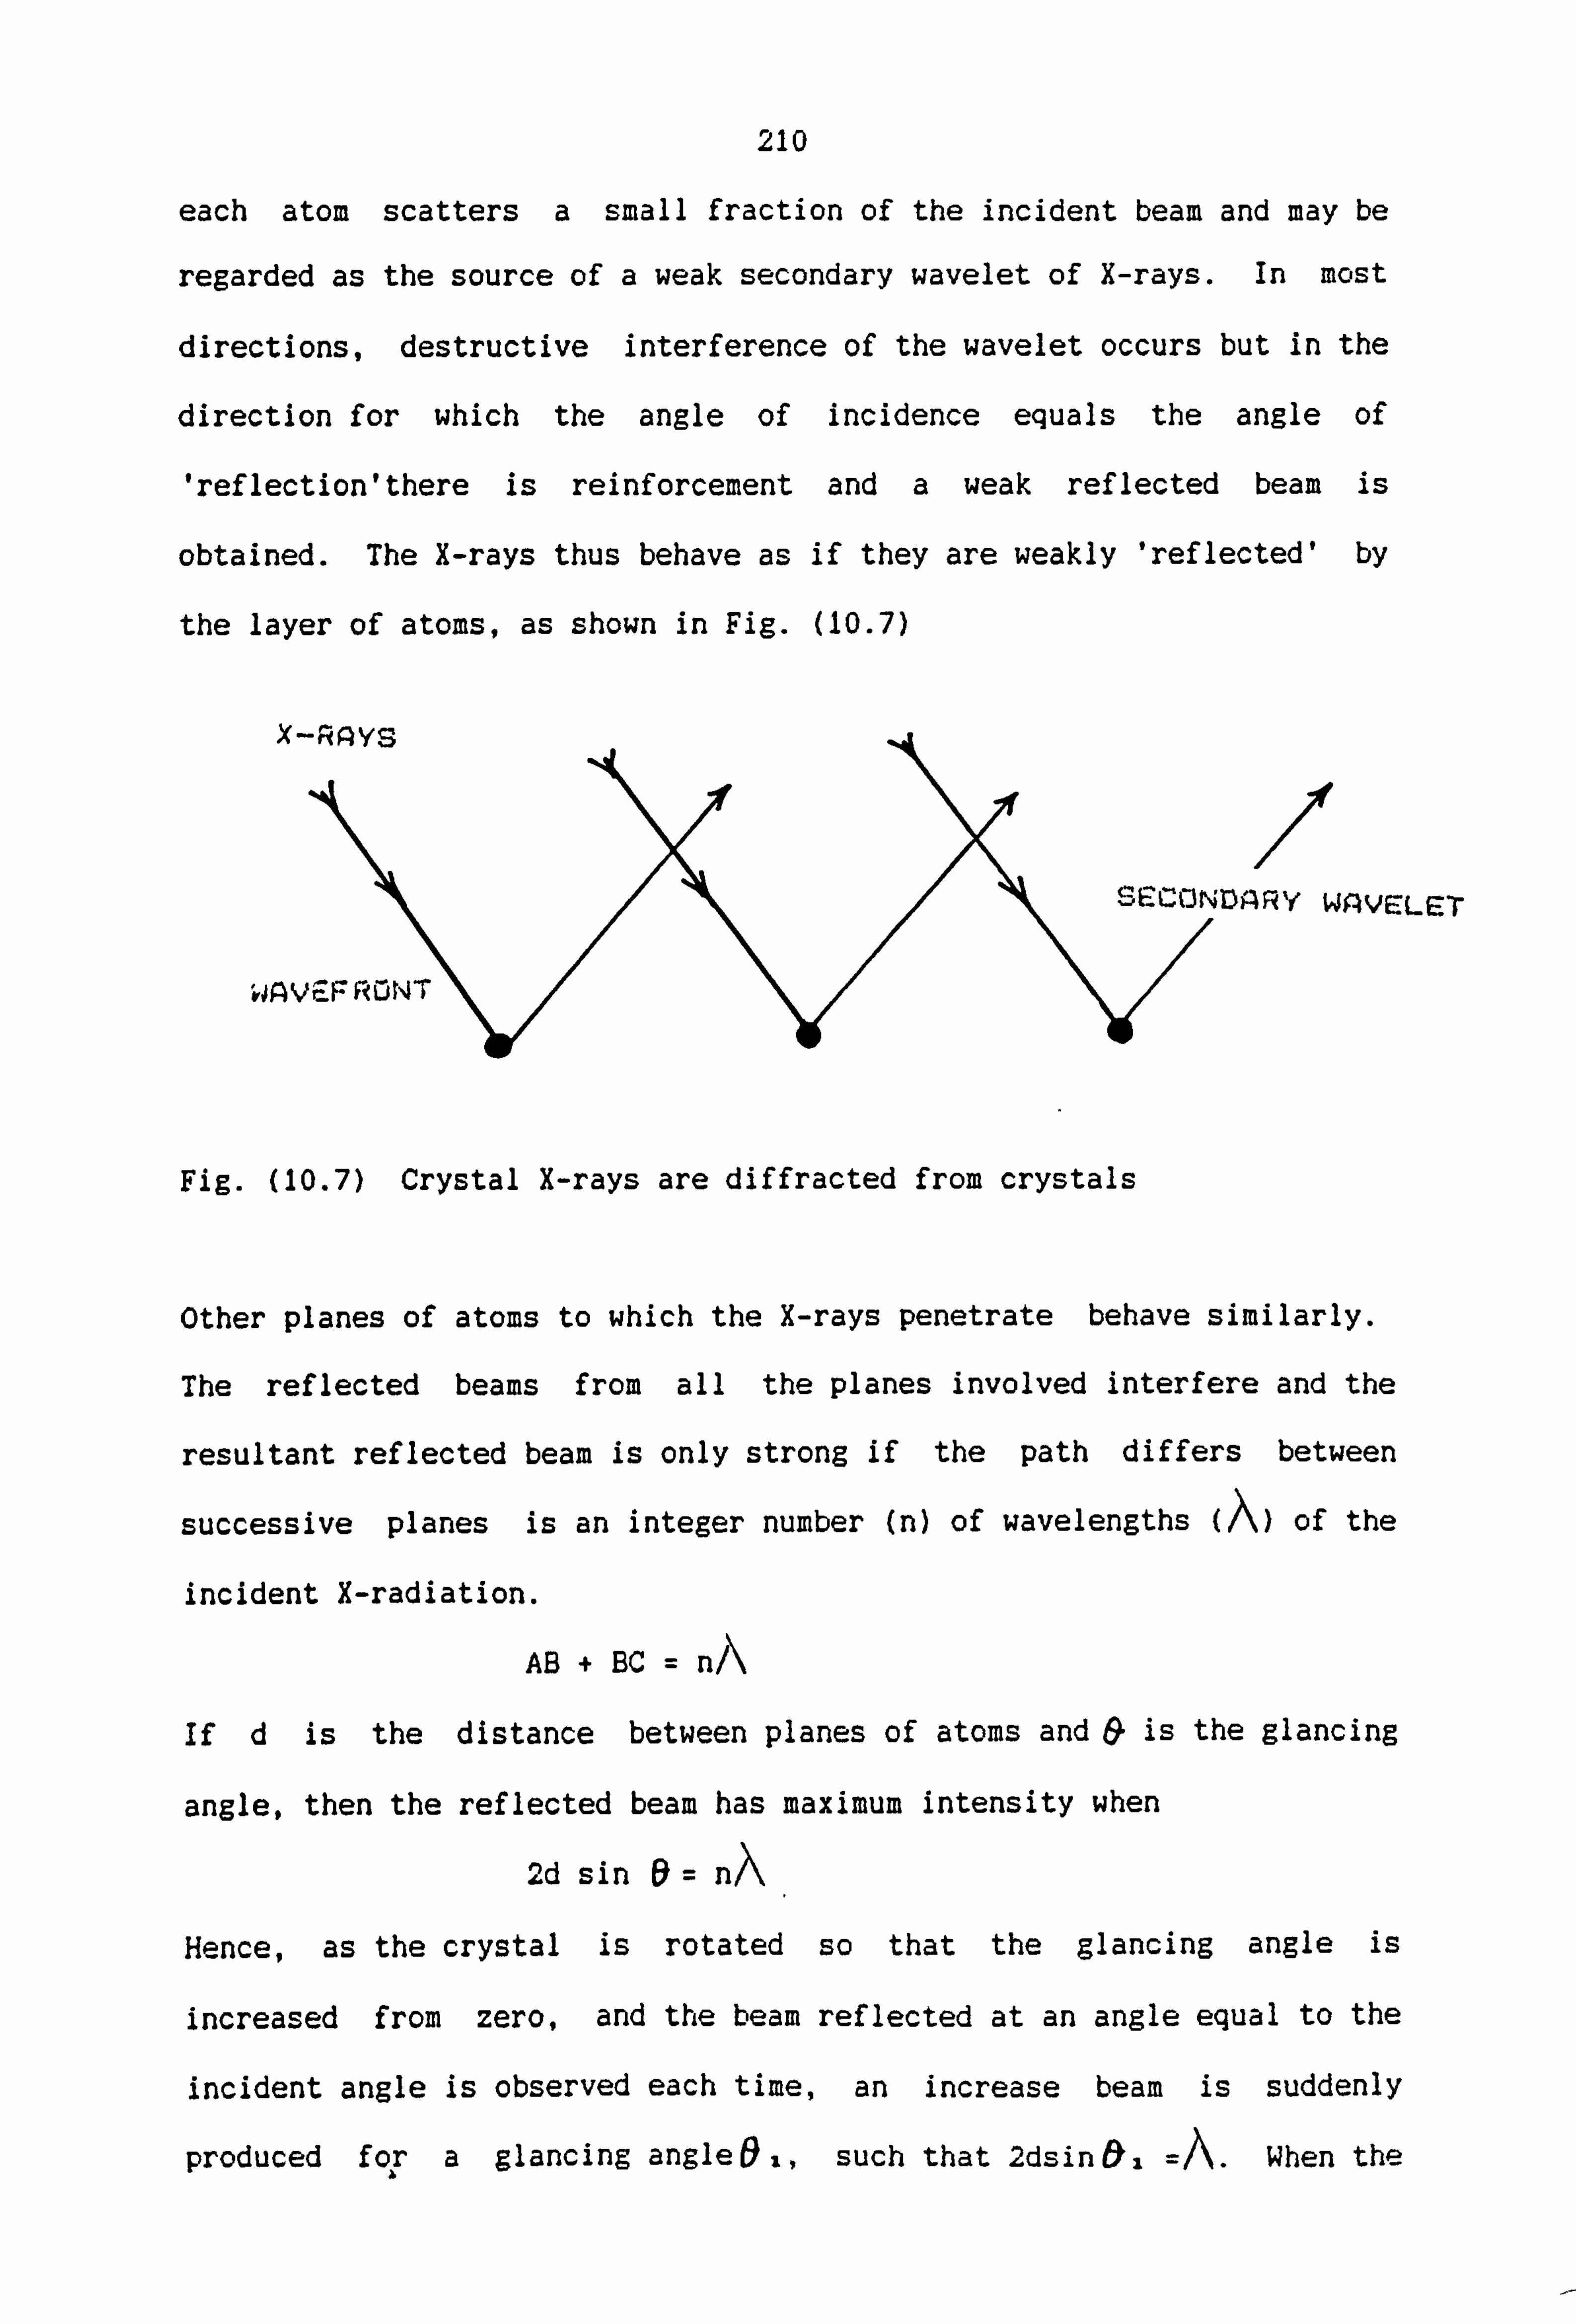
210
each atom scatters a small fraction of the incident beam and may be
regarded as the source of a weak secondary wavelet of X-rays. In most
directions, destructive interference of the wavelet occurs but in the
direction for which the angle of incidence equals the angle of
'reflection'there is reinforcement and a weak reflected beam is
obtained. The X-rays thus behave as if they are weakly 'reflected' by
the layer of atoms, as shown in Fig. (10.7)
X-RAY. q
ZARY WAVELET
I VJAV
Fig. (10.7) Crystal X-rays are diffracted from crystals
Other planes of atoms to which the X-rays penetrate behave similarly.
The reflected beams from all the planes involved interfere and the
resultant reflected beam is only strong if the path differs between
successive planes is an integer number (n) of wavelengths (A) of the
incident X-radiation.
AB + BC = nÄ
If d is the distance between planes of atoms and & is the glancing
angle, then the reflected beam has maximum intensity when
2d sin 6= n/\
Hence, as the crystal is rotated so that the glancing angle is
increased from zero, and the beam reflected at an angle equal to the
incident angle is observed each time, an increase beam is suddenly
produced foT a glancing angleO i, such that 2dsin 01 =A. When the
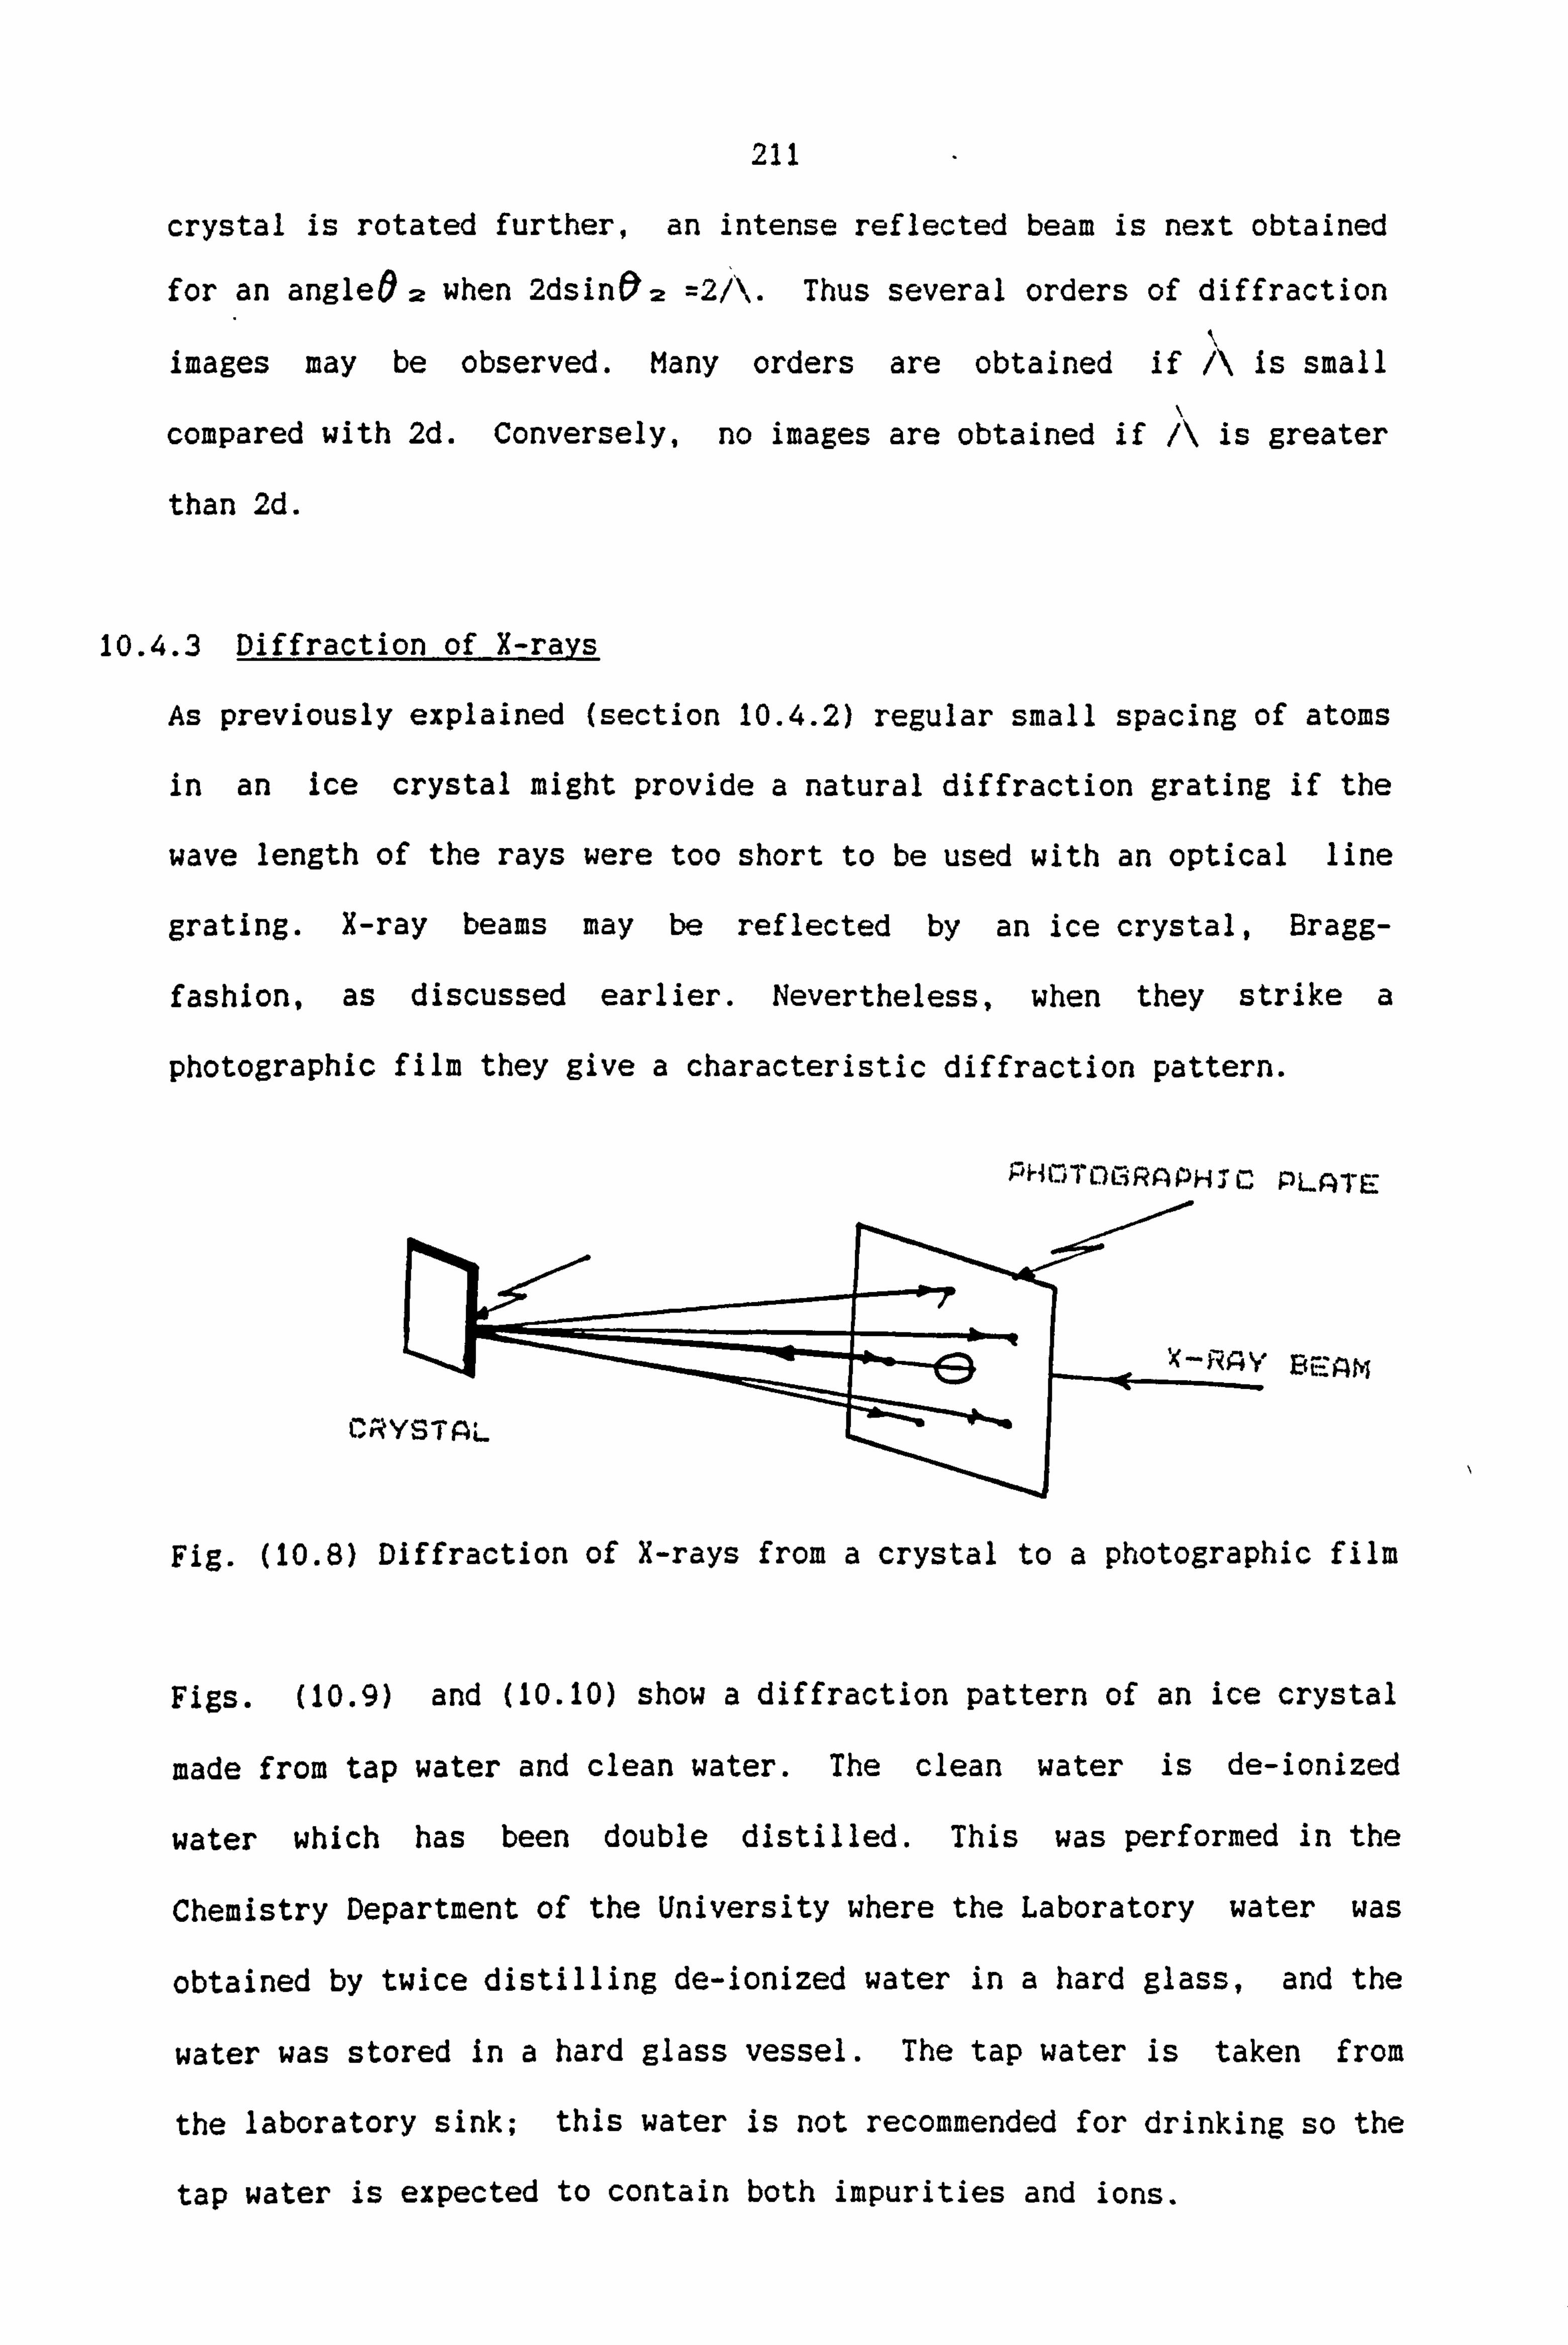
211
crystal is rotated further, an intense reflected beam is next obtained
for an angleO 2 when 2dsinO 2 =2/ Thus several orders of diffraction
images may be observed. Many orders are obtained if Is small
compared with 2d. Conversely, no images are obtained if is greater
than 2d.
10.4.3 Diffraction of X-rays
As previously explained (section 10.4.2) regular small spacing of atoms
in an ice crystal might provide a natural diffraction grating if the
wave length of the rays were too short to be used with an optical line
grating. X-ray beams may be reflected by an ice crystal, Bragg-
fashion, as discussed earlier. Nevertheless, when they strike a
photographic film they give a characteristic diffraction pattern.
; +i(. -jTL-)GRAPHj'C PLATE
cký
BE'Am
Fig. (10.8) Diffraction of X-rays from a crystal to a photographic film
Figs. (10.9) and (10.10) show a diffraction pattern of an ice crystal
made from tap water and clean water. The clean water is de-ionized
water which has been double distilled. This was performed in the
Chemistry Department of the University where the Laboratory water was
obtained by twice distilling de-ionized water in a hard glass, and the
water was stored in a hard glass vessel. The tap water is taken from
the laboratory sink; this water is not recommended for drinking so the
tap water is expected to contain both impurities and ions.

wcri, ZjrF ý_7 T
WElter , 'r- r., E- Z7 ýML. o--ý -f eicis were aw; -v
fr, -, i:! env,, ronmen, ý-, i
ý! "ne 1- 1ý r, a, -. 1-.,; -- : -ý e- C, magnetI . -- fie id !; thev were k. ept in a. meta -j bc, z
J Ile-re [-I I Ze- r Wý, i is ý the experimen-, was progress. a r. -ý
1aine --ý -entrif-UEe piastic tubes ýI '-I MI! Prior T- C1 bein4
tranSlerred for experiment.
ttle atEence of arl-v magnetic fiei, -ý tne thal-, the 2 C, m ag n E: ti f ieids !. These rings are prcbabi,,: due i:, -ý ions and impurities whicri exist in the tap water and ioc-i-. iike- tý,, -- diftraction pattern , -;! Lowcler parT-icies.

Fig. (10. iCl,, shows broken rings which have iarger crystal ization of random orientations. The sampie is from ciean water purifie-, in the absence of anv mainetio fieid othei than a geomagnetin fieA.
Tr, is sect i Cý I, C, ft PT C' j e'- 'L WaSa1 ME'3 -z 1 ; --' LS erV1 rl ý-- a rl Y ý-- IeCtSd
Magneti, - f ieid ( D. C. on a Sainpie of C lean water i dcubie de- ionizee: an-J
ýjistilieo water) wheri it ha, -ý ieen froZen iii the f ieid. The maýmetic
Type J was pr, -, duced by a L, liewp, orl- Hi. --r-tromagrie'L lrlE-ýrumerlL I
whic-1, Cý C, U i -ýi ienerate -: i flign D (ý! K, gauss). Th is
maznet ria-i a scAerioid with aiý inner cliame-Ter uf rl m Cý F, whi ý-- i-ý T- 1 -1 --
as shown in Fi. E.
Eacýh sampie was exposed to aL magriet i, -- i -4 f, as 7- ! -1 D 11 rE
-ontr-1; and thiS wl.; s ivt, - Th- f reezer had a terný, erature - -. L
Cl-- verv siowiv wit-h the magrietil-- f i; -- Id F-, assiriýý throu the sampjý-
214
resting inside the solenoid. The samples were prepared as before by
freezing clean water in- 10 ml plastic centrifuge tubes. Once the
sample was crystalized to an ice structure, it was transferred to the
Crystallography Laboratory for further experiment.
» '»43 -.

Fig. (10.11) Magnetic field and freezer
VIIai, z- rwIirn has teen wat- rl 1L-. a magneLi- iielr-J'. (, Magnetic fieid = i-I-) --aUSE, l U.
curren'ý = IJASA'

Ij. I-i, - X-ray dif fracr-ion pattern of ciear, water. MagneT-i -- fie Id = 1ý0 gauss/D., -. current Ai
ihe smali variations amcn, ýý, the ; -rav Jif ii-acticýri p, attei-ii c, f trie sampies
zr-lc, w LhE- difficultv -ýf re-peatin, this exý: -erimenL. Ti-, isý is PnDb-aLlv vue
t'-- tr'-- meltin- ice surf ac: e cjurinýý the dif i'r ac -c i on ex r, er i men-, C4 - The Mel tinL-- of the surtace of ice crystals mav cause the X-ravs Lo re
d 'iffracted from a new atomic ý, Jan--- It is, however. -lear that tiie
r-a v oi ffp at ter F, C, f magnetic iield treated -iean water ýFig,.
1ý, is compietel-,,, --, JLf teren"L from the A-rav diff ractiorl pattern C, I'
i ea ý,; water wilicý, ýla; E nc; 1ý beer, treated bv amag ne t ic fi e- I 'J iFI
ý -1, J. I 1-i ý. iis the difference ýýiearlv needs m c, re res ea rc i- t r., eaut nc, r
C, C, kaýt he tra 1-1 smissior, C. fX-I,
a vs ratner than t 1-1 e
ref ie, ý I ion pa-Eterr, .
A

217
10.4.4 Transmission of x-rays
X-rays may be refracted (or transmitted) in passing through a crystal.
However, this is not possible for all crystals, but is possible for our
experiments, since the crystal is ice and is transparent. X-ray
transmission diffraction too, is governed by Bragg's law.
Imagine the X-ray beam
strikes an extremely thin
transparent ice crystal
forming a pattern of spots on
a photographic film as placed
behind the crystal in the
other side of the X-ray beam
as shown in Figure (10.14). L
Fig. (10.14) Transmission of X-rays from a crystal to a photographic film.
It is important for the ice crystal to be as thin as possible; this
simplifies the X-ray pattern analysis. It was especially important
during our investigation as the ice crystals and the crystal pattern
needed to be studied carefully. The thin ice crystals were formed by
freezing clean water in fine tubes (the non-crystalline tubes were
kindly loaned to the author by the Crystallography Laboratory). The
objective of the experiment was to observe and study the effect of
magnetic fields on water in its solid state (ice). More than 12
samples were exposed to D. C. magnetic fields. The D. C. magnetic field
was produced by passing a D. C. current through a Newport
electromagnetic Instrument (Type C) coil. The samples were exposed
over the range 100 to 300 gauss magnetic field strength. Each time
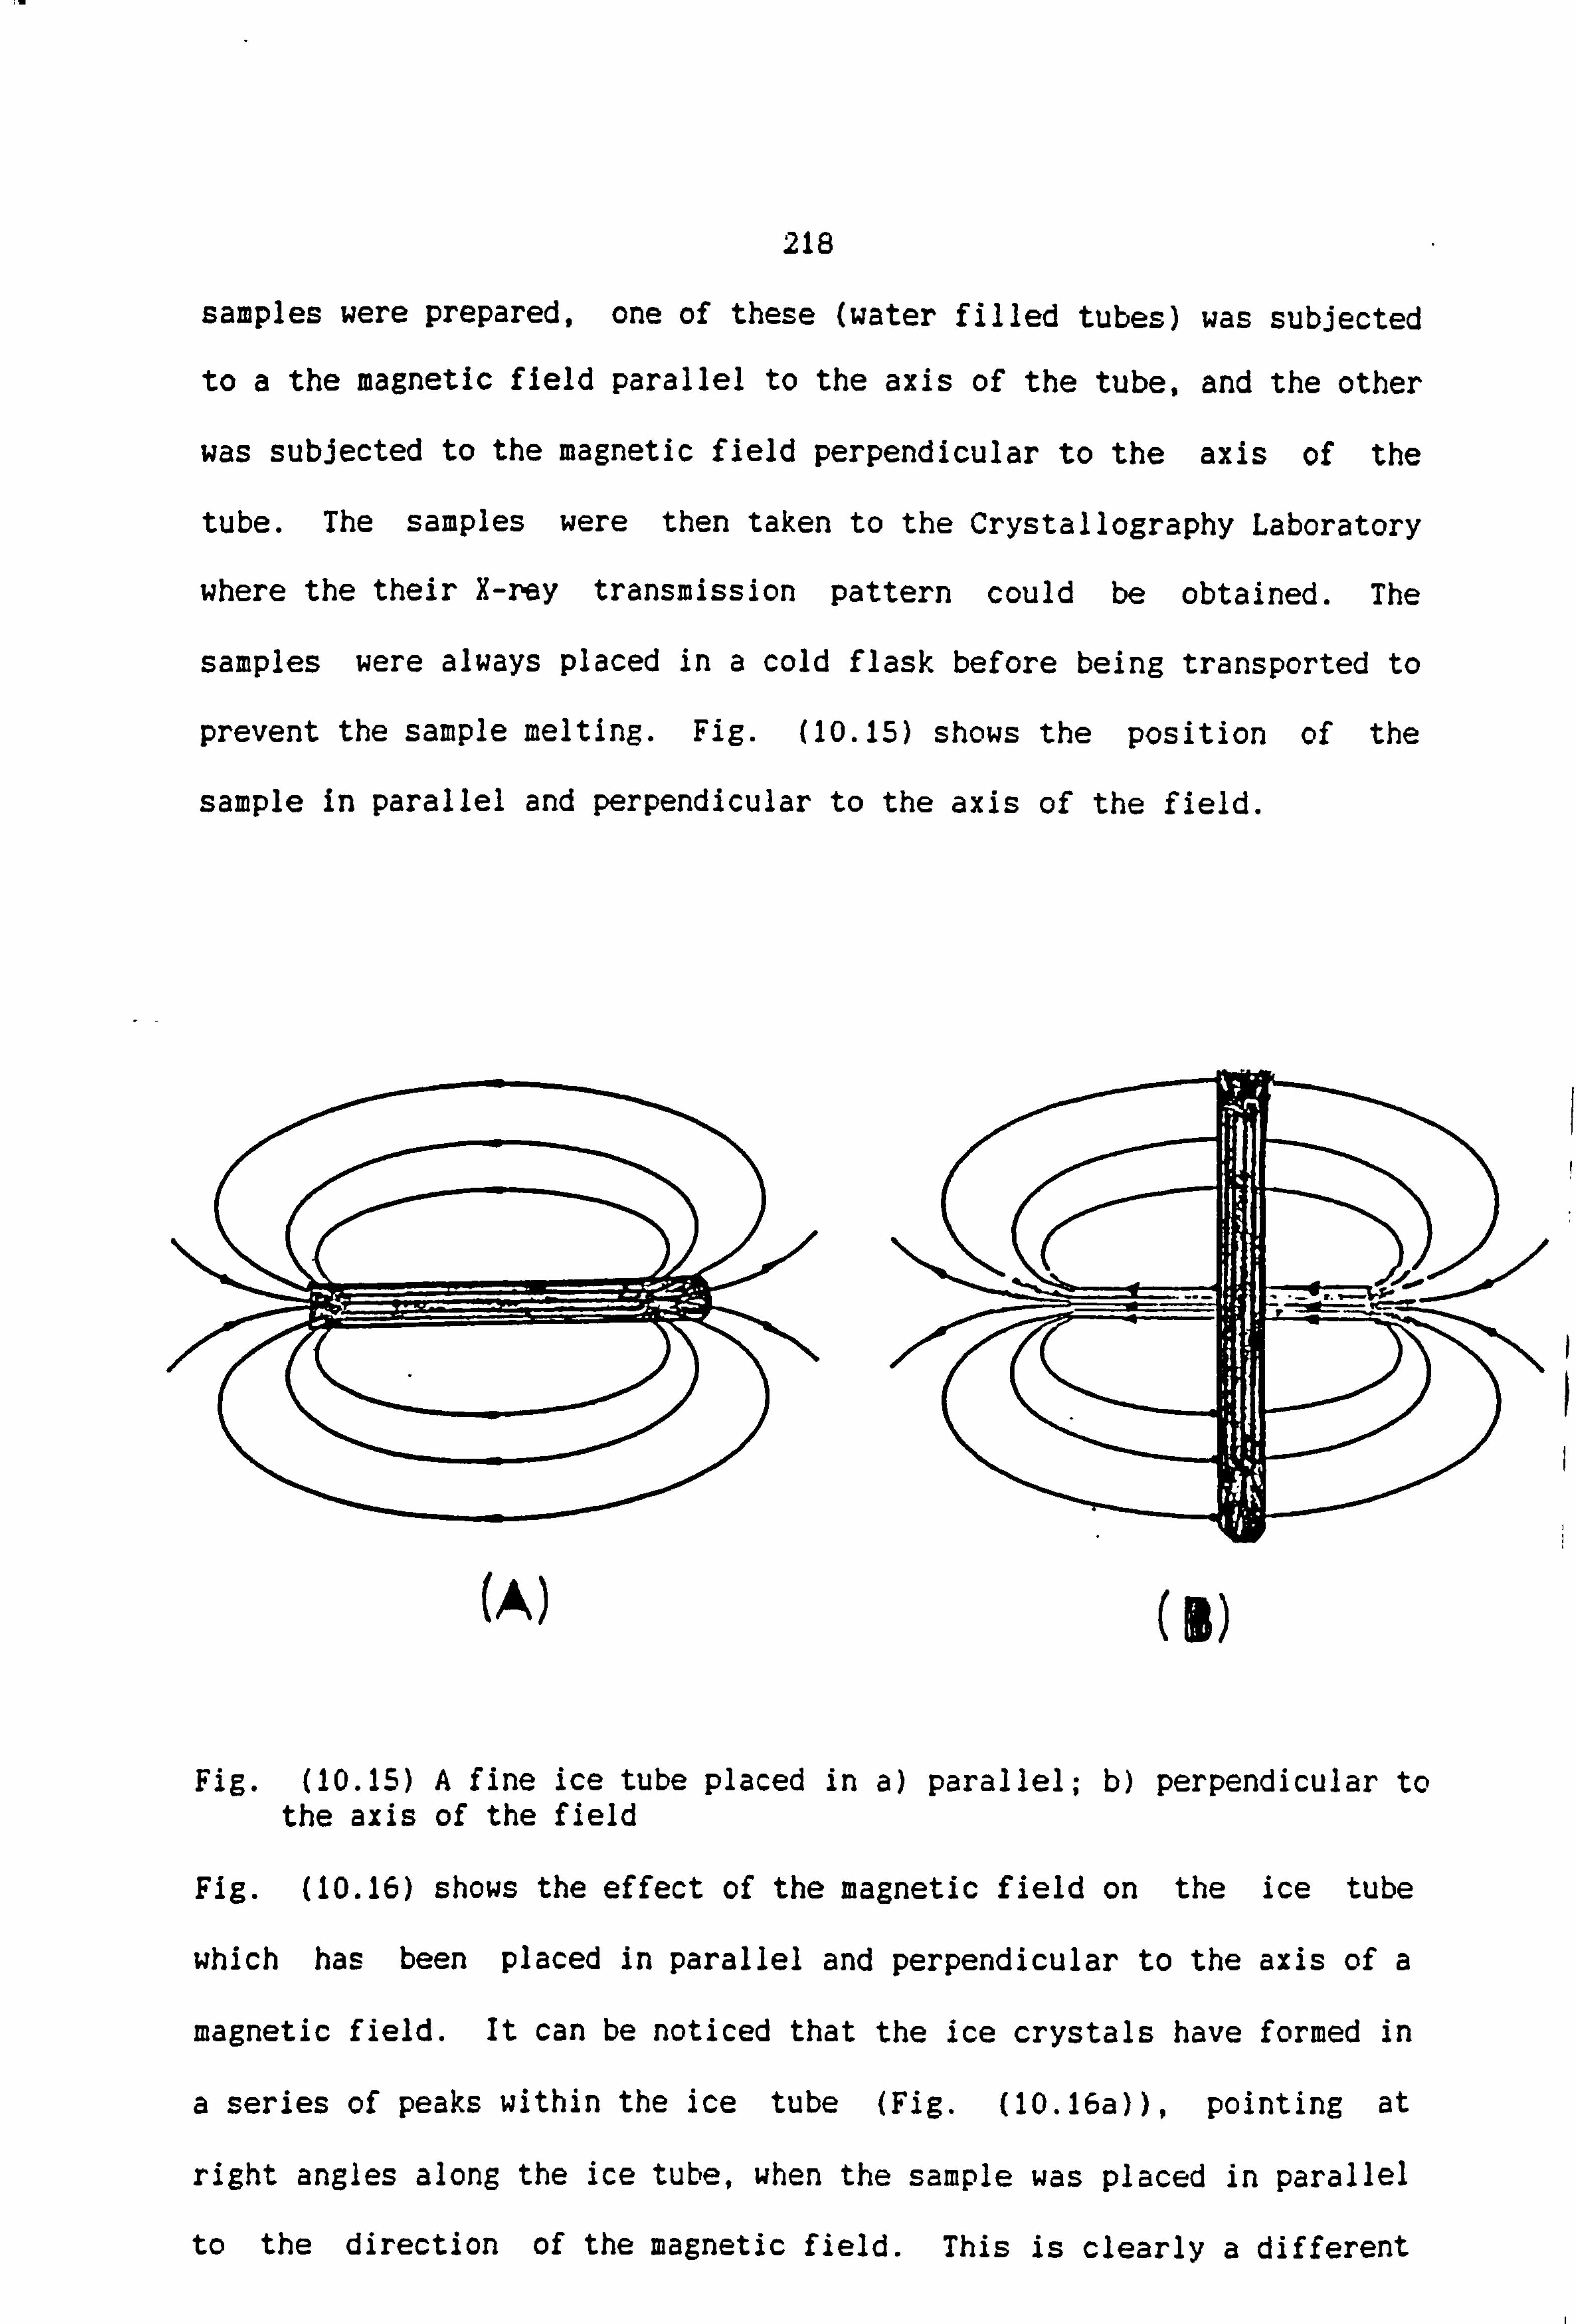
218
samples were prepared, one of these (water filled tubes) was subjected
to a the magnetic field parallel to the axis of the tube, and the other
was subjected to the magnetic field perpendicular to the axis of the
tube. The samples were then taken to the Crystallography Laboratory
where the their X-my transmission pattern could be obtained. The
samples were always placed in a cold flask before being transported to
prevent the sample melting. Fig. (10.15) shows the position of the
sample in parallel and perpendicular to the axis of the field.
(A) (3)
Fig. (10.15) A fine ice tube placed in a) parallel; b) perpendicular to the axis of the field
Fig. (10.16) shows the effect of the magnetic field on the ice tube
which has been placed in parallel and perpendicular to the axis of a
magnetic field. It can be noticed that the ice crystals have formed in
a series of peaks within the ice tube (Fig. (10.16a)), pointing at
right angles along the ice tube, when the sample was placed in parallel
to the direction of the magnetic field. This is clearly a different

219
picture compared to, the samplewhich had been placed in 'a,,
magnetic
field perpendicular to the direction of the field. (Fig. 10.16b)).
It would be possible to obtain the X-ray transmission pattern of the
sample if it could be kept in its solid state whilst being exposed to
X-rays.

Lirection cf magnetic fieid is aiong the axis of the tube. The crystais have been formed at right angies to tne direction of týlt- i; ý"ýý
I
L,,, bire,: tiori of magnetic f iei- T rie 3xis ý-, f Lhe tube ý
Fig. Tne effect of a magnetic fleid or, 1, -e tube crvstai-ý- The ice crvstals were made from clean water and the margetic field was
a) ir-, parallel . b) perpendicular ajong the axis of the ice tube.
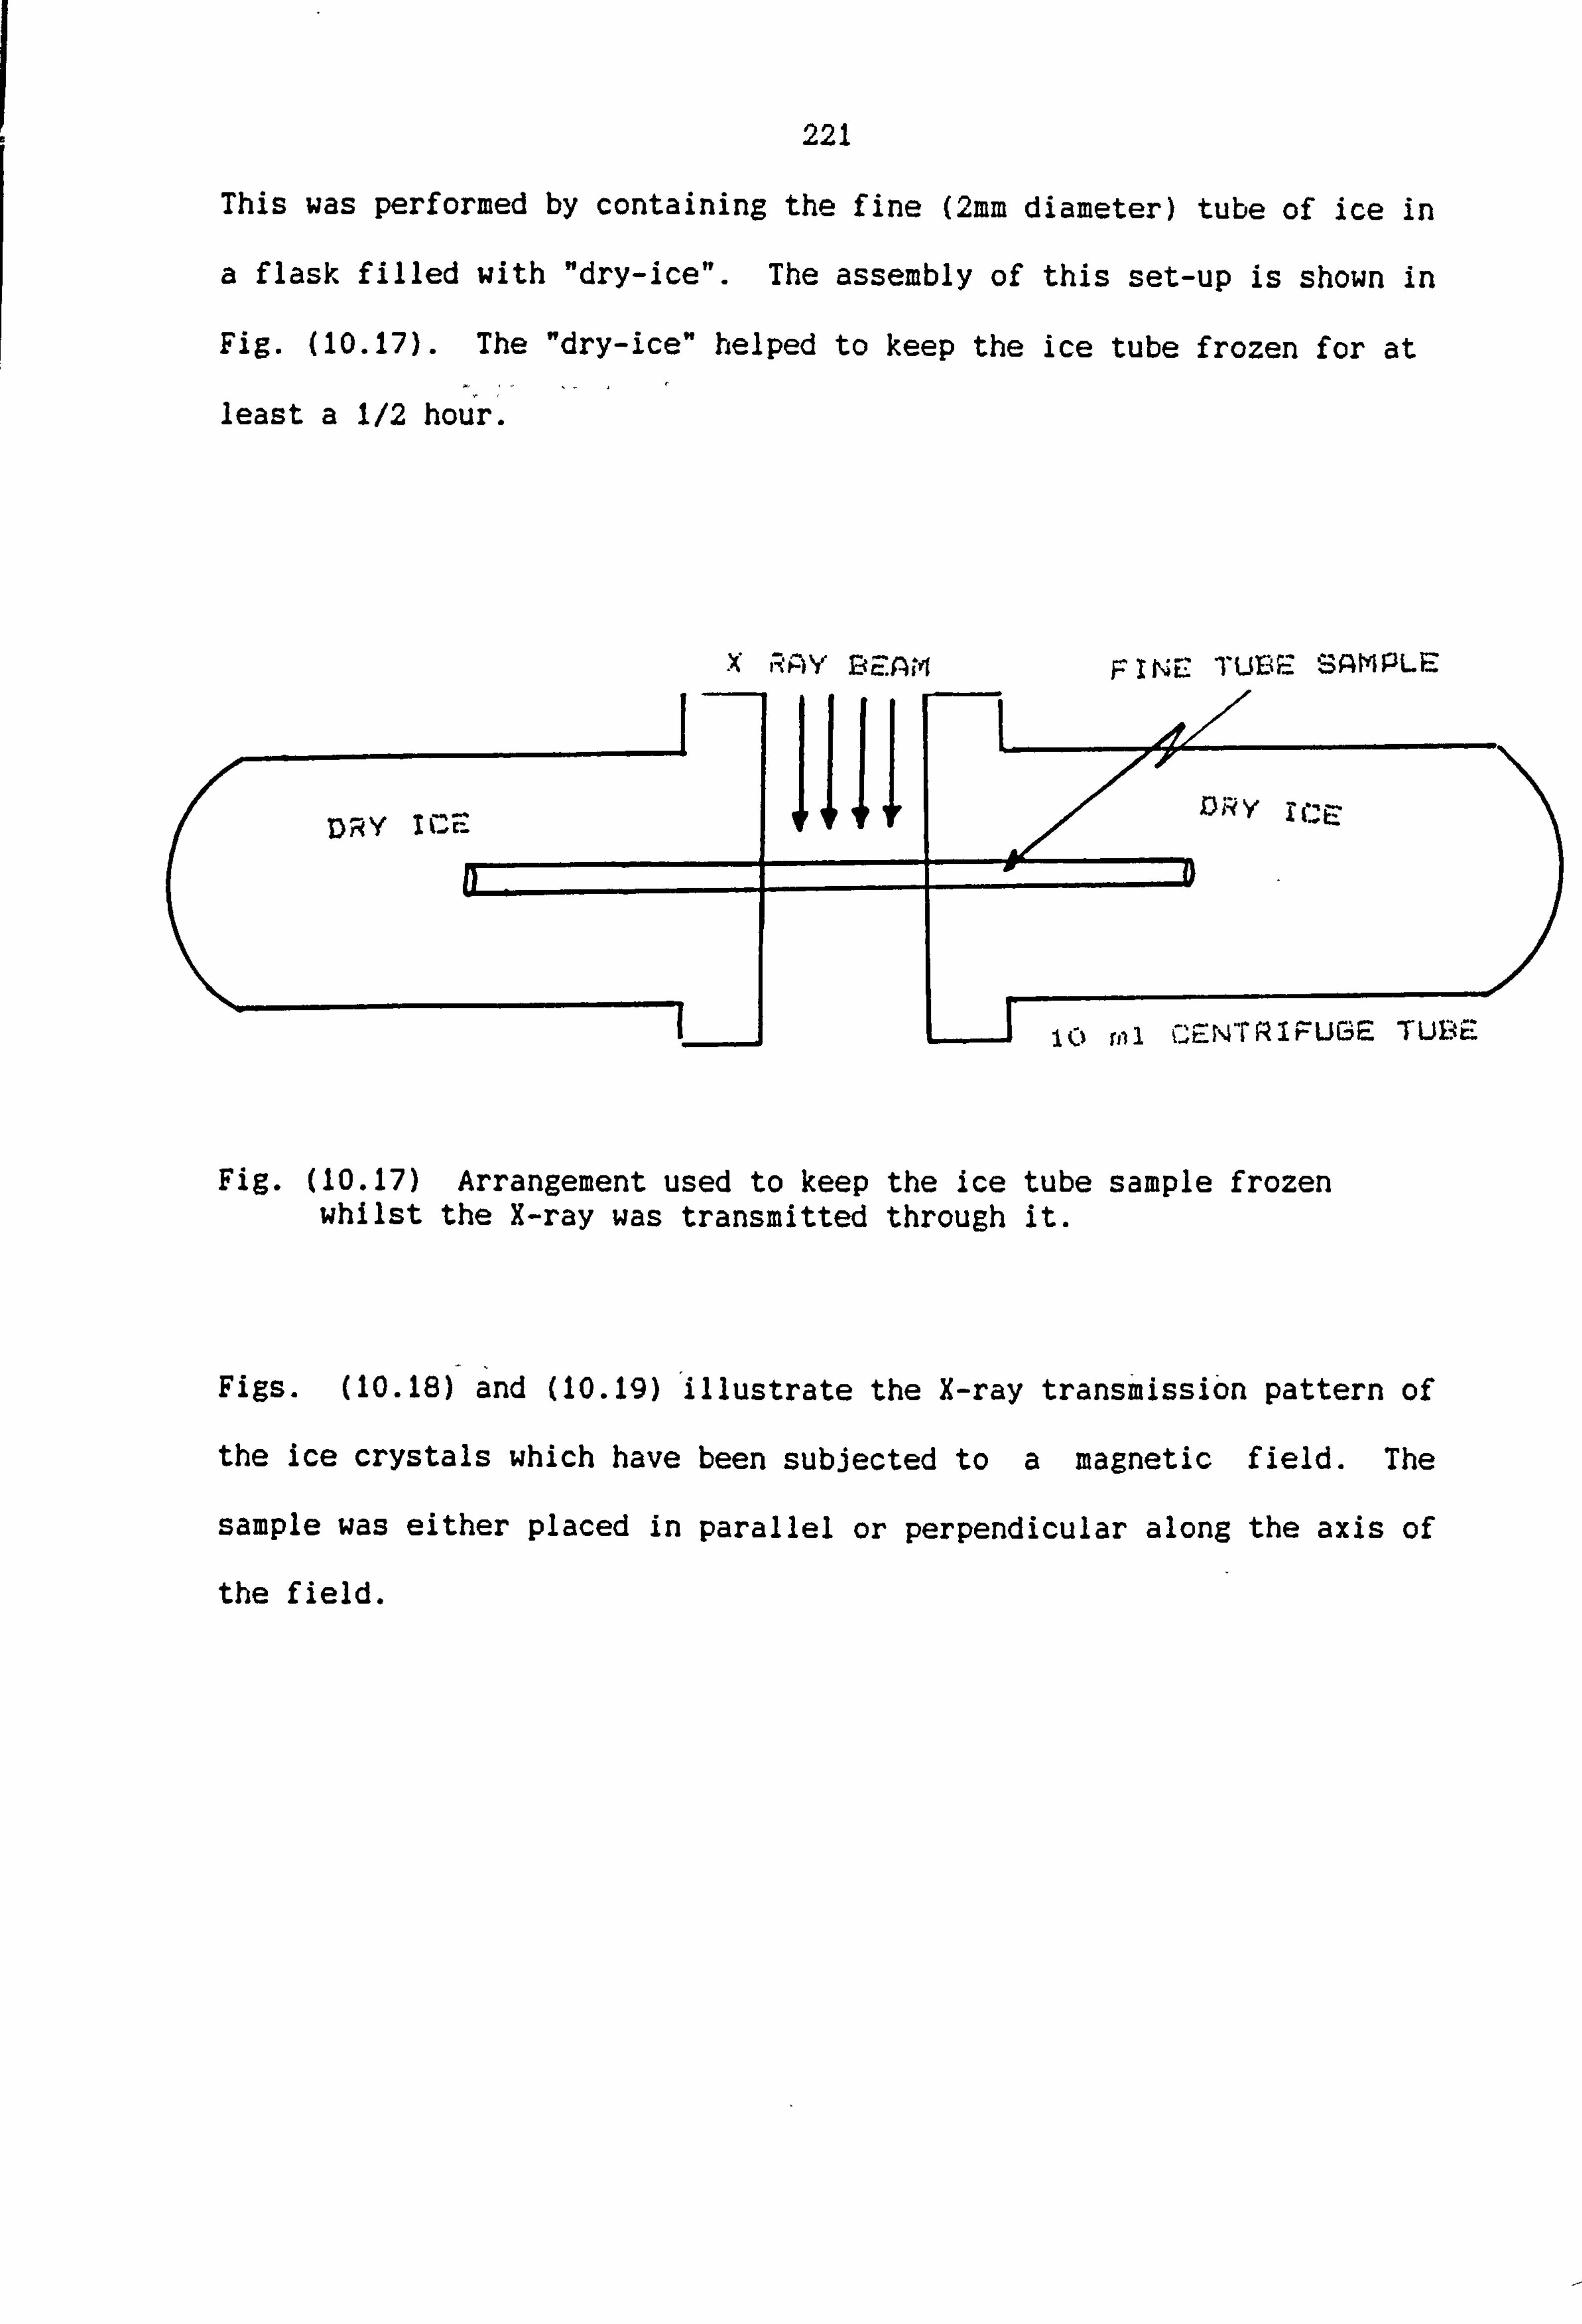
221
This was performed by containing the fine (2mm diameter) tube of ice in
a flask filled with "dry-ice". The assembly of this set-up is shown in
Fig. (10.17). The "dry-ice" helped to keep the ice tube frozen for at
least a 1/2 hour.
x RAY BEAM FINE: TUE'E' SAMPLE
DRY
10 mi CEN-rRIFUGE TU14E
Fig. (10.17) Arrangement used to keep the ice tube sample frozen whilst the X-ray was transmitted through it.
Figs. (10.18) and (10-19) illustrate the X-ray transmission pattern of
the ice crystals which have been subjected to a magnetic field. The
sample was either placed in parallel or perpendicular along the axis of
the field.

I Cý X-rav transmission of a --iear, water i, -e crystai has c-een exposed to a D. C. magnetic fieid in paraliel t(-. the axis of the ice crystai tube.
crvstal which has X-rav r-ransmission of a clear, wa-ier i. -, - I
ueen exposed Lo a magnetir- fieid aT- right angie t: Lhe axis -t trie lce- crvsTai tube.

223
The patterns of Fig. (10.16) confirm that a magnetic field has an
effect on water if it changes their state whilst the field exists. No
such effect could be obtained if the field was absent. The X-ray
pictures of Figs. (10-18) and (10-19) clearly show that the direction
of the magnetic field on the sample is an important factor in the
formation of X-ray patterns on photographic film. The direction of the
magnetic field on the sample can change or orient the position of
crystals in ice-crystals since they manifest different X-ray
transmission pictures.
10.5 Supercooling
When a liquid changes to a solid, it undergoes a change of state or
phase. A clean water will freeze sharply at O-C or below. While the
water is freezing, it is evolving its latent heat of fusion, which
compensates for the heat lost by cooling, and its temperature does not
fall.
The water samples used in this research was double-de-ionized distilled
water which was pre-prepared in the Chemistry Department. This water
is as free as was possible from impurities and had also very low
conductivity (0.5 x 10⁻¹ 0 /m).
An experiment was performed to determine the lowest degree of
supercooling of the prepared pure clean water before its freezing.
The water was frozen in the freezer with therocouple inserted into the
liquid.
I The temperature was measured by a digital (co-marked) thermometer. It

224
was also connected to a plotter (PM 8231 Phillips) so a chart graph
record could be obtained of the temperature data as a function of time.
Graph (10.5) shows the results of cooling of the pure clean water in
a) presence
b) absence; of a magnetic field.
Graph (10.5) shows that the water has been cooled to about -7 to -9-C
before it is frozen.
This cooling of a liquid below its normal freezing point is called
supercooling.
Graph (10.5) shows the chart record of the supercooling of the clean
water.
It is interesting to note that once the water changed it's state or
phase from a supercooled liquid to ice, the temperature increased by a
few (3-4) degrees.
This experiment was repeated 8 times or more and the results are shown
in Graph (10.5).
The results in Graph (10.5) do not show any significant differences in
supercooling of the clean water between the magnetic field exposed
sample and the water which had not been exposed to the magnetic field.
In order to summarise the information regarding the observations

225
Fre zinng point of double steralized de-ionized water
CD --1 12) rt
(D
a CD
CD CD
C-) (D
n
0
I CD
I cn
I -th,
I FIL)
0
4-
G-)
rn U) m C: )
m > Zc Ti
CD rn u3 C) Ln 0 M r- Z -i U)
u CD rn
> :D Zc -< X
:K CD > --n
mn -1 r-
M c-) >
--n Z
1-1 : 2: m> r- ---i 13 m
:u
ý--i z

226
r- w 4-T CY) -
rn
...... ........
D...
ril x
"A' 2.7
recorded, the mean and S. D. freeze points have been determined.
This is represented by an "*" in Graph (10.5). Unfortunately they do
not tell us anything about the dispersion of the values around the
central value.
We therefore need a measure to indicate the spread of the values about I
the mean.
The standard deviation from the mean is used widely in statistics to
indicate the degree of dispersion. It takes into account the deviation
of every value from the mean and for our experiment has been found as
follows:
Standard deviation of supercooling of magnetic field treated water (Cr M. F. J= 0-83
Standard deviation of supercooling of untreated water which had not
been exposed to any magnetic field [C-j = 0.78
228
10.6 Discussion
In recent times-progress has been made in the investigation of the
effects of magnetic fields on water. Dielectrophoresis experiments
indicate that a magnetic field can affect biological systems (7,10
11). The result of dielectrophoresis experiments on live cell
suspensions have shown anomalies in the region of 2 kHz. The proton
magnetic resonance in a geomagnetic field of 0.7 gauss (70 PT) is 2.8
kHz. Effects have also been observed at the electric spin resonance
frequency and for the frequencies corresponding to the magnetic
movements of the isotopes 31p, 23Na, 39cl and 39K [7]. Because
dielectrophoresis experiments readily. show up differences between the
dielectric properties of the particle and the suspending medium, the
effects were easy to investigate initially using this technique.
However, the measured magnetic field dependency of the dielectric
properties of water showed that there is a drop in capacitance and loss
of (spring) water as the proton magnetic field and frequency satisfy
proton NMR conditions.
Experiments have shown that the dielectric properties of water can also
be changed at other frequencies by exposing water to specific
frequencies of magnetic field The same general pattern of symptoms
trapped by electric and magnetic fields is likely to be responsible for
the reaction of some patients to magnetic fields (8]. Smith et al (8]
ha. Vesome patients who are hyperallergic to certain chemicals, and also
to field-treated water and have subjected that could be due to some
resonance structure set up in water. Del Giudice et al [121 have
considered quantisation of the electric dipoles of the water molecules
and the electromagnetic radiation field.

229
In the course of the experiment described in this section relating to
the effect of a magnetic field on a solid state of water (ice) is
observed. The effects described here are based on the information
obtained either by looking through a light microscope (when the
experimental effects of A. C. and D. C magnetic fields on Nacl dissolved
water (brine water)), or X-ray diffraction and transmission patterns of
double de-ionized distilled water. Section 10.3 of this chapter shows
clearly how the dissolved Nacl in a water solution can be aligned in a
uniform manner at an angle to the direction of the magnetic field.
This may be due to the force exerted by water molecules. A change in
frequency of A. C. magnetic fields can orient (section 10.3.4. ) the
crystals in a different direction. Any increase in the strength of a
magnetic field would increase the density alignment of the crystals'but
an increase in temperature of crystallization and magnetic field
exposure time did not show any change in the effect. There are
particularly interesting X-ray diffraction patterns of the materials
which, are wet or have absorbed water. A qualitative survey, carried
out by Rosalind et al [131, has been made of the types of X-ray diagram
given by specimens of sodium thymonucleate (dry NaDNA) at different
humidities. The diagrams show that the structure will have different
X-ray patterns to the different humidities. Section 10.4 of this
chapter has investigated the effect of magnetic fields on ice crystals.
The X-ray diffraction pattern of clean water which has not been exposed
to a magnetic field (control) was made of multi broken rings. This
diffraction pattern was varied as soon as the water was exposed to a
D. C. magnetic field (overnight). The sample's diffraction pattern was
made up of multi cross lines. Fig. (10.12 shows a six-fold symmetry of
clean water which had been exposed to a D. C. magnetic field. In 1985
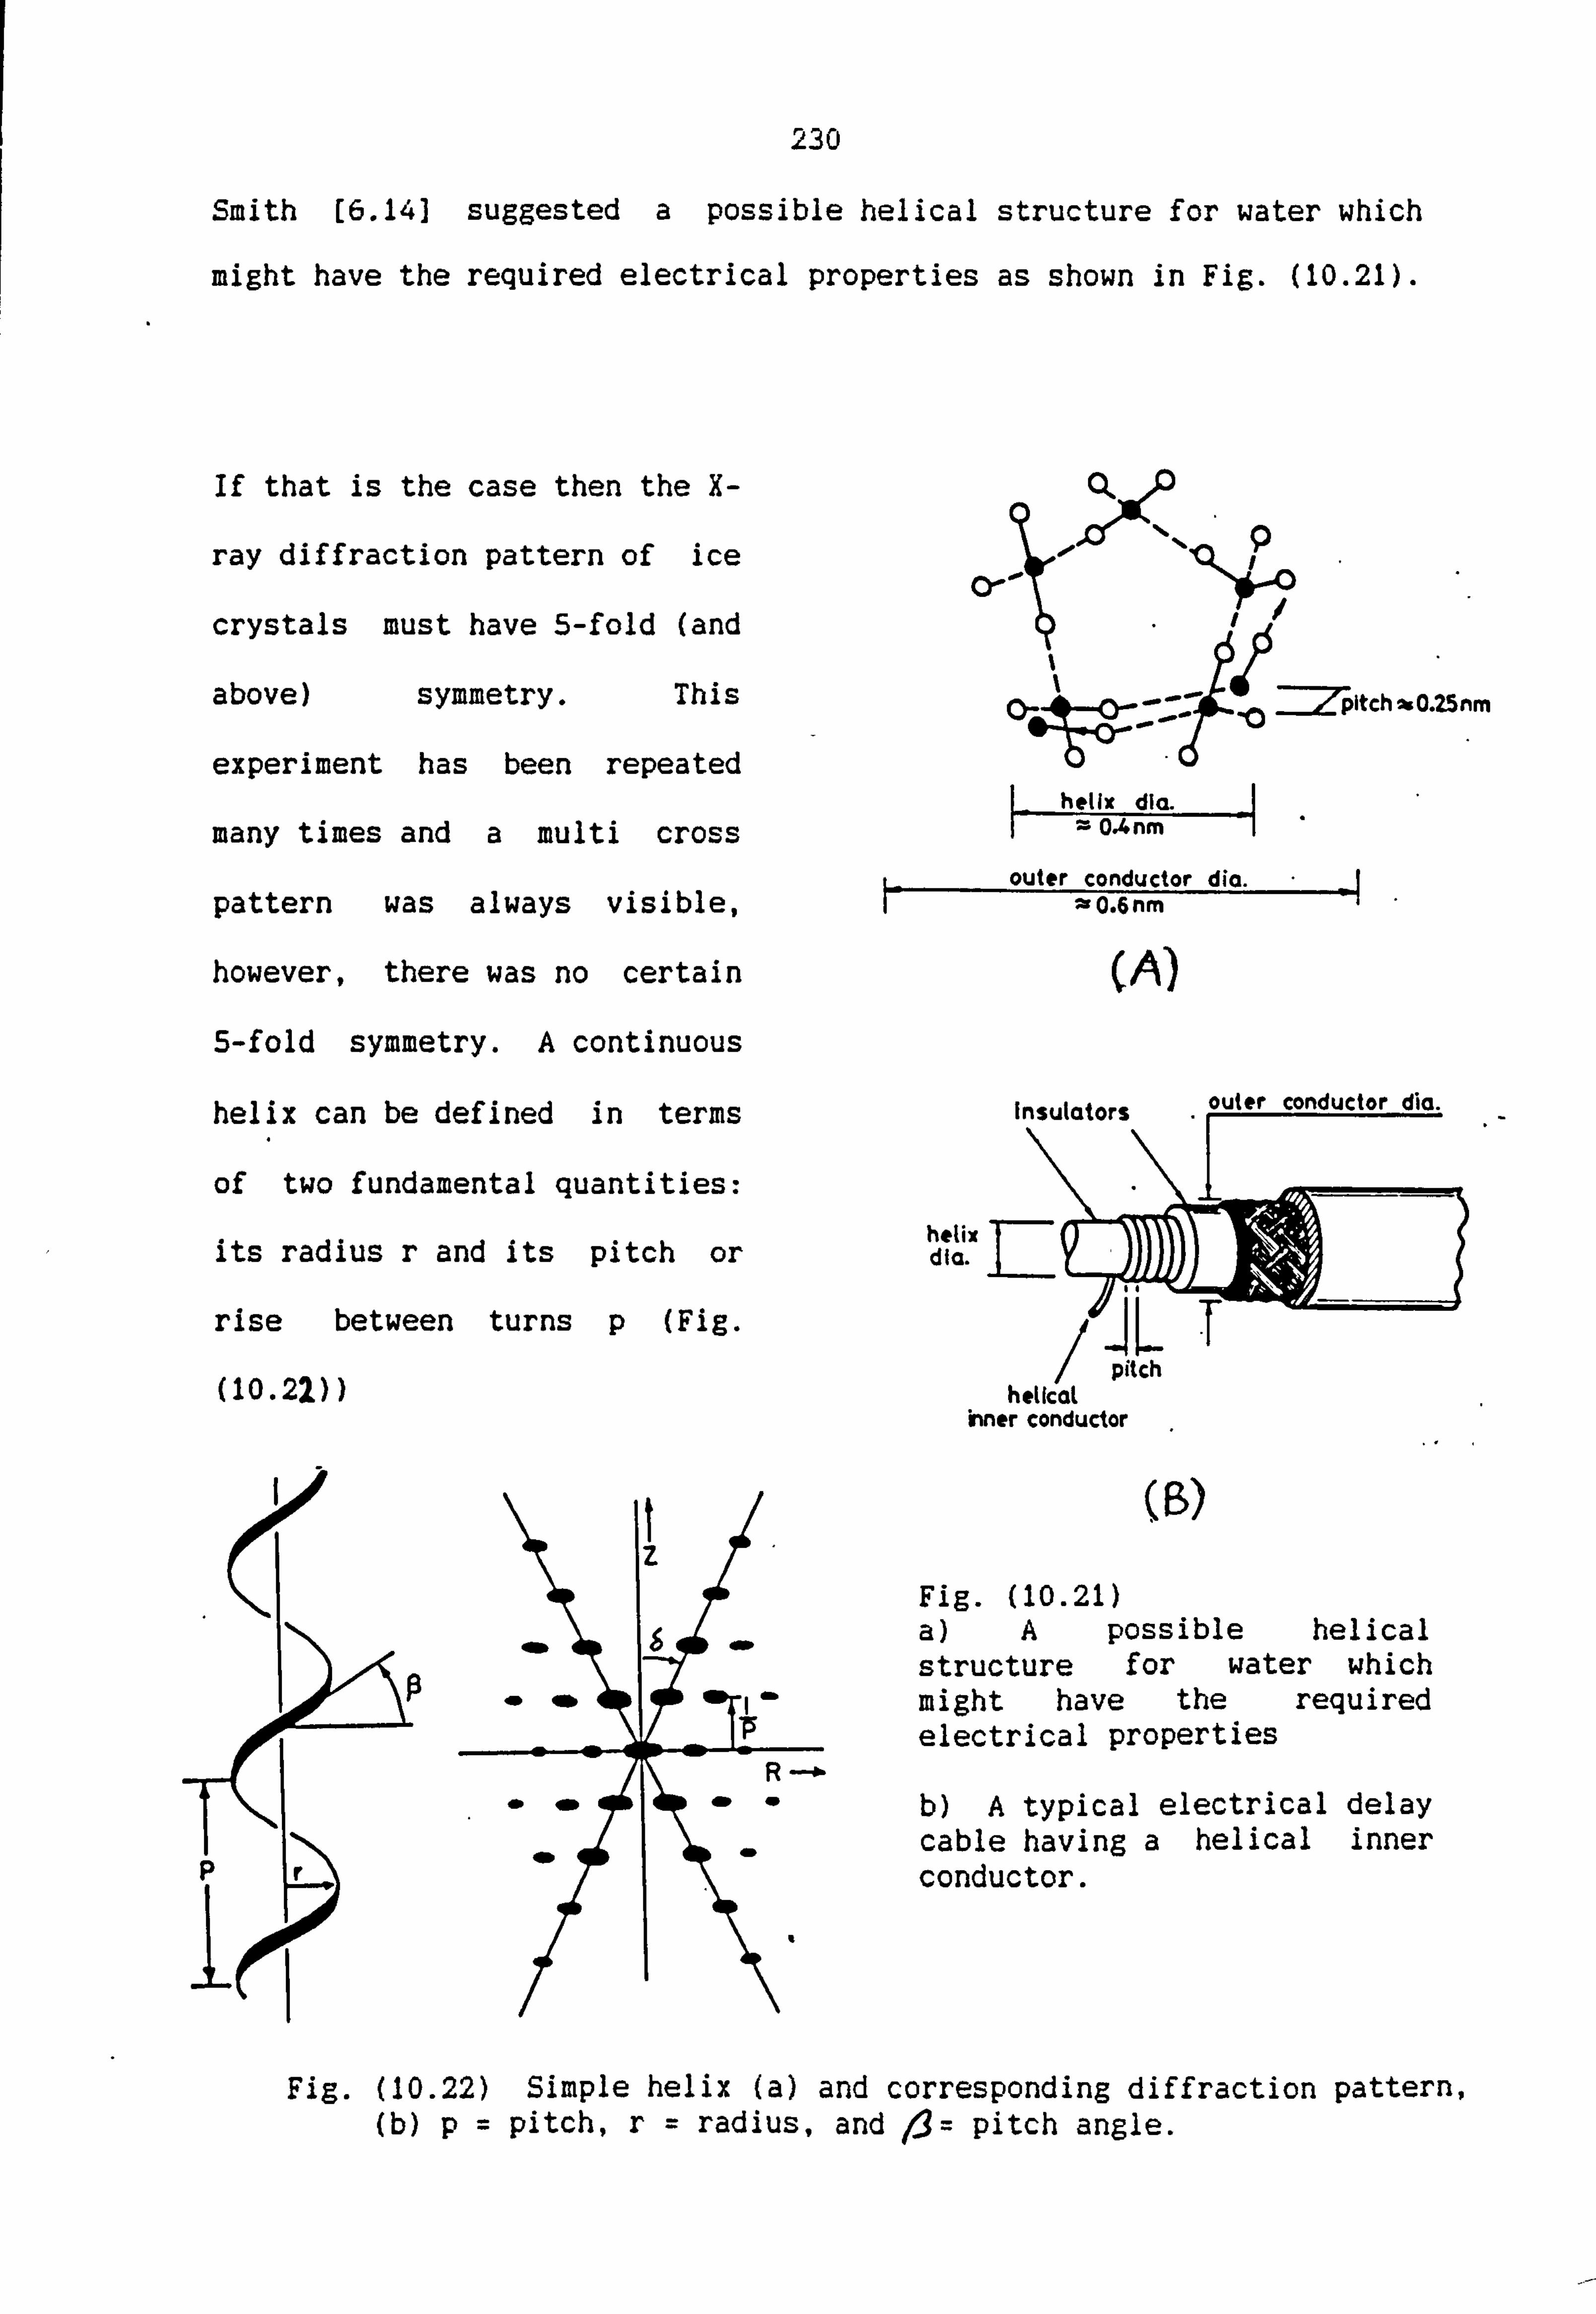
230
Smith (6.141 suggested a possible helical structure for water which
might have the required electrical properties as shown in Fig. (10.21).
If that is the case then the X-
ray diffraction pattern of ice
crystals must have 5-fold (and
above) symmetry. This
experiment has been repeated
many times and a multi cross
pattern was always visible,
however, there was no certain
5-fold symmetry. A continuous
helix can be defined in terms
of two fundamental quantities:
its radius r and its pitch or
rise between turns p (Fig.
(10.22))
_Zpltch ft 0.25 nm
helix dia. = 0.4nm
outer conductor dia. =0.6nm
(A)
Insulators
helix d1a.
"I'd
L pitch heilcal
inner conductor
(6) Fig. (10-21) a) A possible helical structure for water which might have the required electrical properties
b) A typical electrical delay cable having a helical inner conductor.
Fig. (10.22) Simple helix (a) and corresponding diffraction pattern, (b) p= pitch, r= radius, and 4= pitch angle.

With a true axial repeat of p, the diffraction patterns will be
confined to layers of z= O/P L being any positive or negative integer
or zero.
According to Amoros et al [141 conventional Laue photographs taken with
a flat photographic film perpendicular to the X-ray beam give direct
information about the Friedd symmetry of that direction. The entire
symmetry of the X-ray beam direction is seen as its projection on the
perpendicular photographic film. The symmetry of the photograph is
usually obvious.
Thus, we see from Figure (10.13) a clear 6-fold symmetry, and from
Figure (10-12) less clear fold symmetries. This is sufficient to
decide against the pentagonal helical model and in favour of the
dodecahedron model as proposed by Smith Figure Both provide
the necessary solenoidal symmetry for coupling to a magnetic field.
The latter is also the geometry which would result from cavitation ir,
water (Smith, unpublished).
Figure L prepared bv ý-'. W. Smith)
REFERENCES
1) JHON, M. S. "Physico-chemical Approaches to the role of water in modern diseases such as Cancer, Diabetes and AIDS". Speculation Sci. Technol., 1987,10(3), p. 185.
2) FENWICK, P. and HOPKINS, R. "An examination of the effect of healing on water", PhD. Thesis, JSPR 92542,1987, Israel.
3) HAYASHI, H., JHON, M. S., LOWDIN, P. O. "Some remarks on certain magnetic properties of water in the study of cancer. Int. J. Quant., 1987,514, p. 14.
4) POHL, H. A. "Natural electrical RF oscillation from cells". Journal of Bioenergetics and Biomembranes, 1981,13, p. 314.
5) FROHLICH, H. "Coherent Excitation in Active Biological Systems". Modern Biochemistry, Plenum: London, U. K., 1985.
6) SMITH, C. W. "Water Friend or Foe? ". Laboratory Practice, 1985, L4(10), p. 29.
7) JAFFARY-ASL, A. H., SOLANKI, S. N., AARHOLT, E., SMITH, C. W. "Dielectric Measurements on Live Biological Materials Under Magnetic Resonance Conditions". Journal of Biological Physics, 1983,11, p. 15.
8) SMITH, C. W., CHOY, R., MONRO, J. A. "Man and His Environment in Health and Disease". Proc. 3rd Int. Symp., Dallas, Texas, February 21-24,1985.
9) WILLIAMS, H., SABARTH, E. "In vitro Demonstration of Homeopathic Effects", in Proc. 42nd Cong. Int. Homeopathic Med. League. Arlington, Am. Inst. Homeopathy, Washington DC, 29 Mar-2 Apr., 1987.
10) JABERANSARI, M. "Dielectrophoresis, Electrodyanmic and Magnetic Resonance Phenomena, MSc. Thesis, Salford University, 1985.
11) POHL, H. Conf. on Organic and Biological Semiconductors, University of Nottingham, 23-25 Sept., 1980.
12) GIUDICE, E. G., PREPARATA, G., VITIELLO, G. "Water as a free dielectric dipole laser". Physical Review Letters, 1988,6(g), P. 1085.
13) ROSALIND, B. FRAAý4( Al- and GOSLING, G. "The structure of sodium thymonvitreate fibres. I. The influence of water content". Acta Crystallographic, 1953,6, p. 673.
14) AMOROS, J. L., BUERGEMM. J. and De AMOROS, M. C. "The Lave Method", London: Academic, 1975.
15) LUDWIG, W. Translation: "Biophysical opinion". Biophysikalisches Labor Diplomphysiker 21,1988, D7240 Horb a N. 1.

CONCLUSION

232
CONCLUSION
Previous work concerned with dielectric measurements on water and
dielectrophoresis measurements on pearl-chain formations of yeast cells
(Saccharomyces cerevisiae), showed anomalies when the ambient magnetic
field satisfied specific resonance conditions.
The present thesis has described measurements of a cellular-spin-
resonance (CSR) in Saccharomyces cerevisiae and Leishmania major. cells.
The evidence that living cells naturally produce oscillating electric
fields in the r. f. region is by now quite strong, and proceeds from a
variety of experimental evidence. A spectrum of cell rotation speeds
of lone cells with different values of the applied frequency shows the
existence of two frequency regions where cellular-spin-resonance
occurs. These regions are at 3 kHz and 70 kHz respectively. This
experiment predicted a square law dependence of the rotation rate of
the lone cells upon the field strength above 20 kHz, however, for
frequencies below 20 kHz the rotation rate of the lone cells is found
to be linearly dependent on the field strength.
The use of vacuum sputtered thin film metal electrodes allows lone
cells to be studied more accurately by using a short working distance
objective lens on the microscope. The linear oscillatory motion of
lone cells observed at low (sub-Hertz) frequencies implies that there
must also be some surface charge phenomena involved. The effect is by
way of being electrophoretic, but the collection mechanism of the
surface charge may be dielectrophoretic.
Work has been described relating to the Leishmaniae parasite cells
which, normally grow only when they are attached to the gut of a living
sandfly. During the investigations, the attachment of Leishmania major
233
cells to scratches made in polystyrene petri dishes, both with a metal
stylus and with a diamond stylus were equally effective in causing a
localised attachment of parasites to the scratches. The use of a
diamond stylus eliminated the possibility of surface contamination with
ý metal and consequent chemical or ioni c effect. The treatment of
polystyrene petri-dishes by electron beam bombardment was found to
facilitate the attachment of the parasite cells "in vitro", over the
whole area bombarded, thus facilitating their culture. It also became
clear that the parasite cells have a preference for a negatively
charged surface.
The most effective electron dose range for promoting the attachment of
Leishmania major cells to a polystyrene substrate was found to be in
the range 1017 --- ) O. SxIO20 electron/m2. In this charge density range
the parasite's flagellum became modified into an attachment organ as
occurs naturally in its sandfly host. Hence there is often expanding
of its membrane to increase the area of cell-substrate contact
presumably to fasciliate adhesion and nutrition. Treatment of the
substrate with positive ion beams did not result in any case of
attachment of the parasites.
By way of preliminary experiments into the role of water in the
electrical phenomena investigated, ice crystals were formed by the
freezing of supercool water in the presence of a magnetic field. The
resulting ice crystals were always asymmetric relative to the magnetic
field direction. X-ray diffraction photographs of these ice crystals
showed distinct patterns of spots if the water used was double
distilled, otherwise ring-like powder diffraction patterns were
obtained. Possible interpretations of these patterns have been
discussed. The author believes this line of investigation warrants
234
more research; the application of more up-to-date X-ray equipment and
computerised analysis is vital. This experimentýshould be extended to
cover the wide range alternating magnetic field known to have
biological effects.

4NDIC. L- S

235
APPENDIX 1 Savouraud Dextose Agar
Sabouraud dextrose agar (Oxoid Ltd)
Oxoid code powder CM41
FormuLa
Grams per Litre
mycoLogicaL peptone (oxoid L40) ................ in
dextrose ....................................... 40
agar no. l(oxoid L11) .......... o ......... o ...... 15
pH 5.6(approx. )
Description
This modification of Sabouraud agar was made by CarLier in
1948. It is intended for the cuLtivation and differentiation
of fungi. The medium is often used with antibiotics for the
isoLation of pathogen ic fungi from materiaL containi ng Large
number of other fungi or bacteria.
Directions i
Suspend 65 g powder in 1 Litre of distiLLed water. Bring to
the boiL to disoLve compLeteLy. SterLize by autocLavinq at
121 0C for 15 minutes.
Sabouraud Liquid atedium
Oxoid code powder CM147

236
FormuLa
Grams per Litre
pancreatic digest of casein (oxoid L42) 5
peptic digest of fresh meat (oxoid L49) ..... 5
"'dextrose .................................... 20
pH 5.7(approx. )
De sc ri pt ion
Sabouraud Liquid medium is a myoLogicaL steriLity test medium
conforming -with the requirements for. the medium described in
the United States Pharmacopia (1965) for the determination of
pharmaceuticaL products in order t0 avoid faLse steri Li ty
tests. The medium may aLso be recommended for the cuLtivation
of mouLds, yeast, and acidophiLic bacteria.
Directions
Add 30 g powder in 1 Litre of distiLLed water. mix weLL,
distribute into finaL container and steriLize by autocLaving at
121 0C for 15 minutes.
I
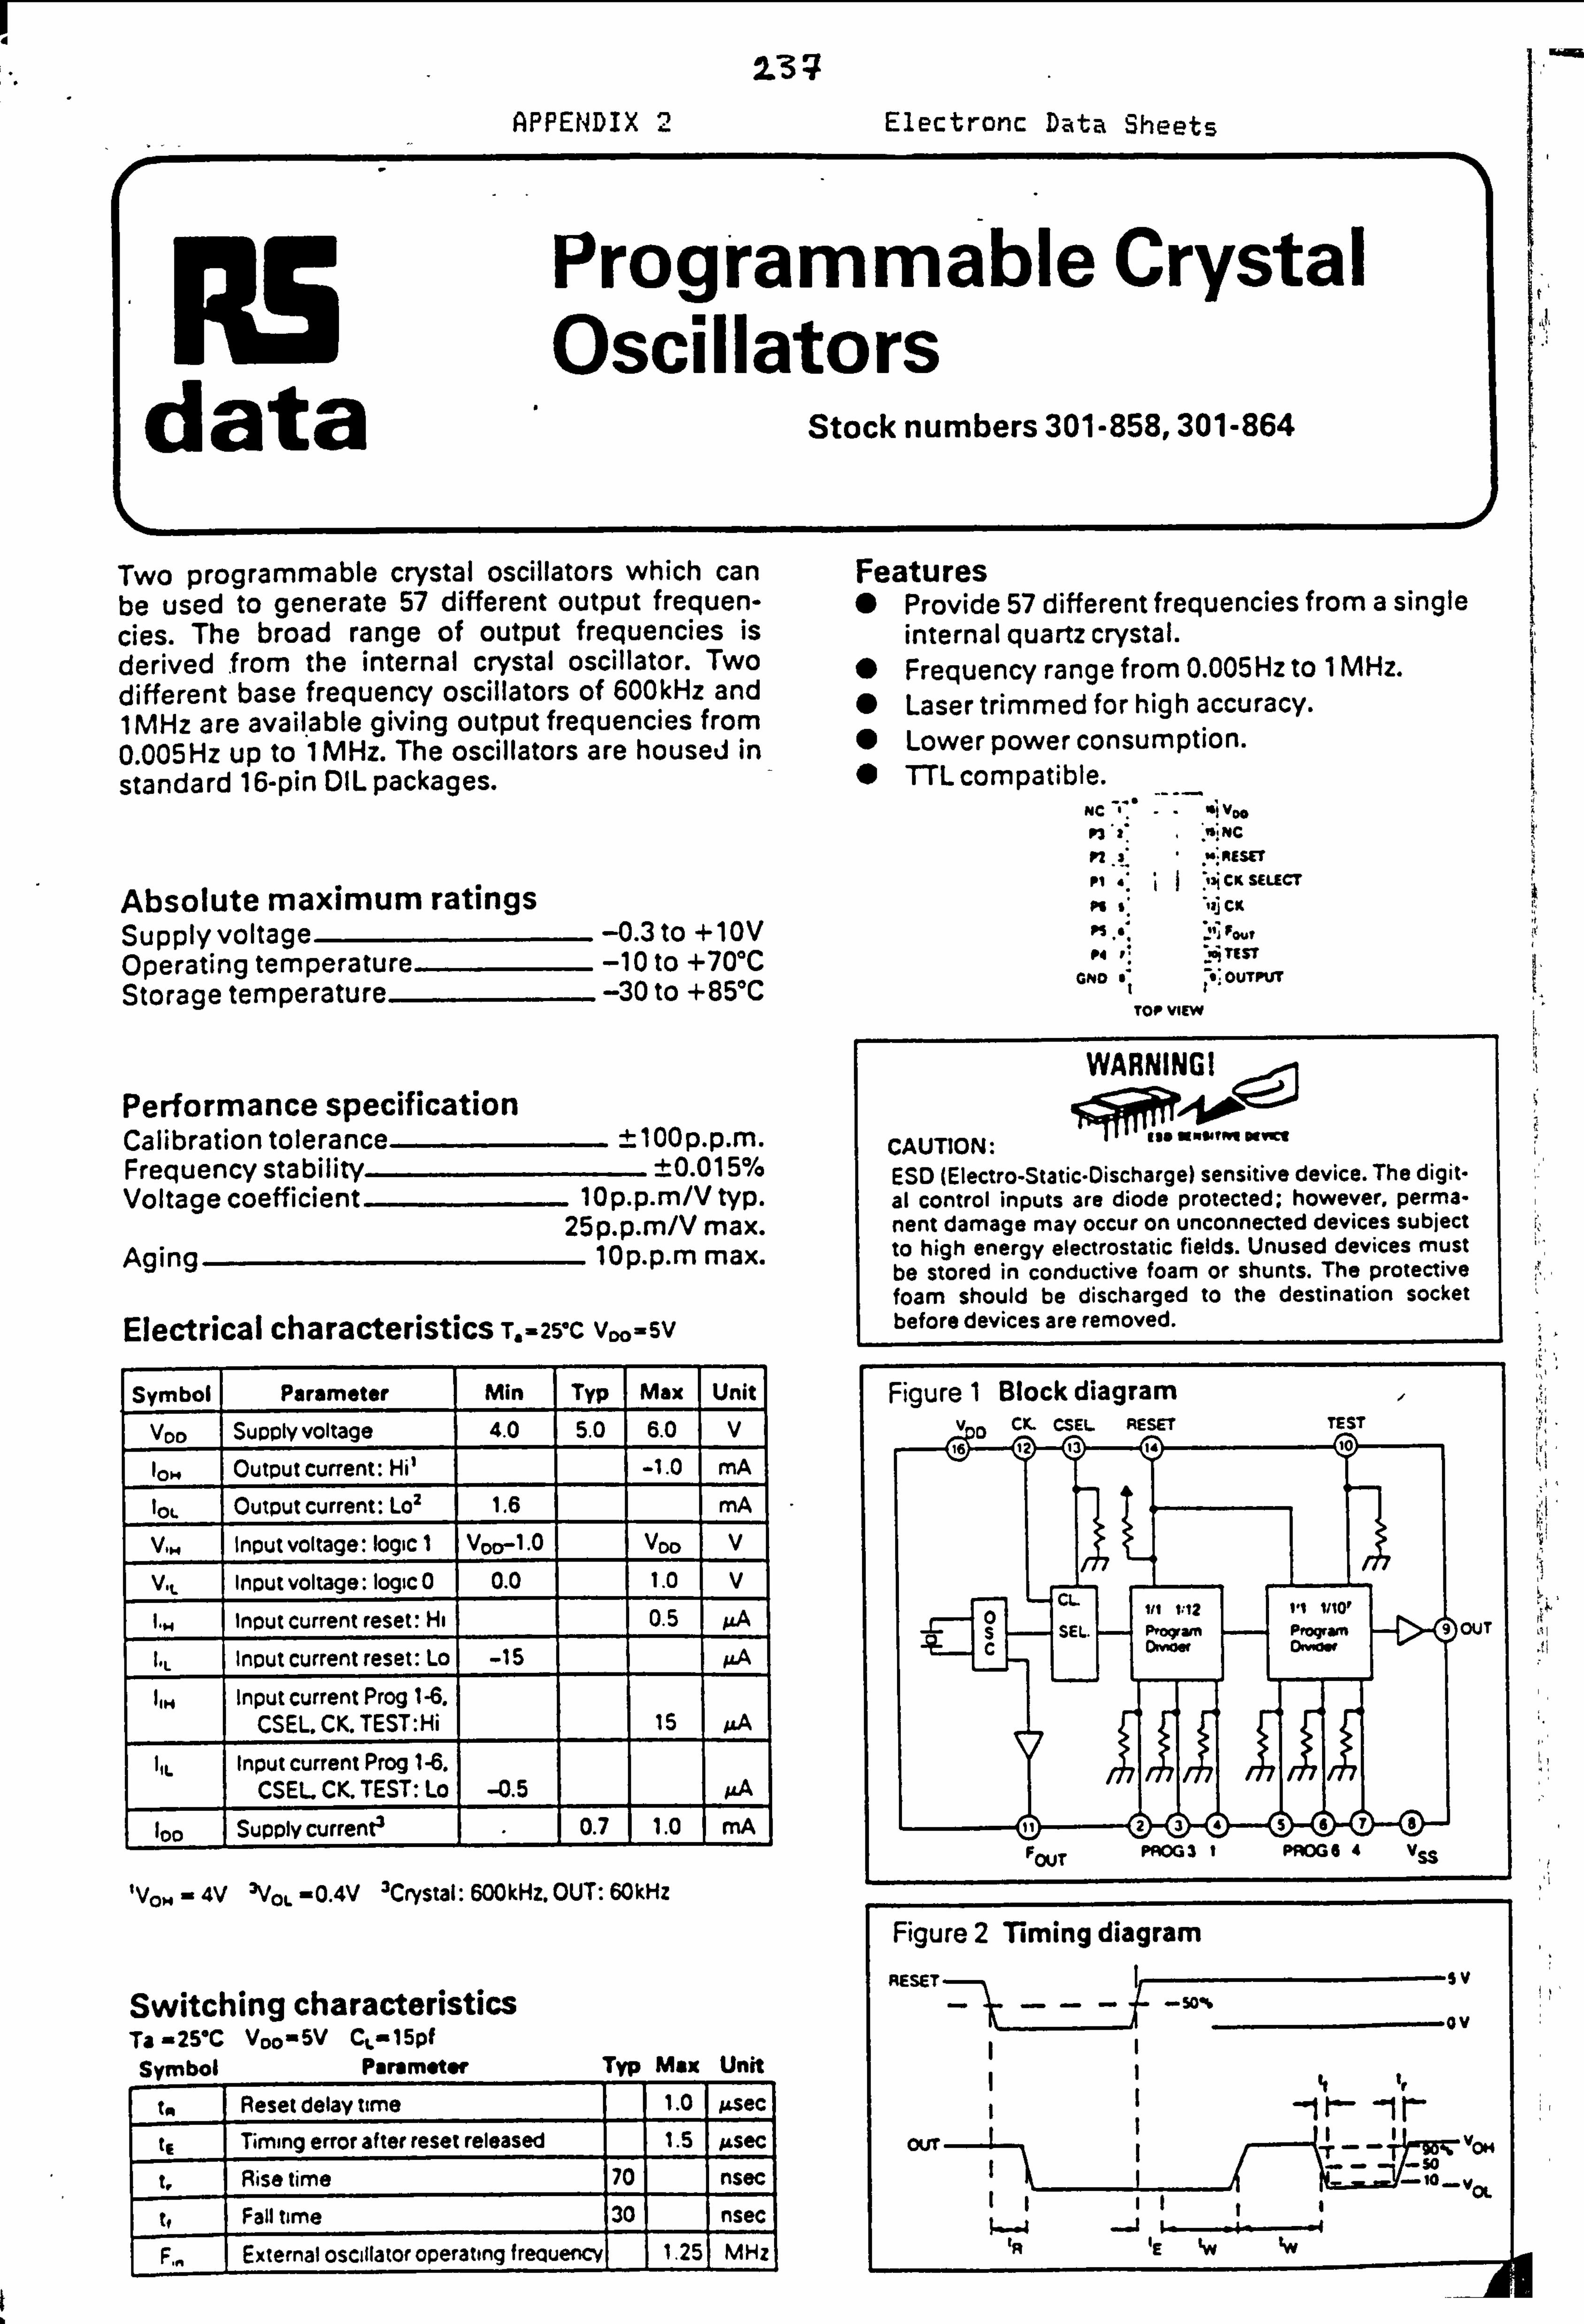
137 Electronc Data Sheets APPENDIX 2
RS
data
Programmable Crystal Oscillators
Stock numbers 301-858,301-864
Two programmable crystal oscillators which can be used to generate 57 different output frequen- cies. The broad range of output frequencies is derived from the internal crystal oscillator. Two different base frequency oscillators of 600kHz and 1 MHz are avail , able giving output frequencies from 0.005Hz up to 1 MHz. The oscillators are housed in standard 16-pin DIL packages.
Absolute maximum ratings Supplyvoltage -0.3 to +1 OV Operating temperature -10 to +70"C Storage temperature -30 to +85"C
Performance specification Calibration tolerance ±100P. P. M. Frequency stability ±0.015% Voltage coefficient lop. P. M/Vtyp.
25p. p. m/V max. Aging 10p. p. m max.
Electrical characteriStiCS T. -25*C Vc*-SV
Symbol Parameter Min Typ Max Unit
VDD Supplyvoltage 4.0 5.0 6.0 V
10, Output current: Hi' -1.0 mA
lot. Output current: Lo2 1.6 mA
V. H Input voltage: logic I VCio-I .0
V00 V
V. 1- input voltage: logic 0 0.0 1.0 V
1.14 Input current reset: Hi 0.5 ; LA
I'L Input current reset: Lo -15 pA IIH input current Prog 1-6.
CSEL. CK. TEST: Hi 15 IA
111. input current Prog 1-6. CSEL. CK. TEST: Lo -0.5
1
pA 1 100 1 supply current3 I- 0.7 11
.0 1 mA
IVO, -4V 3VO, -0,4V 3Crystal: 6OOkHz. OUT: 6OkHz
Switching characteristics Ta -25*C Voo-5V Cý-15pf Swrnbol Paromoter Typ Max Unit
tot Reset delay time 1.0 jLsec
tf Timing error after reset released 1.5 gsec
t, Rise time 70 nsec
tf Fall time ý30 nsec
ýrnal oscillator operating f reauency 1.25 1 MHz
Features 40 Provide 57 different frequencies from a single
internal quartz crystal. Frequency range from 0.005Hz to 1 MHz. Laser trimmed for high accuracy.
40 Lower power consumption. 0 TTL compatible.
NC - ij V"
P3 2. NC
P2 . 3*
P1 131 CK SELECT
Vj CK
P1 "I Four " TIST P4
GNO OUTPUT
TOP VIEW
WARNINGI
CAUTION: [me W"I"I" IWV" ESD (Electro-Static-Discharge) sensitive device. The digit- al control inputs are diode protected; however, perma- nent damage may occur on unconnected devices subject to high energy electrostatic fields. Unused devices must be stored in conductive foam or shunts. The protective foam should be discharged to the destination socket before devices are removed.
Figure 2 riming diagram RESET v
ov
our VOM
-77 -50 10 vot. SOO
'R E LW
F
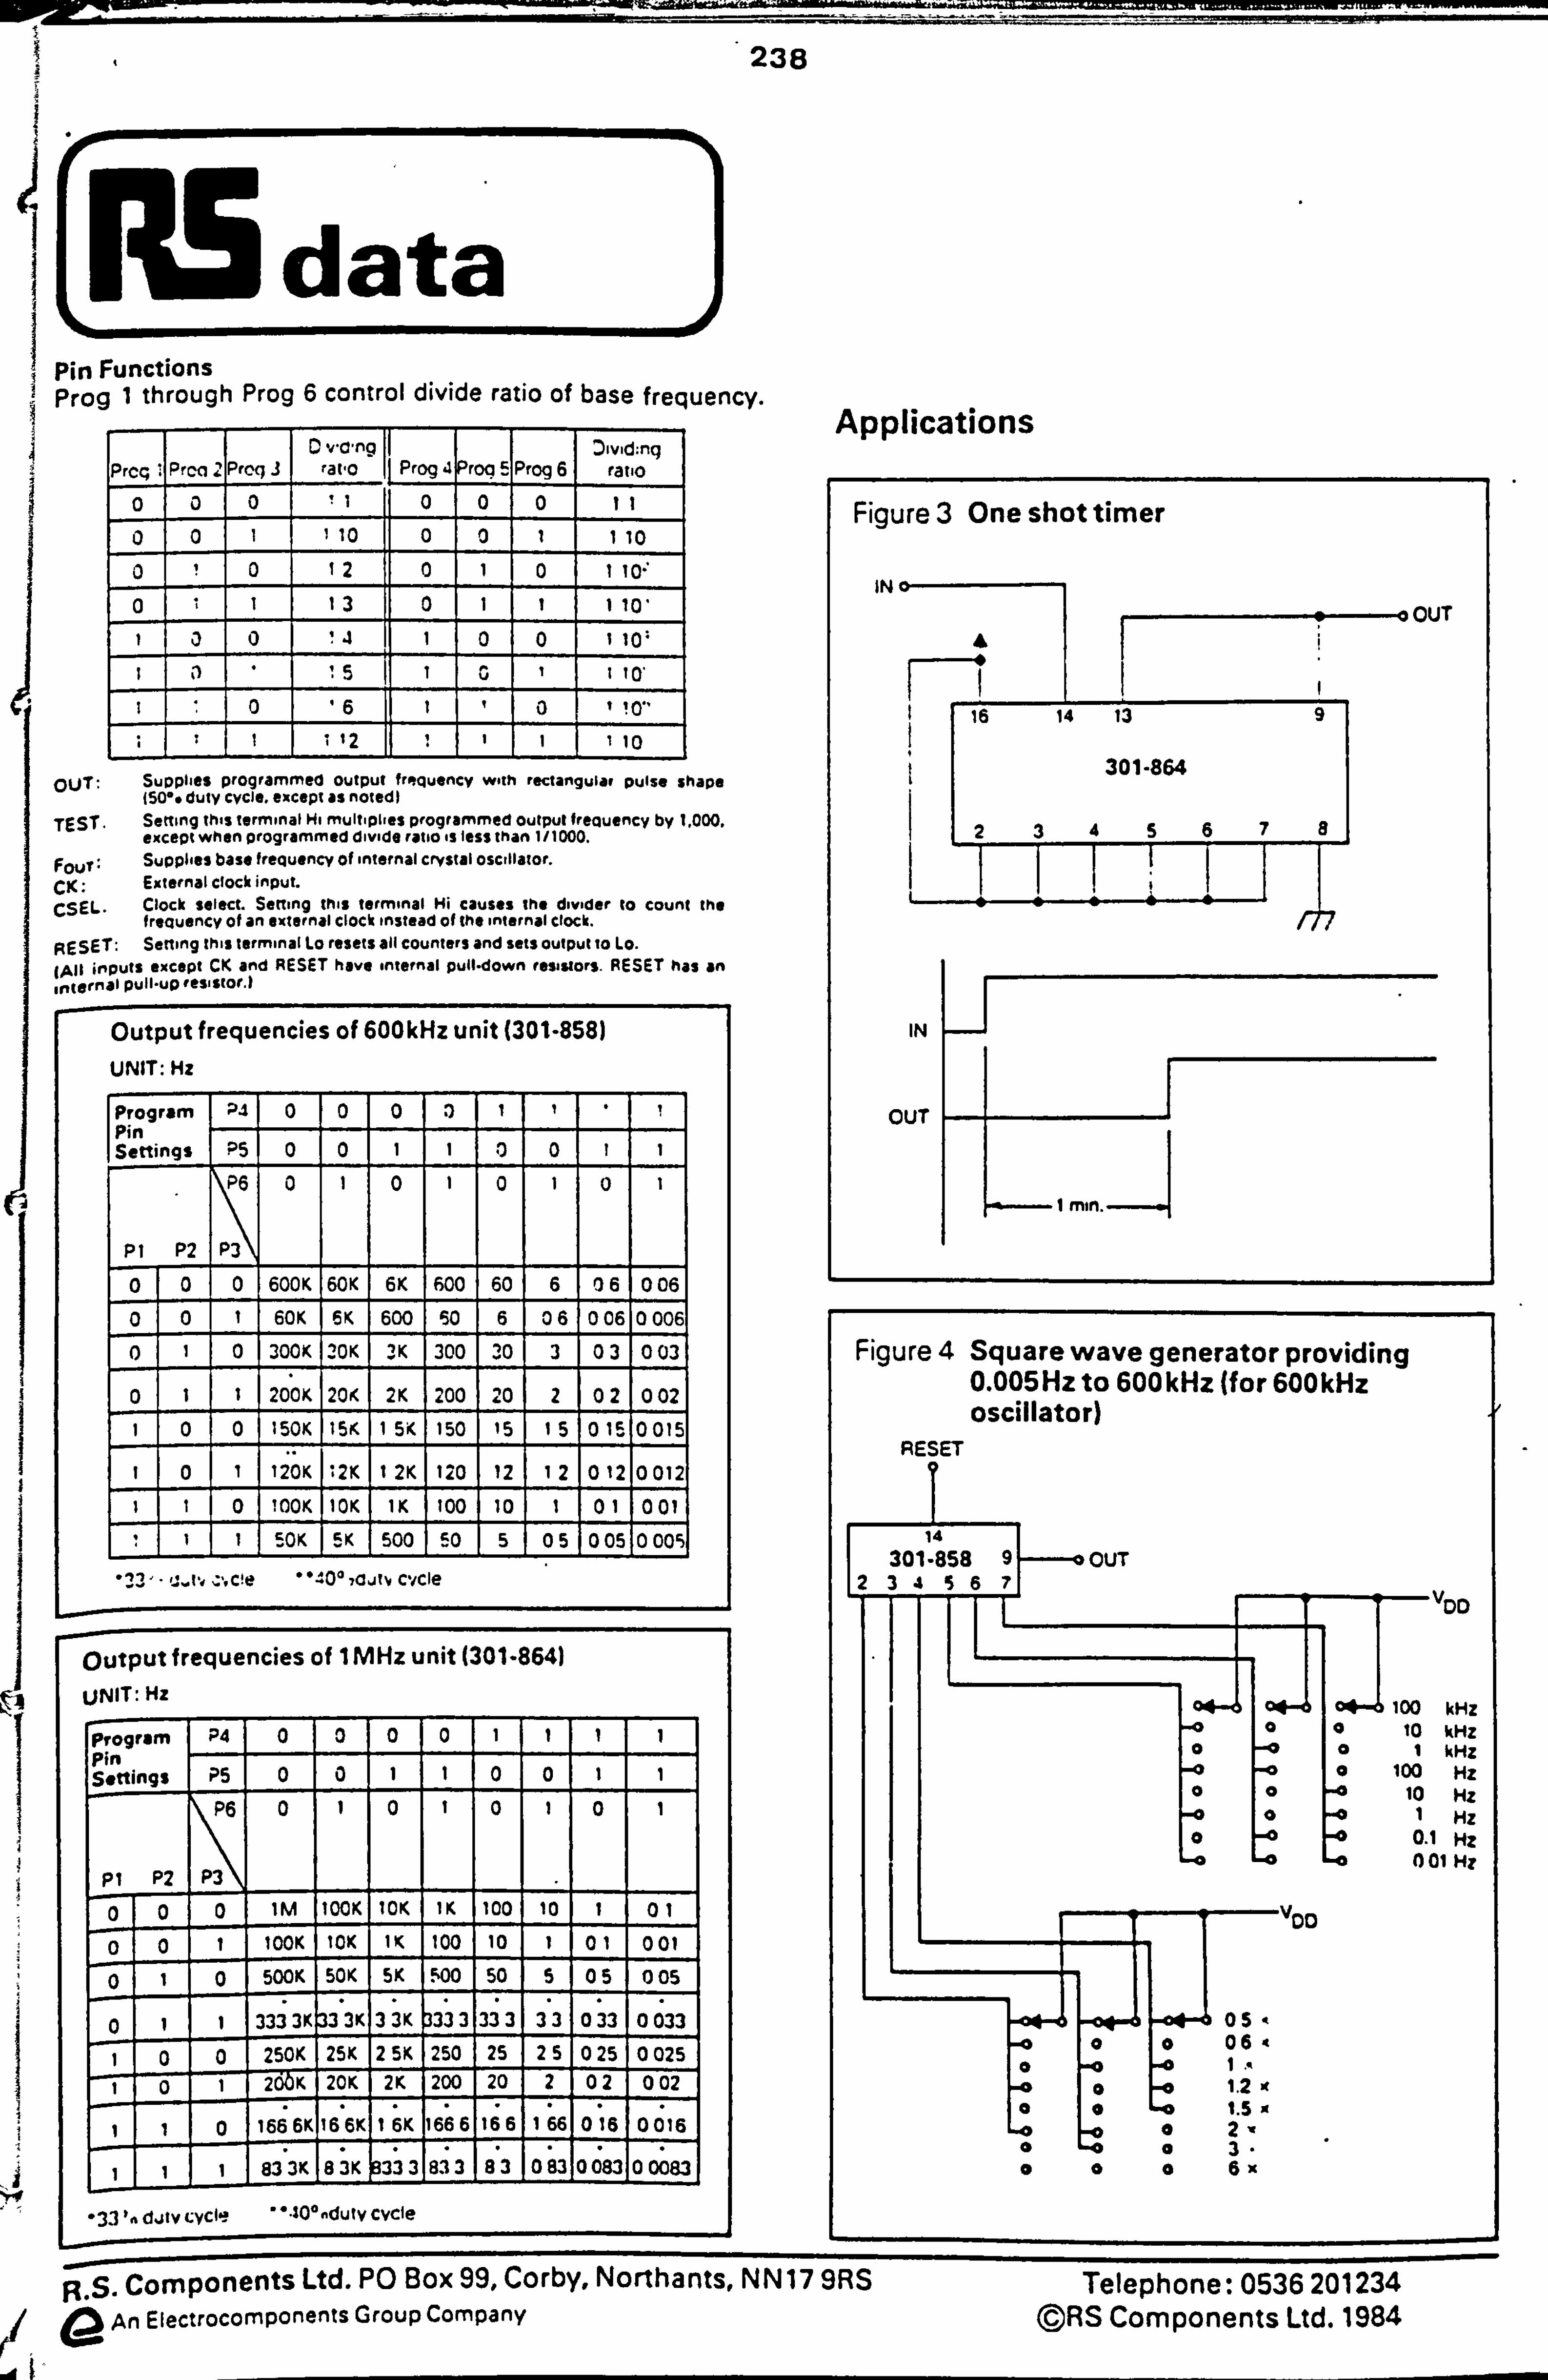
238
data Pin Functions Prog 1 through Prog 6 control divide ratio of base frequency.
Prcq *I Firca ýll pr0q 3 0 v-c-ng
rat-0
1 LtL02 4 Prog 5 Prog 61
: )ivid: ng ratio
0 --0 1 0 !1 10 0- 0 11
0 0 1 1 10 10 o 1 1 10
0 i 0 12 0 1 0 1 10-* 0 1 1- 13 0 1 1 1 101
a 0 !11 1 10 0, 1 10- il 1.5 1
- 1 1o i io 1 ii 0
. ,61 ,1 1' 0 , ! 0"
*1 1 1 *, 12 1 1 '. 11 1 , 10
OUT: Supplies programmed output frnquency with rectangular pulse shape iWo duty cycle, except as notedl
TEST. Setting this terminal Hi multiplies programmed output frequency by 1,000. except when programmed divide ratio is less than 1/1000.
FouT: Supplies base frequency of internal crystal oscillator. CK: External clock input. CSEL. Clock select. Setting this terminal Hi causes the divider to count the
frequency of an external clock instead of the internal clock.
RESET: Setting this terminal Lo resets all counters and sets output to Lo.
! All inputs except CK and RESET have internal pull-down resistors. RESET has an
nternal Pull-uP resistor. )
Output frequencies of 600kHz unit (301-858)
UNIT: Hz
Program P4 0 0 0 a Pin Settings PS 0 0 1 1 10 0 1 1
pl P2
P,
P3
0
1
1 0
f
1
I
0 1 0 1
0 0 0 600K 60K 6K 600 60 6 06 006
0 0 1 60K 6K 600 60 6 06 006 0006
0 1 0 300K 20K 3K 300 30 3 03 003
0 1 1 200K 20K 2K 200 IN 2 02 002 0 0 150K ISK 1 5K 1 150 15 15 01S IO015
1 0 1 120K 12K I 2K 120 12 12 1012 0012 1 0 IOOK IOK 1K 100 1 10 1 01 001
I 50K 5K 5: 0ý 500 0
ý
50 5 05 10 05 0 0051
*33, - :,, C! e * *-'0* 7CIJt'l C-icle
output frequencies of I MHz unit (301-8641
UNIT: -Hz F OL
program P4 0 0 0 0 1 1 1 1 pin Settings P5 0 0 1 1 0 0 1 1
PI P2
0
1
. 0 0 01 IM ICOK I IOK IK 100 1 10 11 01
0 0 1 IOOK IOK I IK 100 10 1 1 101 001
0 1 0 500K 50K I 5K . 5,00 50 5 1 05 005
0 1 1 333 3K 33 3K 3 3K 333 3 33 3 33 0 *33
0 033
1 0 0 250K 25K 2 5K 250 25 25 0 25 1 0 025 0 1 , 200K 20K 2K , 200 20 2 02 002
1 0 166 6K 16 6K I 6K 66 6 116 6 1 66 016 0016
I 833K 83K 8333 1833
3 0 83 0 083 0 0083
le
Applications
Fi. s. Components Ltd. PO Box 99, Corby, Northants, NN17 9RS Telephone: 0536 201234 An Electrocomponents Group Company @RS Components Ltd. 1984
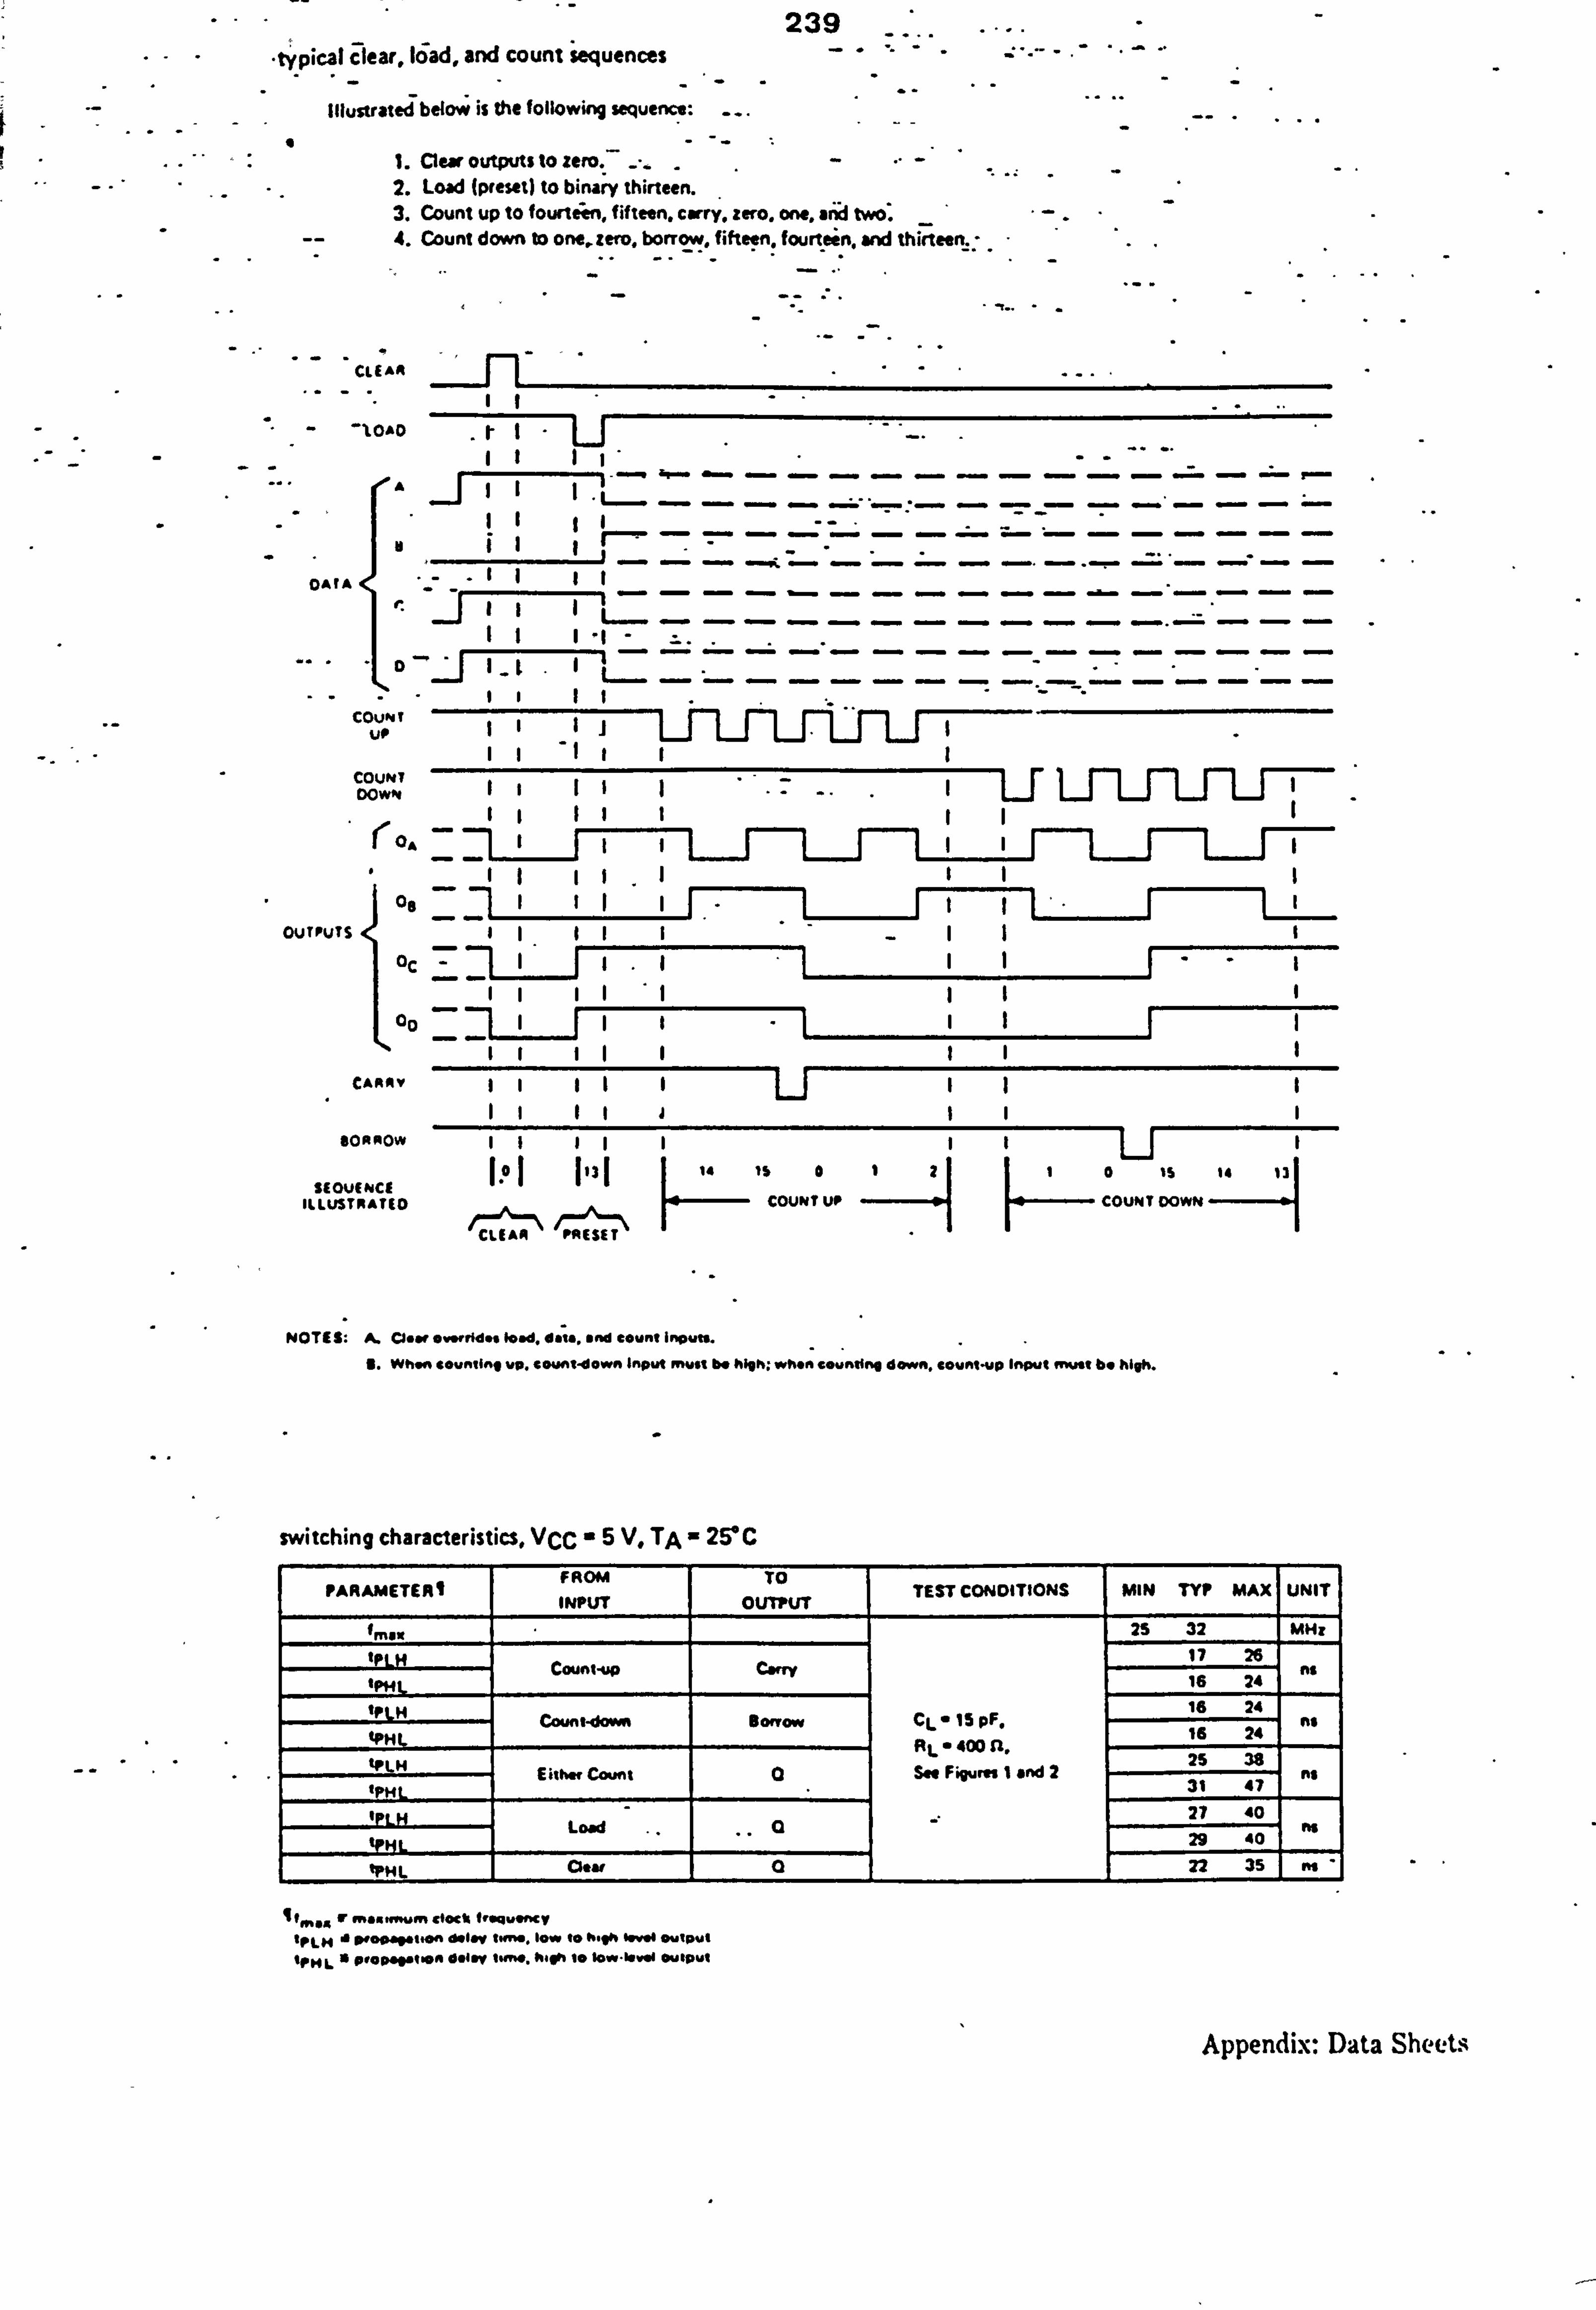
239 -typical
Zlear, 16ad, and count sequences -
Illustrated below is the following Sequence:
1. Clear output$ to zero. 2. Load (preset) to binary thirteen. 3. Count up to fourtt; n, fifteen. carry. zero. one. miýd two. 4. Count down to one, zero. boff ow. fifteen. fourtein. and thirteen. -
CLEAR
-10AD
_j A
. OAfA
----- --- ------
COVN t
COUNT DOWN (OA
08 111 11 jI i OUTPUTS
OC
a,
CAR01V ------ LJ
BORROW
S1OU(NC9 ILLUSTRATED COUNTUP COUNT DOWN
AR PRESET "CLE
NOTES: aeor 9~1ides food. data, and count Inputs.
S. W"w% counting up. count-down Input Must be high. when countins down. cownjýp input "Was be high.
switching characteristics, VCC -5V. TA - 25*C
PARAMIETERI FROM INPUT
TO OUTPUT
TEST CONDITIONS MIN TYP MAX UNIT
fmom 2S 32 MHr
IPLH 17 26 -
IPML Count-up Car" - 76 24 no
tPLH F ' 15 r 16 24
tPHt, Count-down Borrow p . L
* 4oo n R 16 24 no
tPLH . L Fi I nd 2 S
2S 38
tPHL Either Count gures a ee 31 47 no
IPLH 27 40
tp"L Load
29 40
tPHL O*m 22 35 no
I... W -&. ým clocil floq. ýv
I, LH d SWOO"Otion doloW tý, IOW 10 high Irv*l OWIPut
SP14L is p, Q~q. DR delov 1~. ft. #" I* low-I@. W O. IPWI
Appendix: Data Sheets
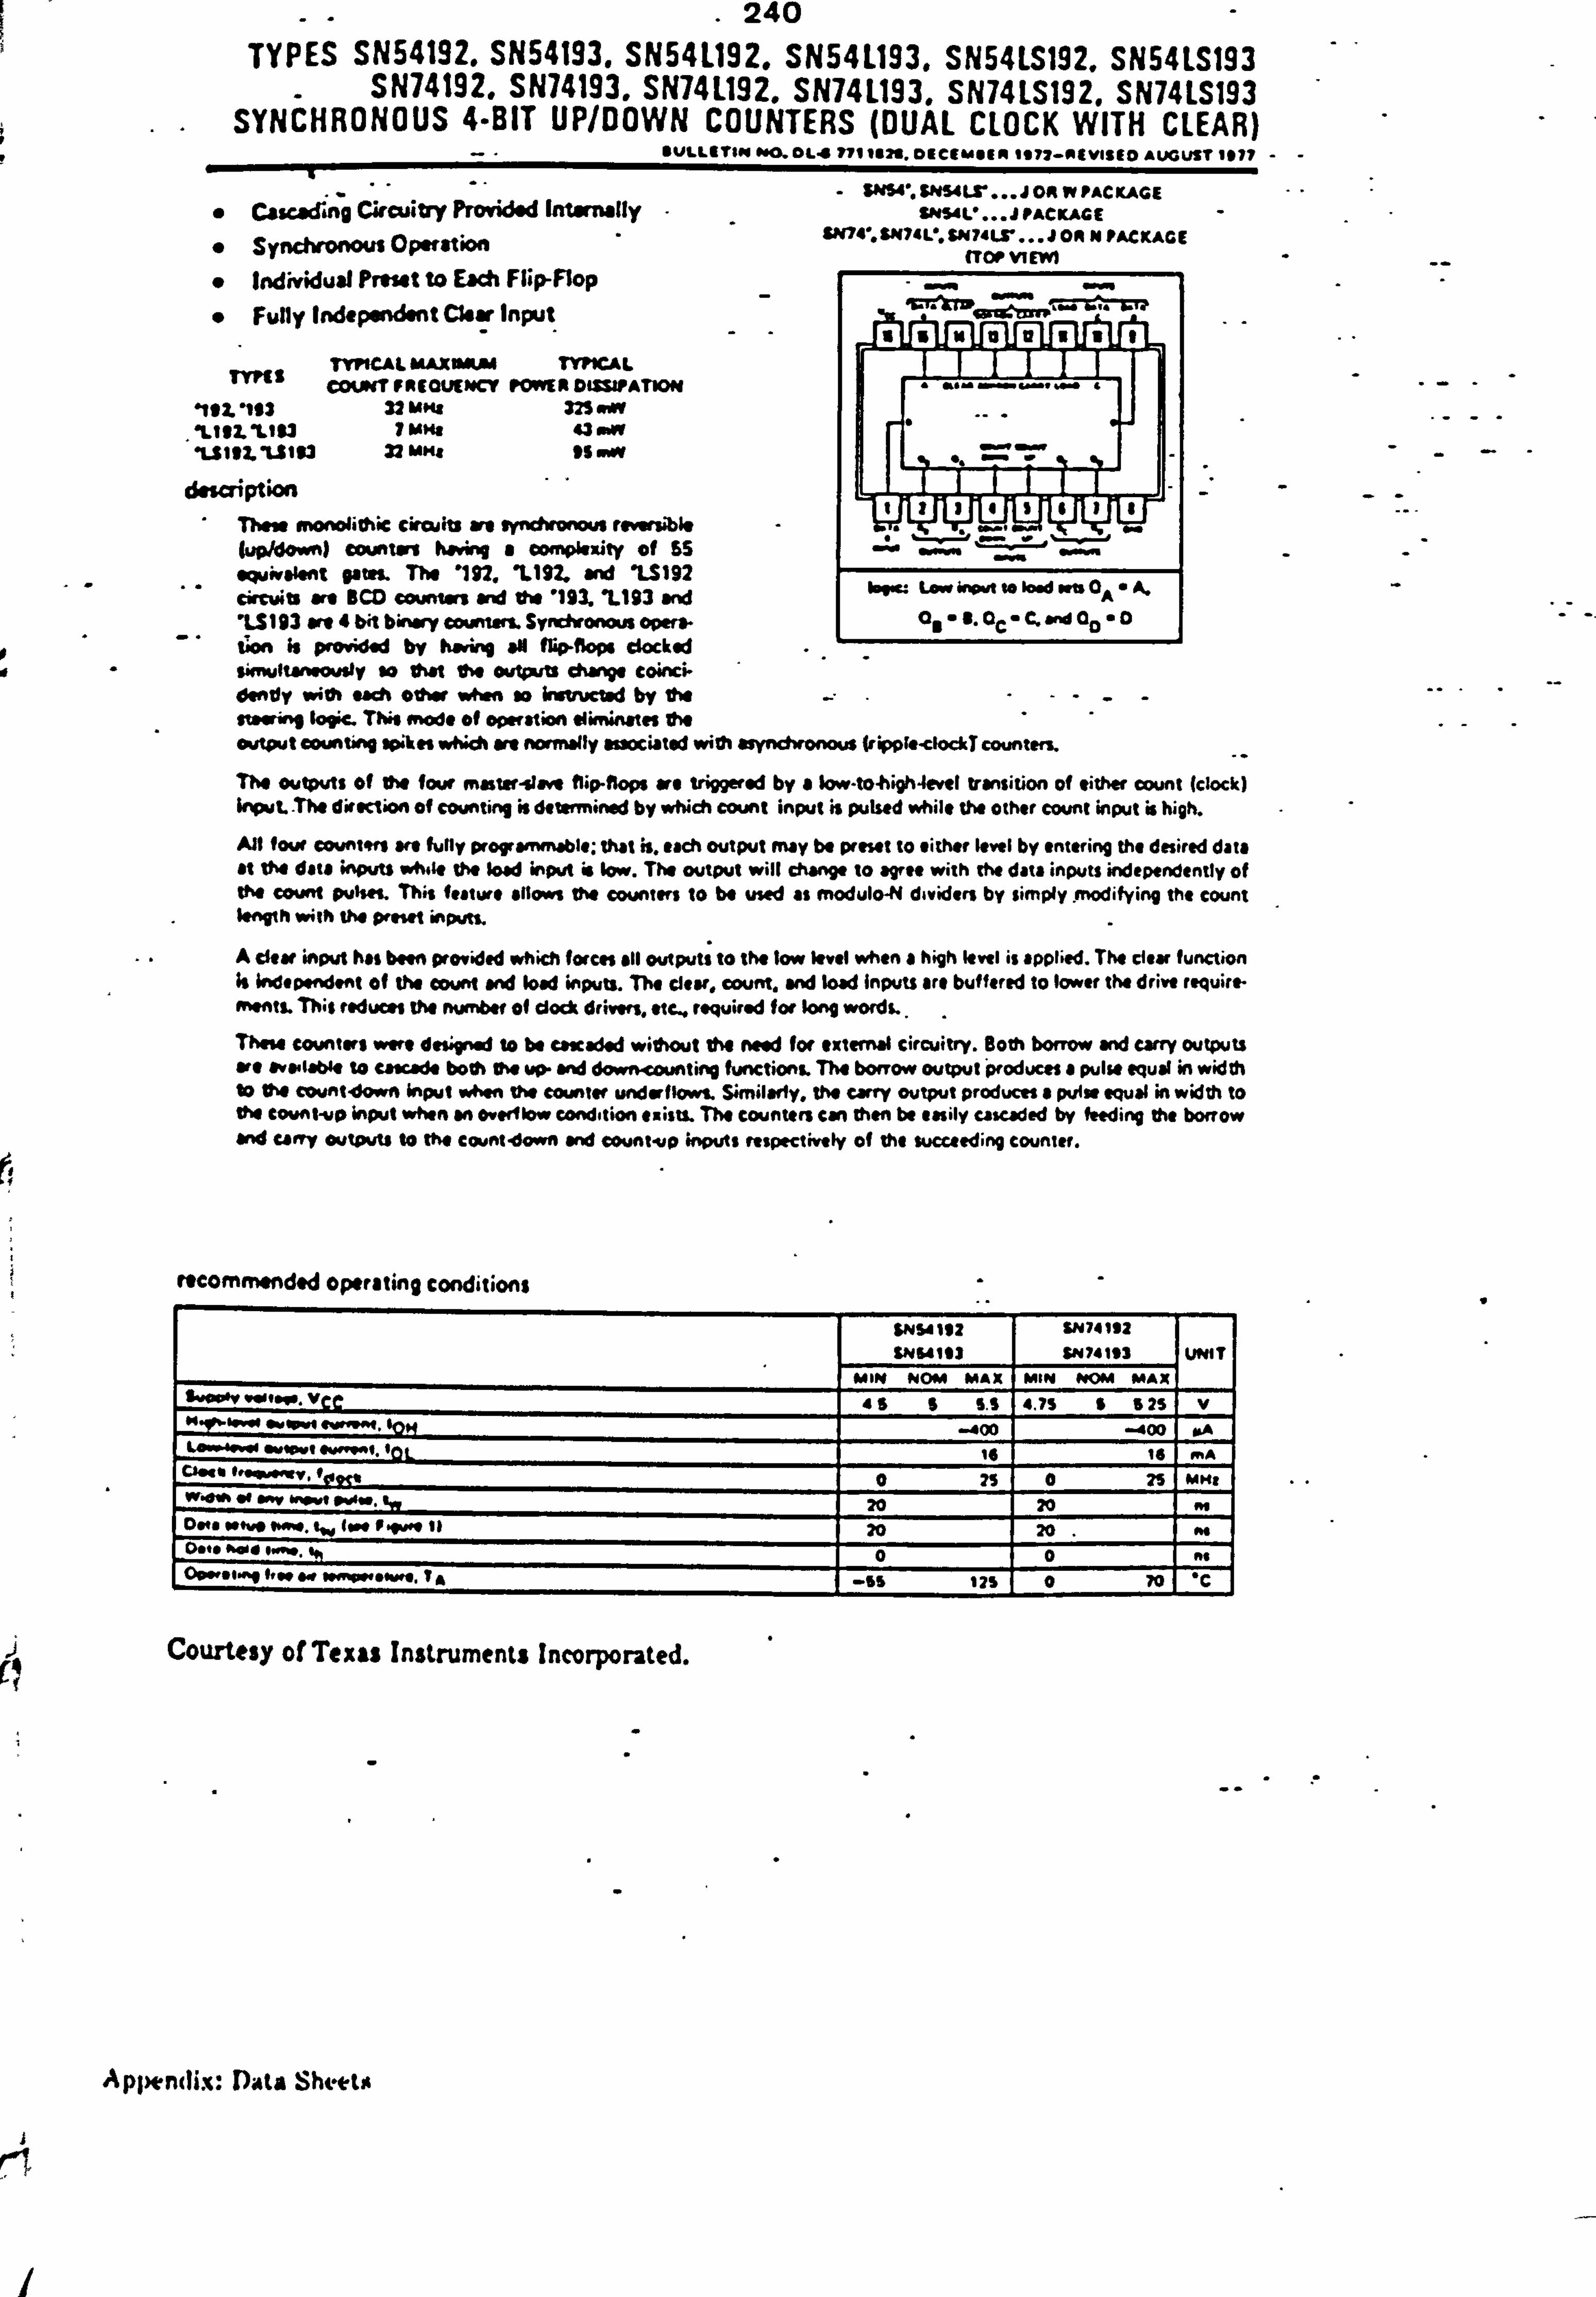
240
TYPES SN54192. SN54193. SN541.192. SN541.193. SN54LS192. SN54LS193 SN74192. SN74193. SN741.192. SN741.193. SN74LS192. SN74LS193
SYNCHRONOUS 4-BIT UP/DOWN COUNTERS (DUAL CLOCK WITH CLEAR)
SM54'. $"ULr... JCRWPACKAGf " C&wAKring Circuitry PrOwiddod lntwMlly SM54L* ... JPACKAGE
" Synchronous Operation LW4'. 9"? 49!. Sft? 4LV ... J ON N PACKAGE ffOPVIEM
L4 wil II
bpa LvwwwAtolo@dwuO, -A.
as-9.0C. C. &WOO-0 tPUrs 15 PFUWVUGU Vy ne" 00 IFUp-TIVp% CWCRGU
sinwItistwowill so that the outputs dl-Ve coinci- dandy with each other w! -- so instructed by the stow" logic- This sn*d@ of operation elknirwes the output counting *kn which are normally associated with asynchronous tripplo-clockT countem
The outputs of the four master-slave flip-flops are triggered by a low-to-high-level transition of either count (clock) Input The direction of counting is dote. ined by which count input is pulsed while the other count input is high.
All four cownt-tirs we fully programmable. that it. each output may be preset to either level by entering the desired data
at the data inputs wAsle the load input is low. The output will Change to agree with the data inputs independently of this count pulses. This feature allows the counters to be used as modulo-N dividers by simply the count length with the preset inpum
A clew input I%*% been provided which forces all output; to the low level when a high level is applied. The clear function Is independent of the count and load inputs. The clear, count. and load lnpuU are buffered to lower the drive require-
ments. This reduess the number of dock driws. etc, required for long wordL. .
Thm counters vivi I designed to be cascaded without the need for exlerriall circuitry. Both borrow and carry outputs We Aler4mlatilt to Cascade both the WP- wild 60wn-COWAting fW4tiOnL The borrow output produces a pulse equal in width 10 the Muntdown input wheo Ow counter underflows. Similarly. the carry output produces a pulse equal in width to the cownt-wo input whom an overflow condition exists. The counters can then be easily cascaded by %eding the borrow " Carry Owtouts to the countdown and count-up kvuts respectively of the succeeding counter.
" Individual Prent to Each Flip-Flop
" Fully Independent Clew Input
T YKS TYPICAL MAXV^JM TYPICAL COLWFRIGUENCY rw-LAD=WATION
-I9X -193 32 M"I M M"
ý'LIIVLIU I mme 43 mW
"ItILILS193 32 MKS 95 W&V description
Then amwiclithic circuits are wynchronows rtvwvbie (up/down) countars having a amoiaxity of SS owivaWt Bates. The '192. *1.122. and U192 ckcvits art BCD counurs and to '123. '093 " 'LS 193 we 4 bit binary counters. Synchronous opera. . 1- - --- .-ý-ý. -- -- . --- ---. -,
rtcomm4nd*d operating conditions $Nsdllz
SN64113
SN74192
SM741193 'T UNI T Mok NOM MAX MIN NOM MAX
swopov volow. VCC 4s s III 41.7s 6 s2s v V W-f-w-VI O. Wo tool
-400 -400 LO.. 'evo *. Vt Ow.. "t. IOL 16 16 mA
Cleo oll Imm. 0". 1, 0 a W, 00b of ww W. P. 1 P. 6m. an 20 20 Do's wtwo wm. t., two F IWO 11 0 20 20
W. W. 11 0 0 I'm se le we *ewe. IA -Zs s 12S 0 70
--c
Courtesy of Texas Instruments Incorporated.
i
ýr-T
Appendix: Di4ta Sheets
I
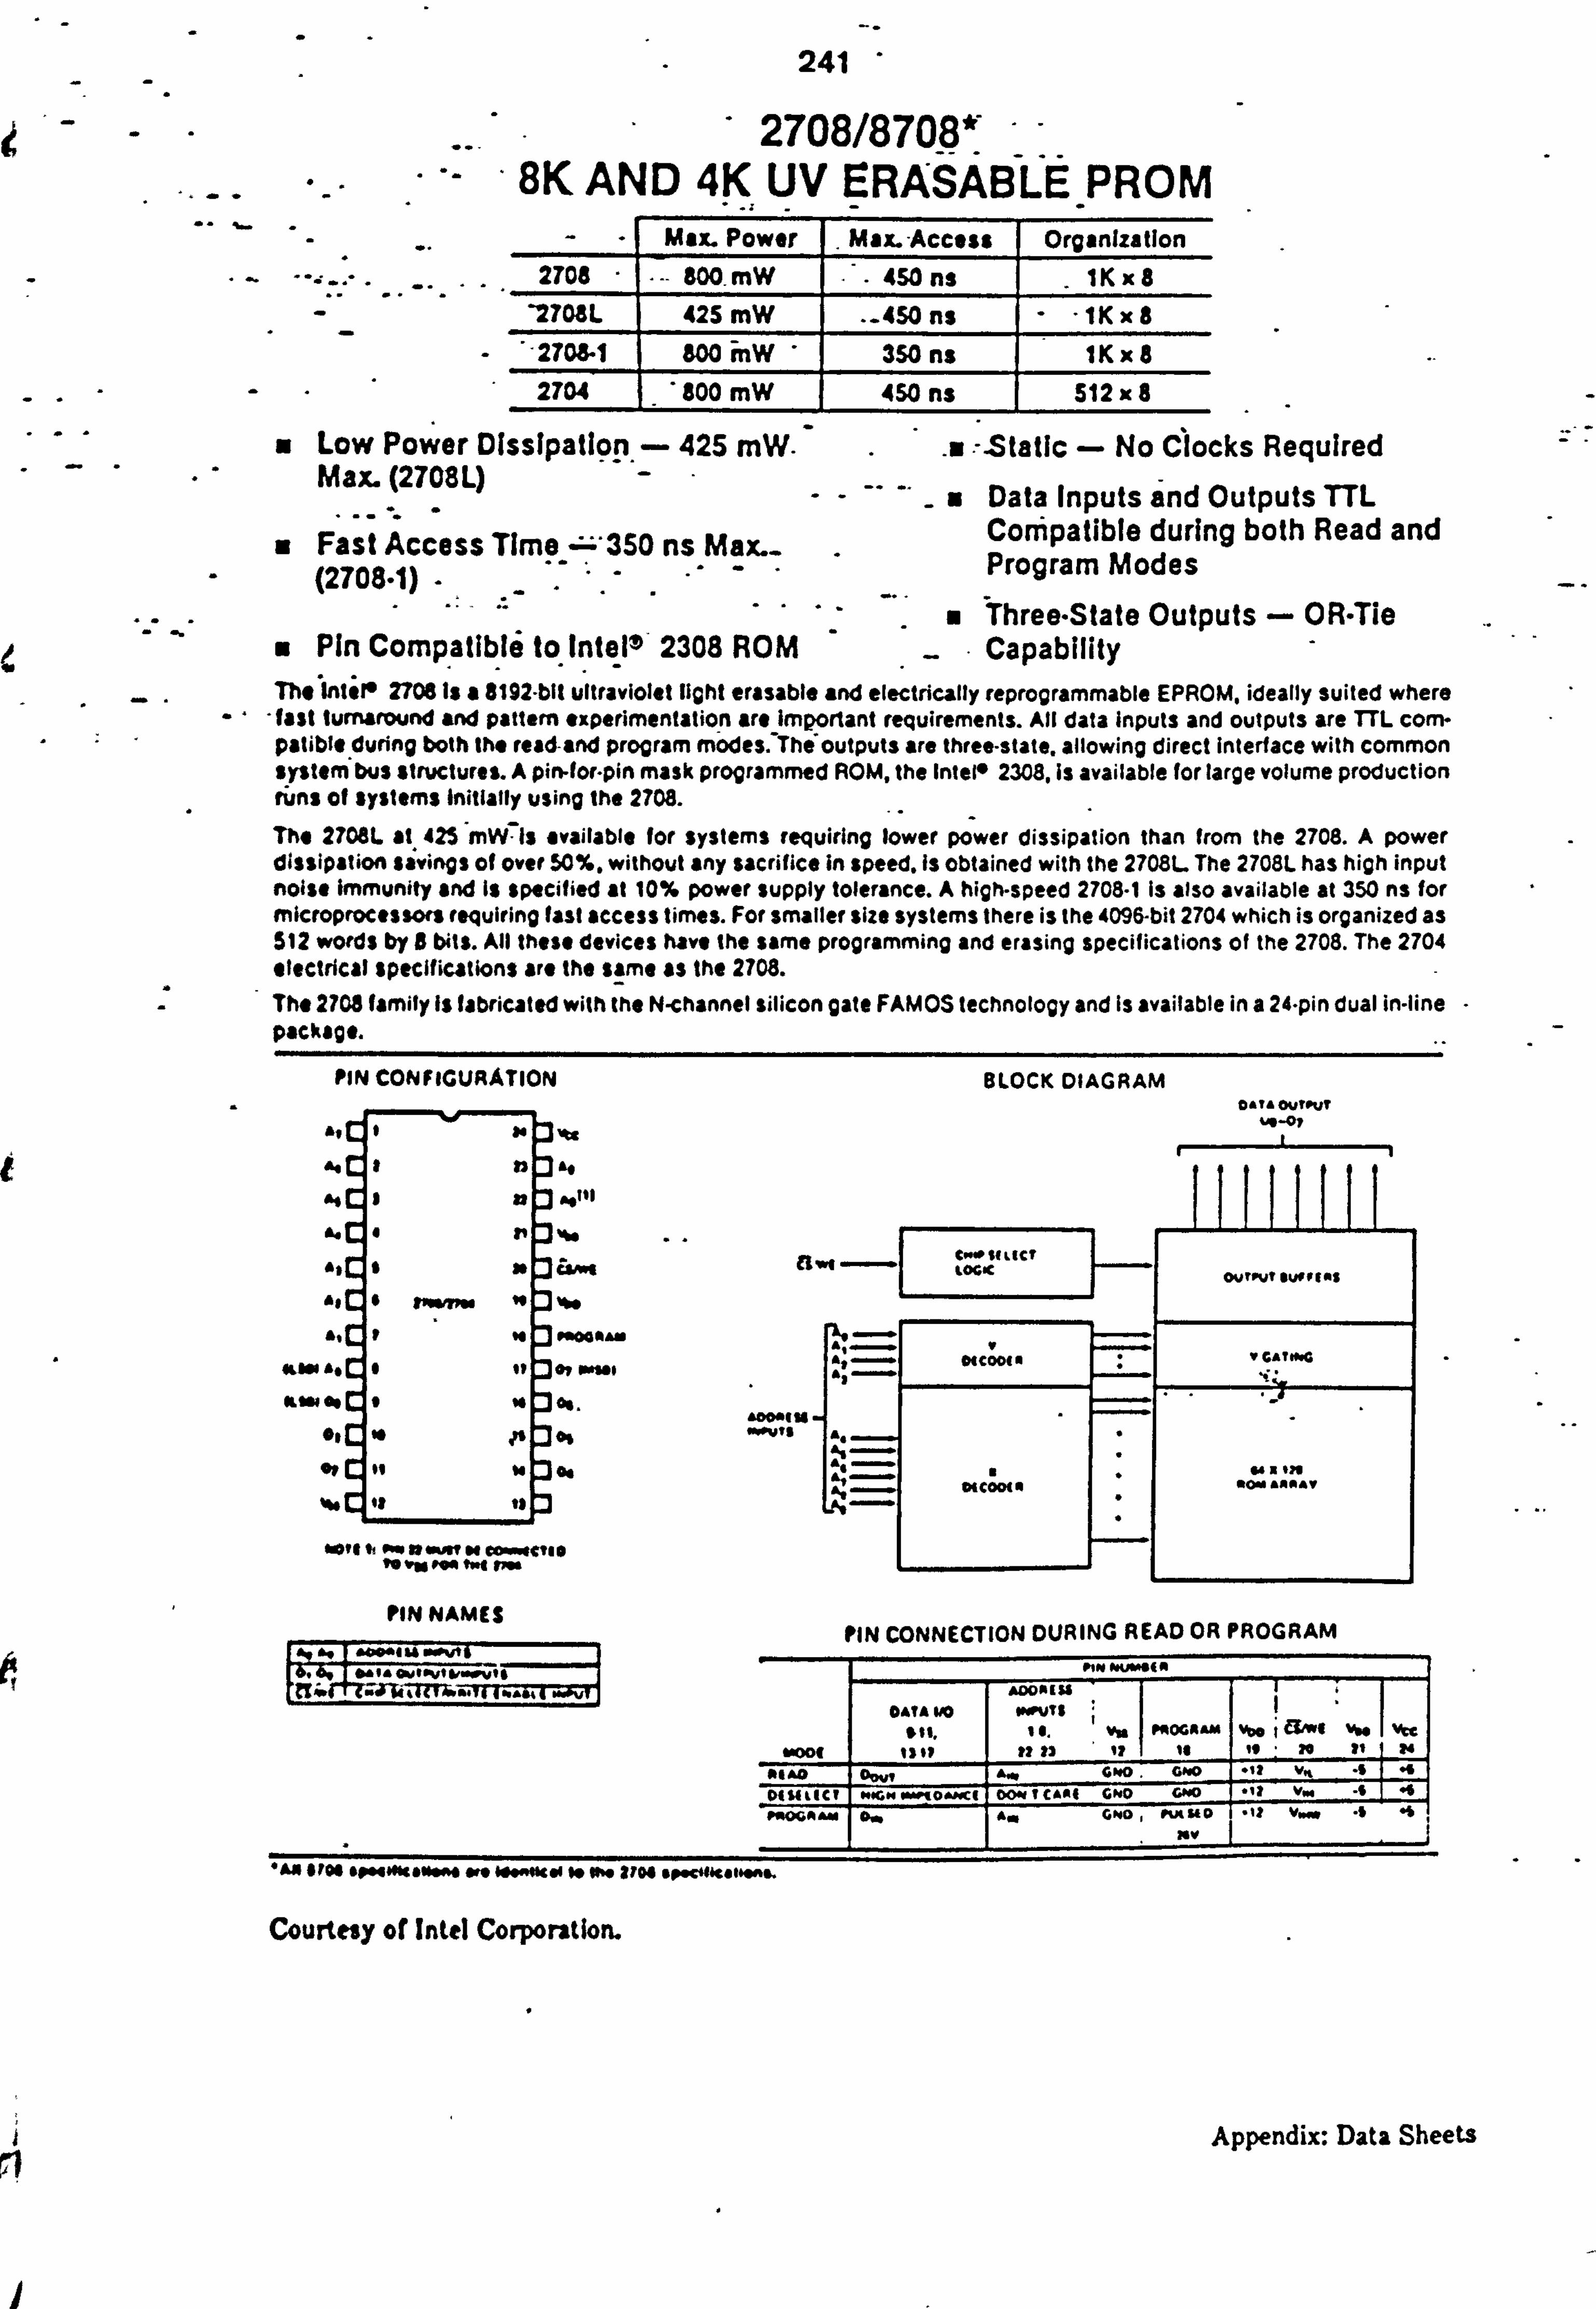
2704 4SO ns 512x8
" LOW Power Dissipall9q. 425 mW- x: -. Static - No Clocks Required Max. (2708L)
0 Data Inputs and Outputs TTL Compatible during both Read and " Fast Access Time ns Max. - Program Modes (2708-1) -
0 Three-State Outputs - OR-Tie " Pin Compatibli to. Intelv- 2308 ROM Capability The Intef* 2706 Is a 81192-blt ultraviolet light erasable and electrically reprogrammable EPROM. ideally suited where
-last turnaround and pattern experimentation are Important requirements. All data Inputs and outputs are TTL com- patibl* during both the read-and program Modes. The7outputs are three-state. allowing direct Interface with common system bus strvctureL A pin-for-pin mask programmed ROM, the Intel* 2308, is available for large volume production fijns of systems Initially using the 2708.
The 2708L at. 425'mW-ls available for systems requiring lower power dissipation than from the 2708. A power dissipation savings of over 50%. without any sacrifice in speed. Is obtained with the 2708L The 2708L has high input noise Immunity and Is specified at 10% power supply tolerance. A high-speed 2708-1 13 also available at 350 ns for microprocessm requiring last access times. For smaller size systems there is the 4096-bit 2704 which is organized 33 512 words by 8 bits. All these devices have the same programming and erasing specifications of the 2708. The 2704 electrical specifications are the same as the 2708.
- The 2708 family Is fabricated with the N-channel silicon gate FAMOS technology and Is available in a 24-pin dual in-line package.
PIN CONFIGURATION BLOCK DIAGRAM a&? & OUTPUT
3, tc n 3he
n3 ""1 A. C 4r 3%*
&, C 6a 3ams live &, E 6 rmswrm " : 3, **
to 3 PNOGNAW V 4LISI AS CI It : 307 W"o 014: 0044 V CAT04
OLIN ftc: 9 'A :3%. .. .1
01 "pull A. AS
of 01 W 04 A,
. 0. . AAV 04 W401111 6113112
" W" me " rm I
PON NAMES PIN CONNECTION DURING READ OR PROGRAM
DATA 1410 PIPUT I "1 1, Is. VU PROGRAM VOO t %tc
Woot I'll pf 12 17 1# a.., Aft GNO GO-0 *6 -AGA*
01111411,11cy "4G. 0.. qOP^X1 DON 11 caml GNO GOOO . 12 V. -6-1 -4
PeOGRAN 0' A. G"D Putuo . 12 Vý .6 -6 0
Courtesy of Intel Corporation.
241
2708/8708v 8K AND 4K, UV ERASABtt. PROM
- Mm Power Max. -Access Organization 2708 800 mW JISO ns lKxS
WO&L 425 mW . -4SO ns -lKx$ 27CMI-I am -mW 3SO ns lKx8 2704 $00 MW 4SO ns 512x8
Appendix: Data Sheets

242.
2708 FAMLY
PROGRAMMING rh, programming &9mitics (ions are described in lhe PROMIROM Programming insvuctionson pagi; l-gl
Absolute Maximurd Ratings". Tempefaivre Uoid- B# as ..................... Stors" Temperaluce ............ ............. VoqrWith ResPeCt 10 Vee-- -- VCC vW VSS With ROSPEC1 to Vgll- Ail input or Output Voltage% With Rfspect .7
to Vgs Dwir; ng Read ......................... "T Anpul With Ft*WCIIO Vag ;, ME Oulinshog'a-mg ........................
Program Input With RespeCt to VIS .............. Po;, q, 154s-psl-on ...
* ..........................
to : -65*Cto-12! 5ýC
» -iv . 420v to -0. *ISVIO-0.3v
415vIO-0.3v
*20V to -0.3V 4,35V to -0 3v
..... I. Sw
'COMMENT
Serettlesabowe those listed under "Absolute Maxirnum Raimrigs" may cause perma-wril daffia" to the device. Tým is a stress rating only and functional operation of the dowi; ot then or any other conditions above tho; g indicated in he opwgtonal sections of this opecificatson is not implied. Emooswe to absolute onaminjurn rat"condolbonsfor taterided Persocil May affeerdev" reliability.
and AC Operating Conditions During Read 270B 274ML
r O'c - 70* C (rc - 70-, c wc--70, c
VCC FO-W S. 00Y SV ! S% SV? S% sv t W.
VD0P0l"5WWV' 12V t 5'- l2v2s% 12V 2 10%
veqpoýswmv -SVIS% SV! S% --Sv - 10-;
READ OPERATION D. C. and Operating Characteristics
"P ISO I- "Will M.. Tý C-0-
#.. &. &ý a" C-O s~ O-Owt 9- C. -i ,I to 1 10 .& "Ift %2%VWVV% VIL
IL, 0~ k-- Cý- 61 10 1 10 .A
VOUT S SV CS WE Sv
LOO Sý C-i be GS 21 7f - . -f c- 1. -0. C, ft
VCC S- Cý G -to-
2 d INW" "r
-9 1 Vol Cý 30 ds to 14 1 -A aV; f S%FTA'OC
V so so% Vol @a% IV
30 VCC-l 1 77 VCC-11 V
! I... 16-4 .7 Me 2 ? a% 1. V. PA~ 4" VW. -O. Gas
1
04 V
'08,1 V... 9 r#~ ~- 31; $I V -ON -100. A 14 24 V . 0,
-A 1,10 C
47% .a- TA -0 C
Isolos f vol ---- v. 9. vcc ea vcio Vol --o owl. ~.. w-v ww"
T. -PS wito. tic"). OCC, f-W ow- it- -ftý SM VU T-. 4)W @CC. ý too ýýI$ P-d - iriý 0 il-t-
a ;
I-wf% low%
11; ASURE CHARACTER'ISTICS The erasure ChwMerittiCS Of the 2708 we such that of $Sure begins to occur whon exposed to light with wavelengths thortet than approximately 4000 Angstroms (A). It should be noted that Sunlight and certain types of fluorescent lamps have wavelengths in the 3000-4000, % Fonge. Date ovw that constant exp(nure to room level fluorescent 1-ghting Could vest the typical 2708 in approximately 3 years. iiihole it would take approximatley I week to cause ofasure when emposqd to direct sunlight. If the 2708 it 10 be exposed to these types of lighting conditions for ex. landed Pot#ods of time. Coaquo label$ are available from
Intel which should be placed over the 2.708 windo; 4-to
prevent unintentional erasure. The recommended erasure procedure (see page 3-55) for the 2708 is exposure to shortwave ultraviolet light which hot a wavelength of 2537 Angstroms JAI. The integrated dose (i. e.. UV intensity X exposure time) for erasure should be a minimum of 15 W-W/cm2. The erasure time with this dotage is approximately 15 to 20 minutes using an ultra- violet lamp with a 12000 jW/CM2 power rating. The 2708
should be placed within I inch of the lamp tubes during
erasure. Some lamps have a filter on their tubes which should be removed before erasure.
Appendix: Data Shtvtjt

243
i C. 27OU2704 Family Programming
Initially. and aftýef each erasure. all 8192/4096 bits of the 2708/2704 are in the -11- state Jo4Apt hiqlý' ). Information is intro- ducOU by selectively PrOglamMing Cr into the desired bit locations. A programmed *V- can only be changed to a "I"
- by
1UV erasure.
The circuit Is setup for programming operation byraisingthe CS/WE input(pin 201 to+12V. Theword address isselectedin ft %ame manner as in the read mode. - Data to be programmed are presented. - 8 bits in parallel. to the data output lines.
__ (01-0a). Logic levels foFaddress and data lines and the supply voltages are the same as for the read mode. After address and data set up. one program pulse per address is applied to the program input (pin 18). One pass through all addresses is defined as a program loop. The number of loops (N) required is a function of the program pulse width (tpw) according to Nx tpw > 100 Ins. The width of the program pulse is from 0.1 to-1 Ins. The number of loops (N) is from a tniniWum*of 100 OpW ms) to greater than 1000 tt#w - 0.1 ms). There must be N successive loops throuhg all 1024 addresses. It is ifotpermftred to apply N pfop" pulses to an address and then change to Of next address to be progravrimed. Caution should be observed regarding the end of a program sequence. The CSIWE failing edge transition m6st-becur before the first address transition when chang- ing from a7program to a read cycle. The program pin should also be pulled down to V, - With an active instead of a passive LF device. This pin will source a small amount of current V ILL) when CS/WE is at VIHW (11 2VI anj the program pulse is at VILr.
Programming Examples (Using Nx tp" > 100 ms) Gamplo 1: An SMS bits a, ri to be programmed with a-0.5 ms program pulse width.
The minimum number of program loops is 200. One program loop consists of words 0 to. 1023. Example 2: Words 0 to 100 and 500 to 600 are to be programmed. All other bits are "don't care'% The program pulse
width 110.75 ms. The minimum number- of program loops is 133. One program loop consists of words 0 to 1023. The dati entered into the "don't car*' bits should be all Vs.
Example 3: Same requirements as example 2. but the PROM is now to be updated to include data for words 750 to 770. The minimum number of program loops. is 133. One program loop consists of words 0 to 1023. The data entered into the "don't care" bits should be oil Vs. Addresses 0 to 100 and 500 to 600 must be re-program- rneý with their original data pattern.
2704,2708 Family PROGRAM CHARACTERISTICS TA 125"CýVCC e5V15%. V00 a +12V ! 5%. Vge --SV ! 5%. VSS *OV. Uniess0therwise Noted.
D. C. Programming Characteristics . SWWWA ptý T vp. U-N Tom co"two
fl, o Aed" dow CIAMPI M"I 1. -0. cw, "" 10 pA Vitt - 5.25V
IWL 140TOW P~ SOLfto Cwv"l 3 -A
to. # P"G. Pvw S-% C. "ýq mA
t ?w
Ii so 66 mA
oo I
VC)o corm" ITOGL 21 . 28 ". wo; " S. Pov
$ I Ice. 2 w"
V C - 6 10 mA c
cc CC wm o 2708L 2 AM Mpýu Mqh
I 2706. INM 30 as MA CS/WI - IV-* TA - G* C
s@ VII swoov Cw-om 2709L 10
. 14 A
Vot I-ow Le- Lo-w So-~ P"wo-1 VS1 a. " I V
2706. Iva 30 VCC 011 V
4"d Dew 270L 2.2 VCC 011 V
V"OW CSJAAF4 k4wA 660 Lo-O 11.4 12.9 V "of cw Vss
Pmrom Pow " Lo-O 2s. 27
I
V Plot ic t*VSS
I'morom Posw Le- Low V&S S V VlHP-VlLP2SVw4ft-
%*to 1. log f4w the 170$1. to Ipmawd ia the progre w it state oftd is 18 MA mank"Um In lh* WWOWSI m 14 Itstf-
Appendix: 'Dats. Sheets

( 244
A. C. Programming Characteristics -77. .. Symbol parameter Min. Typ. Max. Units
- US IkMress Setup Time 10 -. Ys .. tcss MWE Setup Time 10 ps
tos Data Setup Time 10 Ps tAM Address Hold Time I ps
tcM MWE Hold Time S
tom Data Hold Time, I Ps
tolt Chip Deselect to Output Float Delay 0 120 ns
topfl Program To Read Delay 10 ps
tpw Pr4nfarn Pulse Width .1 ms
tPA Program Pulse Rise Time .5 Ps
tpfr Pror&rn Pulse Fall Tkne .5 us
NOT 1: IntA ttwbdwd prodwct warre"11 SPOWS aMy io devices proranwried to specifications atscribed herein.
2704,2708 Family Programming Wavelorms
Of M. PROGMAN LOM Of AD
CAPTIM L FOM LOOM
CL-t
"es"I it. 1 w
&A"@" Acoaess$ Amain I ....... ADONISS W23 ADDRESS 6
Vft
DATA OUT A OUT DATA WMALID
OAVTA4. Ia
WIN
1101 %W (f3; j-ft-A-X) %, IAW
IWI L TWO eVotte"Moram MA? OOCUMAPTIO Tod PPIOGN&AftKUTRAMOTION *AM elpolke Ing Acollonvok"Wrow
favi I spimelso a$ fI poscall 42NOMMIMING a pou"Llmorwnwieg V20FIRIL
APPtndix: Data Sheets
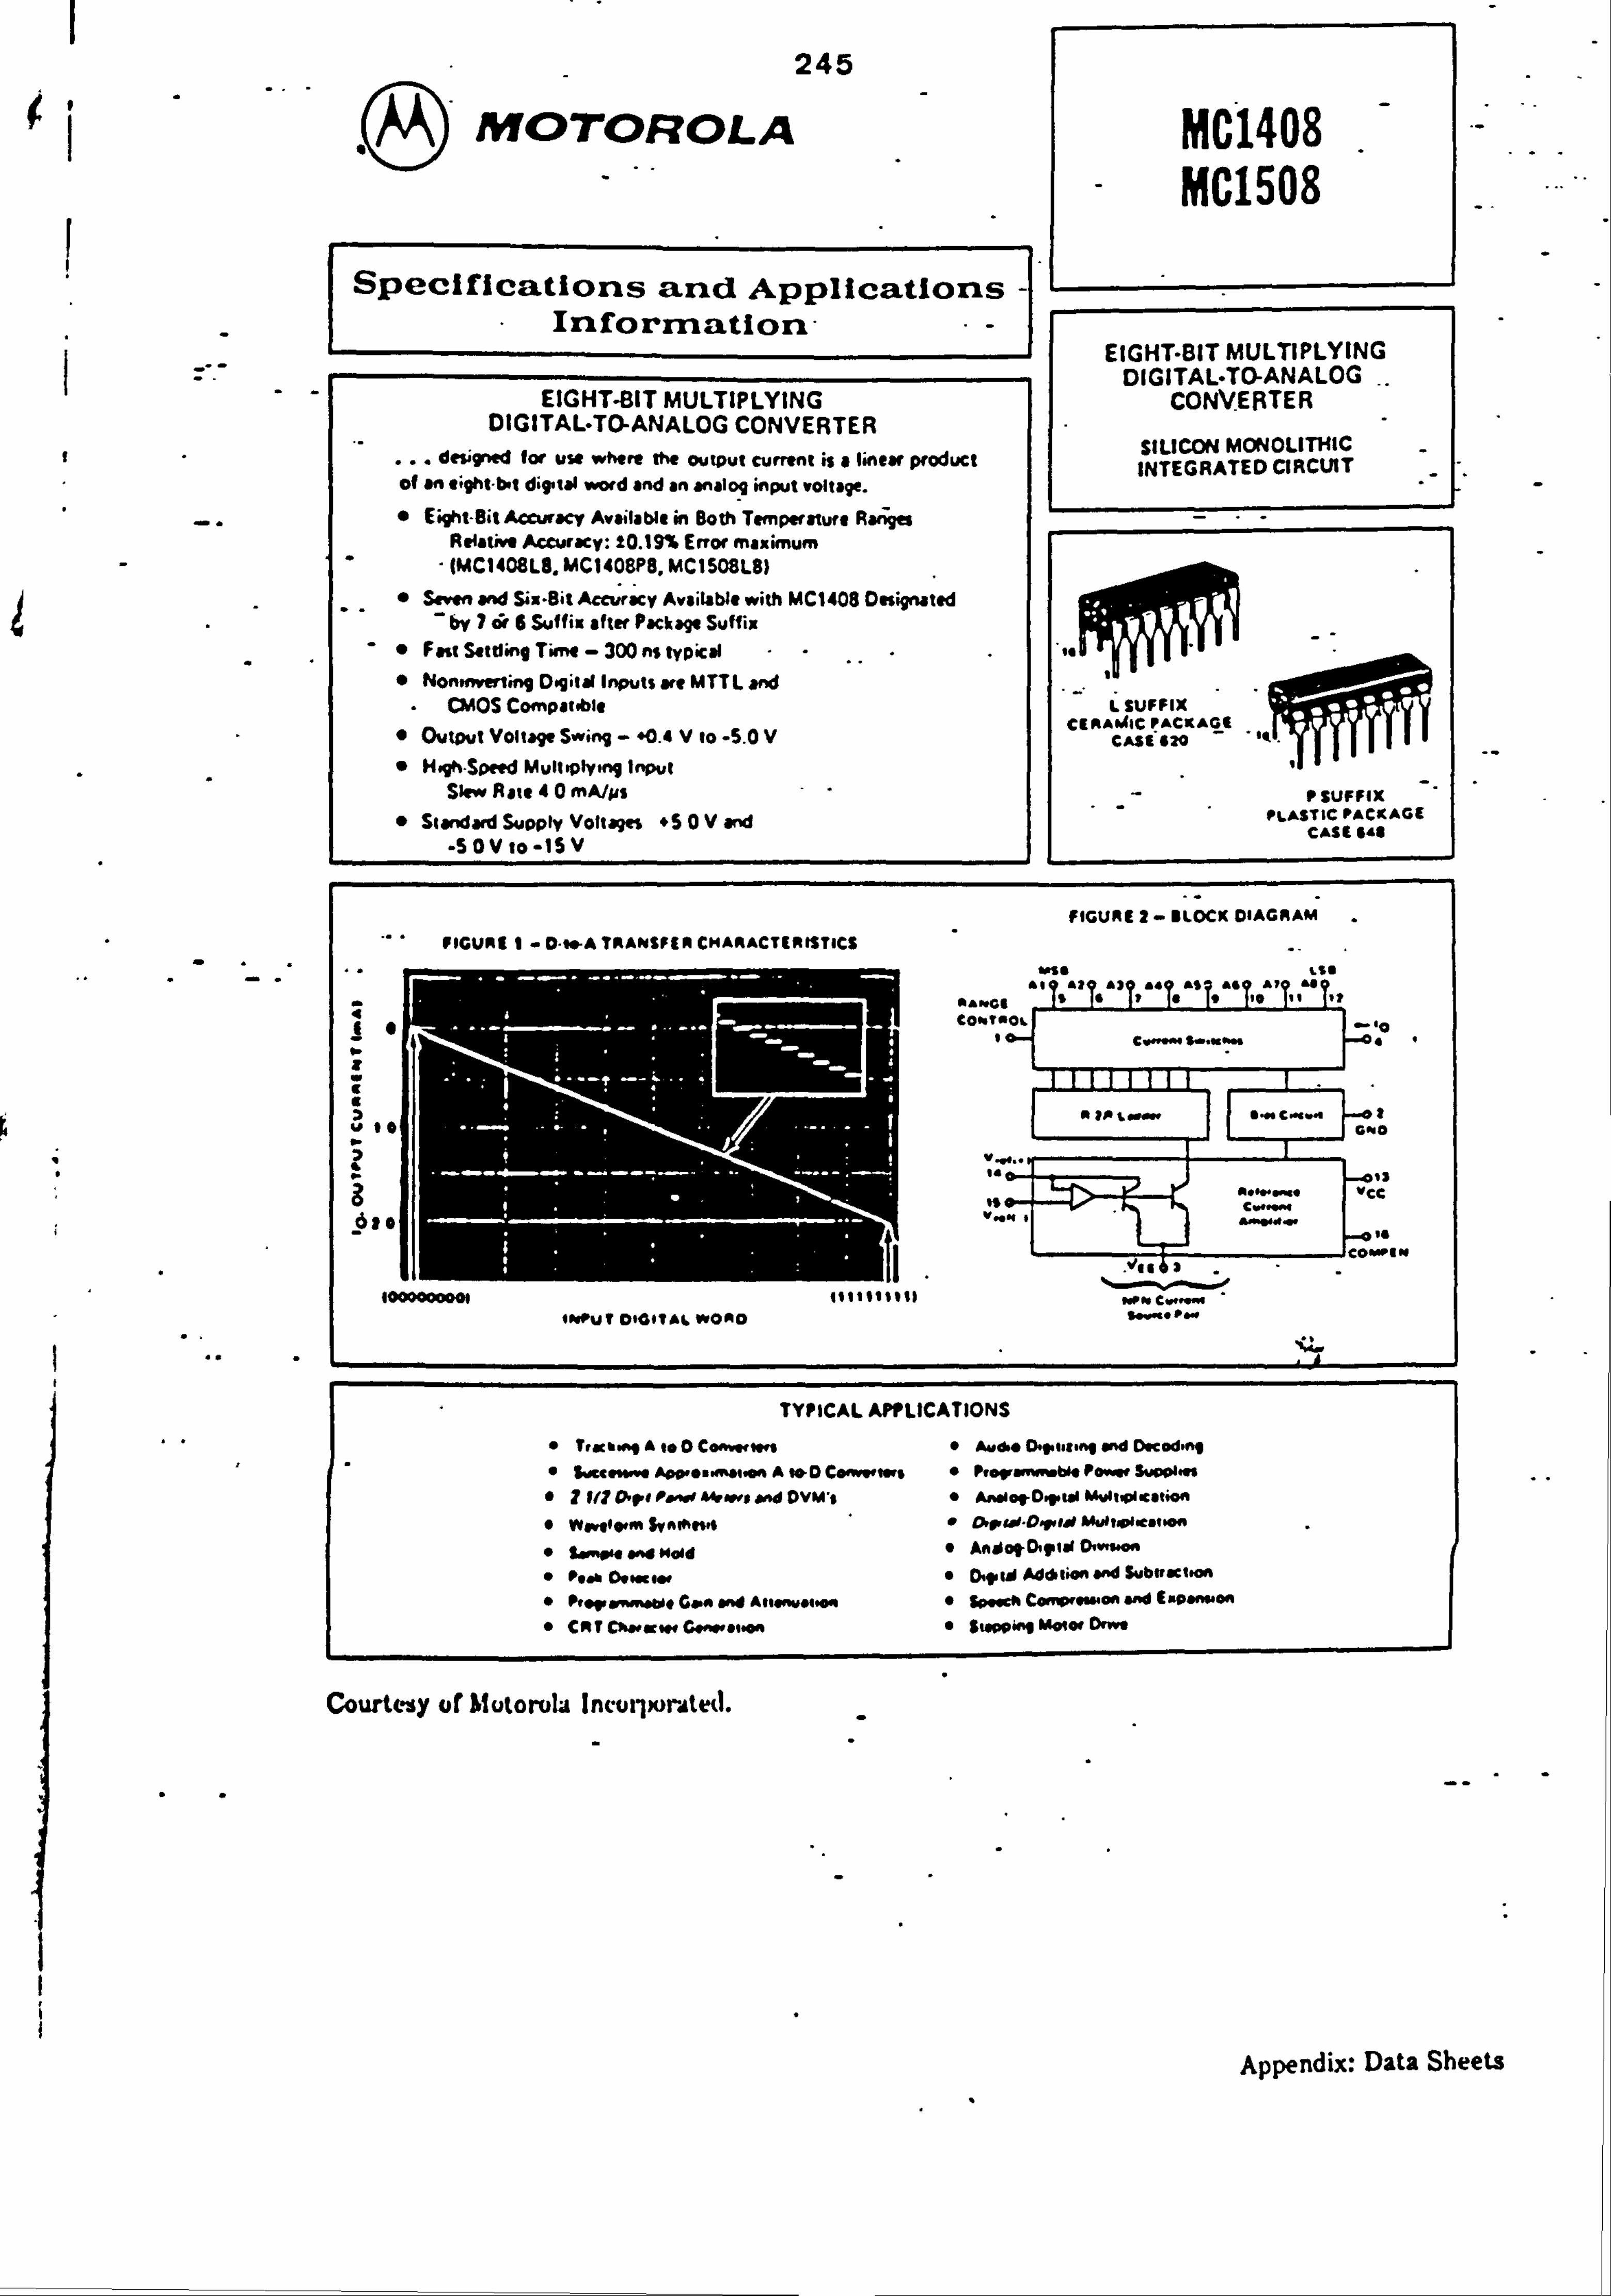
245
MOTOROLA
Specifications and Applications - Information-
4
ILIUM-Ull MULIIFLYINU DIGITAL-TO-ANALOG CONVERTER
desigrwd for use -here the output current is a linear product of an *; qht. b-I digstall word and an analo
-g input voltage.
0 Eight-SitAccuracy Available in Both Temperature Ra4ges Relative Accuracy: 10.19% Error maximum IMC14081.8. MC1408PS, MCI5081.8)
0 Seven wW Six-Sit Accuracy Available with MC1408 Designated by I c; r 6 Suffix after Package Suffix
0 Fast Settling Time - 300 ns typical
0 Nononverting Dogital Inputs are MTTL wid CMOS Compatble
0 Output Vol" Swing - *0.4 V to -S. 0 V
0 Hgh-Speed Multiplying Input Slaw A sit 40 MA/ps
0 St "aid Supply Voft ages +SOVand Sovto-15V
MC1408 MC1508
EIGHT-SIT MULTIPLYING DIGITAL-TO-ANALOG
CONVERTER
SILICON MONOLMIC INTEGRATED CIRCUT
L SUFFIX CKFkAk4lC PACKAGE
CASI'620
P SUFFIX PLASTIC PACKAGE
CASE 648
FIGURE 2- BLOCK DIAGRAM
FIGURE I- D-le-A TRANSFER CHARACTERISTICS
aI A? " AS .6 AI A .4 14 TO T, l, TS '* II 'I
cý
9
w to
o
C il
fill lists$ 400000004" Pft Cý- lisput 01601AL W40010
IQ: I
TYPICAL APPLICATIONS
9 Awd. * 0.1pon, ag ond Docod-ol
0 $wcc@%w-@Aowo-ý&ooaAwDCow#wtws 0 hoq, ýbi* PD. W SWOMMS
ZFf? INrfol~44Fw$*AdDvm, l * A"09.0. rtw M-Alwi-cation
v4mfofn svollft"4 0 alp"V-0, rul mulloo-calw"
0 to 0, ý sftd How 0 AnsiotD. Vial Dwn-on
0 Post, otmow 0 DjomIAdc*ti9nvWSwbtr8clm"
0 Porwvoot Go-^ and Aloo-wooom 0 speaftcomwomonwwExpolopo" 0 cptTclwscwcowooom 0 Stappwq Mow Orwe
Courtesy of Motorola IncoilwrAted.
Appendix: Data Sheets

246
MC1408, MC1508
mAxiMUM RATINGS ITA - *25*C omen aI --amedl
*aw-q svw" Voge unfe
fe. « S. Uwv vouge VCC vEt
-56
-16.3
vde
Q. reat wwi Vgl ule Vs Uv W 12 9 to -b b Voc
AOO. 00 Owwwl weswen VO -0.5. -b. 2
04'weme Cd-nffl 914 - r=
- - -A
J4&weme A~-h- t-14 v14. Vis VC C-Vii Vdc
00«81wn Towo«eWn 0%40w 64c1508 bAC I4(X Solgg 0 to 03
7,11 -6510.150
Vmr ELECTRICAL CHARACTERISTICS IvccA*SGvdcvjz--lsvdr-; ý-,, -2.0#nA. MCISOBLI. TA--55*Coo#1250C.
clWWW"Im Fq., * sv-" M- Typ. M.. U. d
P46*1me Aotwwv liffar ovetme IS full Kate 101 4 E, % Vt 15011 I. G. MC 1408 U. MC 1409n I OL 19
MC14011PIP. MC140110.1" "a" 1 10.31 mc 1 4WO. h0c 140111 I. S. SON Now 1 . 1078
Sotoowq TA* 90 -~ 2112 ILS41-W-On IPLM 1ITA--2b'CJSQ9 hoft 2 6 IS - -- 300 -- P'Spel". 6" Opor twýq 6 OPLH-tPML - 30 100
TA - -2SSC
Owego Fv" Scme Corr"" Oral TCIO - . 20 PPM10C
0'"'. '""' 9" . ". Imse 1 3 Voc 14V% Loo. L994 -11- vf" 20 - - L*W I". L694 -r VIL
0-vido 6.0.1 C. -"l Imsel mA
"4% Lff-0. V114 a0V fill - 0 004
Le. LS-0. VIL 06V OIL I - -04 -08
^0*-WKS 1.0.1 111ý C... Vm IPA ISO 3- Its -1.0 -5.0 pA
0.99wo C. I-"l "o-40 3 $opt A vt I- .5aV 0 20. 2.1 Via - 'IS V- TA - neC
- - -- - 0
- 20 42_
Og". 0 GW-Qq Vms - 1000 V, a 14 - low n
I ro 19 1 2.1
MIA
=011=10.1 3 pA 1 *4 b-to 100A
0. wv v as sop Ce-o-oms di, s0 19% so T^ 21610 VO VdC
PA 19, - :1
PA I soon. Ve I bole" -10 v 40. -0 4
Ago#. *ftQ C. "o-S W. As" 40 -
Owlipwo cv"go I, *~ S~v SO-01-ty as 21 MA/V
09~ i~v CWM-1 3 'cc - 0136 -22 M^ IAN 11.1l l*. W 'it - -IS -13
010~ 1.041" Val" Amet 3 VCCR .4s -so -65 vclc ITS, - . 2secl velpt . 45 As . 16S
pq-m. 0& 3 OD AN 11-fl, low
Via -40 Volt - IN 170
Via . . 15 VOIC - 190 305
*A Ion b. Ift Vt I- .00 Vdt - V1 I- -IS veg - 160
Now 2. All lots smu%"
Appendix: Data SheeLs
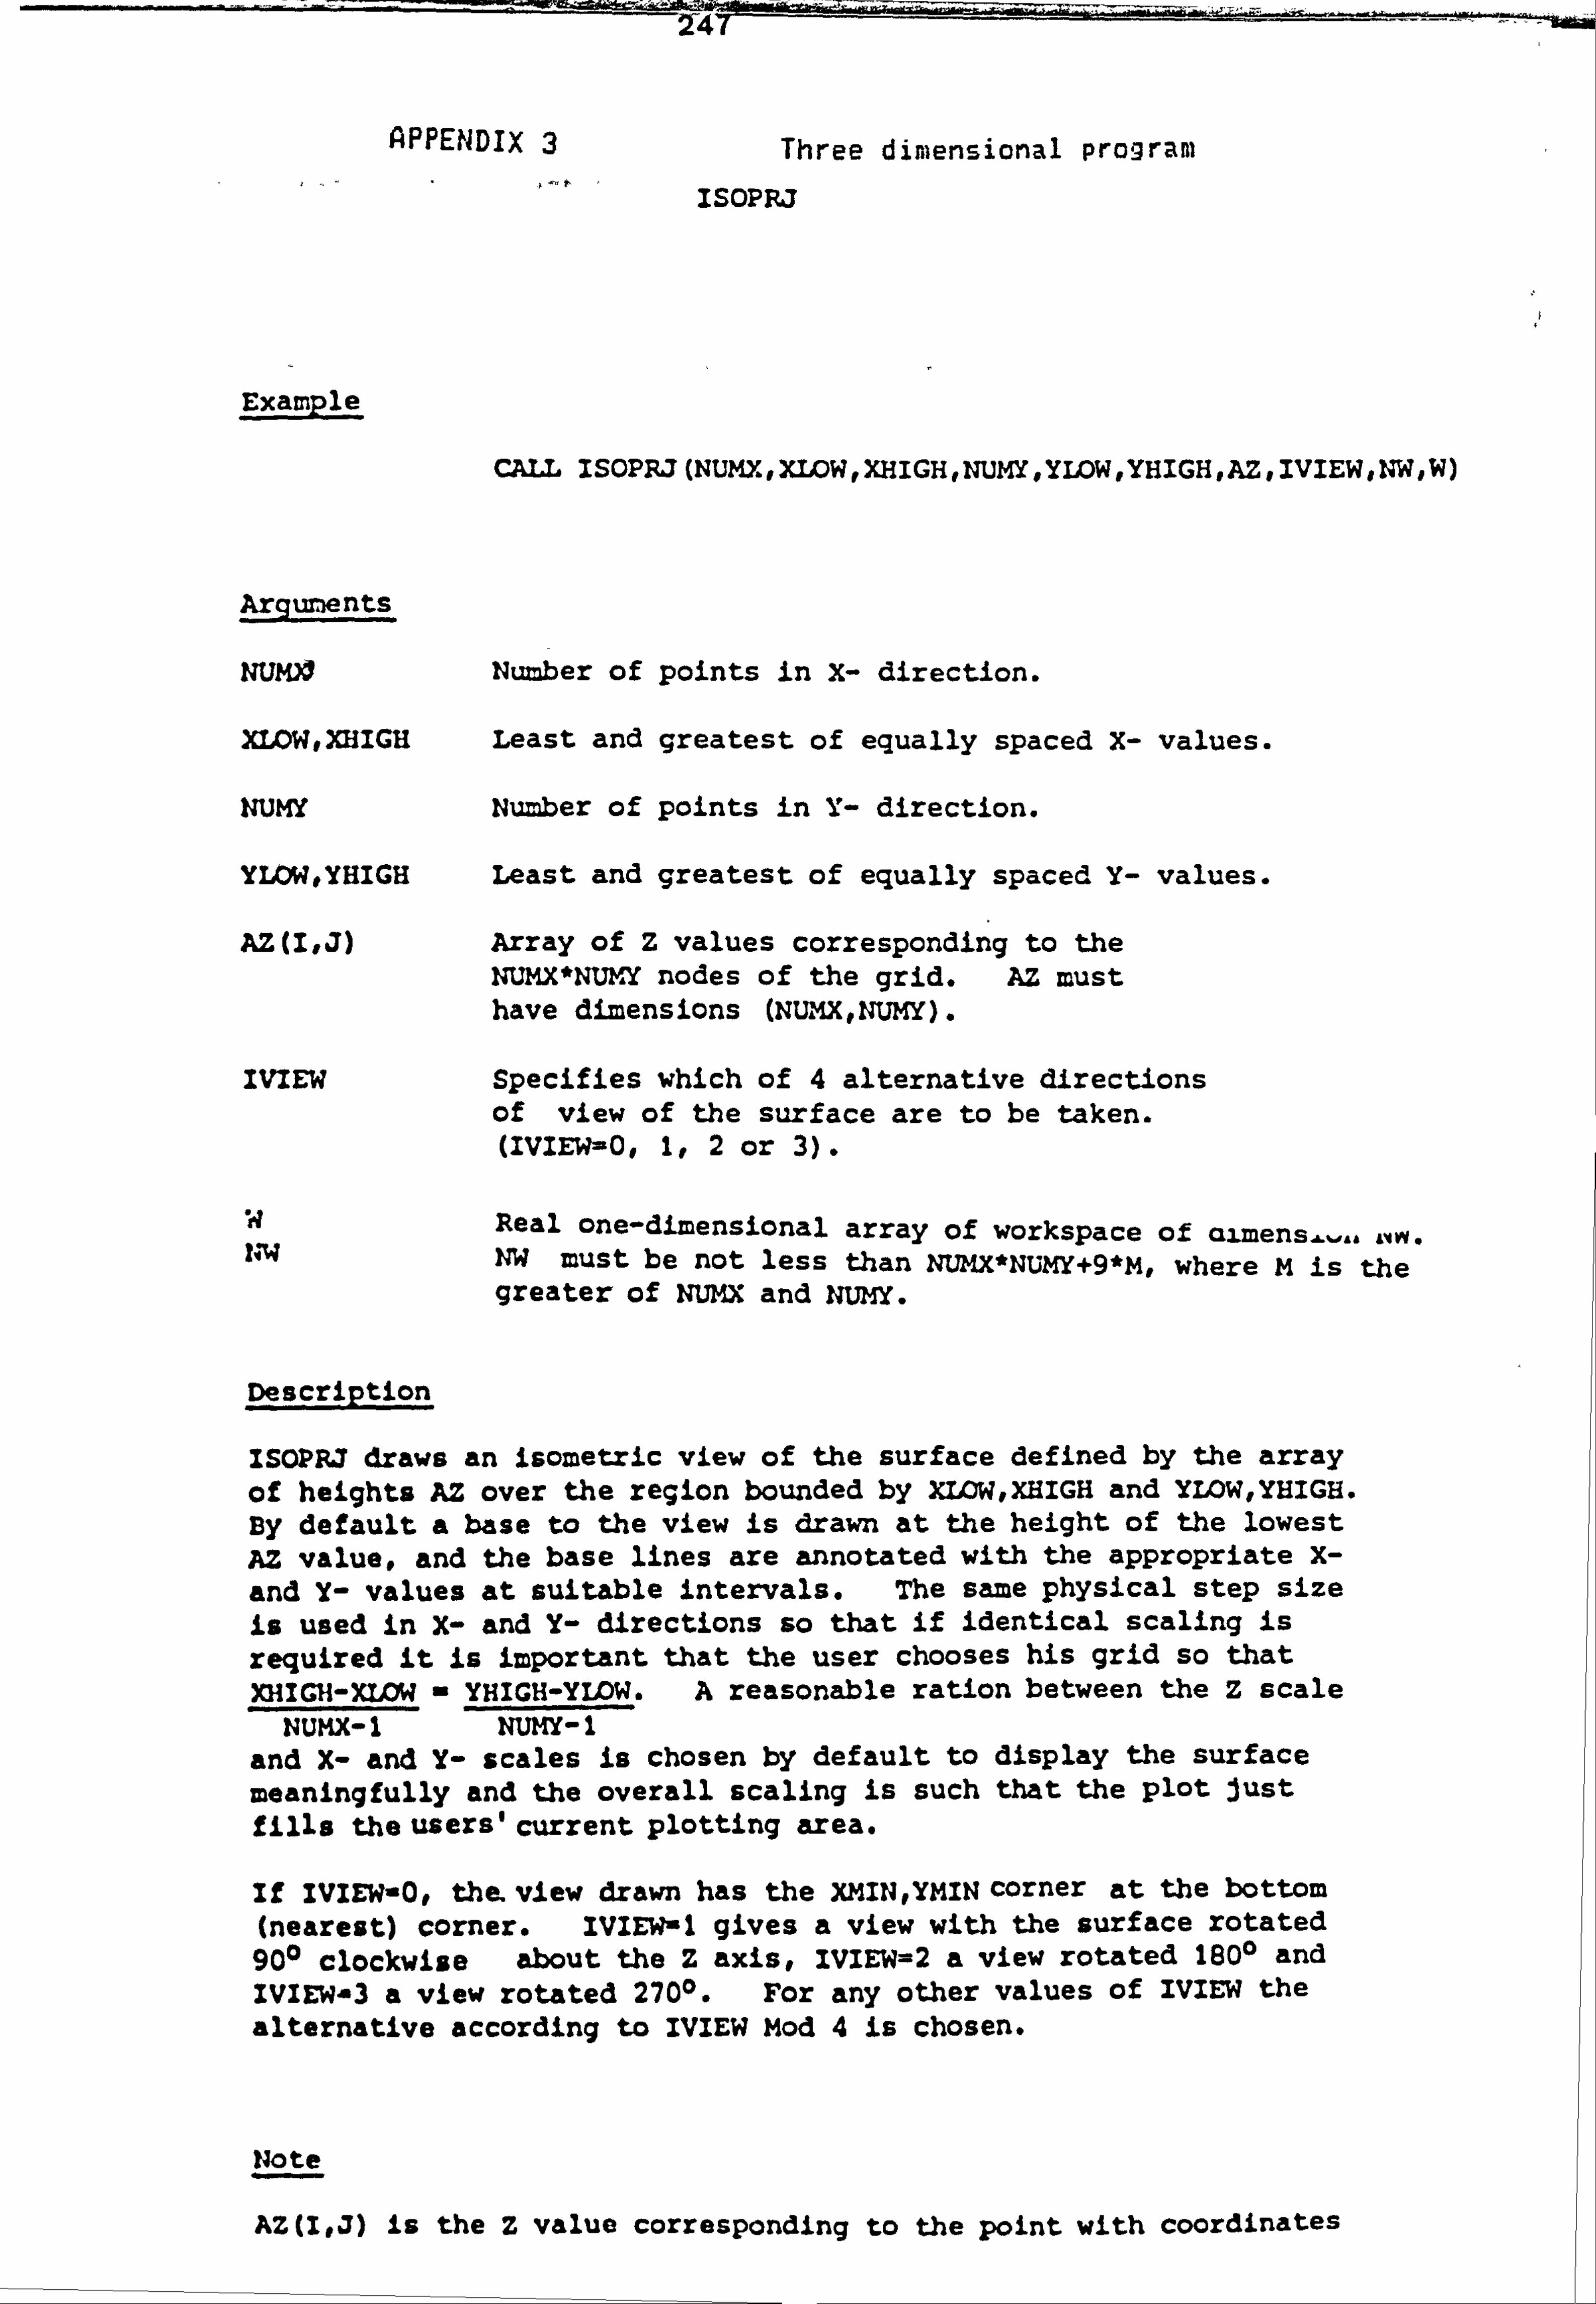
24
APPENDIX 3 Three dimensional program
ISOPRJ
ExaT21e
CALL ISOPRJ(NUMX#XWW, XHIGH, NUMY, YIDW, YHIGH, AZ, IVIEW*NW#W)
Arguments
NUMV Number of points in X- direction.
XLOW, XHIGH Least and greatest of equally spaced X- values.
NUMY Number of points in Y- direction.
YLOW, YHIGH Least and greatest of equally spaced Y- values.
AZU, J) Array of Z values corresponding to the NUMX*NUMY nodes of the grid. AZ must have dimensions (NUMX, NUMY).
IVIEW Specifies which of 4 alternative directions of view of the surface are to be taken. (IVIEW=Oo Ir 2 or 3).
W Real one-dimensional array of workspace of aimensýý.. ow. 104 NW must be not less than NUMX*NUMY+9*M, where M is the greater of NUMX and NUMY.
Description
ISOJ? RJ draws an isometric view of the surface defined by the array of heights AZ over the region bounded by XIDW, XHIGH and YLOW, YHIGH. By default a base to the view is drawn at the height of the lowest AZ value, and the base lines are annotated with the appropriate X- and Y- values at suitable intervals. The same physical step size is used in X- and Y- directions so that if identical scaling is required it is important that the user chooses his grid so that XHICH-XU)W - YHIGH-YIDW. A reasonable ration between the Z scale
NUKX-I NUHY-I and X- and Y- scales is chosen by default to display the surface meaningfully and the overall scaling is such that the plot just fills the users I current plotting area.
If IVIEW-Op the. view drawn has the XMIN, YMIN corner at the bottom (nearest) corner. IVIEwal gives a view with the surface rotated 900 clockwise about the Z axis, IVIEW=2 a view rotated 1800 and IVIEW-3 a view rotated 2700. For any other values of IVIEW the alternative according to VIEW Mod 4 is chosen.
Note
AZ(I, J) is the Z value corresponding to the point with coordinates

248
CI*******aa**a***al*a****aa**a***LIJuLI ca cx C THREE DTMENSP)MAL PROGRAM 9Y
M. JABERANSARI c c***-*, **-***u**a**'***JIuI*M***m***JIuI*MM*Il1I
DIMENSION XX(10,30), YY(10,30), ZARR(10,30) REAL WW(2000) CHARACTER FILE*BOvQ*l
10 PRINT*IFUHAT IS NUMBER OF ROWS IN DATA FILM S)p READ(lp*)h PRINT *, vWHAT IS NUMBER OF COLUMBS IN DATA FILKY S)' READ(1, *)N XL=9999999 XH=O YL=9999999 YH=O PRINT*, ISPECIFY WHICH DIRECTION OF VIEW TO BE TAKEN(Oyl, 2 OR 31 READ(1, *)X
cccc OPEN THE DATA FILE: PRINT*11ENTER NAME OF DATA FILE; ' READ(lj(A)l)FILE OKN(5, FILE=FILE)
cccc READ THE X, Y, Z VALUES READ (5, *)M. N
. Do 50 1-1, M IýI DO 50 J=I, N READ(5, *)XX(I, J), YY(IyJ), ZARR(I, J)
Cccc FIND THE SMALLEST AND LARGEST VALUES OF X IF (XX(I, J) LT. XL) XL=XX(I, J) IF (XX(I, J) GT. XH) XH=XX(I, J)
CCcC FIND THE SMALLEST AND LARGEST VALUES OF Y X (YY(I, J) LT. YL) YL=YY(I, J)
50 IF (YYK, J) LT. YH) YH=YY(ItJ)
, CALL PLN NW=2000 CALL ISOPRJ (M, XL, XH, N, YL, YH, ZARR, X, NW, WW) CALL DEVEND CLOSE(5) CLOSECI) PRINTM, IDO YOU WISH TO PLOT ANOTHER GRAPH? (Y/N)l READ(1, '(A)1)0 IF (O. EP. IYI)THEN GOTO 10 ENDIF STOP END
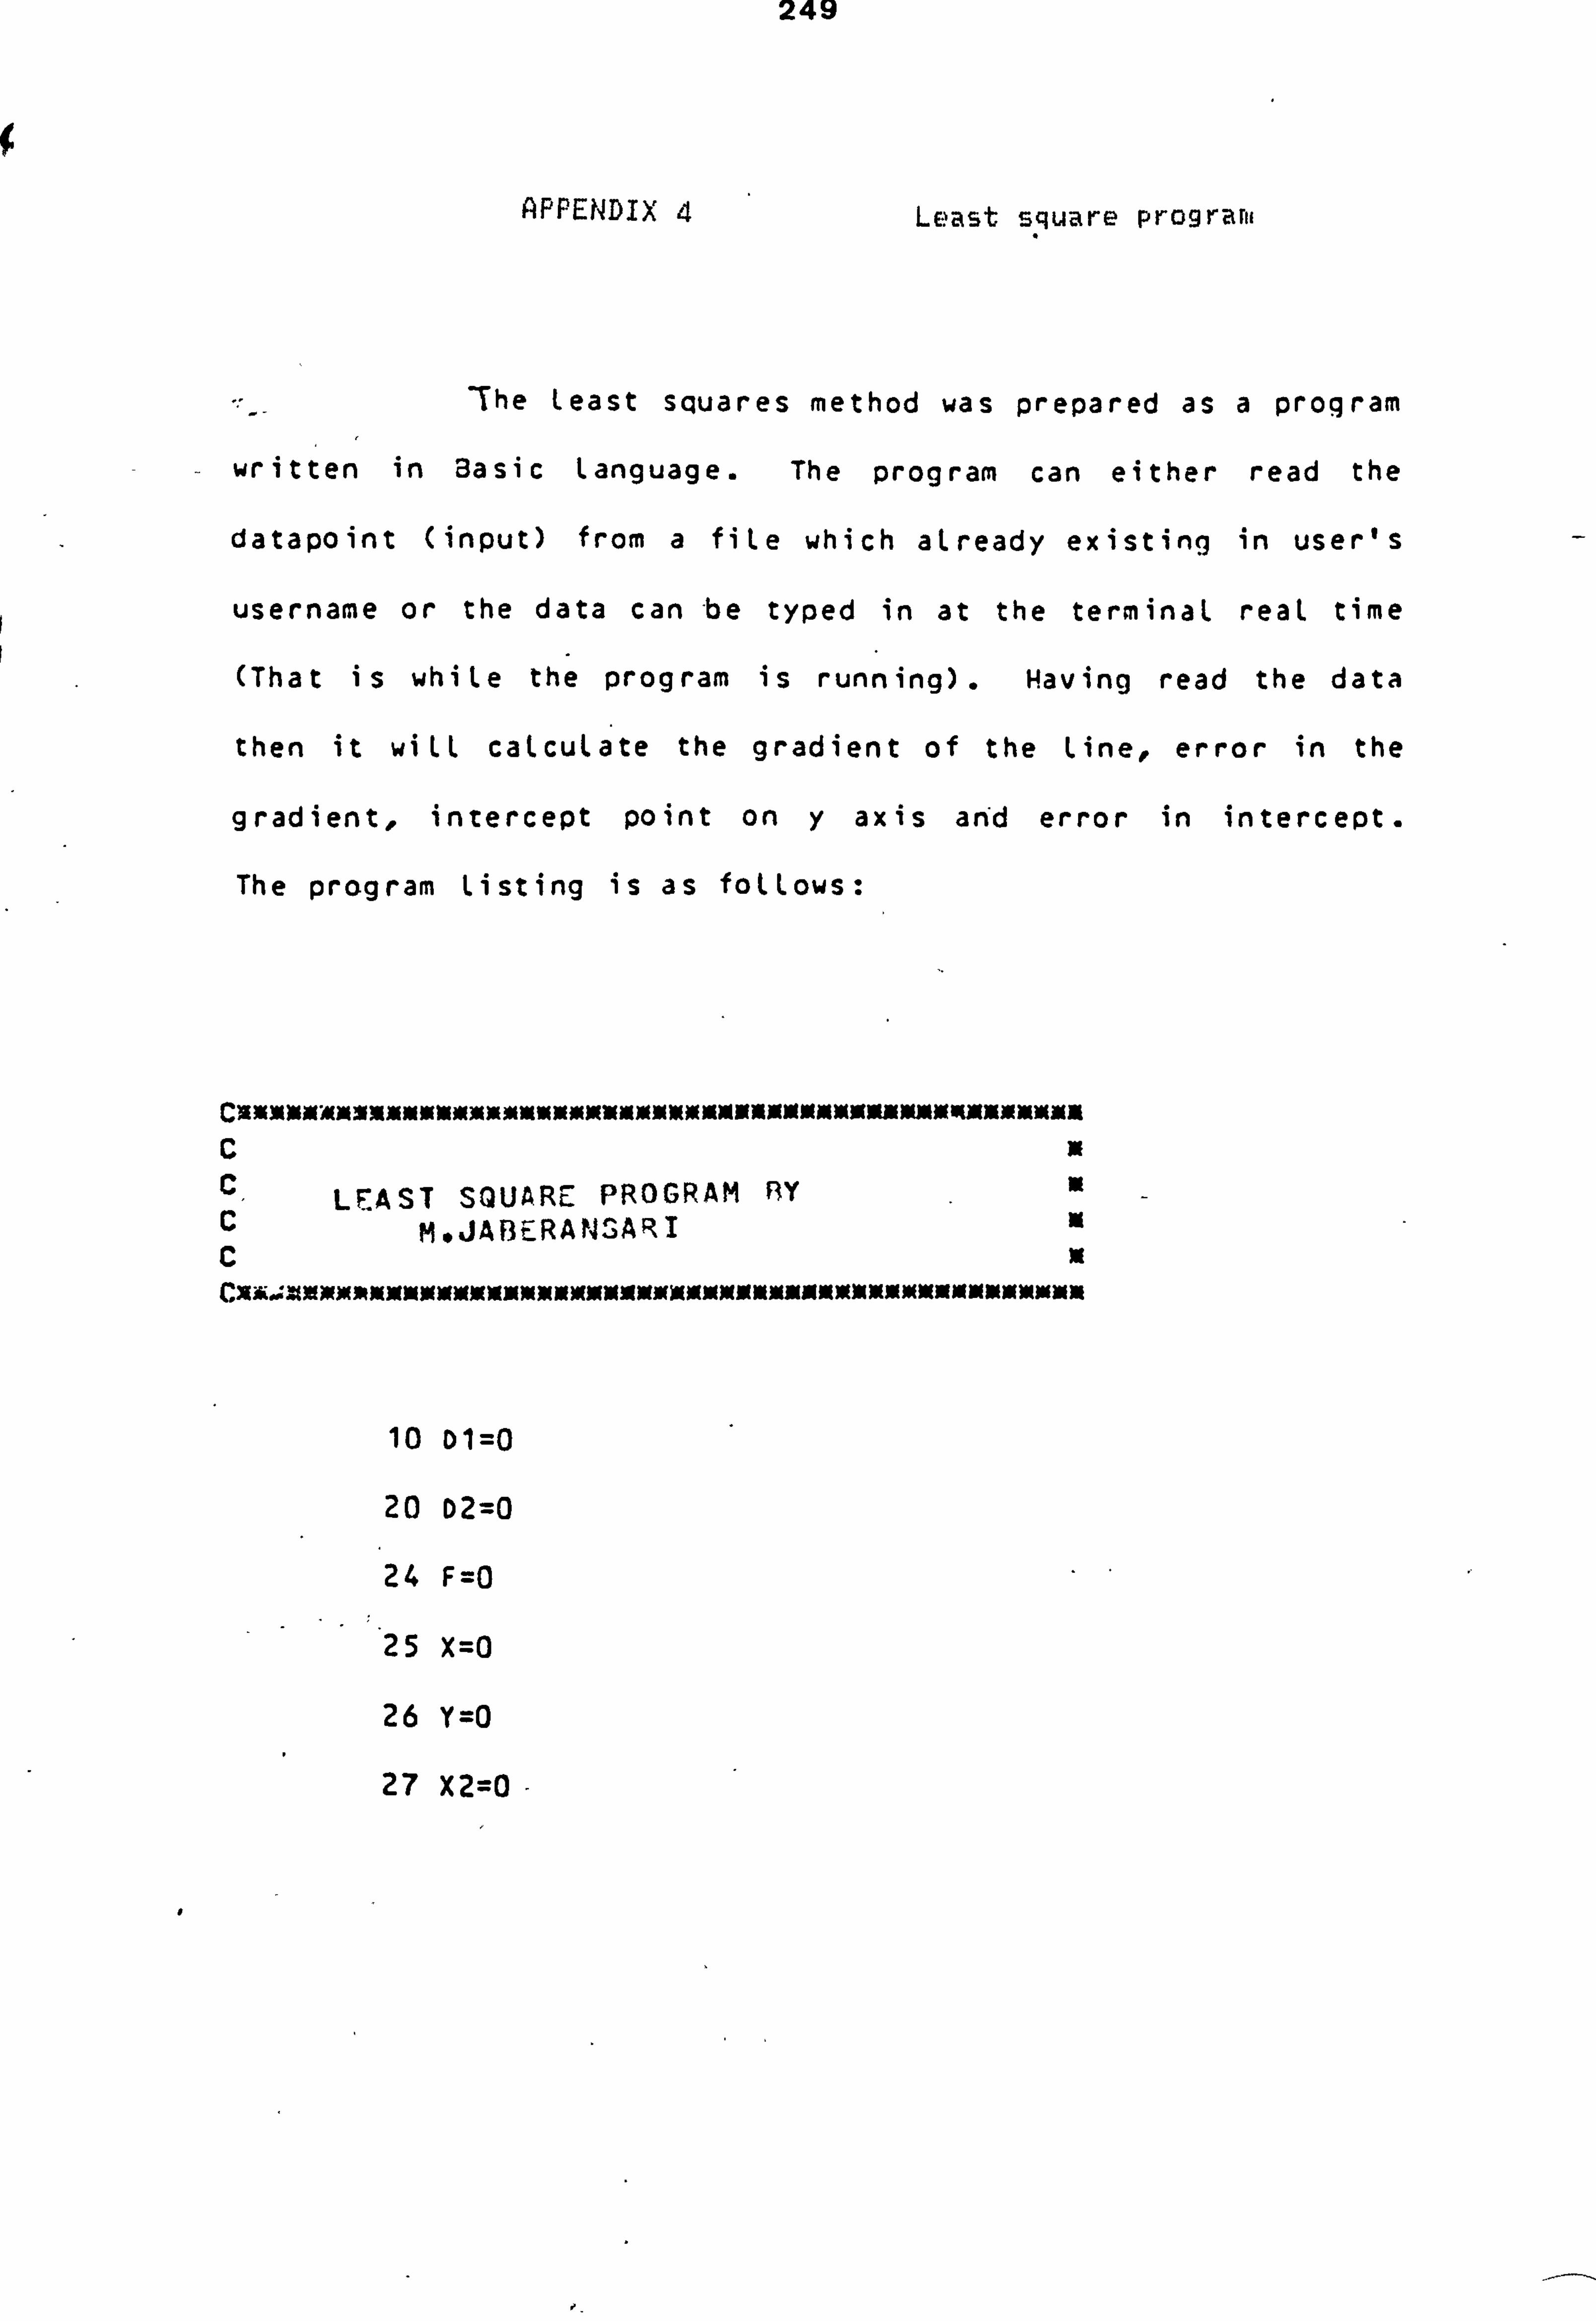
249
APPENDIX 4 Least square program
-The Least squares method was prepared as a program
- written in Basic Language. The program can either read the
datapoint (input) from a fiLe which aLready existing in user's
username or the data can -be typed in at the terminaL reaL time
(That is whiLe the program is running). Having read the data
then it A LL caLcuLate the gradient of the Line, error in the
gradient, intercept point on y axis add error in intercept.
The program Listing is as foLLows:
c C, LEAST SQUARE PROGRAM BY c M*JABERAN. ^)ARI c
10 Dl=O
20 D2=0
24 F=O
25 X=O
26 Y=O
27 X2=0

250
28 Y2=0
29 PRINT "DO YOU WISH TO ENTER DATA POINTS AT THIS TERMINAL, "
30 PRINT "OR DO YOU WISH TO READ THE DATA FROM A FILE(T OR F)"
35 INPUT A$
40 IF A$="F" THEN GOTO 330
50 PRINT "PLEASE INPUT THE NUMBER OF DATA POINTS YOU WISH TO CALCULATE"
70 INPUT N
75-REM READ THE DATA FIREST
8n FOR I=l TO N
90 PRI14T "X VALUE OF POINT ", I
100 INPUT X(I)
110 PRINT "Y VALUE OF POINT ", I
120 INPUT Y(I)
130 X=X+X(I)
140 Y=Y+Y(I)
145 X2=X2+X(I)**2
147 Y2=Y2+Y(I)^2
160 NEXT 1
161 PRINT
162 PRINT
163 PRINT
165 PR INT N, "DATA POINTS READ"
166 PRINT
167 PRINT
170 PRINT "PLEASE SPECIFY THE SYMBOL TO BE CALCULATED"
171 PRINT "A FOR ALL"
177 PRINT "EM FOR GRADIENT AND ERROR IN GRADIENT"
178 PRINT "EC FOR INTERCEPT AND ERROR IN INTERCEPT"
179 INPUT PS
188 FOR I=l TO N

251
189 Dl=Dl+(X(I)-X/N)'2
190 D2=D2+((X(I)-X/N)*Y(I))
195 NEXT I
200 LET M=D2/Dl
210 LET C=(Y/N-M*X/N)
220 FOR I=l TO N
230 F2=(Y(I)-M*X(I)-C)-2
235 F=F+F2
240 NEXT I
250 El=SQR(F/((ti-2)*Dl))
260 E2=SQR((l+X2/Dl)*(F/(ti*(N-2))))
265 M=D2/Dl
266 IF P$="EC" THEN GOTO 3no
270 PRINT" THE GRADIENT M IS ", M
280 PRINT" THE ERROR 114 THE GRADIENT IS ", El
285 IF PS="A" THEN GOTO 300
290 GOTO 330
300 PRINT "THE INTERCEPT ON Y AXIS C IS ", C
310 PRINT" THE ERROR IN THE INTERCEPT IS '*, E2
312 GOTO 400
330 PRINT "TYPE THE NAME OF THE FILE WHERE DATA SHOULD BE READ"
340 INPUT FS
350 DEFINE FILE #1="F$"
360 FOR I=I TO N
370 READ #1, X(I), Y(I)
380 X=X+X(I)
385 Y=Y+Y(I)
387 X2=X2+X(I)^2
389 Y2=Y2+Y(I)^2
390 NEXT I
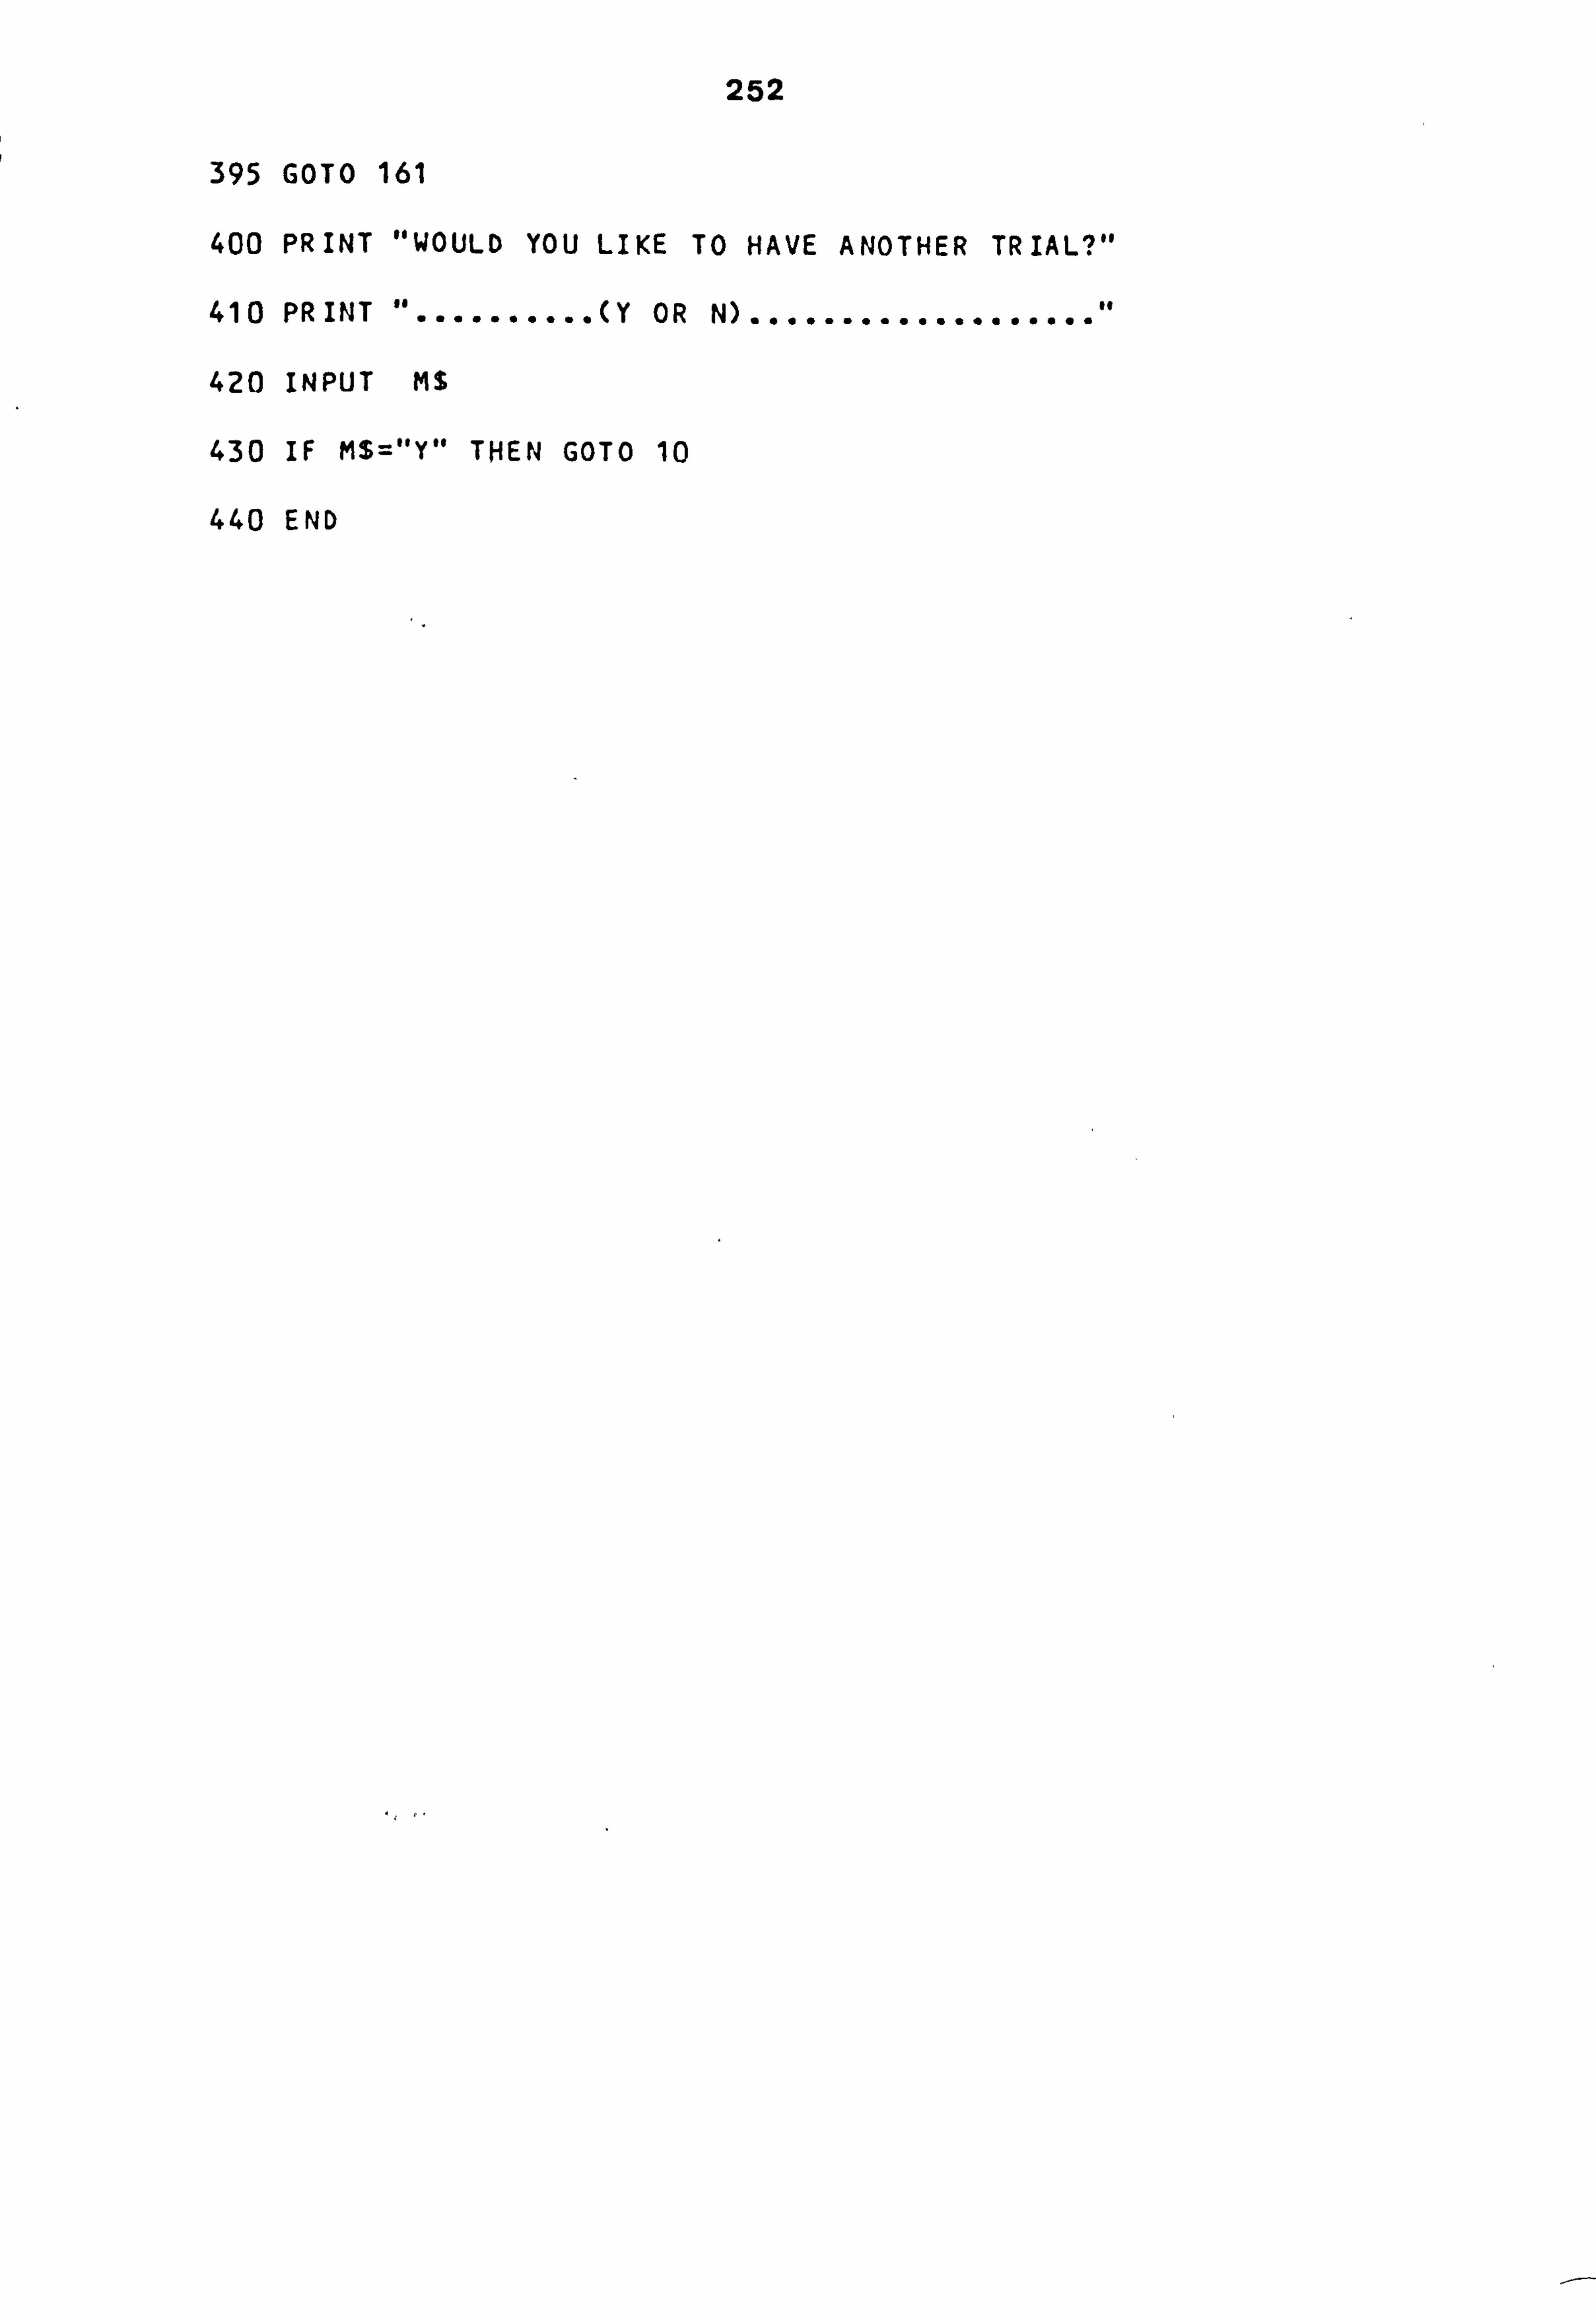
252
395 GOTO 161
400 PRINT "WOULD YOU LIKE TO HAVE ANOTHER TRIAL? "
410 PRINT ............ (Y OR N) ................... I'
420 INPUT MS
430 IF M$ý"Y" THEN GOTO 10
440 END
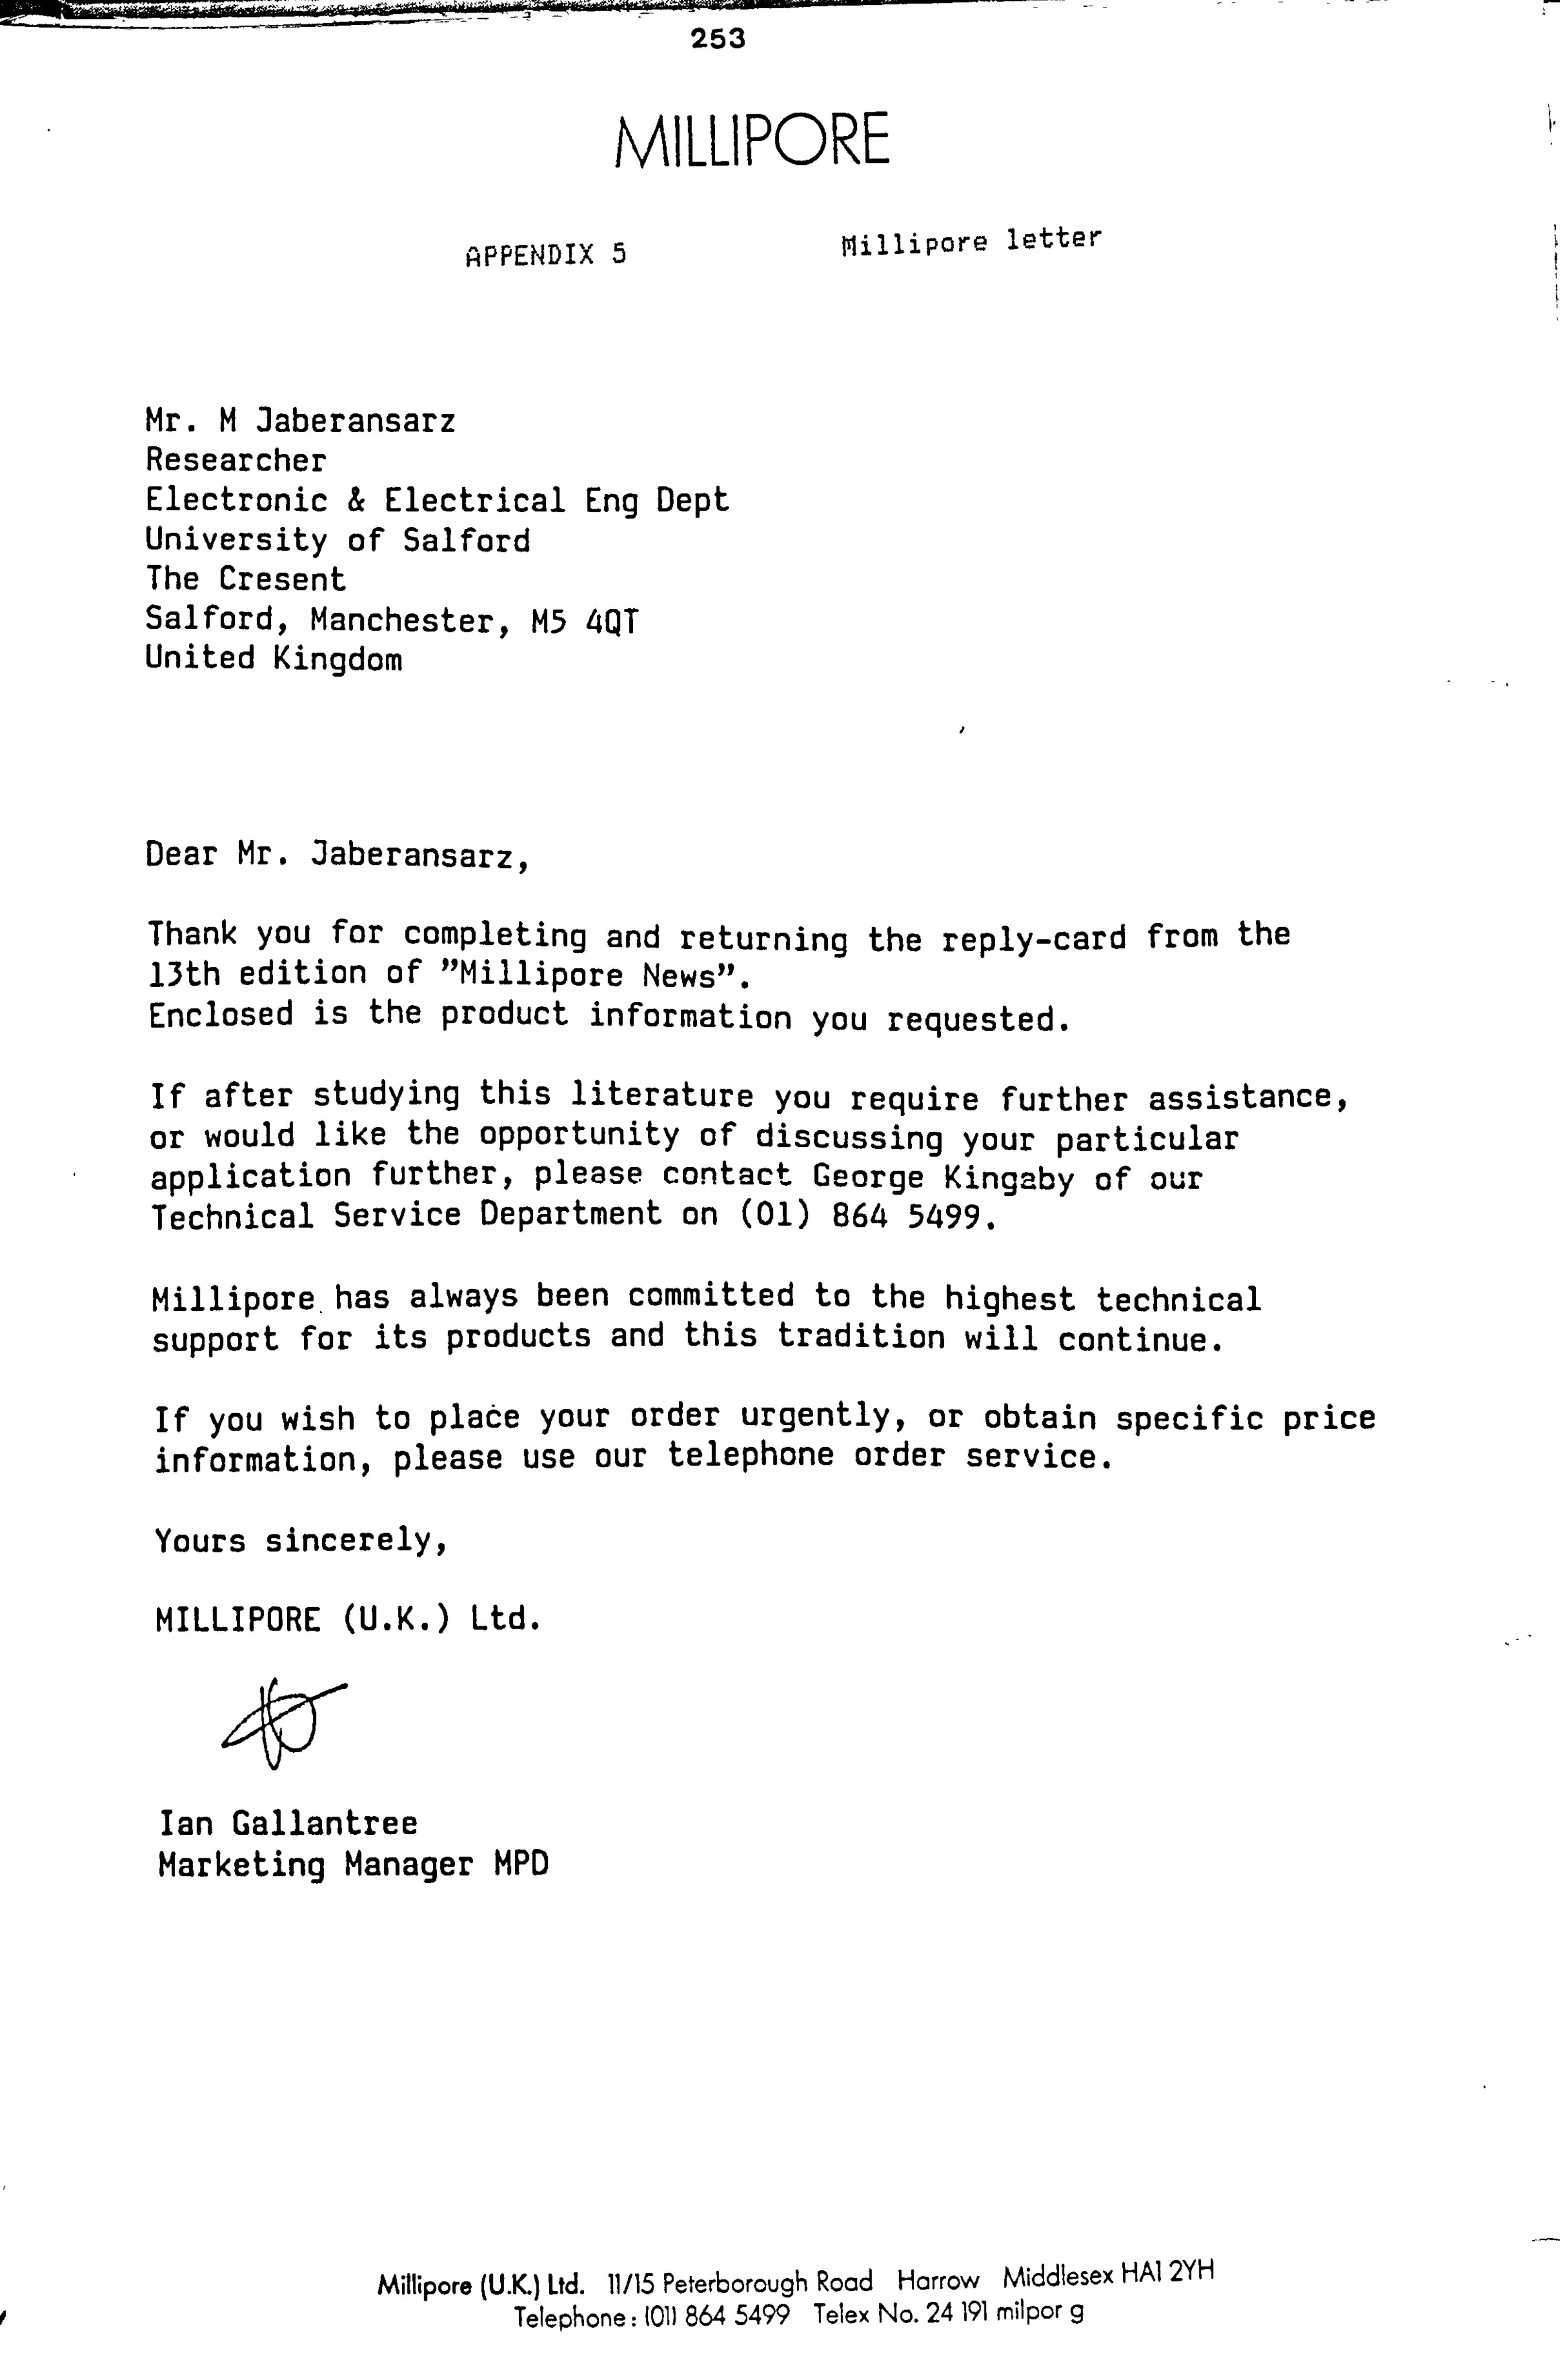
253
MILLIPORE APPENDIX 5 Millipore letter
Mr. M Jaberansarz Researcher Electronic & Electrical Eng Dept University of Salford The Cresent Salford, Manchester, M5 4QT United Kingdom
Dear Mr. Jaberansarz,
Thank you for completing and returning the reply-card from the 13th edition of "Millipore News". Enclosed is the product information you requested.
If after studying this literature You require further assistance, or would like the opportunity of discussing your particular application further, please contact George Kingaby of our Technical Service Department an (01) 864 5499.
Millipore. has always been committed to the highest technical support for its products and this tradition will continue.
If you wish to plate your order urgently, or obtain specific price information, please use our telephone order service.
Yours sincerely,
MILLIPORE (U. K. ) Ltd.
4D, ý' Ian Gallantree Marketing Manager MPD
Millipore (U. K. ) Ltd. 11/15 Peterborough Road Harrow Middlesex HAI 2YH Telephone: 1011864 5499 Telex No. 24 191 milpor 9
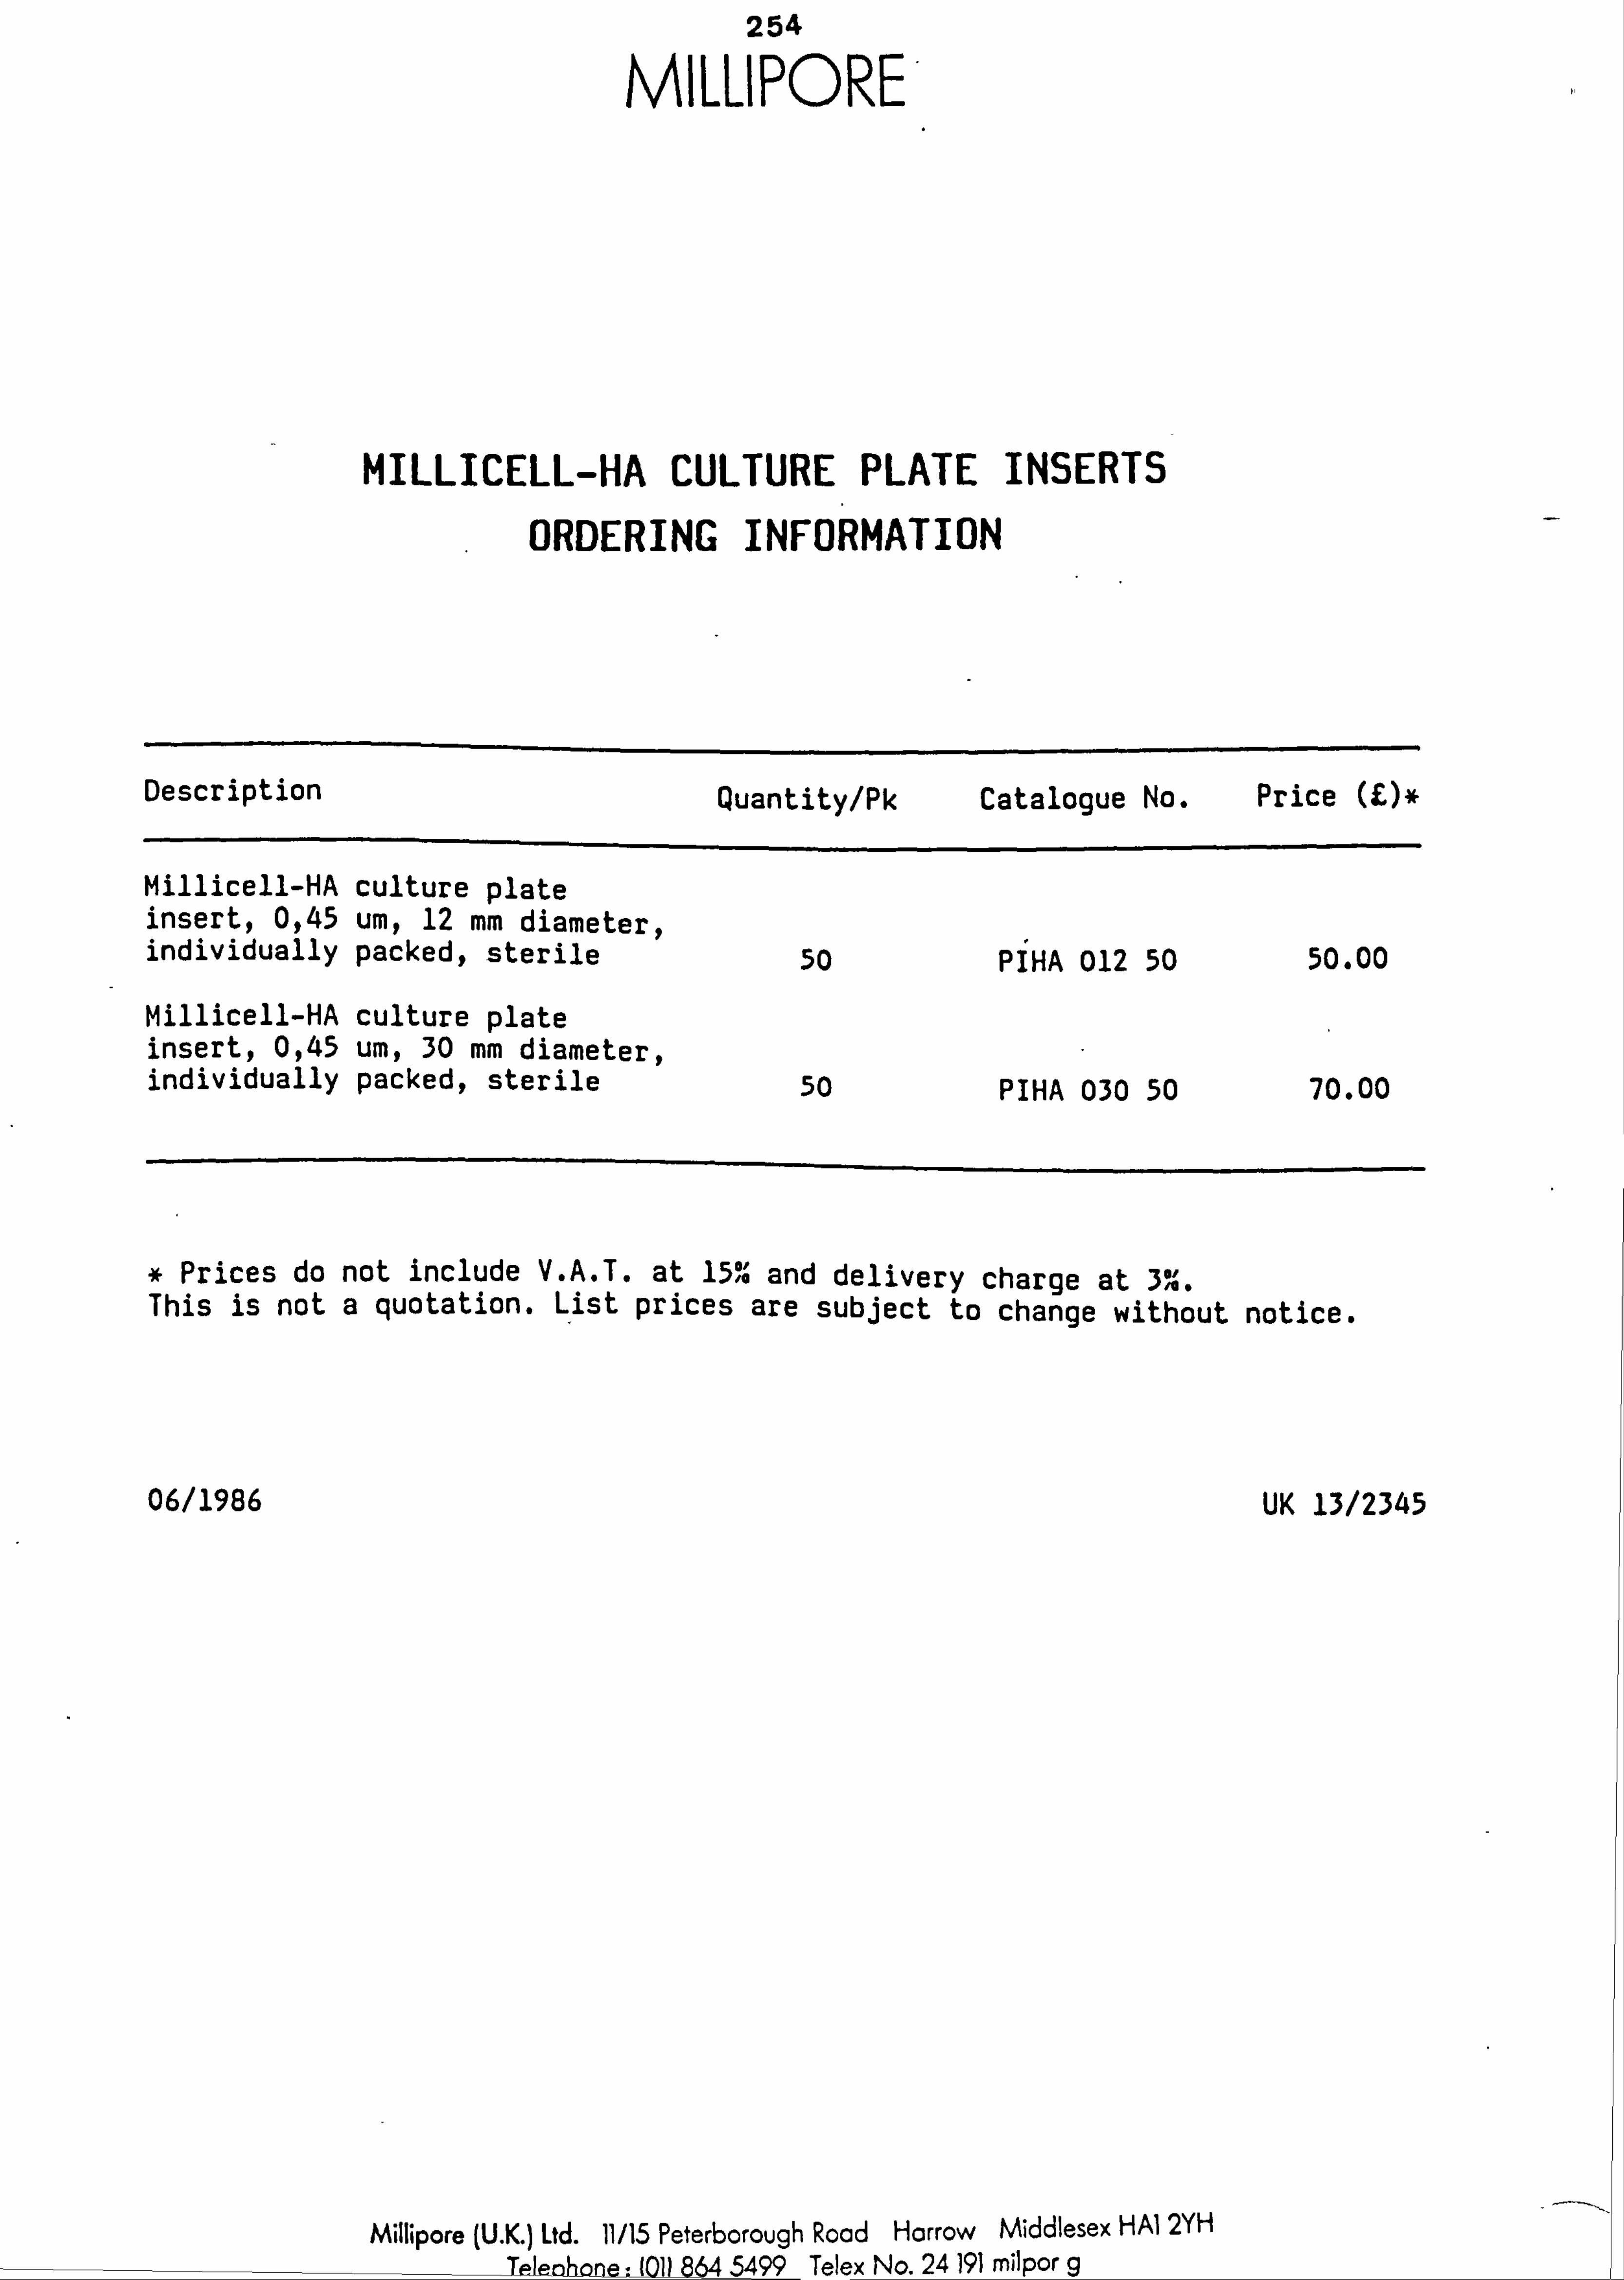
254
MILLIPORE
MILLICELL-HA CULTURE PLATE INSERTS ORDERING INFORMATION
Description Quantity/Pk Catalogue No. Price W*
Millicell-HA culture plate insert, 0,45 um, 12 mm diameter, individually packed, sterile 50 PIHA 012 50 50.00
Millicell-HA culture plate insert, 0,45 um, 30 mm diameter, individually packed, sterile 50 PIHA 030 50 70.00
* Prices do not include V. A. T. at 15% and delivery charge at 3.00'. This is not a quotation. List prices are subject to change without notice.
06/1986 UK 13/2345
Millipore (U. K. ) Ltd. 11/15 Peterborough Road Harrow Middlesex HA1 2YH T-1--k-. IN' ^'' -99 Telex No. 24 191 milpor g

255
PUBLICATION
AARHOLT, E., JABERANSARI, M., JAFARY-ASL, A. H., MARSH, P. N., SMITH, C. W. NMRConditions and biological systems, in: Marino, A. A. (ed). Handbook
of bioelectricity. Marcel Dekker, New York, 1988, Chap. 26.
Recommended