Quarterly Journal of Political Science, 2013, 8: 159–182
Electoral and Policy Consequences of
Voter Turnout: Evidence from
Compulsory Voting in Australia
Anthony Fowler∗
Department of Government, Harvard University, Cambridge, MA, USA;
ABSTRACT
Despite extensive research on voting, there is little evidence connecting
turnout to tangible outcomes. Would election results and public policy
be different if everyone voted? The adoption of compulsory voting in
Australia provides a rare opportunity to address this question. First, I
collect two novel data sources to assess the extent of turnout inequality
in Australia before compulsory voting. Overwhelmingly, wealthy citi-
zens voted more than their working-class counterparts. Next, exploiting
∗ Many thanks to Steve Ansolabehere, Judy Brett, Gloria Chao, Ryan Enos, JeremyFerwerda, Antony Green, Jens Hainmueller, Andy Hall, Eitan Hersh, John Hirst, MikeHiscox, Greg Huber, Keith Krehbiel, Gabe Lenz, Peter Lindert, Krista Loose, MicheleMargolis, Michele Matthews, Aaron Martin, Nolan McCarty, Max Palmer, Jim Sny-der, Sally Young, numerous librarians at the State Library of Victoria and the BendigoLibrary, and seminar participants at Harvard, MIT, Caltech, Princeton, La Trobe Uni-versity, and the University of Melbourne. A special thank you is owed to Harvard’sCommittee on Australian Studies for financial support.
Online Appendix available from:http://dx.doi.org/10.1561/100.00012055 appSupplementary Material available from:http://dx.doi.org/10.1561/100.00012055 suppMS submitted 7 June 2012 ; final version received 15 December 2012
ISSN 1554-0626; DOI 10.1561/100.00012055c© 2013 A. Fowler

160 Electoral and Policy Consequences of Voter Turnout
the differential adoption of compulsory voting across states, I find that
the policy increased voter turnout by 24 percentage points which in turn
increased the vote shares and seat shares of the Labor Party by 7–10
percentage points. Finally, comparing across OECD countries, I find
that Australia’s adoption of compulsory voting significantly increased
turnout and pension spending at the national level. Results suggest
that democracies with voluntary voting do not represent the preferences
of all citizens. Instead, increased voter turnout can dramatically alter
election outcomes and resulting public policies.
In most democracies, voting is voluntary. Citizens can expend a small cost in
exchange for a small chance that they will change the outcome of an election.
Voters are those who care deeply about politics, have a lot at stake, possess
disposable time and resources, or receive utility from the act of voting itself
(Riker and Ordeshook, 1968). As a result, voters may be unrepresentative of
the population as a whole. Typically, they are wealthier and more educated
than nonvoters which could bias public policy in favor of the few. In this
paper, I turn to early twentieth century Australia to address a fundamental
question of democracy: Would election results and public policy be different
if everyone voted?
Previous evidence on this question is conflicted and suffers from method-
ological limitations. Correlational studies show that the association between
turnout and partisan election results can be large (McAllister and Mughan,
1986; Nagel, 1988; Radcliff, 1994; Pacel and Radcliff, 1995; Fisher, 2007;
Hill, 2010), small (Nagel and McNulty, 1996; Grofman et al., 1999; Martinez
and Hill, 2007), or nonexistent (DeNardo, 1980; Erikson, 1995). Further
studies of survey data conclude that higher turnout may benefit left-wing
parties significantly (Herron, 1998; Mackerras and McAllister, 1999), mini-
mally (Citrin et al., 2003; Martinez and Gill, 2005; Bernhagen and Marsh,
2007; Pettersen and Rose, 2007), or not at all (Highton and Wolfinger, 2001;
Rubenson et al., 2007). Finally, studies of small exogenous shocks to turnout
suggest that the effects of turnout on election results and public policy can
be large (Anzia, 2011, 2012; Fowler, 2012; Hansford and Gomez, 2010) or
small (Berry and Gersen, 2011; Knack and White, 1998; Sled, 2008; Stein,
1998; van der Eijk and van Egmond, 2007).
Fowler 161
As a result of methodological limitations, no previous study adequately
addresses the primary question of interest. Confounding variables, reverse
causation, and model misspecification may bias the correlational and survey
studies. The most compelling causal evidence on the effects of turnout comes
from studies of small shocks to turnout. These studies address a separate
question about the effects of marginal changes to voter turnout, but they
do not assess the effects of near-universal turnout. If marginal voters are
unrepresentative of the entire population of nonvoters, then these studies do
not speak to the counterfactual question at hand. To determine what would
happen if everyone voted, we need a policy change that closely mimics the
ideal counterfactual — one where almost everyone is brought to the polls.
This paper analyzes the adoption of compulsory voting laws in Australia
as a unique opportunity to assess the effects of near-universal turnout.
First, I present a brief history of compulsory voting laws in Australia and
explain why this policy change provides such a unique opportunity. Next, I
analyze two novel data sources to determine which types of citizens voted
in Australia before the adoption of compulsory voting. Overwhelmingly,
wealthy and property-owning citizens turned out at higher rates leading to
the hypothesis that compulsory voting benefits the Labor Party and progres-
sive policies. Then, I exploit the differential adoption of compulsory voting
laws across Australian state assembly elections. A difference-in-difference
analysis shows that compulsory voting caused a 24 percentage point increase
in voter turnout and a 7–10 percentage point increase in the vote shares and
seat shares of the Labor Party. Finally, I exploit the adoption of compul-
sory voting at the national level to test for public policy effects. A synthetic
control analysis comparing Australia with other comparable OECD nations
demonstrates that the national adoption of compulsory voting caused sig-
nificant increases in voter turnout and pension spending. I conclude by
discussing the implications of these results for modern democracies with
voluntary voting.
1 Compulsory Voting in Australia
When it comes to democracy, Australia is an innovator. Australia was one
of the first nations to establish universal suffrage, instant-runoff voting, and
the secret ballot. Keeping with the tradition of a fair, expansive democracy,
compulsory voting was first advocated by Alfred Deakin at the turn of the

162 Electoral and Policy Consequences of Voter Turnout
twentieth century (Evans, 2006). Deakin was the second Prime Minister of
the Commonwealth and a member of the Protectionist Party. The political
system in Australia approximated a two-party system with the Labor Party
on the left pitted against several coalition parties on the right. The primary
dimension of conflict between the parties was economic, with working-class
voters and the Labor Party supporting larger government and more progres-
sive policies relative to upper-class voters and the coalition parties (Hirst,
2002).
Australia’s first system of compulsory voting was implemented in the state
of Queensland in 1914. The Liberal Party government led by Digby Denham
implemented the policy on the belief that the opposing Labor Party was
better at ‘‘getting out the vote’’ (Evans, 2006). The other Australian states
eventually followed suit, implementing compulsory voting for state elections
at different times. Victoria was next in 1926, followed by New South Wales
and Tasmania in 1928, Western Australia in 1936, and South Australia in
1941. For national elections, compulsory voting was implemented in 1924.
Except in Queensland where the Labor Party initially opposed the pol-
icy, compulsory voting received unanimous support from all parties at the
national level and in each state assembly. Table 1 presents the timing of the
adoption of compulsory voting for national elections and for each state. This
policy was adopted under the control of multiple different parties and with
broad roll call support from all the parties.
Table 1. The adoption of compulsory voting (CV) across federal and state
elections.
CV First election Controlling
State adopted w/CV Roll call party
Queensland 1914 1915 47/72 Liberal
Federal Elections 1924 1925 75/75 Nationalist/Country
Victoria 1926 1927 65/65 Labor
New South Wales 1928 1930 90/90 Nationalist/Country
Tasmania 1928 1931 30/30 Nationalist
Western Australia 1936 1939 50/50 Labor
South Australia 1941 1944 39/39 Liberal/Country

Fowler 163
Compulsory voting worked in the following way. Every voter was expected
to show up to the polling place and cast a ballot on Election Day. They
were not obligated to support any of the candidates or parties; they could
cast a blank ballot if they preferred. Any citizen who did not vote and could
not provide a valid excuse would have to pay a fine. For national elections,
the fine was two pounds, and traveling and physical illness were explicitly
listed as valid excuses. For state assembly elections, the fines varied but were
never severe. According to anecdotal reports, the government was lenient
with excuses and only a fraction of nonvoters were asked to pay the fine.
A historical reading of this period reveals four primary reasons that com-
pulsory voting was implemented. First, it was believed that compulsory vot-
ing was a natural extension of compulsory registration, which was already
in place (Hirst, 2002). If everyone voted, it would be easier to administer the
election and detect fraud. Second, the fines levied on nonvoters could help
to defray the cost of administering the election (Mackerras and McAllister,
1999). Third, compulsory voting was seen as the only way to ensure a fair
election result (Hirst, 2002; Evans, 2006). During World War I, the issue of
conscription was contentious and divisive. Parliament did not want to make
a controversial decision on its own, so it proposed a public referendum on
the issue. However, since the issue would potentially affect every Australian
family, the Parliament felt that the referendum would only be legitimate if
everyone voted. The debate surrounding the referendum planted the seed
for compulsory voting in all federal elections (Evans, 2006).
The final impetus for compulsory voting involved partisan interests. The
Labor Party on the left and the coalition parties on the right hoped to reduce
a perceived advantage of their opponents (Mackerras and McAllister, 1999;
Evans, 2006). Coalition (non-Labor) voters were more likely to have cars
so that they could drive themselves and others to the polling place. On the
other hand, the Labor Party had a larger supply of campaign workers and
therefore a more extensive effort to bring Labor supporters to the polls. In
order to reduce this wasteful competition, both sides felt that compulsory
voting would make them better off.
All four reasons are somewhat practical. Compulsory voting would aid in
the administration of elections, raise money, increase legitimacy, and reduce
costly campaign efforts of the parties. One party did not push for compulsory
voting at the expense of another. All parties supported the policy, and to
the extent that the parties made a strategic calculation, they all thought

164 Electoral and Policy Consequences of Voter Turnout
that compulsory voting would benefit them. Therefore, it appears that the
adoption of compulsory voting arose more for practical or principled reasons
than it did for strategic reasons.
While the adoption of compulsory voting was not random, the timing
of the policy does not appear to be related to changes in political, eco-
nomic, or demographic factors — a claim that I explicitly test later in this
paper. Therefore, compulsory voting provides a rare opportunity to test for
the effects of near-universal turnout on election outcomes and public pol-
icy. To assess the effects of compulsory voting on partisan election results,
I exploit the differential timing of compulsory voting laws across Australian
states with a simple difference-in-differences design. Then, in order to assess
the policy consequences of compulsory voting, I employ synthetic control
methods to compare changes in Australia’s pension spending over time with
changes in other comparable nations. Both of these designs require a paral-
lel trends assumption which is extremely plausible, justified with data, and
significantly weaker than the assumptions required for previous studies of
the effects of near-universal turnout.1
2 Who Voted in Australia before Compulsory Voting?
Education and class biases in turnout have been well documented in
advanced democracies (Gosnell, 1927; Leighley and Nagler, 1992; Linder,
1994; Powell, 1980; Tingsten, 1937; Topf, 1995; Verba and Nie, 1972; Verba
et al., 1995). In general, wealthier and more educated citizens vote at higher
rates than those of lower socioeconomic status. This effect is greatest for
those nations with low rates of turnout such as the United States and
Switzerland but still present in nations with high turnout such as Canada
and the United Kingdom. Even in modern day Australia, which achieves 95
percent turnout through compulsory voting, poorer and less-educated citi-
zens are more likely to abstain (McAllister, 1986). However, due to the lack
of data, class biases in turnout have not been previously studied in Australia
before the adoption of compulsory voting. Australia does not typically report
1 For example, previous studies of the effects of near-universal turnout (Herron, 1998; MacKerrasand McAllister, 1999; Highton and Wolfinger, 2001; Citrin et al., 2003; Martinez and Gill,2005; Bernhagen and Marsh, 2007; Pettersen and Rose, 2007; Rubenson et al., 2007) requirethe stronger assumption that observational differences in voter turnout across individuals areexogenous.
Fowler 165
the names of individuals who turned out to vote, and no survey data were
collected on voting before compulsory voting was established.
To my knowledge, only two sources provide data on the types of individu-
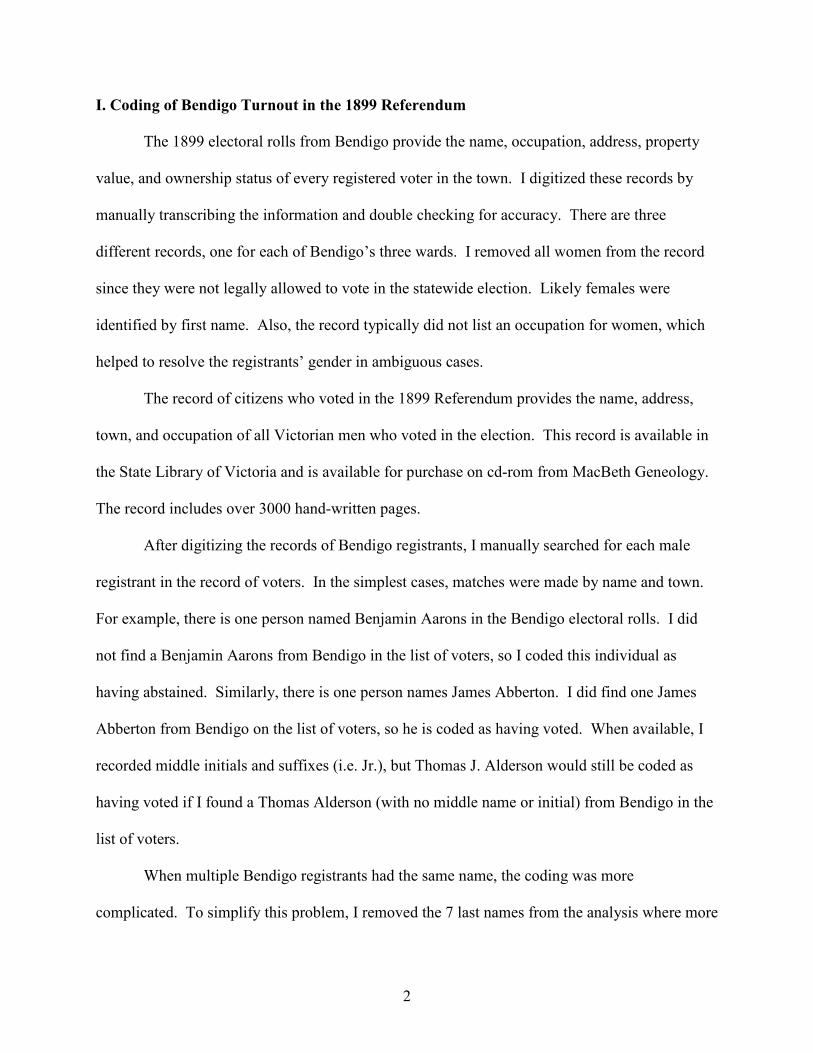
als who turned out in Australia during this period. First, in 1877, the State
of Victoria reported voter turnout separately for property-owners and non-
property-owners for that year’s state assembly election.2 Second, following
Victoria’s 1899 referendum on Australian federation, the state honored the
event by publishing the names of all who had turned out. Analyzing both
sources, I uncover the extent of turnout inequality in Australia before com-
pulsory voting. As in many democracies today, wealthy, property-owning
citizens were much more likely to vote than poor, non-property-owning cit-
izens. This analysis does not suggest that property ownership or property
values exhibit a causal effect on turnout. Similarly, these factors are not nec-
essarily the most important predictors of voting. The analysis is descriptive,
uncovering as best as possible who voted and who abstained from voting
before the adoption of compulsory voting.
2.1 Turnout by Property Ownership in Victoria’s 1877 Election
After his election to the Victoria State Assembly in 1877, Robert Clark,
a working-class miner, requested a report of voter turnout by property-
ownership. To my knowledge, this is the only Australian electoral return
which provides any breakdown of turnout by demographic characteristics.
The report presents turnout data for 37 of Victoria’s 55 districts. These 37
districts contained 580,000 residents and 170,000 eligible voters. For most of
the missing districts, the election for legislative assembly was uncontested,
so no votes were cast.
At that time in Victoria, property-owning males were automatically regis-
tered to vote. If a non-property-owner wanted to register, he would have to
pay 1 shilling. The property requirement was not severe; 59 percent of voting-
age males were automatically registered as property-owners. This group
included farmers, masons, shepherds, storekeepers, butchers, and ‘‘gentle-
man.’’ Non-property owners included strictly working-class citizens such as
laborers, servants, cooks, and gardeners. The 1877 report presents for each
district the approximate number of eligible voters, the number of registered
2 Votes and Proceedings of the Legislative Assembly, 1877–78, Vol. 1, p. 767.

166 Electoral and Policy Consequences of Voter Turnout
property-owners, the number of registered non-property-owners, the num-
ber of voters who were property-owners, and the number of voters who were
non-property-owners. From these data, we can back out the proportions of
eligible property-owners and eligible non-property-owners who turned out
in the state election. Alarmingly, only 18 percent of eligible non-property-
owners turned out to vote compared to 66 percent of property-owners. Given
the burden of registration, only 32 percent of eligible non-property-owners
bothered to pay the shilling and get on the roll. Even conditional on register-
ing, only 57 percent of those individuals turned out. Surprisingly, property-
owners were more likely to vote than even the subset of non-property-owners
who had paid to become registered. Put another way, property-owners com-
prised 84 percent of the electorate even though they only comprised 59
percent of the eligible voters.
2.2 Turnout by Property Ownership and Property
Value in the 1899 Referendum
In 1899, the Australian states held a referendum on forming a federation.
The measure was sure to pass in Victoria, but the state government wanted
a high turnout to ensure legitimacy. To incentivize voters, the government
offered a certificate to all those who turned out and recorded their names
in a commemorative book. This book, held in the Parliamentary Library of
Victoria, contains the names, occupations, and locations of the 163,783 men3
who turned out from the State of Victoria. By this time the registration fee
was removed and registration was mandatory, so that all white men should
have been registered and eligible to vote in the referendum.
Despite this exciting data source, there is no comparable list of all eligible
voters from which we could assess their propensity to turn out in the ref-
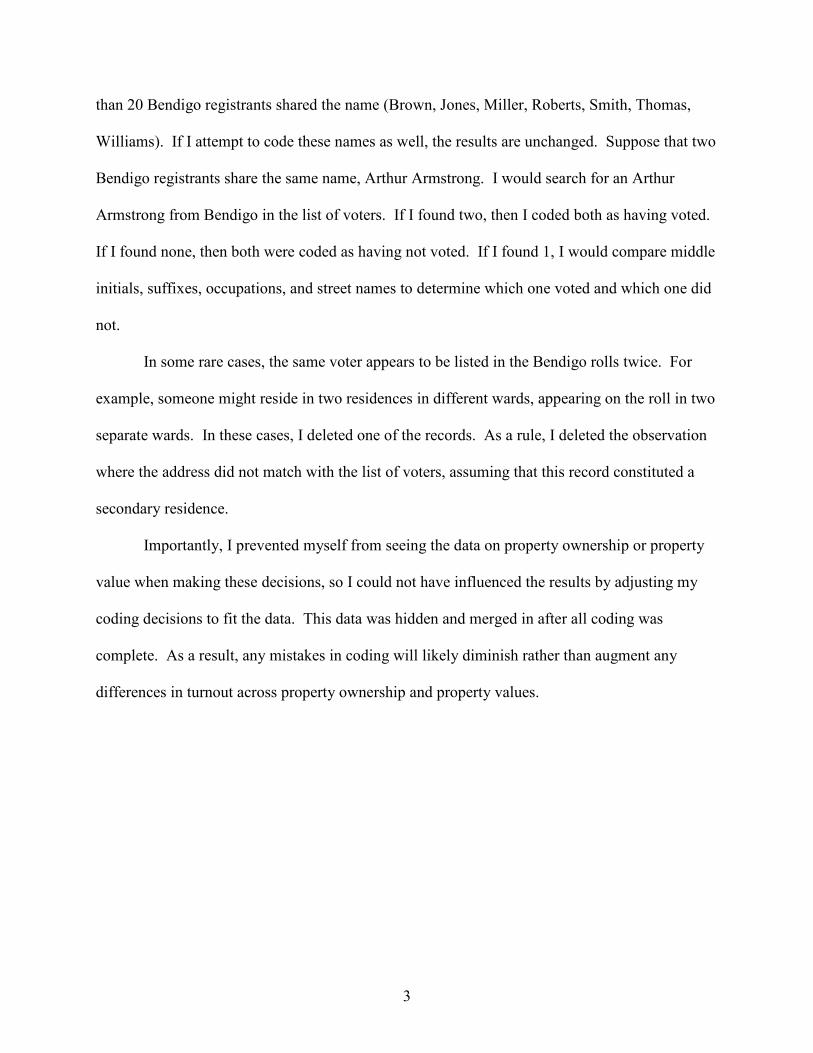
erendum. However, the city of Bendigo has preserved some historical rolls
of all registered voters, and they fortunately have their list from the exact
same year, 1899. Bendigo rolls list the names, occupations, addresses, and
property values of all registered voters. For each individual, the roll indicates
the value of his residence and whether he is the owner or just an occupier
of that residence. The 1899 Bendigo roll contains the names of 3,510 men.
For each individual, I have digitized the data and manually searched for
that person in the book of referendum voters. Sixty-one percent of Bendigo’s
3 Women, unfortunately, did not yet have the right to vote in Victoria.

Fowler 167
registered voters are confirmed as having voted in the referendum, consistent
with historical accounts of the turnout rate in Bendigo (Maslunka, 1983).
Just as in 1877, we can assess whether property owners in Bendigo were
more likely to vote than occupiers. Also, we can assess whether property val-
ues, a good proxy for wealth, are related to turnout. Figure 1 presents kernel
regressions of turnout across property values separately for owners and occu-
piers. Consistent with expectation, owners were 10 percentage points more
likely to vote than occupiers. Also, property values are highly correlated
with turnout for both owners and occupiers. A single standard deviation
increase in property value is associated with a 7 percentage point increase
Owners
Occupiers
.5.6
.7.8
Pr(
Turn
out in
Specia
l E
lection)
1 3 5 7ln(Property Value)
Figure 1. Turnout inequality in Bendigo, 1899.
The solid curves represent kernel regressions indicating the probability that
an individual citizen turned out to vote in the 1899 special election as a
function of the value of his residence. Separate kernel regressions are shown
for property-owners and occupiers (non-owners). The dotted lines indicate
standard errors. The kernel regression use the Epanechnikov distribution
with a bandwidth of 1.5 and a p-width of 0.57, but the general finding is
insensitive to specification.

168 Electoral and Policy Consequences of Voter Turnout
in an individual’s probability of voting for owners and a 10 percentage point
increase in an individual’s probability of voting for occupiers.4
These findings from 1877 and 1899 demonstrate a large degree of turnout
inequality in Australia before the adoption of compulsory voting. Due to the
lack of available data, these findings cannot be replicated outside of Victoria
or Bendigo. However, we have no reason to suspect that turnout inequality
was unique to these regions of Australia. Contemporary electoral reports
indicate that turnout and registration rates in Bendigo were similar with
other municipalities in Victoria and Victoria was comparable with other
states in Australia. This analysis constitutes, to my knowledge, the first and
only possible analysis of individual-level voting behavior in Australia before
compulsory voting. Acknowledging the limitations, I take these results as
evidence of a larger phenomenon across Australia.
As in many democracies today, Australia’s wealthy citizens voted at much
higher rates than working-class citizens under a system of voluntary voting.
For this reason, any lessons drawn from Australia may be applicable to other
democratic nations today. Also, since working-class citizens in Australia
systematically preferred the Labor Party, these analyses suggest that com-
pulsory voting and increased voter turnout would benefit the Labor Party
and lead to more progressive policies in Australia. The next two sections
explicitly test these hypotheses.
3 The Effects of Compulsory Voting in State Assembly Elections
In order to test the effect of compulsory voting on election results, I have
collected the results of every state legislative assembly election from 1910
to 1950.5 The six Australian states provide an excellent opportunity to
test for the effects of near-universal turnout because they adopted compul-
sory voting at different times. Employing a differences-in-differences design,
I estimate the effect of compulsory voting on three different dependent
variables: voter turnout, Labor Party vote share, and Labor Party seat share.
As compulsory voting is implemented in one state, we can compare that
4 These numbers are estimated through separate ordinary least squares (OLS) regressions ofturnout on property value for owners and occupiers.
5 Data were collected from the Australian Politics and Election Database, hosted by the Univer-sity of Western Australia (http://elections.uwa.edu.au/electionsearch.lasso). 1910 is the firstyear for which I can obtain reliable electoral data for every state. Subsequent results are notsensitive to the choice of included years.

Fowler 169
state’s changes in voting behavior with the changes of other states at the
same time. This design — in its simplest form — requires a ‘‘parallel trends
assumption’’ that voting behavior would, on average, have parallel trends
across states in the absence of any changes in compulsory voting laws. Later
in the present paper, this assumption is discussed in detail, justified with
statistical tests, and relaxed by allowing for state-specific trends.
Voter turnout and the electoral success of the Labor Party, measured in
two different ways, are the primary outcomes of interest. During this time
period, Australia had multiple parties competing for office. However, several
conservative parties would typically form a coalition against the Labor Party,
so the environment approximates a two-party system. The clear differences
between the Labor Party and the coalition parties largely revolved around
economic issues; Labor Party preferred government intervention to protect
workers, and coalition leaders preferred free markets. By analyzing the Labor
Party’s success, we capture the bulk of political competition occurring during
this time period. Also, given the economic divide between the Labor and
coalition parties, we have a clear prediction about the effect of increased
turnout on the Labor Party’s success.
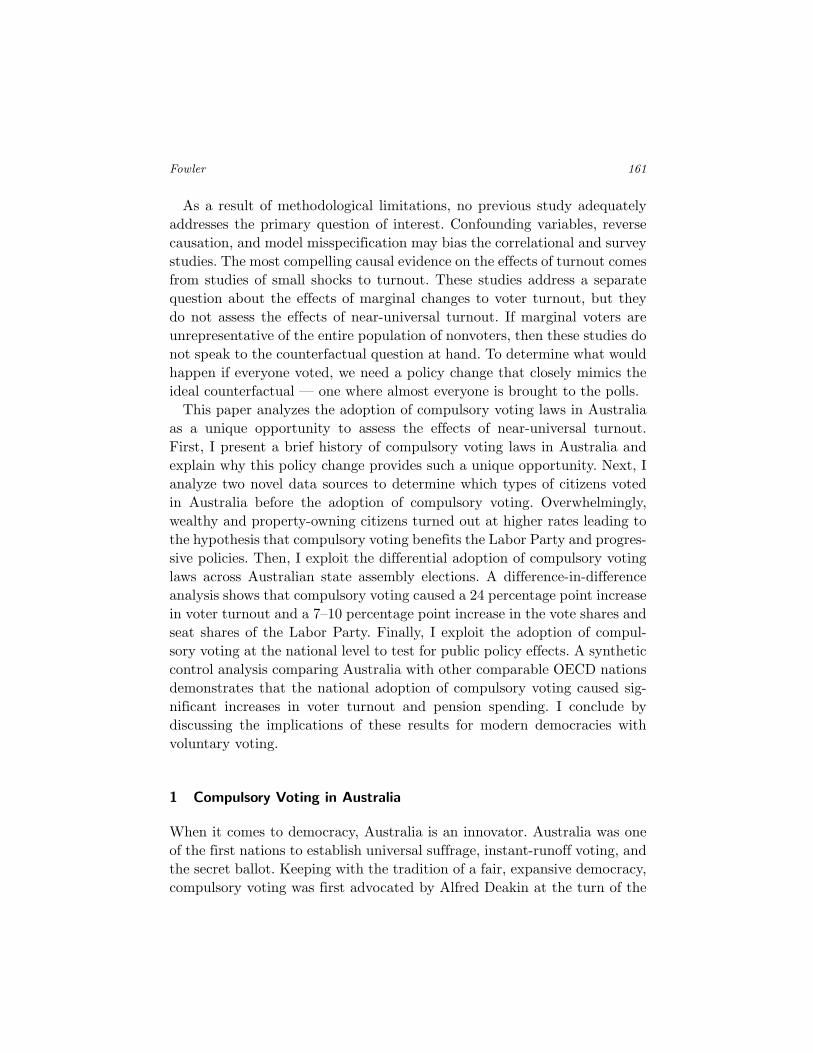
Before turning to the explicit econometric tests, I present the raw data for
the analysis in Figure 2. The top panel of the figure presents the level of voter
turnout in every election and the bottom panel presents the Labor Party’s
vote share. Hollow triangles represent elections before compulsory voting,
and solid triangles represent elections after the adoption of compulsory vot-
ing in that particular state. The naked eye can readily detect the significant
effect of compulsory voting on voter turnout. In each state, turnout jumped
dramatically when compulsory voting laws were implemented. However, the
effect of compulsory voting on Labor Party vote share is less apparent,
because there is so much natural variation in this variable from year to year.
(This variation may explain why conservative parties in Australia continued
to support compulsory voting laws even though the tests in this study reveal
that they suffered from the policy.)
To quantify the effects of compulsory voting, I estimate the following equa-
tion using OLS separately for each dependent variable (turnout, Labor vote
shares, and Labor seat shares):
DV = α(Compulsory Voting)it + γi + δt + εit. (1)
This model includes a dummy variable for compulsory voting, state fixed
effects (γi), and year fixed effects (δt), allowing each state and each year to

170 Electoral and Policy Consequences of Voter Turnout
.5.6
.7.8
.91
.5.6
.7.8
.91
1910 1920 1930 1940 1950 1910 1920 1930 1940 1950 1910 1920 1930 1940 1950
New South Wales Queensland South Australia
Tasmania Victoria Western Australia
Vote
r T
urn
out
Year
.2.3
.4.5
.6.2
.3.4
.5.6
1910 1920 1930 1940 1950 1910 1920 1930 1940 1950 1910 1920 1930 1940 1950
New South Wales Queensland South Australia
Tasmania Victoria Western Australia
Labor
Vote
Share
Year
(a)
(b)
Figure 2. Turnout and labor vote share across state assembly elections
(1910--1950).
The graph presents the level of voter turnout (top panel) and Labor
Party vote share (bottom panel) in every state legislative assembly election
between 1910 and 1950. Hollow triangles indicate an election help before the
adoption of compulsory voting in that state, and solid triangles indicate an
election after the adoption of compulsory voting.

Fowler 171
have their own idiosyncratic effect on the dependent variables. The coeffi-
cient α indicates the effect of compulsory voting on the dependent variable.
As a robustness test, I also include linear time trends for each state, para-
metrically relaxing the parallel trends assumptions by allowing each state
to have a unique trend over time.
Table 2 presents the results of all three difference-in-differences regres-
sions along with the three corresponding models with state-specific trends.
Column 1 shows that the implementation of compulsory voting increased
turnout by 24 percentage points on average, from 67 to 91 percent.
Columns 3 and 5 show that compulsory voting increased the Labor Party’s
vote share and seat share by 9 and 7 percentage points, respectively. These
results are both substantively and statistically significant. Since the Labor
Party’s average seat share was 43 percent before the adoption of compul-
sory voting, these effects were meaningful enough to change the control
of power in many legislative assemblies. Columns 2, 4, and 6 present the
robustness tests allowing for state-specific trends and all three results are
virtually unchanged. These additional tests lend credibility to the parallel
Table 2. Effects of compulsory voting in state assembly elections.
DV = Turnout Labor vote share Labor seat share
(1) (2) (3) (4) (5) (6)
Compulsory voting .243 .245 .092 .093 .069 .098
(.042) (.046) (.033) (.040) (.048) (.065)
State fixed effects X X X X X X
Year fixed effects X X X X X X
State-specific trends X X X
Observations 85 85 85 85 85 85
R-squared .925 .933 .759 .790 .660 .721
SER .056 .052 .049 .045 .110 .098
State-clustered standard errors in parentheses.Each observation is a state assembly election between 1910 and 1950. “Compulsory Vot-ing” is a dummy variable, indicating whether compulsory voting laws were in place. Thedependent variables are coded to theoretically range from 0 to 1, so the coefficients incolumns 1, 3, and 5 indicate that compulsory voting increased voter turnout, Labor voteshare, and Labor seat share by 24, 9, and 7 percentage points, respectively.
172 Electoral and Policy Consequences of Voter Turnout
trends assumption, because relaxing the assumption is inconsequential for
the subsequent estimates.
According to these results, average turnout in the absence of compul-
sory voting during this period would have been 67 percent, and the Labor
Party would have received 44 percent of the votes. However, average turnout
with compulsory voting would have been 91 percent, and Labor would have
received 53 percent of the votes. This suggests that 78 percent of the new
(marginal) voters brought to the polls by compulsory voting supported
the Labor Party compared to just 44 percent of older (regular) voters.6
This estimate is substantively large but quite plausible, given what we
now know about turnout inequality prior to compulsory voting. Among the
91 percent of voters who voted under compulsory voting, only 61 percent
of Labor voters turned out to the polls under voluntary voting while 88
percent of non-Labor supporters turned out. These calculations indepen-
dently confirm the extent of turnout inequality in Australia before com-
pulsory voting. Before compulsory voting, non-Labor supporters were 1.4
times more likely to vote compared to Labor supporters. When compulsory
voting caused an exogenous increase in turnout, election results changed
dramatically.
3.1 Estimating the Standard Errors
While the previous analysis includes 85 different elections, each election does
not represent an independent observation. Serial correlation or state-specific
clustering could lead traditional approaches to overestimate the precision
of our estimates. Table 2 reports state-clustered standard errors which are
designed to accommodate these concerns, but these standard errors can be
misleading when the number of clusters is small. See Bertrand et al. (2004)
for a more detailed discussion of these issues.
In the Online Appendix, I discuss these issues and demonstrate the sta-
tistical significance of these results under numerous different methods for
estimating standard errors. For example, the estimated effect of compulsory
voting on Labor vote share is statistically significant (p < 0.05) even when
calculating the standard errors by nonparametric bootstrap, block boot-
strap, or random permutation.
6 The 78 percent figure comes from solving this simple equation for X: 0.67∗0.44 + 0.24∗X =0.91∗0.53. See Fowler (2012) for more details on this test.

Fowler 173
3.2 Tests for Confounding Demographic Trends
The parallel trends assumption implies that the timing of the adoption of
compulsory voting did not coincide with any state-specific changes in demo-
graphic or political factors that could have independently influenced voter
turnout or election results. Historical analysis of the adoption of compulsory
voting lends credence to this assumption. The insensitivity of the results
to the inclusion of state-specific trends provides further support. In this
section, I search for further evidence that could potentially falsify or bol-
ster the parallel trends assumption. I find that the adoption of compulsory
voting across states was not correlated with any changes in economic or
demographic variables.
To conduct these tests, I collected data for each state from the Australian
censuses in 1911, 1921, 1933, and 1947.7 For all six states at each of these
four time points, I obtained data on the state’s population and the propor-
tion of the state’s population that was under 21, married, born in Australia,
identifying with the Church of England, and working in the manufacturing
sector. Then, treating each variable as an outcome variable, I regress each
variable on a dummy variable for compulsory voting, state fixed effects, and
year fixed effects. This procedure mimics the difference-in-differences regres-
sions shown previously. The results of each regression are shown in Table 3.
For each test, the placebo ‘‘effect’’ of compulsory is statistically and sub-
stantively indistinguishable from zero. These results provide further support
for the parallel trends assumption and demonstrate that the adoption of
compulsory voting across states was not correlated with these demographic
or economic changes.
4 The Effects of Compulsory Voting on Public Policies
The significant effects of compulsory voting on election results suggest that
compulsory voting may have influenced public policy as well. The Labor
Party held systematically different positions than the other parties over
many issues including unions, social spending, immigration policies, and the
7 One natural robustness test would involve including these time-varying covariates as controlvariables in the original regressions. However, these tests cannot be conducted because thesevariables are not available for all election years. As a close substitute, I test whether changesin these covariates coincide with the timing of compulsory voting across states.

174 Electoral and Policy Consequences of Voter Turnout
Table 3. Tests for confounding demographic trends.
Dependent ‘‘Effect’’ of Standard
variable compulsory voting error p-Value
ln(Population) −.036 .035 .343
Under 21 −.002 .006 .785
Married .004 .002 .070
Born in Australia .004 .015 .817
Church of England −.011 .011 .359
Manufacturing .005 .004 .297
Each row represents a difference-in-differences regression where the dependent variableis regressed on a dummy variable for compulsory voting, state fixed-effects, and yearfixed-effects. The estimate is the coefficient on “compulsory voting.” Standard errorsare clustered by state. With the exception of ln(Population), the dependent variablesare coded as proportions (0 to 1), so a coefficient of .004 indicates the compulsoryvoting corresponds to an increase in the dependent variable by 0.4 percentage points.
size of government. Therefore, a greater presence of Labor members in state
assemblies and the national Parliament may have had significant effects on
the lives of Australians at the time. Moreover, the new wave of working-class
voters may have led all parties to shift in a progressive direction. A histori-
cal account of Australia’s national politics around this time period suggests
several potential effects of compulsory voting on public policy.
The majority party’s platform changed dramatically after the adoption
of compulsory voting for federal elections in 1924. In the 1922 election the
Nationalist Party maintained power, announcing a conservative domestic
policy: ‘‘First and foremost, we are against class legislation and class govern-
ment’’ (Hughes, 1922). In 1925, the first election under compulsory voting,
the Nationalist Party maintained power but shifted dramatically on these
issues: ‘‘It has to be recognized that even under the conditions existing in
Australia, the wages of our workers are not sufficient to enable them to
safeguard against these evils [sickness, unemployment, and old-age]’’ (Bruce,
1925). In just a three-year span, the majority party made a clear turn toward
progressive domestic policies, and the introduction of more working-class
voters into the electorate and increased presence of the Labor Party may
have provided impetus for such a change.

Fowler 175
Statistical evidence of the effects of compulsory voting comes from data
on social spending across various nations over time (Lindert, 1994). I focus
specifically on pension spending, because this was a key issue of disagreement
between the parties, just as there was tension between the left and right
in many advanced democracies over pension policies (Baldwin, 1990). In
Australia, the political parties disagreed strongly regarding the size and
structure of the federal pension program, but for various reasons, they did
not diverge significantly on other social issues such as education, health,
welfare, and housing (Hirst, 2002). Because the Labor Party and working-
class voters systematically preferred a more progressive pension program
relative to the coalition parties and upper-class voters, I hypothesize that
compulsory voting increased pension spending in Australia.
To test this hypothesis, I estimate the effect of compulsory voting at the
national level on voter turnout and pension spending by comparing Australia
with 20 other developed nations across three different time points: 1910,
1920, and 1930.8 Again, I rely on a difference-in-differences design. How-
ever, in order to maximize the plausibility of the parallel trends assumption,
I employ synthetic control methods (Abadie et al., 2010) to construct syn-
thetic control units that are comparable with Australia before the adoption
of compulsory voting.
For each test, the synthetic control unit is the weighted average of other
nations that best mirrors Australia in terms of voter turnout or pension
spending in 1910 and 1920. New Zealand, France, Canada, and the United
Kingdom receive the greatest weights in the turnout analysis, because they
closely mirror Australia’s level and trend in turnout before compulsory vot-
ing, while Denmark and New Zealand receive the greatest weights in the pen-
sion analysis. The incorporation of other economic, demographic, and polit-
ical variables into the weighting algorithm does not change the subsequent
results. Moreover, simpler difference-in-differences designs which weigh all
comparison units equally yield similar results. More details on these analyses
are available in the Online Appendix.
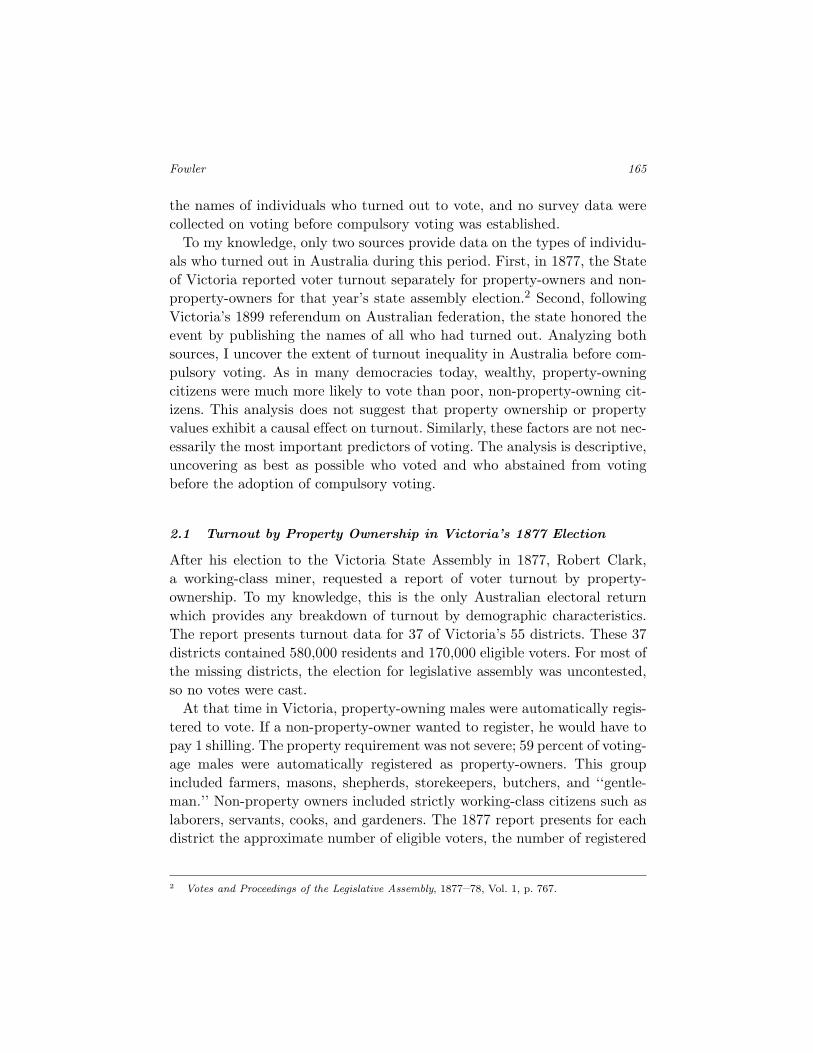
Figure 3 presents the trends in voter turnout (top panel) and pension
spending (bottom panel) for Australia and the synthetic control units. Their
8 Turnout and pension data are from Lindert (1994) with corrections made to Australia’s turnoutdata. This cross-country design could also be employed to assess the impact of compulsoryvoting on the electoral success of left-wing parties, but the state assembly design is muchcleaner for that purpose and it avoids the challenges of coding left-wing parties across countriesand comparing across different electoral systems.

176 Electoral and Policy Consequences of Voter Turnout
Synthetic Control
Australia
19
24
: C
om
pu
lso
ry V
otin
g I
mp
lem
en
ted
.6.7
.8.9
1
Vo
ter
Tu
rno
ut
1910 1920 1930Year
Synthetic Control
Australia
19
24
: C
om
pu
lso
ry V
otin
g I
mp
lem
en
ted
.6.8
11.2
1.4
Pe
nsio
n S
pe
nd
ing
(%
of
GD
P)
1910 1920 1930Year
(a)
(b)
Figure 3. The effects of compulsory voting on turnout and pension
spending.
The figure presents the level of voter turnout (top) and pension spending
(bottom) in Australia and in a synthetic control nation across three points
in time. The synthetic control unit is a weighted average of other OECD
countries that closely mirrored Australia before the adoption of compulsory
voting for national elections in 1924. Both turnout and pension spending
increased dramatically in Australia relative to the synthetic control nation
after the adoption of compulsory voting.

Fowler 177
levels of turnout and pension spending are nearly identical in 1900 and 1910.
However, after the adoption of compulsory voting in 1924, voter turnout and
pension spending increased dramatically relative to the synthetic control
units. Difference-in-differences calculations indicate that compulsory voting
increased voter turnout by 18.6 percentage points and pension spending
by 0.41 percentage points of gross domestic product (GDP). In 1930, the
pension spending of the control group was just under 1 percent of GDP,
so this effect represents a more than 40 percent increase in the number of
federal dollars going toward old age pensions — a substantively significant
effect.
To assess the statistical significance of these estimates, I conduct placebo
tests on the other countries, pretending that a policy change occurred
between 1920 and 1930 in each of the comparison units. For each of the 20
countries other than Australia in this analysis, I construct a synthetic control
for each country, excluding Australia as a potential control unit. I then calcu-
late the difference-in-differences in pension spending between each country
and its synthetic control from 1920 to 1930. The results of these placebo
tests are provided in the Online Appendix. For both turnout and pension
spending, only one country exhibits a difference-in-differences estimate as
large as Australia. The dramatic increases in turnout and pension spending
in Australia between 1920 and 1930 are substantively large and much greater
than we would expect to see by chance alone. Taken together, the analy-
ses of state assembly elections and federal policy over time provide strong
evidence that near-universal turnout can have significant consequences for
both partisan election results and public policy.
5 Discussion of Alternative Explanations
Alternative explanations of this study’s findings will likely arise in two
forms. First, the timing of the adoption of compulsory voting may have
been endogenous to changes in turnout or support for the Labor Party.
Specifically, there may have been some reason that states adopted com-
pulsory voting precisely when the Labor Party was expected to increase
its electoral success. Second, compulsory voting may have influenced elec-
tion results through some mechanism other than increased turnout. Perhaps
the introduction of compulsory voting caused people to change their par-
tisan attitudes in favor of the Labor Party, and the effect of the policy on
elections had nothing to do with increased turnout among the working class.

178 Electoral and Policy Consequences of Voter Turnout
In any observational analysis, alternative explanations cannot be ruled out
entirely. However, I have made the best possible effort to raise and assess
the plausibility of these explanations through historical evidence, previous
research, and my own statistical tests.
Was the timing of compulsory voting truly exogenous? The difference-in-
differences analyses in this paper assume that election results and public
policies would have followed similar trends across states and countries in the
absence of any changes in compulsory voting laws. For example, the results
would be biased if compulsory voting was adopted at a time when the Labor
Party was expected to improve its electoral success. Perhaps the Labor Party
pushed for compulsory voting as it was gaining momentum. Conversely, the
other parties may have pushed for compulsory when they expected to lose
support in the next election. However, the adoption of compulsory voting
received widespread support from all political parties, so these explanations
are unlikely. Moreover, previous election results are uncorrelated with the
timing of compulsory voting. As discussed previously, compulsory voting
was primarily implemented for practical reasons. After numerous discussions
with Australian historians, I am unaware of any confounding variable which
could have simultaneously led to compulsory voting and an increase in sup-
port for the Labor Party. The decision to adopt compulsory voting appears
to be orthogonal to the partisan attitudes of the citizenry and any trends
in these attitudes. Also, the state-level results are unchanged if the parallel
trends assumption is relaxed by allowing for state-specific trends. Lastly,
tests for confounding demographic trends in Table 3 reveal no evidence that
the adoption of compulsory voting was correlated with demographic or eco-
nomic changes.
Even if compulsory voting increased the electoral success of the Labor
Party, it may have done so through some mechanism other than near-
universal turnout. This study of the effects of compulsory voting is less
interesting for the study of democracy if the mechanism has to do with
something other than increased turnout. Could compulsory voting have dra-
matically changed election results or public policy independent of its effects
on turnout? Perhaps voters were upset with the coalition parties for passing
compulsory voting and decided to shift their support to the Labor Party.
This seems unlikely since all parties supported the policy change. Perhaps
the presence of new voters at the polls changed the political attitudes of old
voters causing them to shift toward the Labor Party. However, if anything,
we might expect that this phenomenon would work against my findings if
Fowler 179
upper-class Australians became lionized against the Labor Party because of
the new presence of working-class voters at the polls. A historical analysis
suggests no reason that compulsory voting would cause a shift toward the
Labor Party through any mechanism other than increasing turnout.
Changes in voter turnout do not take place in a vacuum. The introduc-
tion of new voters to the polls will lead candidates to change their campaign
strategies and shift their policy platforms. However, these phenomena do
not pose a problem for my estimates because they are all part of the down-
stream effects of compulsory voting and increased turnout. Presumably, the
shift in political platforms is one mechanism for the observed changes in pen-
sion spending, over and above the increased electoral success of the Labor
Party.
6 Discussion and Conclusion
Advanced democracies expend incredible resources in the administration of
elections in the hope that election results and public policies will closely
reflect the preferences of the citizenry. However, a significant proportion of
citizens often abstain from voting. Worse yet, those who abstain are system-
atically different from those who vote, meaning that election results may not
accurately reflect the preferences of all citizens. Aware of this problem, polit-
ical scientists have extensively studied voter turnout, typically assessing the
correlates and causes of voting. Despite this collective effort to understand
turnout, there is little evidence connecting voting to tangible outcomes. How
would elections and public policies change if everyone voted?
Previous attempts to address this question suffer from methodological
problems. Correlations between turnout and various outcomes lack a causal
interpretation because confounding variables influence both turnout and
the outcomes of interest and the outcomes of interest may influence voter
turnout. Comparisons of voters and nonvoters within an electorate also suf-
fer from the possibility of confounding variables or systematic measurement
error in surveys. Previous quasi-experimental approaches lack external valid-
ity because the subset of voters influenced by the quasi-experiment is unrep-
resentative of all nonvoters. In short, previous research has failed to answer
the counterfactual question of interest. In a democracy with voluntary vot-
ing, researchers have been unable to determine the effects of near-universal
turnout.

180 Electoral and Policy Consequences of Voter Turnout
The analysis presented here largely overcomes the problems of previous
studies. The timing of the introduction of compulsory voting in different
Australian states appears to be exogenous to partisan attitudes and other
political events, so difference-in-differences methods can estimate the causal
effects of compulsory voting laws. Moreover, because compulsory voting
caused a substantial increase in voter turnout, the subset of citizens influ-
enced by the policy is nearly the entire population of nonvoters. This analysis
brings us closer than ever before to answering the extreme counterfactual
question: ‘‘what if everyone voted?’’
Before the implementation of compulsory voting, Australia was similar to
many advanced democracies today. Less than 70 percent of citizens voted in
federal or state elections, and wealthy citizens were much more likely to vote
than working-class citizens. Given these patterns, the lessons learned from
Australia may be applicable to many democracies today. With the extent
of turnout inequality in the United States, Switzerland, Poland, and many
other countries, the effects of compulsory voting could be just as great in
these contexts.
‘‘Democracy’s unresolved dilemma’’ is that elections do not accurately
reflect the preferences of the citizenry (Lijphart, 1997). Systematic turnout
inequality means that some citizens will be better represented than others.
In this study, I exploit a rare opportunity to test the extent of this dilemma.
Before the introduction of compulsory voting in Australia, election results
and public policy were drastically different from the preferences of the citi-
zens. When near-universal turnout was achieved, elections and policy shifted
in favor of the working-class citizens who had previously failed to partici-
pate. While Australia has largely resolved the problem, inequalities in voter
turnout remain in most advanced democracies. Increased turnout has tangi-
ble effects on partisan election results and public policies, and those effects
will benefit the disadvantaged subset of citizens who otherwise would have
abstained from the political process.
References
Abadie, A., A. Diamond, and J. Hainmueller. 2010. “Synthetic Control Methods for Com-parative Case Studies: Estimating the Effect of California’s Tobacco Control Program.”Journal of the American Statistical Association 105(490): 493–505.
Anzia, S. 2011. “Election Timing and the Electoral Influence of Interest Groups.” Journalof Politics 73(2): 412–427.

Fowler 181
Anzia, S. 2012. “The Election Timing Effect: Evidence from a Policy Intervention inTexas.” Quarterly Journal of Political Science 7(3): 209–248.
Baldwin, P. 1990. The Politics of Social Solidarity: Class Bases of the European WelfareState, 1875–1975. Cambridge University Press.
Bernhagen, P. and M. Marsh. 2007. “The Partisan Effects of Low Turnout: AnalyzingVote Absention as a Missing Data Problem. Electoral Studies 26(3): 548–560.
Berry, C. and J. Gersen. 2011. “Election Timing and Public Policy.” Quarterly Journal ofPolitical Science 6(2): 103–135.
Bertrand, M., E. Duflo, and S. Mullainathan. 2004. “How Much Should WeTrust Differences-in-Differences Estimates?” Quarterly Journal of Economics 119(1):249–275.
Bruce, S. 1925. Prime Minister’s Fighting Speech. Published by Winn & Co.Citrin, J., E. Schickler, and J. Sides. 2003. “What if Everyone Voted? Simulating the
Impact of Increased Turnout in Senate Elections.” American Journal of Political Sci-ence 47(1): 75–90.
DeNardo, J. 1980. “Turnout and the Vote: The Joke’s on the Democrats.” AmericanPolitical Science Review 74(2): 406–420.
Erikson, R. 1995. “State Turnout and Presidential Voting: A Closer Look.” AmericanPolitics Quarterly 23: 387–396.
Evans, T. 2006. “Compulsory Voting in Australia.” Australian Electoral CommissionReport.
Fisher, S. 2007. “(Change in) Turnout and (Change in) the Left Share of the Vote.”Electoral Studies 26(3): 598–611.
Fowler, A. 2012. “Regular Voters, Marginal Voters, and the Electoral Effects of HigherTurnout.” APSA Annual Meeting Paper.
Gosnell, H. 1927. Getting Out the Vote: An Experiment in the Stimulation of Voting.Chicago: University of Chicago Press.
Grofman, B., G. Own, and C. Collet. 1999. “Rethinking the Partisan Effects of HigherTurnout: So What’s the Question?” Public Choice 99: 357–376.
Hansford, T. and B. Gomez. 2010. “Estimating the Effects of Voter Turnout.” AmericanPolitical Science Review 104(2): 268–288.
Herron, M. 1998. “The Presidential Election of 1988: Low Voter Turnout and the Defeatof Michael Dukakis.” Working Paper.
Highton, B. and R. Wolfinger. 2001. “The Political Implications of Higher Turnout.”British Journal of Political Science 31: 179–223.
Hill, S. 2010. Changing Composition and Changing Allegiance in American Politics. Doc-toral Dissertation, University of California, Los Angeles.
Hirst, J. 2002. Australia’s Democracy: A Short History. Allen and Unwin.Hughes, W. 1922. “Prime Minister’s Policy Speech.” National Policy and Record.
Chatswood, North Sydney.Knack, S. and J. White. 1998. “Did States’ Motor Voter Programs Help the Democrats?”
American Politics Research 26(3): 344–365.Leighley, J. and J. Nagler. 1992. “Socioeconomic Class Bias in Turnout, 1964–1988: The
Voters Remain the Same.” American Political Science Review 86(3): 725–736.Lijphart, A. 1997. “Unequal Participation: Democracy’s Unresolved Dilemma.” American
Political Science Review 91(1): 1–14.Linder, W. 1994. Swiss Democracy: Possible Solutions to Conflict in Multicultural.
St. Martin’s Press.Lindert, P. 1994. “The Rise of Social Spending, 1880–1930.” Explorations in Economic
History 31: 1–37.Mackerras, M. and I. McAllister. 1999. “Compulsory Voting, Party Stability, and Electoral
Advantage in Australia.” Electoral Studies 18(2): 217–233.Martinez, M. and J. Gill. 2005. “The Effects of Turnout on Partisan Outcomes in U.S.
Presidential Elections 1960–2000.” Journal of Politics 67(4): 1248–1274.

182 Electoral and Policy Consequences of Voter Turnout
Martinez, M. and D. Hill. 2007. “Was the Joke on the Democrats Again? Turnout andPartisan Choice in the 2004 U.S. Election.” American Review of Politics 28: 81–95.
Maslunka, M. 1983. “Bendigo: One Community’s Response to Federation.” Honours The-sis, University of Melbourne.
McAllister, I. 1986. “Compulsory Voting, Turnout, and Party Advantage in Australia.”Australian Journal of Political Science 21(1): 89–93.
McAllister, I. and A. Mughan. 1986. “Differential Turnout and Party Advantage in BritishGeneral Elections, 1964–1983.” Electoral Studies 5: 143–152.
Nagel, J. H. 1988. “Voter Turnout in New Zealand General Elections, 1928–1988.” PoliticalScience 40: 16–38.
Pettersen, P. A. and L. Rose. 2007. “The Dog that Didn’t Bark: Would Increased ElectoralTurnout Make a Difference?” Electoral Studies 26(3): 574–588.
Powell, G. B. 1980. “Voting Turnout in Thirty Democracies: Partisan, Legal, and Socio-Economic Influences.” Electoral Participation: A Comparative Analysis, ed. RichardRose. Sage Press.
Radcliff, B. 1994. “Turnout and the Democratic Vote.” American Politics Quarterly 9:259–276.
Riker, W. and P. Ordeshook. 1968. “A Theory of the Calculus of Voting.” AmericanPolitical Science Review 62(1): 25–42.
Rubenson, D., A. Blais, P. Fournier, E. Digengil, and N. Nevitte. 2007. “Does Low TurnoutMatter: Evidence from the 2000 Canadian Election.” Electoral Studies 26(3): 589–597.
Sled, S. 2008. It’s in the Mail: The Effect of Vote By Mail Balloting on Voter Turnout andPolicy Outcomes in U.S. Elections. Doctoral Dissertation, Massachusetts Institute ofTechnology.
Stein, R. 1998. “Early Voting.” Public Opinion Quarterly 62(1): 57–69.Tingsten, H. 1937. Political Behavior: Studies in Election Statistics P.S. King and Son.Topf, R. 1995. “Electoral Participation.” Citizens and the State, ed. Hans-Dieter Klinge-
mann and Dieter Fuchs. Oxford University Press.van der Eijk and M. van Egmond. 2007. “Political Effects of Low Turnout in National and
European Elections.” Electoral Studies 26(3): 561–573.Verba, S. and N. Nie. 1972. Participation in America: Political Democracy and Social
Inequality. Harper and Row.Verba, S., K. Schlozman, and H. Brady. 1995. Voice and Equality: Civic Voluntarism in
American Politics. Harvard University Press.

��
��������������
�
���� ��������������������������������� ��������� ���
�������������������������� ���������� ������
�
�
����������� �
���� ������� �� ������
� �
�
��������������� ���������������������� ������������������������������� ����������� ���
��������� ��� ������� ��� ������������������������������ ����������������������� ��� � �������
����������������� ������������������������������ ������������������� ����������������������� �����
����������� �����������
�
�
������������ �� ��
��!���������"��������� �������������#$$�%��� ������ � � � � ���&�
��'� ����������%��� �����(����� ��) � ���������������������(��������������)��������� ���*�
��%�������������(��������������%�������������� �������(�������������� � � ���+�
,��'� �����������������(���������!��� ������������ � � � � � ���#�
� �
� �
&�
� ����������!������������ ���� "��#$%%�&���������
� �����#$$������� ��� ������ ���"�������� ������������������������������� ������ ��� ���
�������������� ������������������ �� ������ ������� �������������� �������-��������� ��� ������
���������� ���� �������������� ����������������������.������ ����� ��������� ��� ���� ���
����� ���� ��� ���������� ���������"������/���� ���� ����� � ����������������� ������� ��� ��
������������ ��������������������������������������������������������0�.������������� ��
���������������� �������������������� ��� ����������������������������������������� ������������
���������� ����������� ����� ����/������ �����������������������
� ���� ��� ���������-���������������������#$$�%��� ������� �������������������� �����
���������������������������,���� ���������������������������������������� ��� ������������������
����(�����0�� � �����,���� ���������������������� ��� �����������1 ���� ���'��"����2�����������
���� ��� �������������� �3444�����1 �������������
� ���� �������-�������� ��� ������"������� ����� ������ ������������� ������� �����������
����� ����������� ��� ��������� ���� ������������������������������� �������������������������
� ��5���������� ����������� ����������"��6������� �����������"������������� ��� ������� �����
�����������"��6������� ����� ���"�������������������������� ������ ��������������������������
�������������������(����� ������� ����������� ����������7��������� ������ ��������������7�����
���� ����� ���"�������������������������� ������������������������������������8��������������� �
��� �����������������������������5���9�����7 �:�������������7������ ���������������������������
���������������� �������������������� ����9�������������������� ��������:�� ���"��������������
������������ ���
� 8�������������"������� ����� ���������������������������������������� ��
�������������������������������� ������� � �����������+������������� ������������������ ���� ��
3�
�����&4�"������� ����� �������� ������������9" ����7������'���� ��%��� ����(��������������
8�������:��� �� ����������������������������������������� �������� ��������������(���������������
"������� ����� �������� ������������������ ��� �� ��� ������ ��������� ����� ����� ��� �
� ��� ����� ���"�������������������������� ���� �� ���������������� ������������������������������
�� ������������������������ ������������������������������ �� ���������� ����������� ���������
���������������5����������������������� ����������������� �������������������������������������
�����
� ������� � ���������������������� ������ ����������������������"������� ������������� �
�5��������������������� ������������ ������������������ ����� ��������� ����������� ����������
���� ����� ����� ��������������� �������������������� ��� ���������� ����� ����������������� �������
�� ��������� �������������������������������������� ���������������������� ��� ����������������
������� �� ����������
� ��� �������� �� ���������������� ����������������������� ��� ������ ������ �� ��� ���
������������.������������������������ ������������������������������� ������������6����������
������������������������������������������������������������� ����������� ���������������
���������������� ����������������.�������������������.������������� ���� ������������������
����� ����������� ������� ����� ��� ������ ���������� ��� ������������
�
� �

*�
�� �'����(� �����&��������) ��������������� "��������������) � ��������������� �����
� (��������������� ������� ��� ��.����������� ����1��1����� ���������������� ������ �������
��������� ����� ���������������������9"� � �����������&44*:��� ���������������� ��������������$�
�� ������������������������������������������������ ������������0��� ��������� ��9'�����3����
������&��������� ����������� :������ ����������� �������� ������������������������������� ��� � ����
���������� ����������������� ��� � �9���������������;��4$&:��������������<������ ���������
������ ��� ��� ������������ ����������=0(������� ��� � ������������ �������������� 1
�������������� ���������������������������� �������.����������������������� ������ ������������
���� ��.������������������������ ���� ������� ����� ��.���������������������>��� 18�����
��� �������������� �� ���������� ������1����������� ������ ���������������� ��.������������
����������������1������ ��������� ��� � ����"������������������������������ ������������ �������
��������� � ��� �������������� ��� � ���� ���������������� ���>���� ���������� ������������
����������������������� ���������� ������������������
� ������� ��� ��� ����������� ��������������1�� ���� ��������� �����8������������ ������ �
���������������#?����� ��������� ������������������� �����������9#?������������� ����
������������������ ���������������:������������������������������������ ���������������������
��������� � ������������ ����� ���4�444������������������������������ ��� � �������������� ��
������������������������� �����������������������.������� ������������ ��?����������������������
���1�� ���� ��������� �����������.����5���������� ����������������������� ��������
��������������� ����������������������.������������ ���������������� ���������������������������
���������#?����������������� ������������<���������������������
� 0������� ���������� �������� ����������������������������� ������ ����������������� ������
������� � �������������������� ���������$�4������$?4�9� ���� ���������� ������ �������:�����

?�
��������������� ���������������������������� ������������������������������ ����������������������
������������������ ������������� ������������������������ ����� � ������������ ����� ���44�444�
���������� ��� ������������ ��� � �������������� ����������������������� ���������������������
��� ������ ����������� ���������������� �������� ������������8�������������������������� ��
�� ���������� ����������������-� ������������ ����������������43?������������������������� ���
���� ���������������������� ����������0���������4�?@�������� �������� ���������� ��������������
����������� �� ������������������������������4$&�������������������� �������������������� �� ������
��������5���������������� ����������������������� ���������� ��������������������������
� �������������������������������� ������������0��� �����������������������������������9��A�
�4?:��� �������� ������������������������������� ��� � �������������������������������.����
���������������� ����������������������������� ���������� �����������������������������
�� ������ ���� ������� �������� �������������-���������� ����� ������������������������� ����B�
���������������������� �� ��������������5������������������������
� �������� ����������� ������������ �������� ��������������������������������������
������������������������� ����1��1����� ��������������������������������������� ������������0��� �
������� ����� ������������� � �������������������� ���������$�4������$?4�9� ���� �����
����� ������ �������:�������������������� ���������������������������� ������������������� ������ �
������������� ���������������������������������������� ������������� ������������������������ �����
� ������������ ����� ���44�444����������������� ��� ����������� ���������������� ������
�� ������������8�������������������������� ���� ���������� ����������������-� ������������ ��
��������������43?������������������������� ������� ���������������������� ����������0���������4�?@�
������� �������� ���������� ������������������������� �� ������������������������������4$&��

<�
������������������ �������������������� �� ��������������5���������������� ����������
������������� ���������� ��������������������������
�
�������# �) �������������� "���� ��� ������� ����������������� �������*������� ��
� ���������� 9�4&#:CC�
>��� ��.�����������%������ 9�43�:CC�
(����1!����� ��� 9�433:C�
D��1�� ���� ���"����� ��� 9�4*4:C�
"���.�"����� ��� 9�4*<:C�
%������E� ��������� 9�43?:C�
�
+�������# �&���������� � ����&���� ��
�
�������������� ��������������������������
��
��
�������
��� ��� � �� �������� �����������������

+�
��� �&���� ��������) � �����������&���� �� ���� ���� ����)�������� �����
����������������� ��������� ����������������� ������������ ����������������������%�����
����&�� ���������� ���!������3�����*����������&��������� ����������� ����������������������������
������������������ ���������9������� ���4�����:����0��� �E� ���������� ��9������������ ���4����
�:���"������������������������������5������������������ ���5������������������������� ��������� �
�����1���������� �������������5��*� ���������������������� �����������������������������������
� ����������������� ���������%�������������������� ������������������������������������������������ �
������������������������������������������������������5������������
� %��3������������������ ��������� �����%��*������������� �������� ����� �������������
���������� ����������������� �� ��������������%��?������������������ ��������������������������
� ������������ ��� �� ��������������0�������%��<��������������� ��������� ������� ��������� ������
���� ������������������������� �����������!������� ���������������������������������/��� �������
0��� ��������� ������������������������������������������������ �� ����������������������������
�� ������������������5�������������F�������� ��������������������� � �� ��������������������
���������������5�������6�������0��� ��������� ������������������ ������������������������ ��
������������������� ��� � ��� �������� �����������������������
� �
�������, �&���� ������"��-��
(������������� )�������� (����� ��) � �
F�� ��5���)������� �4$&� �433�
(����1(�������������� ����� �4$3� �4*4�
0���� ������� ���� �4<&� �4&#�
G��� ����������� ���� �4<�� �4&&�
!����������� ���� �4?+� �43&�
����� ���������� �������� �!,� �4<4� �4&3�
�
���� �

#�
�� �'����(� �������� "��)�� "� ������ �������������
�������� ��������������������������� ����������������������������������>��������� �
9&4�4:������������������������������������ �������������������� �������������� �������������
����������� ����������������������� ������������ ���������� ��� ���������#�<��� ���������������
������������������������4�*���� ������������������2�E���"���� �� �������� �������������������
�����������
������������������ ���� ������� ������������ ������������������������������&4����� �
=)!������� ������������������������ ���������$�4������$&4�9���� ���������� ��������:������ ���
����� ����������������������������� ���������������� ����������������3�� ������������������
������������ ����������� ���� ������������ ����������������4������ ���������� ����� ���5�������
� ��������� ������������������������ �������������������������� �������������������&4������ �����
����� ����� �������������������������������������D��H�������� ������!���������������I������
J������� ������������ ����������������������� ��������������������� .�����D��H�������
������������ ���������������������������������������
������ ���������������������������������������������� ���������������������������������� �
���������� ����� ������������������������������$&4������$34���� �������������� ������ ������
�������������� ����������5������������ ������������������������ �������� ����������� ����������������
���������������������������������$&4������$34�������������� ��� �������������������� ����1��1
����� ��������������������������� ��������������������������������� ����������� �����������������4�
����� ���������� ����� �������-����� ��� ����������&4������ ����� �������-����� ���������
����������� ���������������������������� �/������������������������ �����������������������
���� ���������������������������������������� ����/���� ����������������������������������$&4�
�����$34�������������������������������������� �� ��������������5�����������������������������

$�
�������. ����� ���/���" �����)�� "� ������ �������������
!���� �� �� �������������� E����������������
� �������� �44&�
���� ��� �44&�
"������� �44*�
" �-��� �44&�
!������ ��44� �44&�
����� .� �4?<� �+*��
������� �4<�� �44&�
����� ��4$� �44$�
2 ����� �44&�
����� �44&�
7����� �44&�
'�5���� �44&�
D���� ������ �4??� �44$�
D��H������� �*&+� ��#+�
D� ��� �43�� �44<�
E� ������ �44&�
(����� �443�
(����� �4�?� �44?�
I������J������� �4#?� �4�*�
I������(������ �4<4� �44&�
�
� �

�4�
�������0 ������������ ������ "������� ����������������� ���������������)�������
!���� �� �� �����)��������� E�������)���������
��� ������ #$1� 0#0�
� �������� 1�4<$�
���� ��� �*3+�
"������� ��*4�
" �-��� 1�4<$�
!������ 1�&?�� ��?��
����� .� �4*$� �4$4�
������� 1��??� 1�4<$�
����� 1�4�#� �4&&�
2 ����� 1�43<�
����� 1�4<$�
7����� 1�4<$�
'�5���� 1�4<$�
D���� ������ �4#4� 1��$+�
D��H������� �4+*� ��$#�
D� ��� �4�3� 1�4<3�
E� ������ 1�4<$�
(����� 1�4?*�
(����� �4<4� ��$&�
I������J������� �4$?� 1�4?&�
I������(������ �4+*� 1�4<$�
�
Recommended