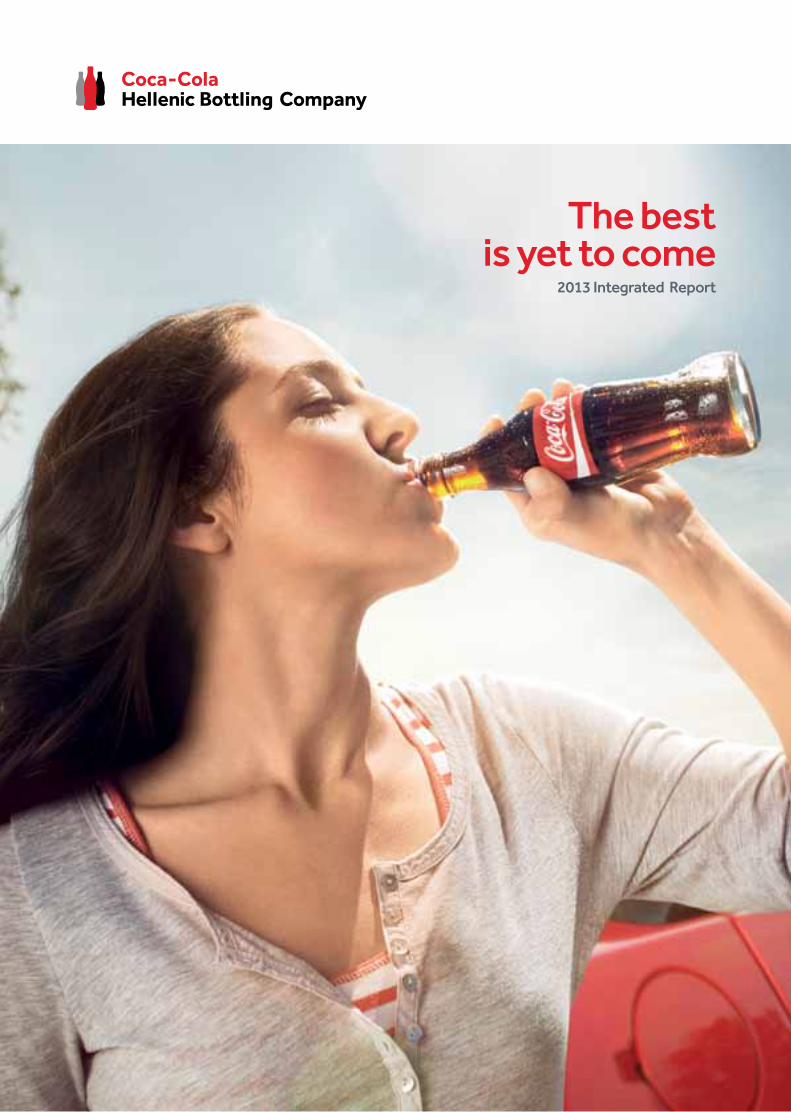
The best is yet to come
2013 Integrated Report
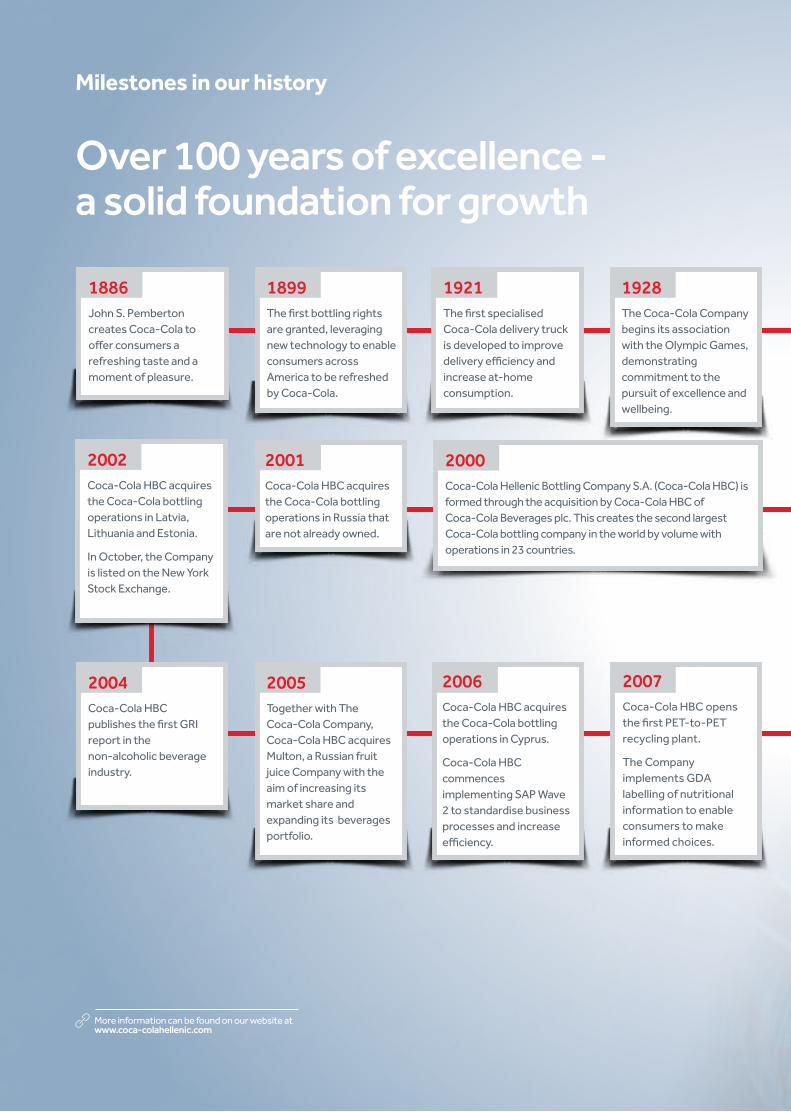
Milestones in our history
Over 100 years of excellence - a solid foundation for growth
1886John S. Pemberton creates Coca-Cola to offer consumers a refreshing taste and a moment of pleasure.
2005
Together with The Coca-Cola Company, Coca-Cola HBC acquires Multon, a Russian fruit juice Company with the aim of increasing its market share and expanding its beverages portfolio.
1899The first bottling rights are granted, leveraging new technology to enable consumers across America to be refreshed by Coca-Cola.
2004Coca-Cola HBC publishes the first GRI report in the non-alcoholic beverage industry.
2000Coca-Cola Hellenic Bottling Company S.A. (Coca-Cola HBC) is formed through the acquisition by Coca-Cola HBC of Coca-Cola Beverages plc. This creates the second largest Coca-Cola bottling company in the world by volume with operations in 23 countries.
1921The first specialised Coca-Cola delivery truck is developed to improve delivery efficiency and increase at-home consumption.
2002Coca-Cola HBC acquires the Coca-Cola bottling operations in Latvia, Lithuania and Estonia.
In October, the Company is listed on the New York Stock Exchange.
2001 Coca-Cola HBC acquires the Coca-Cola bottling operations in Russia that are not already owned.
1928The Coca-Cola Company begins its association with the Olympic Games, demonstrating commitment to the pursuit of excellence and wellbeing.
2006
Coca-Cola HBC acquires the Coca-Cola bottling operations in Cyprus.
Coca-Cola HBC commences implementing SAP Wave 2 to standardise business processes and increase efficiency.
2007Coca-Cola HBC opens the first PET-to-PET recycling plant.
The Company implements GDA labelling of nutritional information to enable consumers to make informed choices.
More information can be found on our website at www.coca-colahellenic.com
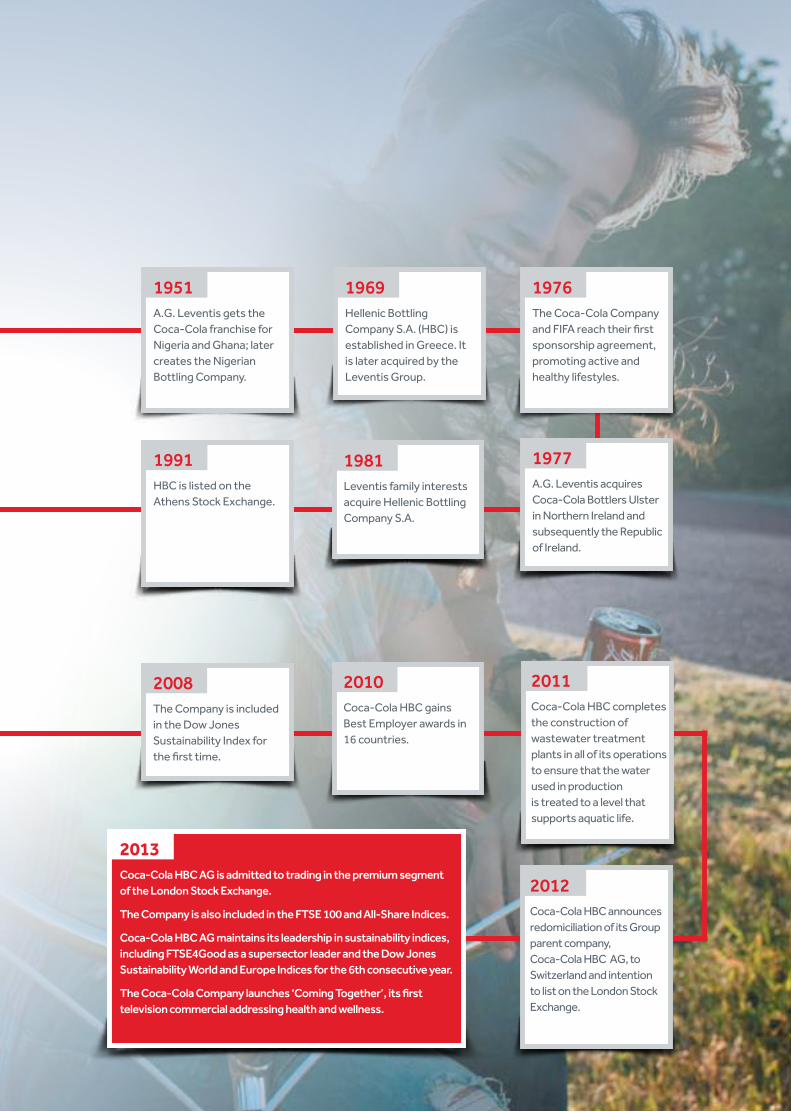
1951A.G. Leventis gets the Coca-Cola franchise for Nigeria and Ghana; later creates the Nigerian Bottling Company.
1969Hellenic Bottling Company S.A. (HBC) is established in Greece. It is later acquired by the Leventis Group.
1976The Coca-Cola Company and FIFA reach their first sponsorship agreement, promoting active and healthy lifestyles.
1991 HBC is listed on the Athens Stock Exchange.
2008The Company is included in the Dow Jones Sustainability Index for the first time.
1977A.G. Leventis acquires Coca-Cola Bottlers Ulster in Northern Ireland and subsequently the Republic of Ireland.
1981Leventis family interests acquire Hellenic Bottling Company S.A.
2010Coca-Cola HBC gains Best Employer awards in 16 countries.
2013Coca-Cola HBC AG is admitted to trading in the premium segment of the London Stock Exchange.
The Company is also included in the FTSE 100 and All-Share Indices.
Coca-Cola HBC AG maintains its leadership in sustainability indices, including FTSE4Good as a supersector leader and the Dow Jones Sustainability World and Europe Indices for the 6th consecutive year.
The Coca-Cola Company launches ‘Coming Together’, its first television commercial addressing health and wellness.
2011Coca-Cola HBC completes the construction of wastewater treatment plants in all of its operations to ensure that the water used in production is treated to a level that supports aquatic life.
2012Coca-Cola HBC announces redomiciliation of its Group parent company, Coca-Cola HBC AG, to Switzerland and intention to list on the London Stock Exchange.
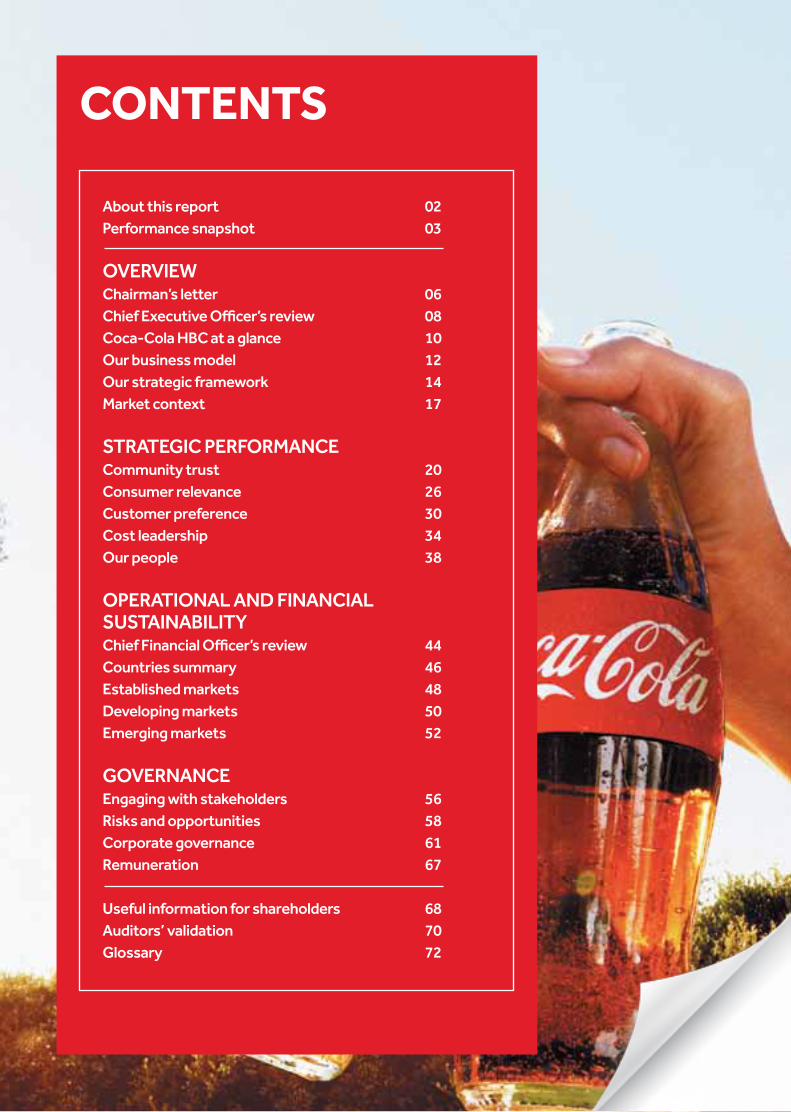
CONTENTS
About this report 02Performance snapshot 03
OvERvIEWChairman’s letter 06Chief Executive Officer’s review 08Coca-Cola HBC at a glance 10Our business model 12Our strategic framework 14Market context 17
STRATEGIC PERFORMAnCECommunity trust 20Consumer relevance 26Customer preference 30Cost leadership 34Our people 38
OPERATIOnAL AnD FInAnCIAL SuSTAInABILITyChief Financial Officer’s review 44Countries summary 46Established markets 48Developing markets 50Emerging markets 52
GOvERnAnCEEngaging with stakeholders 56Risks and opportunities 58Corporate governance 61Remuneration 67
useful information for shareholders 68Auditors’ validation 70Glossary 72
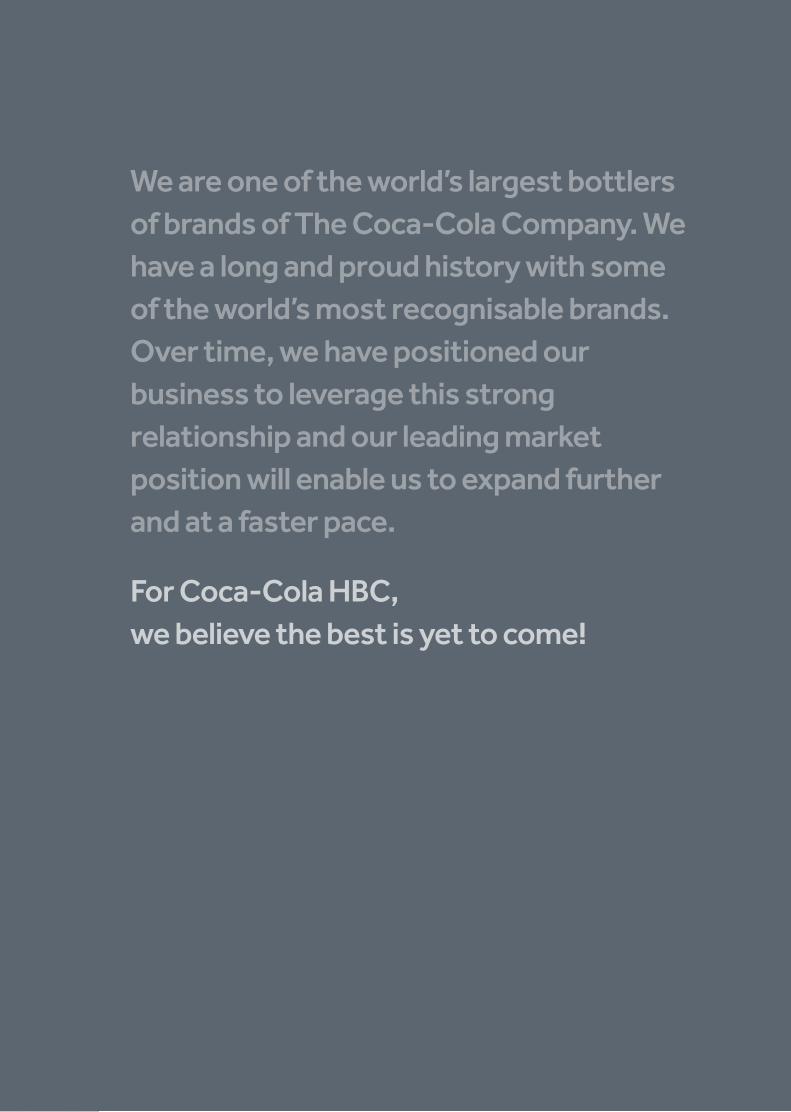
We are one of the world’s largest bottlers of brands of The Coca-Cola Company. We have a long and proud history with some of the world’s most recognisable brands. Over time, we have positioned our business to leverage this strong relationship and our leading market position will enable us to expand further and at a faster pace.
For Coca-Cola HBC, we believe the best is yet to come!
The reason we have adopted integrated reporting is that this better reflects how we operate as a business. After a decade of embedding sustainability throughout our organisation, we now think and operate in a more integrated manner; there is therefore no longer a need to publish separate reports on our financial and non-financial performance. Coca-Cola HBC has been named a sustainability leader by Dow Jones Sustainability Indices amongst others and we aim to lead in the developing field of integrated reporting.
Scope of the reportOur Play to Win strategic framework serves as the narrative structure of this report, showing how this business strategy is helping us create value both now and in the future. The four pillars of our strategy – Community Trust, Consumer Relevance, Customer Preference and Cost Leadership – frames the discussion of our key activities during the year.
The Coca-Cola HBC Group principally produces, sells and distributes non-alcoholic ready-to-drink beverages made under bottlers’ agreements and franchise arrangements with third parties, as well as under its own brand names. In addition, the Group bottles and distributes beer in Bulgaria and FYROM and distributes a selected number of third-party premium spirit brands in certain countries of operation. The Company also has interests in vending businesses in several countries, as well as potato chips and snacks in Greece.
This publication covers calendar year 2013 and its primary focus is on the core business of non-alcoholic ready-to-drink beverages across the 28 countries in which we operate. In our environmental reporting, we do not include offices and warehouses where they are independent from a production facility.
Given the inherent limitations of this publication, certain topics are discussed in more detail in other Coca-Cola HBC documents:
• Our GRI COP report provides more information on our social, economic and environmental performance. Following the guidelines of the Global Reporting Initiative (GRI), this report also serves as our Communication on Progress (COP) to the UN Global Compact.
• Our submission to the Carbon Disclosure Project (CDP) includes in-depth data on our carbon, water and environmental performance.
• Full financial statements and the full corporate governance and remuneration reports are presented in our UK Annual Financial Report and Form 20-F submitted to the UK Listing Authority and the US Securities and Exchange Commission.
These reports are also available on our website, www.coca-colahellenic.com.
Both this report and our GRI COP report have been audited by Denkstatt GmbH. In addition, environmental, quality, health and safety management systems and data in all of our bottling plants undergo an annual third-party audit. Both suppliers and Company-owned operations are subject to independent assessments of workplace conditions. Our compliance with industry codes on responsible sales and marketing is also independently verified. Community investment data are submitted to the London Benchmarking Group (LBG).
Forward-looking statementsThis document contains forward-looking statements that involve risks and uncertainties. These statements may generally, but not always, be identified by the use of words such as ‘believe’, ‘outlook’, ‘guidance’, ‘intend’, ‘expect’,
‘anticipate’, ‘plan’, ‘target’ and similar expressions to identify forward-looking statements. All statements other than statements of historical facts including, among others, statements regarding our future financial position and results, our outlook for 2014 and future years, business strategy and the effects of our recent acquisitions and restructuring initiatives on our business and financial condition, our future dealings with The Coca-Cola Company, budgets, projected levels of consumption and production, projected raw material and other costs, estimates of capital expenditure, free cash flow or effective tax rates and plans and objectives of management for future operations are forward-looking statements. You should not place undue reliance on such forward- looking statements. By their nature, forward-looking statements involve risk and uncertainty because they reflect our current expectations and assumptions as to future events and circumstances that may not prove accurate. Actual results could differ materially from those anticipated in the forward-looking statements for many reasons, including the risks described in our UK Annual Financial Report and the Annual Report on Form 20-F filed with the US Securities and Exchange Commission (File No 1- 35891).
About this report
Welcome to Coca-Cola HBC’s second integrated report. We aim to show how we are creating value not only for our business and our shareholders, but also for the communities and society in which we live and operate.
2 | Coca-Cola HBC 2013 Integrated Report
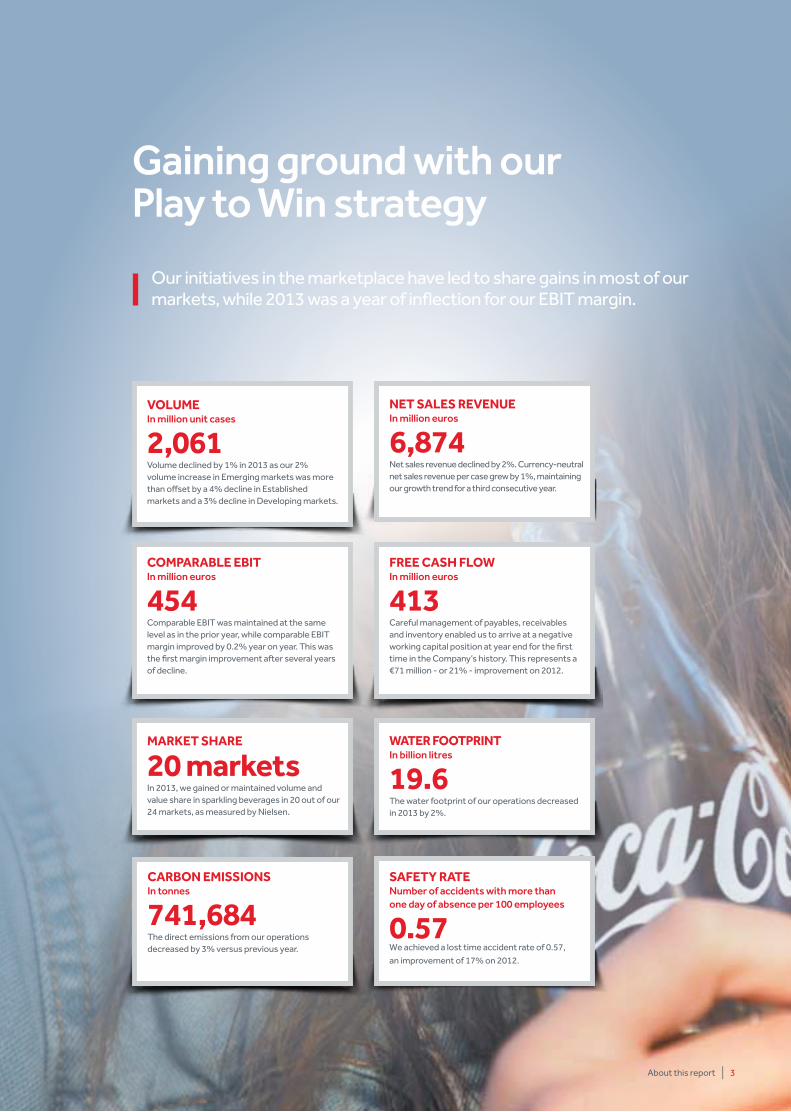
Gaining ground with our Play to Win strategy
Our initiatives in the marketplace have led to share gains in most of our markets, while 2013 was a year of inflection for our EBIT margin.
MARKET SHARE
20 markets In 2013, we gained or maintained volume and value share in sparkling beverages in 20 out of our 24 markets, as measured by Nielsen.
CARBON EMiSSiONSIn tonnes
741,684The direct emissions from our operations decreased by 3% versus previous year.
SAFETy RATEnumber of accidents with more thanone day of absence per 100 employees
0.57We achieved a lost time accident rate of 0.57,
an improvement of 17% on 2012.
WATER FOOTpRiNTIn billion litres
19.6The water footprint of our operations decreased in 2013 by 2%.
VOluMEIn million unit cases
2,061Volume declined by 1% in 2013 as our 2% volume increase in Emerging markets was more than offset by a 4% decline in Established markets and a 3% decline in Developing markets.
COMpARABlE EBiTIn million euros
454Comparable EBIT was maintained at the same level as in the prior year, while comparable EBIT margin improved by 0.2% year on year. This was the first margin improvement after several years of decline.
NET SAlES REVENuEIn million euros
6,874Net sales revenue declined by 2%. Currency-neutral net sales revenue per case grew by 1%, maintaining our growth trend for a third consecutive year.
FREE CASH FlOWIn million euros
413Careful management of payables, receivables and inventory enabled us to arrive at a negative working capital position at year end for the first time in the Company’s history. This represents a €71 million - or 21% - improvement on 2012.
About this report | 3
OVERViEW
In this section
Chairman’s letter 06Chief Executive Officer’s review 08Coca-Cola HBC at a glance 10Our business model 12Our strategic framework 14Market context 17
Our admission to trading in the premium segment of the London Stock Exchange marked 2013 as a milestone year for Coca-Cola HBC. In addition, a relentless focus on our Play to Win strategy continues to drive performance and create value.
More information can be found on our website at www.coca-colahellenic.com
Dear Stakeholder,
Although 2013 remained a challenging year in most of our markets, we remained focused on our four strategic priorities: Community Trust, Customer Preference, Consumer Relevance and Cost Leadership.
As a result, our initiatives in the marketplace delivered encouraging results and allowed us to gain or maintain volume share in sparkling beverages and value share in the non-alcoholic ready-to-drink beverages categories in the majority of our markets. This outcome, especially against the backdrop of economic difficulties and volatility in our territories, reaffirmed my confidence that we will continue to capture growth opportunities as they emerge.
In 2013, we continued to drive efficiency and cost reduction by leveraging the scale and geographic footprint of our business. We are centralising business services in low-cost environments and investing in cross-border manufacturing and logistics. Furthermore, we are exploiting the flexibility of our business strategy to respond to market trends so as to offer value to both customers and consumers. Our winning at the point-of-sale strategy has made us a leader in the sparkling beverages category in all of our 28 markets.
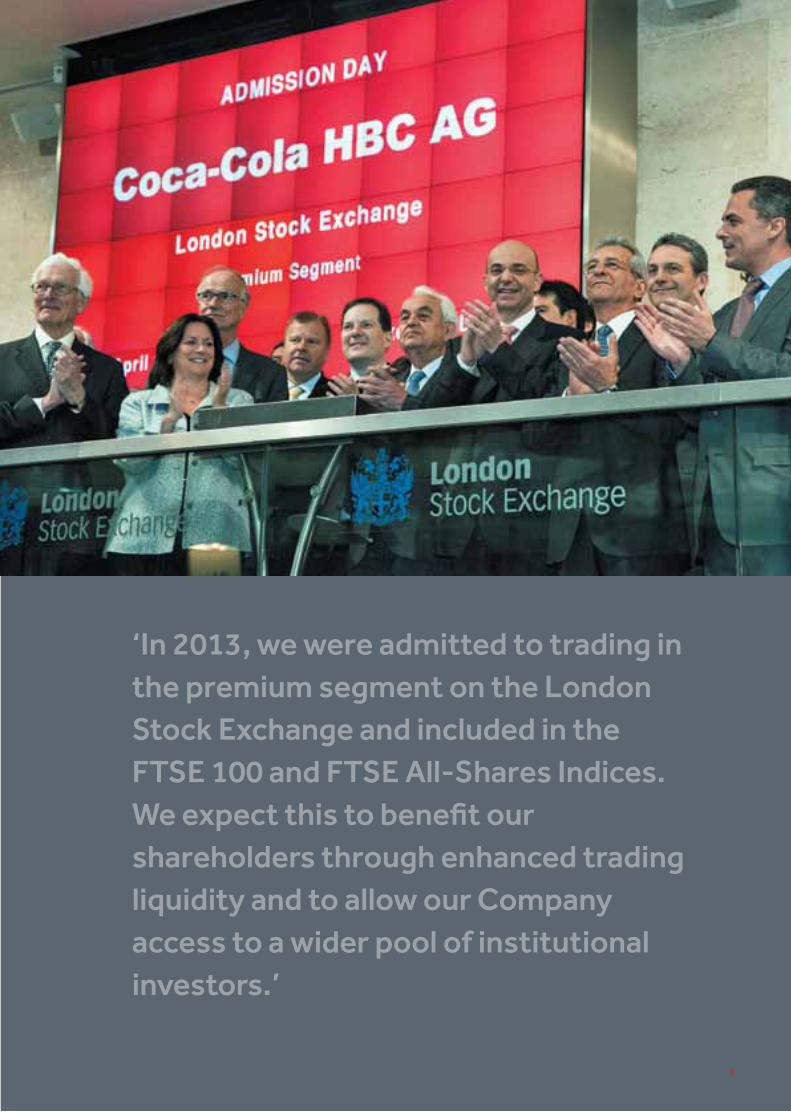
Our admission to premium listing on the London Stock Exchange in 2013 represented a major milestone. Later in the year, we were also included in the FTSE 100 and FTSE All-Share Indices. We expect this to benefit our shareholders through enhanced trading liquidity and to allow our Company access to a wider pool of institutional investors.
We believe strong governance is critical to the long-term creation of shareholder value. In preparation for our premium listing, and in light of the UK Corporate Governance Code, we reviewed and refreshed our corporate governance practices. We also increased the number of independent non-executive Directors and introduced annual elections to the Board by our shareholders. With the retirement of Kent Atkinson, we appointed two new independent non-executive Directors in 2013: Stefan F. Heidenreich and Susan Kilsby. I would like to extend my sincerest thanks to Kent for his contributions over many years and welcome Stefan and Susan to the Board.
In challenging times, sustainability programmes are more important than ever in maintaining trust in our business. Now in their second decade, our environmental projects focus on three key areas: water stewardship; energy and emissions; and packaging, waste and recycling. To help promote sustainability and corporate responsibility, we support local networks of the
United Nations Global Compact and other business initiatives. In 2013, our Romanian plant in Ploiesti received the first European Water Stewardship Standard Gold Medal.
Obesity remains a critical challenge in the markets we serve. To safeguard our future growth, we are renewing our efforts to help address this issue, encouraging active lifestyles, offering low and no-calorie beverages and promoting understanding of the calorie content and ingredients of our beverages.
Listings on sustainability indices are an important measure of trust in our business. Our score on the Dow Jones Sustainability Indices (Europe and World) showed further improvement in 2013, the sixth consecutive year we have maintained our listing. Among beverage companies, Coca-Cola HBC was ranked first in Europe and second in the world for sustainability.
We are cautiously optimistic about the year ahead, despite continuing volatility across our territories. By continuing to deliver on our strategic commitments, we will drive operational performance and create value for our shareowners and our communities. To that end, the Board has recommended a dividend of € 0.354 per share for approval by shareholders.
Finally, I would like to thank all our employees for their contribution throughout the year. We are grateful for the way that they are implementing our strategy, living our values and representing Coca-Cola HBC in our communities. We endeavour to repay this commitment by helping every employee to develop and achieve their full potential.
George A. David Chairman of the Board
Returning to sustainable growth
6 | Coca-Cola HBC 2013 Integrated Report
We are delivering on our strategic commitments to drive operational performance and create value for our shareowners and communities.
Chairman’s letter
Overview | 7
‘In 2013, we were admitted to trading in the premium segment on the London Stock Exchange and included in the FTSE 100 and FTSE All-Shares Indices. We expect this to benefit our shareholders through enhanced trading liquidity and to allow our Company access to a wider pool of institutional investors.’
8 | Coca-Cola HBC 2013 Integrated Report
Dear Stakeholder,
We achieved a significant milestone in 2013. Following our Group’s reorganisation under a new Swiss holding Company with a premium listing on the London Stock Exchange (LSE), we were included in the FTSE 100 and FTSE All-Shares Indices. This provides enhanced visibility with the global institutional investor community and helps to optimise our borrowing costs and capital structure.
During the year, we made good progress in improving our operating performance despite persistent challenging trading conditions in a number of our markets. We continue to implement our Play to Win strategy to achieve sustainable growth and to capture significant opportunities available across our well-balanced portfolio of countries.
A critical part of our strategy is to build a solid foundation for future growth by acting responsibly and, over the years, we have gained public recognition for our achievements. Our inclusion in the Dow Jones Sustainability Indices and the FTSE4Good Index reflects our commitment to earn the trust of the communities in which we operate and to make our social and environmental responsibilities an integral part of our daily operations.
2013 in reviewAdverse economic conditions and volatility in the majority of our markets led to downward pressure on our sales volume. Despite these challenges, we managed to improve our operating profit through more efficient management of operating expenses. In particular, we were able to leverage the scale and footprint of our operations by centralising business services in low-cost environments and investing in opportunities for cross-border manufacturing and logistics. As a result of these initiatives, our operating margin increased after several years of decline. We
also made good progress towards improving our working capital position, delivering negative working capital for the first time ever and improving our free cash flow.
Winning in the marketplaceDuring the year, we continued to deliver on our long-term commitment to meet consumer beverage needs with our portfolio of premium brands, carefully selecting the appropriate package and channel for each brand and leveraging our OBPPC (occasion-based brand, package, price and channel) strategy. Our consumer initiatives, such as the ‘Connect - Share a Coke’ campaign, also contributed to increased sales of single-serve packages.
Sparkling beverages remain our priority category, spearheaded by brand Coca-Cola, and in 2013 we achieved all-time high volume shares in 15 of our markets. We also grew or maintained our overall NARTD value share in the majority of our markets.
Looking ahead, I am optimistic that the new offerings we introduced during the year, including Cappy Pulpy, will yield positive results in 2014 and beyond.
Cost optimisationWe have set three core targets: to improve and optimise our infrastructure; to leverage our scale and to exploit our SAP Wave 2 platform across the business. During 2013 we achieved success in each of these objectives.
We continued to build our Business Services Organisation in Bulgaria with a view to streamlining and centralising many of our finance and HR processes and improving customer service and internal controls. We also continued to consolidate our procurement processes in order to leverage our scale to secure competitive input pricing.
Since 2008, we have reduced the number of manufacturing plants in Established and Developing Markets by 32%, our distribution centres by 16% and our warehouses by 9% in our total footprint. We have also invested in new state-of-the-art facilities, with an emphasis on cross-border consolidation. In 2013, for example, we opened an innovative juice drink production facility in Romania to service our operations in Bosnia & Herzegovina, Bulgaria, Croatia, Czech Republic, Hungary, Romania and Slovakia.
Winning in the marketplace with our values-based business
In this milestone year, we continued to build on our solid foundation for sustainable growth.
Chief Executive Officer’s review
“We achieved all-time high volume shares in 15 of our markets. “
Overview | 9
With the recent implementation in Nigeria, almost 100% of the Group is now sharing SAP Wave 2, one of our greatest initiatives to improve operating efficiencies.
Our peopleWe continue to focus on the skills and capabilities of our more than 38,000 employees. In 2013, our core focus was to maintain and strengthen our talent pipeline to ensure that we have the right people in the right positions. As a result of our efforts, 90% of new General Managers and more than 80% of function heads were promoted from within the Group. We also hired more than 200 management trainees, 50% more than in 2012. Our accomplishments were recognised through our employee surveys, which showed a 6% improvement in both engagement and values scores, despite significant austerity measures in many of our countries. The engagement levels of our top 300 leaders exceeded benchmarks against other fast moving consumer goods companies.
A positive impactActing responsibly and maintaining trust in our business is a cornerstone for our sustainable development and future growth. In 2013, we supported youth development initiatives in many countries, particularly those most impacted by the economic downturn. In Bulgaria, in conjunction with Sofia Technical University and the English Language Faculty of Engineering, Company employees voluntarily gave lectures to students to enhance their business skills. Similarly, we have graduate trainee schemes in many operations, offering young and talented individuals the opportunity to build a career within our organisation. In 2013, we more than doubled participation with 400 graduates taking part. Both of these programmes will be run again during 2014.
We continue to build on our strong partnership with the Red Cross/Red Crescent societies particularly in disaster relief preparedness, community care, health training and fundraising. During 2013, we provided almost 200,000 litres of beverages to rescue workers, volunteers and flood victims, as well as emergency funding in Austria, Czech Republic, Slovakia and Hungary.
Active lifestyle programmes to get young people and their families to move more and be physically active are becoming increasingly important. In 2013, more than 2.1 million people participated in sports and fitness projects supported by Coca-Cola HBC.
Other initiatives included supporting International Danube Day, the world’s largest river festival, and working with The Coca-Cola Company’s 5by20 programme to empower women in Nigeria, with 32,000 outlets now managed by women entrepreneurs.
Our CO2 emissions initiatives focused on improving energy efficiency and switching to cleaner energy sources, reducing our energy consumption, working with suppliers to reduce indirect emissions, developing and promoting low-carbon technologies and rolling out hydrofluorocarbon-free (HFC-free) coolers.
looking forwardEconomic conditions in most of our markets will remain weak in 2014 and we expect macroeconomic and currency exchange headwinds. We have built strong foundations to capture opportunities for future growth. In our Emerging markets, average per capita consumption of sparkling beverages is less than one third of that in the UK and less than a quarter of that in Germany. We believe that over time, there is enormous potential to increase consumption levels across Coca-Cola HBC.
We also have important growth opportunities to create joint value by working closely with our customers. Across many of our markets, local and private brands still account for a significant share of the NARTD beverage category. We believe that our portfolio of brands, combined with our proven ability to win at the point of sale, positions us well to capture growth for the long term.
Last but not least, we will continue to drive operating efficiencies to enhance our competitiveness. For 2014, our objective is to further improve the efficiency of our production infrastructure, continue to optimise our logistics and route-to-market, make strategic revenue-generating investments and maintain tight cost control.
Dimitris lois Chief Executive Officer
10 | Coca-Cola HBC 2013 Integrated Report
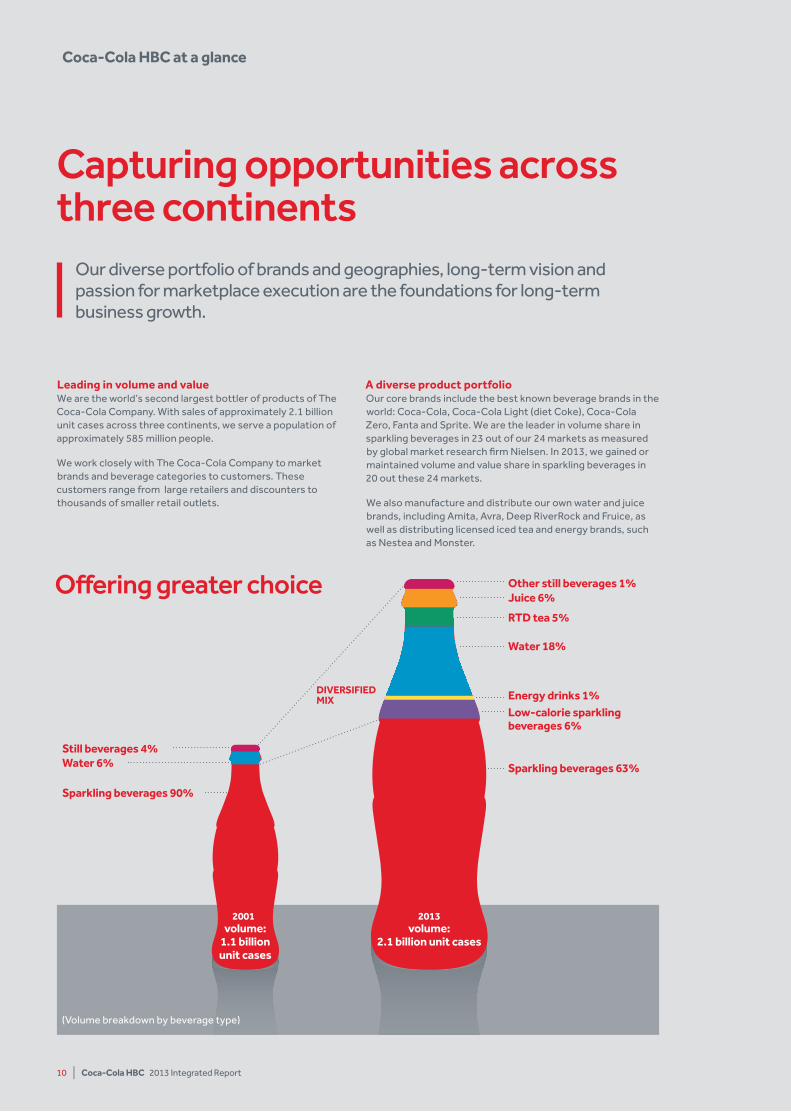
Coca-Cola HBC at a glance
Offering greater choice
leading in volume and valueWe are the world’s second largest bottler of products of The Coca-Cola Company. With sales of approximately 2.1 billion unit cases across three continents, we serve a population of approximately 585 million people.
We work closely with The Coca-Cola Company to market brands and beverage categories to customers. These customers range from large retailers and discounters to thousands of smaller retail outlets.
A diverse product portfolioOur core brands include the best known beverage brands in the world: Coca-Cola, Coca-Cola Light (diet Coke), Coca-Cola Zero, Fanta and Sprite. We are the leader in volume share in sparkling beverages in 23 out of our 24 markets as measured by global market research firm Nielsen. In 2013, we gained or maintained volume and value share in sparkling beverages in 20 out these 24 markets.
We also manufacture and distribute our own water and juice brands, including Amita, Avra, Deep RiverRock and Fruice, as well as distributing licensed iced tea and energy brands, such as Nestea and Monster.
Capturing opportunities across three continents
Our diverse portfolio of brands and geographies, long-term vision and passion for marketplace execution are the foundations for long-term business growth.
Still beverages 4%
Other still beverages 1%
Sparkling beverages 90%
RTD tea 5%
Water 18%
Energy drinks 1%low-calorie sparkling beverages 6%
Sparkling beverages 63%Water 6%
Juice 6%
DiVERSiFiED Mix
2001 2013volume:
2.1 billion unit casesvolume:
1.1 billion unit cases
(Volume breakdown by beverage type)
Find all of our locations:www.coca-colahellenic.com/ interactivemap
Overview | 11
We combine the insights, resources and experience of The Coca-Cola Company with our own expertise in bottling, distribution and sales capabilities to deliver value to our customers, consumers and the wider community. The Coca-Cola Company is responsible for creating demand through consumer marketing and brand development. It also sources ingredients, manufactures and sells concentrates, beverage bases and syrups. As a bottling partner, we are responsible for meeting this demand through manufacturing, packaging, distributing and merchandising the finished branded beverages to customers, who then sell our products to consumers. We are also responsible for customer marketing and outlet execution.
partners in growth for 60 years
Our broad geographic footprintWe operate across 28 countries and three continents. Our territories extend from as far west as the Dingle Peninsular in County Kerry, Ireland, to Petropavlovsk, the easternmost point of Russia, and from the Arctic Circle to the tropics of Nigeria. This breadth provides attractive growth opportunities and reduces our dependence on any particular market.
38,000
324
employees
3continents
28countries
312filling lines
distribution centres and warehouses
68bottling plants
THE COCA-COlA COMpANy
• Owners of the brand
• Concentrate supply
• Brand development
• Consumer marketing
• Quality management
Creates demand
Delivers demandCOCA-COlA HBC
• Bottling
• Sales and distribution
• Customer management
• In-outlet execution
• Investment in production facilities, equipment and vehicles
12 | Coca-Cola HBC 2013 Integrated Report
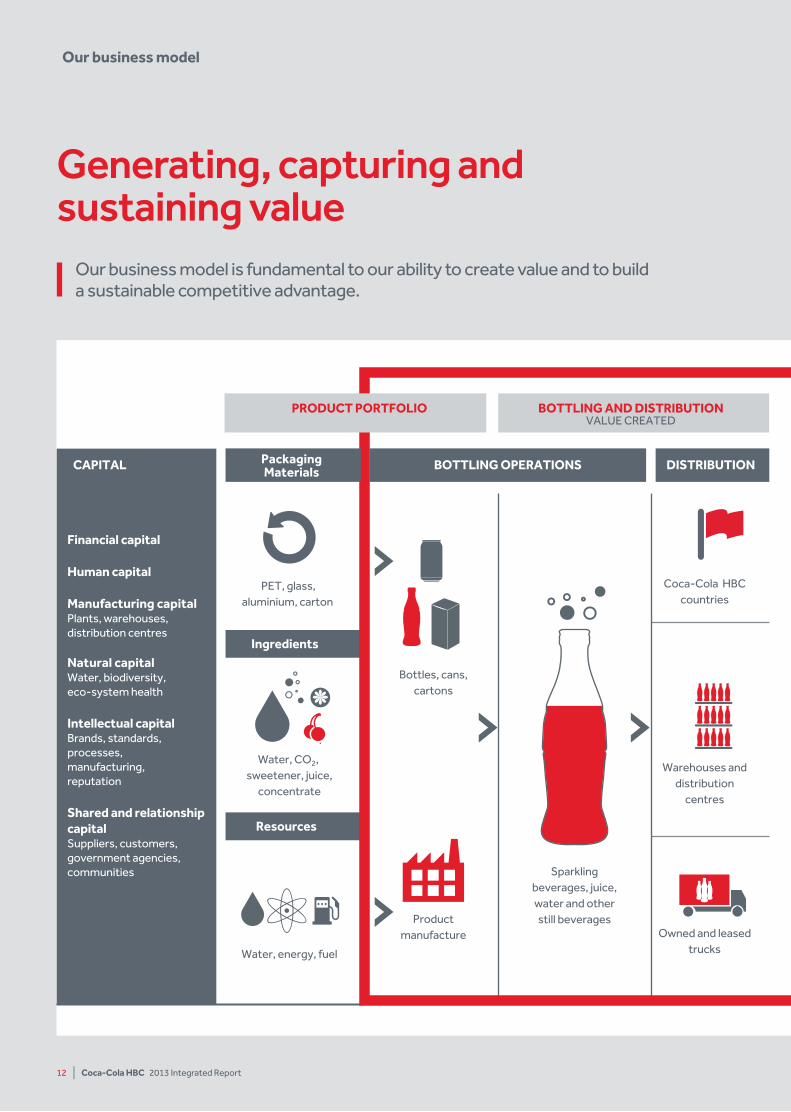
Generating, capturing and sustaining value
Our business model
PET, glass, aluminium, carton
Water, CO2, sweetener, juice,
concentrate
Bottles, cans, cartons
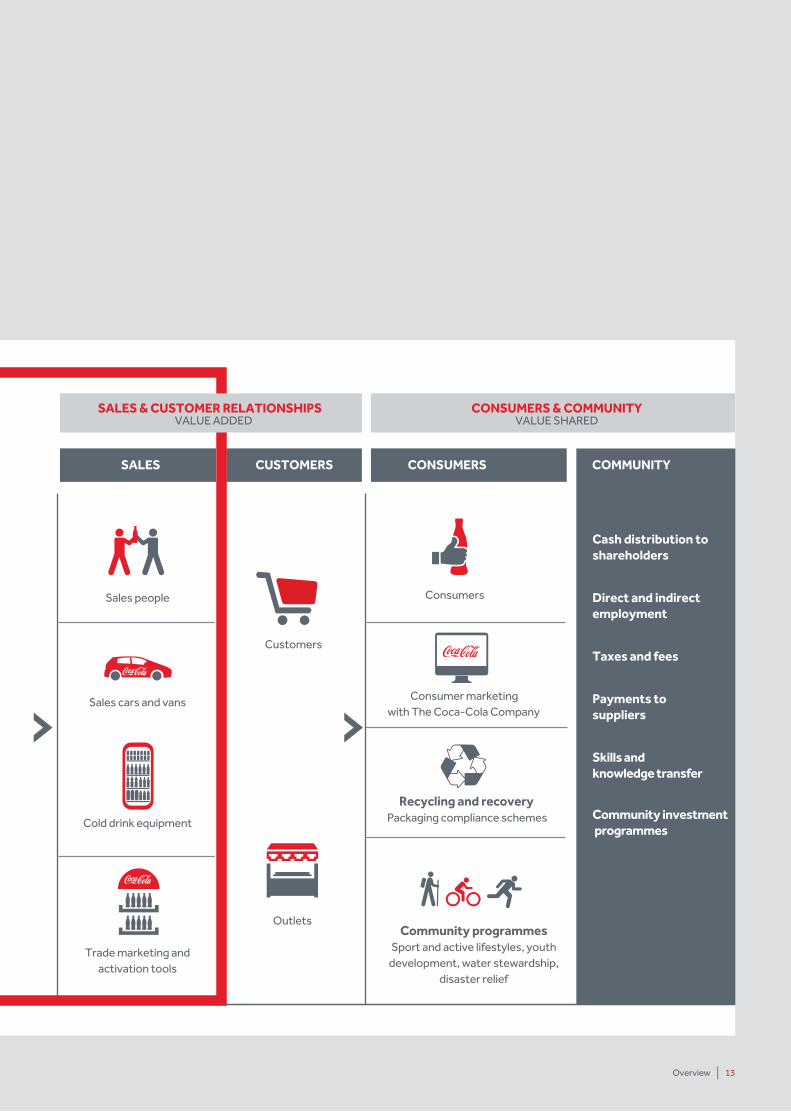
Coca-Cola HBC countries Sales people
Customers
Consumers
Consumer marketing with The Coca-Cola Company
Recycling and recovery Packaging compliance schemes
Community programmesSport and active lifestyles, youth
development, water stewardship, disaster relief
Outlets
Sales cars and vans
Cold drink equipment
Trade marketing and activation tools
Warehouses and distribution
centres
Owned and leased trucks
Product manufacture
Sparkling beverages, juice, water and other still beverages
Water, energy, fuel
Cash distribution to shareholders
Direct and indirect employment
Taxes and fees
Payments to suppliers
Skills and knowledge transfer
Community investment programmes
DISTRIBUTION SALES CUSTOMERS CONSUMERS COMMUNITYCAPITAL
Ingredients
Resources
BOTTLING OPERATIONSPackagingMaterials
PRODUCT PORTFOLIO BOTTLING AND DISTRIBUTIONVALUE CREATED
SALES & CUSTOMER RELATIONSHIPSVALUE ADDED
CONSUMERS & COMMUNITYVALUE SHARED
Financial capital
Human capital
Manufacturing capitalPlants, warehouses, distribution centres
Natural capitalWater, biodiversity, eco-system health
Intellectual capitalBrands, standards,processes, manufacturing, reputation
Shared and relationship capitalSuppliers, customers,government agencies, communities
Our business model is fundamental to our ability to create value and to build a sustainable competitive advantage.
Overview | 13
PET, glass, aluminium, carton
Water, CO2, sweetener, juice,
concentrate
Bottles, cans, cartons
Coca-Cola HBC countries Sales people
Customers
Consumers
Consumer marketing with The Coca-Cola Company
Recycling and recovery Packaging compliance schemes
Community programmesSport and active lifestyles, youth
development, water stewardship, disaster relief
Outlets
Sales cars and vans
Cold drink equipment
Trade marketing and activation tools
Warehouses and distribution
centres
Owned and leased trucks
Product manufacture
Sparkling beverages, juice, water and other still beverages
Water, energy, fuel
Cash distribution to shareholders
Direct and indirect employment
Taxes and fees
Payments to suppliers
Skills and knowledge transfer
Community investment programmes
DISTRIBUTION SALES CUSTOMERS CONSUMERS COMMUNITYCAPITAL
Ingredients
Resources
BOTTLING OPERATIONSPackagingMaterials
PRODUCT PORTFOLIO BOTTLING AND DISTRIBUTIONVALUE CREATED
SALES & CUSTOMER RELATIONSHIPSVALUE ADDED
CONSUMERS & COMMUNITYVALUE SHARED
Financial capital
Human capital
Manufacturing capitalPlants, warehouses, distribution centres
Natural capitalWater, biodiversity, eco-system health
Intellectual capitalBrands, standards,processes, manufacturing, reputation
Shared and relationship capitalSuppliers, customers,government agencies, communities
14 | Coca-Cola HBC 2013 Integrated Report
Our strategic framework
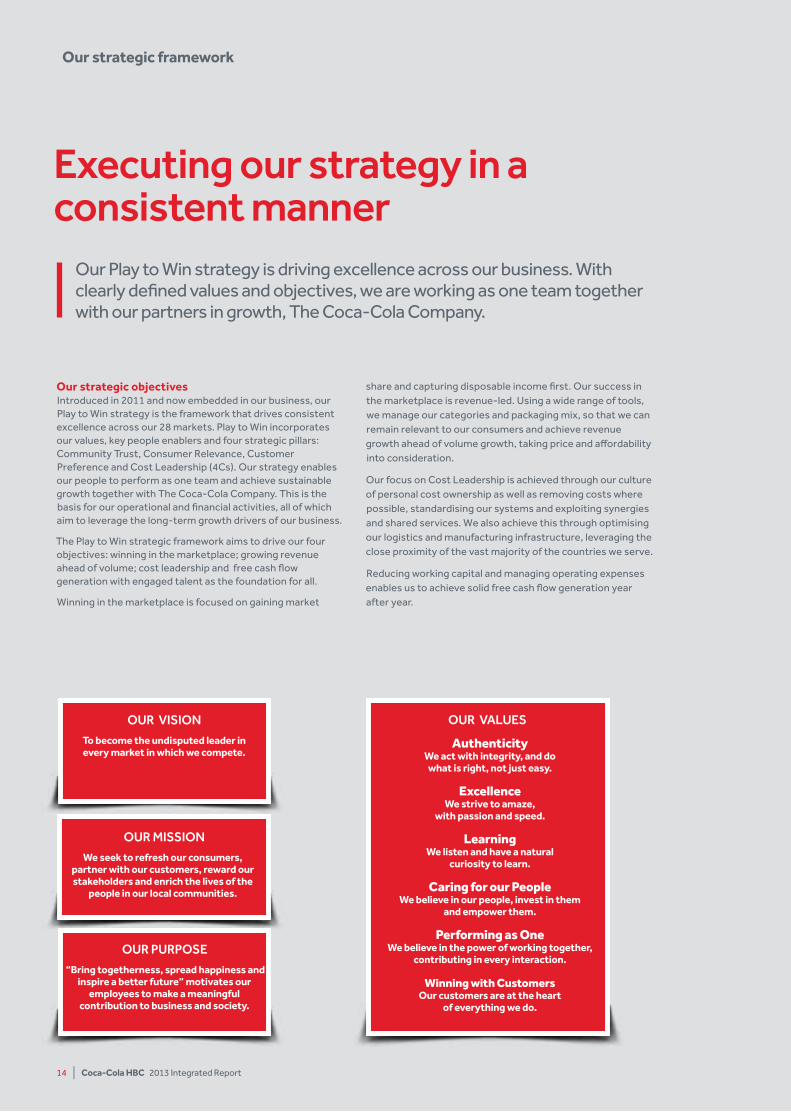
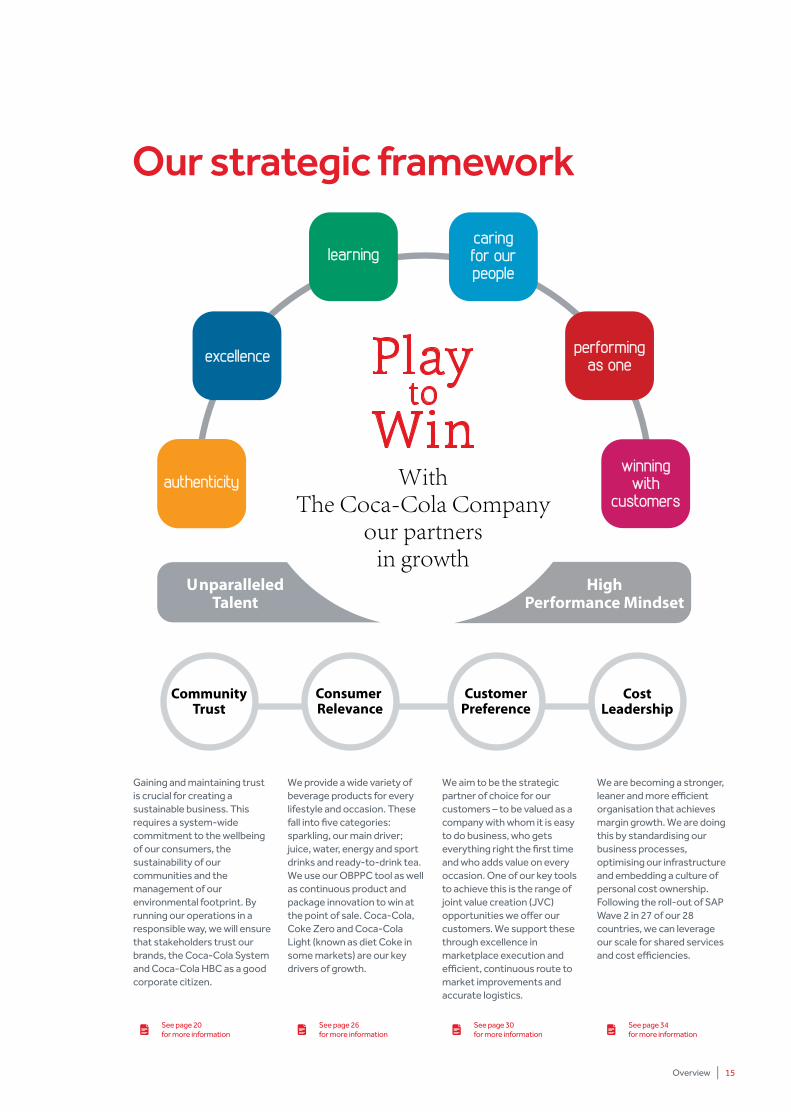
Our strategic objectivesIntroduced in 2011 and now embedded in our business, our Play to Win strategy is the framework that drives consistent excellence across our 28 markets. Play to Win incorporates our values, key people enablers and four strategic pillars: Community Trust, Consumer Relevance, Customer Preference and Cost Leadership (4Cs). Our strategy enables our people to perform as one team and achieve sustainable growth together with The Coca-Cola Company. This is the basis for our operational and financial activities, all of which aim to leverage the long-term growth drivers of our business.
The Play to Win strategic framework aims to drive our four objectives: winning in the marketplace; growing revenue ahead of volume; cost leadership and free cash flow generation with engaged talent as the foundation for all.
Winning in the marketplace is focused on gaining market
share and capturing disposable income first. Our success in the marketplace is revenue-led. Using a wide range of tools, we manage our categories and packaging mix, so that we can remain relevant to our consumers and achieve revenue growth ahead of volume growth, taking price and affordability into consideration.
Our focus on Cost Leadership is achieved through our culture of personal cost ownership as well as removing costs where possible, standardising our systems and exploiting synergies and shared services. We also achieve this through optimising our logistics and manufacturing infrastructure, leveraging the close proximity of the vast majority of the countries we serve.
Reducing working capital and managing operating expenses enables us to achieve solid free cash flow generation year after year.
Executing our strategy in a consistent manner
Our Play to Win strategy is driving excellence across our business. With clearly defined values and objectives, we are working as one team together with our partners in growth, The Coca-Cola Company.
OuR vISIOn
OuR PuRPOSE
To become the undisputed leader in every market in which we compete.
“Bring togetherness, spread happiness and inspire a better future” motivates our
employees to make a meaningful contribution to business and society.
OuR MISSIOn
We seek to refresh our consumers, partner with our customers, reward our stakeholders and enrich the lives of the
people in our local communities.
OuR vALuES
Authenticity We act with integrity, and do what is right, not just easy.
ExcellenceWe strive to amaze,
with passion and speed.
Learning We listen and have a natural
curiosity to learn.
Caring for our PeopleWe believe in our people, invest in them
and empower them.
Performing as OneWe believe in the power of working together,
contributing in every interaction.
Winning with CustomersOur customers are at the heart
of everything we do.
Overview | 15
Our strategic framework
See page 20 for more information
See page 26 for more information
See page 30 for more information
See page 34 for more information
Gaining and maintaining trust is crucial for creating a sustainable business. This requires a system-wide commitment to the wellbeing of our consumers, the sustainability of our communities and the management of our environmental footprint. By running our operations in a responsible way, we will ensure that stakeholders trust our brands, the Coca-Cola System and Coca-Cola HBC as a good corporate citizen.
We provide a wide variety of beverage products for every lifestyle and occasion. These fall into five categories: sparkling, our main driver; juice, water, energy and sport drinks and ready-to-drink tea. We use our OBPPC tool as well as continuous product and package innovation to win at the point of sale. Coca-Cola, Coke Zero and Coca-Cola Light (known as diet Coke in some markets) are our key drivers of growth.
We aim to be the strategic partner of choice for our customers – to be valued as a company with whom it is easy to do business, who gets everything right the first time and who adds value on every occasion. One of our key tools to achieve this is the range of joint value creation (JVC) opportunities we offer our customers. We support these through excellence in marketplace execution and efficient, continuous route to market improvements and accurate logistics.
We are becoming a stronger, leaner and more efficient organisation that achieves margin growth. We are doing this by standardising our business processes, optimising our infrastructure and embedding a culture of personal cost ownership. Following the roll-out of SAP Wave 2 in 27 of our 28 countries, we can leverage our scale for shared services and cost efficiencies.
16 | Coca-Cola HBC 2013 Integrated Report
Our strategic framework
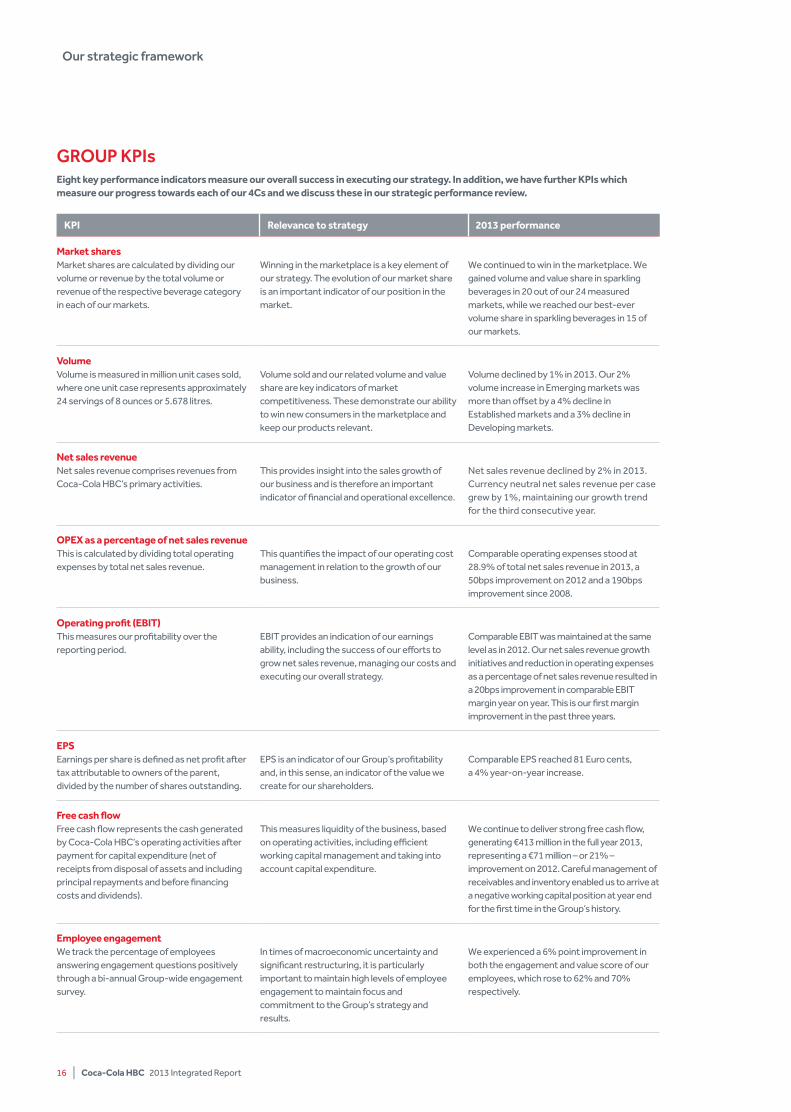
Eight key performance indicators measure our overall success in executing our strategy. in addition, we have further Kpis which measure our progress towards each of our 4Cs and we discuss these in our strategic performance review.
GROuP KPIs
Kpi Relevance to strategy 2013 performance
Market sharesMarket shares are calculated by dividing our volume or revenue by the total volume or revenue of the respective beverage category in each of our markets.
Winning in the marketplace is a key element of our strategy. The evolution of our market share is an important indicator of our position in the market.
We continued to win in the marketplace. We gained volume and value share in sparkling beverages in 20 out of our 24 measured markets, while we reached our best-ever volume share in sparkling beverages in 15 of our markets.
VolumeVolume is measured in million unit cases sold, where one unit case represents approximately 24 servings of 8 ounces or 5.678 litres.
Volume sold and our related volume and value share are key indicators of market competitiveness. These demonstrate our ability to win new consumers in the marketplace and keep our products relevant.
Volume declined by 1% in 2013. Our 2% volume increase in Emerging markets was more than offset by a 4% decline in Established markets and a 3% decline in Developing markets.
Net sales revenueNet sales revenue comprises revenues from Coca-Cola HBC’s primary activities.
This provides insight into the sales growth of our business and is therefore an important indicator of financial and operational excellence.
Net sales revenue declined by 2% in 2013. Currency neutral net sales revenue per case grew by 1%, maintaining our growth trend for the third consecutive year.
OpEx as a percentage of net sales revenue This is calculated by dividing total operating expenses by total net sales revenue.
This quantifies the impact of our operating cost management in relation to the growth of our business.
Comparable operating expenses stood at 28.9% of total net sales revenue in 2013, a 50bps improvement on 2012 and a 190bps improvement since 2008.
Operating profit (EBiT)This measures our profitability over the reporting period.
EBIT provides an indication of our earnings ability, including the success of our efforts to grow net sales revenue, managing our costs and executing our overall strategy.
Comparable EBIT was maintained at the same level as in 2012. Our net sales revenue growth initiatives and reduction in operating expenses as a percentage of net sales revenue resulted in a 20bps improvement in comparable EBIT margin year on year. This is our first margin improvement in the past three years.
EpSEarnings per share is defined as net profit after tax attributable to owners of the parent, divided by the number of shares outstanding.
EPS is an indicator of our Group’s profitability and, in this sense, an indicator of the value we create for our shareholders.
Comparable EPS reached 81 Euro cents, a 4% year-on-year increase.
Free cash flowFree cash flow represents the cash generated by Coca-Cola HBC’s operating activities after payment for capital expenditure (net of receipts from disposal of assets and including principal repayments and before financing costs and dividends).
This measures liquidity of the business, based on operating activities, including efficient working capital management and taking into account capital expenditure.
We continue to deliver strong free cash flow, generating €413 million in the full year 2013, representing a €71 million – or 21% – improvement on 2012. Careful management of receivables and inventory enabled us to arrive at a negative working capital position at year end for the first time in the Group’s history.
Employee engagementWe track the percentage of employees answering engagement questions positively through a bi-annual Group-wide engagement survey.
In times of macroeconomic uncertainty and significant restructuring, it is particularly important to maintain high levels of employee engagement to maintain focus and commitment to the Group’s strategy and results.
We experienced a 6% point improvement in both the engagement and value score of our employees, which rose to 62% and 70% respectively.
Overview | 17
Market context
Macroeconomic trends 2013 was yet another year where incomes stagnated or declined in many of our markets. Although continuing low levels of consumer confidence remained a recurring theme, we successfully shaped our packaging and product mix to capture opportunities across our Established, Developing and Emerging market segments. We also took advantage of the overall market environment to further optimise our cost base.
In our Established markets, only Ireland has seen some degree of stabilisation, while Greece continues to suffer from the deepest recession in recent memory. The trading environment in Italy also remains challenging and this is likely to continue into 2014 and possibly beyond. Switzerland and Austria, on the other hand, have been more stable. Despite this challenging backdrop, we successfully grew our sparkling value and volume share – spearheaded by the innovative ‘Connect – Share a Coke’ campaign. In our Developing markets, we witnessed significant volatility, with some of the lowest consumer confidence experienced in the Czech Republic and Poland. Our countries outside the Eurozone have also experienced significant currency fluctuations. Importantly, in this volatile market environment we improved our operating expenses as a percentage of net sales revenue, enhancing cash-flow generation. In Emerging markets, countries such as Russia have been resilient to economic uncertainty, while Romania, Serbia and Ukraine continued to be severely challenged. Nigeria, however, remains promising with continued GDP growth. This sector continued to be a key growth driver and we increased our currency-neutral net sales revenue per case by approximately 3%.
We have addressed this challenging macroeconomic environment by leveraging our scale and geographic footprint to centralise many of our business services in low-cost environments. We are also taking the opportunity to make investments in cross-border manufacturing and logistics.
industry and consumer trendsAlthough each country in which we operate has unique characteristics, the defining trend of the last decade has been the shift from traditional, small stores to modern, structured trade, including supermarkets, hypermarkets and, most notably, discounters. Transactions in these retail environments are characterised by the purchase of multipacks or larger-volume servings for future consumption. This trend has accelerated faster than most observers had predicted, with a large number of traditional trade outlets going out of business each year.
To capture opportunities and grow our margins in organised trade, we have worked hard to demonstrate the added value our
premium brands can bring to the retailers’ own businesses, which we discuss in the Customer Preference chapter. The rise of discounters has also necessitated a focus on our customer pricing structure and as a result, in 2013 we reached a multi-year agreement with a leading European discounter – a major achievement. In addition, e-retailing has continued its inexorable rise as another channel for major retail brands. We are capturing opportunities in this channel through a wide range of initiatives with our customers.
Overlaying these broad trends has been the growing tendency of consumers to make more frequent – and smaller basket – trips to local retail outlets. This reflects many years of economic contraction and is affecting virtually every retail channel, with approximately 85% of transactions now taking place in small baskets. Using our OBPPC strategic tool, we ensure that we have available the right product and package mix to capture share of these smaller baskets, as we discuss in the Consumer Relevance chapter.
input costs and commoditiesOur key input materials are PET resin, sugar, aluminium, concentrate and beverage bases. The total annual supplier spend in 2013 was €4,364.5 million. Overall input prices reduced in 2013 with a lower-demand environment increasing our leverage with our supply base. However, lower demand has also increased the risk of suppliers going out of business. We are therefore working with suppliers to secure our key inputs and we build strong relationships in order to reduce costs and complexity for both parties, while ensuring the quality of our supply.
This year has seen some good overall developments in the world sugar market which are expected to flow through in 2014. European Union sugar experienced a slight increase, but we are expecting better pricing in 2014 and 2015. PET resin and aluminium have largely followed market trends with our aluminium pricing predominantly hedged for 2014. PET resin cannot be hedged, therefore when we can pre-stock at attractive prices, we do so.
long-term outlookIn 2014, we expect a challenging macroeconomic and trading environment in most of our markets. Persistently high unemployment is likely to continue affecting disposable income, while recent currency developments in our Emerging and Developing markets may add further pressure to the overall trading environment. In the Emerging markets, the potential impact from recent financial and geopolitical turmoil remains uncertain. However, we have successfully positioned our business to capture volume and value share across our categories.
Consistent growth across markets
We have strategies and tools in place to enable us to win at the point of sale in every market, every day, despite continuing macroeconomic challenges.
STRATEGiC pERFORMANCE
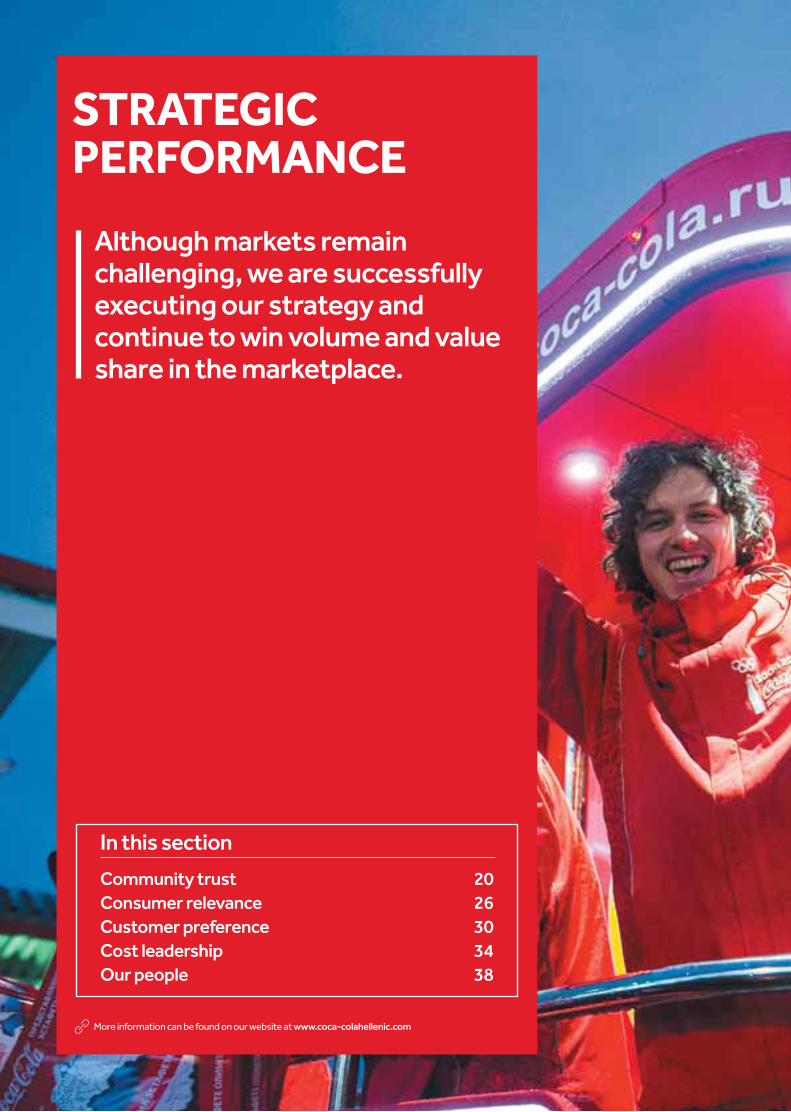
Although markets remain challenging, we are successfully executing our strategy and continue to win volume and value share in the marketplace.
In this section
Community trust 20Consumer relevance 26Customer preference 30Cost leadership 34Our people 38
More information can be found on our website at www.coca-colahellenic.com
20 | Coca-Cola HBC 2013 Integrated Report
Community trust is the foundation of our business. Without trust, we simply cannot operate - we would not have employees, customers or consumers.
For our business and brands to be trusted, Coca-Cola HBC must operate responsibly, engage with stakeholders and contribute to the sustainable development of our communities. As a prerequisite to winning in the marketplace, Community Trust is a key pillar in our Play to Win strategy.
Over the last decade, we have integrated corporate responsibility and sustainability into the way we run our business. We identified the material issues to our business and our stakeholders (see Engaging with stakeholders) and developed ambitious strategies and commitments, along with rigorous governance. As a foundation, we have implemented internationally recognised management systems. Sixty-seven bottling plants accounting for 99% of our production volume are now certified for quality (ISO 9001), environment (ISO 14001), health and safety (OHSAS 18001) and food safety (ISO 22000 and FSSC 22000). We have also made ambitious commitments and report our progress on those publicly.
For six consecutive years, we have been part of the Dow Jones Sustainability Index (DJSI); we hold the leading score on the Europe Index and are second on the Dow Jones Sustainability Index World Index. In addition, we are a Supersector leader (top five) on the FTSE4Good Index. These listings are a good indicator of how deeply socio-economic and environmental factors are embedded in our business - as well as how positively we are perceived by our stakeholders. We continue to support the UN Global Compact and have implemented its ten universal principles, which encourage responsible business practices in the areas of human rights, labour, the environment and anti-corruption.
2013 performanceOur sustainability programmes are long-term investments, building value over time for our business and communities. Consumer health and wellness is a key issue for our business and our communities but we also focus on minimising our
environmental impact, developing sustainability in our value chain and creating value for our communities.
Health and wellnessAll of our products can be part of an active, healthy lifestyle that includes a sensible, balanced diet and regular physical activity. Weight gain is primarily the result of energy imbalance - too many calories consumed and too few expended.
To help consumers achieve a balance between the calories they consume and expend, The Coca-Cola Company announced a series of commitments in 2013 that our global business system will seek to achieve by 2020. We will:
• Offer low or no-calorie beverage options in every market;
• Provide transparent nutrition information, featuring calories on the front of all packages;
• Help get people moving by supporting physical activity programmes in every country where we do business; and
• Market responsibly, including no marketing to children under 12 anywhere in the world.
To provide consumers with more choices, Coca-Cola HBC is accelerating the growth of diet, light and zero-calorie beverages in our portfolio. A number of beverages have been reformulated to contain less sugar and consequently fewer calories, such as Sprite and Nestea with Stevia which now contain up to 30% fewer calories.
Clear and transparent communication on the calorie content of our products helps consumers make informed choices and manage their overall energy balance. In 2007, we pioneered the use of Guideline Daily Amounts (GDA) labels on the front of packages in our EU countries. Since then, we have rolled out front-of-pack labelling of calorie content in non-EU countries too.
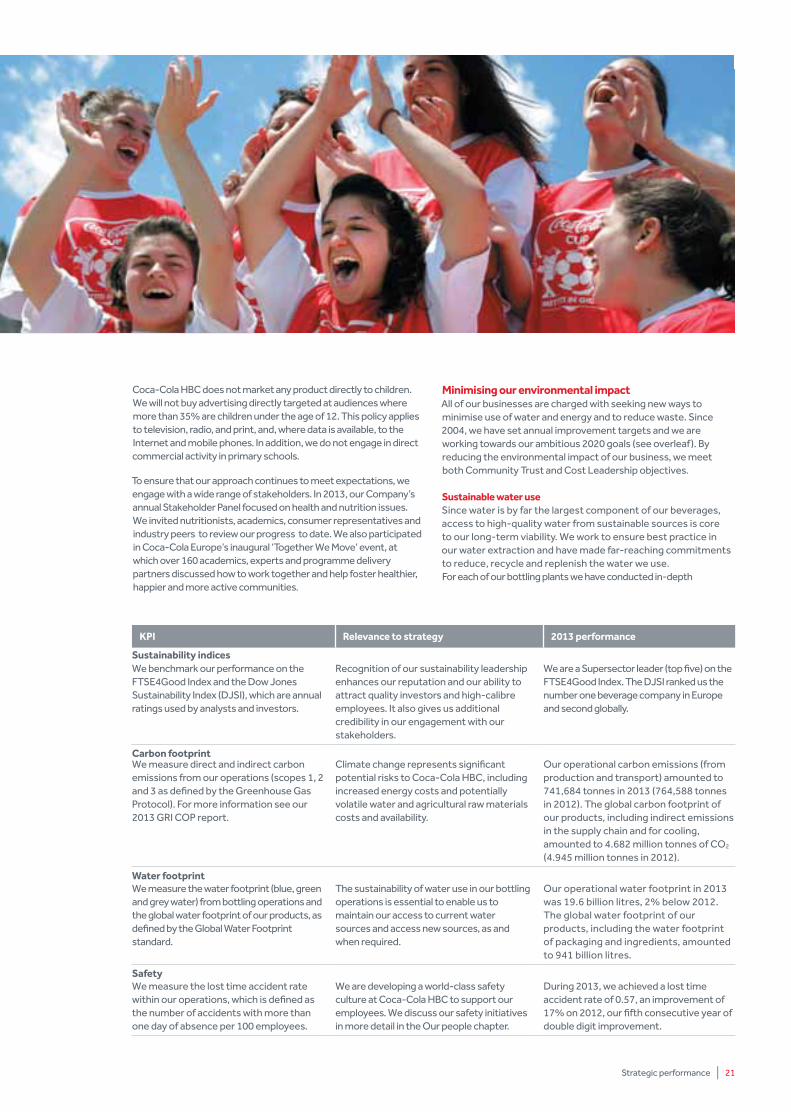
In 27 countries, we support a wide range of sports and fitness events in a bid to encourage people of all ages and abilities to be more physically active. Approximately 2.1 million people actively took part in programmes organised or supported by our Company during 2013.
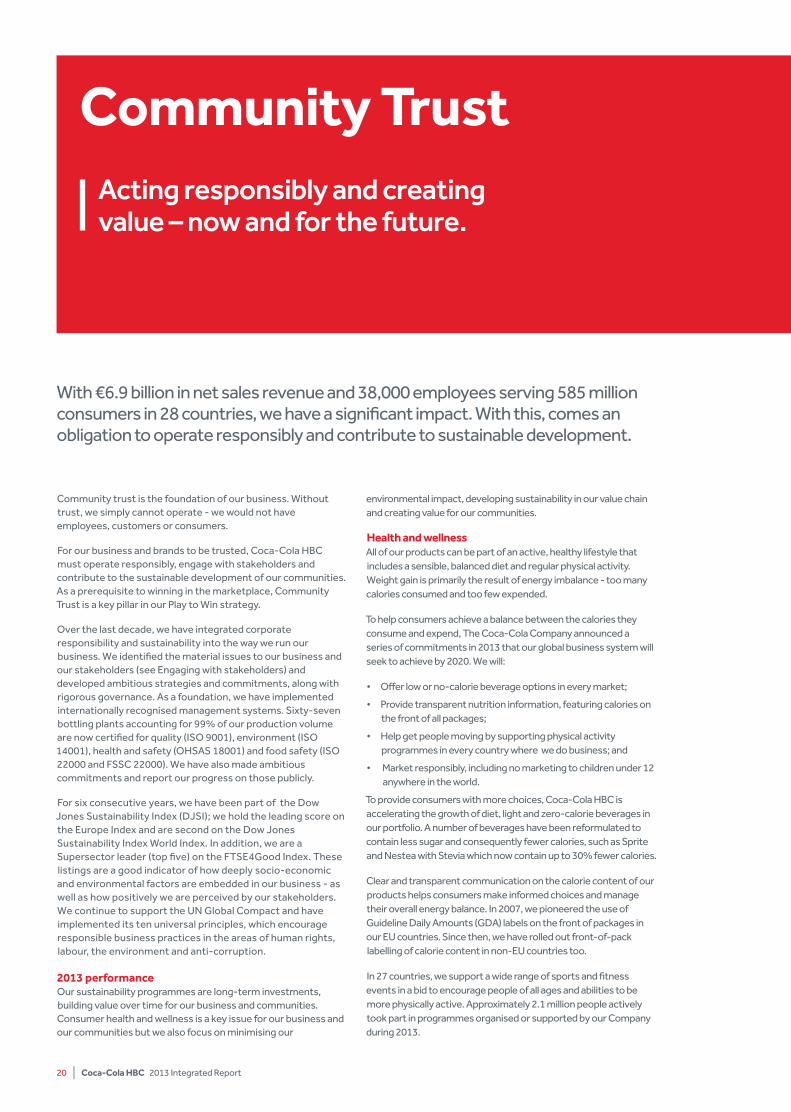
With €6.9 billion in net sales revenue and 38,000 employees serving 585 million consumers in 28 countries, we have a significant impact. With this, comes an obligation to operate responsibly and contribute to sustainable development.
Community TrustActing responsibly and creating value – now and for the future.
Strategic performance | 21
Coca-Cola HBC does not market any product directly to children. We will not buy advertising directly targeted at audiences where more than 35% are children under the age of 12. This policy applies to television, radio, and print, and, where data is available, to the Internet and mobile phones. In addition, we do not engage in direct commercial activity in primary schools.
To ensure that our approach continues to meet expectations, we engage with a wide range of stakeholders. In 2013, our Company’s annual Stakeholder Panel focused on health and nutrition issues. We invited nutritionists, academics, consumer representatives and industry peers to review our progress to date. We also participated in Coca-Cola Europe’s inaugural ‘Together We Move’ event, at which over 160 academics, experts and programme delivery partners discussed how to work together and help foster healthier, happier and more active communities.
Minimising our environmental impactAll of our businesses are charged with seeking new ways to minimise use of water and energy and to reduce waste. Since 2004, we have set annual improvement targets and we are working towards our ambitious 2020 goals (see overleaf). By reducing the environmental impact of our business, we meet both Community Trust and Cost Leadership objectives. Sustainable water useSince water is by far the largest component of our beverages, access to high-quality water from sustainable sources is core to our long-term viability. We work to ensure best practice in our water extraction and have made far-reaching commitments to reduce, recycle and replenish the water we use. For each of our bottling plants we have conducted in-depth
Kpi Relevance to strategy 2013 performance
Sustainability indicesWe benchmark our performance on the FTSE4Good Index and the Dow Jones Sustainability Index (DJSI), which are annual ratings used by analysts and investors.
Recognition of our sustainability leadership enhances our reputation and our ability to attract quality investors and high-calibre employees. It also gives us additional credibility in our engagement with our stakeholders.
We are a Supersector leader (top five) on the FTSE4Good Index. The DJSI ranked us the number one beverage company in Europe and second globally.
Carbon footprintWe measure direct and indirect carbon emissions from our operations (scopes 1, 2 and 3 as defined by the Greenhouse Gas Protocol). For more information see our 2013 GRI COP report.
Climate change represents significant potential risks to Coca-Cola HBC, including increased energy costs and potentially volatile water and agricultural raw materials costs and availability.
Our operational carbon emissions (from production and transport) amounted to 741,684 tonnes in 2013 (764,588 tonnes in 2012). The global carbon footprint of our products, including indirect emissions in the supply chain and for cooling, amounted to 4.682 million tonnes of CO2
(4.945 million tonnes in 2012).
Water footprintWe measure the water footprint (blue, green and grey water) from bottling operations and the global water footprint of our products, as defined by the Global Water Footprint standard.
The sustainability of water use in our bottling operations is essential to enable us to maintain our access to current water sources and access new sources, as and when required.
Our operational water footprint in 2013 was 19.6 billion litres, 2% below 2012. The global water footprint of our products, including the water footprint of packaging and ingredients, amounted to 941 billion litres.
SafetyWe measure the lost time accident rate within our operations, which is defined as the number of accidents with more than one day of absence per 100 employees.
We are developing a world-class safety culture at Coca-Cola HBC to support our employees. We discuss our safety initiatives in more detail in the Our people chapter.
During 2013, we achieved a lost time accident rate of 0.57, an improvement of 17% on 2012, our fifth consecutive year of double digit improvement.
22 | Coca-Cola HBC 2013 Integrated Report
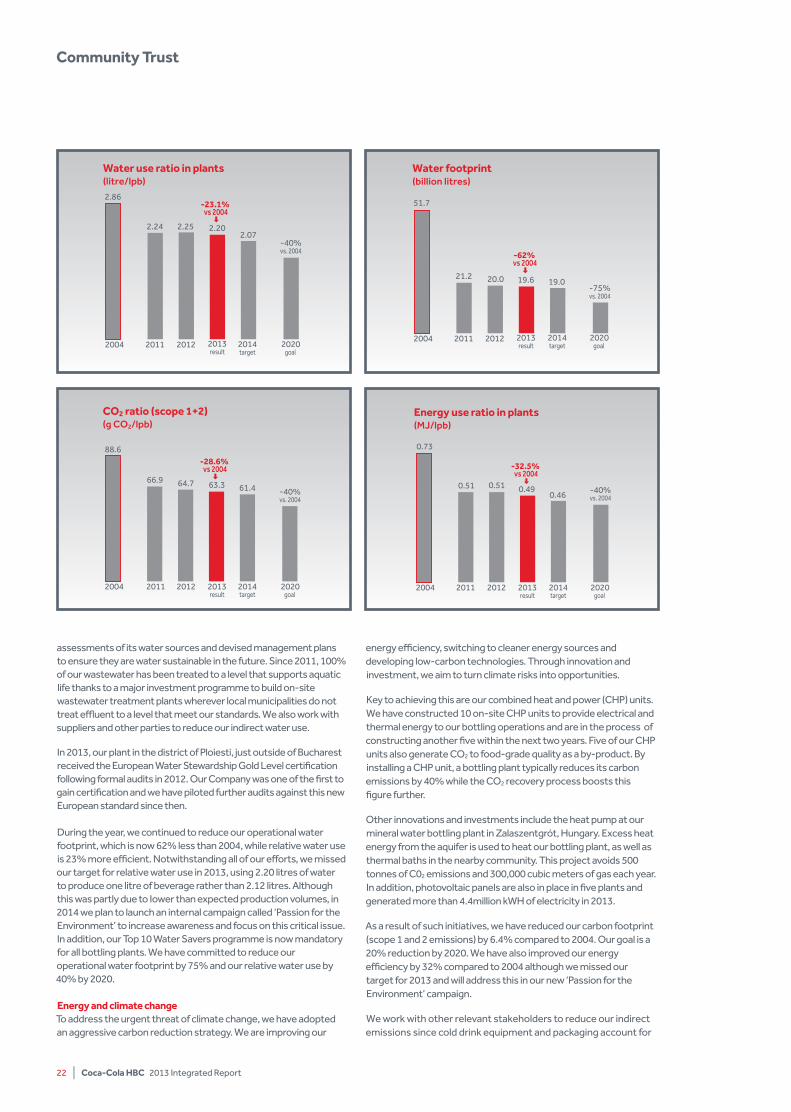
assessments of its water sources and devised management plans to ensure they are water sustainable in the future. Since 2011, 100% of our wastewater has been treated to a level that supports aquatic life thanks to a major investment programme to build on-site wastewater treatment plants wherever local municipalities do not treat effluent to a level that meet our standards. We also work with suppliers and other parties to reduce our indirect water use.
In 2013, our plant in the district of Ploiesti, just outside of Bucharest received the European Water Stewardship Gold Level certification following formal audits in 2012. Our Company was one of the first to gain certification and we have piloted further audits against this new European standard since then.
During the year, we continued to reduce our operational water footprint, which is now 62% less than 2004, while relative water use is 23% more efficient. Notwithstanding all of our efforts, we missed our target for relative water use in 2013, using 2.20 litres of water to produce one litre of beverage rather than 2.12 litres. Although this was partly due to Iower than expected production volumes, in 2014 we plan to launch an internal campaign called ‘Passion for the Environment’ to increase awareness and focus on this critical issue. In addition, our Top 10 Water Savers programme is now mandatory for all bottling plants. We have committed to reduce our operational water footprint by 75% and our relative water use by 40% by 2020.
Energy and climate changeTo address the urgent threat of climate change, we have adopted an aggressive carbon reduction strategy. We are improving our
energy efficiency, switching to cleaner energy sources and developing low-carbon technologies. Through innovation and investment, we aim to turn climate risks into opportunities.
Key to achieving this are our combined heat and power (CHP) units. We have constructed 10 on-site CHP units to provide electrical and thermal energy to our bottling operations and are in the process of constructing another five within the next two years. Five of our CHP units also generate CO2 to food-grade quality as a by-product. By installing a CHP unit, a bottling plant typically reduces its carbon emissions by 40% while the CO2 recovery process boosts this figure further.
Other innovations and investments include the heat pump at our mineral water bottling plant in Zalaszentgrót, Hungary. Excess heat energy from the aquifer is used to heat our bottling plant, as well as thermal baths in the nearby community. This project avoids 500 tonnes of C02 emissions and 300,000 cubic meters of gas each year. In addition, photovoltaic panels are also in place in five plants and generated more than 4.4million kWH of electricity in 2013.
As a result of such initiatives, we have reduced our carbon footprint (scope 1 and 2 emissions) by 6.4% compared to 2004. Our goal is a 20% reduction by 2020. We have also improved our energy efficiency by 32% compared to 2004 although we missed our target for 2013 and will address this in our new ‘Passion for the Environment’ campaign.
We work with other relevant stakeholders to reduce our indirect emissions since cold drink equipment and packaging account for
Community Trust
Energy use ratio in plants (MJ/lpb)
-32.5% vs 2004
2020goal
2014target
2013result
201220112004
0.73
0.51 0.51 0.490.46 -40%
vs. 2004
CO2 ratio (scope 1+2) (g CO2/lpb)
-28.6% vs 2004
2012 2013result
2014target
2020goal
20112004
88.6
66.9 64.7 63.3 61.4 -40%vs. 2004
Water use ratio in plants (litre/lpb)
-23.1% vs 2004
201220112004
2.86
2.24 2.25 2.202.07
-40%vs. 2004
2020goal
2014target
2013result
-62% vs 2004
201220112004
21.2
51.7
20.0 19.6 19.0-75%vs. 2004
Water footprint(billion litres)
2020goal
2014target
2013result
most of our total carbon footprint. Together with suppliers, we developed hydrofluorocarbon-free (HFC-free) coolers which are up to 63% more efficient than older models. In 2013, HFC-free models accounted for almost two-thirds (64%) of coolers purchased, while 85% were equipped with an energy management device. All of our new equipment will be HFC-free by 2015. We are also working to retrofit existing equipment in the marketplace with similar devices.
Sustainable packaging and recyclingWe are minimising the environmental impacts of our packaging at every stage of its life-cycle. Since 2004, we have worked to optimise the amount of packaging we use. For example, our PET packages now contain at least 20% less material, avoiding 125,000 tonnes of CO2 each year.
During 2013, we developed the lightest and most environmentally friendly can in the world through our partnership with Ball Packaging Europe. The new 330ml can weighs only 9.45g compared to its 9.9g predecessor. If we switched our can usage entirely to this ultra lightweight can, some 850 metric tonnes of aluminium would be avoided each year, around 2.5% of our annual usage. In addition, PET lightweighting initiatives in 2013 alone allowed us to save 1,963 tonnes of material, around 1% of our annual usage.
We are also increasing our use of recycled or renewable content. Since recycling of metal and glass is well established, we focus on increasing the recycled content of our PET bottles. In 2013, our use of recycled PET (rPET) rose by 23%. We also continued to roll out Plantbottle™, the first fully recyclable PET bottle to use renewable plant-based content. The package was developed by The Coca-Cola Company and includes up to 30% plant-based material. With Plantbottle™ now launched in Bulgaria and Serbia, we plan to extend its use in 2014 and beyond.
Collection, recovery and recycling of our packages is another key focus area. To date, we have helped to set up 19 recovery organisations. As a result, more than 133 million people across 18,500 municipalities now have access to collection and recycling infrastructure - in some countries, this marks the first residential collection of any waste stream in rural communities. In 2013, these organisations recycled or recovered the equivalent of 73% of our packaging.
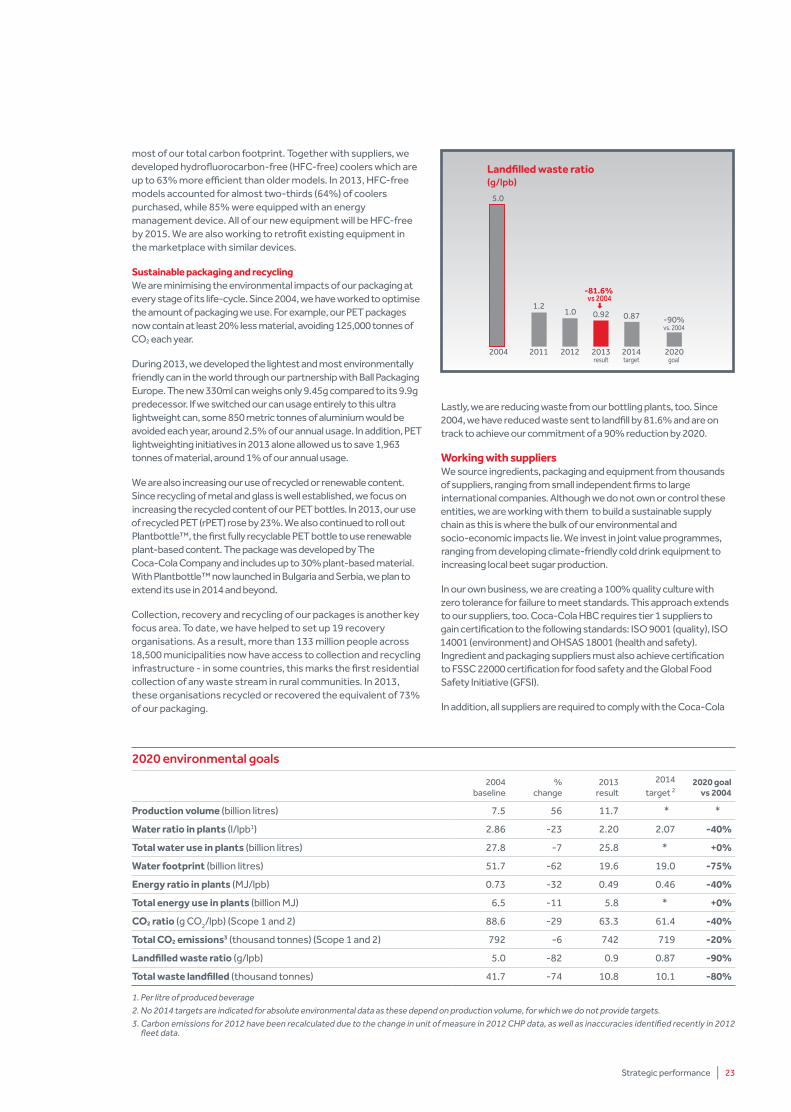
Lastly, we are reducing waste from our bottling plants, too. Since 2004, we have reduced waste sent to landfill by 81.6% and are on track to achieve our commitment of a 90% reduction by 2020.
Working with suppliersWe source ingredients, packaging and equipment from thousands of suppliers, ranging from small independent firms to large international companies. Although we do not own or control these entities, we are working with them to build a sustainable supply chain as this is where the bulk of our environmental and socio-economic impacts lie. We invest in joint value programmes, ranging from developing climate-friendly cold drink equipment to increasing local beet sugar production.
In our own business, we are creating a 100% quality culture with zero tolerance for failure to meet standards. This approach extends to our suppliers, too. Coca-Cola HBC requires tier 1 suppliers to gain certification to the following standards: ISO 9001 (quality), ISO 14001 (environment) and OHSAS 18001 (health and safety). Ingredient and packaging suppliers must also achieve certification to FSSC 22000 certification for food safety and the Global Food Safety Initiative (GFSI).
In addition, all suppliers are required to comply with the Coca-Cola
Strategic performance | 23
2020 environmental goals
2004 baseline
% change
2013 result
2014
target 22020 goal
vs 2004
production volume (billion litres) 7.5 56 11.7 * *
Water ratio in plants (l/lpb1) 2.86 -23 2.20 2.07 -40%
Total water use in plants (billion litres) 27.8 -7 25.8 * +0%
Water footprint (billion litres) 51.7 -62 19.6 19.0 -75%
Energy ratio in plants (MJ/lpb) 0.73 -32 0.49 0.46 -40%
Total energy use in plants (billion MJ) 6.5 -11 5.8 * +0%
CO2 ratio (g CO2/lpb) (Scope 1 and 2) 88.6 -29 63.3 61.4 -40%
Total CO2 emissions3 (thousand tonnes) (Scope 1 and 2) 792 -6 742 719 -20%
landfilled waste ratio (g/lpb) 5.0 -82 0.9 0.87 -90%
Total waste landfilled (thousand tonnes) 41.7 -74 10.8 10.1 -80%
1. Per litre of produced beverage2. No 2014 targets are indicated for absolute environmental data as these depend on production volume, for which we do not provide targets.3. Carbon emissions for 2012 have been recalculated due to the change in unit of measure in 2012 CHP data, as well as inaccuracies identified recently in 2012
fleet data.
Landfilled waste ratio (g/lpb)
-81.6% vs 2004
2012 2013result
2014target
2020goal
20112004
5.0
1.21.0 0.92 0.87 -90%
vs. 2004
24 | Coca-Cola HBC 2013 Integrated Report
Community Trust
More community projects can be found on our website at www.coca-colahellenic.com
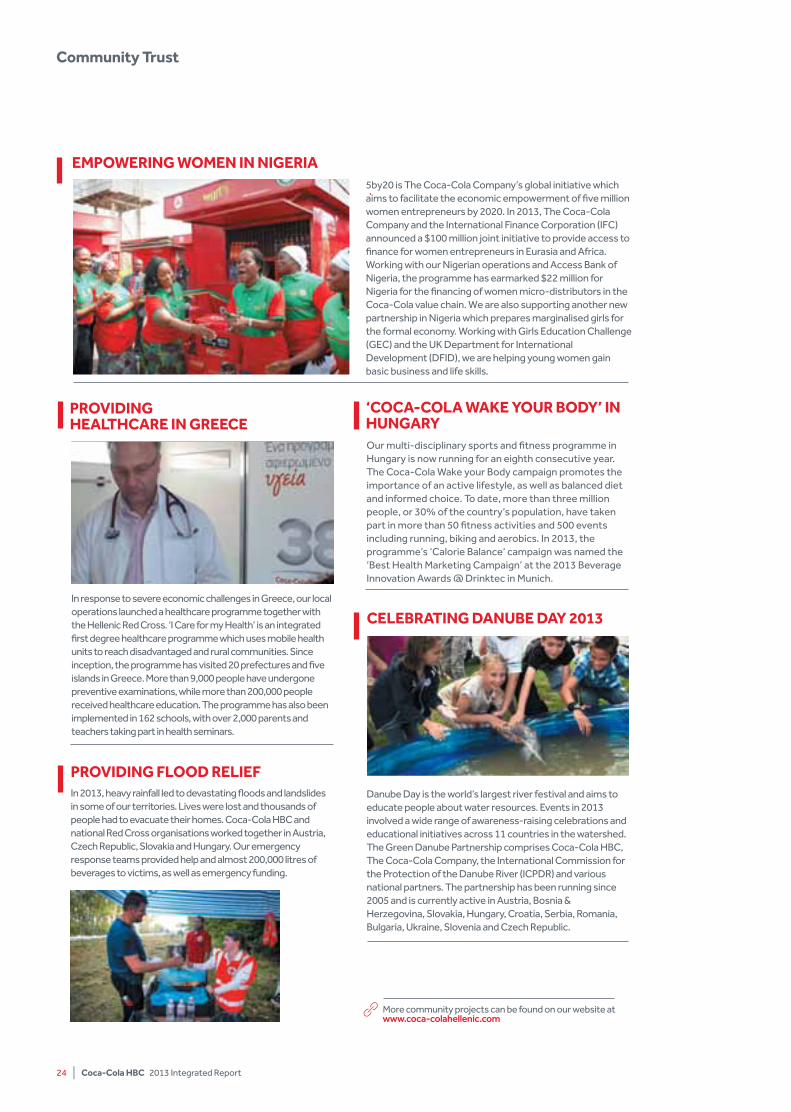
pROViDiNG HEAlTHCARE iN GREECE
In response to severe economic challenges in Greece, our local operations launched a healthcare programme together with the Hellenic Red Cross. ‘I Care for my Health’ is an integrated first degree healthcare programme which uses mobile health units to reach disadvantaged and rural communities. Since inception, the programme has visited 20 prefectures and five islands in Greece. More than 9,000 people have undergone preventive examinations, while more than 200,000 people received healthcare education. The programme has also been implemented in 162 schools, with over 2,000 parents and teachers taking part in health seminars.
CElEBRATiNG DANuBE DAy 2013
Danube Day is the world’s largest river festival and aims to educate people about water resources. Events in 2013 involved a wide range of awareness-raising celebrations and educational initiatives across 11 countries in the watershed. The Green Danube Partnership comprises Coca-Cola HBC, The Coca-Cola Company, the International Commission for the Protection of the Danube River (ICPDR) and various national partners. The partnership has been running since 2005 and is currently active in Austria, Bosnia & Herzegovina, Slovakia, Hungary, Croatia, Serbia, Romania, Bulgaria, Ukraine, Slovenia and Czech Republic.
EMpOWERiNG WOMEN iN NiGERiA 5by20 is The Coca-Cola Company’s global initiative which aims to facilitate the economic empowerment of five million women entrepreneurs by 2020. In 2013, The Coca-Cola Company and the International Finance Corporation (IFC) announced a $100 million joint initiative to provide access to finance for women entrepreneurs in Eurasia and Africa. Working with our Nigerian operations and Access Bank of Nigeria, the programme has earmarked $22 million for Nigeria for the financing of women micro-distributors in the Coca-Cola value chain. We are also supporting another new partnership in Nigeria which prepares marginalised girls for the formal economy. Working with Girls Education Challenge (GEC) and the UK Department for International Development (DFID), we are helping young women gain basic business and life skills.
‘COCA-COlA WAKE yOuR BODy’ iN HuNGARyOur multi-disciplinary sports and fitness programme in Hungary is now running for an eighth consecutive year. The Coca-Cola Wake your Body campaign promotes the importance of an active lifestyle, as well as balanced diet and informed choice. To date, more than three million people, or 30% of the country’s population, have taken part in more than 50 fitness activities and 500 events including running, biking and aerobics. In 2013, the programme’s ‘Calorie Balance’ campaign was named the ‘Best Health Marketing Campaign’ at the 2013 Beverage Innovation Awards @ Drinktec in Munich.
pROViDiNG FlOOD REliEFIn 2013, heavy rainfall led to devastating floods and landslides in some of our territories. Lives were lost and thousands of people had to evacuate their homes. Coca-Cola HBC and national Red Cross organisations worked together in Austria, Czech Republic, Slovakia and Hungary. Our emergency response teams provided help and almost 200,000 litres of beverages to victims, as well as emergency funding.
Strategic performance | 25
Supplier Guiding Principles, which encompass workers’ rights, human rights, health and safety and environment. In 2013, 30 supply points were audited against these principles. In 2014, we will join Sedex, the not-for-profit membership organisation driving improvements in ethical and responsible business practices in global supply chains.
Sustainable agricultureSugar and fruit are the main agricultural raw materials used in our business. These crops are already the largest contributors to our total water footprint. Another challenge is that supplies will likely become harder to secure due to population growth, climate change and growing food security issues.
In 2013, we held further workshops with key suppliers to improve the sustainability of our agricultural supply chain. Building on our responsible sourcing guidelines for sugar, we reviewed the various external standards for social and environmental performance towards which our suppliers are working. Starting in early 2014, we implemented consistent measurement and reporting of performance for sugar and other key suppliers. As we enhance our approach, we will focus further upstream to tier 2 suppliers.
Benefitting local communitiesOur mission statement requires us to improve the quality of life in our communities. Our primary contribution is through core business activities, which generate income for employees, supplier payments and government taxes. The Coca-Cola System supports almost 600,000 direct and indirect jobs in our value chain across the EU.
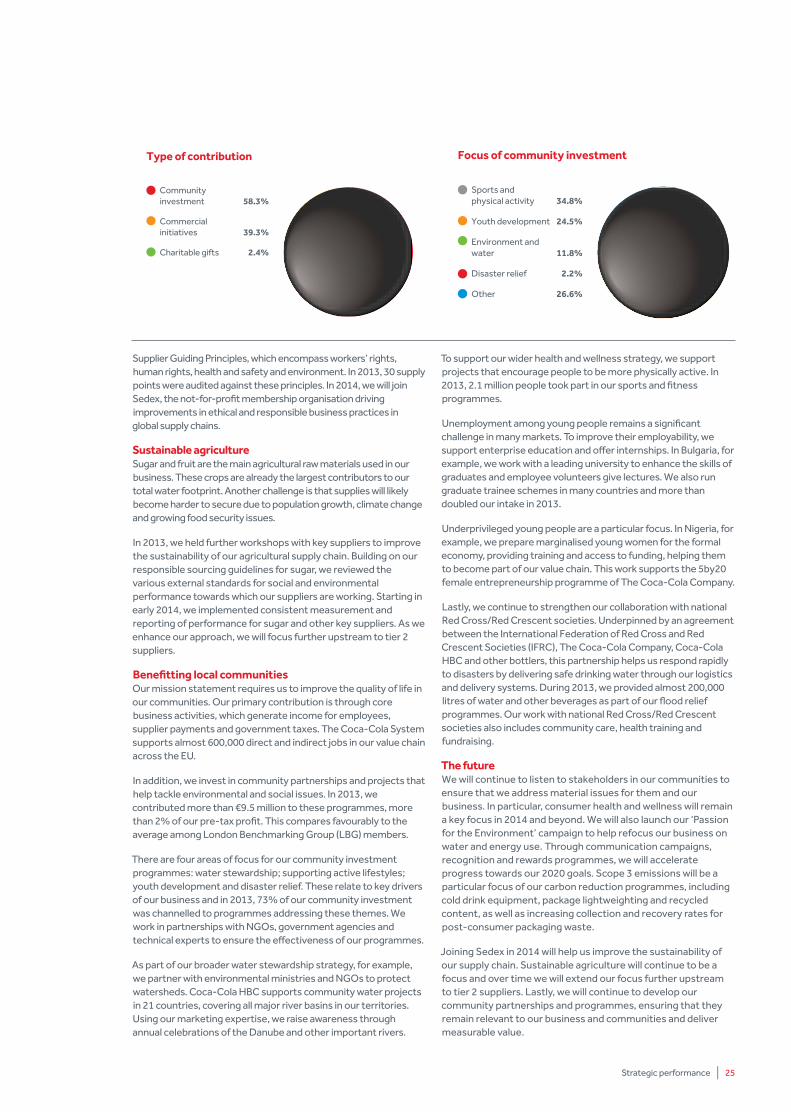
In addition, we invest in community partnerships and projects that help tackle environmental and social issues. In 2013, we contributed more than €9.5 million to these programmes, more than 2% of our pre-tax profit. This compares favourably to the average among London Benchmarking Group (LBG) members.
There are four areas of focus for our community investment programmes: water stewardship; supporting active lifestyles; youth development and disaster relief. These relate to key drivers of our business and in 2013, 73% of our community investment was channelled to programmes addressing these themes. We work in partnerships with NGOs, government agencies and technical experts to ensure the effectiveness of our programmes.
As part of our broader water stewardship strategy, for example, we partner with environmental ministries and NGOs to protect watersheds. Coca-Cola HBC supports community water projects in 21 countries, covering all major river basins in our territories. Using our marketing expertise, we raise awareness through annual celebrations of the Danube and other important rivers.
To support our wider health and wellness strategy, we support projects that encourage people to be more physically active. In 2013, 2.1 million people took part in our sports and fitness programmes.
Unemployment among young people remains a significant challenge in many markets. To improve their employability, we support enterprise education and offer internships. In Bulgaria, for example, we work with a leading university to enhance the skills of graduates and employee volunteers give lectures. We also run graduate trainee schemes in many countries and more than doubled our intake in 2013.
Underprivileged young people are a particular focus. In Nigeria, for example, we prepare marginalised young women for the formal economy, providing training and access to funding, helping them to become part of our value chain. This work supports the 5by20 female entrepreneurship programme of The Coca-Cola Company.
Lastly, we continue to strengthen our collaboration with national Red Cross/Red Crescent societies. Underpinned by an agreement between the International Federation of Red Cross and Red Crescent Societies (IFRC), The Coca-Cola Company, Coca-Cola HBC and other bottlers, this partnership helps us respond rapidly to disasters by delivering safe drinking water through our logistics and delivery systems. During 2013, we provided almost 200,000 litres of water and other beverages as part of our flood relief programmes. Our work with national Red Cross/Red Crescent societies also includes community care, health training and fundraising.
The futureWe will continue to listen to stakeholders in our communities to ensure that we address material issues for them and our business. In particular, consumer health and wellness will remain a key focus in 2014 and beyond. We will also launch our ‘Passion for the Environment’ campaign to help refocus our business on water and energy use. Through communication campaigns, recognition and rewards programmes, we will accelerate progress towards our 2020 goals. Scope 3 emissions will be a particular focus of our carbon reduction programmes, including cold drink equipment, package lightweighting and recycled content, as well as increasing collection and recovery rates for post-consumer packaging waste.
Joining Sedex in 2014 will help us improve the sustainability of our supply chain. Sustainable agriculture will continue to be a focus and over time we will extend our focus further upstream to tier 2 suppliers. Lastly, we will continue to develop our community partnerships and programmes, ensuring that they remain relevant to our business and communities and deliver measurable value.
Sports and physical activity 34.8%
Youth development 24.5%
Environment and water 11.8%
Disaster relief 2.2%
Other 26.6%
Focus of community investment
Community investment 58.3%
Commercialinitiatives 39.3%
Charitable gifts 2.4%
Type of contribution
26 | Coca-Cola HBC 2013 Integrated Report
As consumer tastes and priorities change over time, we seek to reflect those changes in our beverage offerings and in the way we present our brands. Embedded in all of our activities is an understanding that every shopper and every consumer is unique and every product package has a role.
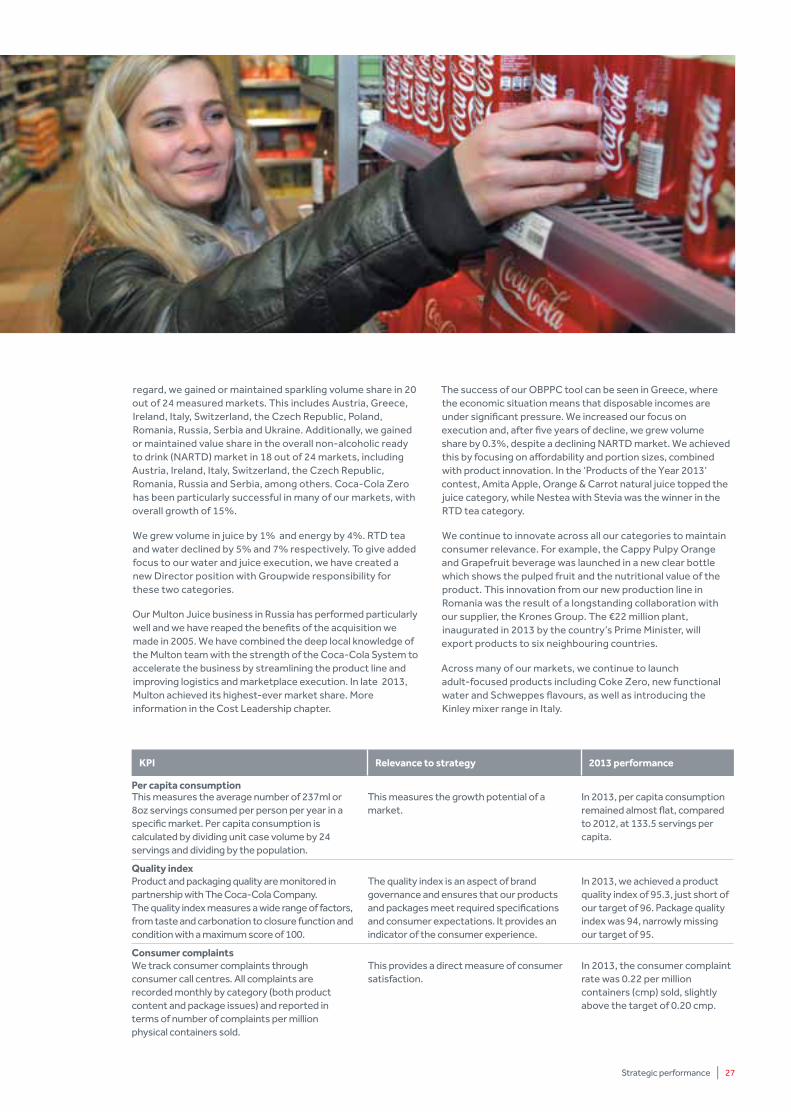
To ensure we remain relevant to consumers and maximise our opportunity to win at the point of sale, we use our tailored OBPPC strategy. This identifies the right Occasion, Brand, Package, Price and Channel for each product, with brand Coca-Cola being a key priority. We also work closely with The Coca-Cola Company and use their consumer insights to capture clearly defined market opportunities. By working together, we achieve results that are greater than the sum of the parts. Our 50 billion servings per annum are testament to that.
To ensure consumer relevance and excellence in the marketplace, we are guided by our core principles, the 5As:
• Availability: placing our range of products within easy reach of consumers in the right package, in the right location, at the right time.
• Affordability: offering a wide variety of premium-quality products in packages appropriate for the occasion, at the right price.
• Acceptability: supplying an extensive and growing range of products that meet the highest quality standards, enhancing their appeal to consumers.
• Activation: motivating consumers to choose our products by improving availability and attractiveness at the point of purchase and by building brand strength in local markets.
• Attitude: the way our sales representatives and our people behave every day in their interactions with our customers ensuring that we meet their needs with the aim of becoming their supplier of choice.
We work together with The Coca-Cola Company to promote understanding that all of our products can be part of an active, healthy lifestyle that includes a sensible, balanced diet, proper hydration and regular physical activity. Our Health and Wellness strategy is described in the Community Trust chapter.
2013 performanceAlthough we experienced a small decline in overall sales volumes of sparkling beverages driven by tough macroeconomic and trading conditions, our continued market strength is evidence of our success in leveraging the power of the Coca-Cola brand and our OBPPC tool. In this
We provide a wide variety of beverage products for every lifestyle and occasion. We have clear category and brand priorities including sparkling, our main driver of growth, as well as juice, water, energy and sport drinks and ready-to-drink tea.
Consumer RelevanceWe are winning at the point of sale by responding to changing consumer needs and offering greater choice.
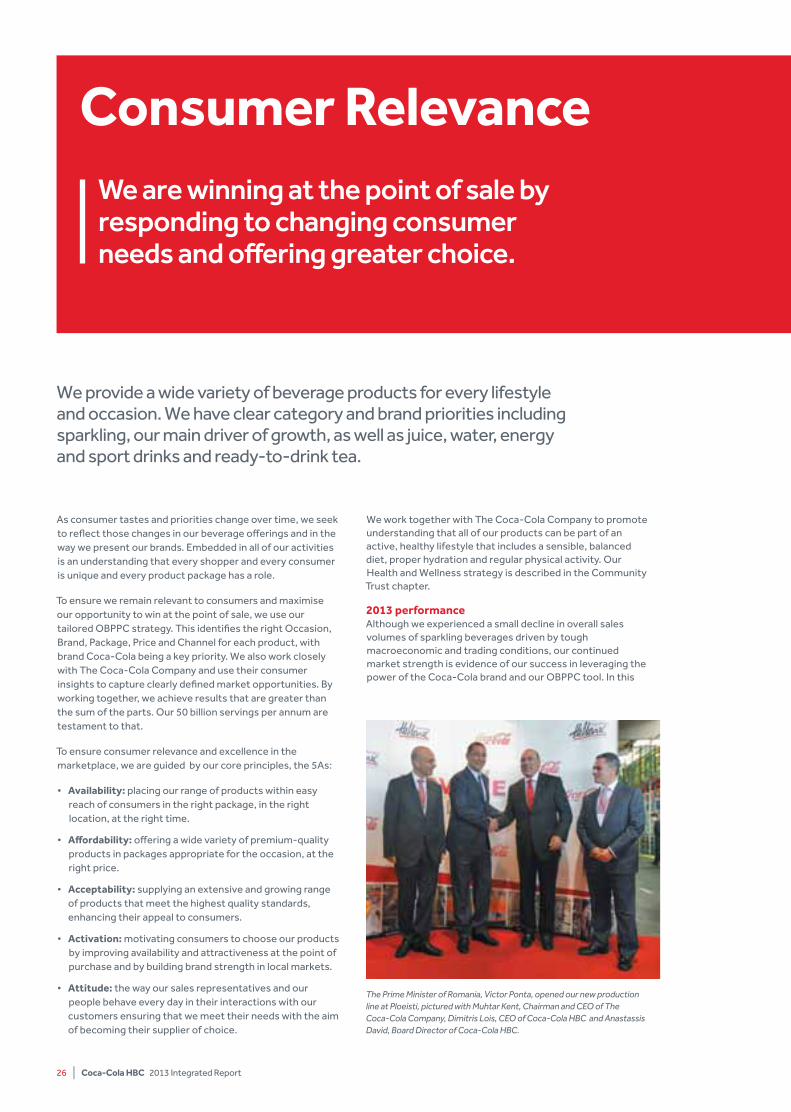
The Prime Minister of Romania, Victor Ponta, opened our new production line at Ploeisti, pictured with Muhtar Kent, Chairman and CEO of The Coca-Cola Company, Dimitris Lois, CEO of Coca-Cola HBC and Anastassis David, Board Director of Coca-Cola HBC.
Strategic performance | 27
regard, we gained or maintained sparkling volume share in 20 out of 24 measured markets. This includes Austria, Greece, Ireland, Italy, Switzerland, the Czech Republic, Poland, Romania, Russia, Serbia and Ukraine. Additionally, we gained or maintained value share in the overall non-alcoholic ready to drink (NARTD) market in 18 out of 24 markets, including Austria, Ireland, Italy, Switzerland, the Czech Republic, Romania, Russia and Serbia, among others. Coca-Cola Zero has been particularly successful in many of our markets, with overall growth of 15%.
We grew volume in juice by 1% and energy by 4%. RTD tea and water declined by 5% and 7% respectively. To give added focus to our water and juice execution, we have created a new Director position with Groupwide responsibility for these two categories.
Our Multon Juice business in Russia has performed particularly well and we have reaped the benefits of the acquisition we made in 2005. We have combined the deep local knowledge of the Multon team with the strength of the Coca-Cola System to accelerate the business by streamlining the product line and improving logistics and marketplace execution. In late 2013, Multon achieved its highest-ever market share. More information in the Cost Leadership chapter.
The success of our OBPPC tool can be seen in Greece, where the economic situation means that disposable incomes are under significant pressure. We increased our focus on execution and, after five years of decline, we grew volume share by 0.3%, despite a declining NARTD market. We achieved this by focusing on affordability and portion sizes, combined with product innovation. In the ‘Products of the Year 2013’ contest, Amita Apple, Orange & Carrot natural juice topped the juice category, while Nestea with Stevia was the winner in the RTD tea category.
We continue to innovate across all our categories to maintain consumer relevance. For example, the Cappy Pulpy Orange and Grapefruit beverage was launched in a new clear bottle which shows the pulped fruit and the nutritional value of the product. This innovation from our new production line in Romania was the result of a longstanding collaboration with our supplier, the Krones Group. The €22 million plant, inaugurated in 2013 by the country’s Prime Minister, will export products to six neighbouring countries.
Across many of our markets, we continue to launch adult-focused products including Coke Zero, new functional water and Schweppes flavours, as well as introducing the Kinley mixer range in Italy.
Kpi Relevance to strategy 2013 performance
per capita consumptionThis measures the average number of 237ml or 8oz servings consumed per person per year in a specific market. Per capita consumption is calculated by dividing unit case volume by 24 servings and dividing by the population.
This measures the growth potential of a market.
In 2013, per capita consumption remained almost flat, compared to 2012, at 133.5 servings per capita.
Quality indexProduct and packaging quality are monitored in partnership with The Coca-Cola Company. The quality index measures a wide range of factors, from taste and carbonation to closure function and condition with a maximum score of 100.
The quality index is an aspect of brand governance and ensures that our products and packages meet required specifications and consumer expectations. It provides an indicator of the consumer experience.
In 2013, we achieved a product quality index of 95.3, just short of our target of 96. Package quality index was 94, narrowly missing our target of 95.
Consumer complaintsWe track consumer complaints through consumer call centres. All complaints are recorded monthly by category (both product content and package issues) and reported in terms of number of complaints per million physical containers sold.
This provides a direct measure of consumer satisfaction.
In 2013, the consumer complaint rate was 0.22 per million containers (cmp) sold, slightly above the target of 0.20 cmp.
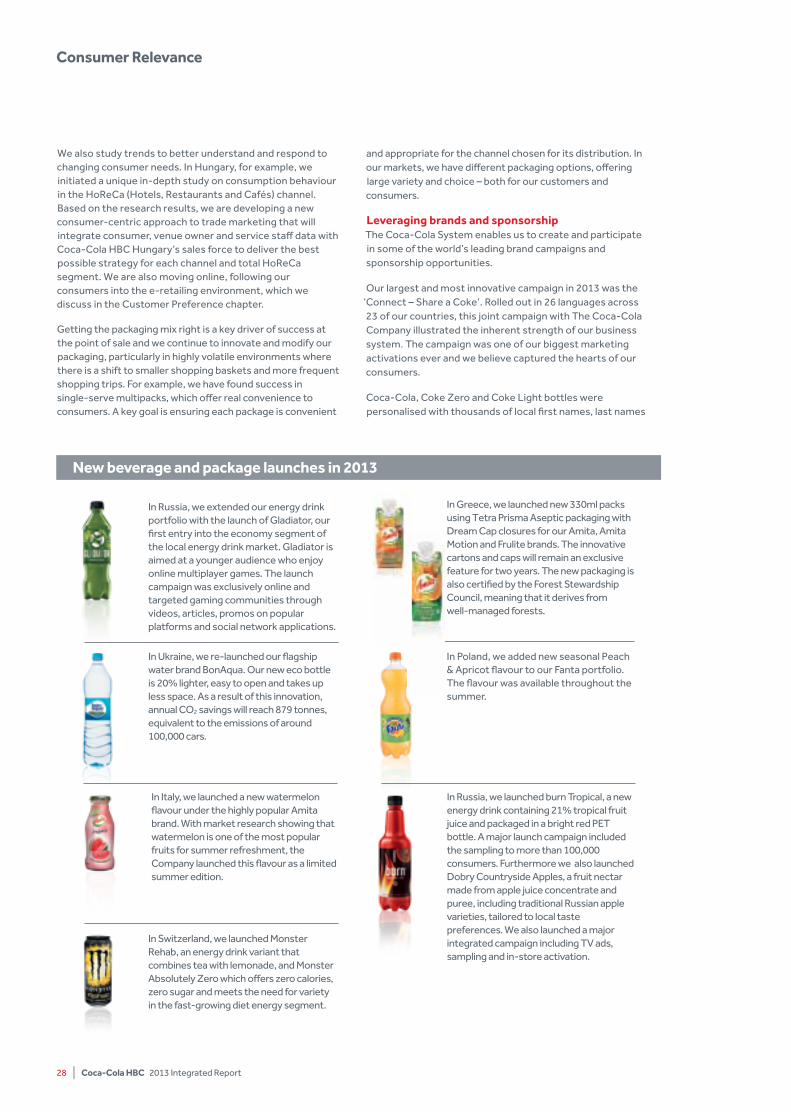
28 | Coca-Cola HBC 2013 Integrated Report
We also study trends to better understand and respond to changing consumer needs. In Hungary, for example, we initiated a unique in-depth study on consumption behaviour in the HoReCa (Hotels, Restaurants and Cafés) channel. Based on the research results, we are developing a new consumer-centric approach to trade marketing that will integrate consumer, venue owner and service staff data with Coca-Cola HBC Hungary’s sales force to deliver the best possible strategy for each channel and total HoReCa segment. We are also moving online, following our consumers into the e-retailing environment, which we discuss in the Customer Preference chapter.
Getting the packaging mix right is a key driver of success at the point of sale and we continue to innovate and modify our packaging, particularly in highly volatile environments where there is a shift to smaller shopping baskets and more frequent shopping trips. For example, we have found success in single-serve multipacks, which offer real convenience to consumers. A key goal is ensuring each package is convenient
and appropriate for the channel chosen for its distribution. In our markets, we have different packaging options, offering large variety and choice – both for our customers and consumers.
leveraging brands and sponsorshipThe Coca-Cola System enables us to create and participate in some of the world’s leading brand campaigns and sponsorship opportunities.
Our largest and most innovative campaign in 2013 was the ‘Connect – Share a Coke’. Rolled out in 26 languages across 23 of our countries, this joint campaign with The Coca-Cola Company illustrated the inherent strength of our business system. The campaign was one of our biggest marketing activations ever and we believe captured the hearts of our consumers.
Coca-Cola, Coke Zero and Coke Light bottles were personalised with thousands of local first names, last names
Consumer Relevance
In Russia, we extended our energy drink portfolio with the launch of Gladiator, our first entry into the economy segment of the local energy drink market. Gladiator is aimed at a younger audience who enjoy online multiplayer games. The launch campaign was exclusively online and targeted gaming communities through videos, articles, promos on popular platforms and social network applications.
In Switzerland, we launched Monster Rehab, an energy drink variant that combines tea with lemonade, and Monster Absolutely Zero which offers zero calories, zero sugar and meets the need for variety in the fast-growing diet energy segment.
In Greece, we launched new 330ml packs using Tetra Prisma Aseptic packaging with Dream Cap closures for our Amita, Amita Motion and Frulite brands. The innovative cartons and caps will remain an exclusive feature for two years. The new packaging is also certified by the Forest Stewardship Council, meaning that it derives from well-managed forests.
In Russia, we launched burn Tropical, a new energy drink containing 21% tropical fruit juice and packaged in a bright red PET bottle. A major launch campaign included the sampling to more than 100,000 consumers. Furthermore we also launched Dobry Countryside Apples, a fruit nectar made from apple juice concentrate and puree, including traditional Russian apple varieties, tailored to local taste preferences. We also launched a major integrated campaign including TV ads, sampling and in-store activation.
In Poland, we added new seasonal Peach & Apricot flavour to our Fanta portfolio. The flavour was available throughout the summer.
In Italy, we launched a new watermelon flavour under the highly popular Amita brand. With market research showing that watermelon is one of the most popular fruits for summer refreshment, the Company launched this flavour as a limited summer edition.
In Ukraine, we re-launched our flagship water brand BonAqua. Our new eco bottle is 20% lighter, easy to open and takes up less space. As a result of this innovation, annual CO2 savings will reach 879 tonnes, equivalent to the emissions of around 100,000 cars.
New beverage and package launches in 2013
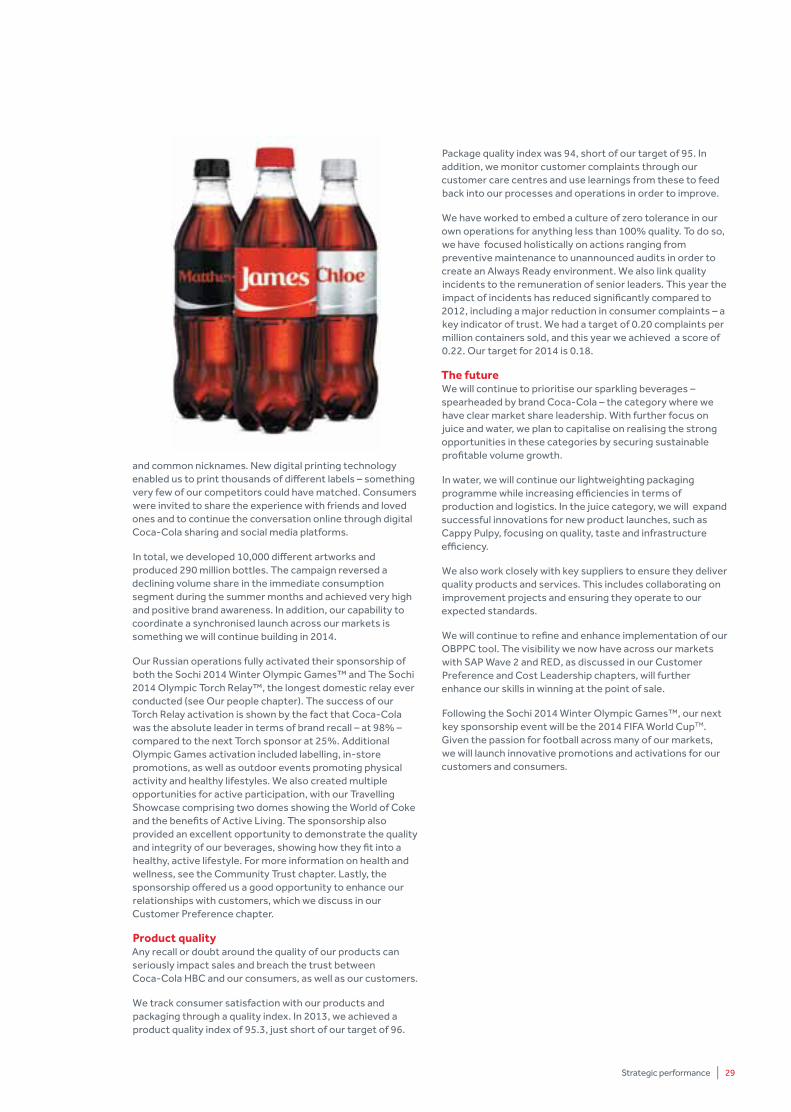
Strategic performance | 29
and common nicknames. New digital printing technology enabled us to print thousands of different labels – something very few of our competitors could have matched. Consumers were invited to share the experience with friends and loved ones and to continue the conversation online through digital Coca-Cola sharing and social media platforms.
In total, we developed 10,000 different artworks and produced 290 million bottles. The campaign reversed a declining volume share in the immediate consumption segment during the summer months and achieved very high and positive brand awareness. In addition, our capability to coordinate a synchronised launch across our markets is something we will continue building in 2014.
Our Russian operations fully activated their sponsorship of both the Sochi 2014 Winter Olympic Games™ and The Sochi 2014 Olympic Torch Relay™, the longest domestic relay ever conducted (see Our people chapter). The success of our Torch Relay activation is shown by the fact that Coca-Cola was the absolute leader in terms of brand recall – at 98% – compared to the next Torch sponsor at 25%. Additional Olympic Games activation included labelling, in-store promotions, as well as outdoor events promoting physical activity and healthy lifestyles. We also created multiple opportunities for active participation, with our Travelling Showcase comprising two domes showing the World of Coke and the benefits of Active Living. The sponsorship also provided an excellent opportunity to demonstrate the quality and integrity of our beverages, showing how they fit into a healthy, active lifestyle. For more information on health and wellness, see the Community Trust chapter. Lastly, the sponsorship offered us a good opportunity to enhance our relationships with customers, which we discuss in our Customer Preference chapter.
product qualityAny recall or doubt around the quality of our products can seriously impact sales and breach the trust between Coca-Cola HBC and our consumers, as well as our customers.
We track consumer satisfaction with our products and packaging through a quality index. In 2013, we achieved a product quality index of 95.3, just short of our target of 96.
Package quality index was 94, short of our target of 95. In addition, we monitor customer complaints through our customer care centres and use learnings from these to feed back into our processes and operations in order to improve.
We have worked to embed a culture of zero tolerance in our own operations for anything less than 100% quality. To do so, we have focused holistically on actions ranging from preventive maintenance to unannounced audits in order to create an Always Ready environment. We also link quality incidents to the remuneration of senior leaders. This year the impact of incidents has reduced significantly compared to 2012, including a major reduction in consumer complaints – a key indicator of trust. We had a target of 0.20 complaints per million containers sold, and this year we achieved a score of 0.22. Our target for 2014 is 0.18.
The futureWe will continue to prioritise our sparkling beverages – spearheaded by brand Coca-Cola – the category where we have clear market share leadership. With further focus on juice and water, we plan to capitalise on realising the strong opportunities in these categories by securing sustainable profitable volume growth.
In water, we will continue our lightweighting packaging programme while increasing efficiencies in terms of production and logistics. In the juice category, we will expand successful innovations for new product launches, such as Cappy Pulpy, focusing on quality, taste and infrastructure efficiency.
We also work closely with key suppliers to ensure they deliver quality products and services. This includes collaborating on improvement projects and ensuring they operate to our expected standards.
We will continue to refine and enhance implementation of our OBPPC tool. The visibility we now have across our markets with SAP Wave 2 and RED, as discussed in our Customer Preference and Cost Leadership chapters, will further enhance our skills in winning at the point of sale.
Following the Sochi 2014 Winter Olympic Games™, our next key sponsorship event will be the 2014 FIFA World CupTM. Given the passion for football across many of our markets, we will launch innovative promotions and activations for our customers and consumers.
30 | Coca-Cola HBC 2013 Integrated Report
Staying close to our customers is important in a fast-changing landscape. In particular, the last decade has seen a shift from small standalone stores and kiosks of the traditional trade to modern supermarkets, hypermarkets and discounters. As customers consolidate, their buying power increases, as does their ability to negotiate with suppliers.
To protect our margins, and increase our presence in store, we must work to create value for customers. We seek to generate value in every aspect of our business, ranging from logistics and delivery to marketplace execution and sustainability programmes.
Customers and other stakeholders expect more from Coca-Cola HBC because of the global status of brand Coca-Cola and The Coca-Cola System. We aim to meet, even surpass, their expectations.
2013 performanceDuring the year, we continued to roll out a Groupwide approach to working with our 2.1 million customers which offers both consistency across our business and flexibility for local activation. The four key initiatives helping to create value for our customers and our business are: Right Execution Daily (RED); Hellenic Good Morning Meetings; Joint Value Creation (JVC); and our Customer Care Centres. SAP Wave 2 is helping to ensure consistency across all 28 countries, while enabling local activation.
Our RED programme was rolled out to 24 countries across the Group in 2013 and is already delivering measurable results for customers and Coca-Cola HBC. This standardised process measures performance consistently against our Picture of Success, the ideal in-store presentation of our beverages we have developed for each
channel in order to drive purchase frequency. During customer visits, our Business Developers use a handheld device to record actual outlet activation. This is then measured electronically against the Picture of Success to identify improvement opportunities.
The powerful combination of RED and SAP Wave 2 generates high-quality Customer and Shopper Beverage Landscape (CBL and SBL) data which we then leverage effectively. We tailor each outlet’s Picture of Success and offerings to suit their shoppers’ profile; we also track our wins and areas of improvement and share learnings with others. By measuring the impact of increased RED scores on offtake in customer outlets, for example, we show customers how they can grow their businesses. In the Czech Republic and Slovakia, for example, specific execution initiatives led to volume increases of more than 10%. Across the Group, the next step is to certify that all of our country operations meet our RED standards. The first five countries gained certification in 2013, while the rest are expected to follow in the years to come.
In addition to shared technology and process platforms at Group level, we also strive to create a sense of unity among sales teams at the local level. Our Hellenic Good Morning Meetings bring teams together each day to share learnings and allocate daily objectives. We have continued to roll this programme out with all 28 countries now holding daily morning meetings. In addition, this initiative has been an excellent means to unify sales teams behind our 4Cs and has also helped to drive consistency and excellence in our in-store activations. In 2013, we conducted 38,000 such meetings and plan to hold over 50,000 in 2014.
In 2013, we have accelerated our plans to create value for our customers, supported by additional initiatives with our suppliers to drive product quality, as we discuss in the
We aim to be our customers’ partner of choice - easy to do business with, doing everything right the first time and adding value on every occasion. By doing this, we expect our customers will continue to stock, promote and sell our products and that we are their number one supplier in every market in which we compete.
Customer preferenceBy creating joint value, we aim to be the partner of choice for customers in every country in which we operate.
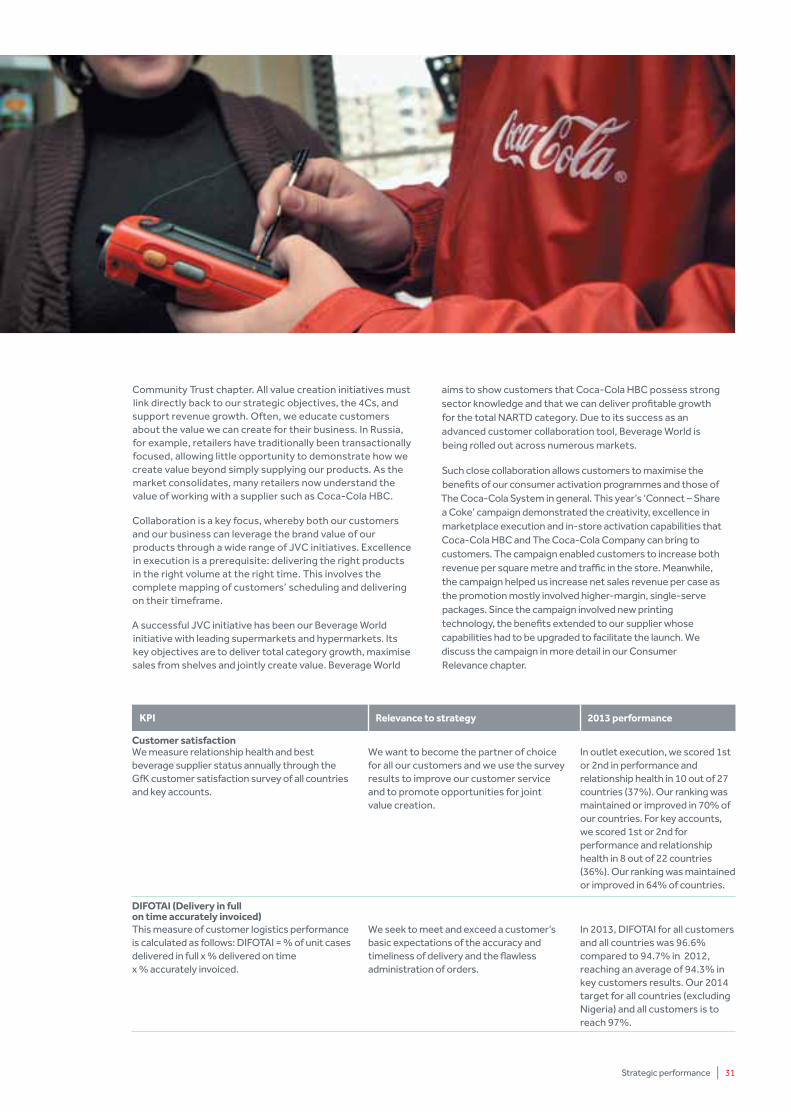
Strategic performance | 31
Community Trust chapter. All value creation initiatives must link directly back to our strategic objectives, the 4Cs, and support revenue growth. Often, we educate customers about the value we can create for their business. In Russia, for example, retailers have traditionally been transactionally focused, allowing little opportunity to demonstrate how we create value beyond simply supplying our products. As the market consolidates, many retailers now understand the value of working with a supplier such as Coca-Cola HBC.
Collaboration is a key focus, whereby both our customers and our business can leverage the brand value of our products through a wide range of JVC initiatives. Excellence in execution is a prerequisite: delivering the right products in the right volume at the right time. This involves the complete mapping of customers’ scheduling and delivering on their timeframe.
A successful JVC initiative has been our Beverage World initiative with leading supermarkets and hypermarkets. Its key objectives are to deliver total category growth, maximise sales from shelves and jointly create value. Beverage World
aims to show customers that Coca-Cola HBC possess strong sector knowledge and that we can deliver profitable growth for the total NARTD category. Due to its success as an advanced customer collaboration tool, Beverage World is being rolled out across numerous markets.
Such close collaboration allows customers to maximise the benefits of our consumer activation programmes and those of The Coca-Cola System in general. This year’s ‘Connect – Share a Coke’ campaign demonstrated the creativity, excellence in marketplace execution and in-store activation capabilities that Coca-Cola HBC and The Coca-Cola Company can bring to customers. The campaign enabled customers to increase both revenue per square metre and traffic in the store. Meanwhile, the campaign helped us increase net sales revenue per case as the promotion mostly involved higher-margin, single-serve packages. Since the campaign involved new printing technology, the benefits extended to our supplier whose capabilities had to be upgraded to facilitate the launch. We discuss the campaign in more detail in our Consumer Relevance chapter.
Kpi Relevance to strategy 2013 performance
Customer satisfactionWe measure relationship health and best beverage supplier status annually through the GfK customer satisfaction survey of all countries and key accounts.
We want to become the partner of choice for all our customers and we use the survey results to improve our customer service and to promote opportunities for joint value creation.
In outlet execution, we scored 1st or 2nd in performance and relationship health in 10 out of 27 countries (37%). Our ranking was maintained or improved in 70% of our countries. For key accounts, we scored 1st or 2nd for performance and relationship health in 8 out of 22 countries (36%). Our ranking was maintained or improved in 64% of countries.
DiFOTAi (Delivery in full on time accurately invoiced)This measure of customer logistics performance is calculated as follows: DIFOTAI = % of unit cases delivered in full x % delivered on time x % accurately invoiced.
We seek to meet and exceed a customer’s basic expectations of the accuracy and timeliness of delivery and the flawless administration of orders.
In 2013, DIFOTAI for all customers and all countries was 96.6% compared to 94.7% in 2012, reaching an average of 94.3% in key customers results. Our 2014 target for all countries (excluding Nigeria) and all customers is to reach 97%.
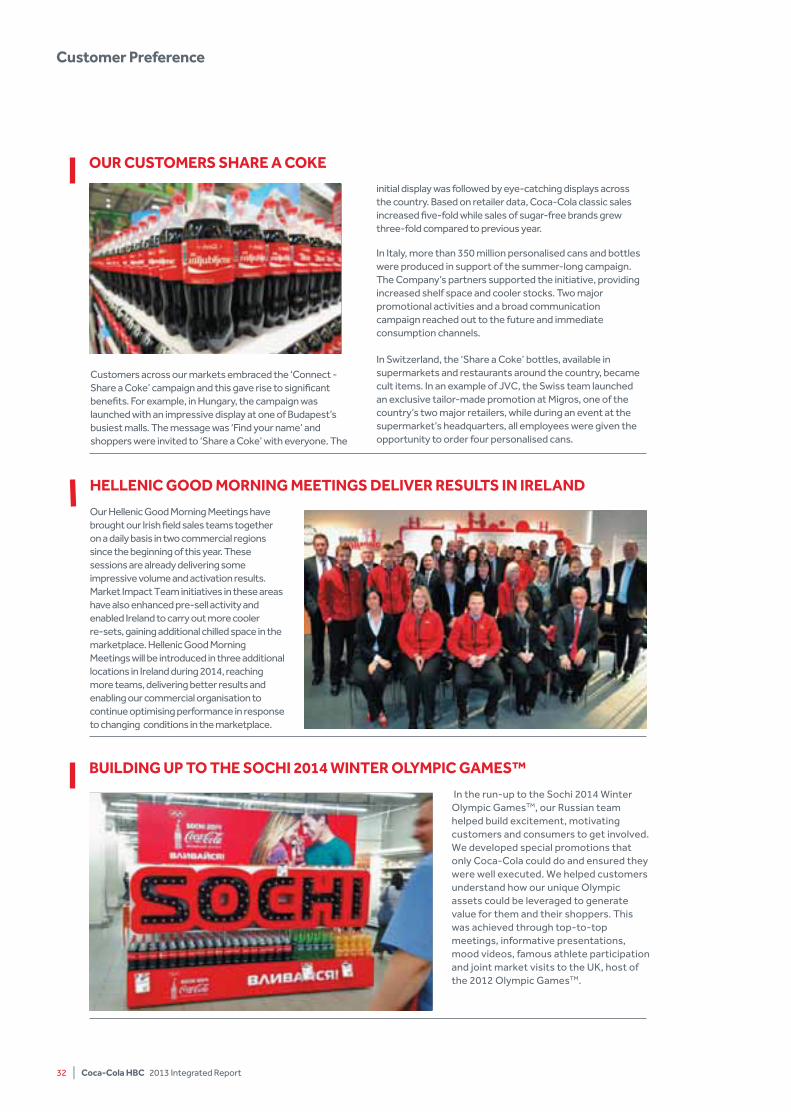
32 | Coca-Cola HBC 2013 Integrated Report
Customer preference
Customers across our markets embraced the ‘Connect - Share a Coke’ campaign and this gave rise to significant benefits. For example, in Hungary, the campaign was launched with an impressive display at one of Budapest’s busiest malls. The message was ‘Find your name’ and shoppers were invited to ‘Share a Coke’ with everyone. The
initial display was followed by eye-catching displays across the country. Based on retailer data, Coca-Cola classic sales increased five-fold while sales of sugar-free brands grew three-fold compared to previous year.
In Italy, more than 350 million personalised cans and bottles were produced in support of the summer-long campaign. The Company’s partners supported the initiative, providing increased shelf space and cooler stocks. Two major promotional activities and a broad communication campaign reached out to the future and immediate consumption channels.
In Switzerland, the ‘Share a Coke’ bottles, available in supermarkets and restaurants around the country, became cult items. In an example of JVC, the Swiss team launched an exclusive tailor-made promotion at Migros, one of the country’s two major retailers, while during an event at the supermarket’s headquarters, all employees were given the opportunity to order four personalised cans.
OuR CuSTOMERS SHARE A COKE
HEllENiC GOOD MORNiNG MEETiNGS DEliVER RESulTS iN iRElAND
Our Hellenic Good Morning Meetings have brought our Irish field sales teams together on a daily basis in two commercial regions since the beginning of this year. These sessions are already delivering some impressive volume and activation results. Market Impact Team initiatives in these areas have also enhanced pre-sell activity and enabled Ireland to carry out more cooler re-sets, gaining additional chilled space in the marketplace. Hellenic Good Morning Meetings will be introduced in three additional locations in Ireland during 2014, reaching more teams, delivering better results and enabling our commercial organisation to continue optimising performance in response to changing conditions in the marketplace.
BuilDiNG up TO THE SOCHi 2014 WiNTER OlyMpiC GAMES™
In the run-up to the Sochi 2014 Winter Olympic GamesTM, our Russian team helped build excitement, motivating customers and consumers to get involved. We developed special promotions that only Coca-Cola could do and ensured they were well executed. We helped customers understand how our unique Olympic assets could be leveraged to generate value for them and their shoppers. This was achieved through top-to-top meetings, informative presentations, mood videos, famous athlete participation and joint market visits to the UK, host of the 2012 Olympic GamesTM.
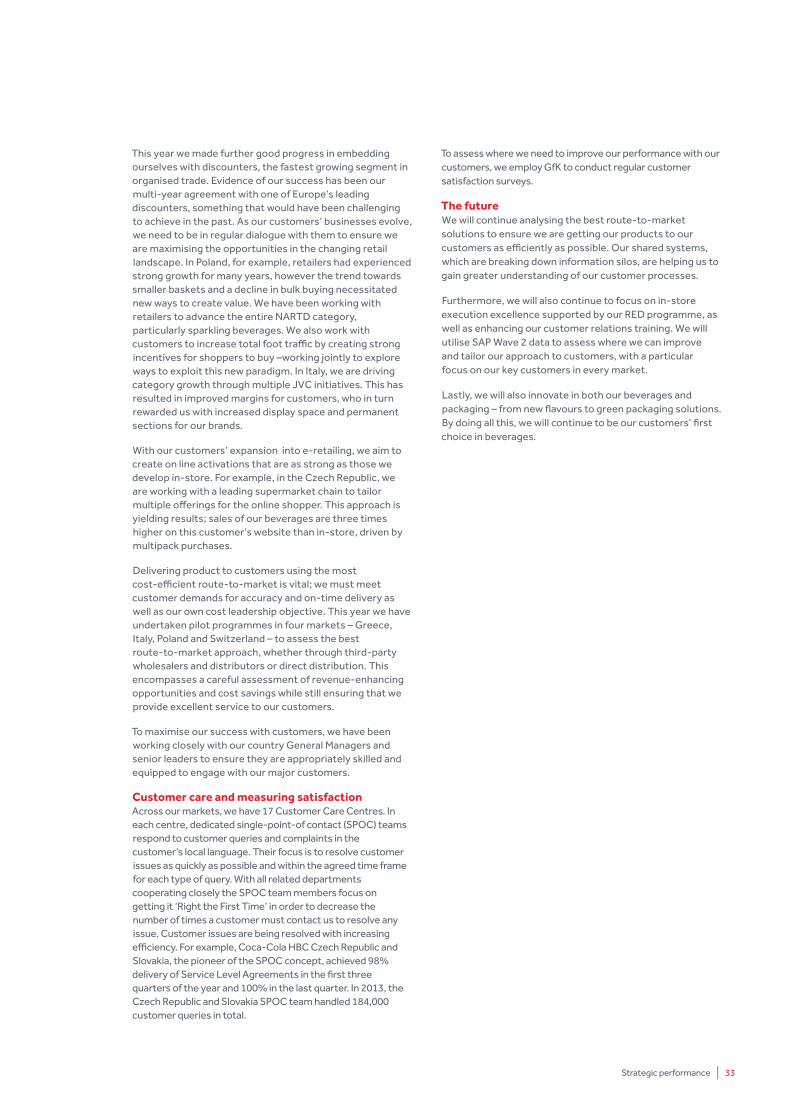
Strategic performance | 33
This year we made further good progress in embedding ourselves with discounters, the fastest growing segment in organised trade. Evidence of our success has been our multi-year agreement with one of Europe’s leading discounters, something that would have been challenging to achieve in the past. As our customers’ businesses evolve, we need to be in regular dialogue with them to ensure we are maximising the opportunities in the changing retail landscape. In Poland, for example, retailers had experienced strong growth for many years, however the trend towards smaller baskets and a decline in bulk buying necessitated new ways to create value. We have been working with retailers to advance the entire NARTD category, particularly sparkling beverages. We also work with customers to increase total foot traffic by creating strong incentives for shoppers to buy –working jointly to explore ways to exploit this new paradigm. In Italy, we are driving category growth through multiple JVC initiatives. This has resulted in improved margins for customers, who in turn rewarded us with increased display space and permanent sections for our brands.
With our customers’ expansion into e-retailing, we aim to create on line activations that are as strong as those we develop in-store. For example, in the Czech Republic, we are working with a leading supermarket chain to tailor multiple offerings for the online shopper. This approach is yielding results; sales of our beverages are three times higher on this customer’s website than in-store, driven by multipack purchases.
Delivering product to customers using the most cost-efficient route-to-market is vital; we must meet customer demands for accuracy and on-time delivery as well as our own cost leadership objective. This year we have undertaken pilot programmes in four markets – Greece, Italy, Poland and Switzerland – to assess the best route-to-market approach, whether through third-party wholesalers and distributors or direct distribution. This encompasses a careful assessment of revenue-enhancing opportunities and cost savings while still ensuring that we provide excellent service to our customers.
To maximise our success with customers, we have been working closely with our country General Managers and senior leaders to ensure they are appropriately skilled and equipped to engage with our major customers.
Customer care and measuring satisfactionAcross our markets, we have 17 Customer Care Centres. In each centre, dedicated single-point-of contact (SPOC) teams respond to customer queries and complaints in the customer’s local language. Their focus is to resolve customer issues as quickly as possible and within the agreed time frame for each type of query. With all related departments cooperating closely the SPOC team members focus on getting it ‘Right the First Time’ in order to decrease the number of times a customer must contact us to resolve any issue. Customer issues are being resolved with increasing efficiency. For example, Coca-Cola HBC Czech Republic and Slovakia, the pioneer of the SPOC concept, achieved 98% delivery of Service Level Agreements in the first three quarters of the year and 100% in the last quarter. In 2013, the Czech Republic and Slovakia SPOC team handled 184,000 customer queries in total.
To assess where we need to improve our performance with our customers, we employ GfK to conduct regular customer satisfaction surveys.
The futureWe will continue analysing the best route-to-market solutions to ensure we are getting our products to our customers as efficiently as possible. Our shared systems, which are breaking down information silos, are helping us to gain greater understanding of our customer processes.
Furthermore, we will also continue to focus on in-store execution excellence supported by our RED programme, as well as enhancing our customer relations training. We will utilise SAP Wave 2 data to assess where we can improve and tailor our approach to customers, with a particular focus on our key customers in every market.
Lastly, we will also innovate in both our beverages and packaging – from new flavours to green packaging solutions. By doing all this, we will continue to be our customers’ first choice in beverages.
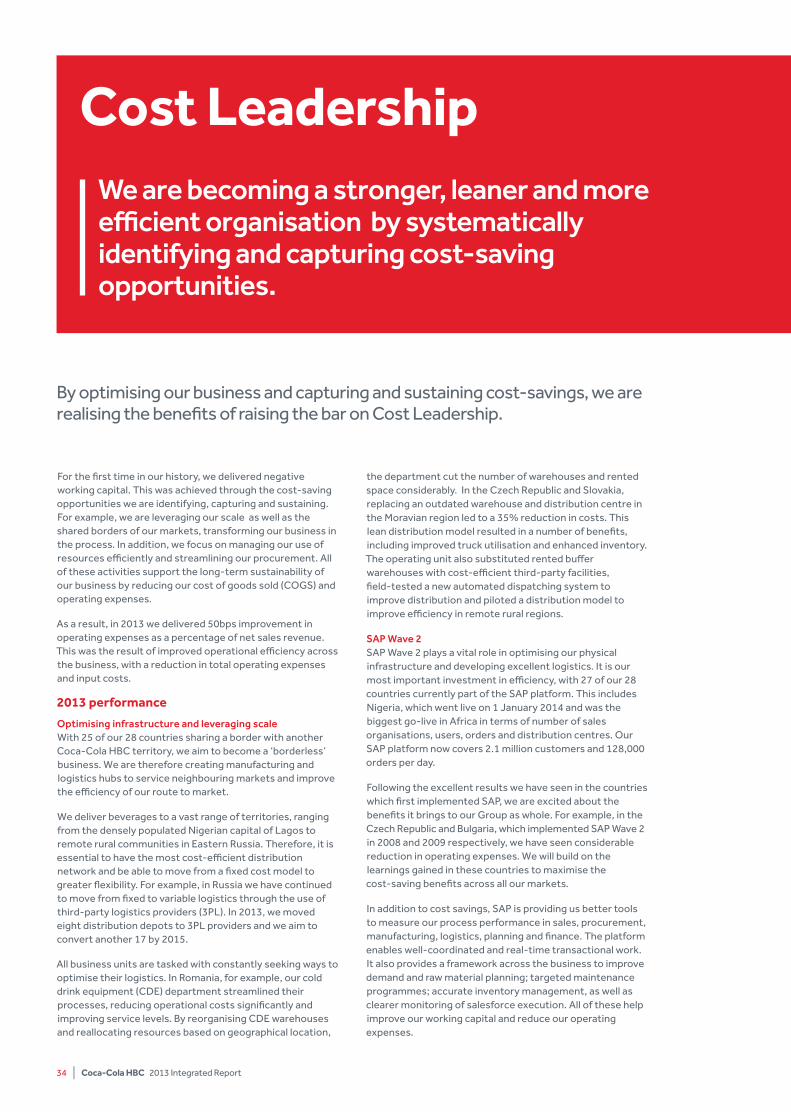
34 | Coca-Cola HBC 2013 Integrated Report
For the first time in our history, we delivered negative working capital. This was achieved through the cost-saving opportunities we are identifying, capturing and sustaining. For example, we are leveraging our scale as well as the shared borders of our markets, transforming our business in the process. In addition, we focus on managing our use of resources efficiently and streamlining our procurement. All of these activities support the long-term sustainability of our business by reducing our cost of goods sold (COGS) and operating expenses.
As a result, in 2013 we delivered 50bps improvement in operating expenses as a percentage of net sales revenue. This was the result of improved operational efficiency across the business, with a reduction in total operating expenses and input costs.
2013 performance Optimising infrastructure and leveraging scale With 25 of our 28 countries sharing a border with another Coca-Cola HBC territory, we aim to become a ‘borderless’ business. We are therefore creating manufacturing and logistics hubs to service neighbouring markets and improve the efficiency of our route to market.
We deliver beverages to a vast range of territories, ranging from the densely populated Nigerian capital of Lagos to remote rural communities in Eastern Russia. Therefore, it is essential to have the most cost-efficient distribution network and be able to move from a fixed cost model to greater flexibility. For example, in Russia we have continued to move from fixed to variable logistics through the use of third-party logistics providers (3PL). In 2013, we moved eight distribution depots to 3PL providers and we aim to convert another 17 by 2015.
All business units are tasked with constantly seeking ways to optimise their logistics. In Romania, for example, our cold drink equipment (CDE) department streamlined their processes, reducing operational costs significantly and improving service levels. By reorganising CDE warehouses and reallocating resources based on geographical location,
the department cut the number of warehouses and rented space considerably. In the Czech Republic and Slovakia, replacing an outdated warehouse and distribution centre in the Moravian region led to a 35% reduction in costs. This lean distribution model resulted in a number of benefits, including improved truck utilisation and enhanced inventory. The operating unit also substituted rented buffer warehouses with cost-efficient third-party facilities, field-tested a new automated dispatching system to improve distribution and piloted a distribution model to improve efficiency in remote rural regions.
SAP Wave 2 SAP Wave 2 plays a vital role in optimising our physical infrastructure and developing excellent logistics. It is our most important investment in efficiency, with 27 of our 28 countries currently part of the SAP platform. This includes Nigeria, which went live on 1 January 2014 and was the biggest go-live in Africa in terms of number of sales organisations, users, orders and distribution centres. Our SAP platform now covers 2.1 million customers and 128,000 orders per day.
Following the excellent results we have seen in the countries which first implemented SAP, we are excited about the benefits it brings to our Group as whole. For example, in the Czech Republic and Bulgaria, which implemented SAP Wave 2 in 2008 and 2009 respectively, we have seen considerable reduction in operating expenses. We will build on the learnings gained in these countries to maximise the cost-saving benefits across all our markets.
In addition to cost savings, SAP is providing us better tools to measure our process performance in sales, procurement, manufacturing, logistics, planning and finance. The platform enables well-coordinated and real-time transactional work. It also provides a framework across the business to improve demand and raw material planning; targeted maintenance programmes; accurate inventory management, as well as clearer monitoring of salesforce execution. All of these help improve our working capital and reduce our operating expenses.
By optimising our business and capturing and sustaining cost-savings, we are realising the benefits of raising the bar on Cost Leadership.
Cost leadershipWe are becoming a stronger, leaner and more efficient organisation by systematically identifying and capturing cost-saving opportunities.
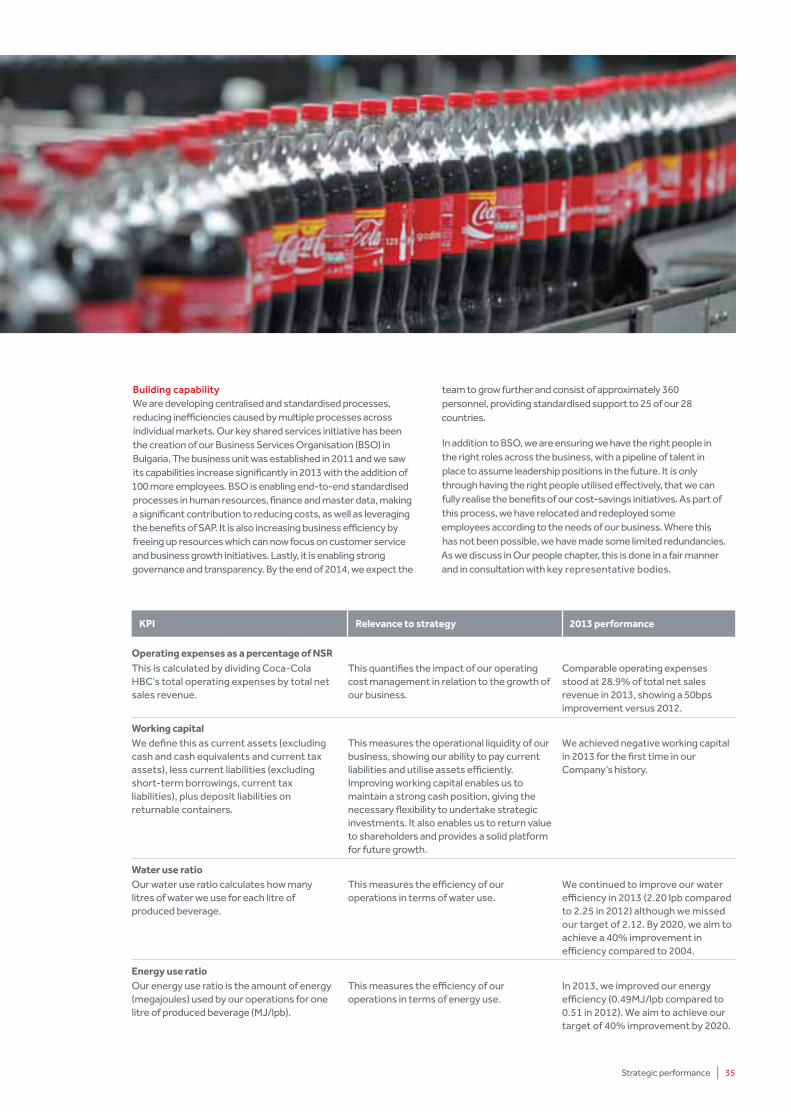
Strategic performance | 35
Building capability We are developing centralised and standardised processes, reducing inefficiencies caused by multiple processes across individual markets. Our key shared services initiative has been the creation of our Business Services Organisation (BSO) in Bulgaria. The business unit was established in 2011 and we saw its capabilities increase significantly in 2013 with the addition of 100 more employees. BSO is enabling end-to-end standardised processes in human resources, finance and master data, making a significant contribution to reducing costs, as well as leveraging the benefits of SAP. It is also increasing business efficiency by freeing up resources which can now focus on customer service and business growth initiatives. Lastly, it is enabling strong governance and transparency. By the end of 2014, we expect the
team to grow further and consist of approximately 360 personnel, providing standardised support to 25 of our 28 countries.
In addition to BSO, we are ensuring we have the right people in the right roles across the business, with a pipeline of talent in place to assume leadership positions in the future. It is only through having the right people utilised effectively, that we can fully realise the benefits of our cost-savings initiatives. As part of this process, we have relocated and redeployed some employees according to the needs of our business. Where this has not been possible, we have made some limited redundancies. As we discuss in Our people chapter, this is done in a fair manner and in consultation with key representative bodies.
Kpi Relevance to strategy 2013 performance
Operating expenses as a percentage of NSRThis is calculated by dividing Coca-Cola HBC’s total operating expenses by total net sales revenue.
This quantifies the impact of our operating cost management in relation to the growth of our business.
Comparable operating expenses stood at 28.9% of total net sales revenue in 2013, showing a 50bps improvement versus 2012.
Working capitalWe define this as current assets (excluding cash and cash equivalents and current tax assets), less current liabilities (excluding short-term borrowings, current tax liabilities), plus deposit liabilities on returnable containers.
This measures the operational liquidity of our business, showing our ability to pay current liabilities and utilise assets efficiently. Improving working capital enables us to maintain a strong cash position, giving the necessary flexibility to undertake strategic investments. It also enables us to return value to shareholders and provides a solid platform for future growth.
We achieved negative working capital in 2013 for the first time in our Company’s history.
Water use ratioOur water use ratio calculates how many litres of water we use for each litre of produced beverage.
This measures the efficiency of our operations in terms of water use.
We continued to improve our water efficiency in 2013 (2.20 lpb compared to 2.25 in 2012) although we missed our target of 2.12. By 2020, we aim to achieve a 40% improvement in efficiency compared to 2004.
Energy use ratioOur energy use ratio is the amount of energy (megajoules) used by our operations for one litre of produced beverage (MJ/lpb).
This measures the efficiency of our operations in terms of energy use.
In 2013, we improved our energy efficiency (0.49MJ/lpb compared to 0.51 in 2012). We aim to achieve our target of 40% improvement by 2020.
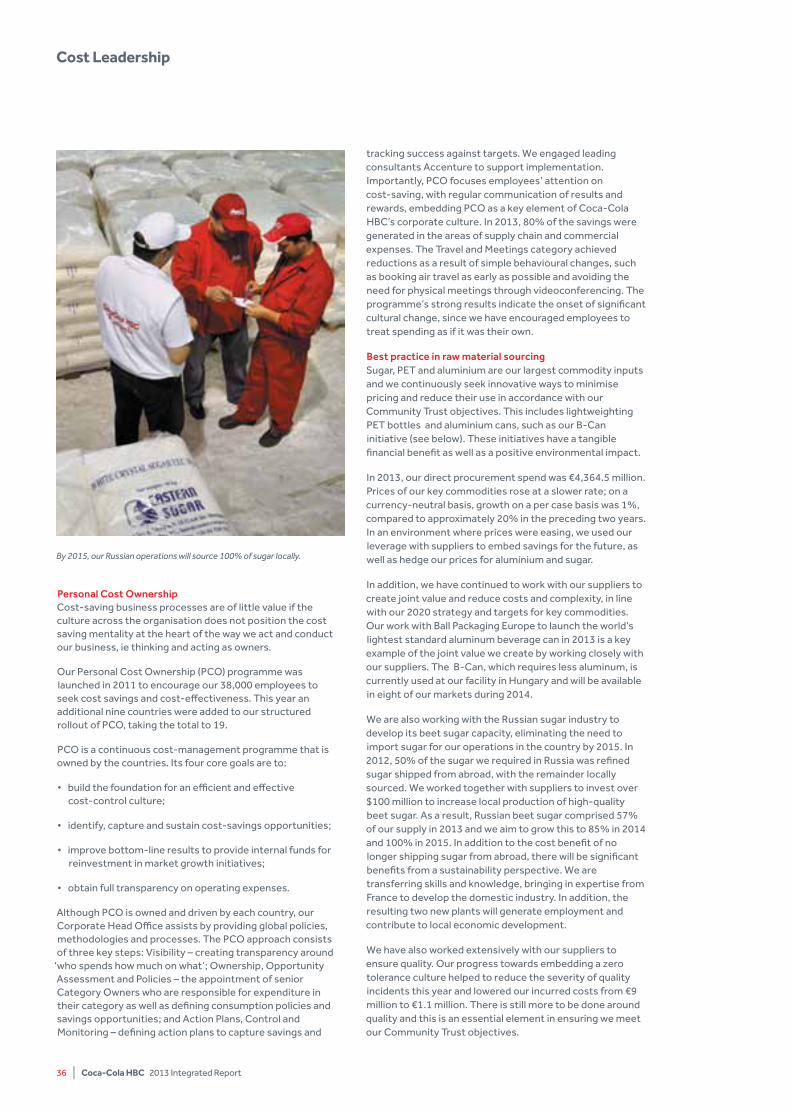
36 | Coca-Cola HBC 2013 Integrated Report
Personal Cost OwnershipCost-saving business processes are of little value if the culture across the organisation does not position the cost saving mentality at the heart of the way we act and conduct our business, ie thinking and acting as owners.
Our Personal Cost Ownership (PCO) programme was launched in 2011 to encourage our 38,000 employees to seek cost savings and cost-effectiveness. This year an additional nine countries were added to our structured rollout of PCO, taking the total to 19.
PCO is a continuous cost-management programme that is owned by the countries. Its four core goals are to:
• build the foundation for an efficient and effective cost-control culture;
• identify, capture and sustain cost-savings opportunities;
• improve bottom-line results to provide internal funds for reinvestment in market growth initiatives;
• obtain full transparency on operating expenses.
Although PCO is owned and driven by each country, our Corporate Head Office assists by providing global policies, methodologies and processes. The PCO approach consists of three key steps: Visibility – creating transparency around
‘who spends how much on what’; Ownership, Opportunity Assessment and Policies – the appointment of senior Category Owners who are responsible for expenditure in their category as well as defining consumption policies and savings opportunities; and Action Plans, Control and Monitoring – defining action plans to capture savings and
tracking success against targets. We engaged leading consultants Accenture to support implementation. Importantly, PCO focuses employees’ attention on cost-saving, with regular communication of results and rewards, embedding PCO as a key element of Coca-Cola HBC’s corporate culture. In 2013, 80% of the savings were generated in the areas of supply chain and commercial expenses. The Travel and Meetings category achieved reductions as a result of simple behavioural changes, such as booking air travel as early as possible and avoiding the need for physical meetings through videoconferencing. The programme’s strong results indicate the onset of significant cultural change, since we have encouraged employees to treat spending as if it was their own.
Best practice in raw material sourcing Sugar, PET and aluminium are our largest commodity inputs and we continuously seek innovative ways to minimise pricing and reduce their use in accordance with our Community Trust objectives. This includes lightweighting PET bottles and aluminium cans, such as our B-Can initiative (see below). These initiatives have a tangible financial benefit as well as a positive environmental impact.
In 2013, our direct procurement spend was €4,364.5 million. Prices of our key commodities rose at a slower rate; on a currency-neutral basis, growth on a per case basis was 1%, compared to approximately 20% in the preceding two years. In an environment where prices were easing, we used our leverage with suppliers to embed savings for the future, as well as hedge our prices for aluminium and sugar.
In addition, we have continued to work with our suppliers to create joint value and reduce costs and complexity, in line with our 2020 strategy and targets for key commodities. Our work with Ball Packaging Europe to launch the world’s lightest standard aluminum beverage can in 2013 is a key example of the joint value we create by working closely with our suppliers. The B-Can, which requires less aluminum, is currently used at our facility in Hungary and will be available in eight of our markets during 2014.
We are also working with the Russian sugar industry to develop its beet sugar capacity, eliminating the need to import sugar for our operations in the country by 2015. In 2012, 50% of the sugar we required in Russia was refined sugar shipped from abroad, with the remainder locally sourced. We worked together with suppliers to invest over $100 million to increase local production of high-quality beet sugar. As a result, Russian beet sugar comprised 57% of our supply in 2013 and we aim to grow this to 85% in 2014 and 100% in 2015. In addition to the cost benefit of no longer shipping sugar from abroad, there will be significant benefits from a sustainability perspective. We are transferring skills and knowledge, bringing in expertise from France to develop the domestic industry. In addition, the resulting two new plants will generate employment and contribute to local economic development.
We have also worked extensively with our suppliers to ensure quality. Our progress towards embedding a zero tolerance culture helped to reduce the severity of quality incidents this year and lowered our incurred costs from €9 million to €1.1 million. There is still more to be done around quality and this is an essential element in ensuring we meet our Community Trust objectives.
Cost leadership
By 2015, our Russian operations will source 100% of sugar locally.
Strategic performance | 37
As a global business, we are able to use cross-border synergies to lower our indirect procurement costs. For example, mobile services were previously purchased at local level; by moving to a global tender, we were able to delivering savings of up to 65% in the 28 countries where we operate.
Reducing our environmental footprint All our businesses continuously seek new ways to minimise waste, water and energy use, in the context of our Community Trust and Cost Leadership objectives.
Energy-reduction projects in our plants generated more than one million Euro savings in 2013. There was an extensive range of projects during the year, including LED lighting, intelligent compressor control, condensate recovery and power supply optimisation.
The more efficiently we use our resources, the less we need to spend on our inputs. On occasion, this will require investments in new equipment and processes, but will contribute to creating a stronger, sustainable business. We have training programmes around water and energy as well as contests to reward the business units with the greatest improvements. As we discuss in our Community Trust chapter, this year we missed our targets in water and energy but are on track to achieve our 2020 goals. We will intensify our efforts in 2014 with our ‘Passion for the Environment’ campaign.
The future
Our geographic and business integration is already delivering results, from our Russian Multon Juice business integration to leveraging our scale across our set of adjacent countries.
In 2014 and beyond, we will continue to focus on the elements of our business that we can control, becoming stronger, leaner and more efficient. We will do this by aggressively maximising the opportunities in BSO and SAP Wave 2 to take costs out of the business and review all of our processes to improve operating efficiency. In addition, we aim to have best-in-class logistics and distribution across all our markets, capable of flexing in harmony with demand.
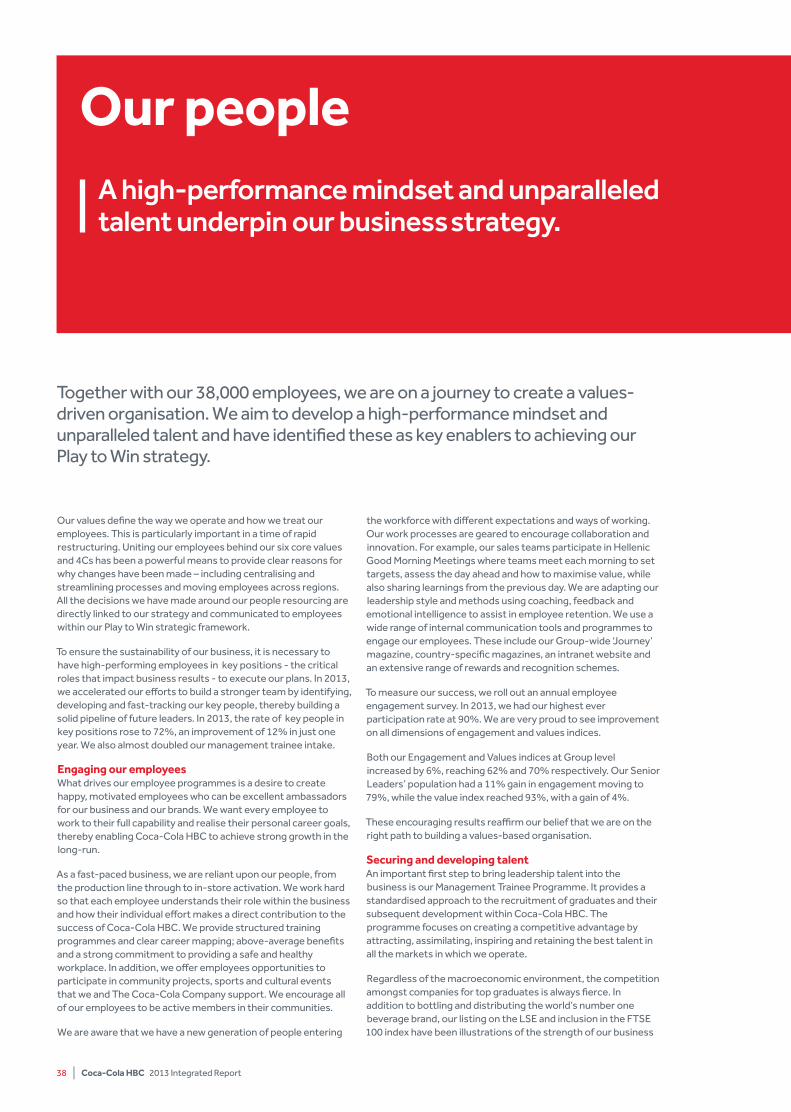
38 | Coca-Cola HBC 2013 Integrated Report
Our values define the way we operate and how we treat our employees. This is particularly important in a time of rapid restructuring. Uniting our employees behind our six core values and 4Cs has been a powerful means to provide clear reasons for why changes have been made – including centralising and streamlining processes and moving employees across regions. All the decisions we have made around our people resourcing are directly linked to our strategy and communicated to employees within our Play to Win strategic framework.
To ensure the sustainability of our business, it is necessary to have high-performing employees in key positions - the critical roles that impact business results - to execute our plans. In 2013, we accelerated our efforts to build a stronger team by identifying, developing and fast-tracking our key people, thereby building a solid pipeline of future leaders. In 2013, the rate of key people in key positions rose to 72%, an improvement of 12% in just one year. We also almost doubled our management trainee intake.
Engaging our employeesWhat drives our employee programmes is a desire to create happy, motivated employees who can be excellent ambassadors for our business and our brands. We want every employee to work to their full capability and realise their personal career goals, thereby enabling Coca-Cola HBC to achieve strong growth in the long-run.
As a fast-paced business, we are reliant upon our people, from the production line through to in-store activation. We work hard so that each employee understands their role within the business and how their individual effort makes a direct contribution to the success of Coca-Cola HBC. We provide structured training programmes and clear career mapping; above-average benefits and a strong commitment to providing a safe and healthy workplace. In addition, we offer employees opportunities to participate in community projects, sports and cultural events that we and The Coca-Cola Company support. We encourage all of our employees to be active members in their communities.
We are aware that we have a new generation of people entering
the workforce with different expectations and ways of working. Our work processes are geared to encourage collaboration and innovation. For example, our sales teams participate in Hellenic Good Morning Meetings where teams meet each morning to set targets, assess the day ahead and how to maximise value, while also sharing learnings from the previous day. We are adapting our leadership style and methods using coaching, feedback and emotional intelligence to assist in employee retention. We use a wide range of internal communication tools and programmes to engage our employees. These include our Group-wide ‘Journey’ magazine, country-specific magazines, an intranet website and an extensive range of rewards and recognition schemes.
To measure our success, we roll out an annual employee engagement survey. In 2013, we had our highest ever participation rate at 90%. We are very proud to see improvement on all dimensions of engagement and values indices.
Both our Engagement and Values indices at Group level increased by 6%, reaching 62% and 70% respectively. Our Senior Leaders’ population had a 11% gain in engagement moving to 79%, while the value index reached 93%, with a gain of 4%.
These encouraging results reaffirm our belief that we are on the right path to building a values-based organisation.
Securing and developing talentAn important first step to bring leadership talent into the business is our Management Trainee Programme. It provides a standardised approach to the recruitment of graduates and their subsequent development within Coca-Cola HBC. The programme focuses on creating a competitive advantage by attracting, assimilating, inspiring and retaining the best talent in all the markets in which we operate.
Regardless of the macroeconomic environment, the competition amongst companies for top graduates is always fierce. In addition to bottling and distributing the world’s number one beverage brand, our listing on the LSE and inclusion in the FTSE 100 index have been illustrations of the strength of our business
Our peopleA high-performance mindset and unparalleled talent underpin our business strategy.
Together with our 38,000 employees, we are on a journey to create a values-driven organisation. We aim to develop a high-performance mindset and unparalleled talent and have identified these as key enablers to achieving our Play to Win strategy.
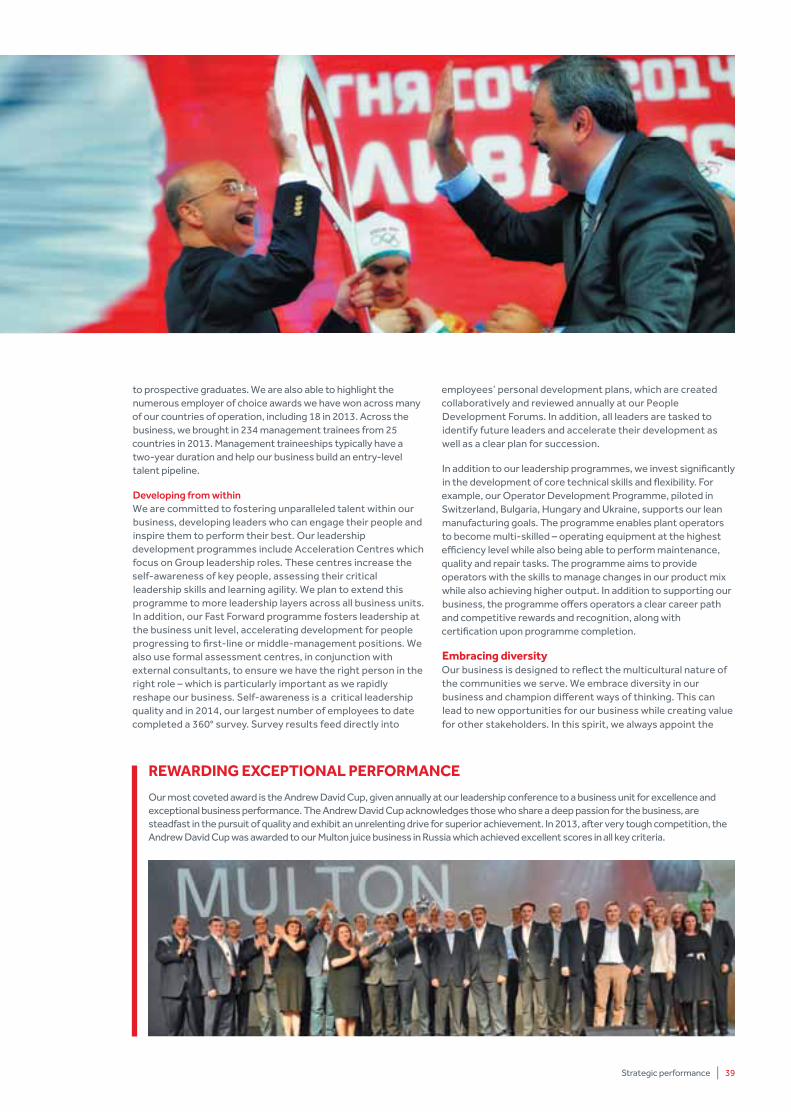
Strategic performance | 39
to prospective graduates. We are also able to highlight the numerous employer of choice awards we have won across many of our countries of operation, including 18 in 2013. Across the business, we brought in 234 management trainees from 25 countries in 2013. Management traineeships typically have a two-year duration and help our business build an entry-level talent pipeline.
Developing from withinWe are committed to fostering unparalleled talent within our business, developing leaders who can engage their people and inspire them to perform their best. Our leadership development programmes include Acceleration Centres which focus on Group leadership roles. These centres increase the self-awareness of key people, assessing their critical leadership skills and learning agility. We plan to extend this programme to more leadership layers across all business units. In addition, our Fast Forward programme fosters leadership at the business unit level, accelerating development for people progressing to first-line or middle-management positions. We also use formal assessment centres, in conjunction with external consultants, to ensure we have the right person in the right role – which is particularly important as we rapidly reshape our business. Self-awareness is a critical leadership quality and in 2014, our largest number of employees to date completed a 360° survey. Survey results feed directly into
employees’ personal development plans, which are created collaboratively and reviewed annually at our People Development Forums. In addition, all leaders are tasked to identify future leaders and accelerate their development as well as a clear plan for succession.
In addition to our leadership programmes, we invest significantly in the development of core technical skills and flexibility. For example, our Operator Development Programme, piloted in Switzerland, Bulgaria, Hungary and Ukraine, supports our lean manufacturing goals. The programme enables plant operators to become multi-skilled – operating equipment at the highest efficiency level while also being able to perform maintenance, quality and repair tasks. The programme aims to provide operators with the skills to manage changes in our product mix while also achieving higher output. In addition to supporting our business, the programme offers operators a clear career path and competitive rewards and recognition, along with certification upon programme completion.
Embracing diversityOur business is designed to reflect the multicultural nature of the communities we serve. We embrace diversity in our business and champion different ways of thinking. This can lead to new opportunities for our business while creating value for other stakeholders. In this spirit, we always appoint the
REWARDiNG ExCEpTiONAl pERFORMANCE
Our most coveted award is the Andrew David Cup, given annually at our leadership conference to a business unit for excellence and exceptional business performance. The Andrew David Cup acknowledges those who share a deep passion for the business, are steadfast in the pursuit of quality and exhibit an unrelenting drive for superior achievement. In 2013, after very tough competition, the Andrew David Cup was awarded to our Multon juice business in Russia which achieved excellent scores in all key criteria.
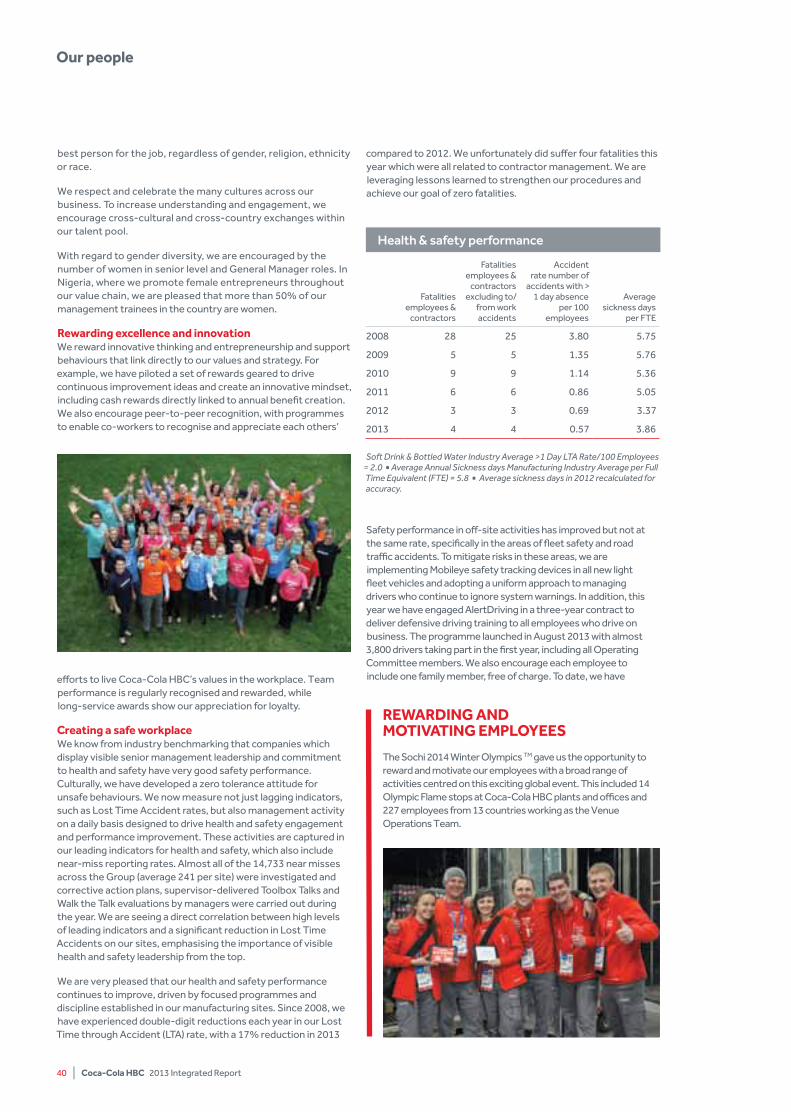
40 | Coca-Cola HBC 2013 Integrated Report
Our people
best person for the job, regardless of gender, religion, ethnicity or race.
We respect and celebrate the many cultures across our business. To increase understanding and engagement, we encourage cross-cultural and cross-country exchanges within our talent pool.
With regard to gender diversity, we are encouraged by the number of women in senior level and General Manager roles. In Nigeria, where we promote female entrepreneurs throughout our value chain, we are pleased that more than 50% of our management trainees in the country are women.
Rewarding excellence and innovationWe reward innovative thinking and entrepreneurship and support behaviours that link directly to our values and strategy. For example, we have piloted a set of rewards geared to drive continuous improvement ideas and create an innovative mindset, including cash rewards directly linked to annual benefit creation. We also encourage peer-to-peer recognition, with programmes to enable co-workers to recognise and appreciate each others’
efforts to live Coca-Cola HBC’s values in the workplace. Team performance is regularly recognised and rewarded, while long-service awards show our appreciation for loyalty.
Creating a safe workplace We know from industry benchmarking that companies which display visible senior management leadership and commitment to health and safety have very good safety performance. Culturally, we have developed a zero tolerance attitude for unsafe behaviours. We now measure not just lagging indicators, such as Lost Time Accident rates, but also management activity on a daily basis designed to drive health and safety engagement and performance improvement. These activities are captured in our leading indicators for health and safety, which also include near-miss reporting rates. Almost all of the 14,733 near misses across the Group (average 241 per site) were investigated and corrective action plans, supervisor-delivered Toolbox Talks and Walk the Talk evaluations by managers were carried out during the year. We are seeing a direct correlation between high levels of leading indicators and a significant reduction in Lost Time Accidents on our sites, emphasising the importance of visible health and safety leadership from the top.
We are very pleased that our health and safety performance continues to improve, driven by focused programmes and discipline established in our manufacturing sites. Since 2008, we have experienced double-digit reductions each year in our Lost Time through Accident (LTA) rate, with a 17% reduction in 2013
compared to 2012. We unfortunately did suffer four fatalities this year which were all related to contractor management. We are leveraging lessons learned to strengthen our procedures and achieve our goal of zero fatalities.
Health & safety performance
Fatalities employees &
contractors
Fatalities employees &
contractors excluding to/
from work accidents
Accident rate number of
accidents with > 1 day absence
per 100 employees
Average sickness days
per FTE
2008 28 25 3.80 5.75
2009 5 5 1.35 5.76
2010 9 9 1.14 5.36
2011 6 6 0.86 5.05
2012 3 3 0.69 3.37
2013 4 4 0.57 3.86
Soft Drink & Bottled Water Industry Average >1 Day LTA Rate/100 Employees
= 2.0 .Average Annual Sickness days Manufacturing Industry Average per Full Time Equivalent (FTE) = 5.8 . Average sickness days in 2012 recalculated for accuracy.
Safety performance in off-site activities has improved but not at the same rate, specifically in the areas of fleet safety and road traffic accidents. To mitigate risks in these areas, we are implementing Mobileye safety tracking devices in all new light fleet vehicles and adopting a uniform approach to managing drivers who continue to ignore system warnings. In addition, this year we have engaged AlertDriving in a three-year contract to deliver defensive driving training to all employees who drive on business. The programme launched in August 2013 with almost 3,800 drivers taking part in the first year, including all Operating Committee members. We also encourage each employee to include one family member, free of charge. To date, we have
REWARDiNG AND MOTiVATiNG EMplOyEES
The Sochi 2014 Winter Olympics TM gave us the opportunity to reward and motivate our employees with a broad range of activities centred on this exciting global event. This included 14 Olympic Flame stops at Coca-Cola HBC plants and offices and 227 employees from 13 countries working as the Venue Operations Team.
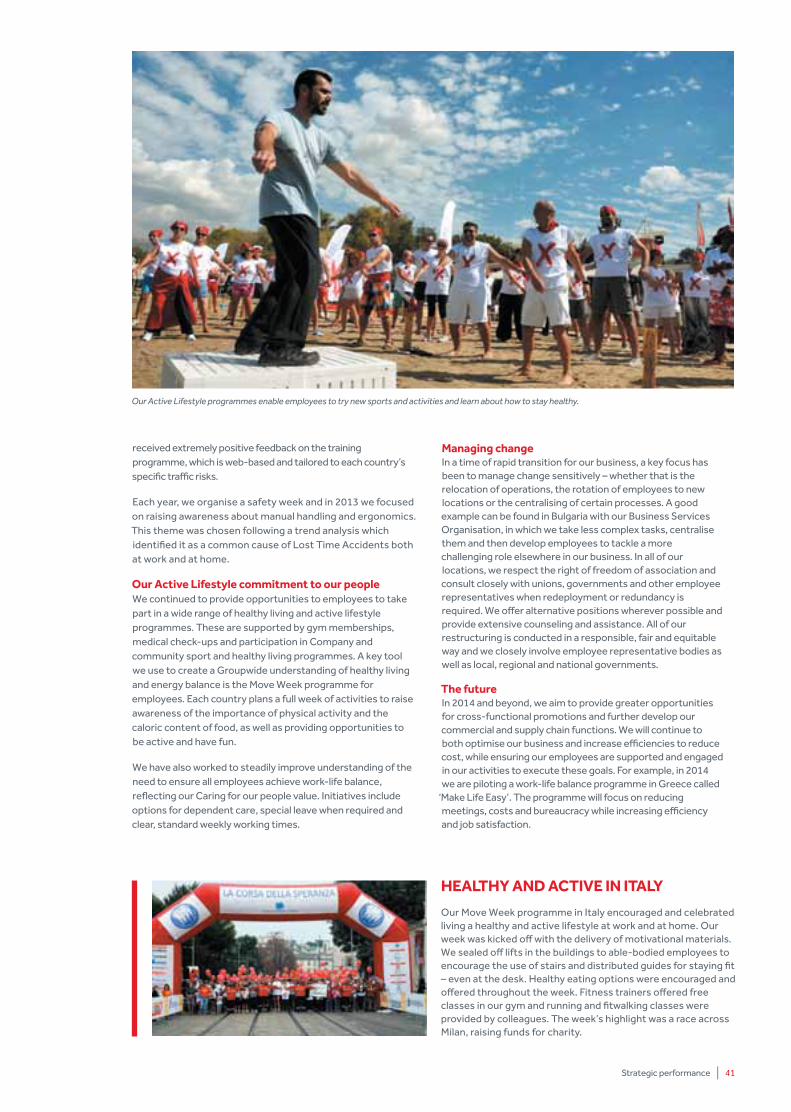
Strategic performance | 41
received extremely positive feedback on the training programme, which is web-based and tailored to each country’s specific traffic risks.
Each year, we organise a safety week and in 2013 we focused on raising awareness about manual handling and ergonomics. This theme was chosen following a trend analysis which identified it as a common cause of Lost Time Accidents both at work and at home.
Our Active lifestyle commitment to our peopleWe continued to provide opportunities to employees to take part in a wide range of healthy living and active lifestyle programmes. These are supported by gym memberships, medical check-ups and participation in Company and community sport and healthy living programmes. A key tool we use to create a Groupwide understanding of healthy living and energy balance is the Move Week programme for employees. Each country plans a full week of activities to raise awareness of the importance of physical activity and the caloric content of food, as well as providing opportunities to be active and have fun.
We have also worked to steadily improve understanding of the need to ensure all employees achieve work-life balance, reflecting our Caring for our people value. Initiatives include options for dependent care, special leave when required and clear, standard weekly working times.
Managing changeIn a time of rapid transition for our business, a key focus has been to manage change sensitively – whether that is the relocation of operations, the rotation of employees to new locations or the centralising of certain processes. A good example can be found in Bulgaria with our Business Services Organisation, in which we take less complex tasks, centralise them and then develop employees to tackle a more challenging role elsewhere in our business. In all of our locations, we respect the right of freedom of association and consult closely with unions, governments and other employee representatives when redeployment or redundancy is required. We offer alternative positions wherever possible and provide extensive counseling and assistance. All of our restructuring is conducted in a responsible, fair and equitable way and we closely involve employee representative bodies as well as local, regional and national governments.
The futureIn 2014 and beyond, we aim to provide greater opportunities for cross-functional promotions and further develop our commercial and supply chain functions. We will continue to both optimise our business and increase efficiencies to reduce cost, while ensuring our employees are supported and engaged in our activities to execute these goals. For example, in 2014 we are piloting a work-life balance programme in Greece called
‘Make Life Easy’. The programme will focus on reducing meetings, costs and bureaucracy while increasing efficiency and job satisfaction.
HEAlTHy AND ACTiVE iN iTAly
Our Move Week programme in Italy encouraged and celebrated living a healthy and active lifestyle at work and at home. Our week was kicked off with the delivery of motivational materials. We sealed off lifts in the buildings to able-bodied employees to encourage the use of stairs and distributed guides for staying fit – even at the desk. Healthy eating options were encouraged and offered throughout the week. Fitness trainers offered free classes in our gym and running and fitwalking classes were provided by colleagues. The week’s highlight was a race across Milan, raising funds for charity.
Our Active Lifestyle programmes enable employees to try new sports and activities and learn about how to stay healthy.
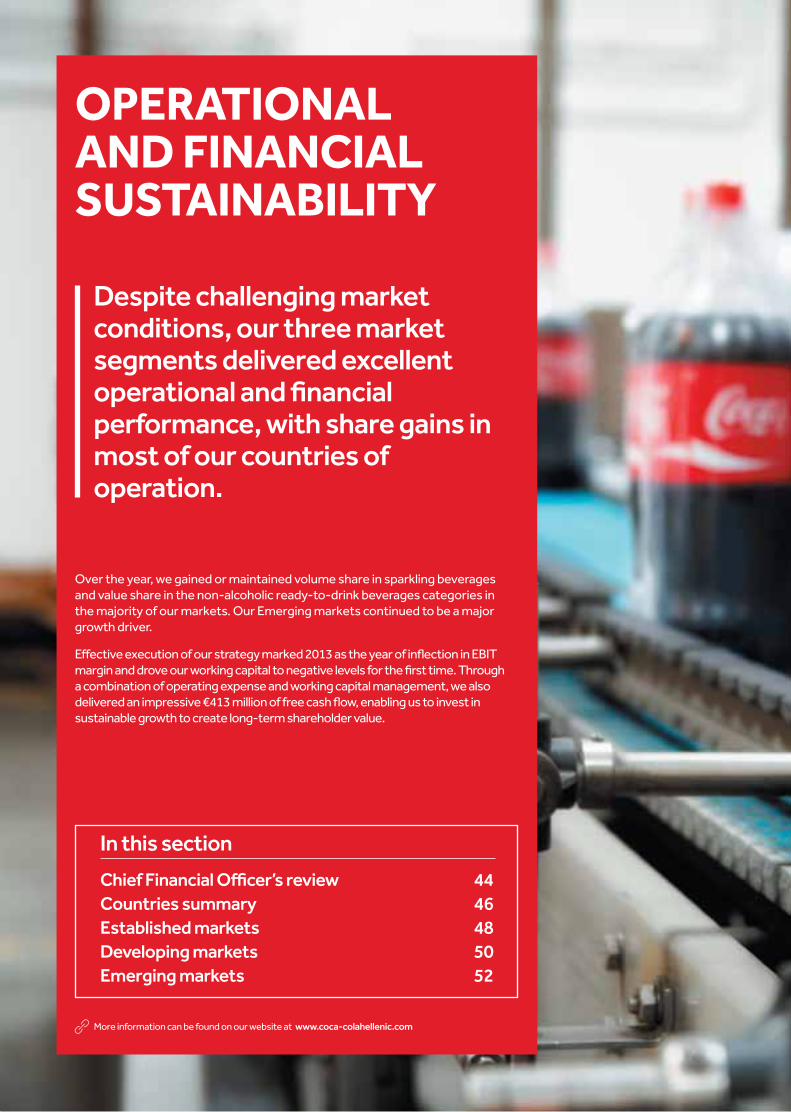
OpERATiONAl AND FiNANCiAl SuSTAiNABiliTy
Despite challenging market conditions, our three market segments delivered excellent operational and financial performance, with share gains in most of our countries of operation.
Over the year, we gained or maintained volume share in sparkling beverages and value share in the non-alcoholic ready-to-drink beverages categories in the majority of our markets. Our Emerging markets continued to be a major growth driver.
Effective execution of our strategy marked 2013 as the year of inflection in EBIT margin and drove our working capital to negative levels for the first time. Through a combination of operating expense and working capital management, we also delivered an impressive €413 million of free cash flow, enabling us to invest in sustainable growth to create long-term shareholder value.
In this section
Chief Financial Officer’s review 44Countries summary 46Established markets 48Developing markets 50Emerging markets 52
More information can be found on our website at www.coca-colahellenic.com
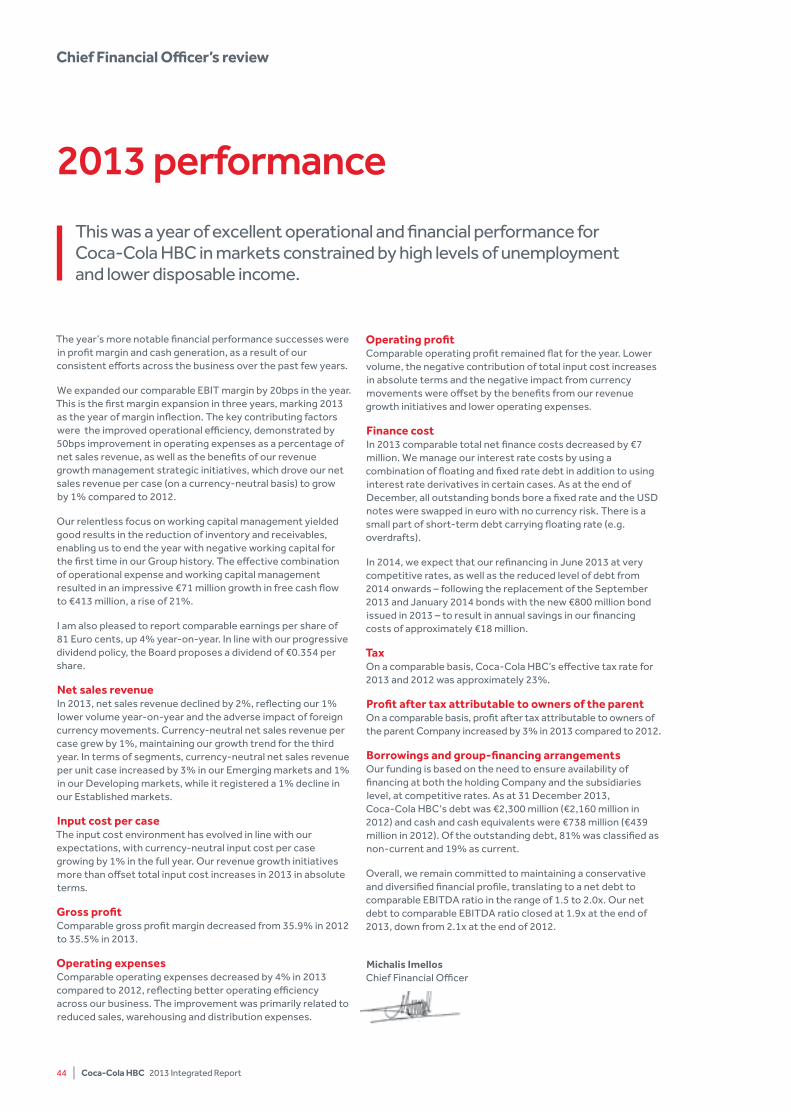
The year’s more notable financial performance successes were in profit margin and cash generation, as a result of our consistent efforts across the business over the past few years.
We expanded our comparable EBIT margin by 20bps in the year. This is the first margin expansion in three years, marking 2013 as the year of margin inflection. The key contributing factors were the improved operational efficiency, demonstrated by 50bps improvement in operating expenses as a percentage of net sales revenue, as well as the benefits of our revenue growth management strategic initiatives, which drove our net sales revenue per case (on a currency-neutral basis) to grow by 1% compared to 2012.
Our relentless focus on working capital management yielded good results in the reduction of inventory and receivables, enabling us to end the year with negative working capital for the first time in our Group history. The effective combination of operational expense and working capital management resulted in an impressive €71 million growth in free cash flow to €413 million, a rise of 21%.
I am also pleased to report comparable earnings per share of 81 Euro cents, up 4% year-on-year. In line with our progressive dividend policy, the Board proposes a dividend of €0.354 per share.
Net sales revenue In 2013, net sales revenue declined by 2%, reflecting our 1% lower volume year-on-year and the adverse impact of foreign currency movements. Currency-neutral net sales revenue per case grew by 1%, maintaining our growth trend for the third year. In terms of segments, currency-neutral net sales revenue per unit case increased by 3% in our Emerging markets and 1% in our Developing markets, while it registered a 1% decline in our Established markets.
input cost per caseThe input cost environment has evolved in line with our expectations, with currency-neutral input cost per case growing by 1% in the full year. Our revenue growth initiatives more than offset total input cost increases in 2013 in absolute terms.
Gross profitComparable gross profit margin decreased from 35.9% in 2012 to 35.5% in 2013.
Operating expensesComparable operating expenses decreased by 4% in 2013 compared to 2012, reflecting better operating efficiency across our business. The improvement was primarily related to reduced sales, warehousing and distribution expenses.
Operating profit Comparable operating profit remained flat for the year. Lower volume, the negative contribution of total input cost increases in absolute terms and the negative impact from currency movements were offset by the benefits from our revenue growth initiatives and lower operating expenses.
Finance cost In 2013 comparable total net finance costs decreased by €7 million. We manage our interest rate costs by using a combination of floating and fixed rate debt in addition to using interest rate derivatives in certain cases. As at the end of December, all outstanding bonds bore a fixed rate and the USD notes were swapped in euro with no currency risk. There is a small part of short-term debt carrying floating rate (e.g. overdrafts).
In 2014, we expect that our refinancing in June 2013 at very competitive rates, as well as the reduced level of debt from 2014 onwards – following the replacement of the September 2013 and January 2014 bonds with the new €800 million bond issued in 2013 – to result in annual savings in our financing costs of approximately €18 million.
TaxOn a comparable basis, Coca-Cola HBC’s effective tax rate for 2013 and 2012 was approximately 23%.
profit after tax attributable to owners of the parent On a comparable basis, profit after tax attributable to owners of the parent Company increased by 3% in 2013 compared to 2012.
Borrowings and group-financing arrangements Our funding is based on the need to ensure availability of financing at both the holding Company and the subsidiaries level, at competitive rates. As at 31 December 2013, Coca-Cola HBC‘s debt was €2,300 million (€2,160 million in 2012) and cash and cash equivalents were €738 million (€439 million in 2012). Of the outstanding debt, 81% was classified as non-current and 19% as current.
Overall, we remain committed to maintaining a conservative and diversified financial profile, translating to a net debt to comparable EBITDA ratio in the range of 1.5 to 2.0x. Our net debt to comparable EBITDA ratio closed at 1.9x at the end of 2013, down from 2.1x at the end of 2012.
Michalis imellos Chief Financial Officer
2013 performance
44 | Coca-Cola HBC 2013 Integrated Report
This was a year of excellent operational and financial performance for Coca-Cola HBC in markets constrained by high levels of unemployment and lower disposable income.
Chief Financial Officer’s review
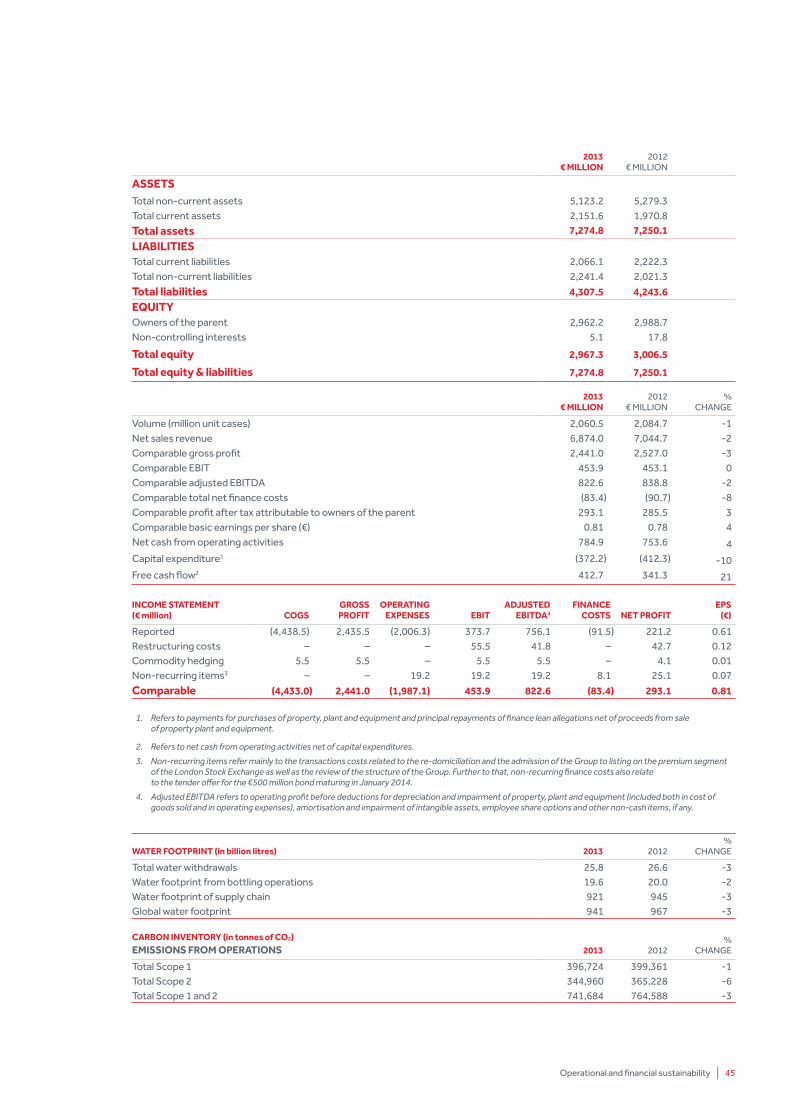
2013€ MilliON
2012€ MILLION
ASSETSTotal non-current assets 5,123.2 5,279.3Total current assets 2,151.6 1,970.8
Total assets 7,274.8 7,250.1
liABiliTiESTotal current liabilities 2,066.1 2,222.3Total non-current liabilities 2,241.4 2,021.3
Total liabilities 4,307.5 4,243.6EQuiTyOwners of the parent 2,962.2 2,988.7Non-controlling interests 5.1 17.8
Total equity 2,967.3 3,006.5
Total equity & liabilities 7,274.8 7,250.1
2013€ MilliON
2012€ MILLION
% CHANGE
Volume (million unit cases) 2,060.5 2,084.7 -1Net sales revenue 6,874.0 7,044.7 -2Comparable gross profit 2,441.0 2,527.0 -3Comparable EBIT 453.9 453.1 0Comparable adjusted EBITDA 822.6 838.8 -2Comparable total net finance costs (83.4) (90.7) -8Comparable profit after tax attributable to owners of the parent 293.1 285.5 3Comparable basic earnings per share (€) 0.81 0.78 4Net cash from operating activities 784.9 753.6 4Capital expenditure1 (372.2) (412.3) -10Free cash flow2 412.7 341.3 21
iNCOME STATEMENT(€ million) COGS
GROSS pROFiT
OpERATiNG ExpENSES EBiT
ADJuSTED EBiTDA4
FiNANCE COSTS NET pROFiT
EpS(€)
Reported (4,438.5) 2,435.5 (2,006.3) 373.7 756.1 (91.5) 221.2 0.61Restructuring costs – – – 55.5 41.8 – 42.7 0.12Commodity hedging 5.5 5.5 – 5.5 5.5 – 4.1 0.01Non-recurring items3 – – 19.2 19.2 19.2 8.1 25.1 0.07
Comparable (4,433.0) 2,441.0 (1,987.1) 453.9 822.6 (83.4) 293.1 0.81
WATER FOOTpRiNT (in billion litres) 2013 2012%
CHANGE
Total water withdrawals 25.8 26.6 -3Water footprint from bottling operations 19.6 20.0 -2Water footprint of supply chain 921 945 -3Global water footprint 941 967 -3
CARBON iNVENTORy (in tonnes of CO2)EMiSSiONS FROM OpERATiONS 2013 2012
% CHANGE
Total Scope 1 396,724 399,361 -1Total Scope 2 344,960 365,228 -6Total Scope 1 and 2 741,684 764,588 -3
Operational and financial sustainability | 45
1. Refers to payments for purchases of property, plant and equipment and principal repayments of finance lean allegations net of proceeds from sale of property plant and equipment.
2. Refers to net cash from operating activities net of capital expenditures.
3. Non-recurring items refer mainly to the transactions costs related to the re-domiciliation and the admission of the Group to listing on the premium segment of the London Stock Exchange as well as the review of the structure of the Group. Further to that, non-recurring finance costs also relate to the tender offer for the €500 million bond maturing in January 2014.
4. Adjusted EBITDA refers to operating profit before deductions for depreciation and impairment of property, plant and equipment (included both in cost of goods sold and in operating expenses), amortisation and impairment of intangible assets, employee share options and other non-cash items, if any.
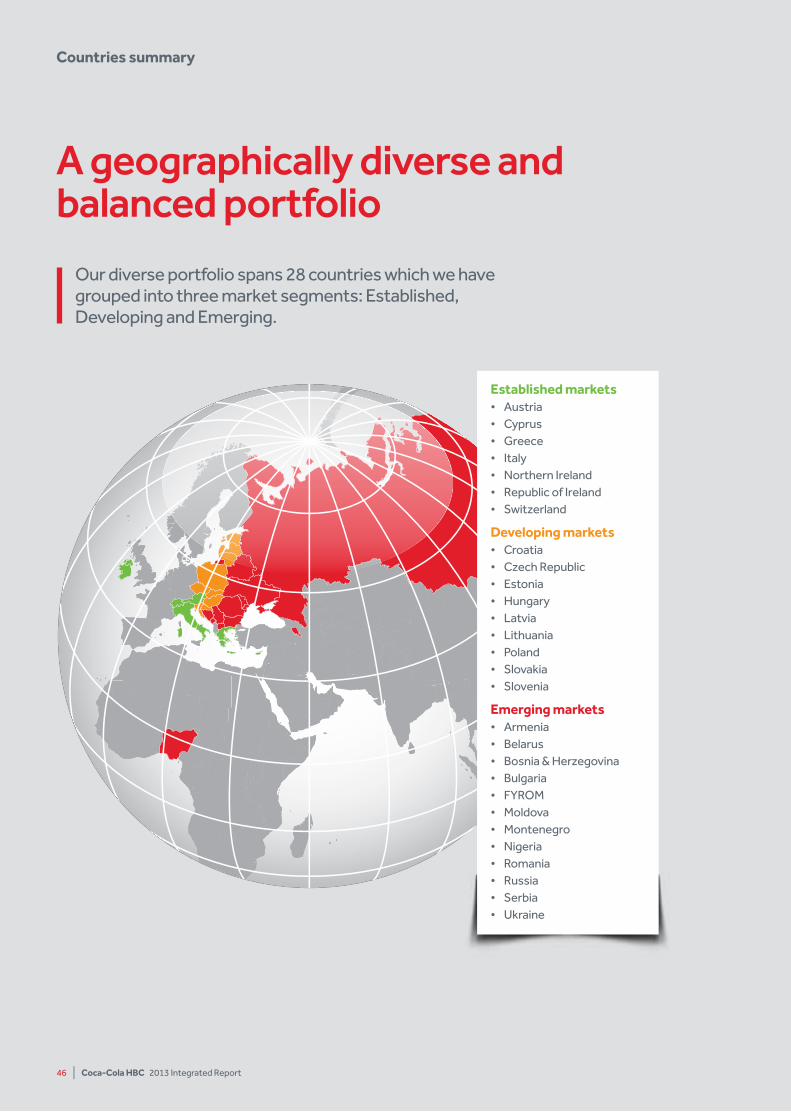
46 | Coca-Cola HBC 2013 Integrated Report
A geographically diverse and balanced portfolio
Countries summary
Established markets• Austria• Cyprus• Greece• Italy• Northern Ireland• Republic of Ireland• Switzerland
Developing markets• Croatia• Czech Republic• Estonia• Hungary• Latvia• Lithuania• Poland• Slovakia• Slovenia
Emerging markets• Armenia• Belarus• Bosnia & Herzegovina• Bulgaria• FYROM• Moldova• Montenegro• Nigeria• Romania• Russia• Serbia• Ukraine
Our diverse portfolio spans 28 countries which we have grouped into three market segments: Established, Developing and Emerging.
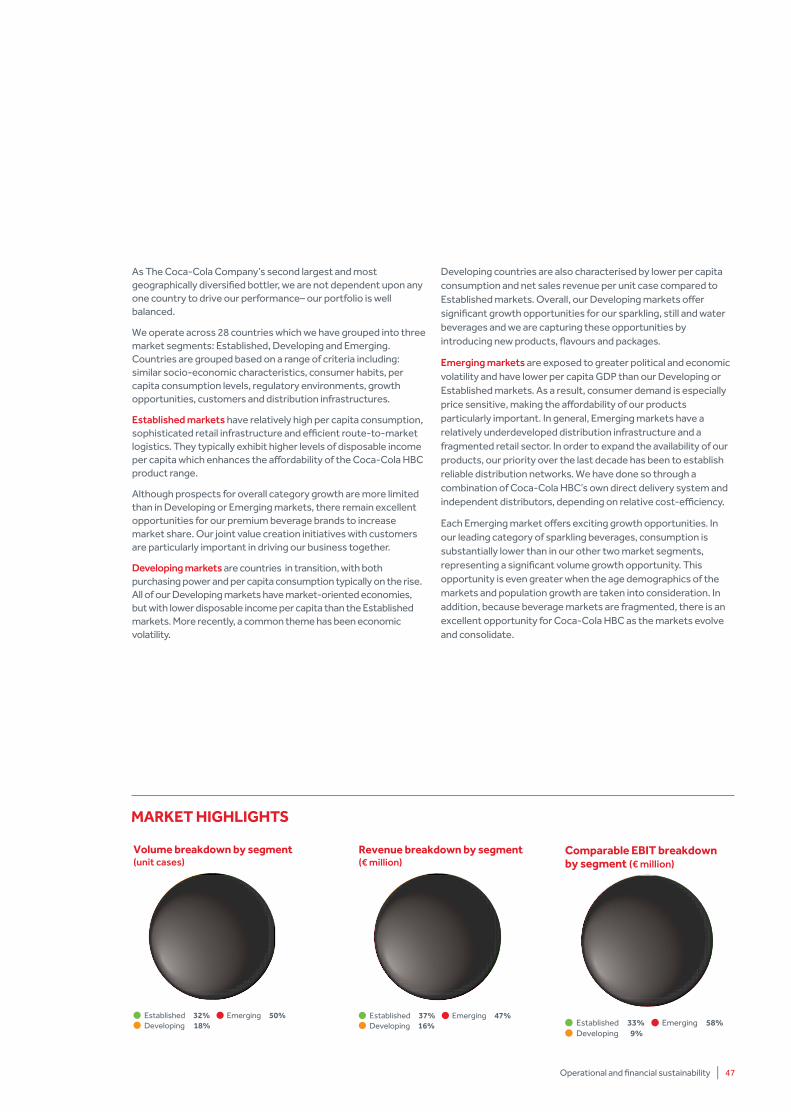
Operational and financial sustainability | 47
MARKET HiGHliGHTS
As The Coca-Cola Company’s second largest and most geographically diversified bottler, we are not dependent upon any one country to drive our performance– our portfolio is well balanced.
We operate across 28 countries which we have grouped into three market segments: Established, Developing and Emerging. Countries are grouped based on a range of criteria including: similar socio-economic characteristics, consumer habits, per capita consumption levels, regulatory environments, growth opportunities, customers and distribution infrastructures.
Established markets have relatively high per capita consumption, sophisticated retail infrastructure and efficient route-to-market logistics. They typically exhibit higher levels of disposable income per capita which enhances the affordability of the Coca-Cola HBC product range.
Although prospects for overall category growth are more limited than in Developing or Emerging markets, there remain excellent opportunities for our premium beverage brands to increase market share. Our joint value creation initiatives with customers are particularly important in driving our business together.
Developing markets are countries in transition, with both purchasing power and per capita consumption typically on the rise. All of our Developing markets have market-oriented economies, but with lower disposable income per capita than the Established markets. More recently, a common theme has been economic volatility.
Developing countries are also characterised by lower per capita consumption and net sales revenue per unit case compared to Established markets. Overall, our Developing markets offer significant growth opportunities for our sparkling, still and water beverages and we are capturing these opportunities by introducing new products, flavours and packages.
Emerging markets are exposed to greater political and economic volatility and have lower per capita GDP than our Developing or Established markets. As a result, consumer demand is especially price sensitive, making the affordability of our products particularly important. In general, Emerging markets have a relatively underdeveloped distribution infrastructure and a fragmented retail sector. In order to expand the availability of our products, our priority over the last decade has been to establish reliable distribution networks. We have done so through a combination of Coca-Cola HBC’s own direct delivery system and independent distributors, depending on relative cost-efficiency.
Each Emerging market offers exciting growth opportunities. In our leading category of sparkling beverages, consumption is substantially lower than in our other two market segments, representing a significant volume growth opportunity. This opportunity is even greater when the age demographics of the markets and population growth are taken into consideration. In addition, because beverage markets are fragmented, there is an excellent opportunity for Coca-Cola HBC as the markets evolve and consolidate.
Established 37% Developing 16%
Emerging 47%
Revenue breakdown by segment(€ million)
Established 33% Developing 9%
Emerging 58%
Comparable EBIT breakdown by segment (€ million)
Established 32% Developing 18%
Emerging 50%
Volume breakdown by segment(unit cases)
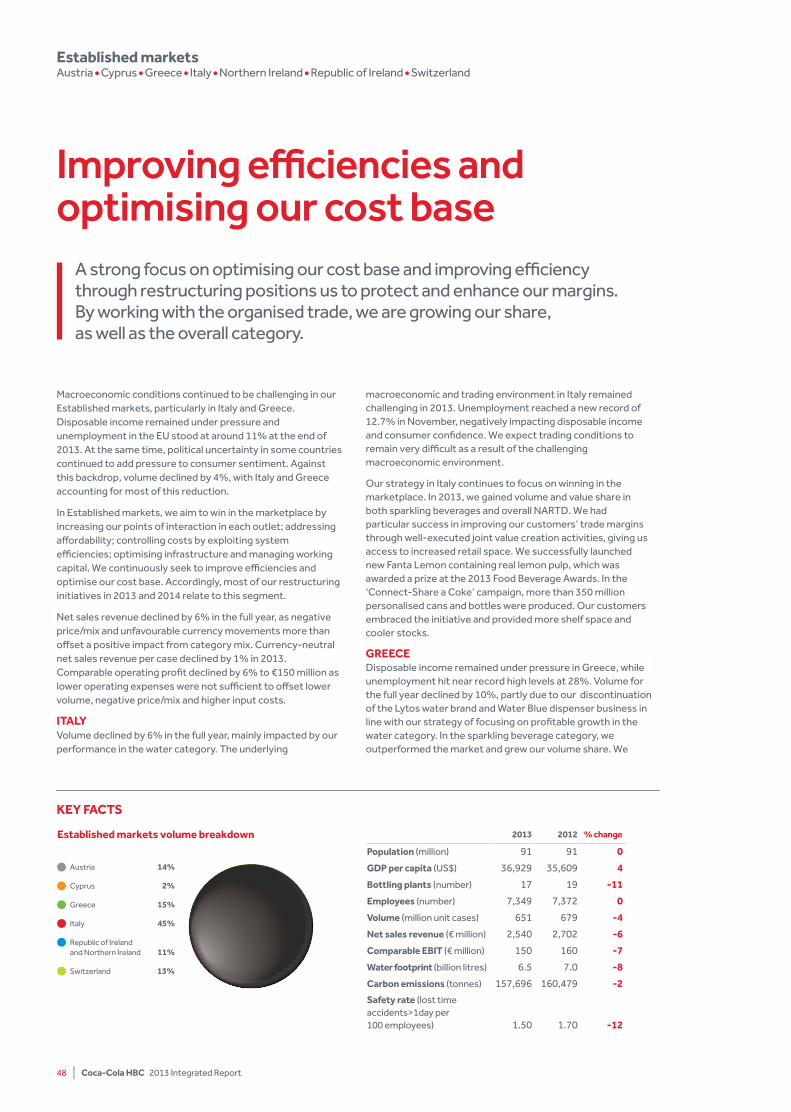
Macroeconomic conditions continued to be challenging in our Established markets, particularly in Italy and Greece. Disposable income remained under pressure and unemployment in the EU stood at around 11% at the end of 2013. At the same time, political uncertainty in some countries continued to add pressure to consumer sentiment. Against this backdrop, volume declined by 4%, with Italy and Greece accounting for most of this reduction.
In Established markets, we aim to win in the marketplace by increasing our points of interaction in each outlet; addressing affordability; controlling costs by exploiting system efficiencies; optimising infrastructure and managing working capital. We continuously seek to improve efficiencies and optimise our cost base. Accordingly, most of our restructuring initiatives in 2013 and 2014 relate to this segment.
Net sales revenue declined by 6% in the full year, as negative price/mix and unfavourable currency movements more than offset a positive impact from category mix. Currency-neutral net sales revenue per case declined by 1% in 2013. Comparable operating profit declined by 6% to €150 million as lower operating expenses were not sufficient to offset lower volume, negative price/mix and higher input costs.
iTAly Volume declined by 6% in the full year, mainly impacted by our performance in the water category. The underlying
macroeconomic and trading environment in Italy remained challenging in 2013. Unemployment reached a new record of 12.7% in November, negatively impacting disposable income and consumer confidence. We expect trading conditions to remain very difficult as a result of the challenging macroeconomic environment.
Our strategy in Italy continues to focus on winning in the marketplace. In 2013, we gained volume and value share in both sparkling beverages and overall NARTD. We had particular success in improving our customers’ trade margins through well-executed joint value creation activities, giving us access to increased retail space. We successfully launched new Fanta Lemon containing real lemon pulp, which was awarded a prize at the 2013 Food Beverage Awards. In the ‘Connect-Share a Coke’ campaign, more than 350 million personalised cans and bottles were produced. Our customers embraced the initiative and provided more shelf space and cooler stocks.
GREECEDisposable income remained under pressure in Greece, while unemployment hit near record high levels at 28%. Volume for the full year declined by 10%, partly due to our discontinuation of the Lytos water brand and Water Blue dispenser business in line with our strategy of focusing on profitable growth in the water category. In the sparkling beverage category, we outperformed the market and grew our volume share. We
Established marketsAustria Cyprus Greece Italy Northern Ireland Republic of Ireland Switzerland
Improving efficiencies and optimising our cost base
A strong focus on optimising our cost base and improving efficiency through restructuring positions us to protect and enhance our margins. By working with the organised trade, we are growing our share, as well as the overall category.
KEy FACTS
2013 2012 % change
population (million) 91 91 0
GDp per capita (US$) 36,929 35,609 4
Bottling plants (number) 17 19 -11
Employees (number) 7,349 7,372 0
Volume (million unit cases) 651 679 -4
Net sales revenue (€ million) 2,540 2,702 -6
Comparable EBiT (€ million) 150 160 -7
Water footprint (billion litres) 6.5 7.0 -8
Carbon emissions (tonnes) 157,696 160,479 -2
Safety rate (lost time accidents>1day per 100 employees) 1.50 1.70 -12
Established markets volume breakdown
Austria 14%
Cyprus 2%
Greece 15%
Italy 45%
Republic of Ireland and Northern Ireland 11%
Switzerland 13%
48 | Coca-Cola HBC 2013 Integrated Report
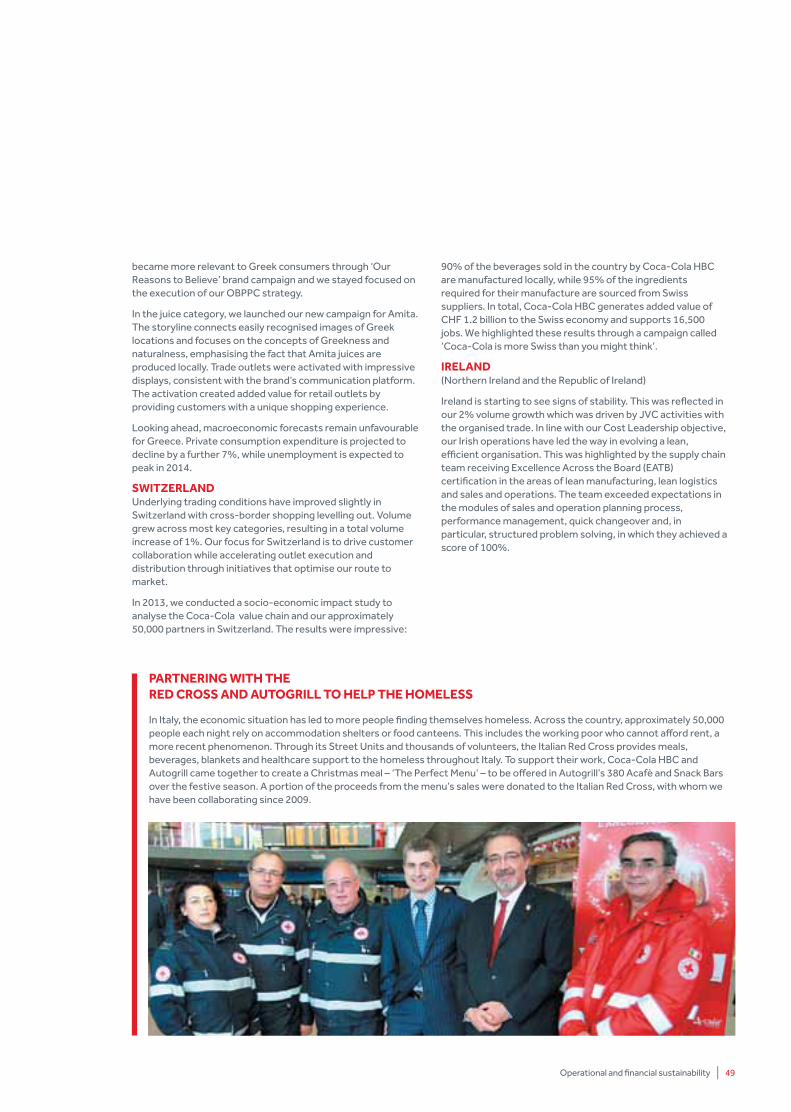
became more relevant to Greek consumers through ‘Our Reasons to Believe’ brand campaign and we stayed focused on the execution of our OBPPC strategy.
In the juice category, we launched our new campaign for Amita. The storyline connects easily recognised images of Greek locations and focuses on the concepts of Greekness and naturalness, emphasising the fact that Amita juices are produced locally. Trade outlets were activated with impressive displays, consistent with the brand’s communication platform. The activation created added value for retail outlets by providing customers with a unique shopping experience.
Looking ahead, macroeconomic forecasts remain unfavourable for Greece. Private consumption expenditure is projected to decline by a further 7%, while unemployment is expected to peak in 2014.
SWiTZERlANDUnderlying trading conditions have improved slightly in Switzerland with cross-border shopping levelling out. Volume grew across most key categories, resulting in a total volume increase of 1%. Our focus for Switzerland is to drive customer collaboration while accelerating outlet execution and distribution through initiatives that optimise our route to market.
In 2013, we conducted a socio-economic impact study to analyse the Coca-Cola value chain and our approximately 50,000 partners in Switzerland. The results were impressive:
90% of the beverages sold in the country by Coca-Cola HBC are manufactured locally, while 95% of the ingredients required for their manufacture are sourced from Swiss suppliers. In total, Coca-Cola HBC generates added value of CHF 1.2 billion to the Swiss economy and supports 16,500 jobs. We highlighted these results through a campaign called ‘Coca-Cola is more Swiss than you might think’.
iRElAND(Northern Ireland and the Republic of Ireland)
Ireland is starting to see signs of stability. This was reflected in our 2% volume growth which was driven by JVC activities with the organised trade. In line with our Cost Leadership objective, our Irish operations have led the way in evolving a lean, efficient organisation. This was highlighted by the supply chain team receiving Excellence Across the Board (EATB) certification in the areas of lean manufacturing, lean logistics and sales and operations. The team exceeded expectations in the modules of sales and operation planning process, performance management, quick changeover and, in particular, structured problem solving, in which they achieved a score of 100%.
pARTNERiNG WiTH THE RED CROSS AND AuTOGRill TO HElp THE HOMElESS
In Italy, the economic situation has led to more people finding themselves homeless. Across the country, approximately 50,000 people each night rely on accommodation shelters or food canteens. This includes the working poor who cannot afford rent, a more recent phenomenon. Through its Street Units and thousands of volunteers, the Italian Red Cross provides meals, beverages, blankets and healthcare support to the homeless throughout Italy. To support their work, Coca-Cola HBC and Autogrill came together to create a Christmas meal – ‘The Perfect Menu’ – to be offered in Autogrill’s 380 Acafè and Snack Bars over the festive season. A portion of the proceeds from the menu’s sales were donated to the Italian Red Cross, with whom we have been collaborating since 2009.
Operational and financial sustainability | 49
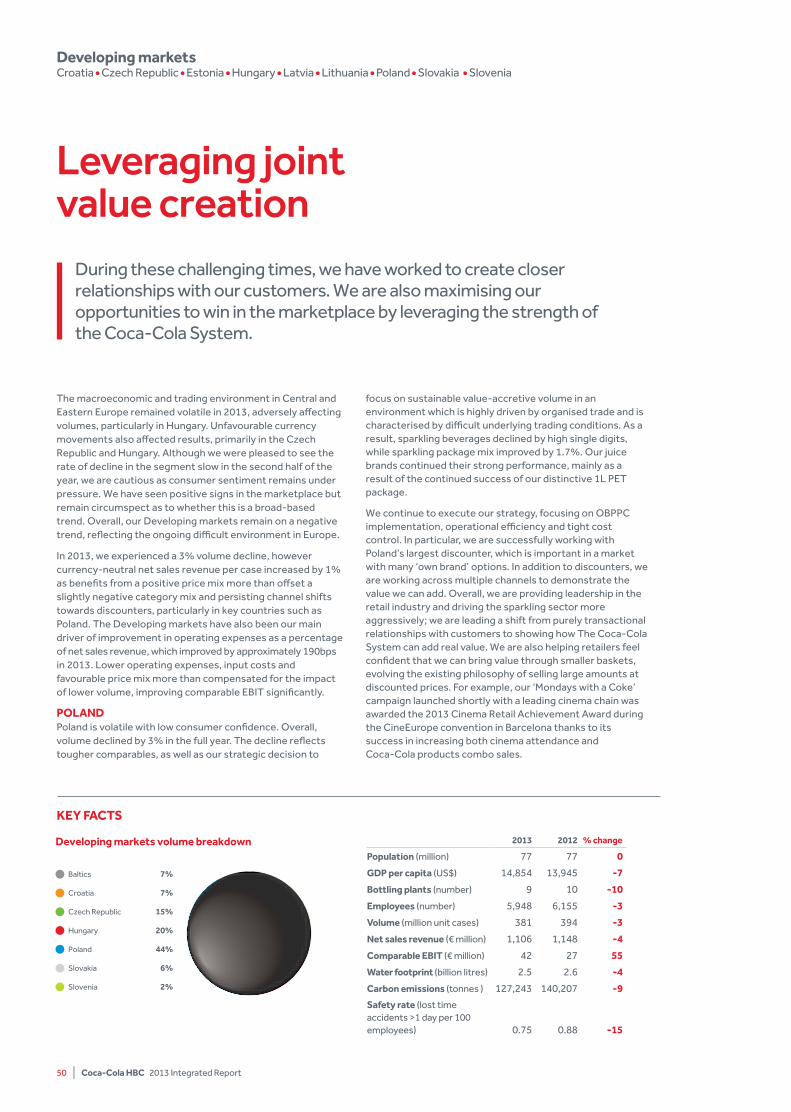
The macroeconomic and trading environment in Central and Eastern Europe remained volatile in 2013, adversely affecting volumes, particularly in Hungary. Unfavourable currency movements also affected results, primarily in the Czech Republic and Hungary. Although we were pleased to see the rate of decline in the segment slow in the second half of the year, we are cautious as consumer sentiment remains under pressure. We have seen positive signs in the marketplace but remain circumspect as to whether this is a broad-based trend. Overall, our Developing markets remain on a negative trend, reflecting the ongoing difficult environment in Europe.
In 2013, we experienced a 3% volume decline, however currency-neutral net sales revenue per case increased by 1% as benefits from a positive price mix more than offset a slightly negative category mix and persisting channel shifts towards discounters, particularly in key countries such as Poland. The Developing markets have also been our main driver of improvement in operating expenses as a percentage of net sales revenue, which improved by approximately 190bps in 2013. Lower operating expenses, input costs and favourable price mix more than compensated for the impact of lower volume, improving comparable EBIT significantly.
pOlANDPoland is volatile with low consumer confidence. Overall, volume declined by 3% in the full year. The decline reflects tougher comparables, as well as our strategic decision to
focus on sustainable value-accretive volume in an environment which is highly driven by organised trade and is characterised by difficult underlying trading conditions. As a result, sparkling beverages declined by high single digits, while sparkling package mix improved by 1.7%. Our juice brands continued their strong performance, mainly as a result of the continued success of our distinctive 1L PET package.
We continue to execute our strategy, focusing on OBPPC implementation, operational efficiency and tight cost control. In particular, we are successfully working with Poland’s largest discounter, which is important in a market with many ‘own brand’ options. In addition to discounters, we are working across multiple channels to demonstrate the value we can add. Overall, we are providing leadership in the retail industry and driving the sparkling sector more aggressively; we are leading a shift from purely transactional relationships with customers to showing how The Coca-Cola System can add real value. We are also helping retailers feel confident that we can bring value through smaller baskets, evolving the existing philosophy of selling large amounts at discounted prices. For example, our ‘Mondays with a Coke’ campaign launched shortly with a leading cinema chain was awarded the 2013 Cinema Retail Achievement Award during the CineEurope convention in Barcelona thanks to its success in increasing both cinema attendance and Coca-Cola products combo sales.
KEy FACTS
Developing marketsCroatia Czech Republic Estonia Hungary Latvia Lithuania Poland Slovakia Slovenia
Leveraging joint value creation
During these challenging times, we have worked to create closer relationships with our customers. We are also maximising our opportunities to win in the marketplace by leveraging the strength of the Coca-Cola System.
Developing markets volume breakdown
Baltics 7%
Croatia 7%
Czech Republic 15%
Hungary 20%
Poland 44%
Slovakia 6%
Slovenia 2%
2013 2012 % change
population (million) 77 77 0
GDp per capita (US$) 14,854 13,945 -7
Bottling plants (number) 9 10 -10
Employees (number) 5,948 6,155 -3
Volume (million unit cases) 381 394 -3
Net sales revenue (€ million) 1,106 1,148 -4
Comparable EBiT (€ million) 42 27 55
Water footprint (billion litres) 2.5 2.6 -4
Carbon emissions (tonnes ) 127,243 140,207 -9
Safety rate (lost time accidents >1 day per 100 employees) 0.75 0.88 -15
50 | Coca-Cola HBC 2013 Integrated Report
We also launched Market Impact Teams (MITs) for Right Execution Daily (RED), a major project to ensure excellent execution at points of sale in accordance with our Picture of Success, as discussed in our Customer Preference chapter. The project ran for six weeks and involved 28,000 customers, 24,000 shelf displays, 8,000 menu boards and 28,000 coolers.
HuNGARyHungary continues to be a very difficult market, with the external environment remaining volatile. The economy is still fragile, unemployment is at double-digit levels, while consumer confidence is among the lowest in the European Union. This led to a 6% decline in our volumes for the full year. In 2013, we became market leaders in the juice category and maintained our value share in both sparkling beverages and the overall NARTD category. Launched in 2013, Burn Blue and Monster Rehab showed strong performances, as did Coca-Cola Zero. Juice was also helped by the positive impact of the launch of Cappy Pulpy Orange.
A key initiative this year was going live with an automated master data synchronisation process with a leading retail chain, ensuring sustained 100% master data accuracy. Real-time synchronised master data promotes efficient supply chain collaboration, helping us to improve supplier performance and on-shelf availability while at the same time reducing logistics costs. Our Hungarian operations received the Product of the Year award for NESTEA Green Tea with Stevia in the Ice Tea / Green Tea category.
CZECH REpuBliC In an environment of very low consumer confidence, our volumes decreased by 1% largely due to declines in water and tea. Sparkling beverages grew by 6%, driven by strong performance in brand Coca-Cola and led by the ‘Connect – Share a Coke’ campaign, while Fanta grew by 11%, supported by the launch of new flavours and the introduction of new 1.5L and 2L multipacks. Coca-Cola Zero
also demonstrated strong growth, supported by increased distribution and activation in the organised trade.
The business reported excellent results following tailor-made ‘Share a Coke’ campaign promotions at key organised trade customers. Sales of promotional packs were up compared to last year, with the 500ml pack showing impressive growth. Coca-Cola HBC Czech Republic and Slovakia also organised a conference for one of the world’s leading retailers. Over 80 participants from around the world met in Prague to explore joint profitable growth through customer marketing and supply chain collaboration. The event also offered participants an opportunity to share best practices, discuss priorities for 2014 and review joint value creation programmes.
Operational and financial sustainability | 51
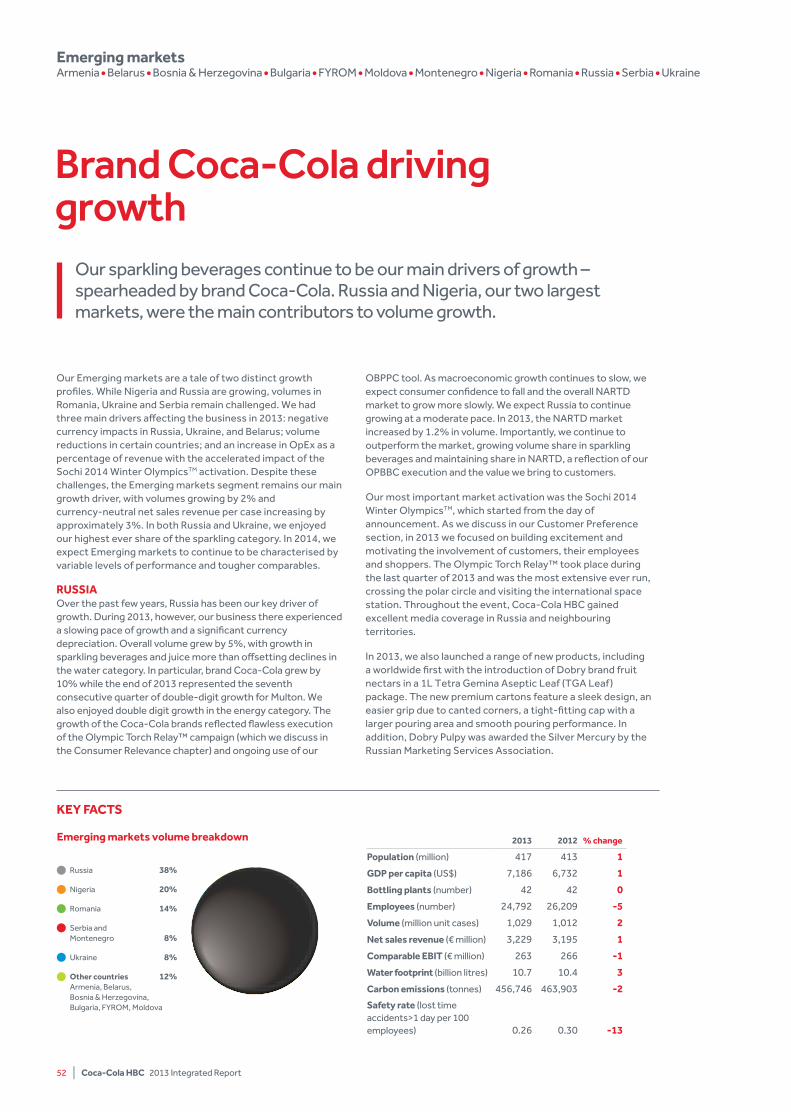
Our Emerging markets are a tale of two distinct growth profiles. While Nigeria and Russia are growing, volumes in Romania, Ukraine and Serbia remain challenged. We had three main drivers affecting the business in 2013: negative currency impacts in Russia, Ukraine, and Belarus; volume reductions in certain countries; and an increase in OpEx as a percentage of revenue with the accelerated impact of the Sochi 2014 Winter OlympicsTM activation. Despite these challenges, the Emerging markets segment remains our main growth driver, with volumes growing by 2% and currency-neutral net sales revenue per case increasing by approximately 3%. In both Russia and Ukraine, we enjoyed our highest ever share of the sparkling category. In 2014, we expect Emerging markets to continue to be characterised by variable levels of performance and tougher comparables.
RuSSiA Over the past few years, Russia has been our key driver of growth. During 2013, however, our business there experienced a slowing pace of growth and a significant currency depreciation. Overall volume grew by 5%, with growth in sparkling beverages and juice more than offsetting declines in the water category. In particular, brand Coca-Cola grew by 10% while the end of 2013 represented the seventh consecutive quarter of double-digit growth for Multon. We also enjoyed double digit growth in the energy category. The growth of the Coca-Cola brands reflected flawless execution of the Olympic Torch Relay™ campaign (which we discuss in the Consumer Relevance chapter) and ongoing use of our
OBPPC tool. As macroeconomic growth continues to slow, we expect consumer confidence to fall and the overall NARTD market to grow more slowly. We expect Russia to continue growing at a moderate pace. In 2013, the NARTD market increased by 1.2% in volume. Importantly, we continue to outperform the market, growing volume share in sparkling beverages and maintaining share in NARTD, a reflection of our OPBBC execution and the value we bring to customers.
Our most important market activation was the Sochi 2014 Winter OlympicsTM, which started from the day of announcement. As we discuss in our Customer Preference section, in 2013 we focused on building excitement and motivating the involvement of customers, their employees and shoppers. The Olympic Torch Relay™ took place during the last quarter of 2013 and was the most extensive ever run, crossing the polar circle and visiting the international space station. Throughout the event, Coca-Cola HBC gained excellent media coverage in Russia and neighbouring territories.
In 2013, we also launched a range of new products, including a worldwide first with the introduction of Dobry brand fruit nectars in a 1L Tetra Gemina Aseptic Leaf (TGA Leaf) package. The new premium cartons feature a sleek design, an easier grip due to canted corners, a tight-fitting cap with a larger pouring area and smooth pouring performance. In addition, Dobry Pulpy was awarded the Silver Mercury by the Russian Marketing Services Association.
KEy FACTS
2013 2012 % change
population (million) 417 413 1
GDp per capita (US$) 7,186 6,732 1
Bottling plants (number) 42 42 0
Employees (number) 24,792 26,209 -5
Volume (million unit cases) 1,029 1,012 2
Net sales revenue (€ million) 3,229 3,195 1
Comparable EBiT (€ million) 263 266 -1
Water footprint (billion litres) 10.7 10.4 3
Carbon emissions (tonnes) 456,746 463,903 -2
Safety rate (lost time accidents>1 day per 100 employees) 0.26 0.30 -13
Emerging marketsArmenia Belarus Bosnia & Herzegovina Bulgaria FYROM Moldova Montenegro Nigeria Romania Russia Serbia Ukraine
Brand Coca-Cola driving growth
Our sparkling beverages continue to be our main drivers of growth – spearheaded by brand Coca-Cola. Russia and Nigeria, our two largest markets, were the main contributors to volume growth.
Emerging markets volume breakdown
Russia 38%
Nigeria 20%
Romania 14%
Serbia and Montenegro 8%
Ukraine 8%
Other countries 12%Armenia, Belarus, Bosnia & Herzegovina, Bulgaria, FYROM, Moldova
52 | Coca-Cola HBC 2013 Integrated Report
NiGERiA The Nigerian economy continues to grow strongly, with GDP growth of 6.7% in 2013. With the country experiencing population growth equivalent to adding the population of Switzerland every two years, such a GDP growth profile is likely to continue. Low per capita consumption combined with a population of approximately 170 million make Nigeria an exciting growth opportunity.
Volume increased by 11% in 2013, with sparkling beverages and water as the main growth drivers. This was driven by strong activation, as well as improved product availability. We continue to execute our country strategy: investing in our brands with an emphasis on sparkling beverages; expanding further distribution and volume per outlet; driving availability across the board and selectively introducing OBPPC initiatives. In addition, we went live with SAP Wave 2, a key enabler of cross-functional efficiency, in January 2014.
Our commercial teams’ annual conventions in the five commercial regions across Nigeria, themed ‘Execute with Excellence’, were also attended by key regional customers in 2013, an important new initiative. The key goal is to provide an effective platform for regularly engaging customers on issues that foster improved performance on both sides and to highlight customer issues that need to be resolved. In 2014, a key priority is building capabilities in sustainability and putting in place high-calibre individuals who can push this forward. We have continued to roll out multiple Community Trust initiatives, which we discuss in our Strategic Performance section.
ROMANiA In 2013, volumes declined by 9%, following 2% growth in 2012. Volume fell in all key categories with the exception of the juice category, which was supported by the launch of Cappy Pulpy Orange. Overall, the macroeconomic and trading environment
remains under pressure, negatively impacting disposable income and consumer confidence. We gained both volume and value share in both sparkling beverages and overall NARTD over the year.
Despite the difficult trading conditions, we continued to implement our strategy and inaugurated a €22 million aseptic bottling line in Ploiesti, which will enable Romania to become a regional production hub, exporting Cappy Pulpy to six European countries. For our products and market execution, our Romanian operations, together with McCann PR, were awarded the Grand Effie and Gold Effie in the non-alcoholic beverages category for the most effective advertising campaigns. The winning campaign ‘Parental Control’ was an innovative national promotion developed for the Sprite brand and aimed at both teens and their parents.
uKRAiNE Ukraine’s economy is in a very fragile state and suffers from low consumer confidence. This contributed to volume declines of 10%. Nevertheless, we did gain volume and value share in the sparkling beverages category in 2013, achieving our highest share to date. Throughout the year, we focused on our strategy, which includes key Cost Leadership initiatives. We expect that these will bring positive results in 2014. We also continued to innovate across our product line, including the re-launch of our flagship water brand BonAqua in a new ‘eco’ bottle, which is 20% lighter, easy to open and takes up less space.
THE lEADiNG BRANDS iN RuSSiA’S NARTD MARKET AND STRONG GROWTH OppORTuNiTiES
Russia is Coca-Cola HBC’s largest market by volume. The country is the seventh largest economy in the world with a population of 141 million, 70% of which is urbanised. With a rapidly developing retail landscape, Russia has experienced strong growth in disposable income albeit with some deceleration in 2013. In the beverage market, there are enormous opportunities for our business, where we are already the leading brand in all core NARTD categories.
The last decade has seen us consolidate our position in Russia as the undisputed leader across multiple categories. Since 2003, we have enjoyed a CAGR exceeding 10% by leveraging our broad portfolio of winning brands. This has been led by the growth engine brand Coca-Cola, which has achieved growth of over 54% since 2008. We also have a strong position in juice, where we are reaping fully the benefits of our acquisition of Multon, with integration driving strong volume growth and increased efficiency through streamlining our beverage range. This has resulted in a reduction in the number of required SKUs from 172 in 2010 to 89 in 2013. We also have the largest supply chain infrastructure in the country and we will combine this with our brand strength to maximise the opportunity in Russia’s expanding beverage market. We will fully leverage our total sparkling portfolio (including Coca-Cola, Fanta and Sprite) while continuing to grow our profitable still drinks business, launching high-margin products in our juice portfolio. These opportunities build on the legacy we created during the Sochi 2014 Winter OlympicsTM.
Operational and financial sustainability | 53
GOVERNANCE
Engaging with stakeholders, effectively addressing material issues and ensuring rigorous governance are critical to our long-term success and ability to create value.
In this section
Engaging with stakeholders 56Risks and opportunities 58Corporate governance 61Remuneration 67
More information can be found on our website at www.coca-colahellenic.com
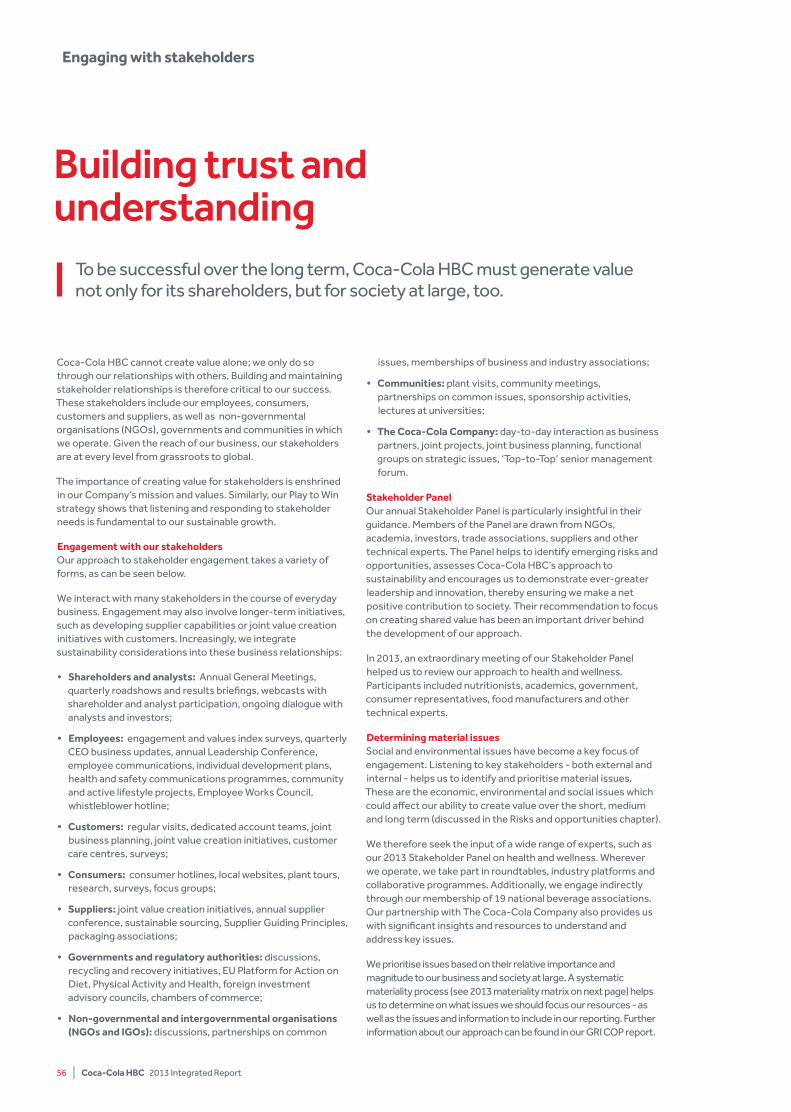
56 | Coca-Cola HBC 2013 Integrated Report
Engaging with stakeholders
Coca-Cola HBC cannot create value alone; we only do so through our relationships with others. Building and maintaining stakeholder relationships is therefore critical to our success. These stakeholders include our employees, consumers, customers and suppliers, as well as non-governmental organisations (NGOs), governments and communities in which we operate. Given the reach of our business, our stakeholders are at every level from grassroots to global.
The importance of creating value for stakeholders is enshrined in our Company’s mission and values. Similarly, our Play to Win strategy shows that listening and responding to stakeholder needs is fundamental to our sustainable growth.
Engagement with our stakeholdersOur approach to stakeholder engagement takes a variety of forms, as can be seen below.
We interact with many stakeholders in the course of everyday business. Engagement may also involve longer-term initiatives, such as developing supplier capabilities or joint value creation initiatives with customers. Increasingly, we integrate sustainability considerations into these business relationships:
• Shareholders and analysts: Annual General Meetings, quarterly roadshows and results briefings, webcasts with shareholder and analyst participation, ongoing dialogue with analysts and investors;
• Employees: engagement and values index surveys, quarterly CEO business updates, annual Leadership Conference, employee communications, individual development plans, health and safety communications programmes, community and active lifestyle projects, Employee Works Council, whistleblower hotline;
• Customers: regular visits, dedicated account teams, joint business planning, joint value creation initiatives, customer care centres, surveys;
• Consumers: consumer hotlines, local websites, plant tours, research, surveys, focus groups;
• Suppliers: joint value creation initiatives, annual supplier conference, sustainable sourcing, Supplier Guiding Principles, packaging associations;
• Governments and regulatory authorities: discussions, recycling and recovery initiatives, EU Platform for Action on Diet, Physical Activity and Health, foreign investment advisory councils, chambers of commerce;
• Non-governmental and intergovernmental organisations (NGOs and iGOs): discussions, partnerships on common
issues, memberships of business and industry associations;
• Communities: plant visits, community meetings, partnerships on common issues, sponsorship activities, lectures at universities;
• The Coca-Cola Company: day-to-day interaction as business partners, joint projects, joint business planning, functional groups on strategic issues, ‘Top-to-Top’ senior management forum.
Stakeholder panelOur annual Stakeholder Panel is particularly insightful in their guidance. Members of the Panel are drawn from NGOs, academia, investors, trade associations, suppliers and other technical experts. The Panel helps to identify emerging risks and opportunities, assesses Coca-Cola HBC’s approach to sustainability and encourages us to demonstrate ever-greater leadership and innovation, thereby ensuring we make a net positive contribution to society. Their recommendation to focus on creating shared value has been an important driver behind the development of our approach.
In 2013, an extraordinary meeting of our Stakeholder Panel helped us to review our approach to health and wellness. Participants included nutritionists, academics, government, consumer representatives, food manufacturers and other technical experts.
Determining material issuesSocial and environmental issues have become a key focus of engagement. Listening to key stakeholders - both external and internal - helps us to identify and prioritise material issues. These are the economic, environmental and social issues which could affect our ability to create value over the short, medium and long term (discussed in the Risks and opportunities chapter).
We therefore seek the input of a wide range of experts, such as our 2013 Stakeholder Panel on health and wellness. Wherever we operate, we take part in roundtables, industry platforms and collaborative programmes. Additionally, we engage indirectly through our membership of 19 national beverage associations. Our partnership with The Coca-Cola Company also provides us with significant insights and resources to understand and address key issues.
We prioritise issues based on their relative importance and magnitude to our business and society at large. A systematic materiality process (see 2013 materiality matrix on next page) helps us to determine on what issues we should focus our resources - as well as the issues and information to include in our reporting. Further information about our approach can be found in our GRI COP report.
Building trust and understanding
To be successful over the long term, Coca-Cola HBC must generate value not only for its shareholders, but for society at large, too.
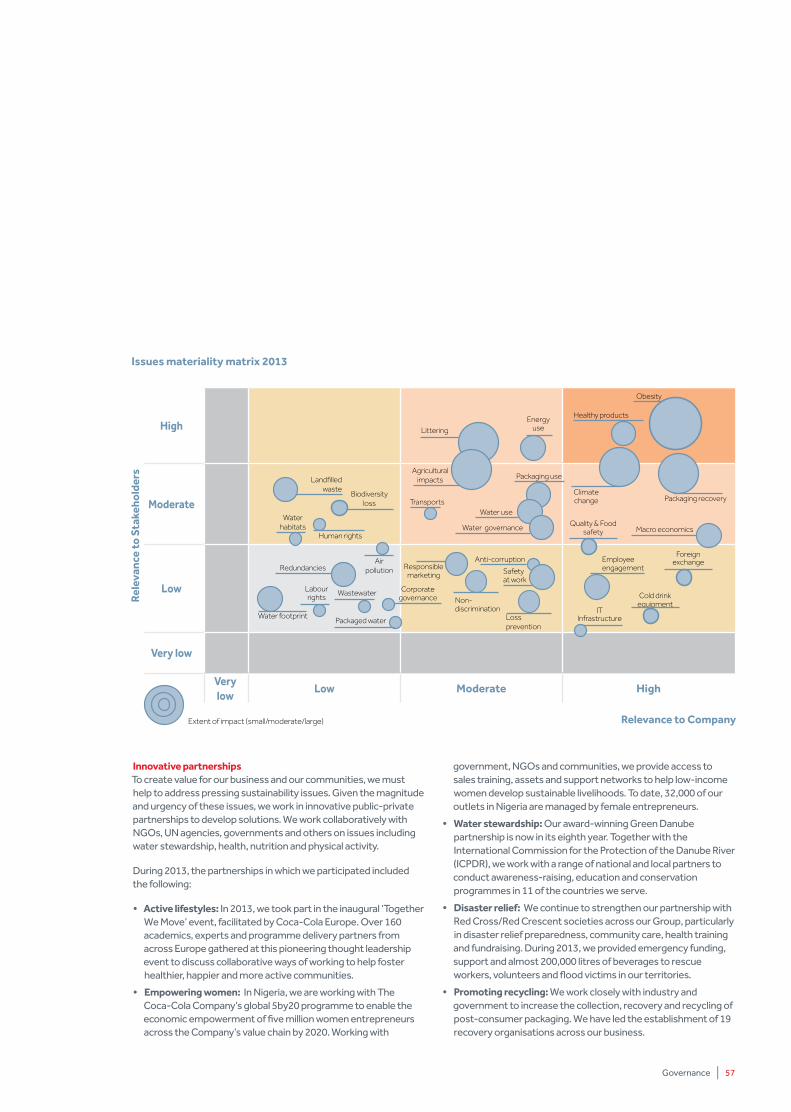
Governance | 57
innovative partnershipsTo create value for our business and our communities, we must help to address pressing sustainability issues. Given the magnitude and urgency of these issues, we work in innovative public-private partnerships to develop solutions. We work collaboratively with NGOs, UN agencies, governments and others on issues including water stewardship, health, nutrition and physical activity.
During 2013, the partnerships in which we participated included the following:
• Active lifestyles: In 2013, we took part in the inaugural ‘Together We Move’ event, facilitated by Coca-Cola Europe. Over 160 academics, experts and programme delivery partners from across Europe gathered at this pioneering thought leadership event to discuss collaborative ways of working to help foster healthier, happier and more active communities.
• Empowering women: In Nigeria, we are working with The Coca-Cola Company’s global 5by20 programme to enable the economic empowerment of five million women entrepreneurs across the Company’s value chain by 2020. Working with
government, NGOs and communities, we provide access to sales training, assets and support networks to help low-income women develop sustainable livelihoods. To date, 32,000 of our outlets in Nigeria are managed by female entrepreneurs.
• Water stewardship: Our award-winning Green Danube partnership is now in its eighth year. Together with the International Commission for the Protection of the Danube River (ICPDR), we work with a range of national and local partners to conduct awareness-raising, education and conservation programmes in 11 of the countries we serve.
• Disaster relief: We continue to strengthen our partnership with Red Cross/Red Crescent societies across our Group, particularly in disaster relief preparedness, community care, health training and fundraising. During 2013, we provided emergency funding, support and almost 200,000 litres of beverages to rescue workers, volunteers and flood victims in our territories.
• promoting recycling: We work closely with industry and government to increase the collection, recovery and recycling of post-consumer packaging. We have led the establishment of 19 recovery organisations across our business.
High
Moderate
low
Very low
Very low
low Moderate High
Water footprint
Human rights
Corporate governance
Packaged water
Packaging recovery
Littering
Agricultural impacts
Quality & Food safety
Foreign exchange
Cold drink equipment
Energy use
Packaging use
Healthy products
Employee engagement
Wastewater
Air pollution
Water use
Water governance
Safety at work
Loss prevention
Non- discrimination
Obesity
Climate change
Landfilled waste
Transports
Labour rights
Water habitats
Biodiversity loss
Responsible marketing
Redundancies
Macro economics
Anti-corruption
Extent of impact (small/moderate/large) Relevance to Company
IT Infrastructure
Rele
vanc
e to
Sta
keho
lder
s
issues materiality matrix 2013
The Board, its committees and our senior management team monitor and manage the risks and opportunities to which the Company is exposed. Our strategic priorities – the 4Cs – provide a framework to address these risks faced by the business.
Coca-Cola HBC has adopted a strategic Enterprise Wide Risk Management (EWRM) approach, which provides a fully integrated common risk management framework for the identification, assessment, management and escalation of risks and opportunities. The primary aims of this framework are to minimise our exposure to unforeseen events and to provide certainty to management of identified risks, creating a stable environment within which we can deliver our objectives. Outputs from this process are embedded in business-planning activities.
In 2013, Coca-Cola HBC reassessed its risk profile in the context of the Company’s incorporation in Switzerland and premium listing on the LSE. We considered the possible impact to enhance community trust and to address concerns about obesity and the risks the possible impact of regulatory and rule changes in both jurisdictions. We also introduced a specific cross-functional inter-Company programme to further enhance community trust as well as a means of addressing rising concerns about obesity and the risks this poses to the overall NARTD category.
Managing risks and opportunities
Through our strategic Enterprise Wide Risk Management approach, we identify, prioritise and manage a wide range of risks and opportunities facing our business.
58 | Coca-Cola HBC 2013 Integrated Report
Risks and opportunities
Macroeconomic risks: These relate to the external environment and the markets in which we operate and over which we have little control. Our three most significant risks in 2013 were the continuing decline in consumer confidence and disposable incomes as well as foreign exchange volatility.
Macroeconomic risks Actions to manage risk
Declining consumer demandReduced consumer confidence and disposable income, together with challenging and volatile macroeconomic conditions, could lead to reduced demand for our products due to lower consumer spending. This trend continued in 2013 in our Established and Developing markets and the eurozone sovereign debt crisis remains a key issue.
link to strategy: Consumer RelevanceWe are using shopper insights to improve our relevance to consumers. We have developed a focused approach called OBPPC that seeks opportunities by identifying the right occasion for the right brands at the right price in the right package and through the right channel. This is enabling us to expand our product offering in the marketplace and to win or maintain market share. In addition, our mix of markets means that despite challenges in some regions, our Emerging Markets are continuing to grow and offset some of the challenges from elsewhere.
input costsPrice increases and shortages of raw materials and packaging materials could materially and adversely affect our results. On a currency-neutral basis, input costs rose by 1% in 2013.
link to strategy: Cost leadershipWe hedge exposure to fluctuations in raw material prices by using various risk management products such as commodity swaps, futures, option contracts and supplier agreements. The hedge horizon for such instruments can be up to a maximum of three years.
Governance | 59
Foreign exchangeOur foreign exchange exposure arises from adverse changes in exchange rates between the euro, the US dollar and the functional currencies in our non-euro countries. This exposure affects our results in the following ways:
• raw materials purchased in currencies such as the US dollar or euro can lead to higher cost of sales which, if not recovered in local pricing or through cost reduction initiatives, might lead to reduced profit margins;
• devaluations of weaker currencies that are accompanied by high inflation;
• declining purchasing power can adversely affect sales and unit case volumes;
• as some operations have functional currencies other than our presentation currency (euro), any change in the functional currency against the euro impacts our income statement and balance sheet when results are translated into Euros, as this exposure is unhedged.
link to strategy: Cost leadershipWe hedge transactional exposures such as forecast raw material purchases to reduce currency risk and limit volatility. Derivative instruments may be used, provided they qualify as hedging activities as defined by our Treasury Policy. Our Treasury Policy requires the hedging of the rolling 12-month forecasted transactional exposures (cash flow exposures) to a range between 25% and 80% of the underlying exposures. Hedging beyond a 12-month period may occur, subject to certain maximum coverage levels, provided the forecasted transactions are highly probable.
Channel mixThe increasing concentration of retailers and independent wholesalers, on which we depend to distribute our products in certain countries, could lower our profitability and harm our ability to compete. In addition, the immediate consumption channel is under pressure as consumers switch increasingly to at-home consumption. This trend continued in 2013 with many customers in the hotel/restaurant/cafe segment continuing to go out of business.
link to strategy: Customer preferenceWe are increasing our presence in the discounter channel and in 2013, we signed a multi-year agreement with one of Europe’s leading discounters. We also work closely with all our customers to identify opportunities for joint value creation. This ensures that we remain the preferred partner of our customers. Additionally, our Right Execution Daily (RED) approach is supporting our commitment to operational excellence and enabling us to meet changing customer needs and channels.
TaxationRegulations around consumer health, particularly the threat of taxation on our products, could impact demand and affect our profitability. In 2013, a number of governments continued to contemplate taxes targeting our products and packaging waste recovery and this is a trend we expect to continue.
link to strategy: Cost leadershipWe continue to work closely with regulators to ensure they understand the facts and that our products are not singled out unfairly. In 2013, we contributed to economic impact studies to demonstrate the broader benefit of our business and industry sector in the countries where we operate and no new discriminatory taxes were imposed on beverage sales in our territories in 2013.
Consumer healthMisconceptions about the health impacts of soft drinks could reduce demand.
link to strategy: Community Trust; Consumer RelevanceWe are proactively counteracting misconceptions through consumer-facing marketing on active lifestyles and clearer labeling on our packages, supported by broader community engagement programmes focused on health and wellness.
We are also reducing the calorie content of many of our products and expanding our range of reduced and zero-calorie beverages.
Climate changeClimate change presents significant long-term risks to our business – from rising energy costs to threats to our agricultural supply chain and availability of water. Adverse weather conditions could reduce demand for our products and affect the price and availability of key crops (e.g. sugar). Water scarcity could limit availability for our operations. Increased regulation on carbon emissions could increase costs for our business. In 2013, there was no significant change to this risk.
link to strategy: Community Trust; Cost leadershipOur water stewardship programmes protect our physical and social license to operate. Our investments in on-site CHP units and energy efficiency may yield increased returns as energy prices rise and meet potential regulatory changes. In addition, we are working with the suppliers of our cold drink equipment to reduce their environmental footprint and retrofitting our current stock to increase their energy efficiency.
Risks and opportunities
Operational risks: These relate specifically to how we run our business and the decisions we take to respond to conditions in our markets.
Operational risks Actions to manage risk
Supply chainDisruptions due to a significant negative incident to Coca-Cola HBC supply and distribution infrastructure could adversely affect our business in some countries.
link to strategy: Customer preferenceIn 2013, there were no disruptions of any material significance. Over the past three years, Coca-Cola HBC has committed significant capital investment to the overall improvement of the Property Loss Prevention (PLP) programme across the Group. PLP audits are carried out with the participation of independent auditors in order to identify risks and recommend improvements. Emergency Response Plans are in place and are reviewed regularly.
Supply chainDisruptions due to a significant negative incident to a Coca-Cola HBC major supplier/business partner infrastructure could adversely affect our business in some countries.
link to strategy: Community TrustThe Coca-Cola Company sets minimum standards which suppliers must meet in order to gain authorisation. We have also added our own requirements to the Coca-Cola Supplier Guiding Principles and expect suppliers to gain certification to ISO 9001, ISO 14001 and FSSC 22000. This is helping us to build close relationships with suppliers so that we get early warning of potential issues and ensure that they have contingency plans in place.
product qualityContamination of our products could damage our reputation and reduce our net sales revenues. In 2013, no major quality issues occurred.
link to strategy: Community TrustWhen problems occur, we aim to deal with them quickly, efficiently and robustly to ensure that our customers and consumers retain confidence in our products. Prevention of stock withdrawals is an absolute priority of Coca-Cola HBC and in 2013, we increased our focus on product quality, with good results.
peopleOur business growth depends on our ability to attract and retain sufficient numbers of qualified and experienced employees. In 2013, we were pleased to see that 90% of new GMs and 80% of new function heads were appointed internally. Additionally, we continued to focus strongly on employee engagement, which we increased across our key measures.
link to strategy: unparalleled talentOur focus on talent development ensures that the right people are in the right positions across our business. We also have in place a strong set of Values which underpin our corporate culture and make Coca-Cola HBC a great place to work. Our ongoing focus on employee engagement is supporting our Values and promoting operational excellence.
SafetyAdverse safety performance can affect our reputation as an employer. It also leads to lost-time incidents, which represent both a human and financial cost to the business. Our highest risks are related to road safety because of the amount of travel within our distribution infrastructure and because road safety in general is a challenge in some of our Emerging markets.
link to strategy: Our peopleOur continued focus on operational safety is successfully reducing lost-time incidents and fatalities, including road traffic accidents. Our initiatives to improve driver training and monitoring, combined with employee awareness campaigns, aim to create a world-class safety culture.
Enterprise Wide iT Systems All significant business processes within the group have a critical reliance on IT. A prolonged disruption or failure of IT services could seriously affect the operations of the Group.
link to strategy: Customer preference, Cost leadership The main business critical trading platform runs on a dual architecture landscape, with remote back-up hosting and redundancy in both system capacity and communication infrastructure. Disaster recovery to a remote data centre is in place in the unlikely event of a total loss of the primary data centre. Business continuity procedures for main business processes are in place to enable continued business trading in the event of an IT service disruption.
60 | Coca-Cola HBC 2013 Integrated Report
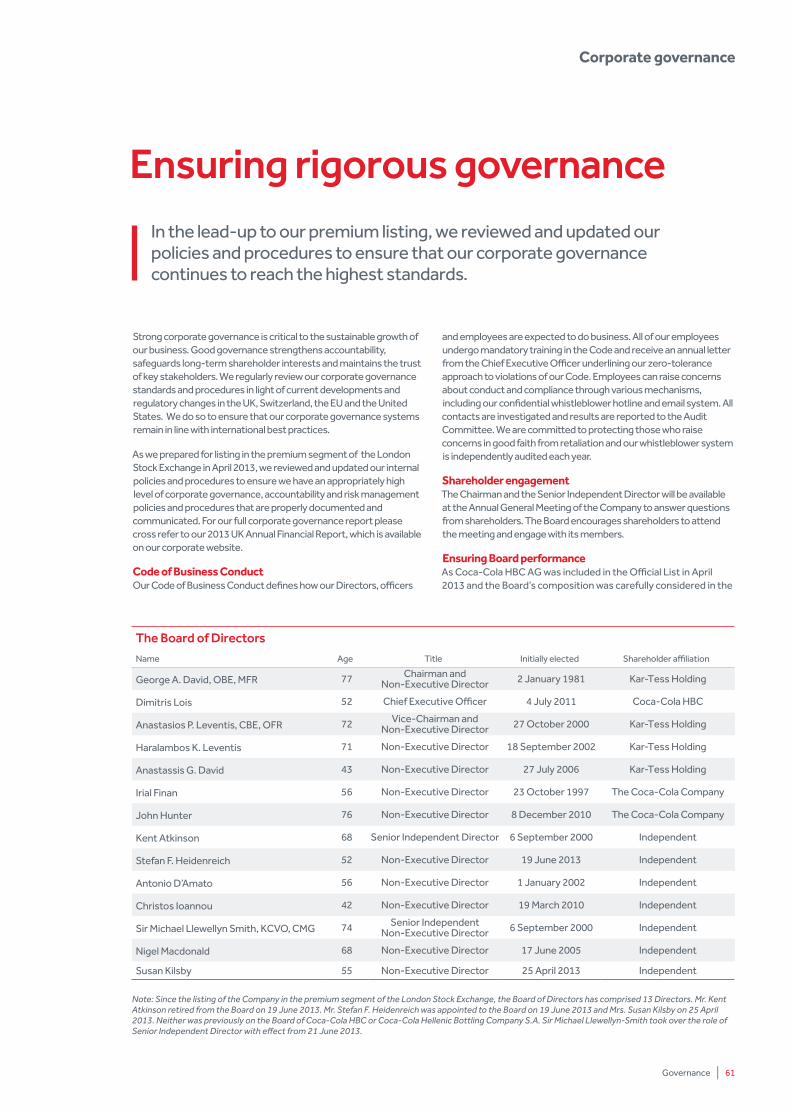
Governance | 61
Strong corporate governance is critical to the sustainable growth of our business. Good governance strengthens accountability, safeguards long-term shareholder interests and maintains the trust of key stakeholders. We regularly review our corporate governance standards and procedures in light of current developments and regulatory changes in the UK, Switzerland, the EU and the United States. We do so to ensure that our corporate governance systems remain in line with international best practices.
As we prepared for listing in the premium segment of the London Stock Exchange in April 2013, we reviewed and updated our internal policies and procedures to ensure we have an appropriately high level of corporate governance, accountability and risk management policies and procedures that are properly documented and communicated. For our full corporate governance report please cross refer to our 2013 UK Annual Financial Report, which is available on our corporate website.
Code of Business Conduct Our Code of Business Conduct defines how our Directors, officers
and employees are expected to do business. All of our employees undergo mandatory training in the Code and receive an annual letter from the Chief Executive Officer underlining our zero-tolerance approach to violations of our Code. Employees can raise concerns about conduct and compliance through various mechanisms, including our confidential whistleblower hotline and email system. All contacts are investigated and results are reported to the Audit Committee. We are committed to protecting those who raise concerns in good faith from retaliation and our whistleblower system is independently audited each year.
Shareholder engagement The Chairman and the Senior Independent Director will be available at the Annual General Meeting of the Company to answer questions from shareholders. The Board encourages shareholders to attend the meeting and engage with its members.
Ensuring Board performanceAs Coca-Cola HBC AG was included in the Official List in April 2013 and the Board’s composition was carefully considered in the
Ensuring rigorous governanceIn the lead-up to our premium listing, we reviewed and updated our policies and procedures to ensure that our corporate governance continues to reach the highest standards.
Corporate governance
The Board of Directors
Name Age Title Initially elected Shareholder affiliation
George A. David, OBE, MFR 77 Chairman and Non-Executive Director 2 January 1981 Kar-Tess Holding
Dimitris Lois 52 Chief Executive Officer 4 July 2011 Coca-Cola HBC
Anastasios P. Leventis, CBE, OFR 72 Vice-Chairman and Non-Executive Director 27 October 2000 Kar-Tess Holding
Haralambos K. Leventis 71 Non-Executive Director 18 September 2002 Kar-Tess Holding
Anastassis G. David 43 Non-Executive Director 27 July 2006 Kar-Tess Holding
Irial Finan 56 Non-Executive Director 23 October 1997 The Coca-Cola Company
John Hunter 76 Non-Executive Director 8 December 2010 The Coca-Cola Company
Kent Atkinson 68 Senior Independent Director 6 September 2000 Independent
Stefan F. Heidenreich 52 Non-Executive Director 19 June 2013 Independent
Antonio D’Amato 56 Non-Executive Director 1 January 2002 Independent
Christos Ioannou 42 Non-Executive Director 19 March 2010 Independent
Sir Michael Llewellyn Smith, KCVO, CMG 74 Senior Independent Non-Executive Director 6 September 2000 Independent
Nigel Macdonald 68 Non-Executive Director 17 June 2005 Independent
Susan Kilsby 55 Non-Executive Director 25 April 2013 Independent
Note: Since the listing of the Company in the premium segment of the London Stock Exchange, the Board of Directors has comprised 13 Directors. Mr. Kent Atkinson retired from the Board on 19 June 2013. Mr. Stefan F. Heidenreich was appointed to the Board on 19 June 2013 and Mrs. Susan Kilsby on 25 April 2013. Neither was previously on the Board of Coca-Cola HBC or Coca-Cola Hellenic Bottling Company S.A. Sir Michael Llewellyn-Smith took over the role of Senior Independent Director with effect from 21 June 2013.
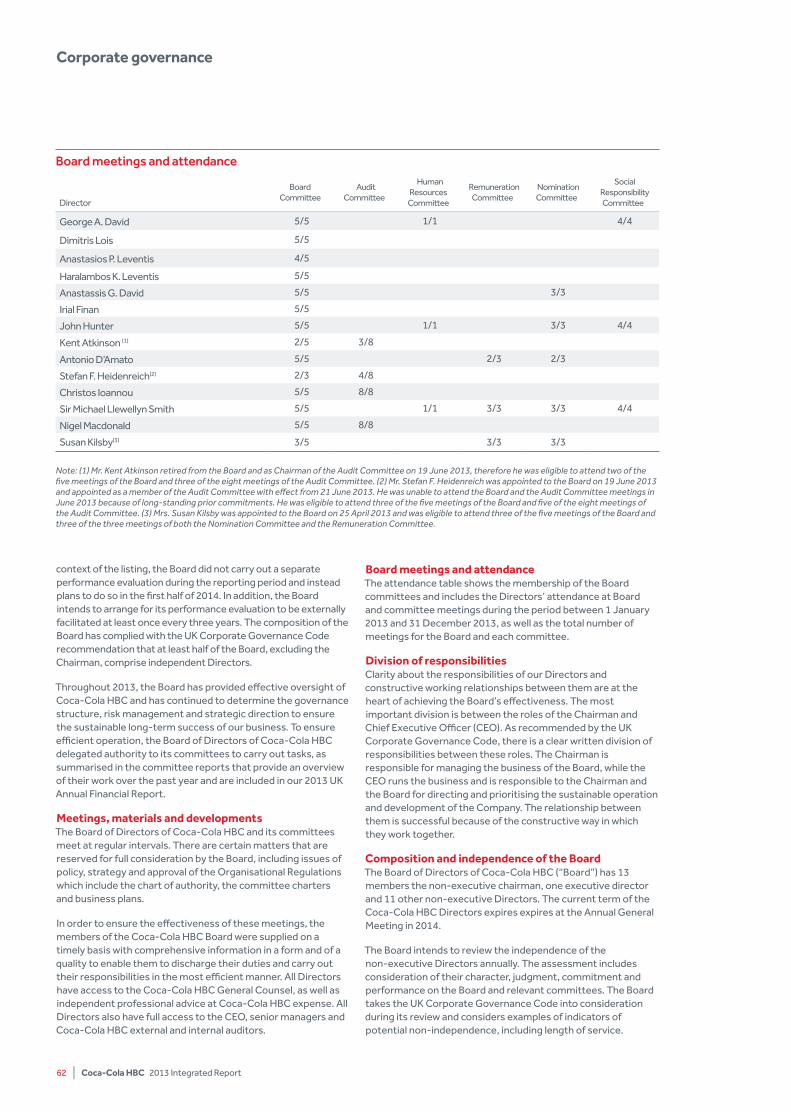
62 | Coca-Cola HBC 2013 Integrated Report
context of the listing, the Board did not carry out a separate performance evaluation during the reporting period and instead plans to do so in the first half of 2014. In addition, the Board intends to arrange for its performance evaluation to be externally facilitated at least once every three years. The composition of the Board has complied with the UK Corporate Governance Code recommendation that at least half of the Board, excluding the Chairman, comprise independent Directors.
Throughout 2013, the Board has provided effective oversight of Coca-Cola HBC and has continued to determine the governance structure, risk management and strategic direction to ensure the sustainable long-term success of our business. To ensure efficient operation, the Board of Directors of Coca-Cola HBC delegated authority to its committees to carry out tasks, as summarised in the committee reports that provide an overview of their work over the past year and are included in our 2013 UK Annual Financial Report.
Meetings, materials and developments The Board of Directors of Coca-Cola HBC and its committees meet at regular intervals. There are certain matters that are reserved for full consideration by the Board, including issues of policy, strategy and approval of the Organisational Regulations which include the chart of authority, the committee charters and business plans.
In order to ensure the effectiveness of these meetings, the members of the Coca-Cola HBC Board were supplied on a timely basis with comprehensive information in a form and of a quality to enable them to discharge their duties and carry out their responsibilities in the most efficient manner. All Directors have access to the Coca-Cola HBC General Counsel, as well as independent professional advice at Coca-Cola HBC expense. All Directors also have full access to the CEO, senior managers and Coca-Cola HBC external and internal auditors.
Board meetings and attendance The attendance table shows the membership of the Board committees and includes the Directors’ attendance at Board and committee meetings during the period between 1 January 2013 and 31 December 2013, as well as the total number of meetings for the Board and each committee.
Division of responsibilities Clarity about the responsibilities of our Directors and constructive working relationships between them are at the heart of achieving the Board’s effectiveness. The most important division is between the roles of the Chairman and Chief Executive Officer (CEO). As recommended by the UK Corporate Governance Code, there is a clear written division of responsibilities between these roles. The Chairman is responsible for managing the business of the Board, while the CEO runs the business and is responsible to the Chairman and the Board for directing and prioritising the sustainable operation and development of the Company. The relationship between them is successful because of the constructive way in which they work together.
Composition and independence of the BoardThe Board of Directors of Coca-Cola HBC (“Board”) has 13 members the non-executive chairman, one executive director and 11 other non-executive Directors. The current term of the Coca-Cola HBC Directors expires expires at the Annual General Meeting in 2014.
The Board intends to review the independence of the non-executive Directors annually. The assessment includes consideration of their character, judgment, commitment and performance on the Board and relevant committees. The Board takes the UK Corporate Governance Code into consideration during its review and considers examples of indicators of potential non-independence, including length of service.
Corporate governance
Board meetings and attendance
Director
Board Committee
AuditCommittee
HumanResources
Committee
RemunerationCommittee
NominationCommittee
Social ResponsibilityCommittee
George A. David 5/5 1/1 4/4
Dimitris Lois 5/5
Anastasios P. Leventis 4/5
Haralambos K. Leventis 5/5
Anastassis G. David 5/5 3/3
Irial Finan 5/5
John Hunter 5/5 1/1 3/3 4/4
Kent Atkinson (1) 2/5 3/8
Antonio D’Amato 5/5 2/3 2/3
Stefan F. Heidenreich(2) 2/3 4/8
Christos Ioannou 5/5 8/8
Sir Michael Llewellyn Smith 5/5 1/1 3/3 3/3 4/4
Nigel Macdonald 5/5 8/8
Susan Kilsby(3) 3/5 3/3 3/3
Note: (1) Mr. Kent Atkinson retired from the Board and as Chairman of the Audit Committee on 19 June 2013, therefore he was eligible to attend two of the five meetings of the Board and three of the eight meetings of the Audit Committee. (2) Mr. Stefan F. Heidenreich was appointed to the Board on 19 June 2013 and appointed as a member of the Audit Committee with effect from 21 June 2013. He was unable to attend the Board and the Audit Committee meetings in June 2013 because of long-standing prior commitments. He was eligible to attend three of the five meetings of the Board and five of the eight meetings of the Audit Committee. (3) Mrs. Susan Kilsby was appointed to the Board on 25 April 2013 and was eligible to attend three of the five meetings of the Board and three of the three meetings of both the Nomination Committee and the Remuneration Committee.
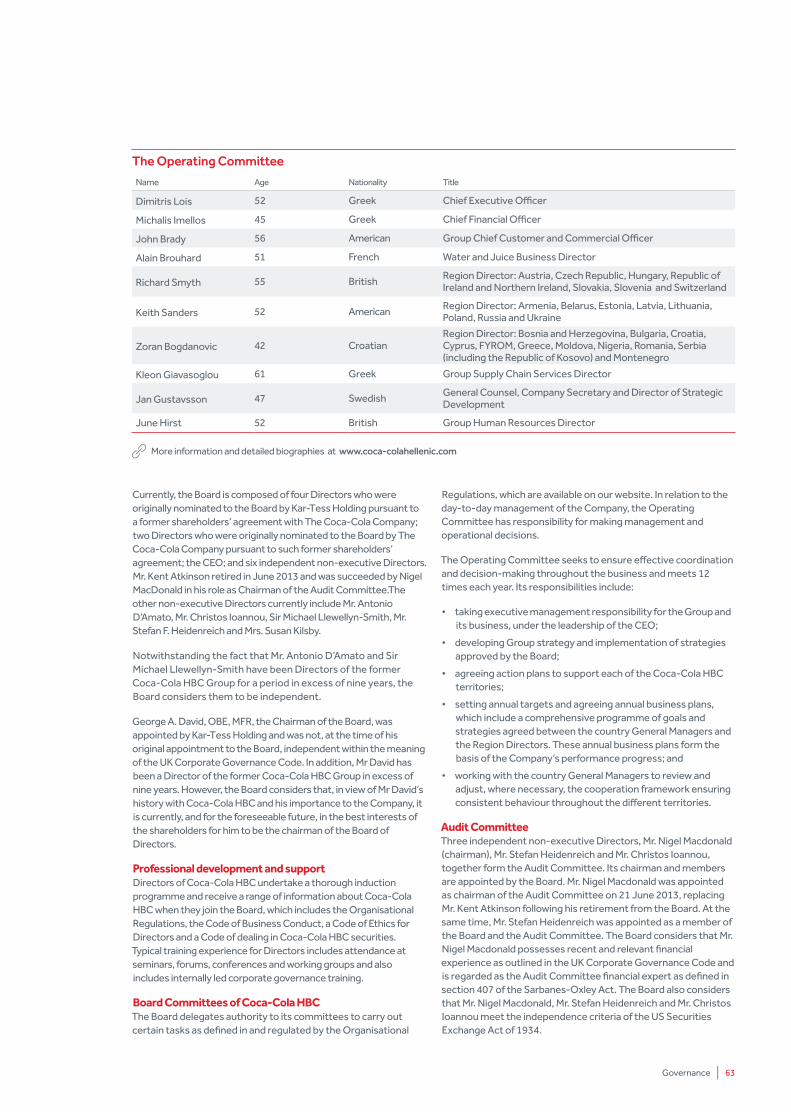
Governance | 63
Currently, the Board is composed of four Directors who were originally nominated to the Board by Kar-Tess Holding pursuant to a former shareholders’ agreement with The Coca-Cola Company; two Directors who were originally nominated to the Board by The Coca-Cola Company pursuant to such former shareholders’ agreement; the CEO; and six independent non-executive Directors. Mr. Kent Atkinson retired in June 2013 and was succeeded by Nigel MacDonald in his role as Chairman of the Audit Committee.The other non-executive Directors currently include Mr. Antonio D’Amato, Mr. Christos Ioannou, Sir Michael Llewellyn-Smith, Mr. Stefan F. Heidenreich and Mrs. Susan Kilsby.
Notwithstanding the fact that Mr. Antonio D’Amato and Sir Michael Llewellyn-Smith have been Directors of the former Coca-Cola HBC Group for a period in excess of nine years, the Board considers them to be independent.
George A. David, OBE, MFR, the Chairman of the Board, was appointed by Kar-Tess Holding and was not, at the time of his original appointment to the Board, independent within the meaning of the UK Corporate Governance Code. In addition, Mr David has been a Director of the former Coca-Cola HBC Group in excess of nine years. However, the Board considers that, in view of Mr David’s history with Coca-Cola HBC and his importance to the Company, it is currently, and for the foreseeable future, in the best interests of the shareholders for him to be the chairman of the Board of Directors.
professional development and support Directors of Coca-Cola HBC undertake a thorough induction programme and receive a range of information about Coca-Cola HBC when they join the Board, which includes the Organisational Regulations, the Code of Business Conduct, a Code of Ethics for Directors and a Code of dealing in Coca-Cola HBC securities. Typical training experience for Directors includes attendance at seminars, forums, conferences and working groups and also includes internally led corporate governance training.
Board Committees of Coca-Cola HBC The Board delegates authority to its committees to carry out certain tasks as defined in and regulated by the Organisational
Regulations, which are available on our website. In relation to the day-to-day management of the Company, the Operating Committee has responsibility for making management and operational decisions.
The Operating Committee seeks to ensure effective coordination and decision-making throughout the business and meets 12 times each year. Its responsibilities include:
• taking executive management responsibility for the Group and its business, under the leadership of the CEO;
• developing Group strategy and implementation of strategies approved by the Board;
• agreeing action plans to support each of the Coca-Cola HBC territories;
• setting annual targets and agreeing annual business plans, which include a comprehensive programme of goals and strategies agreed between the country General Managers and the Region Directors. These annual business plans form the basis of the Company’s performance progress; and
• working with the country General Managers to review and adjust, where necessary, the cooperation framework ensuring consistent behaviour throughout the different territories.
Audit Committee Three independent non-executive Directors, Mr. Nigel Macdonald (chairman), Mr. Stefan Heidenreich and Mr. Christos Ioannou, together form the Audit Committee. Its chairman and members are appointed by the Board. Mr. Nigel Macdonald was appointed as chairman of the Audit Committee on 21 June 2013, replacing Mr. Kent Atkinson following his retirement from the Board. At the same time, Mr. Stefan Heidenreich was appointed as a member of the Board and the Audit Committee. The Board considers that Mr. Nigel Macdonald possesses recent and relevant financial experience as outlined in the UK Corporate Governance Code and is regarded as the Audit Committee financial expert as defined in section 407 of the Sarbanes-Oxley Act. The Board also considers that Mr. Nigel Macdonald, Mr. Stefan Heidenreich and Mr. Christos Ioannou meet the independence criteria of the US Securities Exchange Act of 1934.
The Operating Committee Name Age Nationality Title
Dimitris Lois 52 Greek Chief Executive Officer
Michalis Imellos 45 Greek Chief Financial Officer
John Brady 56 American Group Chief Customer and Commercial Officer
Alain Brouhard 51 French Water and Juice Business Director
Richard Smyth 55 British Region Director: Austria, Czech Republic, Hungary, Republic of Ireland and Northern Ireland, Slovakia, Slovenia and Switzerland
Keith Sanders 52 American Region Director: Armenia, Belarus, Estonia, Latvia, Lithuania, Poland, Russia and Ukraine
Zoran Bogdanovic 42 CroatianRegion Director: Bosnia and Herzegovina, Bulgaria, Croatia, Cyprus, FYROM, Greece, Moldova, Nigeria, Romania, Serbia (including the Republic of Kosovo) and Montenegro
Kleon Giavasoglou 61 Greek Group Supply Chain Services Director
Jan Gustavsson 47 Swedish General Counsel, Company Secretary and Director of Strategic Development
June Hirst 52 British Group Human Resources Director
More information and detailed biographies at www.coca-colahellenic.com
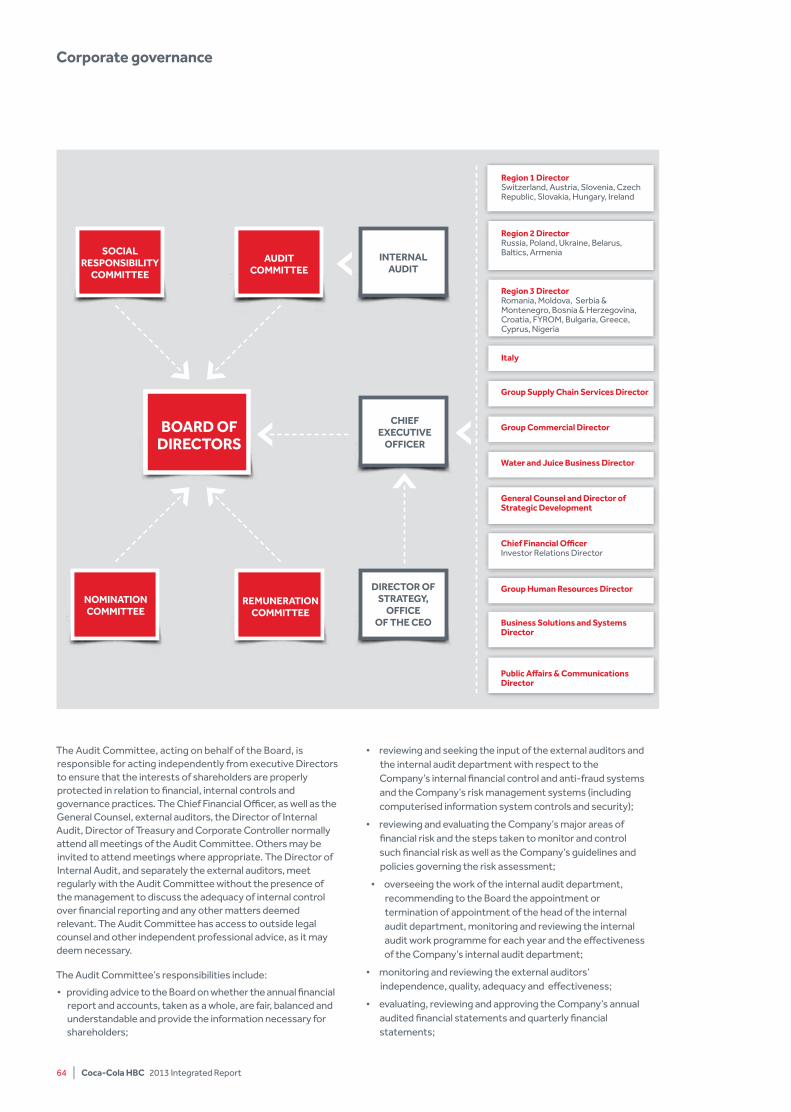
Corporate governance
The Audit Committee, acting on behalf of the Board, is responsible for acting independently from executive Directors to ensure that the interests of shareholders are properly protected in relation to financial, internal controls and governance practices. The Chief Financial Officer, as well as the General Counsel, external auditors, the Director of Internal Audit, Director of Treasury and Corporate Controller normally attend all meetings of the Audit Committee. Others may be invited to attend meetings where appropriate. The Director of Internal Audit, and separately the external auditors, meet regularly with the Audit Committee without the presence of the management to discuss the adequacy of internal control over financial reporting and any other matters deemed relevant. The Audit Committee has access to outside legal counsel and other independent professional advice, as it may deem necessary.
The Audit Committee’s responsibilities include:
• providing advice to the Board on whether the annual financial report and accounts, taken as a whole, are fair, balanced and understandable and provide the information necessary for shareholders;
• reviewing and seeking the input of the external auditors and the internal audit department with respect to the Company’s internal financial control and anti-fraud systems and the Company’s risk management systems (including computerised information system controls and security);
• reviewing and evaluating the Company’s major areas of financial risk and the steps taken to monitor and control such financial risk as well as the Company’s guidelines and policies governing the risk assessment;
• overseeing the work of the internal audit department, recommending to the Board the appointment or termination of appointment of the head of the internal audit department, monitoring and reviewing the internal audit work programme for each year and the effectiveness of the Company’s internal audit department;
• monitoring and reviewing the external auditors’ independence, quality, adequacy and effectiveness;
• evaluating, reviewing and approving the Company’s annual audited financial statements and quarterly financial statements;
64 | Coca-Cola HBC 2013 Integrated Report
Region 1 DirectorSwitzerland, Austria, Slovenia, Czech Republic, Slovakia, Hungary, Ireland
Region 2 Director Russia, Poland, Ukraine, Belarus, Baltics, Armenia
Region 3 DirectorRomania, Moldova, Serbia & Montenegro, Bosnia & Herzegovina, Croatia, FYROM, Bulgaria, Greece, Cyprus, Nigeria
italy
Group Supply Chain Services Director
Group Commercial Director
Water and Juice Business Director
General Counsel and Director of Strategic Development
Chief Financial OfficerInvestor Relations Director
Group Human Resources Director
public Affairs & Communications Director
Business Solutions and Systems Director
BOARD OF DiRECTORS
NOMiNATiON COMMiTTEE
REMuNERATiON COMMiTTEE
AuDiTCOMMiTTEE
CHiEF ExECuTiVE
OFFiCER
iNTERNAl AuDiT
DiRECTOR OF STRATEGy,
OFFiCE OF THE CEO
SOCiAl RESpONSiBiliTy
COMMiTTEE
Governance | 65
• evaluating, reviewing and approving the Company’s earnings press releases, financial information disclosure and earnings guidance provided to analysts and rating agencies, including the narrative parts of the Company’s financial reports;
• appointing the members of the Disclosure Committee, overseeing the work of the Disclosure Committee, enacting and amending its charter, if needed, and reviewing the preparation of the Company’s interim reports, earnings releases and annual reports as provided in the disclosure controls and procedures (as issued by the disclosure committee from time to time), as well as participating in the periodic evaluation of such disclosure controls and procedures;
• considering any other reports or communications (and management’s and/or the internal audit department’s responses thereto) submitted by the external auditors;
• administering and, in conjunction with the Board, enforcing the Code of Business Conduct and Code of Ethics for senior officers and Directors; and
• monitoring, in conjunction with Coca-Cola HBC AG’s General Counsel, the Company’s compliance with legal and regulatory requirements.
The Audit Committee met eight times during 2013 and discharged its responsibilities as they are defined in its written charter. Accordingly, the Audit Committee has been engaged in ensuring that appropriate standards of governance, reporting and compliance are being met and the committee reports its activities and makes recommendations, as it considers appropriate, to the Board.
performance reporting Reports on the annual performance and prospects of Coca-Cola HBC Group will be presented in the Annual Report and in the Form 20-F filed annually with the US Securities and Exchange Commission (SEC). The Coca-Cola HBC Group also prepares a half-yearly financial report on the performance of the Group during the first six months of the financial year. Interim financial information is also released, on a quarterly basis, to the stock exchanges on which Coca-Cola HBC is listed and to the financial press. Internally, the financial results and key performance indicators of Coca-Cola HBC are circulated and reviewed by senior management on a monthly basis. This information includes comparisons against business plans, forecasts and performance during the previous year. The Board receives updates on performance during each meeting as well as a monthly report on Coca-Cola HBC business and financial performance.
internal audit and control The internal audit function monitors the internal financial control system across all the territories in which the Group operates and reports to management and the Audit Committee on its findings. The work of the internal audit function is focused on the areas of greatest risk to the Group, as determined by using a risk-based approach to audit planning. As part of the Company’s commitment to maintain and strengthen best practices in corporate governance matters, it consistently seeks to enhance its internal control environment and risk management capability across the organisation.
The internal audit department of Coca-Cola HBC reports directly to the Audit Committee, which reviews and approves
the internal audit plan for each year. The internal audit department consists of 21 full-time internal staff covering a range of disciplines and business expertise. The function of the internal audit department is to confirm the maintenance and effectiveness of the Group’s internal controls to the Board. For this purpose, the Director of Internal Audit makes quarterly presentations to the Audit Committee. The Director of Internal Audit meets regularly with the Audit Committee without the presence of Group management.
The internal audit function prepares audit reports and recommendations following each audit and appropriate measures are then taken to implement such recommendations. Status reports on management’s action plans are provided to the Audit Committee and the Board on a biannual basis. The CEO, along with Regional and Country Managers, the Chief Financial Officer, General Counsel and Corporate Controller each receive a copy of these reports. The internal audit function is also responsible for the oversight and monitoring of compliance with the Sarbanes-Oxley Act and its provisions regarding internal control over financial reporting.
Nomination Committee The members of the Nomination Committee are Sir Michael Llewellyn Smith, Mr. Anastassis G. David, Mr. John Hunter, Mr. Antonio D’Amato and Mrs. Susan Kilsby. In accordance with the UK Corporate Governance Code, the majority of the Nomination Committee members are independent non-executive Directors and the Nomination Committee is chaired by Sir Michael Llewellyn Smith, the Senior Independent Director.
The function of the Nomination Committee is to support the Board in fulfilling its duties to conduct a self-assessment, to establish and maintain a process for appointing new Board members and to manage, in consultation with the Board’s Chairman, the succession of the CEO. The Nomination Committee’s responsibilities are posted on our website and mainly include:
• reviewing the size and composition of the Board;
• identifying and nominating new members to the Board;
• developing, maintaining and reviewing, in consultation with the Chairman of the Board, the principles and criteria regarding the recruitment and nomination of new members of the Board and committee members and proposing them for approval to the Board;
• reviewing and proposing, in consultation with the Chairman, new candidates for the Board to be recommended for election by the general meeting;
• planning and managing, in consultation with the Chairman, a Board membership succession plan;
• setting the criteria for, and overseeing the annual assessment of, the performance and effectiveness of each member of the Board, each Board committee and the Operating Committee;
• conducting an annual assessment of the performance and effectiveness of the Board and reporting to the Board conclusions and recommendations;
• ensuring effective succession planning and talent development, including the succession of the CEO;
• overseeing, in consultation with the CEO, the succession at the Operating Committee level;
• overseeing the talent management framework for the
Corporate governance
Company to ensure that there is continuous development of talent for key roles;
• establishing the principles governing the human resources policy of the Company, which will guide management decision making and action; and
• approving the general terms of employment (except those relating to remuneration) for the executives of Coca-Cola HBC AG.
During the reporting period (and from its establishment on the listing of the Company on the Official List), the work of the Nomination Committee has included agreeing the process it would establish for the recruitment and nomination of new members to the Board, considering the talent management framework, agreeing the process for undertaking annual assessments of the Board and its committees and considering the Director induction process.
Remuneration Committee The Remuneration Committee consists of three independent non-executive Directors in accordance with the UK Corporate Governance Code: Sir Michael Llewellyn Smith (chairman), Mr. Antonio D’Amato and Mrs. Susan Kilsby.
The main tasks of the Remuneration Committee are to establish the compensation strategy for Coca-Cola HBC and to approve or make recommendations to the Board with regard to certain compensations for the Directors and senior management. The Remuneration Committee operates in accordance with a written charter which is available on our website.
The Remuneration Committee’s responsibilities are posted on our website and mainly include:
• establishing the compensation strategy for Coca-Cola HBC, determining and agreeing with the Board the framework or broad policy for the remuneration of the executives of Coca-Cola HBC;
• approving certain compensation items, including the total aggregate compensation for the non-executive Directors, compensation elements for the executives of Coca-Cola HBC (except for the CEO), Company-wide compensation and benefit plans and all non-cash obligations greater than €15,000 which are reportable by the employee as income;
• recommending to the Board the total individual compensation for the non-executive Directors; the implementation or modification of employee coverage for any benefit plan resulting in an increased annual cost of €5 million or more and compensation elements for the CEO (base salary and increases in base salary, annual incentive plan awards, stock option awards or any long-term incentive plan awards and other forms of compensation);
• conducting a review at least once every three years of the components and amount of the compensation of the members of the Board in relation to other similar companies;
• considering remuneration (including pension contribution and all other elements) of members of the Board of Directors on early termination and give recommendations to the Board; and
• establishing the general policies governing severance for the executives of the Group.
Disclosure CommitteeThe Disclosure Committee is comprised of the Chief Financial Officer, the General Counsel, the Director of Investor Relations and the Corporate Controller of Coca-Cola HBC.
Social Responsibility CommitteeThe Social Responsibility Committee comprises three non-executive Directors: Sir Michael Llewellyn Smith (chairman), Mr. George A. David and Mr. John Hunter. The Social Responsibility Committee ensures that Coca-Cola HBC has integrated sustainability into our growth strategy, ensuring that we create long-term stakeholder value by capturing opportunities and managing risks related to economic, social and environmental developments.
The CEO, the Director of Public Affairs and Communications and the Operational Sustainability Director normally attend meetings of the Social Responsibility Committee. The Social Responsibility Committee’s responsibilities are posted on our corporate website and mainly include:
• overseeing the development of sustainability policies, strategy and targets and the supervision of procedures and systems to ensure the achievement of Coca-Cola HBC’s social and environmental goals;
• establishing and overseeing the operation of a council responsible for developing and implementing policies and strategies to achieve Coca-Cola HBC’s social and environmental goals and ensuring Group-wide capabilities to execute such policies and strategies;
• oversee the development and supervision of procedures and systems to ensure the achievement of the Company’s social responsibility and environmental goals;
• ensure and oversee the Company’s communication to stakeholders of its social responsibility and environmental policies, goals and achievements, including the level of compliance with internationally accepted standards; and
• review the Company’s internal and external communication policies in relation to social responsibility programmes.
66 | Coca-Cola HBC 2013 Integrated Report
Governance | 67
Our remuneration programmes are designed to inspire and reward excellence which, in turn, increases shareholder value. We ensure that we reward our executives appropriately for their contribution to our operational and financial performance. We periodically review our executive remuneration policy to ensure that it remains fair and equitable, encourages strong performance and contributes to our business objectives. In light of significant Company developments during 2013, we conducted a comprehensive review of our remuneration policy and programmes in order to reflect the necessary changes required after the establishment of our new holding Company in Switzerland and our premium listing on the main market of the London Stock Exchange. Our Remuneration Report which is part of our 2013 UK Annual Financial Report and can be found on our corporate website, includes more detailed information on our Remuneration Policy and related items.
uK and Swiss regulationsThe UK Remuneration Reporting Regulations came into force in October 2013. As a Swiss Company, we are not specifically required to comply with the Remuneration Reporting Regulations. Nevertheless, we aim to provide information broadly in line with UK practice in order to assist investors in benchmarking us with our peer companies. We will therefore adhere to these regulations as far as it is practicable and compatible with mandatory Swiss laws and Company’s practice. In addition, the new Swiss Ordinance against Excessive Compensation in Listed Companies will, among other things, require us to establish a remuneration report in accordance with Swiss law in respect for the financial year 2014. We will comply with these regulations as soon as they become applicable and, where appropriate, even earlier.
Remuneration policy Our remuneration programmes must support our current business priorities and long-term strategy. The Remuneration Committee also ensures that our approach is competitive when compared to other multinational companies which are similar in terms of size, geographic spread and complexity. The most significant change in our remuneration policy in 2013 was the new Executive Compensation Policy for the CEO and members of the Operating Committee who were required to relocate to Switzerland. We adapted the Company’s international transfer policy and tax equalisation programme in order to compensate our senior executives for their relocation. Coca-Cola HBC Group links a significant proportion of remuneration for senior managers to our business performance. Through both short and long-term incentives, we reward effective management of business performance, as well as individual achievement. This ensures that the financial interests of senior management are aligned with those of Coca-Cola HBC Group shareholders.
Management incentive plan Coca-Cola HBC Group operates an annual cash incentive plan for all managers. In 2013, we amended two out of the four key
business indicators used to calculate management incentives. Previously, these indicators comprised: volume, earnings before interest, tax, depreciation and amortisation (EBITDA), net sales revenue as a percentage of operating expenses (OpEx) and receivables and inventory days. Starting in the 2014 MIP cycle, we will replace EBITDA with earnings before interest and tax (EBIT). We will also replace receivables and inventory days with total working capital days. We expect these changes to better align management’s performance with Coca-Cola HBC Group’s long-term objectives for EBIT growth and working capital management.
long-term incentive plan Middle and senior management, excluding the Operating Committee, participate in the Long-Term Incentive Plan (LTIP). This plan is designed to promote long-term sustainable growth with incentive pay-outs based on business performance against three-year objectives, which are set on an annual basis. Previously, performance was measured using three key indicators: volume market share, net sales revenue per unit case and group return on invested capital (ROIC). For the 2014-2016 LTIP, Coca-Cola HBC replaced Group ROIC with Group EBIT margin (EBIT as a percentage of net sales revenue) as the multiplier of the plan. We expect this change to further enable our management to align employees’ performance with Coca-Cola HBC Group strategic objectives.
Employee stock purchase planThe Employee Stock Purchase Plan is designed to be a long-term investment to encourage share ownership and to align interests of the employees with those of shareholders. Eligible employees participating in the Plan have the opportunity to contribute a percentage of their salary which is matched by the Company and used to acquire shares on behalf of the employee. Once vesting requirements have been fulfilled, the employee can access the matching shares.
Stock option plan Senior managers are eligible to participate in the Coca-Cola HBC Group Stock Option Plan. We view stock options as an integral long-term component of the total remuneration package of senior managers whose roles have a significant impact on the results of the business as a whole. Options are granted at an exercise price equal to the price of Company shares at close of trading on the London Stock Exchange on the day of grant. These options can be exercised for up to ten years from the date of grant and vest linearly over a three-year period. The Board of Directors approves the stock option award for the Chief Executive Officer, which is based on the recommendation of the Remuneration Committee. Other option awards are approved by the Remuneration Committee upon the recommendation of the Chief Executive Officer.
RemunerationIn Coca-Cola HBC, we aim to attract, motivate and retain high-calibre executives in order to achieve the Group’s business objectives.
Remuneration
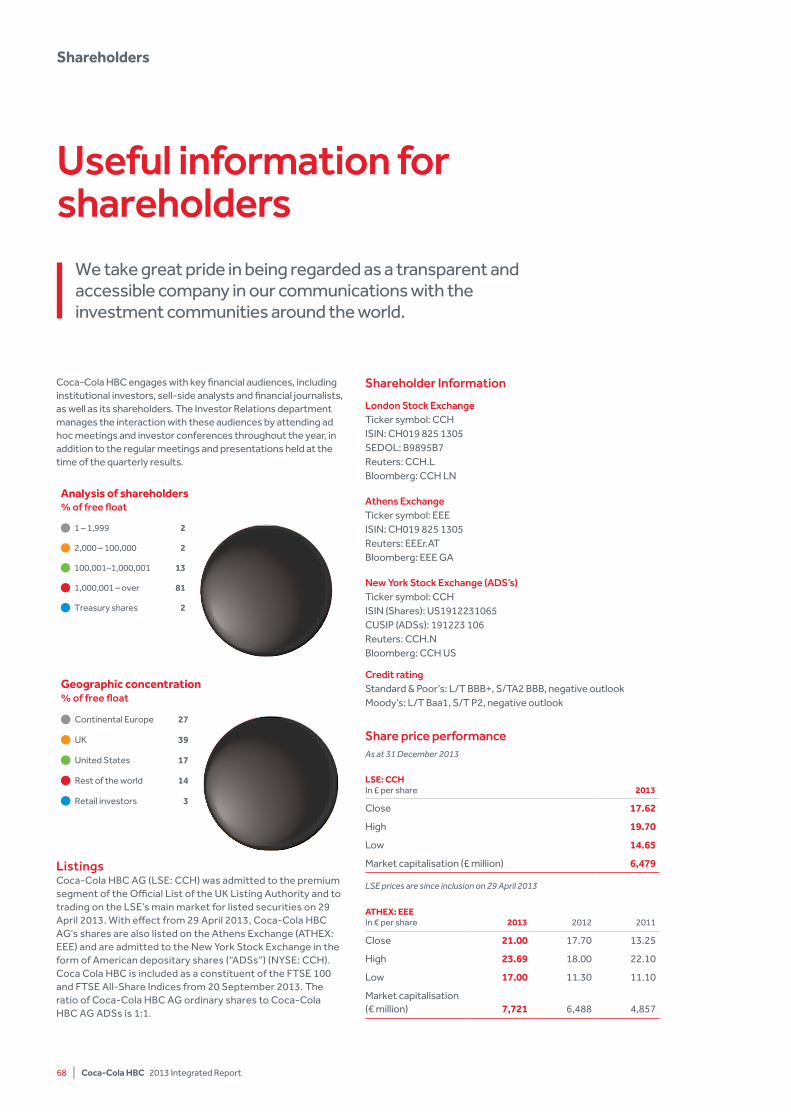
68 | Coca-Cola HBC 2013 Integrated Report
Coca-Cola HBC engages with key financial audiences, including institutional investors, sell-side analysts and financial journalists, as well as its shareholders. The Investor Relations department manages the interaction with these audiences by attending ad hoc meetings and investor conferences throughout the year, in addition to the regular meetings and presentations held at the time of the quarterly results.
Listings Coca-Cola HBC AG (LSE: CCH) was admitted to the premium segment of the Official List of the UK Listing Authority and to trading on the LSE’s main market for listed securities on 29 April 2013. With effect from 29 April 2013, Coca-Cola HBC AG’s shares are also listed on the Athens Exchange (ATHEX: EEE) and are admitted to the New York Stock Exchange in the form of American depositary shares (“ADSs”) (NYSE: CCH). Coca Cola HBC is included as a constituent of the FTSE 100 and FTSE All-Share Indices from 20 September 2013. The ratio of Coca-Cola HBC AG ordinary shares to Coca-Cola HBC AG ADSs is 1:1.
Shareholder Information
London Stock Exchange Ticker symbol: CCH ISIN: CH019 825 1305 SEDOL: B9895B7 Reuters: CCH.L Bloomberg: CCH LN
Athens ExchangeTicker symbol: EEE ISIN: CH019 825 1305 Reuters: EEEr.AT Bloomberg: EEE GA
new york Stock Exchange (ADS’s)Ticker symbol: CCH ISIN (Shares): US1912231065 CUSIP (ADSs): 191223 106 Reuters: CCH.N Bloomberg: CCH US
Credit rating Standard & Poor’s: L/T BBB+, S/TA2 BBB, negative outlook Moody’s: L/T Baa1, S/T P2, negative outlook
Share price performanceAs at 31 December 2013
lSE: CCHIn £ per share 2013
Close 17.62
High 19.70
Low 14.65
Market capitalisation (£ million) 6,479
LSE prices are since inclusion on 29 April 2013
ATHEx: EEEIn € per share 2013 2012 2011
Close 21.00 17.70 13.25
High 23.69 18.00 22.10
Low 17.00 11.30 11.10
Market capitalisation (€ million) 7,721 6,488 4,857
useful information for shareholders
We take great pride in being regarded as a transparent and accessible company in our communications with the investment communities around the world.
Analysis of shareholders% of free float
1 – 1,999 2
2,000 – 100,000 2
100,001–1,000,001 13
1,000,001 – over 81
Treasury shares 2
Continental Europe 27
UK 39
United States 17
Rest of the world 14
Retail investors 3
Geographic concentration% of free float
Shareholders
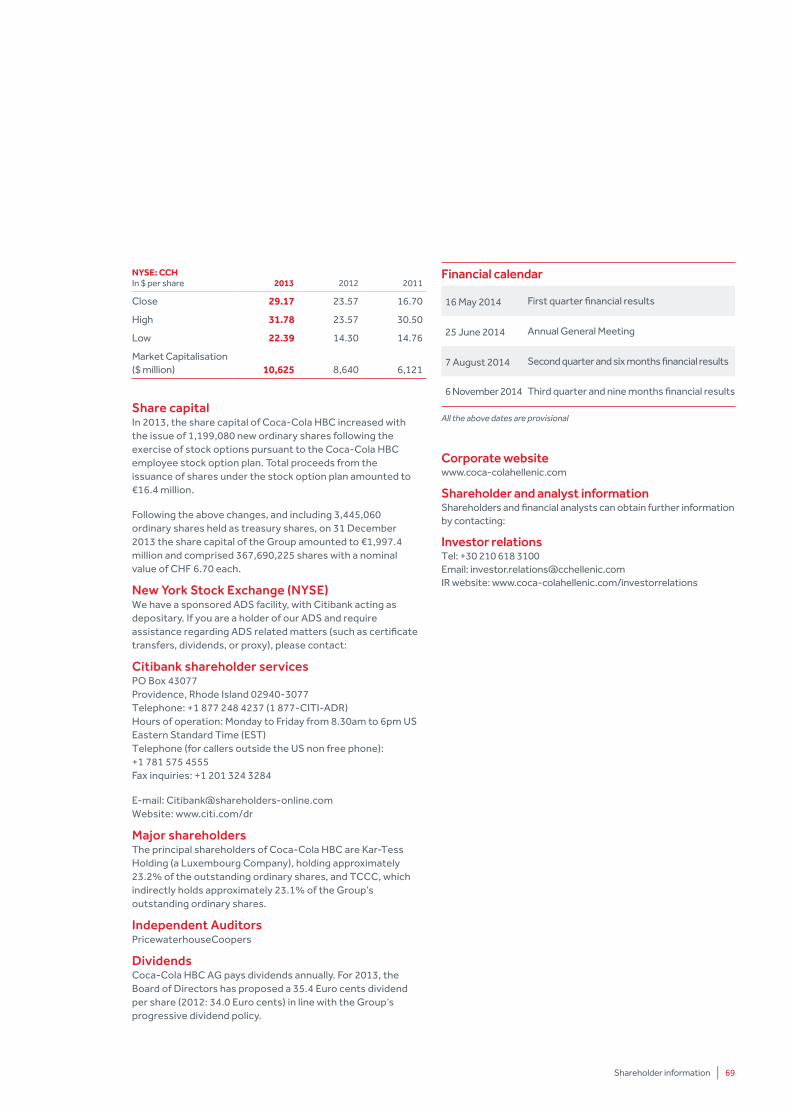
Shareholder information | 69
NySE: CCHIn $ per share 2013 2012 2011
Close 29.17 23.57 16.70
High 31.78 23.57 30.50
Low 22.39 14.30 14.76
Market Capitalisation ($ million) 10,625 8,640 6,121
Share capitalIn 2013, the share capital of Coca-Cola HBC increased with the issue of 1,199,080 new ordinary shares following the exercise of stock options pursuant to the Coca-Cola HBC employee stock option plan. Total proceeds from the issuance of shares under the stock option plan amounted to €16.4 million.
Following the above changes, and including 3,445,060 ordinary shares held as treasury shares, on 31 December 2013 the share capital of the Group amounted to €1,997.4 million and comprised 367,690,225 shares with a nominal value of CHF 6.70 each.
new york Stock Exchange (nySE)We have a sponsored ADS facility, with Citibank acting as depositary. If you are a holder of our ADS and require assistance regarding ADS related matters (such as certificate transfers, dividends, or proxy), please contact:
Citibank shareholder servicesPO Box 43077 Providence, Rhode Island 02940-3077 Telephone: +1 877 248 4237 (1 877-CITI-ADR) Hours of operation: Monday to Friday from 8.30am to 6pm US Eastern Standard Time (EST) Telephone (for callers outside the US non free phone): +1 781 575 4555 Fax inquiries: +1 201 324 3284
E-mail: [email protected] Website: www.citi.com/dr
Major shareholders The principal shareholders of Coca-Cola HBC are Kar-Tess Holding (a Luxembourg Company), holding approximately 23.2% of the outstanding ordinary shares, and TCCC, which indirectly holds approximately 23.1% of the Group’s outstanding ordinary shares.
Independent Auditors PricewaterhouseCoopers
DividendsCoca-Cola HBC AG pays dividends annually. For 2013, the Board of Directors has proposed a 35.4 Euro cents dividend per share (2012: 34.0 Euro cents) in line with the Group’s progressive dividend policy.
Corporate websitewww.coca-colahellenic.com
Shareholder and analyst informationShareholders and financial analysts can obtain further information by contacting:
Investor relationsTel: +30 210 618 3100 Email: [email protected] IR website: www.coca-colahellenic.com/investorrelations
Financial calendar
16 May 2014 First quarter financial results
25 June 2014 Annual General Meeting
7 August 2014 Second quarter and six months financial results
6 November 2014 Third quarter and nine months financial results
All the above dates are provisional
70 | Coca-Cola HBC 2013 Integrated Report
ASSuRANCE STATEMENTindependent verification report on the 2013 integrated Report
To the management and the stakeholders of Coca-Cola Hellenic Bottling Company AG:
denkstatt GmbH was commissioned by Coca-Cola Hellenic Bottling Company AG (herein-after referred to as “the Company”) to provide independent third-party assurance in accordance with the AA1000AS Assurance Standard for the printed and downloadable PDF versions of the Company’s 2013 Annual Integrated Report (hereinafter referred to as
“the Report”). We have reviewed all CSR-relevant content and data included in the Company’s Report for the year 2013. Financial data were not reviewed as part of this process. The assurance engagement covered the nature and extent of the Company’s incorporation of the principles of inclusivity, materiality and responsiveness for stakeholder dialogue contained in the AA1000 AccountAbility Principles Standard 2008. The application level of the guidelines of the Global Reporting Initiative (GRI G3) as well as Food Processing Sector Supplements was verified.
Management responsibilitiesThe Company’s management is responsible for preparing the Report and related website content, and the information and statements within it. They are responsible for identifying stakeholders and material issues, defining commitments with respect to sustainability performance, and for establishing and maintaining appropriate performance management and internal control systems from which reported information is derived.
The Company’s management is also responsible for establishing data collection and internal control systems to ensure reliable reporting, specifying acceptable reporting criteria and selecting data to be collected for the purposes of the Report. Its responsibilities also extend to preparing the Report in accordance with the GRI Sustainability Reporting Guidelines.
Assurance provider’s responsibilitiesOur responsibilities are:
• to express a conclusion and make recommendations on the nature and extent of the Company’s adherence to the AA1000APS principles; and
• to express a conclusion on the reliability of the information in the Report, and whether it is in accordance with the criteria of the GRI guidelines.
Our team of experts has extensive professional experience of assurance engagements related to non-financial information and sustainability management, making it qualified to conduct this independent assurance engagement. During 2013 we did not perform any tasks or services for the Company or other clients which would lead to a conflict of interest, nor were we responsible for the preparation of any part of the Report.
Scope, standards and criteria usedWe have fulfilled our responsibilities to provide appropriate assurance that the information in the Report is free of material misstatements. We planned and carried out our work based on the GRI G3 guidelines and in accordance with AA1000AS. We used the criteria in AA1000APS to perform a Type 2 engagement and to provide a moderate assurance
regarding the nature and extent of the Company’s adherence to the principles of inclusivity, materiality and responsiveness.
Methodology, approach, limitation and scope of workWe planned and carried out our work in order to obtain all the evidence, information and explanations that we considered necessary in relation to the above scope. Our work included the following procedures involving a range of evidence gathering activities:
• Gathering information and conducting interviews with members of the Executive Management, staff from the Sustainability Department and the Reporting Department, as well as various Group-level functional managers, regarding the Company’s adherence to the principles of inclusivity, materiality and responsiveness. This includes the commitment of the company’s management to the principles, the existence of systems and procedures to support adherence to the principles, and the embedding of the principles at a national level. Key topics of the interviews conducted at Group level were: product portfolio, risk management, environmental management, stakeholder panel, and CSR committee;
• Further interviews conducted at national headquarters in Belarus, Estonia, Moldova, Poland, Romania, Russia and Switzerland in order to guarantee the completeness of the information required for the audit;
• Gaining an understanding of the relevant documentation;
• Site visits to nine bottling plants, with a focus on emerging markets:
• Established markets: Bolligen (Switzerland) and Oricola (Italy),
• Developing markets: Alytus (Lithuania) and Radzymin (Poland),
• Emerging markets: Chisinau (Moldova), Dorna (Romania), Minsk (Belarus), Port Harcourt (Nigeria), and Volzhsky (Russia);
• Making enquiries and conducting spot checks to assess implementation of the Company’s policies (at plant, national and corporate level);
• Making enquiries and conducting spot checks with regard to selected documentation required to assess the current data collection systems and the procedures implemented to ensure reliable and consistent reporting from the plants to the corporate level;
• Verifying the GRI index in the Report to ensure consistency with the requirements of GRI level A+.
The scope of the assurance covered all of the information relevant to sustainability in the Report and focused on Company systems and activities during the reporting period. The following chapters were not covered in the sustainability verification process:
• Milestones in our history, operational and financial sustainability (p.44-53), remu-neration and shareholder information (p. 67-69).
positive developments• Strategic alignment at the national level: The business
planning of national headquarters was shown to be highly aligned with the Company strategy and KPIs.
Auditors’ validation
Auditors’ validation | 71
• Health and Safety Management: The different Company instruments such as toolbox talk, walk the talk, and near miss reporting exhibited a very high level of implementation with an increasing trend towards popularity.
• Environmental Data Management: The majority of the data and information presented were found to be accurate, and the KPI monitoring and reporting showed continuous improvement over the last few years.
• Efforts to strengthen the transfer of environmental know-how: Best-practice sharing with examples from Belarus. In addition, the initiative of Top 10 of water and Top 18 of energy activities reveals very good practice in continuous improvement processes for environmental manage-ment.
• Refresh 2020 – community trust initiative: Since consumer health (obesity and healthy products) exhibited the highest score in the materiality analysis, the initiative Refresh 2020 – a promotion for informed, responsible choices on the part of consumers – was a very strong and suitable response to the topic.
• Risk Management: The Company’s risks are very consciously managed. The implementation process and risk surveillance radar of national risks at the group level showed that there is a consistent process of review.
Findings and conclusion concerning adherence to the AA 1000 principles of inclusivity, Materiality, Responsiveness, and specified performance information.
inclusivity• Good stakeholder engagement was evident at the level of
national headquarters.
• A very high level of stakeholder mapping is carried out at the national headquarters level. A simple stakeholder mapping tool at the plant level could be useful to strengthen the mindset of stakeholder engagement.
• The advanced stakeholder management approach is further developed at the national level: By using a scorecard system called Sparkle, the national stakeholder engagement is regularly tracked and further developed to create a more consistent international standard.
• The findings of the assurance engagement process highlight the effectiveness of the systems and processes used for managing and reporting information on sustainability performance. Data sources are identifiable and verifiable, and the personnel responsible were able to reliably demonstrate the origins and interpretation of the data.
Materiality• Consumer health is the top priority within the materiality
analysis and is therefore consistently pursued via internal and external stakeholder activities. External activities such as the stakeholder dialogue on the topic of consumer health are examples of very good practice. The topic was discussed with multiple stakeholder representatives such as nutritionists, academics, government, consumer representatives, food manufacturers and other technical experts.
• For further improvement of the materiality assessment process, a higher level of standardisation is recommended.
• Premium spirits are not within the scope of this report, and
the same applies to the remote properties of CO2
calculations. If the reason for not reporting this information is because their impact is mentioned as not material, a precise internal definition of materiality in terms of premium spirits and the remote properties is recommended.
Responsiveness• Good stakeholder responsiveness at the national level in all
countries.
• There were best-practice examples for dialogue-orientated and targeted communications at the national level. For example, facebook sites for sustainability awareness building with young journalists and experts in the field of nutrition and environment were highly successful.
• Various good examples of national sustainability reporting are in place.
• The Company is involved in an intensive exchange with multiple stakeholder groups at group level. Their feedback is implemented in reporting, strategy, and risk management. However, if the significant inputs from the national stakeholder engagements were implemented into the sustainability strategy, it could add value to the entire group.
Additional conclusions and recommendations• There was a small improvement in the previous upward
trend for water and energy. Steps to help reverse these trends were implemented with the Top 18 energy activities and Top 10 water activities. The implementation of these steps is being tracked at group level.
• The company experienced a significant increase in the volume of premium spirits distributed during the reporting period. Guidelines for responsible sales and marketing should be developed, approved and applied to this sector of business.
• Long-term targets with respect to product mix, such as the average calorie content of the beverages sold, have not been communicated yet.
• The full implementation of GDA labelling has almost been achieved.
• A strategy on renewable energy sources could be a sustainable solution for decreasing the carbon footprint of local plants.
Vienna, 28 May 2014
denkstatt GmbHConsultancy for Sustainable Development
Willibald KaltenbrunnerLead AuditorManaging Director, denkstatt
72 | Coca-Cola HBC 2013 Integrated Report
Capital expenditure; CAPEXGross CAPEX is defined as payments for purchase of property, plant and equipment. Net CAPEX is defined as payments for purchase of property, plant and equipment less receipts from disposals of property, plant and equipment plus principal repayment of finance lease obligations.
Carbon emissionsEmissions of CO2 and other greenhouse gases from fuel combustion and electricity use in Coca-Cola HBC’s own operations (scope 1 and 2, mostly in bottling and distribution), in tonnes
Carbon footprintGlobal emissions of CO2 and other greenhouse gases from Coca-Cola HBC’s wider value chain (raw materials, product cooling, etc.)
CHPCombined heat and power plants
Coca-Cola HBCCoca-Cola HBC AG, and, as the context may require, its subsidiaries and joint ventures; also, the Group, the Company
Coca-Cola SystemThe Coca-Cola Company and its bottling partners
Cold drink equipmentA generic term encompassing point-of-sale equipment such as coolers (refrigerators), vending machines and post-mix machines
Comparable adjusted EBITDAWe define adjusted EBITDA as operating profit before deductions for depreciation and impairment of property, plant and equipment (included both in cost of goods sold and in operating expenses), amortisation and impairment of and adjustments to intangible assets, stock option compensation and other non-cash items, if any.
Comparable operating profitOperating profit (EBIT) refers to profit before tax excluding finance income / (costs) and share of results of equity method investments
ConsumerPerson who drinks Coca-Cola HBC products
CPM Complaints per million containers sold - a key performance indicator
CustomerRetail outlet, restaurant or other operation that sells or serves Coca-Cola HBC products directly to consumers
Energy use ratioThe KPI used by Coca-Cola HBC to measure energy consumption in the bottling plants, expressed in megajoules of energy consumed per litre of produced beverage (MJ/lpb)
FMCGFast moving consumer goods
Fragmented tradeKiosks, quick service restaurants (QSR), hotels, restaurants and cafes (HORECA)
Future consumptionA distribution channel where consumers buy multi-packs and larger packages from supermarkets and discounters which are not consumed on the spot
FyROMFormer Yugoslav Republic of Macedonia
GDPGross domestic product
GfKWe work with the company Growth for Knowledge (GfK) to track our customer satisfaction levels.
IFRSInternational Financial Reporting Standards of the International Accounting Standards Board
IIRCThe International Integrated Reporting Council, a global coalition of regulators, investors, companies, standard setters, the accounting profession and NGOs
Immediate consumptionA distribution channel where consumers buy chilled beverages in single-serve packages (typically 0.5 litre or smaller) and fountain products for immediate consumption, away from home
Inventory daysWe define inventory days as the average number of days an item remains in inventory before being sold using the following formula: average inventory ÷ cost of goods sold x 365.
IrelandThe Republic of Ireland and Northern Ireland
ItalyTerritory in Italy served by Coca-Cola HBC (excludes Sicily)
Joint value creation (JvC)An advanced programme and process to collaborate with customers in order to create shared value.
Litre of produced beverage (lpb): Unit of reference to show environmental performance relative to production volume
MarketWhen used in reference to geographic areas, a territory in which Coca-Cola HBC does business, often defined by national boundaries.
Modern tradeThe way of buying is shifting as consumers increase frequency in visits to stores but have smaller basket sizes which can cause higher volume but lower revenue.
nARTDNon-alcoholic ready-to-drink
OBPPCOccasion, Brand, Price, Package, Channel
Organised tradeLarge retailers (e.g. supermarkets, discounters, etc.)
PETPolyethylene terepthalate, a form of polyester used in the manufacturing of beverage bottles
Premium sparklingIncludes brand Coca-Cola, Fanta, Sprite, Schweppes, Tuborg and Kinley sparkling beverages
Ready-to-drink (RTD)Drinks that are pre-mixed and packaged, ready to be consumed immediately with no further preparation
Right Execution Daily (RED)Major Group-wide programme to ensure in-outlet excellence
Receivable days The average number of days it takes to collect the receivables using the following formula: average accounts receivables x net sales revenue x 365
SAP Wave 2A powerful software platform that enables us to standardise key business processes and systems
Serving237ml or 8oz of beverage, equivalent to 1/24 of a unit case
Shared servicesCentre to standardise and simplify key finance and human resources processes
Sparkling beveragesNon-alcoholic carbonated beverages containing flavourings and sweeteners, excluding, among others, waters and flavoured waters, juices and juice drinks, sports and energy drinks, teas and coffee
Still and water beveragesNon-alcoholic beverages without carbonation including, but not limited to, waters and flavoured waters, juices and juice drinks, sports and energy drinks, teas and coffee
Brand Coca-Cola productsIncludes Coca-Cola, Coca-Cola Zero and Coca-Cola Light brands
unit caseApproximately 5.678 litres or 24 servings, a typical volume measurement unit
un Global Compact (unGC)The world’s largest corporate citizenship initiative provides a framework for businesses to align strategies with its ten principles promoting labour rights, human rights, environmental protection and anti-corruption.
volume shareShare of total unit cases sold
value shareShare of total revenue
Waste ratio The KPI used by Coca-Cola HBC to measure waste generation in the bottling plant, expressed in grammes of waste generated per litre of produced beverage (g/lpb)
Waste recyclingThe KPI used by Coca-Cola HBC to measure the percentage of production waste at bottling plants that is recycled or recovered
Water footprintA measure of the impact of water use, in operations or beyond, as defined by the Water Footprint Network methodology
Water use ratioThe KPI used by Coca-Cola HBC to measure water use in the bottling plant, expressed in litres of water used per litre of produced beverage (l/lpb)
Glossary

Published by Coca-Cola HBC AG Turmstrasse 26, CH-6300 Zug, Switzerland
Recommended