Eindhoven University of Technology
MASTER
Drivers of customer retention in a software-as-a-service setting
Schermer, M.J.
Award date:2021
Link to publication
DisclaimerThis document contains a student thesis (bachelor's or master's), as authored by a student at Eindhoven University of Technology. Studenttheses are made available in the TU/e repository upon obtaining the required degree. The grade received is not published on the documentas presented in the repository. The required complexity or quality of research of student theses may vary by program, and the requiredminimum study period may vary in duration.
General rightsCopyright and moral rights for the publications made accessible in the public portal are retained by the authors and/or other copyright ownersand it is a condition of accessing publications that users recognise and abide by the legal requirements associated with these rights.
• Users may download and print one copy of any publication from the public portal for the purpose of private study or research. • You may not further distribute the material or use it for any profit-making activity or commercial gain

Drivers of CustomerRetention in a
Software-as-a-Servicesetting
Master Thesis
Maartje Schermer
Department of Industrial Engineering and Innovation SciencesInnovation, Technology Entrepreneurship and Marketing Group
In partial fulfillment of the requirements of the degree of:Master of Science in Innovation Management
Supervisors TU Eindhoven:Dr. S.E.C. Gelper
Dr. F. Langerak
Supervisors SAP Netherlands:J.T. Wiltschek
3rd version
Eindhoven, March 2021

Abstract
The rise of cloud managed services in the B2B software market is forcing software providers
to change their business model, adopting a model named Software-as-a-Service (SaaS). 20% of
customer churn is proven to be fatal for businesses using a SaaS model, shifting the focus to
customer success and retention. Despite the importance of customer retention in a SaaS-setting,
little to no research is conducted regarding the drivers of customer retention in a SaaS-setting. This
study attempts to close the gap in scientific literature by assessing drivers of customer retention in a
SaaS-context. The study analyzes a data set of 8,902 renewal opportunities between 2018 and 2020
by applying a logistic regression. Results show that the length of the customer relationship does
not affect the probability of renewal. The addition of other products to the customer portfolio
positively affects the probability of renewal. However, the magnitude of this effect differs per
product. The after-sales services can positively influence the retention levels by increasing the
overall service levels and strategically timing the service delivery in the final phase of the contract.
The study concludes that if SaaS-providers want to increase their retention levels, they should
focus on selling additional product to existing customers, increased frequency of service delivery
and especially focus on service frequency in the final phase of the contract.
ii Drivers of Customer Retention in a Software-as-a-Service setting

Executive summary
The rise of cloud managed services radically changed the enterprise application software market.
Software providers needed to change their business model and the format in which they offer
their products. The focus of the business models transformed from a product-focused offering
to a service-focused offering in which the products are used to sell these services. Traditional
up-front payments are replaced by subscription-based systems, allowing unsatisfied customers to
unsubscribe at any moment. Additionally, since the required investments of the customer at the
start of the contract disappeared, including placement of on-premise servers, customers can churn
more easily. Replacing churned customers leads to increased costs and decreasing profits, pushing
back the break-even point. Accordingly, customer retention is critical for the survival of software
providers in a Software-as-a-Service context. Drivers of customer retention have been extensively
researched, but not in a SaaS-context. Kocaman et al. (2020) show that these drivers might
have different effects in a SaaS-setting. Therefore, the drives and especially their effects cannot
be generalized to the SaaS setting and need to be complemented with additional research. This
research will attempt to close this gap in the scientific literature by exploring drivers of customer
retention in a Software-as-a-Service setting.
The length of the relationship is considered as the first driver of customer retention. It is
hypothesized that the length of the relationship will have a positive effect on the probability of
renewal. The first phase of the relationship between the provider and customer is surrounded
with a lot of uncertainty from both sides. The needs and expectations are not yet clear. Frequent
interactions between the provider and customer during their relationship help mitigate these un-
certainties, and establish a better understanding of the needs, preferences and expectations. The
provider can improve and customize their services to the customers based on these understandings.
Additionally, customers having a long successful history with the provider establish cumulative
build up of positive experiences, outweighing the disadvantages of adverse and new information,
resulting in a more robust and stable relationship with an improved likelihood of remaining with
the service provider for a long duration in time. It is, therefore, hypothesized that the length of
the customer-provider relationship has a positive effect on the probability of renewal.
The second driver that is included is the breadth of the relationship. The breadth indicates
Drivers of Customer Retention in a Software-as-a-Service setting iii

the number of products from the same provider that a customer has included in their portfolio,
defined as the cross-buying effect. This mechanism is based on the switching costs, which states
that if customers use more products from one provider, they build up switching costs and thus
decrease the probability of churning. Additionally, the customer satisfaction based on experiences
with other products by the same provider influences the probability of renewal. Customers are
more prone to weigh overall experiences when the renewal decisions are made. Therefore, it
is hypothesized that the breadth of the relationship will positively influence the probability of
renewal, however there will be a difference between the products.
The final driver that is included in this analysis are the after-sales services. This is not a
traditional driver, but the new business model of the providers is centered around the service
delivery. According to previous research by Jaiswal and Niraj (2011) interactions between the
customer and provider can prove insights in the future behaviour of the customer. Therefore, this
driver is included to assess the relationship between the delivery of the service and the probability
of renewal. A high degree of interactions between provider and customer imply a mature and
strong relationship, which in turn will increase the probability of renewal. Therefore, the first part
of the hypothesis for the after-sales services is as following: the interactions between provider and
customer have a positive effect on the probability of renewal. Additionally, previous research has
shown that the timing of these interactions can influence the impact on the probability of renewal.
Customers are more likely to renew their contract if they had a positive experience in the final
year of the contract. Therefore, the second part of the hypothesis of the after-sales services is that
in the final phase of the contract after-sales services will have a bigger impact on the probability
of renewal.
The data was gathered from multiple internal tools from SAP. The data set included all renewal
cases from 2018 to 2020, resulting in a sample size of 8,902 cases. The length of the relationship
is operationalised in number of days since the start of the first contract between the customer and
SAP. This also includes the contracts of the on-premise systems. The breadth of the relationship
is operationalised in threefold. The first variable is if the customer has any additional products
in their portfolio. The second variable is the number of additional products which the customer
includes in their portfolio. The third measure is a set of binary variables indicating which addi-
tional products they have in their portfolio. The choice has been made to include substitution
variables for the after-sales services. Therefore, three internal customer classification systems,
iv Drivers of Customer Retention in a Software-as-a-Service setting

namely Account Classification, IAC and ISS, are used to analyse the overall interactions between
the provider and customer. To test the effect of the timing of the service delivery two different
kinds of dedicated customer officers are included in the analysis. The first dedicated customer
officer is the regular customer officer. This customer officer is assigned to the customer from the
beginning of the contract and guides the customers through all the phases. The regular dedicated
customer officer pro-actively monitors the customer and their implemented solutions, and guides
the customers when necessary. The second customer officer is the dedicated renewal customer of-
ficer is assigned to the customer when they enter the final phase of their contract and negotiations
on the renewal decision start.
The results showed that the length of the relationship does not effect the probability of renewal,
and therefore we are rejecting the hypothesis. A possible explanation could be that the disruption
by a new technology, in this case cloud managed services, influences the effect of the customer-firm
relationship (Kocaman et al., 2020). The breadth of the relationship showed a positive effect on
the probability of renewal. The results show that the effect of customers expanding their solution
portfolio, i.e. subscribing to multiple products from the same provider, is bigger for the first
product compared to later additions. However, the more products added to the solution portfolio
the higher the probability of renewal, which is in line with the expectations based on the switching
costs. Nonetheless, the effect differs between the different products. Further research needs to be
conducted to fully understand the cause of these differences and if satisfaction is the source. The
results show that the after-sales services have a positive effect on the probability of renewal. In
other words, the more interactions between the customer and provider the higher the probability
of renewal. The results of the timing of the interactions and the probability of renewal are also
in line with the expectation. The addition of dedicated renewal customer officers results in an
increase in the probability of renewal. Indicating that service interactions between customer and
provider in the final phases of the contract have a positive effect on the probability of renewal.
If a SaaS-provider wants to increase their retention levels, they should focus on the following:
due to insignificant effect of the length of the relationship, it is stated that the length of the rela-
tionship does not affect the retention levels. Therefore, management should focus that long-term
customers get the same attention as relatively new customers. It is also helpful to broaden the re-
lationship with the customer. Switching costs will increase if customers use multiple products from
the same provider. Therefore, management should focus on selling multiple products to existing
Drivers of Customer Retention in a Software-as-a-Service setting v

customers. However, keep in mind that not all products have the same effect on the probability
of renewal, but overall, the addition of other products to the customer portfolio will increase the
probability of retaining the customer. The conclusion is that the amount of interactions between
the provider and customer matter. These interactions are a means of establishing a strong and
mature relationship with these customers and help them optimize the use of their products based
on their needs and preferences. Especially in the final phase of the contract it is recommended to
increase the amount of interactions and guide the customers through the renewal process. This
will result in higher retention rates.
vi Drivers of Customer Retention in a Software-as-a-Service setting

Preface
This master thesis is written for the master Innovation Management at the Eindhoven Univer-
sity of Technology. The research concerns customer retention in a Software as a Service setting.
The study was conducted at SAP Netherlands.
First, I would like to start to thank all the Dutch SAP employees. They were always enthusiastic
and willing to help and supported me with my questions.
Secondly, a special thanks to dr. S.E.C. Gelper from the Eindhoven University of Technology
and ir. J.T. Wiltschek PDEng from SAP who guided me through this process. Their feedback
and support helped me to create the report you see in front of you.
Maartje Schermer
’s-Hertogenbosch
Wednesday 17th March, 2021
Drivers of Customer Retention in a Software-as-a-Service setting vii

Contents
Contents viii
1 Introduction 1
1.1 Research Questions . . . . . . . . . . . . . . . . . . . . . . . . . . . . . . . . . . . . 2
2 Theoretical Background 5
2.1 Software-as-a-Service . . . . . . . . . . . . . . . . . . . . . . . . . . . . . . . . . . . 5
2.2 Customer Retention . . . . . . . . . . . . . . . . . . . . . . . . . . . . . . . . . . . 5
3 Hypothesis 7
3.1 Length of the Relationship . . . . . . . . . . . . . . . . . . . . . . . . . . . . . . . . 7
3.2 Breadth of the Relationship . . . . . . . . . . . . . . . . . . . . . . . . . . . . . . . 7
3.3 After Sales Services . . . . . . . . . . . . . . . . . . . . . . . . . . . . . . . . . . . . 8
4 Methodology 10
4.1 Method . . . . . . . . . . . . . . . . . . . . . . . . . . . . . . . . . . . . . . . . . . 10
4.2 Measurement . . . . . . . . . . . . . . . . . . . . . . . . . . . . . . . . . . . . . . . 10
4.2.1 Length of the Relationship . . . . . . . . . . . . . . . . . . . . . . . . . . . 10
4.2.2 Breadth of the Relationship . . . . . . . . . . . . . . . . . . . . . . . . . . . 10
4.2.3 After-sales services . . . . . . . . . . . . . . . . . . . . . . . . . . . . . . . . 11
4.3 Sample Description . . . . . . . . . . . . . . . . . . . . . . . . . . . . . . . . . . . . 13
5 Results 16
5.1 Model Development . . . . . . . . . . . . . . . . . . . . . . . . . . . . . . . . . . . 16
5.2 Drivers of Customer Retention . . . . . . . . . . . . . . . . . . . . . . . . . . . . . 18
5.2.1 Length of the Relationship . . . . . . . . . . . . . . . . . . . . . . . . . . . 18
5.2.2 Breadth of the Relationship . . . . . . . . . . . . . . . . . . . . . . . . . . . 20
5.2.3 After-Sales Services . . . . . . . . . . . . . . . . . . . . . . . . . . . . . . . 20
6 Conclusion 22
6.0.1 Length of the Relationship . . . . . . . . . . . . . . . . . . . . . . . . . . . 22
6.0.2 Breadth of the Relationship . . . . . . . . . . . . . . . . . . . . . . . . . . . 23
viii Drivers of Customer Retention in a Software-as-a-Service setting

Contents
6.0.3 After-Sales Services . . . . . . . . . . . . . . . . . . . . . . . . . . . . . . . 23
6.1 Managerial Implications . . . . . . . . . . . . . . . . . . . . . . . . . . . . . . . . . 24
6.2 Limitations and Directions for Future Research . . . . . . . . . . . . . . . . . . . . 24
Drivers of Customer Retention in a Software-as-a-Service setting ix
List of Figures and Tables
Fig. 1.1 Conceptual Framework . . . . . . . . . . . . . . . . . . . . . . . . . . . . . . . . 4
Fig. 4.1 Account Classification . . . . . . . . . . . . . . . . . . . . . . . . . . . . . . . . . 11
Fig. 4.2 Internal Account Classification . . . . . . . . . . . . . . . . . . . . . . . . . . . . 12
Tab. 4.1 Descriptive Statistics - Continuous Variables . . . . . . . . . . . . . . . . . . . . 13
Fig. 4.3 Distribution of Data . . . . . . . . . . . . . . . . . . . . . . . . . . . . . . . . . . 14
Tab. 4.2 Descriptive Statistics - Discrete Variables . . . . . . . . . . . . . . . . . . . . . . 15
Tab. 4.3 Difference in Retention Level for Additional Products (t-test) . . . . . . . . . . 15
Tab. 5.1 Model fit . . . . . . . . . . . . . . . . . . . . . . . . . . . . . . . . . . . . . . . . 16
Tab. 5.2 Measurement Fit of After-Sales . . . . . . . . . . . . . . . . . . . . . . . . . . . 16
Tab. 5.3 Estimates of Final Model . . . . . . . . . . . . . . . . . . . . . . . . . . . . . . . 17
Fig. 5.1 Visualisation of Effects of Length of the Relationship . . . . . . . . . . . . . . . 18
Fig. 5.2 Visualisation of Effects of Breadth of the Relationship . . . . . . . . . . . . . . . 19
Fig. 5.3 Visualisation of Effects of After-Sales Services . . . . . . . . . . . . . . . . . . . 21
x Drivers of Customer Retention in a Software-as-a-Service setting

Chapter 1: Introduction
The worldwide Software-as-a-Service (SaaS) revenue is expected to rise 37% from 2019, reaching
140.6 billion U.S. dollars in 2022 (Gartner, 2020). Gartner (2020) stated: “The cloud managed
service landscape is becoming increasingly sophisticated and competitive. In fact, by 2022, up to
60% of organizations will use an external service provider’s cloud managed service offering, which
is double the percentage of organizations from 2018”. Therefore, the effect of transitioning from
traditional on-premise software solutions to external cloud management is of interest.
To accommodate the changing market environment, software providers need to modify their
business model and the format in which they offer their products to the customers. Whereas the
on-premise software was sold as a lifetime subscription, the cloud-based offerings are provided
based on a monthly fee (Ma, 2007). There are two radical paradigm shifts necessary within the
software providers to progress from the traditional to a SaaS business model (Satyanarayana,
2012). The first shift is the adoption of a service-based mentality. The providers are not only
accountable for the development of the software but also the entire service supporting the soft-
ware. This includes training, hosting, implementation, maintenance, support, upgrades, security
(Satyanarayana, 2012). The providers should turn their products into tools for their sales repres-
entatives to sell services (Makila et al., 2010). The second radical shift discussed by Satyanarayana
(2012) is that the SaaS revenue model is more dependent on the success of the customer. The new
business model lowers the switching costs for customers, thus making it easier for customers to
switch from software vendor (Ojala, 2012). Therefore, customer satisfaction and continuance are
more important than before (Lah & Wood, 2016; Satyanarayana, 2012). Additionally, replacing
churned customers by acquiring new customers leads to increased costs (e.g., marketing and sales),
and delays break-even points and profits (Lah & Wood, 2016). As a result, customer retention is
proven more vital for the providers survival in the long run. Despite the growing importance of
retention in the B2B software market, little attention has been directed towards the antecedents
of retention in the Software as a Service setting (Walther et al., 2013)
An example of a software provider that made this shift is SAP. SAP is a leading company
in enterprise application software, originally known for its Enterprise Resource Planning (ERP)
software (SAP SE, 2020). SAP evolved over the years in a market leader in end-to-end enterprise
Drivers of Customer Retention in a Software-as-a-Service setting 1

CHAPTER 1. INTRODUCTION
application software, database, analytic, intelligent technologies, and experience management.
The recent rise of cloud-based software solutions challenged the leading position of SAP in the
market. A survey showed that 16% of the customers of SAP were using cloud-based solutions
from competitors next to their SAP systems (Ashford, 2010). To accommodate to the changing
market environment, SAP started to change their strategy from traditional software provider to
a cloud provider, by different acquisitions like Ariba and SuccessFactors, and the development of
S/4HANA and SAP Analytics Cloud. Traditionally, SAP sold a lifetime license to their customers.
These customers would pay a monthly fee for maintenance and updates to the infrastructure.
Customers could access the system for the rest of their life. With the introduction of the cloud
applications the responsibility of the infrastructure shifts from the customer to SAP. Additionally,
the lifetime license disappeared. Customers only pay a monthly fee for the rights to use the service
from SAP. This shift in business model results in the increased importance of customer retention.
1.1. Research Questions
Drivers of customer retention have been subject to extensive research in a stable market envir-
onment. Kocaman et al. (2020) investigated customer retention before, during and after migration
to cloud-based solutions. Their analysis showed that the retention levels after the migration to
the cloud never fully recover to the same levels as before migration to the cloud, indicating that
the drivers of cloud retention might work different in a SaaS-context. Despite the importance
of customer retention to the success of the business and the indications of studies like Kocaman
et al. (2020), little to no research has been conducted concerning drivers of customer retention in a
Software-as-a-Service context. This study aims to close the gap in scientific literature concerning
customer retention in a Software-as-a-Service setting. Since there is little to no research on this
topic, the choice has been made to explore the effects of the most used drivers of customer re-
tention in the stable market environment, namely length and breadth of the relationship (Bolton
et al., 2004), accompanied with the after-sales services. The software providers are transforming
into service providers, making the delivery of their services the new focal point in their business
model. Therefore, after-sales services are included into the analysis. This results in the following
research question.
2 Drivers of Customer Retention in a Software-as-a-Service setting

CHAPTER 1. INTRODUCTION
Main research question: What is the effect of length/breadth of the
customer-provider relationship and after sales service on customer retention in a
Software-as-a-Service setting?
To create a structured approach for coherently solving the research question, three sub-
questions are formulated.
Sub-question 1: What is the effect of the length of the customer-provider
relationship on customer retention?
One of the most commonly used measurements to address the question whether a customer
is at risk for terminating or enhancing their license is the length of the customer relationship
(Bolton et al., 2004). To determine the length of the customer-brand relationship, all the different
products offered in the past and present should be included (Schweidel et al., 2011). Based on
this information it can be determined how long the customer is using products of SAP and how
this influences the retention rates.
Sub-question 2: What is the effect of the breadth of the customer-provider
relationship on the customer retention?
The second sub-question concerns the breadth of the relationship between customer and sup-
plier. The breadth of the relationship represents the number of different products that a customer
purchases from the same provider. Schweidel et al. (2011) emphasize the importance of including
the effects of cross-selling on the retention levels for multiple service providers, as they positively
influence retention levels.
Sub-question 3: What is the effect of after-sales services on customer retention?
In a B2B market environment one of the key drivers of renewal decisions is the level of service
experienced during the contract period (Stremersch et al., 2001). Therefore, the final sub-question
concerns the after-sale services. The likelihood of customers renewing their contract increases
when they experienced favorable support encounters with the software provider (Berger et al.,
2002; Bolton et al., 2006).
Drivers of Customer Retention in a Software-as-a-Service setting 3

CHAPTER 1. INTRODUCTION
The conceptual framework of this thesis is displayed in figure 1.1. The variables that will be
examined in this project are displayed in the blue boxes, whereas the control variables are displayed
in the white boxes. The first control variable is Hierarchy position. This variable is included,
because if the customer is part of a larger organization it cannot always make renewal decisions
on their own. The second control variable is customer size. This variable is included, because the
on-premise systems were mostly used by large customers. Additionally, large customers are more
prone to have multiple products and because of that receive more attention from the customer
officers.
Figure 1.1: Conceptual Framework
The remainder of this paper is structured as followed. The next chapter consists of an overview
of the theoretical background surrounding Software-as-a-Service and Customer Retention. In
chapter 3, the conceptual model will be introduced and hypothesis will be formed. Followed by a
description of the methodology and the data that has been used to answer the research questions
in chapter 4. Chapter 5 will consist of the results from the analysis and the final chapter will be
used to describe the conclusions that follow from these results.
4 Drivers of Customer Retention in a Software-as-a-Service setting

Chapter 2: Theoretical Background
2.1. Software-as-a-Service
Software-as-a-Service (SaaS) is a part of the cloud computing phenomenon. Cloud comput-
ing phenomenon or cloud managed services is a generic term used for different kinds of cloud
applications. It consists of five different layers on top of each other, starting with the software ap-
plications, software environment, infrastructure, kernel and the hardware at the bottom (Benlian
& Hess, 2011). The advantage of cloud computing technology is that it enables a multi-tenant
architecture. The multi-tenant architecture allows the providers to offer the same software to
different customers without the additional costs (Saaksjarvi et al., 2005). Yet, the customers are
able to use the software as if it were separate instances (Zhang et al., 2009).
The SaaS market is still developing. Therefore, literature concerning the definition of SaaS and
categorizations of SaaS business models is rather scarce. There have been some attempts to close
this gap in the literature. For example, Makila et al. (2010) defined SaaS as: ”software deployment
model, where the software is provisioned over the internet”. Despite these attempts, there is no
consensus on the definition of SaaS. Additionally, scholars have tried to define categorizations of
the different business models, but likewise the definition of SaaS, no consensus has been reached
concerning these categorizations.
The refinement of these definitions and typologies are outside the scope of this paper. However,
to ensure the generalizability and consistency, the business model that will be discussed in this
paper is the ”Enterprise SaaS” identified and defined by Luoma (2013), Luoma and Ronkko (n.d.)
and Luoma et al. (2012). The providers that use this business model target larger enterprise
customers, which can be compared to B2B markets. The revenue streams consist of an entry fee,
recurring gees and service fees, which are based on service-level agreements.
2.2. Customer Retention
Lah and Wood (2016) state that for businesses in a SaaS-setting over 20% churn is fatal for
subscription-based services. There are multiple definitions used in the scientific body for customer
retention. Ascarza et al. (2018) proposed definition is intended to catch the accompanying ideas.
Drivers of Customer Retention in a Software-as-a-Service setting 5
CHAPTER 2. THEORETICAL BACKGROUND
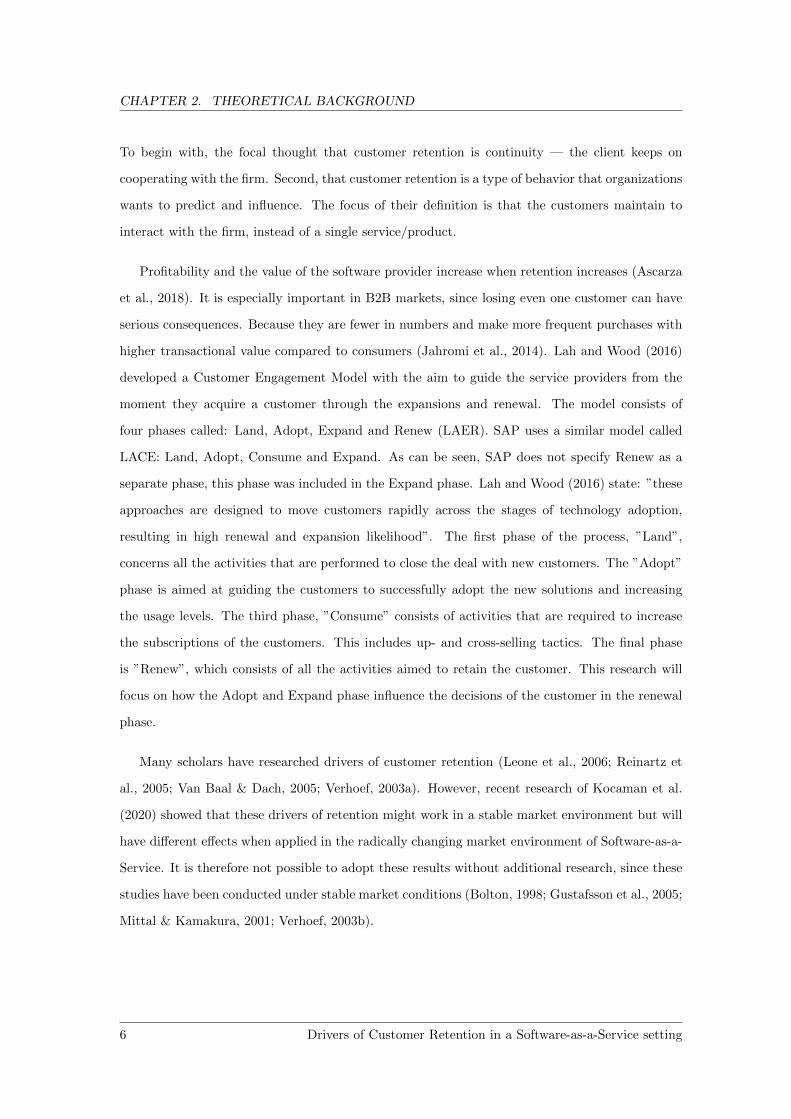
To begin with, the focal thought that customer retention is continuity — the client keeps on
cooperating with the firm. Second, that customer retention is a type of behavior that organizations
wants to predict and influence. The focus of their definition is that the customers maintain to
interact with the firm, instead of a single service/product.
Profitability and the value of the software provider increase when retention increases (Ascarza
et al., 2018). It is especially important in B2B markets, since losing even one customer can have
serious consequences. Because they are fewer in numbers and make more frequent purchases with
higher transactional value compared to consumers (Jahromi et al., 2014). Lah and Wood (2016)
developed a Customer Engagement Model with the aim to guide the service providers from the
moment they acquire a customer through the expansions and renewal. The model consists of
four phases called: Land, Adopt, Expand and Renew (LAER). SAP uses a similar model called
LACE: Land, Adopt, Consume and Expand. As can be seen, SAP does not specify Renew as a
separate phase, this phase was included in the Expand phase. Lah and Wood (2016) state: ”these
approaches are designed to move customers rapidly across the stages of technology adoption,
resulting in high renewal and expansion likelihood”. The first phase of the process, ”Land”,
concerns all the activities that are performed to close the deal with new customers. The ”Adopt”
phase is aimed at guiding the customers to successfully adopt the new solutions and increasing
the usage levels. The third phase, ”Consume” consists of activities that are required to increase
the subscriptions of the customers. This includes up- and cross-selling tactics. The final phase
is ”Renew”, which consists of all the activities aimed to retain the customer. This research will
focus on how the Adopt and Expand phase influence the decisions of the customer in the renewal
phase.
Many scholars have researched drivers of customer retention (Leone et al., 2006; Reinartz et
al., 2005; Van Baal & Dach, 2005; Verhoef, 2003a). However, recent research of Kocaman et al.
(2020) showed that these drivers of retention might work in a stable market environment but will
have different effects when applied in the radically changing market environment of Software-as-a-
Service. It is therefore not possible to adopt these results without additional research, since these
studies have been conducted under stable market conditions (Bolton, 1998; Gustafsson et al., 2005;
Mittal & Kamakura, 2001; Verhoef, 2003b).
6 Drivers of Customer Retention in a Software-as-a-Service setting

Chapter 3: Hypothesis
This chapter will elaborate on the conceptual model and the hypotheses will be formed. This
chapter will be structured based on the sub-questions that were formulated in section 1.1.
3.1. Length of the Relationship
The length of the relationship is one of the most commonly used metrics to model retention
and satisfaction (Bolton et al., 2004). In the first stages of the relationship between the customer
and the service provider, there is a lot of uncertainty on both sides of the relationship. But as
the relationship matures, these uncertainties are reduced by interactions between the customer
and the provider. The provider establishes a better understanding of the needs, preferences and
expectations of the customer (Reichheld & Sasser, 1990). Based on these understandings the
software provider can improve their services delivered to the customer. From a customer point
of view, the length of the relationship suggests that the customer finds the relationship beneficial
and therefore renews their contract with the software provider. Additionally, customers who have
a long-lasting relationship with the organization, weigh the prior cumulative satisfaction more
heavily than relatively new information (Bolton, 1998). Therefore, the following hypothesis is
formulated:
Hypothesis 1: The length of the customer-firm relationship has a positive effect on
the probability of renewal.
3.2. Breadth of the Relationship
The second metric, that is most commonly used to address the questions surrounding customer
retention, is the breadth of the relationship (Bolton et al., 2004). The breadth of the relationship
represents the number of different products a customer has acquired from the same software
provider. This effect is called cross-buying in the scientific literature (Bolton et al., 2004; Schweidel
et al., 2011). The effects of cross-buying on customer retention are based on two different concepts.
The first concept is based on switching costs (Morgan & Hunt, 1994). If customers use more
products from one provider, they accumulated incremental switching costs, which in turn will lead
Drivers of Customer Retention in a Software-as-a-Service setting 7

CHAPTER 3. HYPOTHESIS
to stickiness and reduced propensity to leave the software provider (i.e. churn) (Hashmi et al.,
2013; Rindfleisch & Heide, 1997). Therefore, the following hypothesis is formulated:
Hypothesis 2a: The breadth of the customer-firm relationship has a positive effect
on the probability of renewal.
The second concept on which the cross-buying effects are based is customer satisfaction. Bolton
(1998) showed that the overall customer satisfaction positively effects the duration of the relation-
ship, i.e. customer retention. This indicates that positive experiences with other products affect
the probability of retention. As a result, it is hypothesized that the cross-buying effects work in
two different ways. The first approach of the effect of cross-buying is that the number of products
will positively affect the probability of renewal, based on the transaction cost theory. The second
approach is based on the overall customer satisfaction. Therefore, the following hypothesis is
formulated:
Hypothesis 2b: The positive effect of the breadth of the relationship differs per
product.
3.3. After Sales Services
The interactions between the customers and the provider can provide insights in the future
behavior of the customer (Berger et al., 2002; Bolton et al., 2006). A high degree of interactions
between the customer and software provider indicate that the relationship is strong and mature
and therefore more likely to continue (Jaiswal & Niraj, 2011; Zeithaml et al., 1996). Therefore,
the following hypothesis is formulated:
Hypothesis 3a: The level of after-sales services have a positive effect on the
probability of renewal.
The probability of renewal is not only affected by the amount of interactions but also the timing of
the interactions has an effect. Bolton et al. (2006) state that customer-firm interactions have more
impact in the final year of the contract, because these positive experiences are still on the top of
their minds. Therefore, the second hypothesis of the after-sales services is that the interactions in
the final phase of the contract have a bigger impact on the probability of renewal.
8 Drivers of Customer Retention in a Software-as-a-Service setting

CHAPTER 3. HYPOTHESIS
Hypothesis 3b: The timing of the after-sales services effect the probability of
renewal.
This chapter elaborated on the concepts of the different drivers included in this analysis. Based
on these concepts multiple hypothesis are formulated. The next chapter will elaborate upon the
methodology used to test the hypothesis. The methodology includes a description of the data
sample, analysis technique and operationalization of the drivers.
Drivers of Customer Retention in a Software-as-a-Service setting 9

Chapter 4: Methodology
This chapter will start with a description of the chosen analysis technique and the reasoning
behind this choice. Followed by a description of the operationalization of the different concepts.
The final section of this chapter is used to describe the data.
4.1. Method
Ascarza et al. (2018) state that simply identifying predictors of churn without investigating
the why is not sufficient enough. The dependent variable used in this analysis is a binary variable,
limiting the appropriate analysis techniques to a logistic regression or discriminant analysis (Hair
et al., 1998). Furthermore, the analysis also includes non-metric independent variables. For these
reasons a logistic regression will be used in this analysis, because this type of regression analysis
can be used to explain and predict binary variables and is especially designed to predict the
probability of an event (in this case contract renewal) occurring (Hair et al., 1998). Additionally,
logistic regression enables the use of metric and non-metric as independent variables.
4.2. Measurement
4.2.1. Length of the Relationship
The length of the relationship is included in the dataset as a ”date”. This date is the start of
the customer-provider relationship. This variable is included in the analysis with the name Client
since.
4.2.2. Breadth of the Relationship
The breadth of the relationship is operationalized in threefold. The first variable is a binary
value which indicates if the customers have any additional products, this variable is called Addi-
tional Products. The second variable is the number of additional products, which is called Number
of Additional Products. The third way the additional products are operationalized, is by including
binary values for each product. These binary values can be used to measure if the inclusion of
each of these additional products affects the probability of renewal, and especially if there is a
difference between the product in their effect on the renewal rates. There are 14 different product
10 Drivers of Customer Retention in a Software-as-a-Service setting

CHAPTER 4. METHODOLOGY
categories included in this analysis. Each of these products represents a different line of business.
4.2.3. After-sales services
The after-sales services are measured by different variables. Due to time constraints, it was not
possible to include the precise interactions between the customer and provider. SAP uses internal
classification systems to specify the strategic value, potential and current value but also how labor
intensive the customers are. If customers receive a higher classification, they get more attention and
time from the customer officers at SAP. Additionally, some customers have a dedicated executive on
either the enterprise level or the solution level. Together these variables can be used as substitutes.
The remainder of this section will be used to shortly introduce these classification systems.
Figure 4.1: Account Classification
There are three different classification systems included in the data set. The first classification
system is called Account Classification, where the customers are classified based on their current
and potential customer value. As can be seen in figure 4.1, there is no clear hierarchy between
the different classifications. At first, 1271 rows were missing the Account Classification. Some of
the values could be filled in since the customer was included multiple times in the sample and
the other rows had the same Account Classifications. But there were also customers who had
different Account Classifications (the Account Classification can evolve over time) or no Account
Classification. In consultation with the experts at SAP, the decision is made that if there is
Drivers of Customer Retention in a Software-as-a-Service setting 11

CHAPTER 4. METHODOLOGY
one Account Classification that is predominant, then that classification can be adopted. This still
leaves 823 missing values. The exclusion of these missing values does not violate the recommended
sample size of 400 (Hosmer & Lemeshow, 2000). Therefore, the choice is made to exclude these
cases from the analysis.
Figure 4.2: Internal Account Classification
The second internal classification system
that is used is the ISS. This classification is de-
termined by the industry value advisory team
of SAP and is based on long-term trends and
strategies. Customers are divided into 3 differ-
ent categories as can be seen in the pyramid in
figure 4.2. The final classification system that
is included in this study is a more detailed ver-
sion of the ISS, called Internal Account Clas-
sification. This classification system is based
on the ISS system, but every category is split
into two new categories. These categories are
displayed on the right of the pyramid in figure
4.2. These classification systems are measured
in two different ways, numerical and categor-
ical. The best measurement fit will be determ-
ined in chapter 5.1, based on the estimation of the full model.
The last variable for the after-sales services are the dedicated customer officers, there are
two different kinds of customer officers. The first are the overall customer officers (Customer
Engagement Executives in SAP terms), they guide the customers through all the steps of the
LACE/LAER model. The second kind of customer officers are Customer Retention Executives,
and they get involved in the final ”Renewal” phase of the customer journey. They get involved
2-3 months before the contract will be renewed making Quote’s, CRM entries, OBV checks etc.
(the operational part of the renewal process).
12 Drivers of Customer Retention in a Software-as-a-Service setting

CHAPTER 4. METHODOLOGY
Table 4.1: Descriptive Statistics - Continuous Variables
Statistic N Mean St. Dev. Min Max
Renewal Status 8,902 0.842 0.365 0 1Analytics 8,902 0.233 0.423 0 1Ariba 8,902 0.089 0.285 0 1Business ByDesign 8,902 0.086 0.280 0 1Customer Experience 8,902 0.169 0.374 0 1Data Management 8,902 0.191 0.393 0 1Databases 8,902 0.044 0.204 0 1Digital Supply Chain 8,902 0.115 0.319 0 1Fieldglass 8,902 0.021 0.143 0 1HANA Enterprise Cloud 8,902 0.077 0.267 0 1Other 8,902 0.128 0.334 0 1S/4 HANA Cloud 8,902 0.078 0.268 0 1SAP Platform 8,902 0.299 0.458 0 1SuccessFactors 8,902 0.205 0.404 0 1Training and Adoption 8,902 0.147 0.354 0 1Additional Products 8,902 0.609 0.488 0 1Number of Additional Products 8,902 1.880 2.293 0 12Regular Customer Officer 8,902 0.264 0.441 0 1Renewal Customer Officer 1 8,902 0.385 0.487 0 1Renewal Customer Officer 2 8,902 0.438 0.496 0 1ISS 8,902 1.414 0.573 1 3
4.3. Sample Description
The data was gathered from the internal customer relationship tools from SAP. The basis
of the data set was constructed of an operational report of all cloud renewals in from 2018 to
2020. The data set was expanded using information from the customer database. The final data
set consists of 8,902 renewal opportunities of 2501 different customers. Table 4.1 contains the
descriptive statistics of the continuous variables included in the dataset. The average renewal rate
in the sample is equal to 84%. The mean of the customer acquisition date is on 10-6-2009. The
oldest customer included in the data set has been a customer of SAP from 25-5-1983. On the
other side, the shortest customer relationship that is included in the data set, started at 1-10-
2020. Table 4.2 shows the descriptive statistics as if the length of the relationship was a discrete
categorical variable, the model development is based on the continuous variable. Creating a clear
understanding of how the data is distributed, but also the retention level percentage shows how
these levels change per category. As can be seen, the retention levels decrease as the relationship
with the customer shortens. 60% of the opportunities included in the analysis are customers with
additional products. The customers have an average of 1.88 additional products, with a maximum
Drivers of Customer Retention in a Software-as-a-Service setting 13

CHAPTER 4. METHODOLOGY
of 12 and a minimum of zero, in other words customers with no additional products. Table 4.3
shows the results of the t-test performed to confirm if there is a difference in mean of the retention
levels, for each of the possible additional products. As can be seen, the increase or in some cases
even decrease in mean retention levels, indicates that the different products might have a different
effect on retention. The descriptive statistics and retention level per category of the classification
systems are included in table 4.2. A notable number is the retention level of the Strategic Customer
Program - Platinum group, which is expected to be the highest of all the categories, but shows
the lowest retention level.
(a) Distribution of Internal Account Classification (b) Distribution of Account Classification
Figure 4.3: Distribution of Data
14 Drivers of Customer Retention in a Software-as-a-Service setting

CHAPTER 4. METHODOLOGY
Table 4.2: Descriptive Statistics - Discrete Variables
Frequency Percent Retention Level
Year of Customer Acquisition1980-1989 85 1% 85.9%1990-1999 1201 13% 85.7%2000-2009 3110 35% 85%2010-2020 4506 51% 83.2%
Account ClassificationDigital 6333 71 83%
Feature 539 6 86.3%Nurture 923 10 88.3%Protect 1107 12 86.7%
Internal Account ClassificationGeneral Business - Lower 3969 45 83.1%General Business - Upper 1635 18 84%
Key - Active 2293 26 86.4%Key - Dormant 624 7 83.3%
Strategic Customer Program 295 3 85.4%Strategic Customer Program - Platinum 86 1 80.2%
Table 4.3: Difference in Retention Level for Additional Products (t-test)
Frequency Without With p-value
Analytics 1463 84.3% 83.7% 0.55Ariba 296 83.8% 88.0% 0.00Business ByDesign 372 83.8% 88.4% 0.00Customer Experience 887 84.0% 85.2% 0.24Data Management 31 84.2% 84.3% 0.89Databases 273 84.0% 89.5% 0.00Digital Supply Chain 202 83.9% 86.3% 0.04Fieldglass 93 84.1% 87.6% 0.17HANA Enterprise Cloud 180 84.2% 84.6% 0.79Other 162 84.3% 83.6% 0.52S/4 HANA Cloud 70 84.2% 84.1% 0.92SAP Platform 2030 84.5% 83.6% 0.27Success Factors 1575 83.8% 85.7% 0.04Training and Adoption 1268 83.6% 87.9% 0.00
Drivers of Customer Retention in a Software-as-a-Service setting 15

Chapter 5: Results
5.1. Model Development
The model is developed by subsequently adding the different building blocks of drivers to the
model as specified in chapter 4.3. There are four variations of the After-Sales building block, due
to the ISS and IAC classification system being registered in two different measurements, factor
and numerical. To assess the best fit and combination, four versions of Model 4 in table 5.1 are
estimated. The models are compared based on their explanatory power and the best fit, Model C,
is used for further analysis. The model fit of the different models can be found in table 5.1. As can
be seen and as expected, all the building blocks add to the explanatory power of the model. Model
5 includes the same building blocks as Model 4, but all the interactions with a p-value higher than
0.2 are removed from the model. This adjustment results in an increase of explanatory power.
Hence, Model 5 will be the focus of the discussion.
Table 5.1: Model fit
Log Likelihood AIC
Model 1 = Intercept only −3,875.534 7,763.067Model 2 = Model 1 + Length −3,873.390 7,760.780Model 3 = Model 2 + Breadth −3,834.206 7,712.412Model 4 = Model 3 + After Sales Services −3,666.136 7,406.272Model 5 = Model 4 with only interactions at p < .20 −3,668.940 7,397.880
Table 5.2: Measurement Fit of After-Sales
IAC ISS Log Likelihood AIC
Model A Factor Factor −3.666.131 7,408.262Model B Numerical Numerical −3,673.700 7,413.400Model C Factor Numerical −3,666.136 7,406.272Model D Numerical Factor −3,673.590 7,415.180
16 Drivers of Customer Retention in a Software-as-a-Service setting

CHAPTER 5. RESULTS
Table 5.3: Estimates of Final Model
Estimate Std. Error Pr(>|z|)(Intercept) 4.191 0.862 0.00000
LengthClient since −0.00002 0.00001 0.228
BreadthAdditional Products 0.327 0.096 0.001
Number of Additional Products 0.164 0.054 0.002Analytics −0.340 0.102 0.001
Business ByDesign 0.227 0.139 0.102Customer Experience −0.173 0.105 0.098
Data Management −0.261 0.114 0.021Databases 0.757 0.215 0.0004
Digital Supply Chain −0.313 0.135 0.021Fieldglass −0.370 0.252 0.142
Other −0.495 0.129 0.0001S/4HANA Cloud −0.383 0.158 0.015
SAP Platform −0.412 0.097 0.00002After-Sales ServicesAccount Classification
Feature (Ref=Digital) 0.535 0.167 0.001Nurture(Ref=Digital) 0.447 0.140 0.001Protect(Ref=Digital) 0.338 0.119 0.005
Internal Account ClassificationKey - Active (Ref=General Business) 2.859 0.787 0.0003
Key - Dormant (Ref=General Business) 2.748 0.794 0.001SCP (Ref=General Business) 5.586 1.587 0.0004
SCP - PCU (Ref=General Business) 5.020 1.605 0.002Regular Customer Officer −0.174 0.098 0.075
Renewal Customer Officer 1 0.626 0.066 0Renewal Customer Officer 2 0.956 0.070 0
ISS −2.866 0.799 0.0003Control Variables
Hierarchy PositionBottom (Ref=Alone) −0.071 0.099 0.469Middle (Ref=Alone) −0.039 0.112 0.727
Top (Ref=Alone) −0.159 0.095 0.094Company Size
Lower midmarket (Ref=Large Enterprise) −0.066 0.153 0.665Upper midmarket (Ref=Large Enterprise) −0.039 0.152 0.797
Drivers of Customer Retention in a Software-as-a-Service setting 17

CHAPTER 5. RESULTS
5.2. Drivers of Customer Retention
The estimates of Model 5 are reported in table 5.3. The estimated coefficients that are displayed
in table 5.3 cannot be used to interpret the direct effects on the probability of renewal, due to
the nonlinear nature of a logistic regression (Ai & Norton, 2003). Therefore, to test the different
hypothesis, similar visualizations as proposed by Lamey et al. (2018) are used. These visualizations
show the effects of the different variables, where all other factors kept constant. The discussion is
structured based on the research questions that were formulated in the section 1.1.
5.2.1. Length of the Relationship
In section 3.1 it was hypothesized that the length of the customer relationship would positively
influence the probability of the renewal. Figure 5.1 shows the effect of the length of the relationship,
controlling for all other variables. As can be seen in figure 5.1, the longer the relationship the
higher the probability of renewal. This is in line with the expectations. However, the p-value is
not significant (p=0.228). This means that this relationship cannot be confirmed.
Figure 5.1: Visualisation of Effects of Length of the Relationship
18 Drivers of Customer Retention in a Software-as-a-Service setting

CHAPTER 5. RESULTS
(a) Effect of Additional Products
(b) Difference in Effect of First Additional Products
(c) Difference in Effect of Additional Products
Figure 5.2: Visualisation of Effects of Breadth of the Relationship
Drivers of Customer Retention in a Software-as-a-Service setting 19

CHAPTER 5. RESULTS
5.2.2. Breadth of the Relationship
In section 3.2 it was hypothesized that the breadth, i.e. the number of additional products,
has a positive effect on the probability of renewal. Figure 5.2a shows the effect of the number
of additional products. As can be seen, the more products the customer uses, the higher the
probability of renewal. This is in line with the expectation. However, figures 5.2b and 5.2c show
that the effect of adding a product to their portfolio differs per product. The addition of some
products even results in a decrease in probability of renewal. Figure 5.2b shows the effect of
the addition of the first additional product to the customer portfolio. As can be seen, there is
a substantial difference in the positive effect of the different products. The direction of these
effects are mostly positive, only the ”Other” category shows a small decrease in the probability
of renewal. However, figure 5.2c shows that only ”Business ByDesign” and ”Databases” show an
increase in probability.
5.2.3. After-Sales Services
The after-sales services are divided into multiple variables. Due to constraints in time and data
availability, data on service deliveries was unavailable. Therefore, internal classification systems
combined with addition of an assigned customer officer are used to analyze this relationship.
The first classification system is the Account Classification. This classification system consists
of four levels: Digital, Protect, Nurture and Feature. The results show that a better Account
Classification result in higher probability of retention, as was hypothesized in section 3.3. The
second classification system that is used in this research paper is called the Internal Account
Classification. As expected, the higher the classification the higher the probability of renewal.
The final variable that was included to research the after-sales services are the assigned cus-
tomer officers. It is hypothesized in section 3.3 that these assigned customer officers increase the
probability of renewal. However, the addition of a general customer officer shows the opposite,
it showed a decrease in probability of renewal. The opposite effect can be seen for the renewal
officers. The probability of renewal when the customer gets an assigned retention customer officer
increases, as was expected.
20 Drivers of Customer Retention in a Software-as-a-Service setting

CHAPTER 5. RESULTS
(a) Effect Account Classification
(b) Effect Internal Account Classification
(c) Effect of Customer Officer
Figure 5.3: Visualisation of Effects of After-Sales Services
Drivers of Customer Retention in a Software-as-a-Service setting 21

Chapter 6: Conclusion
This paper explored the drivers of customer retention in a Software-as-a-Service (SaaS) context.
The rise of SaaS offerings and switch to subscription-based offerings decreased switching barriers
for customers. Additionally, over 20% churn is fatal for subscription-based services (Lah & Wood,
2016), resulting in increased emphasis on customer success and retention. Drivers of customer
retention have been extensively researched in a traditional setting, but research by Kocaman et al.
(2020) indicates that these drivers might have different effects in a SaaS-context. Nevertheless,
the drivers of customer retention in a SaaS-setting have not been touched upon in the scientific
literature. Therefore, this paper tries to close this gap in scientific literature.
This study is one of the first exploratory studies and therefore the choice has been made
to include the most common and traditional drivers of customer retention, namely length and
breadth of the relationship and after-sales services. These drivers are accompanied by the after-
sales services, because the focus of the new business model is focused around the service delivery.
The remainder of this chapter is structured based on the three different drivers. Each of these
sections will start with a brief description of the scientific basis on which the hypothesis was build,
the results of our study and the implications of those results. These sections will be followed by
the managerial implications, limitations of the study and directions for future research.
6.0.1. Length of the Relationship
The first element that was included in this research paper was the length of the customer
relationship. Bolton et al. (2004) stated that the length of this relationship is one of the most
commonly used metrics to assess retention, the longer the relationship the higher the probability
of renewal. New relationships between customers and providers are surrounded by uncertainty.
But as the relationship progresses, the needs, preferences and expectations of the customers are
uncovered (Reichheld & Sasser, 1990), based on which the provider can improve their services. The
relationship was not significant, and therefore H1 was rejected. This could indicate that radical
innovations disrupt the relationships between the customer and the provider. The strong, mature
relationships are weakened due to the uncertainty surrounding the radical innovation. The format
in which the software solutions are offered changed, which makes all the acquired knowledge during
the relationship redundant.
22 Drivers of Customer Retention in a Software-as-a-Service setting
CHAPTER 6. CONCLUSION
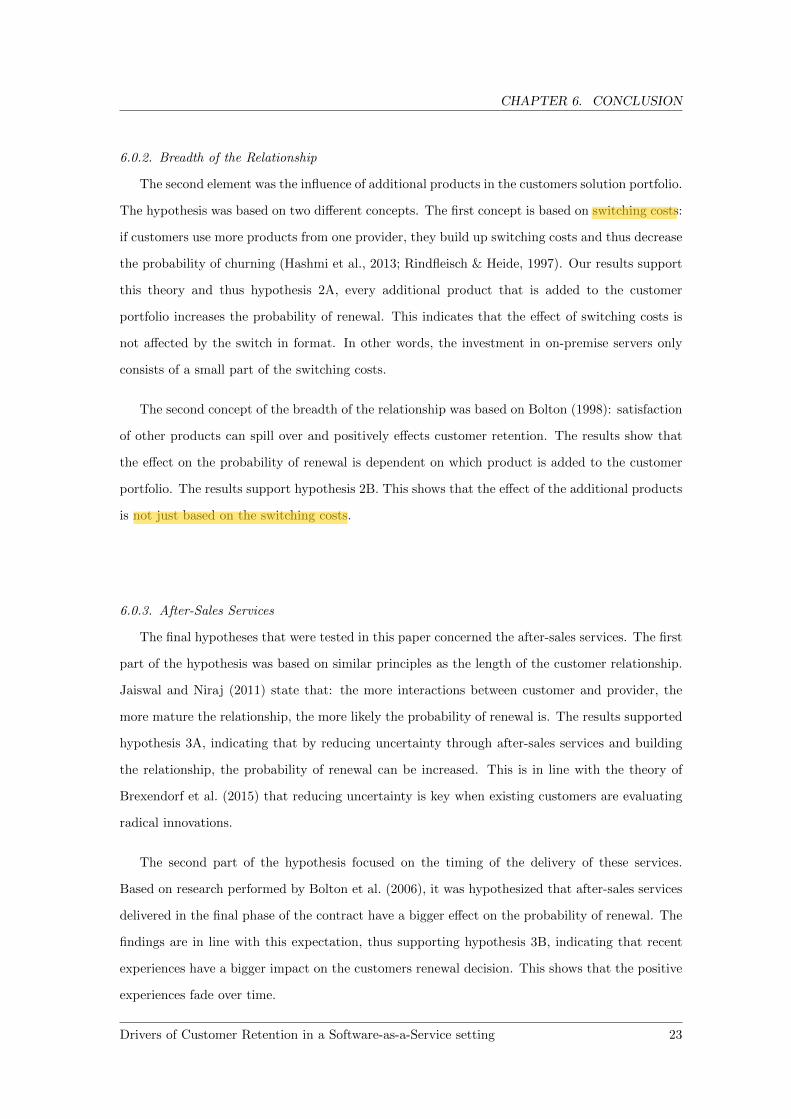
6.0.2. Breadth of the Relationship
The second element was the influence of additional products in the customers solution portfolio.
The hypothesis was based on two different concepts. The first concept is based on switching costs:
if customers use more products from one provider, they build up switching costs and thus decrease
the probability of churning (Hashmi et al., 2013; Rindfleisch & Heide, 1997). Our results support
this theory and thus hypothesis 2A, every additional product that is added to the customer
portfolio increases the probability of renewal. This indicates that the effect of switching costs is
not affected by the switch in format. In other words, the investment in on-premise servers only
consists of a small part of the switching costs.
The second concept of the breadth of the relationship was based on Bolton (1998): satisfaction
of other products can spill over and positively effects customer retention. The results show that
the effect on the probability of renewal is dependent on which product is added to the customer
portfolio. The results support hypothesis 2B. This shows that the effect of the additional products
is not just based on the switching costs.
6.0.3. After-Sales Services
The final hypotheses that were tested in this paper concerned the after-sales services. The first
part of the hypothesis was based on similar principles as the length of the customer relationship.
Jaiswal and Niraj (2011) state that: the more interactions between customer and provider, the
more mature the relationship, the more likely the probability of renewal is. The results supported
hypothesis 3A, indicating that by reducing uncertainty through after-sales services and building
the relationship, the probability of renewal can be increased. This is in line with the theory of
Brexendorf et al. (2015) that reducing uncertainty is key when existing customers are evaluating
radical innovations.
The second part of the hypothesis focused on the timing of the delivery of these services.
Based on research performed by Bolton et al. (2006), it was hypothesized that after-sales services
delivered in the final phase of the contract have a bigger effect on the probability of renewal. The
findings are in line with this expectation, thus supporting hypothesis 3B, indicating that recent
experiences have a bigger impact on the customers renewal decision. This shows that the positive
experiences fade over time.
Drivers of Customer Retention in a Software-as-a-Service setting 23

CHAPTER 6. CONCLUSION
6.1. Managerial Implications
If a SaaS-company wants to increase their retention levels, they should focus on the follow-
ing recommendations. When a service provider radically innovates their offerings, management
should be aware that the benefits of a long and mature relationship are undone by the radical
changes. Management should treat each customer as if this is the first time that they renew their
contract. Especially focus on reducing the uncertainty and rebuilding the relationship in this
new and unknown territory. Next to rebuilding the relationship, it is also helpful to broaden the
relationship with the customer. Switching costs will increase if customers use multiple products
from the same provider, which will result in higher probabilities of the customer renewing their
contract. Therefore, try to sell other products to existing customers. However, keep in mind that
not all products have the same effect on the probability of renewal. Management should monitor
which products churning customers have in their portfolio and try to uncover patterns. Based
on these patterns cross-selling methods can be put in place, to maximize the positive effects of
additional products. The final research question of this study concerned the after-sales services.
Two different recommendations can be formulated based on these results. The first recommenda-
tion is that the level of interactions matters. The analysis showed that customers who had more
contact with the provider have higher probabilities of renewal. These interactions are a means of
establishing a strong relationship, based on mutual understanding of the preferences, needs and
expectations. Additionally, customers officers can guide the customers to optimize the use of their
products. The second recommendation is based on the conclusion that positive experiences decay
over time. Therefore, management should focus on the service levels in the final phase of the
contract, increasing the interactions compared to the average service levels. This way retention
levels can be increased and more customers can be retained.
6.2. Limitations and Directions for Future Research
This study has a few limitations that offer directions for future research. The first limitation is
based on the scope of the study. The analysis has been limited to three different drivers, due to time
constraints. However, Ascarza et al. (2018) show that there are more known drivers in contractual
settings. Further research could enrich this study and the knowledge base on customer retention
in a Software-as-a-Service setting by considering these drivers in a SaaS-setting. The second
limitation can be found in the operationalization of the after-sales services. It was not possible
24 Drivers of Customer Retention in a Software-as-a-Service setting

CHAPTER 6. CONCLUSION
to include the precise interactions between the customer and the provider as Bolton et al. (2006),
due to time constraints. Therefore, classification systems and dedicated customer officers are used
as substitutions. The results of this analysis should be verified in further research, based on the
precise interactions. Thirdly, the analysis of the breadth of the relationship showed differences
in the effects of the various products. Previous research indicated that this could be based on
the satisfaction of those other products (Bolton, 1998). Further research should substantiate if
satisfaction is the cause of the different effects.
Drivers of Customer Retention in a Software-as-a-Service setting 25

Bibliography
Ai, C. & Norton, E. C. (2003). Interaction terms in logit and probit models. Economics letters,
80 (1), 123–129.
Ascarza, E., Neslin, S. A., Netzer, O., Anderson, Z., Fader, P. S., Gupta, S., Hardie, B. G.,
Lemmens, A., Libai, B., Neal, D. et al. (2018). In pursuit of enhanced customer retention
management: Review, key issues, and future directions. Customer Needs and Solutions,
5 (1-2), 65–81. https://doi.org/10.1007/s40547-017-0080-0
Ashford, W. (2010). SAP too slow to cloud, say users [Accessed at September 16, 2020]. https:
//www.computerweekly.com/news/1280093386/SAP-too-slow-to-cloud-say-users
Benlian, A. & Hess, T. (2011). Opportunities and risks of software-as-a-service: Findings from a
survey of it executives. Decision support systems, 52 (1), 232–246. https://doi.org/10.
1016/j.dss.2011.07.007
Berger, P. D., Bolton, R. N., Bowman, D., Briggs, E., Kumar, V., Parasuraman, A. & Terry, C.
(2002). Marketing actions and the value of customer assets: A framework for customer
asset management. Journal of Service Research, 5 (1), 39–54. https://doi.org/10.1177/
1094670502005001005
Bolton, R. N. (1998). A dynamic model of the duration of the customer’s relationship with a
continuous service provider: The role of satisfaction. Marketing science, 17 (1), 45–65.
https://doi.org/10.1287/mksc.17.1.45
Bolton, R. N., Lemon, K. N. & Bramlett, M. D. (2006). The effect of service experiences over time
on a supplier’s retention of business customers. Management Science, 52 (12), 1811–1823.
https://doi.org/10.1287/mnsc.1060.0594
Bolton, R. N., Lemon, K. N. & Verhoef, P. C. (2004). The theoretical underpinnings of cus-
tomer asset management: A framework and propositions for future research. Journal of the
Academy of Marketing Science, 32 (3), 271–292. https://doi.org/10.1177/0092070304263341
Brexendorf, T. O., Bayus, B. & Keller, K. L. (2015). Understanding the interplay between brand
and innovation management: Findings and future research directions. Journal of the
Academy of Marketing Science, 43 (5), 548–557. https://doi.org/10.1007/s11747-015-
0445-6
26 Drivers of Customer Retention in a Software-as-a-Service setting

BIBLIOGRAPHY
Gartner. (2020). Gartner forecasts worldwide public cloud revenue to grow 6.3% in 2020 [Accessed
at November 26, 2020]. https://www.gartner.com/en/newsroom/press-releases/2020-07-
23-gartner-forecasts-worldwide-public-cloud-revenue-to-grow-6point3-percent-in-2020
Gustafsson, A., Johnson, M. D. & Roos, I. (2005). The effects of customer satisfaction, relationship
commitment dimensions, and triggers on customer retention. Journal of marketing, 69 (4),
210–218. https://doi.org/10.1509/jmkg.2005.69.4.210
Hair, J. F., Black, W. C., Babin, B. J., Anderson, R. E., Tatham, R. L. et al. (1998). Multivariate
data analysis (Vol. 5). Prentice hall Upper Saddle River, NJ.
Hashmi, N., Butt, N. A. & Iqbal, D. (2013). Customer churn prediction in telecommunication a
decade review and classification. IJCSI, 10, 271–282.
Hosmer, D. W. & Lemeshow, S. (2000). Applied logistic regression. Wiley New York.
Jahromi, A. T., Stakhovych, S. & Ewing, M. (2014). Managing b2b customer churn, retention and
profitability. Industrial Marketing Management, 43 (7), 1258–1268. https://doi.org/10.
1016/j.indmarman.2014.06.016
Jaiswal, A. K. & Niraj, R. (2011). Examining mediating role of attitudinal loyalty and nonlinear
effects in satisfaction-behavioral intentions relationship. Journal of Services Marketing.
Kocaman, B., Gelper, S. & Langerak, F. (2020). Working paper.
Lah, T. & Wood, J. (2016). Technology-as-a-service playbook. USA: Technology Services Industry
Association.
Lamey, L., Deleersnyder, B., Steenkamp, J.-B. E. & Dekimpe, M. G. (2018). New product success
in the consumer packaged goods industry: A shopper marketing approach. International
Journal of Research in Marketing, 35 (3), 432–452.
Leone, R. P., Rao, V. R., Keller, K. L., Luo, A. M., McAlister, L. & Srivastava, R. (2006). Linking
brand equity to customer equity. Journal of service research, 9 (2), 125–138.
Luoma, E. (2013). Examining business models of software-as-a-service firms. International confer-
ence on grid economics and business models, 1–15.
Luoma, E. & Ronkko, M. (n.d.). Software-as-a-service business models.
Luoma, E., Ronkko, M. & Tyrvainen, P. (2012). Current software-as-a-service business models:
Evidence from finland. International Conference of Software Business, 181–194.
Ma, D. (2007). The business model of” software-as-a-service”. Ieee international conference on
services computing (scc 2007), 701–702. https://doi.org/10.1109/SCC.2007.118
Drivers of Customer Retention in a Software-as-a-Service setting 27

BIBLIOGRAPHY
Makila, T., Jarvi, A., Ronkko, M. & Nissila, J. (2010). How to define software-as-a-service–an
empirical study of finnish saas providers. International Conference of Software Business,
115–124.
Mittal, V. & Kamakura, W. A. (2001). Satisfaction, repurchase intent, and repurchase behavior:
Investigating the moderating effect of customer characteristics. Journal of marketing re-
search, 38 (1), 131–142. https://doi.org/10.1509/jmkr.38.1.131.18832
Morgan, R. M. & Hunt, S. D. (1994). The commitment-trust theory of relationship marketing.
Journal of marketing, 58 (3), 20–38. https://doi.org/10.1177/002224299405800302
Ojala, A. (2012). Software-as-a-service revenue models. IT Professional, 15 (3), 54–59.
Reichheld, F. F. & Sasser, W. E. (1990). Zero defeofions: Quality comes to services. Harvard
business review, 68 (5), 105–111.
Reinartz, W., Thomas, J. S. & Kumar, V. (2005). Balancing acquisition and retention resources
to maximize customer profitability. Journal of marketing, 69 (1), 63–79. https://doi.org/
10.1509/jmkg.69.1.63.55511
Rindfleisch, A. & Heide, J. B. (1997). Transaction cost analysis: Past, present, and future applic-
ations. Journal of marketing, 61 (4), 30–54.
Saaksjarvi, M., Lassila, A. & Nordstrom, H. (2005). Evaluating the software as a service business
model: From cpu time-sharing to online innovation sharing. IADIS international confer-
ence e-society, 177–186.
SAP SE. (2020). About SAP SE [Accessed at September 11, 2020]. https : / / www . sap . com /
corporate/en.html
Satyanarayana, S. (2012). Cloud computing: Saas. Computer Sciences and Telecommunications,
(4), 76–79.
Schweidel, D. A., Bradlow, E. T. & Fader, P. S. (2011). Portfolio dynamics for customers of a
multi-service provider. Management Science, 57, 471–486. https://doi.org/10.1287/mnsc.
1100.1284
Stremersch, S., Wuyts, S. & Frambach, R. T. (2001). The purchasing of full-service contracts::
An exploratory study within the industrial maintenance market. Industrial Marketing
Management, 30 (1), 1–12.
Van Baal, S. & Dach, C. (2005). Free riding and customer retention across retailers’ channels.
Journal of Interactive Marketing, 19 (2), 75–85.
28 Drivers of Customer Retention in a Software-as-a-Service setting

BIBLIOGRAPHY
Verhoef, P. C. (2003a). Understanding the effect of customer relationship management efforts on
customer retention and customer share development. Journal of marketing, 67 (4), 30–45.
Verhoef, P. C. (2003b). Understanding the effect of customer relationship management efforts on
customer retention and customer share development. Journal of marketing, 67 (4), 30–45.
https://doi.org/10.1509/jmkg.67.4.30.18685
Walther, S., Sarker, S., Sedera, D. & Eymann, T. (2013). Exploring subscription renewal intention
of operational cloud enterprise systems-a socio-technical approach.
Zeithaml, V. A., Berry, L. L. & Parasuraman, A. (1996). The behavioral consequences of service
quality. Journal of marketing, 60 (2), 31–46.
Zhang, Y., Liu, S. & Meng, X. (2009). Towards high level saas maturity model: Methods and case
study. 2009 IEEE Asia-Pacific Services Computing Conference (APSCC), 273–278.
Drivers of Customer Retention in a Software-as-a-Service setting 29
Recommended