Effects of muscle tense on impact responses of lower extremity
Takahiko Sugiyama, Hideyuki Kimpara, Masami Iwamoto, Daisuke Yamada,
Yuko Nakahira and Masatoshi Hada
TOYOTA Central R&D Labs., Inc.
ABSTRACT
This paper describes investigation on the effects of muscle tense in bracing on impact responses
of driver’s lower extremity in frontal impacts. From an experimental volunteer test data using a male
subject, 33 muscle activation levels of right lower extremity for his maximal voluntary contraction in
pressing on a brake pedal were predicted by a musculoskeletal model and then used for a human FE
model. Parametric studies on pedal impacts to the foot with three pre-impact muscular conditions
reveal that activated thigh muscles can increase axial compressive force and possibility of bone
fractures at the tibia.
Keywords: Muscle activation, Finite Element Method, Musculoskeletal Model, Bracing, Lower
extremity
MUSCLE ACTIVATION must be considered in the crashworthiness as an essential effect to
biomechanical responses and occupant injuries. In case of approaching a crash, it is conjectured that
vehicular occupants would brace themselves with activating their muscles. Tensed muscles may
change occupant’s posture and stiffen up their joint articulations, while occupant’s posture and
biomechanical apparent stiffness would determine impact responses of the human body. Therefore,
it can be assumed that muscle tense affects injury patterns and severities as well as impact responses
during automotive crashes.
Several studies have been performed to investigate the influence of muscle tense to the injuries.
Tennyson and King (1976) conducted a series of neck loading cadaveric tests and reported that muscle
tense increased the neck injury in higher acceleration, while muscle tense contributed to the decrease
in neck injury probability in low acceleration. This study suggested inherent performance tradeoffs
in the role of muscle tense on the injury severities in impact loadings. Begeman et al. (1980)
conducted a series of sled test using human volunteers and cadaveric subjects and investigated the
influence of muscle tense on kinematics of the lower extremities. Electromyogram (EMG)
technology was used to identify muscular activities. As the results, they revealed that muscle tense
stiffened up the human body rigidly and alter the overall kinematics of the human body during whole
impact events. Funk et al. (2001) performed cadaveric axial impact tests for the foot and ankle
complex under a condition to simulate entrapped knee. In their tests. a foot plate hit the foot axially
with an initial velocity of 5 m/s while muscular tension forces of 0 kN, 1.7 kN or 2.6 kN were applied
to the Achilles tendon for investigation of muscular effect to skeletal injuries of the lower leg. They
found that the muscular tension force can increase axial compressive force and the possibility of bone
fractures at the distal tibia. On the other hand, some benefit effects of muscle tense were also
reported. Klopp et al. (1995) performed numerical simulation, pendulum tests and sled tests using
dummies and cadavers to investigate muscular effect to occupant injuries. They concluded that
muscular bracing of the legs acted as additional restraints and reduced horizontal pelvic motion.
Levine et al. (1978) conducted frontal impact tests using cadavers restrained by a three-point belt
system equipped with and without a knee brace which simulated muscular tense of quadriceps in thigh.
They found that the knee brace played a role in the prevention of submarining in frontal collisions.
Therefore, the muscle tense appears to have both aspects of advantage and disadvantage for occupant
injuries. However, it is not fully understood how muscle tense affects the impact responses and
injury severities.
This study particularly focused on the lower extremity of vehicular occupants, because the lower
extremity is the second most commonly injured body part for vehicular occupants (States, 1986;
Morgan et al., 1991). Additionally, some lower extremity injuries might cause long term disability
and impairment (States, 1986), while those are not fatal ones. Morgan et al. (1991) estimated that
pedal interaction was the major cause of foot and ankle injuries based on NASS database. Their
IRCOBI Conference - Maastricht (The Netherlands) - September 2007 127
analysis showed that 57 % of the drivers who sustained moderate or greater ankle injuries were injured
while the foot was on the pedal. However, there are no accident data to explain how the muscle tense
in bracing affects the ankle injuries of drivers. Finite Element Method (FEM) simulations using
human body models with and without muscle activation have the possibility to investigate the
muscular effects.
A great number of finite element (FE) models of human body has been developed and validated
against cadaveric experimental data. Although few studies (e.g. Camacho, et al., 1997) attempted to
validate them for volunteer subjects with muscle tense, most of FE studies could not indicate the
effects of muscle tense on impact responses and injuries due to limitations of FE techniques.
Recently, Choi et al. (2005) conducted both of sled tests using eight volunteer subjects and
computational analysis using a human FE model in frontal impact. They used the EMG as an
indicator of muscle activation levels and normalized it against that of maximal voluntary contraction.
Reaction forces on steering wheel and brake pedal predicted by using their FE model with 16 muscles
in the upper and lower extremities agreed with those of experimental data. However, due to the
definition of joint model, bone fractures on the articulated joints or ligamentous injuries could not be
predicted in their model. In addition, muscles in deep layers were not considered in the motion
analysis of the human body. Behr et al. (2006) developed a FE model of the lower limb with 20
independent muscle bundles in the superficial and deep layers and used to investigate the effect of
muscle tense on the skeletal injuries of the lower limb. They found that muscle activation in a frontal
impact loading condition significantly increased the stress level on the tibial shaft. Since their model
did not include muscles of the foot and hip, however, the model was not enough to reproduce driver’s
bracing in an emergency braking.
The aim of this study is to determine how the muscle tense affects the impact responses and injury
severities of the lower extremities. To achieve the research object, this study conducted an
experimental test using a volunteer subject, computational analysis using a musculoskeletal model,
and parametric simulations using FE human model.
METHODS
This study concentrated research objects on a pedal impact to the driver’s sole of the foot during
pressing on the brake. To achieve our research goals, four research steps were conducted in this
study: (1) experimental study using a human volunteer, (2) prediction of muscle activation levels from
obtained experimental data by using a 3D musculoskeletal model, (3) reconstruction of the volunteer’s
bracing condition using a 3D FE human model, and (4) parametric study for pre-impact muscular
conditions. Detailed explanations are expressed in the following sections.
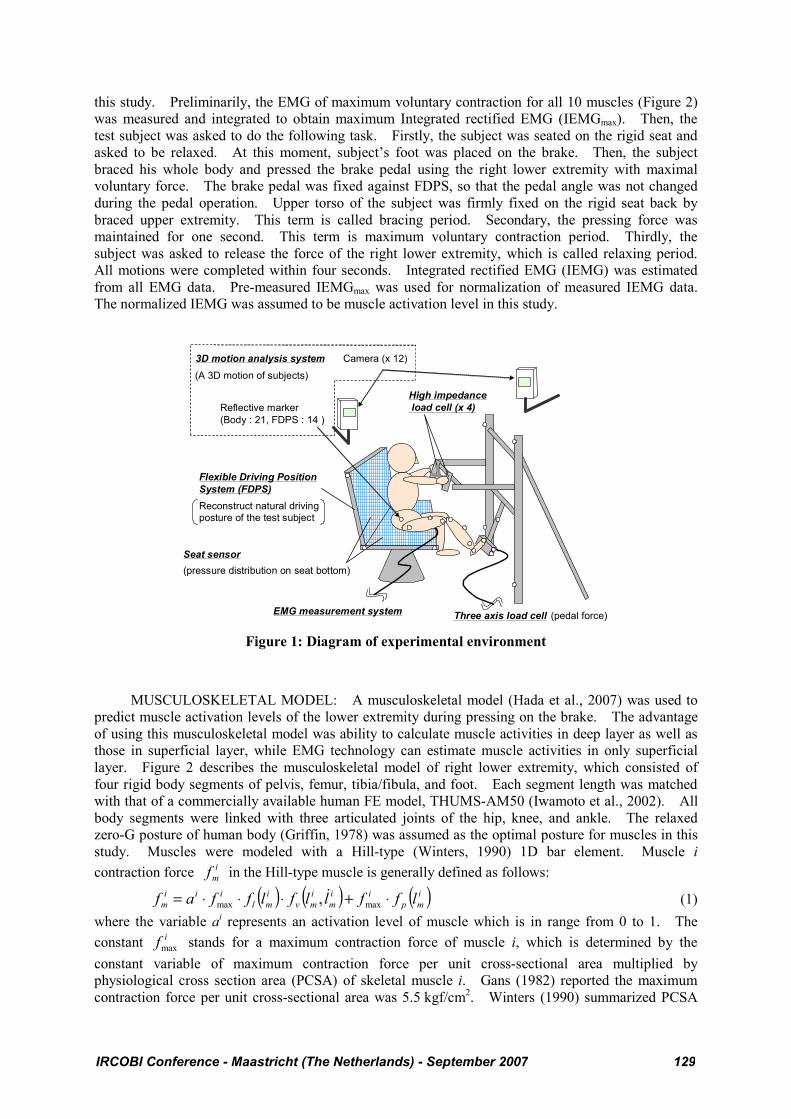
EXPERIMENTAL STUDY: An experimental system (Figure 1) was developed in order to
obtain 3D motion, reaction forces, and muscle activation levels of the subject’s right lower extremities
during pressing on the brake. A flexible driving position system (FDPS) provided a vehicular driving
environment. All positions and angles of FDPS including a rigid seat bottom, rigid seatback, steering
handle, and brake pedal were adjusted to provide a volunteer subject’s usual driving posture. A 3D
motion analysis system (Eagle/Hawk digital system, Motion Analysis, USA) was used to capture a
motion of human body and a part of FDPS segments. Reflective markers were placed on the
subject’s pelvis, right lower extremity, and surface of FDPS in order to identify their kinematics. To
identify translational and rotational positions of body segments in the global coordinate system, each
segment had the local coordinates using a group of three or more markers. Seventeen and fourteen
markers were used for the test subject and FDPS, respectively. At the same time, pedal force,
reaction forces on the steering handle, muscle activities of lower extremity, and pressure distributions
on a flat rigid seat back and bottom were measured using a three-axis load cell (9602A, Kistler,
Germany), high impedance load cell (9212, Kistler, Germany), an EMG measurement system
(MP150, Biopac systems, USA), and a seat sensor (BigMat, Nitta, Japan), respectively. Motion data
were captured at a sampling rate of 100 Hz. The pedal force, reaction force on the steering handle,
and EMG were sampled at 1 kHz and then EMG data were filtered using a low pass filter of 500 Hz.
However, due to limitation of sampling rates, pressure distribution of the seat sensor was sampled at
100 Hz. A single trigger pulse synchronized all measurement systems.
A 31 years old human male volunteer who had a height of 1.77 m and a weight of 75 kg, which
were similar as those of a mid-size male (American Male 50th percentile: AM50), was employed for
128 IRCOBI Conference - Maastricht (The Netherlands) - September 2007
this study. Preliminarily, the EMG of maximum voluntary contraction for all 10 muscles (Figure 2)
was measured and integrated to obtain maximum Integrated rectified EMG (IEMGmax). Then, the
test subject was asked to do the following task. Firstly, the subject was seated on the rigid seat and
asked to be relaxed. At this moment, subject’s foot was placed on the brake. Then, the subject
braced his whole body and pressed the brake pedal using the right lower extremity with maximal
voluntary force. The brake pedal was fixed against FDPS, so that the pedal angle was not changed
during the pedal operation. Upper torso of the subject was firmly fixed on the rigid seat back by
braced upper extremity. This term is called bracing period. Secondary, the pressing force was
maintained for one second. This term is maximum voluntary contraction period. Thirdly, the
subject was asked to release the force of the right lower extremity, which is called relaxing period.
All motions were completed within four seconds. Integrated rectified EMG (IEMG) was estimated
from all EMG data. Pre-measured IEMGmax was used for normalization of measured IEMG data.
The normalized IEMG was assumed to be muscle activation level in this study.
Camera (x 12)
Three axis load cellEMG measurement system
Flexible Driving Position
System (FDPS)
Seat sensor
Reflective marker
(Body : 21, FDPS : 14 )
3D motion analysis system
(A 3D motion of subjects)
Reconstruct natural driving posture of the test subject
(pressure distribution on seat bottom)
(pedal force)
High impedance
load cell (x 4)
Figure 1: Diagram of experimental environment
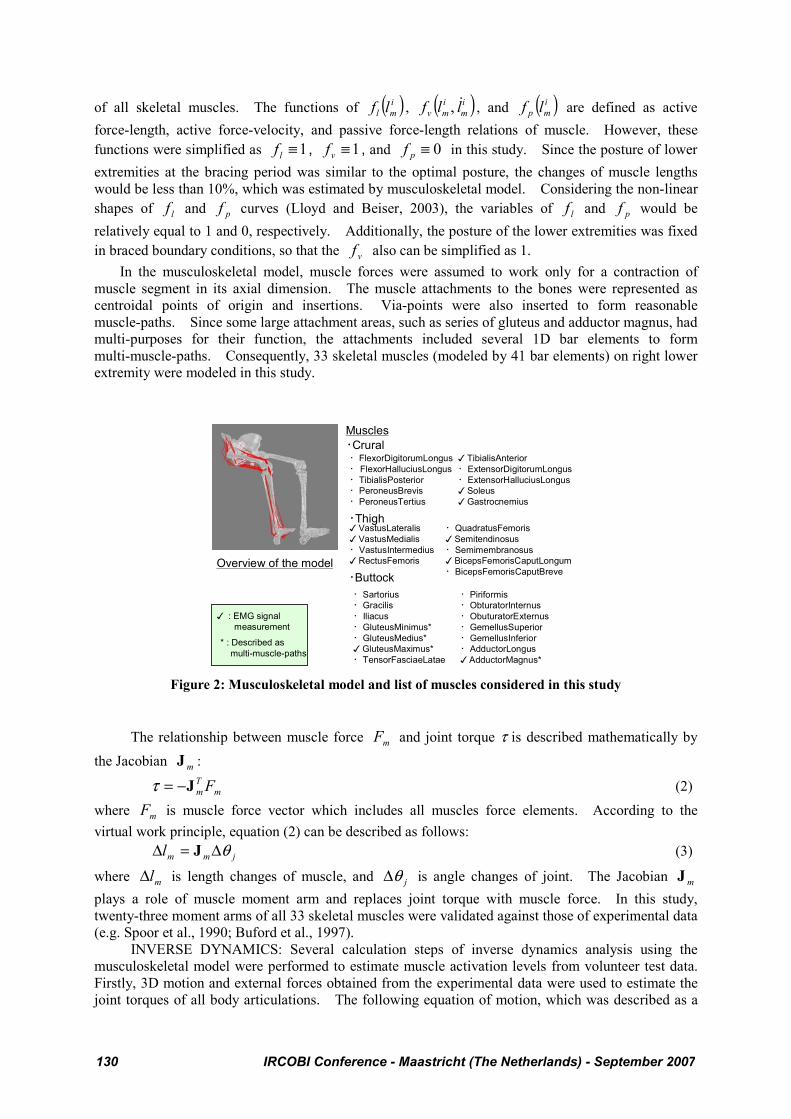
MUSCULOSKELETAL MODEL: A musculoskeletal model (Hada et al., 2007) was used to
predict muscle activation levels of the lower extremity during pressing on the brake. The advantage
of using this musculoskeletal model was ability to calculate muscle activities in deep layer as well as
those in superficial layer, while EMG technology can estimate muscle activities in only superficial
layer. Figure 2 describes the musculoskeletal model of right lower extremity, which consisted of
four rigid body segments of pelvis, femur, tibia/fibula, and foot. Each segment length was matched
with that of a commercially available human FE model, THUMS-AM50 (Iwamoto et al., 2002). All
body segments were linked with three articulated joints of the hip, knee, and ankle. The relaxed
zero-G posture of human body (Griffin, 1978) was assumed as the optimal posture for muscles in this
study. Muscles were modeled with a Hill-type (Winters, 1990) 1D bar element. Muscle i
contraction force i
mf in the Hill-type muscle is generally defined as follows:
( ) ( ) ( )i
mp
ii
m
i
mv
i
ml
iii
m lffllflffaf ⋅+⋅⋅⋅= maxmax , $ (1)
where the variable ai represents an activation level of muscle which is in range from 0 to 1. The
constant ifmax stands for a maximum contraction force of muscle i, which is determined by the
constant variable of maximum contraction force per unit cross-sectional area multiplied by
physiological cross section area (PCSA) of skeletal muscle i. Gans (1982) reported the maximum
contraction force per unit cross-sectional area was 5.5 kgf/cm2. Winters (1990) summarized PCSA
IRCOBI Conference - Maastricht (The Netherlands) - September 2007 129
of all skeletal muscles. The functions of ( )i
ml lf , ( )i
m
i
mv llf $, , and ( )i
mp lf are defined as active
force-length, active force-velocity, and passive force-length relations of muscle. However, these
functions were simplified as 1≡lf , 1≡vf , and 0≡pf in this study. Since the posture of lower
extremities at the bracing period was similar to the optimal posture, the changes of muscle lengths
would be less than 10%, which was estimated by musculoskeletal model. Considering the non-linear
shapes of lf and pf curves (Lloyd and Beiser, 2003), the variables of lf and pf would be
relatively equal to 1 and 0, respectively. Additionally, the posture of the lower extremities was fixed
in braced boundary conditions, so that the vf also can be simplified as 1.
In the musculoskeletal model, muscle forces were assumed to work only for a contraction of
muscle segment in its axial dimension. The muscle attachments to the bones were represented as
centroidal points of origin and insertions. Via-points were also inserted to form reasonable
muscle-paths. Since some large attachment areas, such as series of gluteus and adductor magnus, had
multi-purposes for their function, the attachments included several 1D bar elements to form
multi-muscle-paths. Consequently, 33 skeletal muscles (modeled by 41 bar elements) on right lower
extremity were modeled in this study.
恪Thigh
恪Crural
恪Buttock
恪FlexorDigitorumLongus
恪 FlexorHalluciusLongus
恪TibialisPosterior
恪PeroneusBrevis
恪PeroneusTertius
嚊 VastusLateralis
嚊 VastusMedialis
恪VastusIntermedius
嚊 RectusFemoris
嚊 TibialisAnterior
恪ExtensorDigitorumLongus
恪ExtensorHalluciusLongus
嚊 Soleus
嚊 Gastrocnemius
恪Sartorius
恪Gracilis
恪Iliacus
恪GluteusMinimus*
恪GluteusMedius*
嚊 GluteusMaximus*
恪TensorFasciaeLatae
恪QuadratusFemoris
嚊 Semitendinosus
恪Semimembranosus
嚊 BicepsFemorisCaputLongum
恪BicepsFemorisCaputBreve
恪Piriformis
恪ObturatorInternus
恪ObuturatorExternus
恪GemellusSuperior
恪GemellusInferior
恪AdductorLongus
嚊 AdductorMagnus*
Overview of the model
Muscles
* : Described as
multi-muscle-paths
嚊 : EMG signal
measurement
Figure 2: Musculoskeletal model and list of muscles considered in this study
The relationship between muscle force mF and joint torque τ is described mathematically by
the Jacobian mJ :
m
T
m FJ−=τ (2)
where mF is muscle force vector which includes all muscles force elements. According to the
virtual work principle, equation (2) can be described as follows:
jmml θΔ=Δ J (3)
where mlΔ is length changes of muscle, and jθΔ is angle changes of joint. The Jacobian mJ
plays a role of muscle moment arm and replaces joint torque with muscle force. In this study,
twenty-three moment arms of all 33 skeletal muscles were validated against those of experimental data
(e.g. Spoor et al., 1990; Buford et al., 1997).
INVERSE DYNAMICS: Several calculation steps of inverse dynamics analysis using the
musculoskeletal model were performed to estimate muscle activation levels from volunteer test data.
Firstly, 3D motion and external forces obtained from the experimental data were used to estimate the
joint torques of all body articulations. The following equation of motion, which was described as a
130 IRCOBI Conference - Maastricht (The Netherlands) - September 2007
function of joint angle vector )(tq , was used to determine joint torques τ of all joints:
e
T
e FJqgqqhqqM −=+⋅+ τ)()()( $$$ (4)
where the variables of )(tq$ and )(tq$$ are angular vectors of joint velocity and acceleration,
respectively. The functions of M , h , and g represent an inertia matrix, centrifugal and coriolis force
term, and a gravity force term, respectively. The symbols of eF , and eJ stand for external forces
and Jacobian matrix for external forces, respectively. The boundary condition of the musculoskeletal
model was assumed that effect of upper body forces could be replaced with the fixed pelvis in this
study. The fixed pelvis caused associated forces and moments at the hip joints in solving the inverse
dynamics problem.
Secondary, obtained joint torque τ from equation (4) was assigned to muscle forces based on the
equation (2). Since the number of muscles was generally greater than degrees of freedom of
articulated joints, an optimization method is required to determine the muscle forces. This study
assumed the principal of minimal total squared non-dimensional muscle force. The objective
function E(Fm) for optimization is defined as follows:
m
TT
mm FWWFFE =)( (5)
The tensor of W is a diagonal matrix of weighting factor and defined as follows:
{ }ikdiagW ρ/1.= (6)
where the constant k is coefficient which represents muscle force per unit area, and constant iρ is
PCSA of muscle i.
Finally, muscle activation level was obtained as a ratio of estimated muscle force against the
maximum voluntary contraction force. In this study, the predicted muscle activation levels at a
moment of pressing on the brake were used as inputs for a FE human model. More detailed
descriptions for the musculoskeletal model and inverse dynamics are reported in the previous reports
(Hada et al., 2007; Yamada and Hada, 2007).
VALIDATION FOR PREDICTED MUSCLE ACTIVATION LEVELS: Yamada and Hada
(2007) reported on a validation of the musculoskeletal model used in this study. In their report,
another series of volunteer test using three subjects was conducted to estimate the normalized IEMG.
Additionally, the subjects performed braking motion in three different ankle joint rotated conditions.
As the result, the pattern of normalized IEMG, predicted muscle activation levels of each subjects, and
postures were well matched together.
HUMAN FE MODEL: A commercially available mid-sized human male occupant model
THUMS-AM50 (Version 1.61, Toyota Central R&D Labs., Inc.; Iwamoto et al., 2002) was used with
some modifications of geometry and FE mesh of the lower extremity. The cortical bone of lower
extremity was represented by the elastic plastic solid elements. The material properties were
determined from the previous report (Iwamoto et al., 2005). The yield stress of 95.4 MPa and
ultimate plastic strain of 2.0% were assumed for cortical bone of the tibia. The hip and knee
articulations were assumed as a rotational joint, however, ankle articulation was modeled as
bone-to-bone contacts without joint definition and the joint stiffness was controlled by major
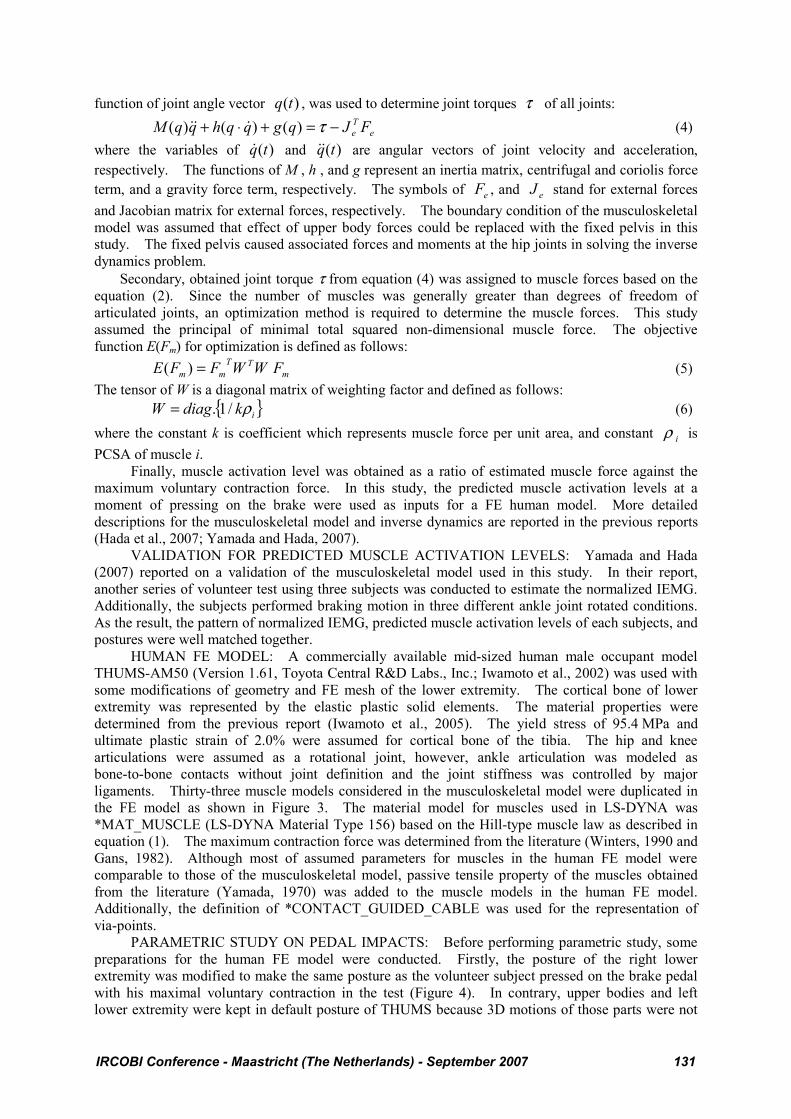
ligaments. Thirty-three muscle models considered in the musculoskeletal model were duplicated in
the FE model as shown in Figure 3. The material model for muscles used in LS-DYNA was
*MAT_MUSCLE (LS-DYNA Material Type 156) based on the Hill-type muscle law as described in
equation (1). The maximum contraction force was determined from the literature (Winters, 1990 and
Gans, 1982). Although most of assumed parameters for muscles in the human FE model were
comparable to those of the musculoskeletal model, passive tensile property of the muscles obtained
from the literature (Yamada, 1970) was added to the muscle models in the human FE model.
Additionally, the definition of *CONTACT_GUIDED_CABLE was used for the representation of
via-points.
PARAMETRIC STUDY ON PEDAL IMPACTS: Before performing parametric study, some
preparations for the human FE model were conducted. Firstly, the posture of the right lower
extremity was modified to make the same posture as the volunteer subject pressed on the brake pedal
with his maximal voluntary contraction in the test (Figure 4). In contrary, upper bodies and left
lower extremity were kept in default posture of THUMS because 3D motions of those parts were not
IRCOBI Conference - Maastricht (The Netherlands) - September 2007 131
captured. Secondly, pressure distributions on the seat bottom were calculated using the modified
human FE model and compared with those obtained from the volunteer test to reproduce the volunteer
test condition. In this study, muscles were represented as a 1D bar element, which can simulate only
for contractional direction force. However, the effect of muscular volume and stiffness changes
could not be represented in the lower extremity model. Therefore, this study compared the patterns
of pressure distribution at the moment before bracing. Then, the model posture was slightly modified
to fit the posture of bracing period.
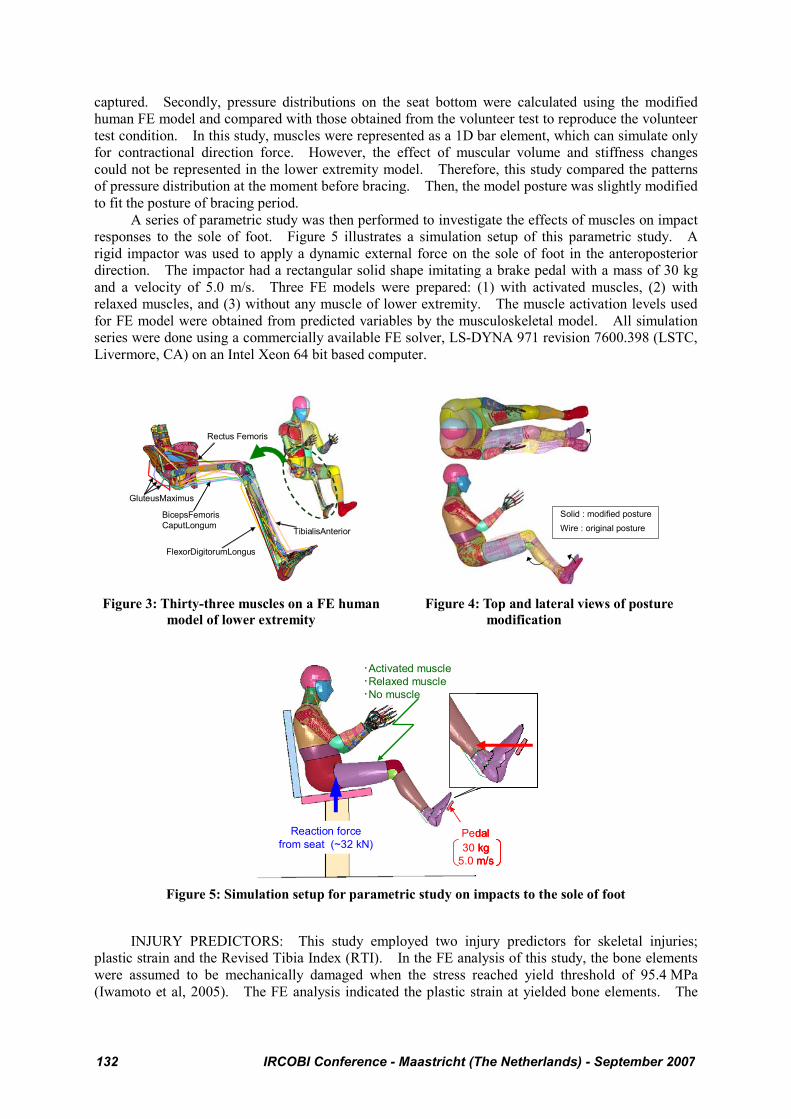
A series of parametric study was then performed to investigate the effects of muscles on impact
responses to the sole of foot. Figure 5 illustrates a simulation setup of this parametric study. A
rigid impactor was used to apply a dynamic external force on the sole of foot in the anteroposterior
direction. The impactor had a rectangular solid shape imitating a brake pedal with a mass of 30 kg
and a velocity of 5.0 m/s. Three FE models were prepared: (1) with activated muscles, (2) with
relaxed muscles, and (3) without any muscle of lower extremity. The muscle activation levels used
for FE model were obtained from predicted variables by the musculoskeletal model. All simulation
series were done using a commercially available FE solver, LS-DYNA 971 revision 7600.398 (LSTC,
Livermore, CA) on an Intel Xeon 64 bit based computer.
Rectus Femoris
BicepsFemoris
CaputLongum
GluteusMaximus
FlexorDigitorumLongus
TibialisAnterior
Solid : modified posture
Wire : original posture
Figure 3: Thirty-three muscles on a FE human
model of lower extremity
Figure 4: Top and lateral views of posture
modification
30 kg
5.0 m/s
恪Activated muscle
恪Relaxed muscle
恪No muscle
Reaction force
from seat (~32 kN)Pedal
30 kg
5.0 m/s
恪Activated muscle
恪Relaxed muscle
恪No muscle
Reaction force
from seat (~32 kN)Pedal
30 kg
5.0 m/s
恪Activated muscle
恪Relaxed muscle
恪No muscle
Reaction force
from seat (~32 kN)Pedal
Figure 5: Simulation setup for parametric study on impacts to the sole of foot
INJURY PREDICTORS: This study employed two injury predictors for skeletal injuries;
plastic strain and the Revised Tibia Index (RTI). In the FE analysis of this study, the bone elements
were assumed to be mechanically damaged when the stress reached yield threshold of 95.4 MPa
(Iwamoto et al, 2005). The FE analysis indicated the plastic strain at yielded bone elements. The
132 IRCOBI Conference - Maastricht (The Netherlands) - September 2007
RTI (Kuppa et al., 2001) was described to suggest the probability of leg fracture (AIS 2+) as the
following equation,
12240
MFRTI += (7)
where the variable F is the measured compressive axial force (kN), the variable M is the resultant
bending moment in the X and Y directions (Nm). According to risk curves proposed by Kuppa et al.,
(2001), the RTI values of 1.16, 1.0, and 0.91 correspond 25%, 33%, and 50% probability of the AIS
2+ leg injury.
RESULTS
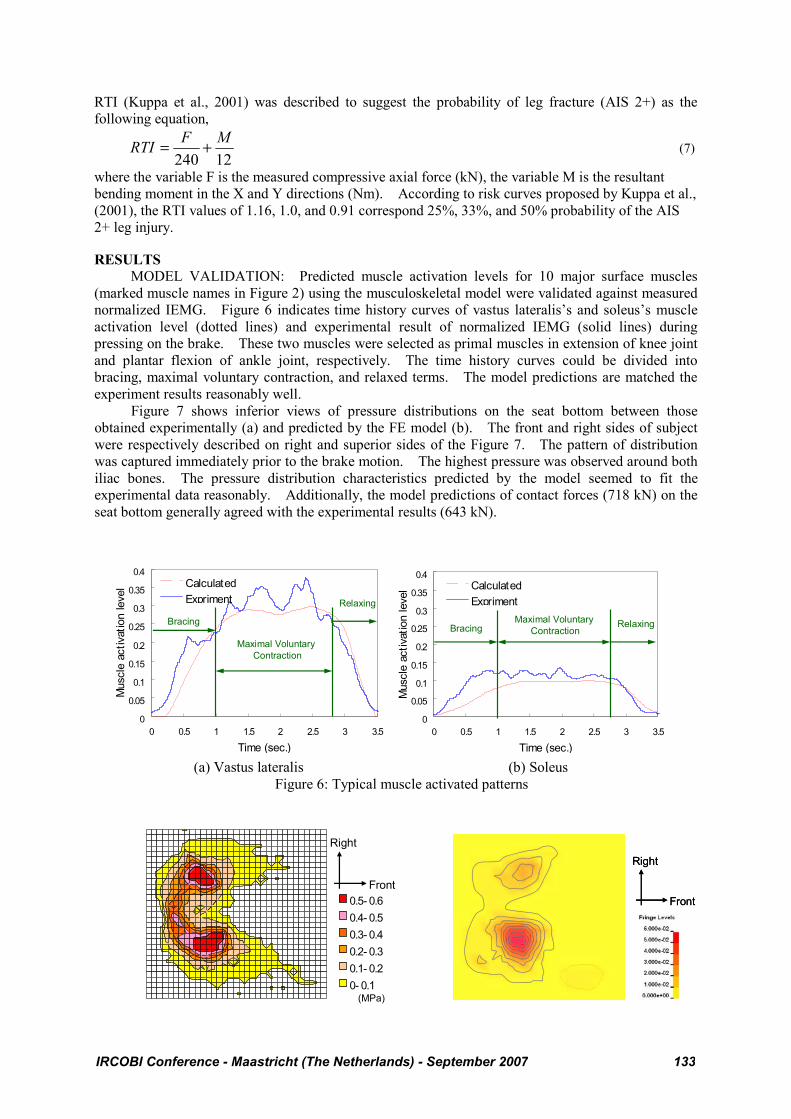
MODEL VALIDATION: Predicted muscle activation levels for 10 major surface muscles
(marked muscle names in Figure 2) using the musculoskeletal model were validated against measured
normalized IEMG. Figure 6 indicates time history curves of vastus lateralis’s and soleus’s muscle
activation level (dotted lines) and experimental result of normalized IEMG (solid lines) during
pressing on the brake. These two muscles were selected as primal muscles in extension of knee joint
and plantar flexion of ankle joint, respectively. The time history curves could be divided into
bracing, maximal voluntary contraction, and relaxed terms. The model predictions are matched the
experiment results reasonably well.
Figure 7 shows inferior views of pressure distributions on the seat bottom between those
obtained experimentally (a) and predicted by the FE model (b). The front and right sides of subject
were respectively described on right and superior sides of the Figure 7. The pattern of distribution
was captured immediately prior to the brake motion. The highest pressure was observed around both
iliac bones. The pressure distribution characteristics predicted by the model seemed to fit the
experimental data reasonably. Additionally, the model predictions of contact forces (718 kN) on the
seat bottom generally agreed with the experimental results (643 kN).
0
0.05
0.1
0.15
0.2
0.25
0.3
0.35
0.4
0 0.5 1 1.5 2 2.5 3 3.5Time (sec.)
Mus
cle
activ
atio
n le
vel Calculated
Expriment
Maximal Voluntary
Contraction
Bracing
Relaxing
0
0.05
0.1
0.15
0.2
0.25
0.3
0.35
0.4
0 0.5 1 1.5 2 2.5 3 3.5Time (sec.)
Mus
cle
activ
atio
n le
vel Calculated
ExprimentMaximal Voluntary
ContractionBracingRelaxing
(a) Vastus lateralis (b) Soleus
Figure 6: Typical muscle activated patterns
Right
Front
(MPa)
0.5- 0.60.4- 0.50.3- 0.40.2- 0.30.1- 0.20- 0.1
Right
Front
Right
Front
IRCOBI Conference - Maastricht (The Netherlands) - September 2007 133
(a) Experimental (b) FE analysis
Figure 7: Pressure distribution between a test subject and a seat bottom (inferior view)
The peak force on the brake pedal was 710 N in this study. This variable was comparable to
previous reports; Owen et al. (1998) reported that the emergency braking force was ranged from 431
to 1150 N (4 male; Height, 1.72-1.76 m; Age, 20-50) using a driving simulator, while Yoshida (1998)
reported 800 N of the brake pedal force.
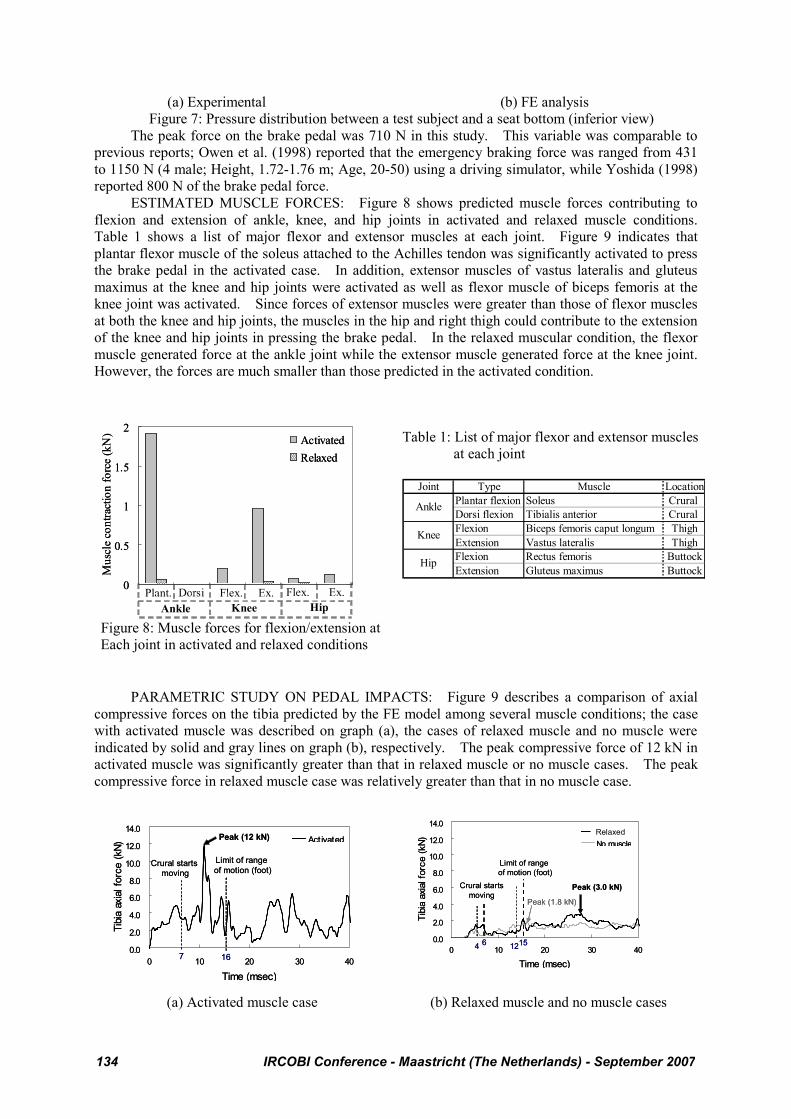
ESTIMATED MUSCLE FORCES: Figure 8 shows predicted muscle forces contributing to
flexion and extension of ankle, knee, and hip joints in activated and relaxed muscle conditions.
Table 1 shows a list of major flexor and extensor muscles at each joint. Figure 9 indicates that
plantar flexor muscle of the soleus attached to the Achilles tendon was significantly activated to press
the brake pedal in the activated case. In addition, extensor muscles of vastus lateralis and gluteus
maximus at the knee and hip joints were activated as well as flexor muscle of biceps femoris at the
knee joint was activated. Since forces of extensor muscles were greater than those of flexor muscles
at both the knee and hip joints, the muscles in the hip and right thigh could contribute to the extension
of the knee and hip joints in pressing the brake pedal. In the relaxed muscular condition, the flexor
muscle generated force at the ankle joint while the extensor muscle generated force at the knee joint.
However, the forces are much smaller than those predicted in the activated condition.
Table 1: List of major flexor and extensor muscles
at each joint
Plant. Dorsi Flex. Ex. Flex. Ex.
Ankle Knee Hip
0
0.5
1
1.5
2
1 2 3 4 5 6
Mu
scle
co
ntr
acti
on
fo
rce
(kN
)
Activated
Relaxed
Plant. Dorsi Flex. Ex. Flex. Ex.
Ankle Knee Hip
0
0.5
1
1.5
2
1 2 3 4 5 6
Mu
scle
co
ntr
acti
on
fo
rce
(kN
)
Activated
Relaxed
Figure 8: Muscle forces for flexion/extension at
Each joint in activated and relaxed conditions
Joint Type Muscle Location
Plantar flexion Soleus Crural
Dorsi flexion Tibialis anterior Crural
Flexion Biceps femoris caput longum Thigh
Extension Vastus lateralis Thigh
Flexion Rectus femoris Buttock
Extension Gluteus maximus Buttock
Ankle
Knee
Hip
PARAMETRIC STUDY ON PEDAL IMPACTS: Figure 9 describes a comparison of axial
compressive forces on the tibia predicted by the FE model among several muscle conditions; the case
with activated muscle was described on graph (a), the cases of relaxed muscle and no muscle were
indicated by solid and gray lines on graph (b), respectively. The peak compressive force of 12 kN in
activated muscle was significantly greater than that in relaxed muscle or no muscle cases. The peak
compressive force in relaxed muscle case was relatively greater than that in no muscle case.
0.0
2.0
4.0
6.0
8.0
10.0
12.0
14.0
0 10 20 30 40
Time (msec)
Tibia
axia
l for
ce (k
N)
Act ivated
Crural startsmoving
Peak (12 kN)
Limit of range
of motion (foot)
1670.0
2.0
4.0
6.0
8.0
10.0
12.0
14.0
0 10 20 30 40
Time (msec)
Tibia
axia
l for
ce (k
N)
Act ivated
Crural startsmoving
Peak (12 kN)
Limit of range
of motion (foot)
167
0.0
2.0
4.0
6.0
8.0
10.0
12.0
14.0
0 10 20 30 40
Time (msec)
Tibia
axia
l for
ce (k
N)
RestedNo muscle
Peak (3.0 kN)Crural starts
moving
6
Limit of range
of motion (foot)
15
Peak (1.8 kN)
4 12
Relaxed
0.0
2.0
4.0
6.0
8.0
10.0
12.0
14.0
0 10 20 30 40
Time (msec)
Tibia
axia
l for
ce (k
N)
RestedNo muscle
Peak (3.0 kN)Crural starts
moving
6
Limit of range
of motion (foot)
15
Peak (1.8 kN)
4 12
Relaxed
(a) Activated muscle case (b) Relaxed muscle and no muscle cases
134 IRCOBI Conference - Maastricht (The Netherlands) - September 2007
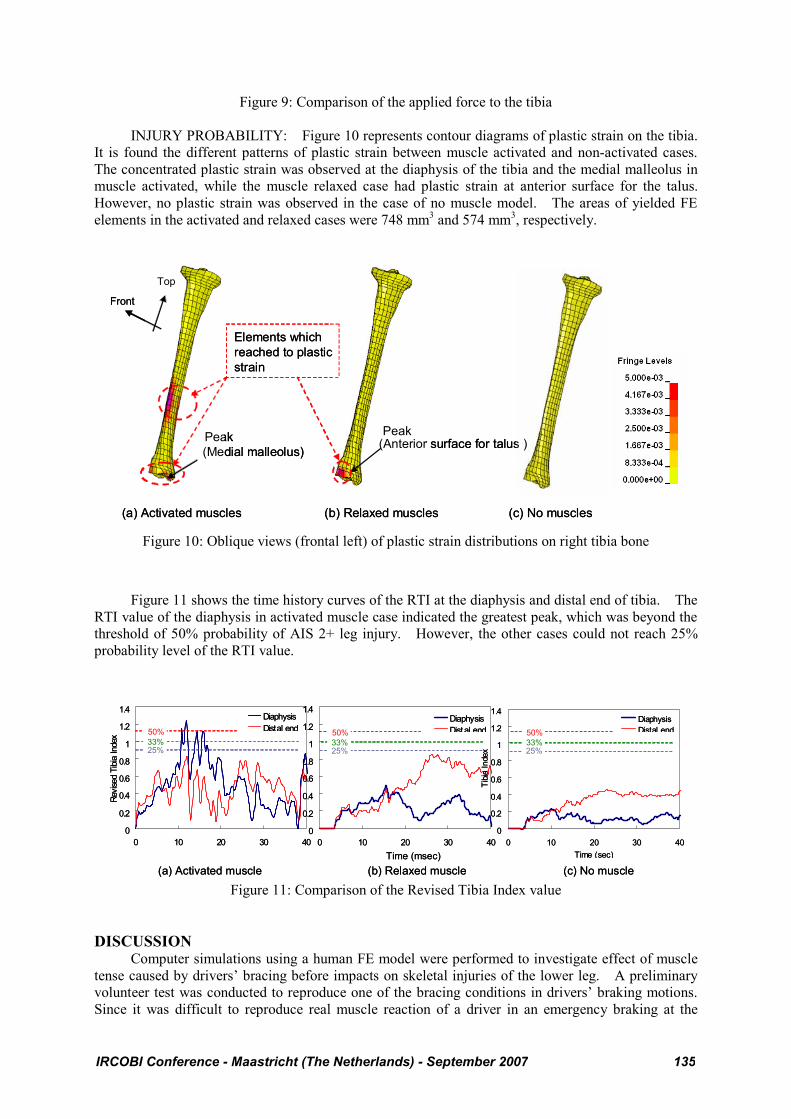
Figure 9: Comparison of the applied force to the tibia
INJURY PROBABILITY: Figure 10 represents contour diagrams of plastic strain on the tibia.
It is found the different patterns of plastic strain between muscle activated and non-activated cases.
The concentrated plastic strain was observed at the diaphysis of the tibia and the medial malleolus in
muscle activated, while the muscle relaxed case had plastic strain at anterior surface for the talus.
However, no plastic strain was observed in the case of no muscle model. The areas of yielded FE
elements in the activated and relaxed cases were 748 mm3 and 574 mm3, respectively.
Elements which
reached to plastic
strain
(a) Activated muscles
(Medial malleolus)(Anterior surface for talus )
PeakPeak
(b) Relaxed muscles (c) No muscles
Front
Top
Elements which
reached to plastic
strain
(a) Activated muscles
(Medial malleolus)(Anterior surface for talus )
PeakPeak
(b) Relaxed muscles (c) No muscles
Front
Top
Figure 10: Oblique views (frontal left) of plastic strain distributions on right tibia bone
Figure 11 shows the time history curves of the RTI at the diaphysis and distal end of tibia. The
RTI value of the diaphysis in activated muscle case indicated the greatest peak, which was beyond the
threshold of 50% probability of AIS 2+ leg injury. However, the other cases could not reach 25%
probability level of the RTI value.
0
0.2
0.4
0.6
0.8
1
1.2
1.4
0 10 20 30 40
Revis
ed T
ibia
Index
DiaphysisDistal end
0
0.2
0.4
0.6
0.8
1
1.2
1.4
0 10 20 30 40
DiaphysisDistal end
0
0.2
0.4
0.6
0.8
1
1.2
1.4
0 10 20 30 40Time (sec)
Tibia
Inde
x
DiaphysisDistal end
(b) Relaxed muscle(a) Activated muscle (c) No muscle
25%33%
50%
25%33%
50%
25%33%
50%
Time (msec)
0
0.2
0.4
0.6
0.8
1
1.2
1.4
0 10 20 30 40
Revis
ed T
ibia
Index
DiaphysisDistal end
0
0.2
0.4
0.6
0.8
1
1.2
1.4
0 10 20 30 40
DiaphysisDistal end
0
0.2
0.4
0.6
0.8
1
1.2
1.4
0 10 20 30 40Time (sec)
Tibia
Inde
x
DiaphysisDistal end
(b) Relaxed muscle(a) Activated muscle (c) No muscle
25%33%
50%
25%33%
50%
25%33%
50%
Time (msec)
Figure 11: Comparison of the Revised Tibia Index value
DISCUSSION Computer simulations using a human FE model were performed to investigate effect of muscle
tense caused by drivers’ bracing before impacts on skeletal injuries of the lower leg. A preliminary
volunteer test was conducted to reproduce one of the bracing conditions in drivers’ braking motions.
Since it was difficult to reproduce real muscle reaction of a driver in an emergency braking at the
IRCOBI Conference - Maastricht (The Netherlands) - September 2007 135
laboratory test, however, a 31 years old male subject, who was similar to the body size of AM50 and
had 11 years experience as a driver, was asked to press a brake pedal by his right leg with his maximal
voluntary contraction in this study. Although it is still unknown if a driver can yield the maximal
voluntary contraction in an emergency braking before impact, in this study, this particular test
condition was used to investigate effect of muscle tense in bracing on the lower leg skeletal injury of a
driver similar to AM50.
Based on the measurements obtained from the volunteer test, in this study, activation level of
each muscle was estimated by using a musculoskeletal model which could simulate 33 skeletal
muscles of the right lower extremity including deep layer as well as superficial layer. In previous
studies using cadaver tests and computer simulations, only an Achilles tendon force or muscular forces
contributing to flexion of the ankle joint were considered to investigate the muscular effects for the
lower leg skeletal injuries (e.g. Funk et al., 2001 and Kitagawa et al., 1998). However, each muscle
collaboratively works with the other muscles during a human motion. Therefore, several muscles of
the lower extremity can work together in a braking motion. In our previous work, we conducted a
series of volunteer tests using three male subjects to measure activation level of each muscle in the
lower extremity during pressing a pedal. We found that some muscles other than the soleus and
gastrocnemial muscle contributing to flexion of the ankle joint were activated in the motion (Hada et
al., 2007). Thus, it is critical to simulate activation levels of all the related muscles to the braking
motion in the lower extremity.
The interaction forces between upper extremity and steering handle as well as forces from the
seat back could affect prediction of muscular activation levels in solving the inverse dynamics
problem. Actually, we measured the interaction forces between the hands and a steering handle and
forces from the seat back in addition to forces from the seat bottom and the pedal force. As a result,
these external forces and muscular forces of whole body worked together and kept the pelvis fixed
during the bracing period. In this study, we focused on the muscular effects of the lower extremity on
the skeletal injuries. Therefore, we simplified the boundary condition of the musculoskeletal model
and assumed that effect of upper body forces could be replaced with the fixed pelvis. The fixed pelvis
caused associated forces and moments at the hip joints in solving the inverse dynamics problem. This
is a first approximation used for application of the lower extremity musculoskeletal model to occupant
injury prediction. Further studies are needed to develop musculoskeletal models of upper bodies and
apply the models to occupant injury prediction.
In previous study performed by Yamada and Hada (2007), the same musculoskeletal model and
optimization method used in this study was used to predict activation levels of each muscle in the right
lower extremity. In their study, three volunteers were employed and asked to press the brake pedal in
three different ankle positions with internal rotation, fullface, and external rotation. Their study
revealed that this musculoskeletal model and optimization method could predict activation level of
each muscle accurately. In addition, activation levels of 10 muscles for the test subject predicted by
the musculoskeletal model in this study showed good agreement with normalized IEMG obtained
from the experimental volunteer test. The predicted activation levels can be assumed as those for an
occupant similar to AM50, although further study is needed to investigate the variability in the muscle
activity among the same size of drivers as AM50.
Activation levels of the muscles predicted by the musculoskeletal model were used as inputs for
the muscle models of the human FE model with the body size of AM50 in bracing. However, in
order to apply the predicted activation level of each muscle to the corresponding muscle of the human
FE model, the human FE model should be comparable in shapes and sizes of the bones, muscle
attachments to the bones, and joint properties with the musculoskeletal model. The musculoskeletal
model was developed based on the skeletal geometry of the human FE model and the muscle
attachments to the bones were duplicated in the human FE model. Although body size and weight of
the subject used in the volunteer test was similar to those of the human FE model, in particular, the
length of skeletal parts in the lower extremity was a little bit different between the subject and the
human FE model. Therefore, the musculoskeletal model was modified to fit the subject’s
anthropometric data before predicting muscle activation levels and then the activation levels were
adjusted to fit the human FE model using some scaling techniques. The hip and knee joints were
modeled using a rotational joint with reasonable material properties and the ankle joint was modeled
as bone-to-bone contacts with major ligaments in the human FE model while all joints of the lower
136 IRCOBI Conference - Maastricht (The Netherlands) - September 2007
extremity in the musculoskeletal model were modeled using a similar type of rotational joint as used in
the human FE model. However, the ankle joint was validated against test data on
dorsiflexion/planterflexion and inversion/eversion of human surrogates (Iwamoto et al., 2000). In
addition, extensor muscle of soleus attached to the Achilles tendon provided muscular force of 1.9 kN
in the parametric simulations with activated muscles (Figure 9). Some researchers provided human
subjects with 1.0 to 2.6 kN of Achilles tendon forces in their experimental cadaver tests based on their
preliminary study in order to investigate the muscular effect for the lower leg skeletal injuries
(e.g. Funk et al., 2001 and Kitagawa et al., 1998). This indicates that the activation levels predicted
by the musculoskeletal model were quite reasonable. Thus, the activation levels predicted by the
musculoskeletal model can be used to reproduce muscle activation levels of the human FE model
when pressing the pedal.
In this study, we assumed that the human body was impacted from the foot by a brake pedal
when the muscle activation levels showed maximal voluntary contracion in order to investigate effect
of muscle tense on lower leg skeletal injuries caused by the intrusion in frontral impacts. To
reproduce the pre-impact situation, the reaction force from the seat bottom was applied to the buttock
and right and left thighs. As shown in Figure 7, the simulation result is comparable in pressure
distribution and contact force to experimental test. Therefore, the pre-impact situation was
reproduced by using the human FE model.
Pedal forces predicted by the FE simulation were comparable to emergency braking forces using
driving simulators obtained from the literature (Owen et al. 1998 and Yoshida et al. 1998). Therefore,
the predicted pedal forces might reproduce those obtained from emergency braking situation.
Parametric simulations on the pedal impacts to the foot demonstrated that there were siginificant
difference in peak compressive forces at the tibia according to the pre-impact conditions on the
muscles. The peak force in the condition with activated muscle was significantly greater than that
with relaxed muscle. As shown in Figure 9, the extensor muscles at the knee and hip joints were
predominantly activated in the pedal impact simulations with activated muscles. This indicates that
the extension of the knee and hip joints and the pedal intrusion prevented the knee from comping
upward. Therefore, activated muscles in the hip and right thigh kept the tibia fixed, and as a result,
they increased the axial compressive force in the activated case. The peak force in the condition with
relaxed muscle was a little bit greater than that without any muscles. This result suggests that passive
muscular property contributed to the increase of the tibial axial force.
This study employed two injury criteria of a plastic strain based criterion and the RTI to
investigate the possibility of bone fractures in the tibia. The plastic strains appearred at both the distal
tibia and tibial diaphysis in the case with activated muscles while the strains appearred only at the
distal tibia with relaxed muscles. The RTI also estimated 50% probability of AIS 2+ leg injury at the
diaphysis with activated muscles while it did not estimate 25% probability of AIS 2+ leg injury at both
the diaphysis and the distal end with relaxed cases. The reason why activated muscle case had the
possibility of bone fractures at the diaphysis is because a bending moment was applied to the tibia due
to preventing the knee from moving upward. The investigation by using two injury criteria suggested
that the activated muscles of the lower extremity could increase the possibility of tibial fractures.
Many researchers conducted cadaver tests on the impacts for the foot with an assumed Achilles
tendon force to reproduce the axial impact for the tibia with a fixation of the proximal tibia, which
simulated an entrapped knee observed in automotive frontal crashes (e.g. Funk et al., 2001 and
Kitagawa et al., 1998). They found bone fractures, in particular, at the tibia, fibula, talus, and
calcaneus and concluded that the muscular tension force at the Achilles tendon could increase bone
fractures in those bones. Some studies using human FE model also provided the same conclusion
(e.g. Iwamoto et al., 2005 and Kitagawa et al., 1998). In this study, as mentioned above, parametric
simulations without the entrapped knee indicated that activated muscles in the hip and right thigh
played a similar role in the entrapped knee and then activated crural muscles could increase tibial
compressive force and possibility of bone fractures at the tibia. According to cadaver tests conducted
by Klopp et al. (1995) and Levine et al.(1978), the activated thigh muscles tend to prevent the knee
from moving forward and keep the knee fixed during frontal collisions. This supports that the
activated muscles in the hip and right thigh cause the entrapped knee in frontal collisions.
IRCOBI Conference - Maastricht (The Netherlands) - September 2007 137
LIMITATIONS OF THIS STUDY: There are some limitations on modeling the muscles in the
occupant FE models used in this study. First of all, each muscle of the right lower extremity in the
occupant FE model was modeled using bar elements and attached to bones by merging nodes between
the muscles and the bones. Therefore, activated muscular force could cause stress concentrations to
generate bone fractures at the muscle attachments. This study avoided the stress concentrations by
representing the elements of bones attached to the muscle as rigid bodies. However, this method can
not be used to evaluate bone fractures at the muscle attachments, although it can be used for bone
fracture predictions at the distal tibia and tibial diaphysis because the middle and distal parts of the
tibia have little muscle attachments. Secondly, via-points of each muscle cannot move in this study,
although actual muscles can slide on the bones according to motions of the human body. Thirdly, the
transverse stiffness of each muscle is the same between activated state and relaxed state, because the
bar elements cannot reproduce the stiffness change in the transverse direction. In addition, the
activation levels were given as constant ones from a driver's maximum voluntary contraction during
the impact simulations. This is because muscle responses for an emergency braking in real-world
accidents are still unknown and the individual variability in muscle activation among the same size of
drivers is not adequately investigated yet. Furthermore, the current musculoskeletal model does not
include muscles of upper bodies. Consequently, the model cannot be used for investigation on effect
of muscle tense in upper extremities and trunk to upper body injuries. Finally, the parametric
simulations performed in this study did not represent inertia effects caused by deceleration during
impacts. Since occupants can move forward due to the inertia effects, the axial compressive force at
the tibia can increase more significantly than without the inertia effects. However, as Klopp et al.
(1995) and Levine et al. (1978) suggest that activated thigh muscles could prevent the occupants from
moving forward, further study is needed to investigate if the thigh muscles are effective to prevent the
submarining or they increase the possibility of bone fractures at the tibia. CONCLUSIONS
This study investigates effects of muscle tense in bracing on impact responses and skeletal
injuries of a driver’s lower extremity in a simulated frontal crash situation with pedal intrusion. An
experimental volunteer test using a male subject with the same size as AM50 was conducted to obtain
some measurements of EMG, pedal force, and pressure distributions of a seat bottom and a seat back
in his maximum voluntary contraction. Based on the experimental test data, muscle activation levels
in bracing were predicted by inverse dynamics analysis using a musculoskeletal model with 33
skeletal muscles of the right lower extremity not only in superficial layer but also in deep layer. The
activation levels of the musculoskeletal model were used as those of an AM50 occupant FE model to
simulate driver’s bracing. Parametric studies on the pedal impacts to the foot were performed using
the occupant FE model with three pre-impact muscular conditions to investigate the effects of muscle
tense on the lower leg skeletal injuries. Simulation results reveal that activated thigh muscles could
cause the entrapped knee in frontal collisions and therefore the activated crural muscles could increase
axial compressive force and possibility of bone fractures at the tibia. However, there are still some
limitations on modeling the muscles in occupant FE models. Further study is needed to improve
stress concentration at muscle attachments and to control via-points in each muscle. Additionally,
the simulation setup used in this study only represents an assumed impact situation without inertia
effects in frontal crashes. Therefore, additional simulations are necessary to elucidate injury
mechanisms of the lower leg with considering effect of the inertia force. Future works include
prediction of muscle activation levels for the upper extremities during pressing a steering wheel or
holding it and investigation of the muscular effects for the skeletal injuries of the upper body.
ACKNOWLEDGMENTS
The authors would like to acknowledge Toyota Technical Development Corporation for their
supports in developing the human FE model. We also wish to thank NAC Image Technology, Inc. in
Japan for their technical supports of motion analysis.
REFERENCES:
(1) Begeman, P., King, A.I., Levine, R., Viano, D.C., (1980), Biodynamic Response ofthe
Musculoskeletal System to Impact Acceleratio. Proc. of the 24nd Stapp Car Crash Conference,
138 IRCOBI Conference - Maastricht (The Netherlands) - September 2007
SAE Paper No. 801312, pp. 479-509.
(2) Behr, M., Arnoux, P-J., Serre, T., Thollon, L., Brunet, C., (2006), Tonic Finite Element Model
of the Lower Limb, Journal of Biomechanical Engineering, Vol. 128, pp.223-228.
(3) Buford, W.L., Ivey, M., Marone, J.D., Patterson, R.M., Peare, G.L., Nguyen, D.K., Stewart,
A.A., (1997) Muscle barance at the knee-moment arms for the normal knee and the ACL-Minus
knee, IEEE Transactions on Rehabilitation Engineering, Vol. 5, No. 4, pp. 367-379.
(4) Camacho, D.L., Nightingale, R.W., Robinette, J.J., Vanguri, S.K., Coates, D.J., and Myers, B.S.
(1997) Experimental flexibility measurements for the development of a computational
head-neck model validated for near-vertex head impact. Proc. 41st Stapp Car Crash Conference,
SAE Paper No. 973345.
(5) Choi, H.Y., Sah, S.J., Lee, B., Cho, H.S., Kang, S.J., Mun, M.S., Lee, I., and Lee, J., (2005),
Experimental and numerical studies of muscular activations of bracing occupant. Paper No.
05-0139-O, Proc. of 19th International Technical Conference on the Enhanced Safety of
Vehicles (ESV), Washington DC.
(6) Crandall, J.R., Portier, L., Petit, P., Hall, G.W., Bass, C.R., Klopp, G.S., Hurwitz, S., Pilkey,
W.D., Trosseille, X., Tarrière, C., and Lassau, J. (1996), Biomechanical Response and Physical
Properties of the Leg, Foot, and Ankle. Proc. of the 40th Stapp Car Crash Conference, pp.
173-192. Society of Automotive Engineers, Warrendale, PA.
(7) Funk J.R., Crandall J.R., Tourret L.J., MacMahon C.B., Bass C.R., Khaewpong N.K., Rppinger
R.H., (2001), The effect of active muscle tension on the axial injury tolerance of the human
foot/ankle complex. Proc. 21st ESV Conference, Paper No. 237, pp. 1-14.
(8) Gans, C. (1982), Fiber architecture and muscle function. Exercise and Sports Sciences Reviws.
10, pp. 106-107.
(9) Griffin, B.N., (1978), Design Guide: The Influence of Zero-G and Acceleration on the Human
Factors of Spacecraft Design, NASA Johnson Space Center.
(10) Hada M., Yamada, D., and Tsuji, T., (2007), An Analysis of Equivalent Impedance
Characteristics by modeling the Human Musculoskeletal Structure as a Multibody System.
Proc. of An ECCOMAS Thematic Conference on Multibody Dynamics, Milano, 25-28 June (in
press).
(11) Iwamoto, M., Tamura, A., Furusu, K., Kato, C., Miki, K., Hasegawa, J., Yang, K.H., (2000),
Development of a Finite Element Model of the Human Lower Extremity for Analyses of
Automotive Crash Injuries, SAE Trans. J. of Passenger Car, Mech.Sys., 109(6), pp.846-853.
(12) Iwamoto, M., Kisanuki Y., Watanabe I., Furusu K., Miki K., Hasegawa J., (2002),
Development of a Finite Element Model of the Total Human Model for Safety (THUMS) and
Application to Injury Reconstruction. Proc., International Research Council on the
Biomechanics of Impact, Munich, Germany, pp. 31-42.
(13) Iwamoto, M., Miki, K., Tanaka, E., (2005), Ankle Skeletal Injury Predictions Using Anisotropic
Inelastic Constitutive Model of Cortical Bone Taking into Account Damage Evolution. Proc.
49st Stapp Car Crash Conference, SAE Paper No. 05S-24.
(14) Kitagawa, Y., Ichikawa, H., King. A.I., and Levine, R.S., (1998), A severe ankle and foot injury
in frontal crashes and its mechanism. Proc. of the 42nd Stapp Car Crash Conference, SAE
Paper No. 983145, Society of Automotive Engineers, Warrendale, PA.
(15) Klopp G.S., Crandall J.R., Sieveka E.M., Pilkey W.D., (1995), Simulation of muscle tensing in
pre-impact bracing. IRCOBI conference 1995, pp.171-182.
(16) Kuppa S., Wang J., Haffner M., Eppinger R., (2001), Lower extremity injuries and associated
injury criteria. Proc. of 17th International Technical Conference on the Enhanced Safety of
Vehicles (ESV), Amsterdam, Netherlands.
(17) Levine R.S., Patrick L.M., Begeman P.C., King A.I., (1978), Effect of quadriceps function on
submarining. Proc. of the 22th Conference of Association for the Advancement of Automotive
Medicine (AAAM), pp. 319-329.
(18) Lloyd D.G. and Besier T.F., (2003) An EMG-driven musculoskeletal model to estimate
muscle forces and knee joint moments in vivo., J. Biomech., 36, pp.765-776.
(19) Morgan, R.M., Eppinger, R.H., Hennessey, B.C., (1991), Ankle Joint Injury Mechanism for
Adults in Fronatal Automotive Impact. Proc. of the 35nd Stapp Car Crash Conference, SAE
Paper No. 912902, pp. 189-198.
IRCOBI Conference - Maastricht (The Netherlands) - September 2007 139
(20) Owen, C., Roberts, A.., Manning, P., Lowne, R., (1998), Positioning and bracing of the lower
leg during emergency braking – A volunteer study., IRCOBI conference 1998, pp. 147-159.
(21) Spoor C.W., Leeuwen, J.L., Meskers, C.G., Titulaer, A.F., Huson, A., (1990), Estimation of
instantaneous moment arms of lower-leg muscles, J.Biomech. Vol. 23, No. 12, pp. 1247-1259.
(22) States, J.D., (1986), Adult Occupant Injuries to the Lower Limb. SAE Pater No. 861927,
pp.97-107.
(23) Tennyson S.A., King A.I., (1976), A Biodynamic Model of the Human Spinal Column. SAE
Paper No. 760771.
(24) Winters, J.M. (1990) ‘Hill-Based Muscle Models: A System Engineering Perspective’, in
Multiple Muscle Systems: Biomechanics and Movement Organization, Winters, J.M. and Woo.
S. (eds.), New York, Springer, pp. 66-93.
(25) Winters, J.M. Woo. S. (1990), Multiple Muscle Systems: Biomechanics and Movement
Organization, New York, Springer, pp. 726-749.
(26) Yamada, H., (1970), Strength of Biological Materials, Williams & Wilkins Company.
(27) Yamada, D., Hada, M., (2007), An Estimation Method of Muscle Force by Variable Moment
Arm Vector, SAE Digital Human Modeling for Design and Engineering Conference and
Exhibition, Seattle, Washington DC., SAE Paper No. 2007-01-2468.
(28) Yoshida, H., Sugitani, T., Ohta, M., (1998), Development of the brake assist sysytem,
International congress and exposition, Detroit, Michigan, SAE Paper No., 980601.
140 IRCOBI Conference - Maastricht (The Netherlands) - September 2007
Recommended


![RESEARCH ARTICLE Open Access Changes of direction …bolic responses to straight-line HIE is improving (e.g., cardiorespiratory [13], muscle tissue oxygenation [14] responses), little](https://img.pdfslide.us/doc/110x75/5f0510f17e708231d4111728/research-article-open-access-changes-of-direction-bolic-responses-to-straight-line.jpg)