EFFECTS OF DEFORESTATION AND RIPARIAN BUFFERS ON LOTIC
COMMUNITIES IN SOUTHEASTERN COSTA RICA: IMPLICATIONS FOR
BIODIVERSITY CONSERVATION IN TROPICAL STREAMS
A Dissertation
Presented in Partial Fulfillment of the Requirements for the
Degree of Doctor of Philosophy
with a Major in Natural Resources
in the College of Graduate Studies
University of Idaho
and in the Graduate School
Centro Agronómico Tropical de Investigación y Enseñanza
by
Christopher M. Lorion
December 2007
Major Professors: Brian Kennedy, Ph.D. and Celia Harvey, Ph.D.

ii
AUTHORIZATION TO SUBMIT DISSERTATION
This dissertation of Christopher M. Lorion submitted for the degree of Doctor of Philosophy
with a major in Natural Resources and titled “Effects of deforestation and riparian buffers on
lotic communities in southeastern Costa Rica: implications for biodiversity conservation in
tropical streams,” has been reviewed in final form. Permission, as indicated by the signatures
and dates given below, is now granted to submit final copies to the College of Graduate
Studies at the University of Idaho (UI), and to the Postgraduate School at the Centro
Agronómico Tropical de Investigación y Enseñanza (CATIE) for approval.
Major Professor _________________________________ Date ________________ Brian Kennedy (UI) Co-Advisor _________________________________ Date ________________ Celia Harvey (CATIE) Committee Members _________________________________ Date ________________ George LaBar (UI)
_________________________________ Date ________________ James Johnson (UI) Department Administrator (UI) _________________________________ Date ________________ Kerry Reese Discipline’s College Dean (UI) _________________________________ Date ________________ Steven Daley-Laursen Final Approval and Acceptance by the College of Graduate Studies (UI) _________________________________ Date ________________ Margrit von Braun And by the Postgraduate School (CATIE)
_________________________________ Date ________________ Glenn Galloway
iii
ABSTRACT
Freshwater biodiversity in the tropics is threatened by a variety of anthropogenic factors,
and land cover change may have the most widespread and pervasive impacts. Costa Rica has
experienced extensive deforestation, and there is a great need to understand how land cover
change has affected stream ecosystems and investigate strategies for mitigating these
impacts. Understanding the distribution of freshwater biodiversity in relatively pristine
systems is also critical for effective conservation planning.
To examine the effects of deforestation on stream communities in southeastern Costa
Rica and test the hypothesis that riparian forest buffers can reduce these effects, comparisons
were made between forested stream reaches and stream reaches adjacent to pasture with and
without a riparian forest buffer. Based on these comparisons, deforestation appeared to
significantly alter the diversity and taxonomic composition of fish and benthic
macroinvertebrate assemblages in the study streams, as well as stream temperatures and
allochthonous inputs. Reaches with a riparian forest buffer, however, generally maintained
aquatic assemblages and stream ecosystem conditions more similar to those observed in
forested reaches. Overall, these results provide support for existing Costa Rican regulations
mandating riparian forest protection, and suggest that appropriate riparian management could
significantly reduce the impacts of deforestation on tropical stream biota.
To investigate landscape-scale patterns in fish diversity, stream fishes were sampled
along an altitudinal gradient of nearly 500 m in the Sixaola River basin. Fish diversity
decreased steeply with increasing elevation, and the main gradient in assemblage structure
was strongly correlated with several stream habitat variables. Diadromous fishes were
common throughout the altitudinal gradient and dominated the highest elevation sites,
highlighting the importance of longitudinal connectivity in Mesoamerican river systems.
Systematic conservation planning that focuses on terrestrial and aquatic ecosystems, as
well as biophysical linkages between these realms, could potentially identify more efficient
and effective reserve networks. A critical evaluation of existing planning methods illustrates
how incorporating linkages among ecosystems increases planning complexity. Several of the
methods reviewed would be applicable to an example planning domain in Costa Rica and
Panama, but new tools will be needed to realize the full potential of a comprehensive
planning approach.

iv
ACKNOWLEDGEMENTS
The research presented in this dissertation would not have been possible without the
unwavering support and guidance provided by Jeffrey H. Braatne, who served as my advisor
for nearly four years. Jeff was a great friend and mentor, and provided invaluable advice and
encouragement even in the last days of his fight against cancer. Special thanks are due to
Brian Kennedy for taking over as my major professor and making time to guide me through
the writing process. Celia Harvey, my co-advisor at CATIE, also deserves special recognition
for her commitment to helping me succeed as a student and for her insightful comments that
greatly improved all of the chapters in the dissertation. George LaBar and Ding Johnson, the
other members of my graduate committee, have provided valuable suggestions and feedback
at all stages of my program, and their contribution to this work is gratefully acknowledged.
My wife Julia Young-Lorion also made an invaluable contribution to the work described
here. Her help in the field was especially important, but she also provided assistance with lab
work, data entry, and myriad other details associated with conducting research in a foreign
country. I am eternally grateful for her patience and support.
Many other people were instrumental in the successful completion of my research in
Costa Rica. Field research for Chapters 1 and 2 was made possible by José Maria López,
Teodoro López, and José Luís Zúñiga, all of whom provided assistance with data collection
and shared their extensive knowledge of the Gandoca-San Miguel area to help me identify
field sites. I am grateful to the landowners who generously provided access to their land,
including the Talamanca-Caribbean Biological Corridor and ANAI Association. Bill
McLarney and Maribel Mafla of ANAI Association also directed me towards potential field
sites and helped me develop the hypotheses that guided my research. Successful completion
of field work for Chapter 3 depended on a host of guides and field assistants. Joselito
Sánchez and Juradir Villanueva made especially important contributions to this work, but
Isaías Almengor, Jeison Chele Rojas, Isaías Hidalgo, Wilbur Hidalgo, Edward Jackson,
Antonio Méndez, Osvaldo Morales, Jonás Oniel, Jorge Pereira, Kattia Rodríguez, Ermelino
Sánchez, Carlos Torres, Elmer Torres, and José Pablo Valladares all provided valuable help
in the field.
I am grateful to Pablo Gutierrez for the hundreds of hours he spent carefully processing
benthic macroinvertebrate samples and for his tremendous help with macroinvertebrate

v
identification. Monika Springer of the University of Costa Rica facilitated this work by
providing lab space, unpublished identification keys, and other logistical support. Monika
also identified particularly difficult specimens, as did Wills Flowers of Florida A&M
University. Laboratory work at CATIE was facilitated by Frank López and the staff of the
CATIE Laboratory of Entomology. Permits to conduct field research and collect specimens
were provided by the Costa Rican Ministry of Environment and Energy (MINAE), with Earl
Junier of the La Amistad-Caribe Conservation Area kindly processing my permit requests.
Permission to conduct research in the Bribri and Cabécar indigenous territories was granted
by the Asociación de Desarrollo Integral del Territorio Indígena Bribri (ADITIBRI) and the
Asociación de Desarrollo Integral del Territorio Indígena Cabécar (ADITICA). Marilyn
Villalobos and Eduardo Somarriba facilitated this process and helped me communicate my
results to landowners and indigenous community leaders.
I would also like to extend my thanks to fellow students at the University of Idaho and
CATIE. In particular, I am grateful to the other IGERT students working in Talamanca, Beth
Polidoro, Jan Schipper, Leigh Winowiecki, and Ruth Dahlquist, all of whom provided ideas,
contacts, logistical help, and other support that made research in Talamanca more feasible.
Jan Schipper and Beth Polidoro also co-authored Chapter 4 of this dissertation. IGERT
students Steve Sesnie and Dina Roberts also contributed many useful ideas and suggestions
along the way. Professor Chris Williams of the University of Idaho was a great help in
finding and applying appropriate statistical techniques for analyzing my data. John Elwood
and Sally Burkhart provided me with an outstanding place to work during the final stages of
writing. Finally, I would like to thank my family for all of their support and encouragement.
Financial support for the research described in this dissertation was provided by a
fellowship from the National Science Foundation’s Integrative Graduate Education and
Research Traineeship (IGERT) program; grant number 0014304 to the University of Idaho.

vi
TABLE OF CONTENTS
Authorization to submit dissertation......................................................................................... ii
Abstract .................................................................................................................................... iii
Acknowledgements.................................................................................................................. iv
Table of contents...................................................................................................................... vi
List of tables........................................................................................................................... viii
List of figures........................................................................................................................... ix
List of appendices ..................................................................................................................... x
Introduction to the Dissertation ............................................................................................... xi
Chapter 1: Riparian forest buffers mitigate the effects of deforestation on fish assemblages in small tropical rainforest streams ........................................................................................... 1
Abstract ............................................................................................................................... 1
Introduction ......................................................................................................................... 1
Methods............................................................................................................................... 4
Results ............................................................................................................................... 11
Discussion ......................................................................................................................... 13
Acknowledgements ........................................................................................................... 19
References ......................................................................................................................... 19
Tables ................................................................................................................................ 26
Figures............................................................................................................................... 31
Appendix ........................................................................................................................... 38
Chapter 2: Relationships between deforestation, riparian forest buffers, and benthic macroinvertebrates in lowland neotropical streams................................................................ 39
Abstract ............................................................................................................................. 39
Introduction ....................................................................................................................... 40
Methods............................................................................................................................. 41
Results ............................................................................................................................... 47
Discussion ......................................................................................................................... 50
Acknowledgements ........................................................................................................... 55
References ......................................................................................................................... 56
Tables ................................................................................................................................ 62
Figures............................................................................................................................... 66
Appendix ........................................................................................................................... 72

vii
Chapter 3: Altitudinal gradients in diversity and diadromy in stream fish assemblages of the Sixaola River basin, Costa Rica.............................................................................................. 75
Abstract ............................................................................................................................. 75
Introduction ....................................................................................................................... 75
Methods............................................................................................................................. 77
Results ............................................................................................................................... 81
Discussion ......................................................................................................................... 85
Acknowledgements ........................................................................................................... 90
References ......................................................................................................................... 90
Tables ................................................................................................................................ 96
Figures............................................................................................................................. 100
Chapter 4: Comprehensive conservation planning: developing a framework for planning across terrestrial, freshwater and marine ecosystems ........................................................... 104
Abstract ........................................................................................................................... 104
Introduction ..................................................................................................................... 104
Discussion ....................................................................................................................... 107
Conclusions ..................................................................................................................... 118
Acknowledgements ......................................................................................................... 119
References ....................................................................................................................... 120
Tables .............................................................................................................................. 129
Figures............................................................................................................................. 131

viii
LIST OF TABLES
Chapter 1 Table 1. Physicochemical characteristics of forest, forest buffer and pasture study reaches in southeastern Costa Rica ................................................................................................ 26
Table 2. Results of repeated measures ANOVA models for fish density, biomass, and species richness with reach type and sample period as fixed effects ................................ 27
Table 3. Results of one-way PERMANOVA tests for differences in species composition of fish assemblages between reach types .......................................................................... 28
Table 4. Results of ANOVA models for the effect of reach type and sampling month on mean, minimum and maximum daily water temperature in April-May 2006, with mean values (± SE) for each reach type...................................................................................... 29
Table 5. Results of repeated measures ANOVA models for habitat and food resource variables, with reach type and sample period as fixed effects .......................................... 30
Chapter 2 Table 1. Mean values of environmental variables in forest, forest buffer, and pasture study reaches in southeastern Costa Rica.......................................................................... 62
Table 2. Results of repeated measures ANOVA models for macroinvertebrate density and diversity with reach type, sample period, and habitat type as fixed effects...................... 63
Table 3. Results of three-way PERMANOVA test for the effects of reach type, sample period, and habitat type on the taxonomic composition of stream macroinvertebrate assemblages....................................................................................................................... 64
Table 4. List of taxa making the largest contributions to dissimilarity between forest and pasture reaches, and between forest buffer and pasture reaches, based on SIMPER analysis .............................................................................................................................. 65
Chapter 3 Table 1. Physical characteristics of study sites in the Sixaola River basin....................... 96
Table 2. List of fish species captured in study sites in the Sixaola River basin, with the total number of individuals of each species captured across all sites ............................... 97
Table 3. Distribution of stream fishes along an altitudinal sampling gradient in the Sixaola River basin, with sites arranged in order of increasing elevation ........................ 98
Table 4. Pearson correlation coefficients of linear relationships between environmental variables and elevation, and the two NMS axes ............................................................... 99
Chapter 4 Table 1.Examples of conservation assessments that include targets and/or identify priority areas for terrestrial and aquatic ecosystems. ................................................................... 129
Table 2. Methods for developing comprehensive conservation plans across terrestrial and aquatic ecosystems, with references that discuss or apply each approach...................... 130
ix
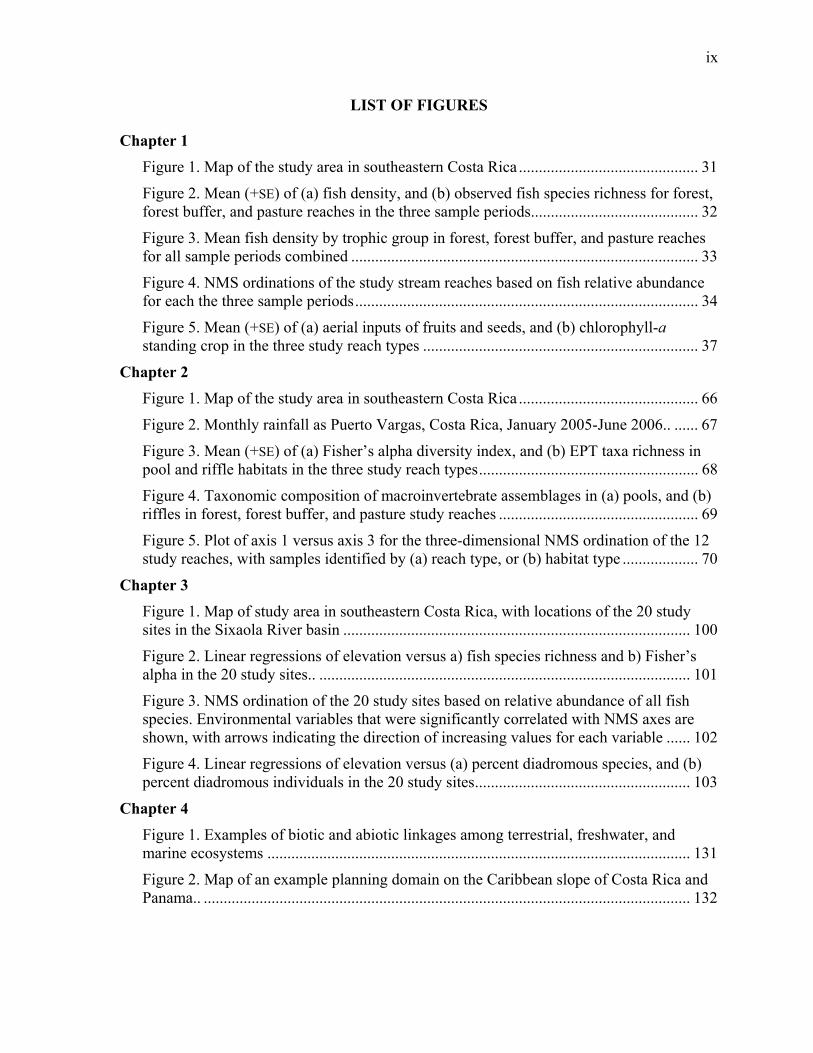
LIST OF FIGURES
Chapter 1 Figure 1. Map of the study area in southeastern Costa Rica ............................................. 31
Figure 2. Mean (+SE) of (a) fish density, and (b) observed fish species richness for forest, forest buffer, and pasture reaches in the three sample periods.......................................... 32
Figure 3. Mean fish density by trophic group in forest, forest buffer, and pasture reaches for all sample periods combined ....................................................................................... 33
Figure 4. NMS ordinations of the study stream reaches based on fish relative abundance for each the three sample periods...................................................................................... 34
Figure 5. Mean (+SE) of (a) aerial inputs of fruits and seeds, and (b) chlorophyll-a standing crop in the three study reach types ..................................................................... 37
Chapter 2 Figure 1. Map of the study area in southeastern Costa Rica ............................................. 66
Figure 2. Monthly rainfall as Puerto Vargas, Costa Rica, January 2005-June 2006.. ...... 67
Figure 3. Mean (+SE) of (a) Fisher’s alpha diversity index, and (b) EPT taxa richness in pool and riffle habitats in the three study reach types....................................................... 68
Figure 4. Taxonomic composition of macroinvertebrate assemblages in (a) pools, and (b) riffles in forest, forest buffer, and pasture study reaches .................................................. 69
Figure 5. Plot of axis 1 versus axis 3 for the three-dimensional NMS ordination of the 12 study reaches, with samples identified by (a) reach type, or (b) habitat type ................... 70
Chapter 3 Figure 1. Map of study area in southeastern Costa Rica, with locations of the 20 study sites in the Sixaola River basin ....................................................................................... 100
Figure 2. Linear regressions of elevation versus a) fish species richness and b) Fisher’s alpha in the 20 study sites.. ............................................................................................. 101
Figure 3. NMS ordination of the 20 study sites based on relative abundance of all fish species. Environmental variables that were significantly correlated with NMS axes are shown, with arrows indicating the direction of increasing values for each variable ...... 102
Figure 4. Linear regressions of elevation versus (a) percent diadromous species, and (b) percent diadromous individuals in the 20 study sites...................................................... 103
Chapter 4 Figure 1. Examples of biotic and abiotic linkages among terrestrial, freshwater, and marine ecosystems .......................................................................................................... 131
Figure 2. Map of an example planning domain on the Caribbean slope of Costa Rica and Panama.. .......................................................................................................................... 132

x
LIST OF APPENDICES
Chapter 1 Appendix 1. Fish species captured in the study streams, with mean density in each reach type across all sample periods and trophic classification for each species, as well as total fish density and biomass for each reach type.................................................................... 38
Chapter 2 Appendix 1. Macroinvertebrate taxa collected in the study streams and their mean density in pool and riffle habitats in forest, buffer, and pasture reaches ....................................... 72

xi
INTRODUCTION TO THE DISSERTATION
Freshwater biodiversity is increasingly imperiled worldwide due to a variety of
anthropogenic impacts that degrade aquatic habitats and fragment populations (Allan and
Flecker 1993, Malmqvist and Rundle 2002). Tropical streams support extraordinarily diverse
communities, and present special conservation challenges due to socioeconomic factors that
constrain management options and the general lack of knowledge concerning the ecology of
these systems (Pringle 2000). Therefore, there is a great need to gain a better understanding
of tropical freshwater biodiversity while developing strategies to maintain the ecological
integrity of tropical streams in increasingly human-dominated landscapes. The work
presented here is aimed at filling current gaps in our understanding of freshwater biodiversity
in an understudied area of Costa Rica, while looking for patterns that may apply more
broadly to biodiversity conservation in tropical streams. The study area in southeastern Costa
Rica, commonly known as Talamanca, is recognized as a globally significant center of
terrestrial biodiversity (Olsen and Dinerstein 2002), but freshwater ecosystems and aquatic
biodiversity also play a critical role in the sustainability of this region (Borge and Castillo
1997).
Among the factors threatening freshwater biodiversity, land cover change has particularly
widespread and pervasive effects (Allan and Flecker 1993). Recent studies in diverse tropical
environments have demonstrated that conversion of forests to agricultural land uses can have
significant impacts on stream biodiversity (e.g. Benstead et al. 2003, Bojsen and Jacobsen
2003, Iwata et al. 2003). However, very few studies have examined the capacity of riparian
forest buffers to mitigate the impacts of tropical deforestation on lotic communities. Chapters
1 and 2 of the dissertation present research examining the effects of deforestation and
riparian forest buffers on fish and macroinvertebrates in lowland Costa Rican streams. In
order to test the hypothesis that riparian forest buffers can mitigate the effects of
deforestation, comparisons were made between forested reference stream reaches and stream
reaches in pasture with and without a riparian forest buffer. Chapter 1 focuses on fish
abundance and assemblage structure in the study streams, making comparisons among reach
types and through time. To better understand the underlying causes of patterns observed in
fish assemblages, comparisons of stream habitat and food resources available in the study
reaches were also made. A similar approach is used in Chapter 2, but with a focus on benthic

xii
macroinvertebrates. In this case, comparisons among the study treatments, sampling periods
and among habitat types within the sampling reaches were all of interest.
Focusing on reach-level effects of our study treatments eliminated many confounding
factors when addressing research questions in the first two chapters. However, stream fishes
often respond to heterogeneity in lotic systems at much larger spatial scales (Schlosser 1991,
Fausch et al. 2002) and exhibit diverse responses to environmental gradients. Chapter 3
presents a study of the distribution of stream fishes along an altitudinal gradient in the
Sixaola River basin, one the most intact river systems of its size on the Caribbean slope of
Costa Rica. By focusing on streams with high ecological integrity within this river system,
the goal of this study was to provide new insight into the factors shaping fish assemblages in
the study region, develop a baseline for future comparative studies, and inform conservation
planning efforts. Distributional patterns of diadromous fishes were of particular interest
because the Sixaola River basin is one of a declining number of free-flowing river systems in
the region.
Chapter 4 is an interdisciplinary chapter that discusses the conceptual basis and
methodological framework for integrated conservation planning across terrestrial and aquatic
ecosystems. Systematic conservation planning methods are widely used to identify
conservation priority areas in terrestrial, freshwater, and marine ecosystems, and have
traditionally considered these three realms separately. It is increasingly recognized that a
more unified approach to planning is needed (e.g. Abell 2002, Stoms et al. 2004), but
significant challenges remain in achieving this integration. In this chapter, the goals of
systematic conservation planning across terrestrial and aquatic ecosystems are discussed,
using a planning domain on the Caribbean slope of Costa Rica and Panama as an example. A
critical evaluation of existing methods for integrated conservation planning based on several
different criteria is presented next. The chapter ends with a discussion of how these methods
could be applied in the example planning domain and the future developments needed to
advance the comprehensive planning approach.
All chapters in this dissertation are formatted as manuscripts to be submitted for
publication. Chapter 4 is the result of a collaborative effort by three doctoral students in the
University of Idaho/CATIE IGERT Program, Beth Polidoro, Jan Schipper, and myself. Other
co-authors on this chapter include Drs. J. Michael Scott and Celia Harvey.

xiii
REFERENCES
Abell, R. 2002. Conservation biology for the biodiversity crisis: a freshwater follow-up.
Conservation Biology 16:1435-1437.
Allan, J. D., and A. S. Flecker. 1993. Biodiversity conservation in running waters. Bioscience
43:32-43.
Benstead, J. P., M. M. Douglas, and C. M. Pringle. 2003. Relationship of stream invertebrate
communities to deforestation in eastern Madagascar. Ecological Applications 13:1473-
1490.
Bojsen, B. H., and D. Jacobsen. 2003. Effects of deforestation on macroinvertebrate diversity
and assemblage structure in Ecuadorian Amazon streams. Archiv für Hydrobiologie
158:317-342.
Borge, C., and R. Castillo. 1997. Cultura y conservación en la Talamanca indígena. Editorial
Universidad Estatal a Distancia, San José, Costa Rica.
Fausch, K. D., C. E. Torgersen, C. V. Baxter, and H. W. Li. 2002. Landscapes to riverscapes:
bridging the gap between research and conservation of stream fishes. BioScience 52:483-
498.
Iwata, T., S. Nakano, and M. Inoue. 2003. Impacts of past riparian deforestation on stream
communities in a tropical rainforest in Borneo. Ecological Applications 13:461-473.
Malmqvist, B., and S. Rundle. 2002. Threats to the running water ecosystems of the world.
Environmental Conservation 29: 134-153.
Olsen, D. M., and E. Dinerstein. 2002. The Global 200: priority ecoregions for global
conservation. Annals of the Missouri Botanical Garden 89:199-224.
Pringle, C. M. 2000. River conservation in tropical versus temperate latitudes. Pages 371-384
in P. J. Boon, B. R. Davies, and G. E. Petts, eds. Global perspectives on river
conservation: science, policy, and practice. John Wiley & Sons Ltd., New York, New
York, USA.
Schlosser, I. J. 1991. Stream fish ecology: a landscape perspective. BioScience 41:704-712.
Stoms, D. M., F. W. Davis, S. J. Andelman, M. H. Carr, S. D. Gaines, B. S. Halpern, R.
Hoenicke, S. G. Leibowitz, A. Leydecker, E. M. P. Madin, H. Tallis, and R. R.Warner.
2005. Integrated coastal reserve planning: making the land-sea connection. Frontiers in
Ecology and the Environment 3:429-436.
1
Chapter 1. Riparian forest buffers mitigate the effects of deforestation on fish
assemblages in small tropical rainforest streams
Abstract
Riparian forest buffers may play a critical role in moderating the effects of deforestation
on tropical stream ecosystems, but there is currently very little information on riparian forest
buffer design or effectiveness from studies conducted in the tropics. We investigated the
effects of deforestation on stream fish assemblages, and the influence of riparian forest
buffers on this response, in southeastern Costa Rica in order to critically evaluate the
effectiveness of forest buffers. Fish assemblages were sampled in small, lowland streams
representing three different treatments: 1) forested reference stream reaches, 2) stream
reaches in pasture with a riparian forest buffer averaging at least 15 m in width on each bank,
and 3) stream reaches in pasture without a riparian forest buffer. Forest cover at the
catchment scale was high at all sites, allowing us to isolate the reach-scale effects of our
three study treatments. Fish density was consistently higher in pasture reaches than in forest
and forest buffer reaches, mostly due to an increase in herbivore-detritivores, but fish
biomass did not differ among reach types. Pasture reaches also had higher fish diversity than
reference forest reaches, while forest buffer reaches were intermediate. Overall, fish
assemblages in forest and forest buffer reaches were very similar, while those in pasture
reaches were quite distinct. These patterns were persistent across three sampling periods
during our 15-month long study. Stream ecosystem conditions in pasture reaches, which
included higher stream temperatures and reduced fruit and seed inputs compared with
forested reference reaches, appeared to favor fishes normally found in larger streams. Forest
buffer reaches, in contrast, had stream temperatures and allochthonous inputs similar to
forested streams in the study area. Our results provide support for existing Costa Rican
legislation protecting riparian forests, and suggest that riparian areas should be given a high
priority in efforts to maintain stream ecosystem integrity in the tropics.
Introduction
Tropical landscapes are increasingly dominated by agricultural land uses as a result of
widespread and ongoing deforestation (Achard et al. 2002, Lambin et al. 2003). Although
tropical deforestation is recognized as a critical threat to biodiversity (e.g. Pimm et al. 1995,
Dirzo and Raven 2003), the effects of forest clearing on tropical stream ecosystems have

2
received relatively little research attention and are poorly understood (Jackson and Sweeney
1995, Chapman and Chapman 2002). However, recent studies from diverse tropical
environments have demonstrated that deforestation can have negative impacts on stream
ecosystems and aquatic biota through degradation of stream habitats (Kamdem Toham and
Teugels 1999, Iwata et al. 2003) and changes in food resources available to aquatic
organisms (Bojsen and Barriga 2002, Benstead et al. 2003, Benstead and Pringle 2004).
Given the scale of tropical deforestation, the socioeconomic forces driving land use
change, and the potential impacts on stream ecosystem function and aquatic biodiversity
(Chapman and Chapman 2002, Benstead et al. 2003), there is a great need to develop
strategies for maintaining the ecological integrity of stream ecosystems in agricultural
landscapes. Protecting natural riparian vegetation along tropical streams is one of the most
widely recognized strategies (e.g. Pringle and Scatena 1999, Chapman and Chapman 2002,
Benstead et al. 2003, Casatti et al. 2006), and is supported by a large body of literature
illustrating the importance of riparian zones to stream ecosystem function and the capacity of
riparian areas to reduce the impacts of upslope land use on aquatic biota (Karr and Schlosser
1978, Gregory et al. 1991, Naiman and Décamps 1997). Specifically, forested riparian zones
provide allochthonous organic matter inputs (e.g. large woody debris, leaf litter, terrestrial
insects) that serve as food and habitat for stream organisms (Sweeney 1993, Pusey and
Arthington 2003); filter sediments, nutrients, and pollutants from agricultural runoff
(Peterjohn and Correll 1984, Osborne and Kovacic 1993, Lowrance et al. 1997); provide
shade that moderates stream temperatures (Barton et al. 1985, Abell and Allan 2002); and
help maintain channel features that enhance stream habitat and key ecosystem processes
(Sweeney et al. 2004).
Despite the functional importance of riparian forests and their potential for maintaining
stream ecosystem integrity in increasingly deforested tropical landscapes, few studies have
evaluated the capacity of riparian forest buffers to mitigate the effects of deforestation on
tropical stream biota. Forest buffer width recommendations from temperate studies (e.g.
Castelle et al. 1994, Wenger 1999) may be equally valid in the tropics, but there is very little
direct evidence to inform policy and management decisions concerning riparian forest
protection. Furthermore, trophic dynamics and other stream ecosystem processes can differ
substantially between temperate and tropical streams (e.g. Flecker 1992, Wootton and Oemke

3
1992, Wantzen and Wagner 2006), and may have significant implications for riparian buffer
design and effectiveness.
In this context, we designed a study to investigate the influence of riparian forest buffers
on tropical stream ecosystems, with a focus on stream fish assemblages. Fishes are an
excellent indicator group for monitoring changes in stream ecosystems (Karr 1981, Fausch et
al. 1990), and are strongly influenced by land use change, particularly at terrestrial-aquatic
interfaces (Schlosser 1991). Many tropical fish species feed directly on allochthonous food
items from surrounding forests (Goulding 1980, Lowe-McConnell 1987), and are expected to
be particularly vulnerable to deforestation (Angermeier and Karr 1983). In addition, fishes
can strongly influence the structure of other aquatic assemblages in tropical streams (Flecker
1992, Pringle and Hamazaki 1997, 1998). Therefore, changes in fish assemblages could have
important consequences for stream ecosystem processes and biodiversity. Previous studies
have demonstrated significant effects of deforestation on the trophic and taxonomic structure
of neotropical stream fish assemblages (Burcham 1988, Bojsen and Barriga 2002), but the
influence that riparian forest buffers might have on these effects is largely unknown.
The objectives of our study were to evaluate the capacity of riparian forest buffers to
mitigate the effects of deforestation on stream fish assemblages, and to investigate specific
stream habitat and food resource variables that could explain the patterns observed in fish
assemblages. We pursued these objectives in a Costa Rican landscape where large patches of
forest have been converted to pasture, an important land use trajectory throughout the
Neotropics (Schelhas 1996, Lambin et al. 2003), but where forest cover remains relatively
high overall. The patchy nature of deforestation in this area allowed us to compare pasture
stream reaches with and without a riparian forest buffer to forested reference sites, while
controlling to a large extent for catchment-scale land use. Stream reaches were identified as
having a riparian forest buffer if they met the criteria for riparian forest protection set forth in
the 1996 Costa Rican forestry law (no. 7575). This law prohibits the cutting or clearing of
trees in riparian protection zones that vary in width depending on the slope of surrounding
terrain and whether streams are located in rural or urban areas. The study was designed to
incorporate these minimum protections as a treatment effect that could be compared with
stream reaches lacking a forest buffer, and with streams in continuous forest.

4
Our overarching hypothesis was that riparian forest buffers could moderate the effects of
deforestation on stream fish assemblages by maintaining stream ecosystem conditions similar
to those found in continuous forest. Therefore, we expected that in streams affected by
deforestation, the presence or absence of a riparian forest buffer would have a significant
effect on fish assemblage structure, stream habitat characteristics and on the food resources
available to stream fishes. Furthermore, based on previous studies of riparian buffer
effectiveness in temperate environments, sites with an intact riparian forest buffer were
predicted to be more similar to sites in continuous forest for all of these variables.
Methods
Study Site
The study was conducted in small, lowland streams in Limón Province, southeastern
Costa Rica (9°35' N, 82°40' W). This area falls within the Bocas biogeographical province of
Smith and Bermingham (2005), a region characterized by a relatively depauperate freshwater
fish fauna with high endemism. Study streams drain the low hills between the Sixaola River
Valley and the Caribbean coast, and are tributaries of either the lower Sixaola River or the
small Gandoca stream system (Figure 1). The study area is underlain by a mix of tertiary
sediments of marine origin and quaternary alluvium from several formations in the
Talamanca mountain range (Bergoeing 1998). All study catchments fall within the moist
tropical forest life zone of Holdridge (1967), with mean annual precipitation of
approximately 2500 mm (WorldClim, Hijmans et al. 2005). Rainfall is largely aseasonal and
highly variable between years, but tends to peak in November-January, while drier conditions
often persist in February-April and August-September.
Twelve sampling reaches in nine first- and second-order streams were selected for the
study (Figure 1). Our study design incorporated four replicates of three different stream reach
types, hereafter forest, forest buffer, and pasture reaches, to investigate ecological responses
to deforestation and the efficacy of riparian forest buffers. Forest reaches were selected as
reference sites and had catchments dominated by primary and well-developed secondary
forest with little or no past anthropogenic disturbance in near-stream areas. Riparian
vegetation at these sites was characterized by a tall (>25 m), multi-strata forest canopy, a
relatively open understory with many palms and some small trees and shrubs, and sparse
herbaceous ground cover.

5
Forest buffer and pasture reaches, in contrast, had all been directly affected by
deforestation and were adjacent to actively grazed pastures. Conversion of forest to pasture
had occurred at least 10 years prior to our study at all of these sites. In forest buffer reaches,
streams were separated from adjacent pastures by a riparian forest buffer averaging at least
15 m in width on both banks, in accordance with Costa Rican law for rural streams in flat
terrain. Mean buffer width, averaging measurements on both banks, ranged from 26-45 m.
Forest buffers were typically wider on one bank than the other, and buffer width on the bank
with the narrower buffer averaged approximately 20 m across the four reaches. Riparian
buffer width also varied considerably along the meandering stream channels and was less
than 15 m at some points. Riparian vegetation in forest buffer reaches was composed of a
multi-strata forest canopy with a mix of large remnant trees and younger secondary growth, a
relatively dense understory, and low herbaceous ground cover. Streamside vegetation in
pasture reaches was categorically different, typically having a single, often discontinuous,
row of remnant and planted trees along the stream channel, and a nearly complete lack of
understory trees and shrubs. Ground cover was very high, and included pasture grasses and
closely cropped herbaceous plants that extended to the edge of the stream channel. There was
considerable variation in tree cover among pasture reaches, representing a range of
conditions common in the study area, but the canopy cover provided by the narrow strip of
trees present in these sites was generally quite high (Table 1).
In addition to the riparian vegetation conditions discussed above, study reaches were
selected based on having similar wetted widths and channel gradients (Table 1). The study
was also designed to control, to the extent possible, for catchment-scale effects on the study
streams. Therefore, we selected study reaches based on forest cover at the catchment scale,
which was determined from aerial photos and extensive field reconnaissance. Forest cover
was high in all of the study catchments (Table 1), but forests in the catchments of pasture and
forest buffer reaches were generally more heavily disturbed by past clearing and selective
logging than forests in the catchments of reference stream reaches. Deforested areas in the
study catchments were used almost exclusively for pasture or small home gardens. At each
study site, we established a sampling reach that was approximately 40 times the average
wetted channel width, beginning at a randomly selecting starting point within a longer reach
with similar habitat conditions. All study sites had pool-riffle channels (Montgomery and

6
Buffington 1997), and sampling reaches always captured at least three pool-riffle sequences.
Stream water in the study sites had high conductivity and slightly basic pH (Table 1).
Fish Assemblages
Fish sampling was conducted with the goals of comparing stream fish assemblages
among reach types and investigating how assemblages varied within and among years. Thus,
we sampled all 12 study reaches once in each of following periods: February-April 2005
(sample period 1), September-October 2005 (sample period 2), and February-April 2006
(sample period 3). This sampling schedule was intended to represent dry and wet season
samples in 2005 and a dry season sample in 2006. However, precipitation did not vary in a
predictable seasonal pattern during the study. Furthermore, discharge in these small streams
responded rapidly to rainfall events, and then quickly returned to base flow conditions when
rains ceased. Given the lack of consistent seasonal patterns in precipitation and stream flow,
and the fact that fish sampling was always conducted when streams were at or near base
flow, the three sample periods will be referred to by their sequential order instead of by
season.
Stream fishes were captured using a backpack electrofishing unit (Model B-12, Smith-
Root, Inc., Vancouver, Washington, USA). Each geomorphic channel unit (pool or riffle) in
the sampling reach was isolated using block nets and two thorough passes of equal effort
were made through each habitat unit. Fish from the first pass were maintained in buckets, and
at least 15 minutes was allowed between passes. Preliminary work indicated that a third pass
yielded few fish and led to significantly higher fish mortality in these small streams. Captures
from the two passes were combined for subsequent analyses. All fish were identified to
species using keys in Bussing (1998), measured for length to the nearest mm, weighed to the
nearest 0.1 gram, and then returned to the stream. Fishes of the genera Eleotris and Sicydium
could not be identified to species reliably in the field, and so were recorded according to their
respective genus. Sicydium was present at only one site, while Eleotris was present in low
numbers at many of the sites. Given the similar ecology of the two species within each genus
that occur in the study area (Bussing 1998, Winemiller and Ponwith 1998), we felt justified
in grouping these species at the genus level in our analyses. Only fish ≥20mm were included
in analyses, as smaller fish were not adequately sampled with our methods.
7
Fishes were also assigned to one of four trophic groups (herbivore-detritivore, omnivore,
invertivore, or carnivore) based on previous studies in Costa Rica (Burcham 1988,
Winemiller and Leslie 1992, Wootton and Oemke 1992, Bussing 1993, Winemiller 1993,
Bussing 1998). Several species are known to consume terrestrial invertebrates, but the extent
to which a particular species specialized in eating terrestrial or aquatic invertebrates varied
among the studies cited above, and so all fishes that feed primarily on invertebrates were
placed in a single group. Fishes were classified as carnivores if their diet regularly includes
fish and freshwater shrimp, in addition to smaller invertebrates.
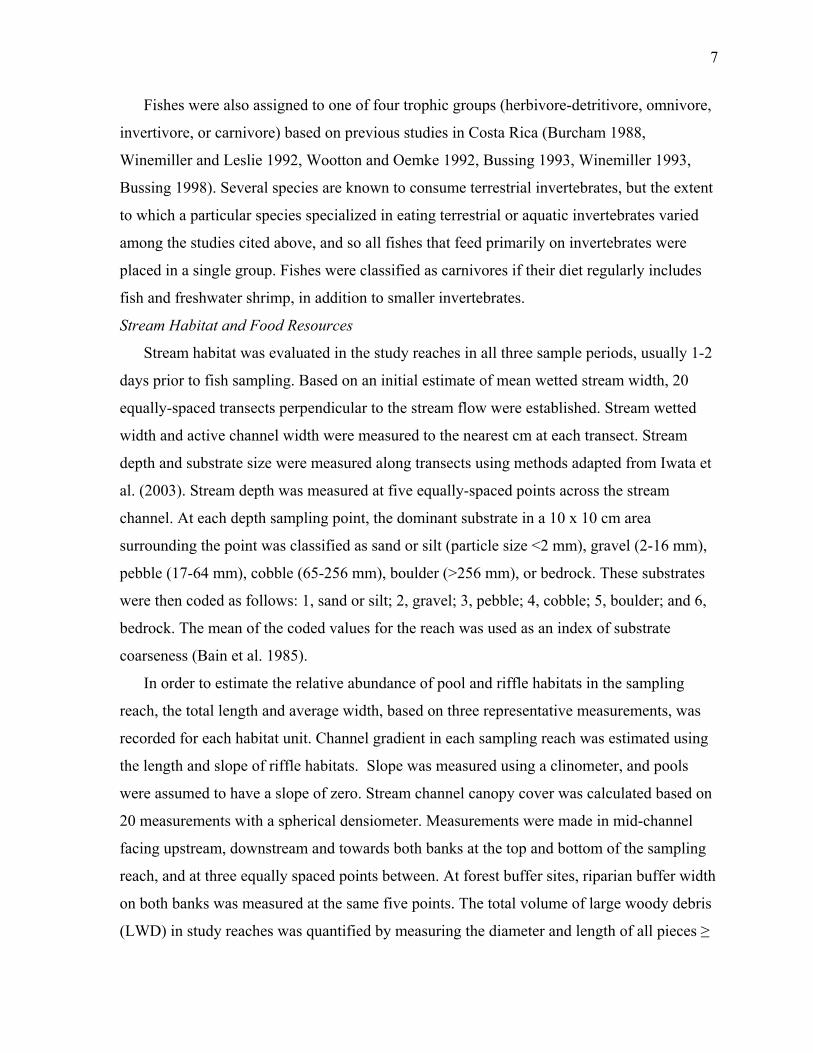
Stream Habitat and Food Resources
Stream habitat was evaluated in the study reaches in all three sample periods, usually 1-2
days prior to fish sampling. Based on an initial estimate of mean wetted stream width, 20
equally-spaced transects perpendicular to the stream flow were established. Stream wetted
width and active channel width were measured to the nearest cm at each transect. Stream
depth and substrate size were measured along transects using methods adapted from Iwata et
al. (2003). Stream depth was measured at five equally-spaced points across the stream
channel. At each depth sampling point, the dominant substrate in a 10 x 10 cm area
surrounding the point was classified as sand or silt (particle size <2 mm), gravel (2-16 mm),
pebble (17-64 mm), cobble (65-256 mm), boulder (>256 mm), or bedrock. These substrates
were then coded as follows: 1, sand or silt; 2, gravel; 3, pebble; 4, cobble; 5, boulder; and 6,
bedrock. The mean of the coded values for the reach was used as an index of substrate
coarseness (Bain et al. 1985).
In order to estimate the relative abundance of pool and riffle habitats in the sampling
reach, the total length and average width, based on three representative measurements, was
recorded for each habitat unit. Channel gradient in each sampling reach was estimated using
the length and slope of riffle habitats. Slope was measured using a clinometer, and pools
were assumed to have a slope of zero. Stream channel canopy cover was calculated based on
20 measurements with a spherical densiometer. Measurements were made in mid-channel
facing upstream, downstream and towards both banks at the top and bottom of the sampling
reach, and at three equally spaced points between. At forest buffer sites, riparian buffer width
on both banks was measured at the same five points. The total volume of large woody debris
(LWD) in study reaches was quantified by measuring the diameter and length of all pieces ≥

8
10 cm in diameter and ≥ 1 m in length that were resting within the active stream channel. To
compare thermal regimes between reach types, stream water temperatures in the study
reaches were continuously monitored during April-May 2006 using submerged temperature
loggers (HOBO Water Temp Pro, Onset Computer Corporation, Pocasset, Massachusetts,
USA). Water temperatures were recorded every 30 minutes for one month at each site. Only
six temperature loggers were available, and so loggers were maintained at two randomly
selected sites of each reach type for one month, and then moved to the remaining sites.
Quantitative samples of potential food resources for fishes were also collected in
conjunction with habitat surveys. In all three sample periods, 10 randomly placed Surber
samples (sampling area 0.093 m2) were collected to estimate benthic macroinvertebrate
abundance. Surber samples were stratified by habitat type, with five samples collected from
pools and five samples collected from riffles. Material captured in Surber samples was
preserved in the field in 95% ethanol and invertebrates were later separated from other
material in the laboratory using a dissecting microscope. Invertebrates were enumerated and
identified to the lowest feasible taxonomic level. A habitat-weighted estimate of benthic
macroinvertebrate density for each study reach was made based on the relative abundance of
pools and riffles (Iwata et al. 2003).
Epilithic algae abundance in the study reaches was estimated in the latter two sample
periods by measuring chlorophyll-a concentrations on natural stream substrates. At each site,
one or more small stones were collected at 10 randomly-selected sampling points in the study
reach. Sampling points were stratified so that five samples were collected in pools and riffles,
respectively. In the laboratory, chlorophyll was extracted by placing stones in 96% ethanol
for 24 hours at room temperature. Chlorophyll-a concentration in the extract was determined
spectrophotometrically, without phaeophytin correction, using the equation of Wintermans
and De Mots (1965). Stone surface area was calculated using the equation of Dall (1979),
and one half of the stone area was used to estimate chlorophyll-a standing crop per square
meter at each sampling point. Mean values in pool and riffle habitats were used to calculate a
habitat-weighted estimate of chlorophyll-a standing crop for each study reach.
Direct aerial inputs of plant material and terrestrial invertebrates to the stream were also
measured during the second two sample periods. Five clear plastic pans partially filled with
soapy water, each with surface area of 0.2 m2, were placed within or at the edge of the wetted

9
stream channel and retrieved after 24 hours. Pan traps were used at all but one site, where
repeated problems with theft and disturbance by livestock precluded data collection. In
several cases, one or more samples were lost due to inclement weather and resultant
increases in stream discharge. In cases where more than one sample was lost, all samples
were discarded and pan traps were re-set for 24 hours. Material captured in the pan traps was
preserved in 95% ethanol, and later sorted using a dissecting microscope. Terrestrial
invertebrates were counted, identified to order or family, and sorted into two groups, fully
terrestrial taxa and terrestrial insects with an aquatic larval stage. In some cases, particularly
within the order Diptera, these distinctions required identifying insects to the family level and
making assumptions based on general patterns within families. Terrestrial invertebrates, as
well as fruits and seeds less than 25 mm in diameter, were dried at 60°C for 24 hours and
then weighed to the nearest 0.1 mg. The few larger fruits and seeds collected in pan traps had
a thick, hard pericarp and are unlikely to be consumed by fishes in the study streams.
Data Analysis
Comparisons of fish density, biomass, and species richness among reach types and
sample periods were made with repeated measures ANOVAs using PROC MIXED in SAS
Version 9.1 (SAS Institute Inc. 2002). Akaike Information Criterion values for small samples
(AICc) were used to select the most appropriate covariance structure for within-subject
variation in the repeated-measures models. When a significant effect of reach type was found
for any variable, pairwise comparisons of the three reach types were made. We did not
correct p-values for multiple pairwise comparisons in these tests, or in the tests described
below, because F tests provide adequate protection against type I error for pairwise
comparisons among three groups (Toothaker 1993). Species richness comparisons among
sampling reaches may have been influenced by differences in sampling area and the total
number of fish captured (Gotelli and Colwell 2001). Therefore, we used the program EcoSim
(Gotelli and Entsminger 2005) to make individual-based rarefaction curves and estimate
species richness for the study reaches based on an equal number of individuals. Diversity
comparisons among reach types were made based on observed species richness and using
richness estimates based on rarefaction to a common sample size.
Comparisons of fish assemblages among sampling sites were also made using two
multivariate techniques, permutational multivariate analysis of variance (PERMANOVA)

10
and non-metric multidimensional scaling (NMS). Both techniques are appropriate for
analysis of community data that do not meet distributional assumptions of parametric tests
(McCune and Grace 2002). Prior to analyses, fish abundance data were converted to relative
abundance due to differences in sampling area among sites. Bray-Curtis dissimilarity (Bray
and Curtis 1957) was used as the distance measure for PERMANOVA tests and NMS
ordinations, and all species were included in the analyses.
PERMANOVA was used to test for differences in fish assemblages among reach types
and sampling periods. Analyses were based on the methods of Anderson (2001) and McArdle
and Anderson (2001), and were conducted using the program PERMANOVA (Anderson
2005). Data from all three sample periods were first analyzed together, with sample period
and reach type as fixed factors, because we were interested in testing for significant changes
in community composition through time and for possible interactions between the factors.
However, because we used a repeated-measures study design, this test artificially inflated the
sample size for reach type comparisons. Therefore, we also ran one-way PERMANOVA
tests for the effect of reach type in each sampling period. P-values for the test statistic
(pseudo F-value) in PERMANOVA tests were based on 10000 permutations of raw data.
When one-way PERMANOVA tests indicated a significant effect of reach type, pairwise
comparisons of reach types were made. Pairwise tests had few unique permutations, and so
the Monte Carlo method of Anderson and Robinson (2003) was used to calculate p-values for
the test statistic (multivariate t-statistic).
Relationships among sites based on fish relative abundance were also evaluated with
NMS ordinations using the program PC-ORD (McCune and Mefford 1999). Final
ordinations were based on the best configuration from 250 runs with random starting points.
Appropriate dimensionality for ordinations was determined from scree plots and significance
tests of stress values based on 250 Monte Carlo randomizations. Separate ordinations were
run for each sample period to investigate how relationships among sites varied through time.
Habitat and food resource variables were compared among reach types and sample
periods using repeated measures ANOVAs. For water temperature, a two-way ANOVA
model with reach type and month as fixed effects was used. ANOVAs were conducted using
SAS Version 9.1, and data transformations were made as needed to meet distributional
assumptions.

11
Results
Fish Assemblage Structure
Over 13,000 fish representing 24 species and 11 families were captured during the study.
Fish assemblages were dominated by poeciliid and characid fishes (Appendix 1), and all
species encountered are native to the study area. Fish density varied significantly among
reach types and sample periods (Table 2), and was higher in pasture reaches than in forest
and forest buffer reaches (Figure 2a). Fish biomass also varied among sampling periods, but
not among reach types (Table 2). Observed species richness varied significantly among reach
types, but not among sampling periods (Table 2). Species richness was significantly higher in
pasture reaches than forest reaches, while forest buffer reaches had intermediate species
richness and did not differ significantly from the other two reach types (Figure 2b). Species
richness estimates based on rarefaction to a common sample size yielded very similar results
(Table 2), indicating that patterns in fish species richness were not an artifact of variation in
sampling area or fish abundance.
Comparisons of fish density by trophic group showed no significant effect of reach type
on the density of omnivores, invertivores, or carnivores (Table 2). The density of herbivore-
detritivores did, however, differ significantly among reach types. Herbivore-detritivore
density was highest in the pasture reaches, and differences in herbivore-detritivore density
accounted for most of the variation in fish density among reach types (Figure 3). Herbivore-
detritivore density was also significantly higher in forest buffer reaches than in forest
reaches, but this difference was comparatively small. Among the trophic groups, only
omnivores and herbivore-detritivores showed significant variation in density through time
(Table 2).
PERMANOVA tests showed a highly significant effect of reach type on fish assemblages
in the study reaches (F = 14.23, p = 0.0001). Sample period, in contrast, was not a significant
factor (F = 1.58, p = 0.14), indicating that relative abundances were relatively stable through
time. There was also no significant multivariate interaction between sample period and reach
type (F = 0.45, p = 0.96). One-way PERMANOVA tests for individual sample periods also
showed a significant effect of reach type (Table 3). Pairwise comparisons of reach types
showed highly significant differences in fish assemblages between forest and pasture reaches

12
and between forest buffer and pasture reaches in all three sample periods. Differences
between forest and forest buffer reaches were not significant (Table 3).
NMS ordinations of sampling sites supported the conclusions of PERMANOVA tests.
Ordinations produced two-dimensional configurations with relatively low stress for all three
sample periods (Figure 4). The total variance explained by the two ordination axes, as
indicated by coefficients of determination between distances in the ordination space and
Bray-Curtis distances in the original n-dimensional space, was greater than 90% for all three
ordinations. Forest reaches and forest buffer reaches consistently grouped together in
multivariate space, while pasture reaches always formed a distinct group. Distances between
individual reaches were also generally consistent across sampling periods (Figure 4).
Differences in fish assemblages in pasture reaches relative to other reach types were due
in large part to the dramatic increase in herbivore-detritivores. However, we observed shifts
in the relative abundance of species in other trophic groups, as well. For example, the small
invertivore Priapichthys annectens was the most abundant fish in forest and forest buffer
reaches, with densities three to four times those observed in pasture reaches. Decreased
abundance of P. annectens in pasture reaches was matched by increased abundance of other
invertivores, especially the poeciliid Alfaro cultratus and the characid Hyphessobrycon
panamensis. Likewise, increases in the abundance of one omnivorous characid, Astyanax
aeneus, in pasture reaches were offset to some degree by decreased abundance of another,
Bryconamericus scleroparius, relative to forest and forest buffer reaches (Appendix 1).
Environmental Variables
We observed relatively few significant differences in comparisons of environmental
variables among reach types and sample periods. Among habitat variables, only water
temperature showed significant differences among reach types. Mean, minimum, and
maximum daily water temperatures were all significantly higher in pasture reaches than in
forest reaches during April-May 2006 (Table 4). Water temperatures in forest buffer reaches
were intermediate and did not differ from the other two groups. Water temperatures also
differed significantly among sampling months, but there was no significant interaction
between reach type and sampling month for any of the temperature variables (Table 4).
Reach type did not have a significant effect on the other stream habitat variables we

13
measured (Table 5), but mean depth and LWD volume both varied among sample periods
(Table 5).
Among food resource variables, only aerial inputs of small fruits and seeds differed
significantly among reach types, with forest and forest buffer reaches having higher fruit and
seed inputs than pasture reaches (Table 5, Figure 5a). In contrast, chlorophyll-a standing crop
tended to be much higher in pasture reaches than in the other two reach types (Figure 5b).
However, variation among pasture reaches was also very high and differences among reach
types were not statistically significant (Table 5). There were also no significant differences or
strong trends in aquatic macroinvertebrate density or aerial inputs of terrestrial invertebrates
among reach types (Table 5).
Discussion
Patterns in Fish Abundance and Assemblage Structure
Comparisons of fish assemblages in our three study reach types suggest that deforestation
has significant effects on stream fishes in lowland Costa Rican streams and support our
hypothesis that riparian forest buffers can mitigate the effects of upslope deforestation. The
differences we observed among treatments are particularly striking considering the relatively
small scale of deforestation in the study catchments and the high canopy cover present in
pasture reaches. Nevertheless, the geographic proximity of our sampling reaches and their
similarity in size and channel gradient suggest that differences we observed among reach
types were a direct consequence of land use change.
Dissimilarities in fish abundance, diversity, and assemblage structure were greatest
between forest reaches and pasture reaches lacking a riparian forest buffer. In particular,
pasture reaches had higher fish abundance and species richness, as well as significantly
different trophic and taxonomic composition. In general, these differences were consistent
with results from previous studies in neotropical streams (Burcham 1988, Bojsen and Barriga
2002), which found that deforestation significantly increased fish abundance, particularly the
abundance of herbivorous species that constituted a very small component of fish
assemblages in forested sites. The result was major shifts in fish assemblage trophic structure
and species relative abundance patterns, with decreasing dominance by insectivorous and
omnivorous fishes that feed on allochthonous material (Burcham 1988, Bojsen and Barriga
2002).

14
However, our results also demonstrated that these effects are strongly influenced by the
presence of a riparian forest buffer. Despite similar land use patterns at the catchment and
reach scale outside the riparian buffer zone in pasture and forest buffer reaches, we observed
significant differences in fish abundance and assemblage structure between these reach types.
Fish density was lower in forest buffer reaches than in pasture reaches for all fishes, mostly
due to differences in the abundance of herbivore-detritivores. Comparisons based on the
relative abundances of all fish species also revealed consistent and highly significant
differences between pasture and forest buffer reaches. In all of these regards, forest buffer
reaches supported fish assemblages that were much more similar to those in forested
reference reaches.
Given land use patterns in the study catchments, differences between forest buffer and
pasture sites appear to be driven almost completely by the ecological effects of riparian
vegetation. However, comparisons of fish assemblage characteristics among the three reach
types also showed that forest buffer sites were intermediate between forest and pasture
reaches in many regards. This may be an indicator of catchment-scale effects that cannot be
fully mitigated by riparian forest buffers, or may reflect the generally more disturbed nature
of riparian vegetation in forest buffer reaches compared to forest reaches. Studies from
temperate landscapes have shown mixed results regarding the relative importance of
catchment versus riparian-scale land use on stream fish assemblages (Roth et al. 1996,
Lammert and Allan 1999, Stauffer et al. 2000), and these relationships appear to be highly
dependent on spatial scale (Lammert and Allan 1999, Allan 2004) and the extent of
landscape modification (Wang et al. 2003). Nevertheless, deforestation in riparian areas can
have strong impacts on fish assemblages even in watersheds with very high forest cover
(Jones et al. 1999), as we observed in our study streams.
Patterns of fish abundance, diversity, and assemblage structure among the three study
reach types were highly persistent across the three sample periods in our study, further
reinforcing the significance of the patterns we observed. Despite low annual variation in
temperature and day length, lowland tropical streams are highly dynamic environments and
tropical stream fish assemblages can show marked temporal variation, often linked to
seasonality of rainfall and resultant changes in stream discharge (Lowe-McConnell 1987).
We did not observe any distinct seasonality in rainfall during our study, and patterns relating

15
to surrounding land use appeared to be much stronger than temporal dynamics in fish
assemblage structure. Bürnheim and Fernandes (2001) also reported very low seasonal
variation in fish assemblage structure in small Amazonian rainforest streams, despite stronger
seasonality in rainfall patterns. Fishes in our small study streams are subject to considerable
abiotic disturbance in the form of frequent spates and extended periods of very low stream
flow. Nevertheless, the relative stability of fish assemblages that we observed also suggests
ample opportunities for strong biotic interactions.
Relationships between Fish Assemblages and Environmental Variables
Differences in fish assemblage structure among our three study reach types appeared to
be most strongly linked to the availability of food resources. The abundance of herbivore-
detritivores in pasture reaches was one the most obvious differences among reach types, and
suggests that primary production was highest in pasture reaches, substantially lower in forest
buffer reaches, and lowest in forest reaches. Comparisons of chlorophyll-a standing crop
among reach types generally support this conclusion, although high variability among
reaches resulted in a lack of statistically significant differences. One pasture reach, in
particular, was a strong outlier, and had a very low algal standing crop throughout the study.
This reach was not the most heavily shaded, but had experienced more channel degradation
than other pasture reaches and had very fine, unstable sediments. Excluding this site, we did
observe much higher chlorophyll-a standing crops in pasture reaches, consistent with many
studies that have demonstrated an inverse relationship between algal abundance and stream
canopy cover (e.g. Tait et al. 1994, Bojsen and Barriga 2002, Roy et al. 2006). However, we
also observed large differences in chlorophyll-a standing crops between sites with very
similar canopy cover, suggesting that other factors (e.g. nutrient availability, herbivory) were
affecting algal abundance.
Allochthonous food inputs may have also influenced the differences in fish assemblages
we observed among reach types. We did not observe differences in terrestrial insect inputs
among reach types, contrary to other studies comparing terrestrial insect flux from forests
and pastures (Edwards and Huryn 1996, Kawaguchi and Nakano 2001). However, our
pasture reaches had relatively high tree cover compared to other studies. In addition,
logistical constraints limited our trapping period to only 24 hours, and we observed high
variability related to individual rain and wind events. A longer trapping period where all

16
reaches were sampled simultaneously would provide a more robust comparison among reach
types.
Despite these limitations, we did observe significantly higher fruit and seed inputs in
forest and forest buffer reaches compared to pasture reaches. Several species in the study
streams are known to feed on fruits and seeds (Bussing 1998), including two relatively large
characid fishes, B. scleroparius and Astyanax orthodus. On average, these two species
accounted for over 60% of fish biomass in forest and forest buffer reaches, and
approximately 30% of fish biomass in pasture reaches. Stomach content analysis of
specimens collected during sampling in 2006 (n=55 for B. scleroparius, n=60 for A.
orthodus) revealed that allochthonous food items accounted for at least 90% of stomach
contents for both species, regardless of reach type (C. M. Lorion and B. P. Kennedy,
unpublished data). Fruits and seeds alone made up approximately 25% of the diet of B.
scleroparius and 16% of the diet of A. orthodus. Pasture reaches in our study likely receive
significant subsidies of allochthonous food resources from forested areas upstream, and we
did not find statistically significant differences in the abundance or biomass of A. orthodus or
B. scleroparius among reach types. Nevertheless, their combined biomass was, on average,
approximately 40% lower in pasture reaches than in forest and forest buffer reaches.
Characiform fishes are often a dominant component of neotropical fish assemblages (Lowe-
McConnell 1987), and deforestation appears to have negative impacts on characids that
depend on allochthonous resources (Bojsen 2005).
The influence of stream habitat on fish assemblages was less clear. Overall, we found
relatively few differences in physical stream habitat among reach types, contrary to Iwata et
al. (2003), who observed strong and persistent impacts of riparian deforestation on stream
substrates and the distribution of channel units. The general lack of differences in habitat
among reach types in our study is not entirely surprising given the small scale of
deforestation in the study catchments. However, studies in Madagascar (Benstead et al. 2003)
and Ecuador (Bojsen and Barriga 2002) also found very similar substrate characteristics in
forested and deforested streams. Thus, the effects of deforestation on physical stream habitats
appear to be highly context-specific and may depend on interactions between land use
intensity in riparian areas and specific soil and climatic conditions. An understanding of these
interactions may be crucial to understanding how changes in riparian vegetation will

17
influence stream habitats and biota. As Benstead et al. (2003) note, the protection of forested
headwater areas may be particularly important for minimizing sedimentation in tropical
streams. In our study, substrate conditions among forest sites were relatively consistent, but
forest buffer and pasture reaches showed large differences in the prevalence of fine
sediments. Some forest buffer and pasture reaches were strongly affected by sedimentation,
while others were not. These differences were not clearly related to land cover or buffer
width, but appeared to be influenced by trampling of stream banks by livestock.
Among the habitat variables we measured, stream temperature showed the strongest
differences among reach types. As expected, pasture sites had the highest temperatures, while
temperatures in forested streams were significantly lower. Interestingly, forest buffer sites
had intermediate temperatures that did not differ from the other two groups, suggesting that
riparian vegetation can mitigate some, but not all, of the effects of deforestation on stream
temperatures. The significance of the temperature differences we observed for fishes in the
study streams is very difficult to determine, as we have no information on the thermal
tolerance of any of the fish species present. Although the increases we observed in pasture
sites were relatively small, they are substantial relative to the normal diel, and even annual,
temperature variation in forested reaches, and may have important impacts on fish activity
and metabolism.
Overall, we observed an increase in the importance of autochthonous production,
decreased allochthonous inputs, and increased stream temperatures in pasture reaches, effects
that are functionally similar to a downstream shift along the river continuum (Vannote et al.
1980). This shift was associated with an increase in herbivore-detritivore density and
generally appeared to favor fish species characteristically found in larger streams
(Winemiller and Leslie 1992, Bussing 1998). Although the headwater communities we
observed are not dominated by endemic species, the patterns we observed are otherwise
consistent with the native invasion process described by Scott and Helfman (2001) for
streams in North America. Native invasions result in the homogenization of fish faunas and
loss of unique headwater fish assemblages, and constitute a significant threat to freshwater
biodiversity. The native invasion process also illustrates the limitations of species richness as
a measure of ecosystem integrity and the importance of considering species composition

18
when evaluating the effects of land use change on stream ecosystems (Scott and Helfman
2001).
Significantly, our results also suggest that riparian forest buffers can have a strong
influence on the native invasion process by maintaining stream ecosystem conditions that
favor characteristic headwater fish assemblages. Whether riparian forest buffers can serve a
similar function in more extensively deforested tropical landscapes remains a key research
question in general and with respect to current forestry regulations in Costa Rica. Designing
studies to address this question is challenging because riparian buffer effects are nearly
always confounded by catchment-scale land use patterns, longitudinal variation in buffer
width, disturbance history, and natural environmental gradients (Allan 2004). By focusing on
reach-scale effects, we were able to control for several of these confounding factors and
demonstrate that riparian buffers have a significant influence on the response of stream biota
to deforestation. Scaling these results up to more extensively deforested landscapes presents
several challenges. For example, it remains unclear whether the patterns we observed among
our study reaches were driven by habitat selection by adult fish or by recruitment dynamics
in the study reaches. We often observed larvae and juveniles of the common poeciliid and
cichlid species, but seldom encountered characids <20 mm in length. Closely-related
characid species are known to move to distinct habitats for spawning and rearing (Kramer
1978), suggesting that the availability and spatial arrangement of habitats at larger spatial
scales influenced the patterns we observed in our study reaches (Schlosser 1991, Fausch et al.
2002). In fact, the proximity of all study reaches to forested headwater areas may have
allowed for the persistence of some species that would be absent in more extensively
deforested areas. More research is clearly needed on the relationships between land use,
riparian vegetation, and demographic processes of tropical stream fishes. Such information
would improve our ability to predict the effects of deforestation on tropical stream
communities, and would inform decisions about the trade-offs between production and
conservation in agricultural landscapes.
In summary, our results demonstrate strong effects of deforestation on lowland tropical
stream fish assemblages, and highlight the importance of riparian forests in mediating these
impacts. Comparisons among our study reaches suggest that riparian forest buffers can
reduce the effects of deforestation on lotic communities by maintaining stream ecosystem
19
conditions similar to those found in forested catchments. Results from intensive sampling of
benthic macroinvertebrates in the same study sites support this conclusion (Lorion et al. In
Prep), but also illustrate that riparian forest buffers cannot fully mitigate the effects of land
use change. Thus, although our results provide strong support for the principle of riparian
forest protection, further research is needed in more extensively deforested catchments to
determine the general effectiveness, and limitations, of riparian forest buffers. Similarly, our
results support existing Costa Rican legislation protecting riparian forests, but evaluations in
larger streams and in catchments with different land uses will be needed to determine
whether current regulations provide sufficient protection for aquatic communities. Riparian
forest buffers are not a panacea, but riparian forest protection and restoration should be given
a high priority in efforts to maintain stream ecosystem integrity in tropical riverscapes.
Acknowledgements
This research was supported by NSF-IGERT grant no. 0114304 to the University of
Idaho. Thanks to Julia Young-Lorion, José Maria López, Teodoro López, and José Luis
Zúñiga for assistance in the field, and to the landowners in the study area who generously
provided access to their farms. Laboratory assistance was provided by Pablo Gutiérrez and
Frank López. Thanks to William McLarney and Maribel Mafla of ANAI Association for
many useful suggestions and to the Costa Rican Ministry of Environment and Energy
(MINAE) for providing research permits. Celia Harvey, George LaBar, and Ding Johnson
provided helpful reviews of earlier versions of this manuscript.
References
Abell, R., and J. D. Allan. 2002. Riparian shade and stream temperatures in an agricultural
catchment, Michigan, USA. Verhandlungen Internationale Vereinigung fur Theoretische
und Angewandte Limnologie 28:232-237.
Achard, F., H. D. Eva, H.-J. M. P. Stibig, J. Gallego, T. Richards, and J.-P. Malingreau.
2002. Determination of deforestation rates of the world's humid tropical forests. Science
297:999-1002.
Allan, J. D. 2004. Landscapes and riverscapes: the influence of land use on stream
ecosystems. Annual Review of Ecology and Systematics 35:257-284.
Anderson, M. J. 2001. A new method for non-parametric multivariate analysis of variance.
Austral Ecology 26:32-46.

20
Anderson, M. J. 2005. PERMANOVA: a FORTRAN computer program for permutational
multivariate analysis of variance. Department of Statistics, University of Auckland,
Auckland, New Zealand.
Anderson, M. J., and J. Robinson. 2003. Generalised discriminant analysis based on
distances. Australian & New Zealand Journal of Statistics 45:301-318.
Angermeier, P. L., and J. R. Karr. 1983. Fish communities along environmental gradients in
a system of tropical streams. Environmental Biology of Fishes 9:117-135.
Bain, M. B., J. T. Finn, and H. E. Booke. 1985. Quantifying stream substrate for habitat
analysis studies. North American Journal of Fisheries Management 5:499-506.
Barton, D. R., W. D. Taylor, and R. M. Biette. 1985. Dimensions of riparian buffer strips
required to maintain trout habitat in southern Ontario streams. North American Journal of
Fisheries Management 5:364-378.
Benstead, J. P., M. M. Douglas, and C. M. Pringle. 2003. Relationship of stream invertebrate
communities to deforestation in eastern Madagascar. Ecological Applications 13:1473-
1490.
Benstead, J. P., and C. M. Pringle. 2004. Deforestation alters the resource base and biomass
of endemic stream insects in eastern Madagascar. Freshwater Biology 49:490-501.
Bergoeing, J. P. 1998. Geomorfología de Costa Rica. Instituto Geográfico Nacional, San
José, Costa Rica.
Bojsen, B. H. 2005. Diet and condition of three fish species (Characidae) of the Andean
foothills in relation to deforestation. Environmental Biology of Fishes 73:61-73.
Bojsen, B. H., and R. Barriga. 2002. Effects of deforestation on fish community structure in
Ecuadorian Amazon streams. Freshwater Biology 47:2246-2260.
Bray, J. R., and J. T. Curtis. 1957. An ordination of the upland forest communities of
southern Wisconsin. Ecological Monographs 27:325-349.
Burcham, J. 1988. Fish communities and environmental characteristics of two lowland
streams in Costa Rica. Revista de Biologia Tropical 36:273-285.
Bürnheim, C. M., and C. C. Fernandes. 2001. Low seasonal variation of fish assemblages in
Amazonian rain forest streams. Ichthyological Exploration of Freshwaters 12:65-78.
Bussing, W. A. 1993. Fish communities and environmental characteristics of a tropical rain
forest river in Costa Rica. Revista de Biología Tropical 41:791-809.

21
Bussing, W. A. 1998. Freshwater fishes of Costa Rica. Editorial de la Universidad de Costa
Rica, San José, Costa Rica.
Casatti, L., F. Langeani, and C. P. Ferreira. 2006. Effects of physical habitat degradation on
the stream fish assemblage structure in a pasture region. Environmental Management
38:974-982.
Castelle, A. J., A. W. Johnson, and C. Conolly. 1994. Wetland and stream buffer size
requirements – a review. Journal of Environmental Quality 23:878-882.
Chapman, L. J., and Chapman, C. A. 2002. Tropical forest degradation and aquatic
ecosystems: our current state of knowledge. Pages 237-249 in M. J. Collares-Pereira, M.
M. Coelho, and I. G. Cowx, editors. Conservation of freshwater fishes: options for the
future. Blackwell Science, Oxford, UK.
Dall, P. C. 1979. A sampling technique for littoral stone dwelling organisms. Oikos 33:106-
112.
Dirzo, R., and P. H. Raven. 2003. Global state of biodiversity and loss. Annual Review of
Environment and Resources 28:137-167.
Edwards, E. D., and A. D. Huryn. 1996. Effect of riparian land use on contributions of
terrestrial invertebrates to streams. Hydrobiologia 337:151-159.
Fausch, K. D., J. Lyons, J. R. Karr, and P. L. Angermeier. 1990. Fish communities as
indicators of environmental degradation. American Fisheries Society Symposium 8:123-
144.
Fausch, K. D., C. E. Torgersen, C. V. Baxter, and H. W. Li. 2002. Landscapes to riverscapes:
bridging the gap between research and conservation of stream fishes. BioScience 52:483-
498.
Flecker, A. S. 1992. Fish trophic guilds and the structure of a tropical stream: weak direct vs.
strong indirect effects. Ecology 73:927-940.
Gregory, S. V., F. J. Swanson, W. A. McKee, and K. W. Cummins. 1991. An ecosystem
perspective of riparian zones. BioScience 41:540-551.
Gotelli, N. J., and R. K. Colwell. 2001. Quantifying biodiversity: procedures and pitfalls in
the measurement and comparison of species richness. Ecology Letters 4:379-391.
Gotelli, N. J., and G. L. Entsminger. 2005. Ecosim: Null Models Software for Ecology,
Version 7.72. Acquired Intelligence Inc. and Kesey-Bear, Jericho, Vermont, USA.
22
Goulding, M. 1980. The fishes and the forest: explorations in Amazonian natural history.
University of California Press, Berkeley, California, USA.
Hijmans, R. J., S. E. Cameron, J. L. Parra, P. G. Jones, and A. Jarvis. 2005. Very high
resolution interpolated climate surfaces for global land areas. International Journal of
Climatology 25:1965-1978.
Holdridge, L. R. 1967. Life zone ecology. Tropical Science Center, San José, Costa Rica.
Iwata, T., S. Nakano, and M. Inoue. 2003. Impacts of past riparian deforestation on stream
communities in a tropical rainforest in Borneo. Ecological Applications 13:461-473.
Jackson, J. K., and B. W. Sweeney. 1995. Present status and future directions of tropical
stream research. Journal of the North American Benthological Society 14:5-11.
Jones, E. B. D., G. S. Helfman, J. O. Harper, and P. V. Bolstad. 1999. Effects of riparian
forest removal on fish assemblages in southern Appalachian streams. Conservation
Biology 13:1454-1465.
Karr, J. R. 1981. Assessment of biotic integrity using fish communities. Fisheries 6:21-27.
Karr, J. R., and I. J. Schlosser. 1978. Water resources and the land-water interface. Science
201:229-234.
Kamdem Toham, A., and G. G. Teugels. 1999. First data on an Index of Biotic Integrity (IBI)
based on fish assemblages for the assessment of the impact of deforestation in a tropical
West African river system. Hydrobiologia 397:29-38.
Kawaguchi, Y., and S. Nakano. 2001. Contribution of terrestrial invertebrates to the annual
resource budget for salmonids in forest and grassland reaches of a headwater stream.
Freshwater Biology 46:303-316.
Kramer, D. L. 1978. Reproductive seasonality in the fishes of a tropical stream. Ecology 59:
976-985.
Lambin, E. F., H. J. Geist, and E. Lepers. 2003. Dynamics of land-use and land-cover change
in tropical regions. Annual Review of Environment and Resources 28:205-241.
Lammert, M., and J. D. Allan. 1999. Assessing biotic integrity of streams: effects of scale in
measuring the influence of land use/cover and habitat structure on fish and
macroinvertebrates. Environmental Management 23:257-270.
Lowe-McConnell, R. H. 1987. Ecological studies in tropical fish communities. Cambridge
University Press, Cambridge, UK.

23
Lowrance, R., L. S. Altier, J. D. Newbold, R. R. Schnabel, P. M. Groffman, J. M. Denver, D.
L. Correll, J. W. Gilliam, J. L. Robinson, R. B. Brinsfield, K. W. Staver, W. Lucas, and
A. H. Todd. 1997. Water quality functions of riparian forest buffers in Chesapeake Bay
watersheds. Environmental Management 21:687-712.
McArdle, B. H., and M. J. Anderson. 2001. Fitting multivariate models to community data: a
comment on distance-based redundancy analysis. Ecology 82:290-297.
McCune, B., and J. B. Grace. 2002. Analysis of ecological communities. MJM Software
Design, Gleneden Beach, Oregon, USA.
McCune, B., and M. J. Mefford. 1999. PC-ORD. Multivariate analysis of ecological data,
Version 5.0. MjM Software, Gleneden Beach, Oregon, USA.
Montgomery, D. R., and J. M. Buffington. 1997. Channel-reach morphology in mountain
drainage basins. Geological Society of America Bulletin 109:596-611.
Naiman, R. J., and H. Décamps. 1997. The ecology of interfaces: riparian zones. Annual
Review of Ecology and Systematics 28:621-658.
Osborne, L. L., and D. A. Kovacic. 1993. Riparian vegetated buffer strips in water-quality
restoration and stream management. Freshwater Biology 29:243-258.
Peterjohn, W. T., and D. L. Correll. 1984. Nutrient dynamics in an agricultural watershed:
observations on the role of a riparian forest. Ecology 65:1466-1475.
Pimm, S. L., G. J. Russell, J. L. Gittleman, and T. M. Brooks. 1995. The future of
biodiversity. Science 269:347-350.
Pringle, C. M., and T. Hamazaki. 1997. Effects of fishes on algal response to storms in a
tropical stream. Ecology 78: 2432-2442.
Pringle, C. M., and T. Hamazaki. 1998. The role of omnivory in a neotropical stream:
separating diurnal and nocturnal effects. Ecology 79:269-280.
Pringle, C. M., and F. N. Scatena. 1999. Aquatic ecosystem deterioration in Latin America
and the Caribbean. Pages 104-113 in L. U. Hatch and M. E. Swisher, editors. Managed
ecosystems: the Mesoamerican experience. Oxford University Press, New York, New
York, USA.
Pusey, B. J., and A. H. Arthington. 2003. Importance of the riparian zone to the conservation
and management of freshwater fish: a review. Marine and Freshwater Research 54:1-16.
24
Roth, N. E., J. D. Allan, and D. L. Erickson. 1996. Landscape influences on stream biotic
integrity assessed at multiple spatial scales. Landscape Ecology 11:141-156.
Roy, A. H., C. L. Faust, M. C. Freeman, and J. L. Meyer. 2005. Reach-scale effects of
riparian forest cover on urban stream ecosystems. Canadian Journal of Fisheries and
Aquatic Science 62:2312-2329.
SAS Institute Inc. 2002. SAS Version 9.1. SAS Institute, Cary, North Carolina, USA.
Schelhas, J. 1996. Land-use choice and forest patches in Costa Rica. Pages 258-284 in J.
Schelhas and R. Greenberg, editors. Forest patches in tropical landscapes. Island Press,
Washington, D.C., USA.
Schlosser, I. J. 1991. Stream fish ecology: a landscape perspective. BioScience 41:704-712.
Scott, M. C. and G. S. Helfman. 2001. Native invasions, homogenization, and the
mismeasure of integrity of fish assemblages. Fisheries 26:6-15.
Smith, S. A., and E. Bermingham. 2005. The biogeography of lower Mesoamerican
freshwater fishes. Journal of Biogeography 32:1835-1854.
Stauffer, J. C., R. M. Goldstein, and R. M. Newman. 2000. Relationship of wooded riparian
zones and runoff potential to fish community composition in agricultural streams.
Canadian Journal of Fisheries and Aquatic Sciences 57:307-316.
Sweeney, B. W. 1993. Effects of streamside vegetation on macroinvertebrate communities of
White Clay Creek in eastern North America. Proceedings of the Academy of Natural
Sciences of Philadelphia 144:291-340.
Sweeney, B. W., T. L. Bott, J. K. Jackson, L. A. Kaplan, J. D. Newbold, L. J. Standley, W.
C. Hession, and R. J. Horwitz. 2004. Riparian deforestation, stream narrowing, and loss
of stream ecosystem services. Proceedings of the National Academy of Sciences of the
USA 101:14132-14137.
Tait, C. K., J. L. Li, G. A. Lamberti, T. N. Pearsons, and H. W. Li. 1994. Relationships
between riparian cover and the community structure of high desert streams. Journal of the
North American Benthological Society 13:45-56.
Toothaker, L. E. 1993. Multiple comparison procedures. Sage Publications, Newbury Park,
California, USA.
25
Vannote, R. L., G. W. Minshall, K. W. Cummins, J. R. Sedell, and C. E. Cushing. 1980. The
river continuum concept. Canadian Journal of Fisheries and Aquatic Sciences 37:130-
137.
Wang, L., J. Lyons, P. Rasmussen, P. Seelbach, T. Simon, M. Wiley, P. Kanehl, E. Baker, S.
Niemela, and P. M. Stewart. 2003. Watershed, reach, and riparian influences on stream
fish assemblages in the Northern Lakes and Forest Ecoregion, U.S.A. Canadian Journal
of Fisheries and Aquatic Sciences 60:491-505
Wantzen, K. M., and R. Wagner. 2006. Detritus processing by invertebrate shredders: a
neotropical-temperate comparison. Journal of the North American Benthological Society
25:216-232.
Wenger, S. 1999. A review of the scientific literature on riparian buffer width, extent, and
vegetation. Institute of Ecology, University of Georgia, Athens, Georgia, USA.
Winemiller, K. O. 1993. Seasonality of reproduction by livebearing fishes in tropical
rainforest streams. Oecologia 95:266-276.
Winemiller, K. O., and M. A. Leslie. 1992. Fish assemblages across a complex, tropical
freshwater/marine ecotone. Environmental Biology of Fishes 34:29-50.
Winemiller, K. O., and B. J. Ponwith. 1998. Comparative ecology of eleotrid fishes in
Central American coastal streams. Environmental Biology of Fishes 53:373-384.
Wintermans, J. F. G. M., and A. De Mots. 1965. Spectrophotometric characteristics of
chlorophylls a and b and their pheophytins in ethanol. Biochimica et Biophysica Acta
109: 448-453.
Wootton, J. T. and M. P. Oemke. 1992. Latitudinal differences in fish community trophic
structure, and the role of the fish herbivory in a Costa Rican stream. Environmental
Biology of Fishes 35:311-319.
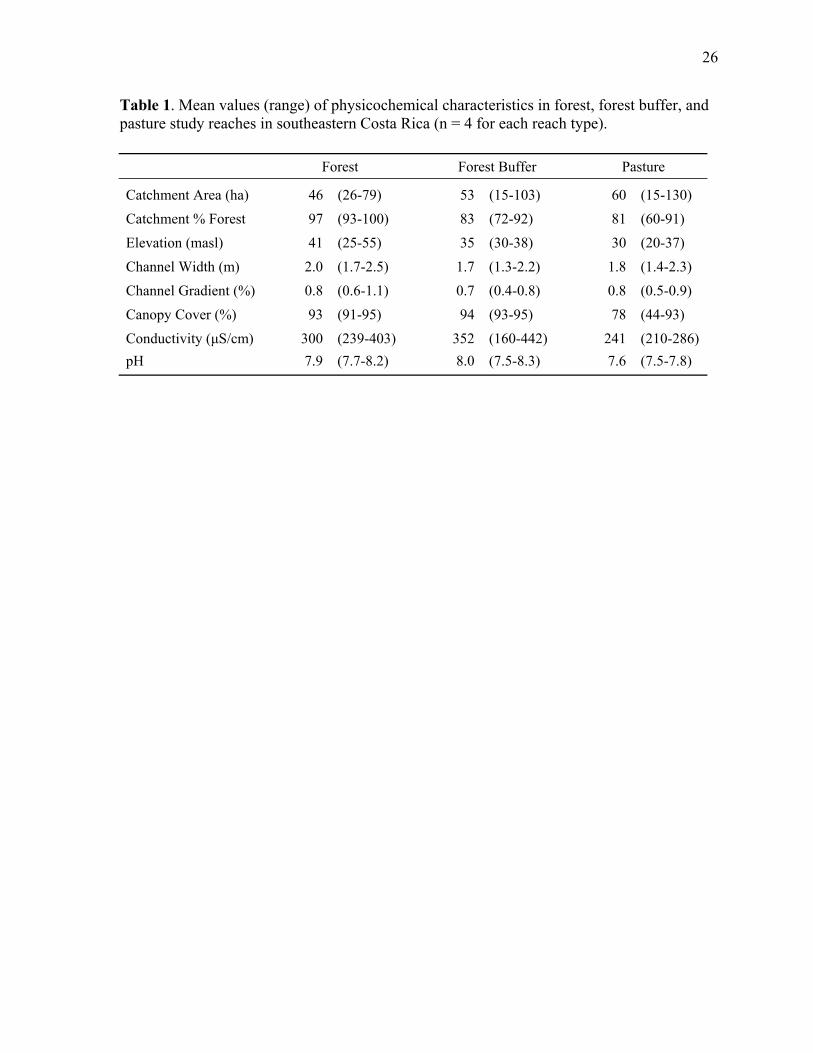
26
Table 1. Mean values (range) of physicochemical characteristics in forest, forest buffer, and pasture study reaches in southeastern Costa Rica (n = 4 for each reach type). Forest Forest Buffer Pasture
Catchment Area (ha) 46 (26-79) 53 (15-103) 60 (15-130) Catchment % Forest 97 (93-100) 83 (72-92) 81 (60-91) Elevation (masl) 41 (25-55) 35 (30-38) 30 (20-37) Channel Width (m) 2.0 (1.7-2.5) 1.7 (1.3-2.2) 1.8 (1.4-2.3) Channel Gradient (%) 0.8 (0.6-1.1) 0.7 (0.4-0.8) 0.8 (0.5-0.9) Canopy Cover (%) 93 (91-95) 94 (93-95) 78 (44-93) Conductivity (µS/cm) 300 (239-403) 352 (160-442) 241 (210-286) pH 7.9 (7.7-8.2) 8.0 (7.5-8.3) 7.6 (7.5-7.8)

27
Table 2. Results of repeated-measures ANOVA models of fish density, biomass, and species richness with reach type and sample period as fixed effects (n = 4 for each reach type). Reach Type* Reach Type Sample Period Sample Period F p F p F p
Density (individuals/m2) 4.87 0.037 3.96 0.038 1.22 0.339 Biomass (g/m2) 0.23 0.800 5.36 0.015 0.44 0.781 Species Richness (observed) 6.95 0.015 0.83 0.452 0.16 0.955 Species Richness (rarefaction) 6.16 0.021 1.67 0.217 0.37 0.827 Density By Trophic Group Herbivore-Detritivorea 12.70 0.002 5.60 0.013 2.16 0.115 Omnivore 1.76 0.227 10.91 0.0008 1.53 0.237 Invertivore 0.48 0.636 1.59 0.232 1.80 0.173 Carnivorea 0.85 0.457 2.28 0.131 0.35 0.843
Notes: Results in bold are significant at P < 0.05. For reach type, df = 2, 9; for sample period, df = 2, 18; for reach type*sample period interaction, df = 4, 18. a log10(x +1) transformed for analysis

28
Table 3. Results of one-way PERMANOVA tests for differences in the species composition of fish assemblages between reach types in the three sample periods. Pairwise Comparisons Forest vs. Forest vs. Forest Buffer vs. Sample Reach Type Forest Buffer Pasture Pasture Period F P t P t P t P
1 4.60 0.0044 0.75 0.6359 2.62 0.0072 2.45 0.0072
2 5.30 0.0015 1.19 0.2748 2.65 0.0063 2.45 0.0074
3 5.28 0.0018 1.14 0.3013 2.94 0.0038 2.25 0.0089
Notes: Results in bold are significant at P < 0.05 (df = 2, 9 for F tests).

29
Table 4. Results of ANOVA models for the effects of reach type and sampling month on mean, minimum, and maximum daily water temperature in April-May 2006, with mean values (± SE) for each reach type.
Reach Type*
Reach Type Month Month Mean ± 1 SE Variable F P F P F P Forest Forest Buffer Pasture
Mean Temperature1 8.20 0.019 20.55 0.004 1.67 0.266 24.3a ± 0.17 24.8ab ± 0.39 25.3b ± 0.29
Daily Minimum 6.20
0.035 33.95 0.001 2.29 0.182 23.9a ± 0.22 24.1ab ± 0.34 24.4b ± 0.16
Daily Maximum1 8.54 0.018 12.07 0.013 1.87 0.234 24.8a ± 0.12 25.5ab ± 0.47 26.2b ± 0.43
Notes: Results in bold are significant at P < 0.05. For reach type, df = 2, 6; for sampling month, df = 1, 6; for reach type*sampling month interaction, df = 2, 6. Different superscript letters indicate significant differences among reach types based on ANOVA models. 1log10(x) transformed for analysis

30
Table 5. Results of repeated measures ANOVA models for habitat and food resource variables with reach type and sample period as fixed effects (n=4 for each reach type, except as noted below). Reach Type* Reach Type Sample Period Sample Period F p F p F p Stream Habitat Mean Substrate Size 0.40 0.679 2.17 0.143 4.59 0.010 % Pool Habitata
2.60 0.128 2.11 0.150 0.14 0.964 Mean Depth (cm) 3.68 0.068 3.63 0.048 0.84 0.518 LWD Volumeb
1.96 0.196 5.78 0.012 6.24 0.003 Food Resources Macroinvertebrate Density (no./m²)b
0.37 0.700 1.32 0.292 0.07 0.990 Chlorophyll-a (mg/m²)b
1.44 0.287 5.35 0.046 3.69 0.068 Fruit and Seed Inputs (mg/m²)b,c
6.08 0.025 0.54 0.484 0.09 0.914 Terrestrial Insect Inputs (no./m²)b,c
0.34 0.720 0.11 0.745 0.88 0.451 Terrestrial Insect Biomass (mg/m²)b,c
2.02 0.195 5.56 0.046 1.29 0.326
Notes: Results in bold are significant at P < 0.05. Stream habitat variables and macroinvertebrate density were measured in all three sample periods. Other food resource variables were measured only in sample periods 2 and 3. a arcsin square-root transformed for analysis b log10(x) transformed for analysis c n=3 for pasture reaches

31
Figure 1. Map of study area in southeastern Costa Rica showing locations of the 12 study stream reaches.
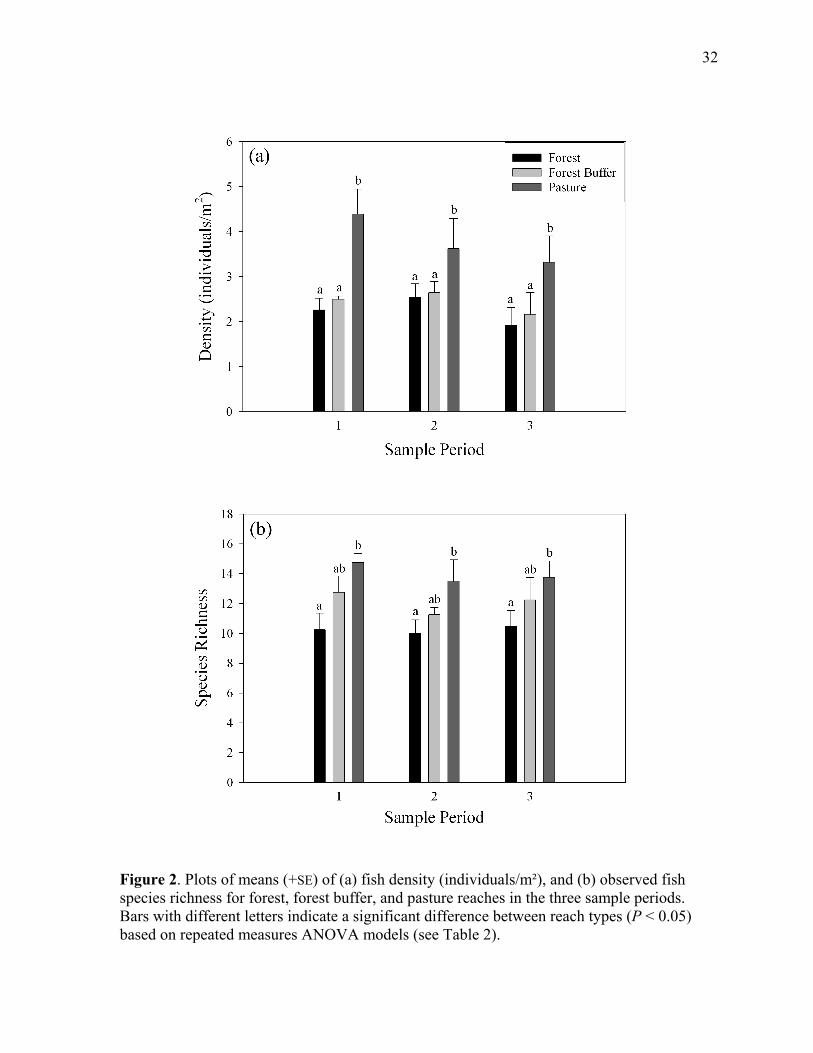
32
Figure 2. Plots of means (+SE) of (a) fish density (individuals/m²), and (b) observed fish pecies richness for forest, forest buffer, and pasture reaches in the three sample periods. ars with different letters indicate a significant difference between reach types (P < 0.05) ased on repeated measures ANOVA models (see Table 2).
sBb

33
Figure 3. Mean fish density by trophic group in forest, forest buffer, and pasture reaches, all sample periods combined.
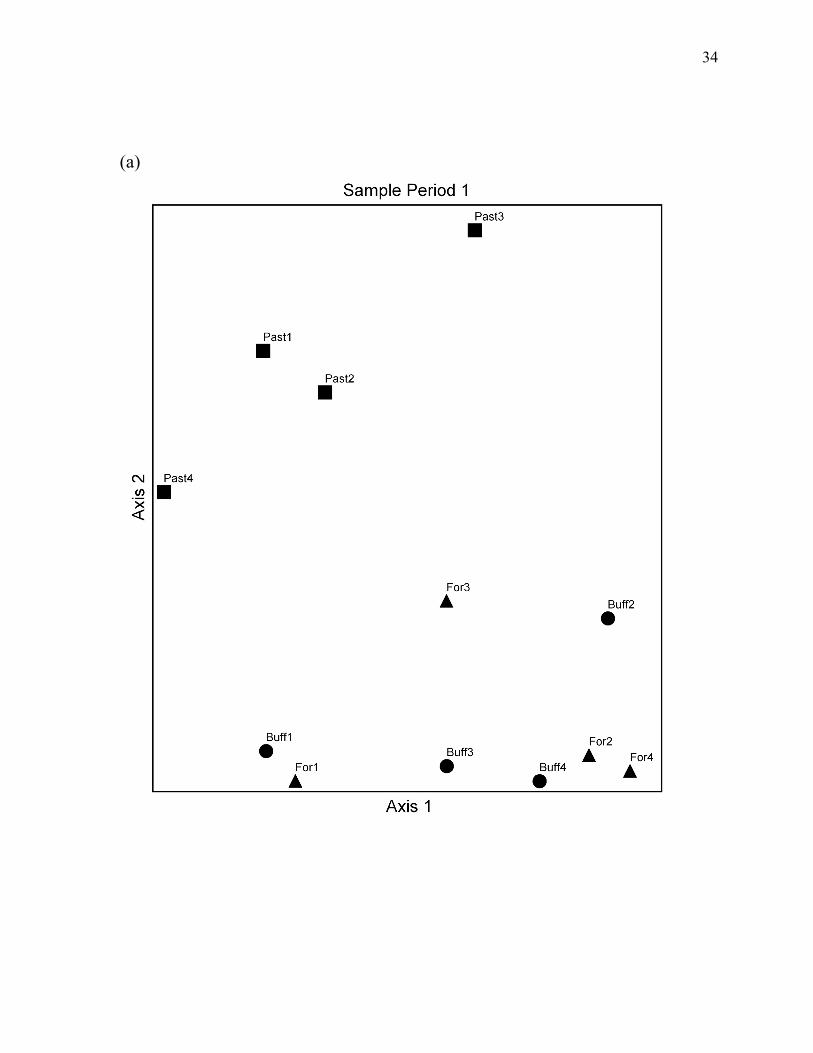
34
(a)
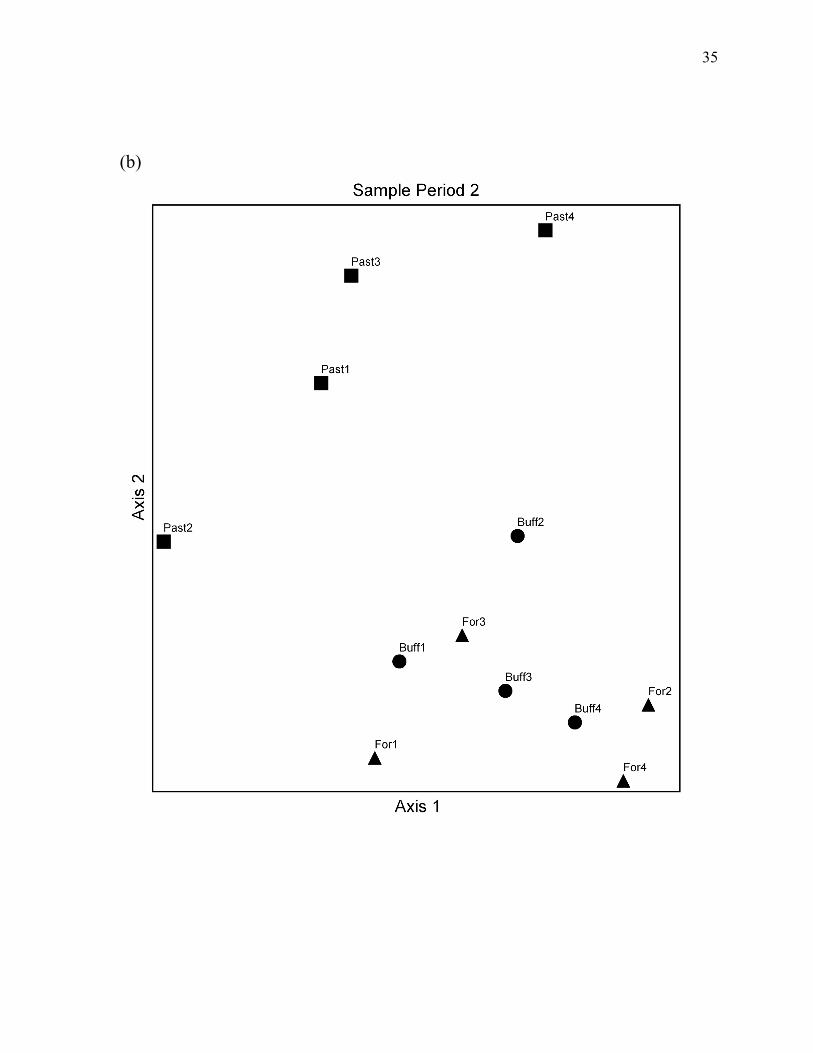
35
(b)
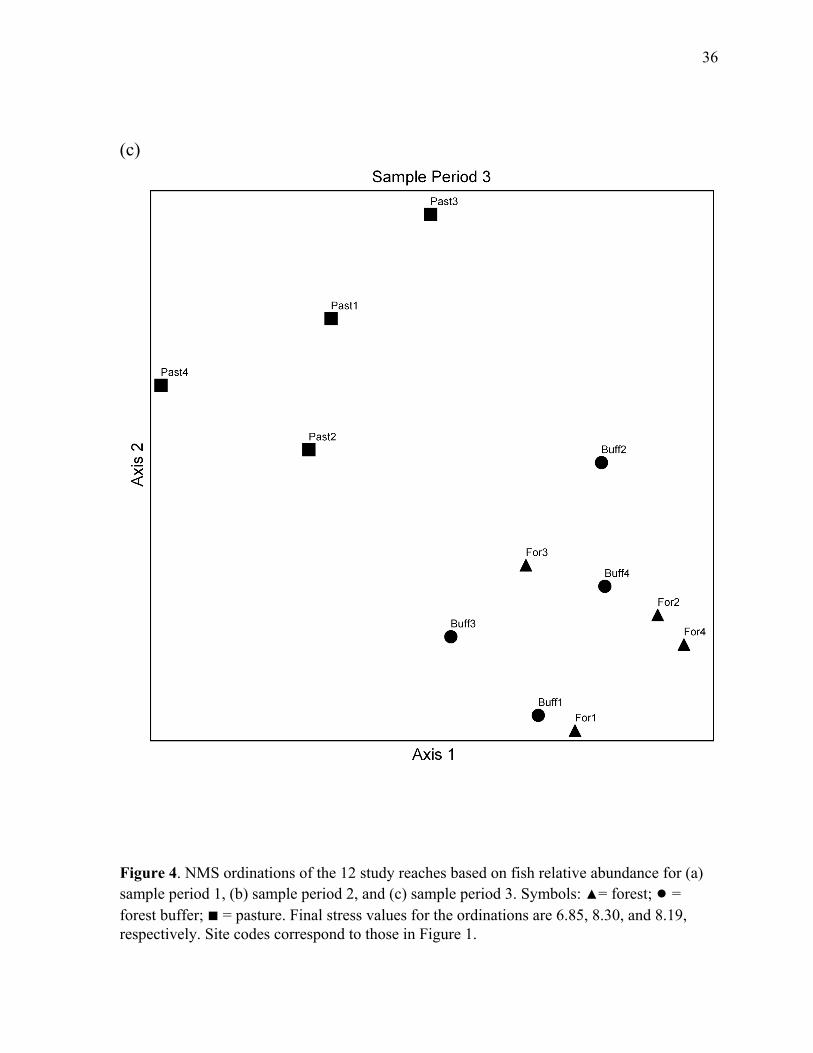
36
(c)
.19,
Figure 4. NMS ordinations of the 12 study reaches based on fish relative abundance for (a) sample period 1, (b) sample period 2, and (c) sample period 3. Symbols: ▲= forest; ● = forest buffer; ■ = pasture. Final stress values for the ordinations are 6.85, 8.30, and 8respectively. Site codes correspond to those in Figure 1.

37
Figure 5. Mean values (+SE) for (a) aerial inputs of fruits and seeds, and (b) chlorophylstanding crop in forest, forest buffer and pasture reaches (data from sample periods 2 and 3 combined). Bars with different letters indicate significant differences among reach types (0.05) from repeated measures ANOVA models based on log-transformed data (see Table
l-a
P < 5).
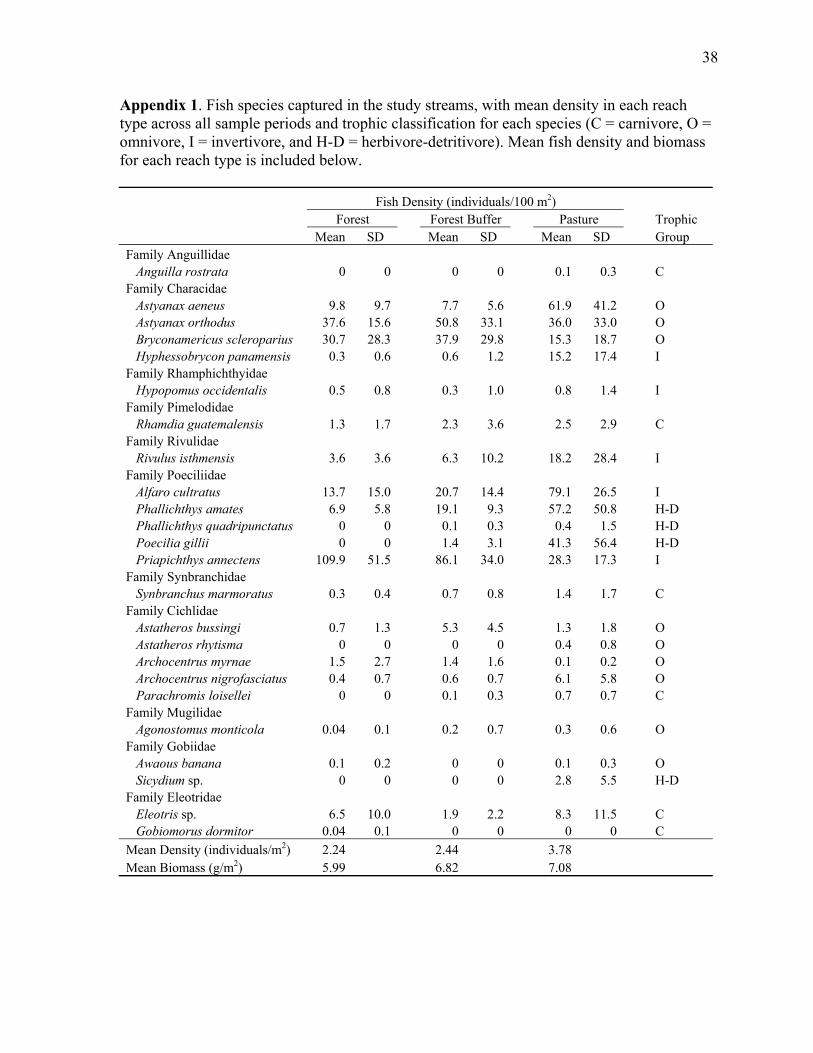
38
Appendix 1. Fish species captured in the study streams, with mean density in each retype across all sample periods and trophic classification for each species (C = carnivore, Oomnivore, I = invertivore, and H-D = herbivore-detritivore). Mean fish density and biomasfor each reach type is included below.
Fish Density (individuals/100 m
ach = s
2) Forest Forest Buffer Pasture Trophic Mean SD Mean SD Mean SD GroupFamily Anguillidae Anguilla rostrata 0 0 0 0 0.1 0.3 C Family Characidae Astyanax aeneus 9.8 9.7 7.7 5.6 61.9 41.2 O Astyanax orthodus 37.6 15.6 50.8 33.1 36.0 33.0 O Bryconamericus scleroparius 30.7 28.3 37.9 29.8 15.3 18.7 O Hyphessobrycon panamensis 0.3 0.6 0.6 1.2 15.2 17.4 I Family Rhamphichthyidae Hypopomus occidentalis 0.5 0.8 0.3 1.0 0.8 1.4 I Family Pimelodidae Rhamdia guatemalensis 1.3 1.7 2.3 3.6 2.5 2.9 C Family Rivulidae Rivulus isthmensis 3.6 3.6 6.3 10.2 18.2 28.4 I Family Poeciliidae Alfaro cultratus 13.7 15.0 20.7 14.4 79.1 26.5 I Phallichthys amates 6.9 5.8 19.1 9.3 57.2 50.8 H-D Phallichthys quadripunctatus 0 0 0.1 0.3 0.4 1.5 H-D Poecilia gillii 0 0 1.4 3.1 41.3 56.4 H-D Priapichthys annectens 109.9 51.5 86.1 34.0 Family Synbranchidae
28.3 17.3 I
SFa
11.5 C 0 C
Me
ynbranchus marmoratus 0.3 0.4 0.7 0.8 1.4 1.7 C mily Cichlidae
Astatheros bussingi 0.7 1.3 5.3 4.5 1.3 1.8 O Astatheros rhytisma 0 0 0 0 0.4 0.8 O Archocentrus myrnae 1.5 2.7 1.4 1.6 0.1 0.2 O Archocentrus nigrofasciatus 0.4 0.7 0.6 0.7 6.1 5.8 O Parachromis loisellei 0 0 0.1 0.3 0.7 0.7 C Family Mugilidae Agonostomus monticola 0.04 0.1 0.2 0.7 0.3 0.6 O Family Gobiidae Awaous banana 0.1 0.2 0 0 0.1 0.3 O Sicydium sp. 0 0 0 0 2.8 5.5 H-D Family Eleotridae Eleotris sp. 6.5 10.0 1.9 2.2 8.3 Gobiomorus dormitor 0.04 0.1 0 0 0
an Density (individuals/m2) 2.24 2.44 3.78 Mean Biomass (g/m2) 5.99 6.82 7.08

39
Chapter 2. Relationships between deforestation, riparian forest buffers, and benth
macroinvertebrates in lowland neotropical streams
Abstract
Riparian forest buffers could play an important role in mitigating the impacts of tropic
deforestation on stream ecosystems, but few studies have documented riparian buffer effects
in the tropics, and even less is known about how forest buffers might affect benthic
communities. In this study, we investigated relationships between deforestation, riparian
ic
al
fore n
can
isons
c
cts of
re generally similar to those in forested reference
ne forest buffer reach was clearly an exception to this pattern, despite the presence
iparian buffer. Differences among reach types were consistent in pool and riffle
hab g
ons
in tropical streams.
st buffers, and benthic macroinvertebrate assemblages in small lowland streams i
southeastern Costa Rica. In order to test our hypothesis that riparian forest buffers
mitigate the effects of deforestation on benthic macroinvertebrates, we made compar
between three different stream reach types: 1) forested reference reaches, 2) stream reaches
adjacent to pasture with a riparian forest buffer at least 15 m in width on both banks, and 3)
stream reaches adjacent to pasture without a riparian forest buffer. Differences between
forest and pasture reaches indicated that deforestation significantly altered the taxonomi
composition and diversity of macroinvertebrate assemblages, and eliminated several of the
most sensitive taxa. The presence of a riparian forest buffer appeared to reduce the effe
deforestation on benthic communities, as macroinvertebrate diversity and assemblage
structure in forest buffer reaches we
reaches. O
of a wide r
itats and persisted across three sampling periods during our 15-month long study. Amon
the environmental variables we measured, only stream water temperature varied significantly
among reach types, but trends in periphyton abundance and stream sedimentation may have
also been important factors driving observed differences in macroinvertebrate assemblages.
Forest cover was high upstream from all of our sites, and more research is needed to
determine whether riparian forest buffers will sustain similar functions in more extensively
deforested catchments. Nevertheless, our results provide support for Costa Rican regulati
protecting riparian forests and suggest that proper riparian management could significantly
reduce the impacts of deforestation on benthic communities

40
Introduction
Widespread clearing of tropical forests for agriculture has transformed landscapes
throughout the tropics in recent decades (Laurance 1999), and continues to affect million
hectares annually (Achard et al. 2004). Although the effects of deforestation on tropical
stream ecosystems have received relatively little research attention, there is increasing
evidence that conversion of forests to agricultural land uses has pervasive impacts on benthic
communities in tropical streams. In particular, deforestation can degrade stream habitats
(Iwata et al. 2003, Wantzen 2006), increase stream water temperatures, and alter the
abundance and diversity of basal food resources (Henry et al. 1994, Benstead et al. 2003,
Bojsen and Jacobsen 2003, Benstead and Pringle 2004), leading to major shifts in bent
community structure and declines in macroinvertebrate diversity (Benstead et al. 2003,
Bojsen and Jacobsen 2003, Iwata et al. 2003, Dudgeon 2006, Wantzen 2006).
Many of the effects of deforestation, including disruption of allochthon
s of
hic
ous resource
sub o
3).
ing
s the most important energy source for invertebrate production in headwater streams
ace et al. 1997, Hall et al. 2001).
.g.
n
sidies, decreased stream shading, and increased sedimentation, are directly linked t
processes occurring at terrestrial-aquatic interfaces (Gregory et al. 1991, Naiman and
Décamps 1997), suggesting that forested riparian buffer zones could significantly reduce the
impacts of deforestation on tropical streams (Pringle and Scatena 1999, Benstead et al. 200
In fact, studies in temperate systems have demonstrated that riparian forest buffers can filter
sediment and nutrients from agricultural runoff, stabilize stream banks, and provide shade
that moderates stream temperatures and regulates instream primary production (Karr and
Schlosser 1978, Peterjohn and Correll 1984, Osborne and Kovacic 1993, Sweeney 1993).
Streamside forests also contribute leaf litter and other particulate organic matter that provides
food and habitat for macroinvertebrates (Cummins et al. 1989, Sweeney 1993), often serv
a
(Vannote et al. 1980, Wall
Although riparian forest buffers are expected to provide similar functions in tropical
systems, studies documenting relationships between forest buffers and lotic communities in
the tropics are conspicuously lacking. Recent studies have shown that riparian vegetation
affects hydrological processes and sediment transport in humid tropical ecosystems (e
McKergow et al. 2004, Gomi et al. 2006) and is linked to physicochemical conditions i
streams (Heartsill-Scalley and Aide 2003). However, information on how these factors
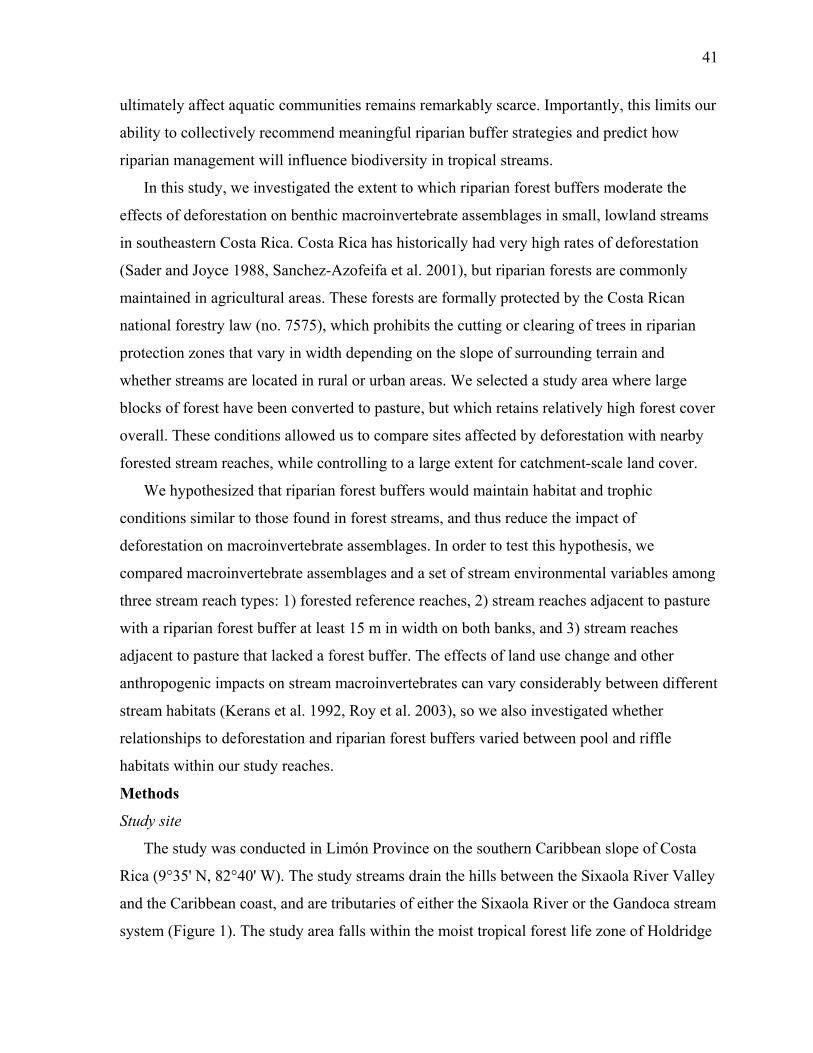
41
ultimately affect aquatic communities remains remarkably scarce. Importantly, this lim
ability to collectively recommend meaningful riparian buffer strategies and predict h
its our
ow
ripa
e
an
e
ver
aches, while controlling to a large extent for catchment-scale land cover.
sture
r
ent
ried between pool and riffle
hab
ta
am
dridge
rian management will influence biodiversity in tropical streams.
In this study, we investigated the extent to which riparian forest buffers moderate th
effects of deforestation on benthic macroinvertebrate assemblages in small, lowland streams
in southeastern Costa Rica. Costa Rica has historically had very high rates of deforestation
(Sader and Joyce 1988, Sanchez-Azofeifa et al. 2001), but riparian forests are commonly
maintained in agricultural areas. These forests are formally protected by the Costa Rican
national forestry law (no. 7575), which prohibits the cutting or clearing of trees in ripari
protection zones that vary in width depending on the slope of surrounding terrain and
whether streams are located in rural or urban areas. We selected a study area where larg
blocks of forest have been converted to pasture, but which retains relatively high forest co
overall. These conditions allowed us to compare sites affected by deforestation with nearby
forested stream re
We hypothesized that riparian forest buffers would maintain habitat and trophic
conditions similar to those found in forest streams, and thus reduce the impact of
deforestation on macroinvertebrate assemblages. In order to test this hypothesis, we
compared macroinvertebrate assemblages and a set of stream environmental variables among
three stream reach types: 1) forested reference reaches, 2) stream reaches adjacent to pa
with a riparian forest buffer at least 15 m in width on both banks, and 3) stream reaches
adjacent to pasture that lacked a forest buffer. The effects of land use change and othe
anthropogenic impacts on stream macroinvertebrates can vary considerably between differ
stream habitats (Kerans et al. 1992, Roy et al. 2003), so we also investigated whether
relationships to deforestation and riparian forest buffers va
itats within our study reaches.
Methods
Study site
The study was conducted in Limón Province on the southern Caribbean slope of Cos
Rica (9°35' N, 82°40' W). The study streams drain the hills between the Sixaola River Valley
and the Caribbean coast, and are tributaries of either the Sixaola River or the Gandoca stre
system (Figure 1). The study area falls within the moist tropical forest life zone of Hol
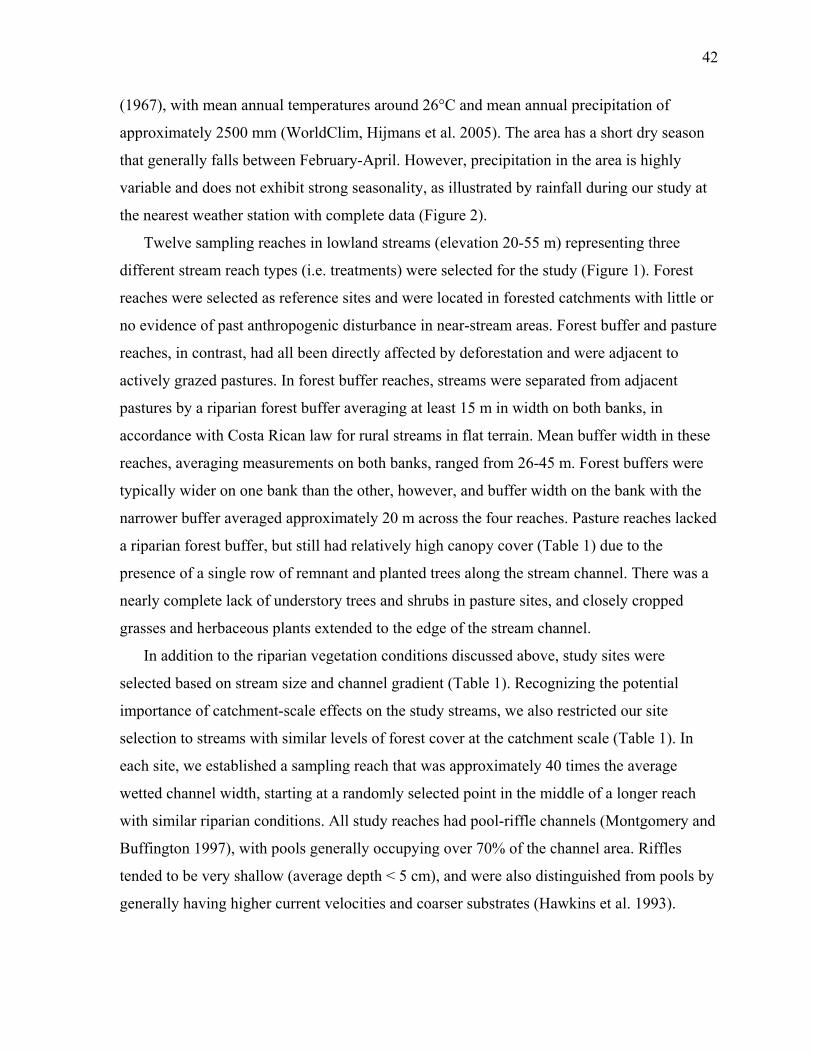
42
(19
or
re
nt
e
re
an the other, however, and buffer width on the bank with the
oximately 20 m across the four reaches. Pasture reaches lacked
a ri
l
eac
d
67), with mean annual temperatures around 26°C and mean annual precipitation of
approximately 2500 mm (WorldClim, Hijmans et al. 2005). The area has a short dry season
that generally falls between February-April. However, precipitation in the area is highly
variable and does not exhibit strong seasonality, as illustrated by rainfall during our study at
the nearest weather station with complete data (Figure 2).
Twelve sampling reaches in lowland streams (elevation 20-55 m) representing three
different stream reach types (i.e. treatments) were selected for the study (Figure 1). Forest
reaches were selected as reference sites and were located in forested catchments with little
no evidence of past anthropogenic disturbance in near-stream areas. Forest buffer and pastu
reaches, in contrast, had all been directly affected by deforestation and were adjacent to
actively grazed pastures. In forest buffer reaches, streams were separated from adjace
pastures by a riparian forest buffer averaging at least 15 m in width on both banks, in
accordance with Costa Rican law for rural streams in flat terrain. Mean buffer width in thes
reaches, averaging measurements on both banks, ranged from 26-45 m. Forest buffers we
typically wider on one bank th
narrower buffer averaged appr
parian forest buffer, but still had relatively high canopy cover (Table 1) due to the
presence of a single row of remnant and planted trees along the stream channel. There was a
nearly complete lack of understory trees and shrubs in pasture sites, and closely cropped
grasses and herbaceous plants extended to the edge of the stream channel.
In addition to the riparian vegetation conditions discussed above, study sites were
selected based on stream size and channel gradient (Table 1). Recognizing the potentia
importance of catchment-scale effects on the study streams, we also restricted our site
selection to streams with similar levels of forest cover at the catchment scale (Table 1). In
h site, we established a sampling reach that was approximately 40 times the average
wetted channel width, starting at a randomly selected point in the middle of a longer reach
with similar riparian conditions. All study reaches had pool-riffle channels (Montgomery an
Buffington 1997), with pools generally occupying over 70% of the channel area. Riffles
tended to be very shallow (average depth < 5 cm), and were also distinguished from pools by
generally having higher current velocities and coarser substrates (Hawkins et al. 1993).

43
Environmental variables
Stream habitat conditions in the study reaches were assessed once in each of following
periods: February-April 2005 (sample period 1), September-October 2005 (sample period 2
and February-April 2006 (sample period 3). This sampling schedule was intended to captur
dry and wet season conditions in 2005 and dry season conditions in 2006. However,
precipitation did not vary in a predictable seasonal pattern during the study (Figure 2).
Furthermore, discharge in the small study str
),
e
eams responded rapidly to rainfall events, and
urned to base flow conditions when rains ceased. Therefore, the three
sam
s
points
we
width
Me both
ges in
then quickly ret
pling periods will be referred to by their sequential order instead of by season.
In each study reach, we established 20 equally-spaced transects perpendicular to the
stream flow to quantify channel depth and substrate characteristics following method
adapted from Iwata et al. (2003). Stream depth was measured at five equally-spaced
along each transect. At each depth sampling point, the dominant substrate in a 10 x 10 cm
area surrounding the point was classified as sand or silt (particle size <2 mm), gravel (2-16
mm), pebble (17-64 mm), cobble (65-256 mm), boulder (>256 mm), or bedrock. These
substrates were then coded as follows: 1, sand or silt; 2, gravel; 3, pebble; 4, cobble; 5,
boulder; and 6, bedrock. The mean of the coded values for the reach was used as an index of
substrate coarseness (Bain et al. 1985, Iwata et al. 2003). In sample period 3, substrate
embeddedness was measured by visually estimating the percentage of the surface area of
individual substrate particles embedded in fine sediments (to the nearest 25%) at each depth
sampling point.
To determine the relative abundance of pool and riffle habitats in the sampling reach,
estimated the surface area of each habitat unit based on total unit length and average
from three width measurements. Channel gradient was estimated by measuring the slope of
riffle habitats with a clinometer, and assuming that pools had a slope of zero. Stream channel
canopy cover was calculated based on 20 measurements with a spherical densiometer.
asurements were made in mid-channel facing upstream, downstream and towards
banks at the top and bottom of the sampling reach, and at three equally spaced points
between. At forest buffer sites, buffer width on each bank was measured at the same five
points. Buffer width was only measured on one date because we did not observe chan
riparian vegetation at forest buffer sites during the study.
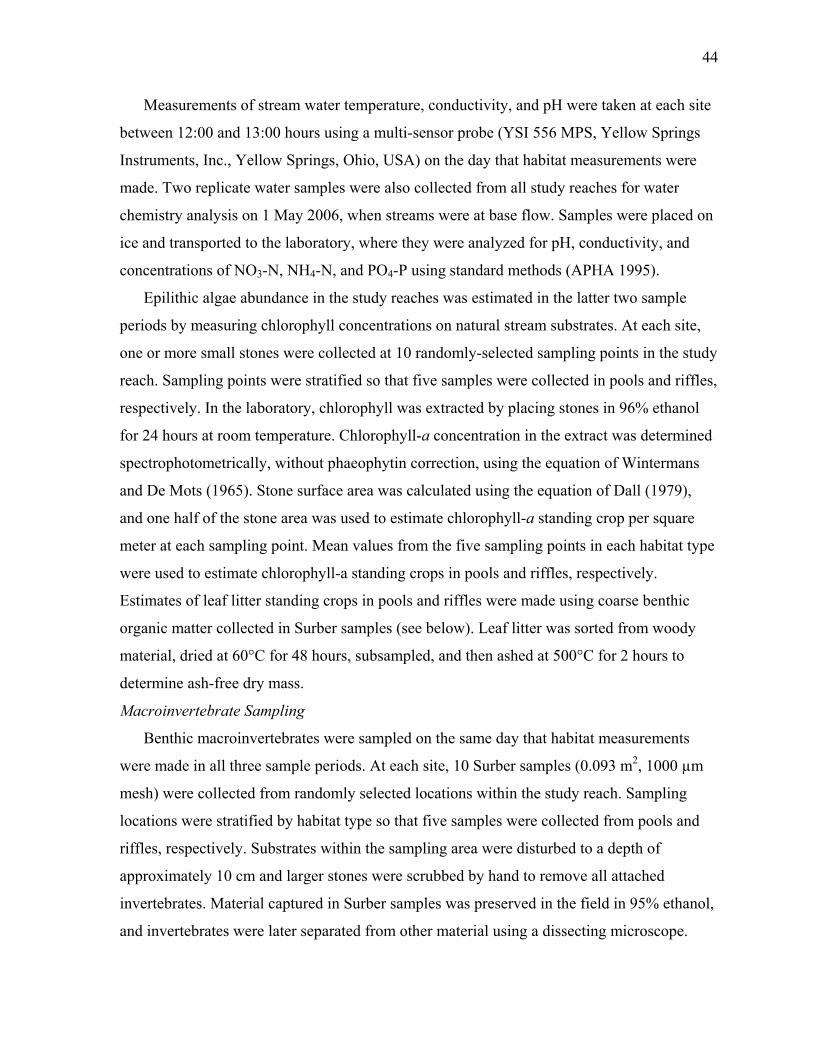
44
Measurements of stream water temperature, conductivity, and pH were taken at e
between 12:00 and 13:00 hours using a multi-sensor probe (YSI 556 MPS, Yellow Springs
Instruments, Inc., Yellow Springs, Ohio, USA) on the day that habitat measurements were
made. Two replicate water samples were also collected from all study reaches for water
chemistry analysis on 1 May 2006, when streams were at base flow. Samples were placed on
ice and transp
ach site
orted to the laboratory, where they were analyzed for pH, conductivity, and
con
y
,
rmined
spe
pe
Benthic macroinvertebrates were sampled on the same day that habitat measurements
s. At each site, 10 Surber samples (0.093 m2, 1000 µm
randomly selected locations within the study reach. Sampling
loca
l,
.
centrations of NO3-N, NH4-N, and PO4-P using standard methods (APHA 1995).
Epilithic algae abundance in the study reaches was estimated in the latter two sample
periods by measuring chlorophyll concentrations on natural stream substrates. At each site,
one or more small stones were collected at 10 randomly-selected sampling points in the stud
reach. Sampling points were stratified so that five samples were collected in pools and riffles
respectively. In the laboratory, chlorophyll was extracted by placing stones in 96% ethanol
for 24 hours at room temperature. Chlorophyll-a concentration in the extract was dete
ctrophotometrically, without phaeophytin correction, using the equation of Wintermans
and De Mots (1965). Stone surface area was calculated using the equation of Dall (1979),
and one half of the stone area was used to estimate chlorophyll-a standing crop per square
meter at each sampling point. Mean values from the five sampling points in each habitat ty
were used to estimate chlorophyll-a standing crops in pools and riffles, respectively.
Estimates of leaf litter standing crops in pools and riffles were made using coarse benthic
organic matter collected in Surber samples (see below). Leaf litter was sorted from woody
material, dried at 60°C for 48 hours, subsampled, and then ashed at 500°C for 2 hours to
determine ash-free dry mass.
Macroinvertebrate Sampling
were made in all three sample period
mesh) were collected from
tions were stratified by habitat type so that five samples were collected from pools and
riffles, respectively. Substrates within the sampling area were disturbed to a depth of
approximately 10 cm and larger stones were scrubbed by hand to remove all attached
invertebrates. Material captured in Surber samples was preserved in the field in 95% ethano
and invertebrates were later separated from other material using a dissecting microscope
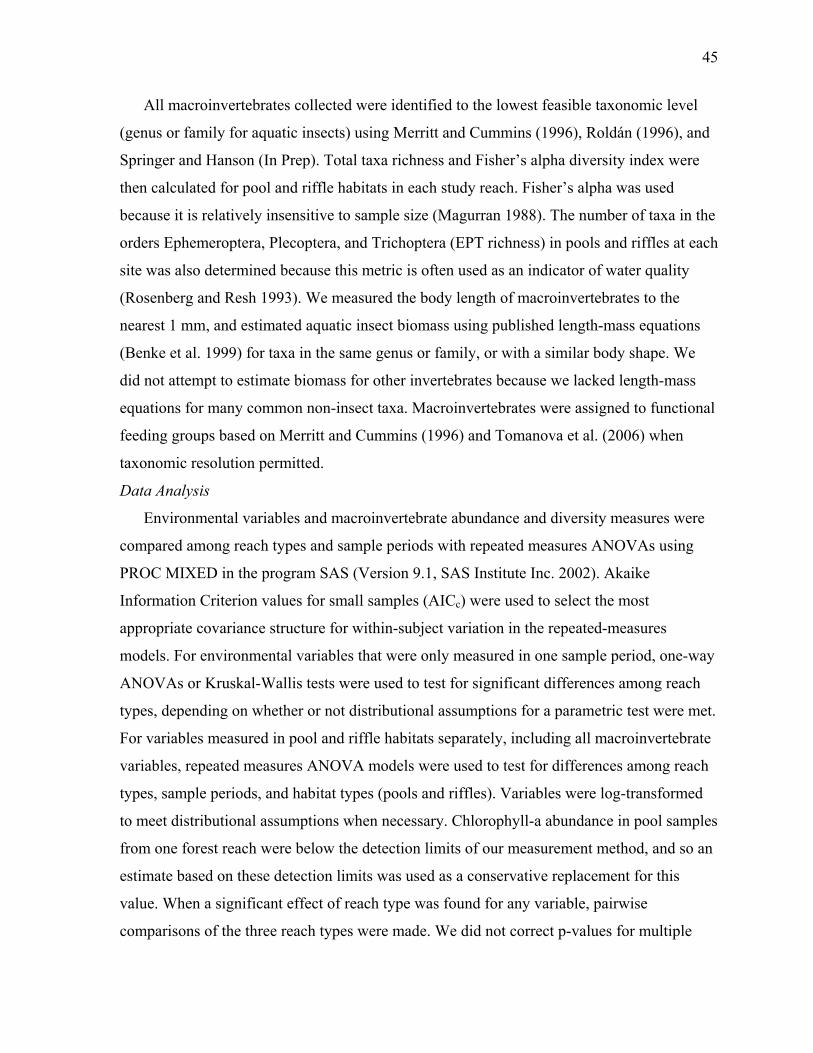
45
All macroinvertebrates collected were identified to the lowest feasible taxonomic level
(genus or family for aquatic insects) using Merritt and Cummins (1996), Roldán (1996), a
Springer and Hanson (In Prep). Total taxa richness and Fisher’s alpha diversity index were
then calculated for pool and riffle habitats in each study reach. Fisher’s alpha was used
because it is relatively insensitive to sample size (Magurran 1988). The number of taxa in
orders Ephemeroptera, Plecoptera, and Trichoptera (EPT richness) in pools and riffles at each
site was also determined because this metric is often used as an indicator of water quality
(Rosenberg and Resh 1993). We measured the body length of macroin
nd
the
vertebrates to the
nea
al
l variables and macroinvertebrate abundance and diversity measures were
s with repeated measures ANOVAs using
PRO
ay
st for differences among reach
typ
ples
an
rest 1 mm, and estimated aquatic insect biomass using published length-mass equations
(Benke et al. 1999) for taxa in the same genus or family, or with a similar body shape. We
did not attempt to estimate biomass for other invertebrates because we lacked length-mass
equations for many common non-insect taxa. Macroinvertebrates were assigned to function
feeding groups based on Merritt and Cummins (1996) and Tomanova et al. (2006) when
taxonomic resolution permitted.
Data Analysis
Environmenta
compared among reach types and sample period
C MIXED in the program SAS (Version 9.1, SAS Institute Inc. 2002). Akaike
Information Criterion values for small samples (AICc) were used to select the most
appropriate covariance structure for within-subject variation in the repeated-measures
models. For environmental variables that were only measured in one sample period, one-w
ANOVAs or Kruskal-Wallis tests were used to test for significant differences among reach
types, depending on whether or not distributional assumptions for a parametric test were met.
For variables measured in pool and riffle habitats separately, including all macroinvertebrate
variables, repeated measures ANOVA models were used to te
es, sample periods, and habitat types (pools and riffles). Variables were log-transformed
to meet distributional assumptions when necessary. Chlorophyll-a abundance in pool sam
from one forest reach were below the detection limits of our measurement method, and so
estimate based on these detection limits was used as a conservative replacement for this
value. When a significant effect of reach type was found for any variable, pairwise
comparisons of the three reach types were made. We did not correct p-values for multiple
46
comparisons in these tests, or in the tests described below, because F tests provide adequate
protection against type I error for three or fewer pairwise comparisons (Toothaker 1993).
To investigate the effects of reach type, habitat type, and sampling period on the
taxonomic composition of macroinvertebrate assemblages, we used two multivariate
techniques, permutational multivariate analysis of variance (PERMANOVA) and non-metric
multidimensional scaling (NMS). Both techniques are robust to departures from the
distributional assumptions of parametric tests, and are therefore appropriate for the analysis
of community data (McCune and Grace 2002). Prior to analysis, macroinvertebrate
abundance data were log10(x + 1) transformed and rare taxa, defined as taxa represented by a
nd periods, were removed from the data set. This
resu ity
S
pe
f reach types were made, also based on 10000 permutations.
habitat
r
R
single individual across all sampling sites a
lted in the removal of 12 of the 105 taxa collected in the study. Bray-Curtis dissimilar
(Bray and Curtis 1957) was used as the distance measure for PERMANOVA tests and NM
ordinations.
PERMANOVA tests were based on the methods of Anderson (2001) and McArdle and
Anderson (2001), and were conducted using the program PERMANOVA (Anderson 2005).
Data from all three sample periods were analyzed together, with sample period, reach ty
(forest, buffer, or pasture), and habitat type (pool or riffle) as fixed factors. P-values for the
test statistic (pseudo F-value) in PERMANOVA tests were based on 10000 permutations of
raw data. When three-way PERMANOVA tests indicated a significant effect of reach type,
pairwise comparisons o
PERMANOVA tests may have overestimated differences among reach types and
types because we used a repeated measures study design. Therefore, NMS ordination was
used to investigate how consistently samples from different habitat types and reach types
were segregated in multivariate space. NMS ordination was conducted using the program
PC-ORD (Version 5, McCune and Mefford 1999), and the final ordination was based on the
best configuration from 250 runs with random starting points. Appropriate dimensionality fo
the ordination was determined from scree plots and significance tests of stress values based
on 250 Monte Carlo randomizations. The contributions of individual taxa to differences
between reach types and habitats were determined using the two-way crossed SIMPE
routine in the program PRIMER (Version 6, Plymouth, UK).
47
Res
t no
orest
=
ll
af
nsformed chlorophyll-a
stan
e
te
ults
Environmental Variables
Stream habitat conditions varied considerably among the study reaches (Table 1), ye
statistically significant differences among reach types were observed for mean depth,
substrate coarseness, or the proportion of riffle habitat (results not shown). Substrate
embeddedness tended to be lower in forest reaches than in the other reach types (Table 1),
but differences among reach types were not statistically significant (P = 0.147, Kruskal-
Wallis test). Among the measured physicochemical variables, only stream water temperature
differed significantly among reach types (F2,9 = 4.29, P = 0.049, data log-transformed for
analysis), with pasture reaches having higher water temperatures than forest reaches. F
buffer reaches had intermediate water temperatures and did not differ from the other two
reach types. Stream temperatures also varied significantly among sample periods (F2,9
28.13, P < 0.001), and were lowest in the third sample period, when rainfall was highest. A
streams had relatively high conductivity and slightly basic pH, and nutrient concentrations
did not show any consistent differences among reach types (Table 1).
Leaf litter standing crops also showed no consistent differences among reach types (Table
1). In the repeated measures ANOVA, only sample period had a significant effect on le
litter standing crop (F2,36 = 6.27, P = 0.005). The ANOVA for log-tra
ding crop showed marginally significant effects of reach type (F2,18 = 3.13, P = 0.068)
and sample period (F1,18 = 4.10, P = 0.058), as well as a significant interaction between thes
factors (F2,18 = 3.61, P = 0.048). Chlorophyll-a standing crops tended to be greater in pasture
reaches than in forest and forest buffer reaches, but there was high variability within reach
types (Table 1).
Macroinvertebrate Abundance and Diversity
No significant differences in macroinvertebrate density among reach types were
observed, regardless of whether data were summarized at the reach level or separated by
habitat type (Table 2). There were also no significant differences in macroinvertebra
density among sample periods. However, we did observe a significant difference between
habitat types (Table 2), with riffles having significantly higher macroinvertebrate densities
(mean = 1396 individuals/m2) than pools (mean = 790 individuals/m2). Very similar patterns

48
were observed for aquatic insect biomass, which did not differ among reach types or sam
periods, but was significantly higher in riffles than in pools.
A total of 105 macroinvertebrate taxa were identified in the study streams, including 91
aquatic i
ple
nsect taxa representing 56 families (Appendix 1). Total taxa richness across all
iods ranged from 45-67 taxa for individual sampling sites, and there were no
ong reach types or sample periods. There was a
sign
s
from
ypes
d
gher EPT richness in riffles relative to pools (Figure 3).
Ma
tion
itats
ces
olution for all taxa (see Appendix 1) also showed consistent differences among
habitats and reach types. PERMANOVA tests indicated that reach type, sample period, and
sampling per
significant differences in taxa richness am
ificant difference in taxa richness between habitat types (Table 2), with riffles having
higher taxa richness than pools. In contrast to taxa richness, alpha diversity did differ among
reach types (Table 2), and was significantly higher in forest reaches than in pasture reache
(Figure 3). Alpha diversity in forest buffer reaches was intermediate and did not differ
the other two reach types (Figure 3). The difference in alpha diversity among habitat t
was only marginally significant (Table 2), indicating that the difference in taxa richness
between pools and riffles was mainly driven by sample size. EPT taxa richness also differe
among reach types (Table 2), with forest and forest buffer reaches both having significantly
higher EPT richness than pasture reaches (Figure 3). No significant differences in EPT
richness were observed among sample periods or habitat types, although there was a trend
toward hi
croinvertebrate Assemblage Structure
Macroinvertebrate assemblages in the study streams were numerically dominated by
aquatic insects (Figure 4). Non-insect taxa, especially gastropods and oligochaete worms,
were much more common in pasture reaches, but still made up less than 20% of all
macroinvertebrates collected in these sites. Ephemeroptera made up a much larger propor
of the insect fauna at forest and forest buffer reaches than in pasture reaches, where Diptera
had a higher proportional abundance (Figure 4). Differences in taxonomic composition
between pool and riffle habitats could also be seen at the ordinal level. Diptera made up a
larger proportion of total macroinvertebrate abundance in pool habitats than in riffle hab
in all reach types, while Trichoptera and Coleoptera tended have higher relative abundan
in riffles (Figure 4).
Multivariate comparisons of macroinvertebrate assemblages based on our finest
taxonomic res

49
hab in the
ach type
riff
on
lages
(Figure 4a).
nd riffle
rs
itat all had significant effects on the composition of macroinvertebrate assemblages
study reaches (Table 3). The effect of sampling period was relatively weak, while re
and channel unit type were both highly significant (Table 3). Pairwise comparisons among
reach types showed significant differences in macroinvertebrate assemblages between forest
and pasture reaches (t = 2.91, P = 0.0001) and between forest buffer and pasture reaches (t =
2.35, P = 0.0001). Differences between forest and forest buffer reaches were not as
pronounced, but were also significant (t = 1.51, P = 0.0344).
Ordination of the sampling sites based on log-transformed macroinvertebrate abundance
illustrated how assemblage composition differed among reach types and between pool and
le habitats. NMS ordination of samples from the twelve study reaches, organized by
sample period and habitat type, produced a three-dimensional configuration with moderate
stress (final stress = 12.06). Coefficients of determination between distances in the ordinati
space and Bray-Curtis distances in the original n-dimensional space indicated that the three
ordination axes explained 89.7% of the total variation in assemblage structure. The plot of
NMS axis 1 versus axis 3 supported the conclusion that macroinvertebrate assemb
varied significantly among reach types (Figure 4a). Forest and pasture reaches showed nearly
complete segregation in multivariate space, and three of the four forest buffer reaches
grouped very closely with the forest reaches (Figure 4a). One forest buffer reach, represented
by six points in the ordination, consistently fell within the pasture group
Differences in the composition of macroinvertebrate assemblages between pool a
habitats were also apparent with this combination of axes (Figure 4b). Other combinations of
axes showed similar differences between reach types and habitats, but patterns were not as
strong as for the combination presented above. Differences among sample periods, although
significant in the PERMANOVA analysis, were not apparent in any two-dimensional
combination of the ordination axes or in a three-dimensional view.
The SIMPER analysis indicated that taxa representing several different functional feeding
groups contributed to differences between forest and pasture reaches. In particular, pasture
reaches differed from forest reaches by generally having higher abundances of the scrape
Thiaridae and Hydrobiidae and the collector-gatherers Caenis and Oligochaeta and lower
abundances of the collector-gatherers Farrodes, Thraulodes, Tricorythodes, Neoelmis, and
Terpides, the shredder Anchytarsus, and the predators Heteragrion, Gomphidae,
50
Coe
ame
nd
t
,
were
nt in
ure
ree
ery
eavily on the presence or absence of a riparian forest buffer, providing
ffers can reduce the effects of deforestation
on
nagrionidae, and Palaemnema (Table 4). Insects of the families Chironomidae and
Baetidae also tended to be more abundant in pasture reaches (Table 4). Many of the s
taxa contributed to differences between forest buffer and pasture reaches (Table 4),
consistent with the generally high similarity in assemblage structure between forest and
forest buffer reaches. Some differences were also apparent, however, as Tricorythodes a
Baetidae made comparatively larger contributions to differences between pasture and fores
buffer sites while Anchytarsus was much less important (Table 4). Taxa making important
contributions to dissimilarity between pools and riffles included Thraulodes, Neoelmis
Tricorythodes, Smicridea, Thiaridae, Allenhyphes, Farrodes, and Baetidae, all of which
generally more abundant in riffles, and Caenis and Campsurus, which were more abunda
pools.
Discussion
Deforestation and riparian forest buffers
Our results suggest that conversion of forests to pasture, particularly in riparian areas,
leads to significant changes in benthic macroinvertebrate diversity and assemblage struct
in small lowland Costa Rican streams. The strong patterns we observed among our th
study reach types are particularly noteworthy considering the relatively small scale of
deforestation in our study catchments and the fact that streamside trees had not been
completely cleared in pasture reaches. Although we were not able to sample pasture and
forest buffer reaches before deforestation occurred, the geographic proximity of our study
sites and their similarities in channel size and geomorphology suggests that all sites had v
similar benthic macroinvertebrate assemblages prior to forest clearing in the study area.
Therefore, differences we observed among sites appear to be directly attributable to land use
change.
The effects of deforestation on macroinvertebrate assemblages in our study streams
appeared to depend h
support for our hypothesis that riparian forest bu
stream biota. Macroinvertebrates assemblages in pasture reaches, which lacked a forest
buffer, had lower alpha diversity and significantly different taxonomic composition than
those in our forested reference reaches. These differences were consistent with the effects of
deforestation in other neotropical streams (Bojsen and Jacobsen 2003), as well as impacts

51
associated with pastoral development in previously forested temperate catchments (Quinn
2000). Reaches with a forest buffer, in contrast, generally supported macroinvertebrate
assemblages that were very similar to those in forested reference sites, both in terms of
taxonomic composition and diversity. The contrast between pasture and buffer reaches wa
particularly evident for EPT taxa, a group commonly used as an indicator of stream
degradation.
Our diversity comparisons should be interpreted with some caution because of the
differences in taxonomic resolution among macroinvertebrate groups in our study.
Comparisons of EPT taxa richness are more robust in this regard because most EP
were identified to the genus level. The generally higher abundance of EPT taxa in forest a
forest buffer reaches compared to pasture reaches likely had a strong influence on d
in EPT richness among reach types. However, we also noted that several of the EPT families
considered especially sensitive to stream degradation in Costa Rica were either very rare (e
Perlidae, Leptoceridae) or absent (e.g. Ecnomidae) in pasture reache
s
T taxa
nd
ifferences
.g.
s. These taxa also tended
to b .
s
d
as generally much more abundant in forest reaches than pasture reaches, with
r abundance is typically
link
ndance of
e of
e uncommon in forest and forest buffer reaches, but were present at many different sites
Caveats concerning taxonomic resolution do not apply to the differences in taxonomic
composition that we observed among reach types, which were evident even at the ordinal
level and were consistent across habitat types and sample periods. These differences were
driven by a variety of taxa representing several functional feeding groups, and in some case
links to the abundance of food resources were evident. In particular, pasture reaches tende
to have higher densities of scraping taxa, especially the gastropods Thiaridae and
Hydrobiidae. The families Baetidae and Chironomidae, which were most abundant in pasture
sites, also include many scraper and collector-gatherer taxa that can exploit in-stream
primary production. Patterns of abundance among reach types for these taxa were consistent
with the trend toward higher periphyton abundance in pasture reaches.
Interestingly, we found that the most common shredder in the study streams,
Anchytarsus, w
intermediate densities in forest buffer sites (Appendix 1). Shredde
ed to the abundance of leaf litter (Cummins et al. 1989), and the density of ptilodactylids
has been shown elsewhere to have a significant positive association with the abu
litter detritus (Bojsen and Jacobsen 2003). However, in our study streams, the abundanc
52
Anchytarsus and other invertebrate shredders did not mirror patterns in leaf litter abundance,
which showed no consistent differences among reach types. It remains an open question
differences in riparian vegetation among our study sites might affect the quality of litter
available to shredders. Despite heavy shading by riparian vegetation and abundant leaf litter
in nearly all of our streams, shredders always made up a very small component of the benthi
fauna, consistent with a general pattern in tropical streams (Wantzen and Wagner 2006).
Differences in thermal regimes among reach types may have also played a significant
role in producing the patterns we observed in macroin
how
c
vertebrate assemblages. Point
mea
g of
our
ce has often been found to increase in streams where
can
y
und
ests had
ler
ca
surements in our study streams indicated that pasture reaches had significantly higher
stream temperatures than forest reaches, a pattern confirmed by continuous monitorin
stream temperatures in these sites (Lorion et al. In Prep). Temperatures in forest buffer
reaches tended to be intermediate, suggesting that riparian shading is an important factor.
Although we know very little about the thermal ecology of benthic macroinvertebrates in
study streams, water temperature is known to have a significant influence on
macroinvertebrate growth, fecundity, and survival (Sweeney 1993). The highest water
temperatures observed in pasture reaches were 2-3°C outside the range of temperatures
recorded during months of continuous monitoring of forest reaches. Some EPT taxa may be
especially sensitive to high water temperatures, and altered thermal regimes could help
explain why the EPT group was generally less abundant and diverse in pasture reaches.
Total macroinvertebrate abundan
opy cover has been reduced by forest clearing (e.g. Hawkins et al. 1982, Bojsen and
Jacobsen 2003), due in large part to increased primary production. Therefore, it was
somewhat surprising that we did not see any consistent trends in macroinvertebrate densit
among our different reach types. However, a previous study in southeastern Costa Rica fo
that forested sites actually had higher macroinvertebrate densities than sites where for
been cleared (Paaby et al. 1998), suggesting that the negative impacts of deforestation can
counteract potential subsidy effects associated with canopy removal. Overall, we surely
underestimated macroinvertebrate abundance in our study streams by using a Surber samp
with relatively coarse mesh. Nevertheless, our estimates of macroinvertebrate density were,
on average, over 10 times higher than a previous study of streams in southeastern Costa Ri

53
whe
s
tes in
erth
ss
les
g to the same factors in our study streams, our results suggest that
pacts in both habitats. It should also be noted that the Surber
sam
ling
es
ampling
ificant changes in macroinvertebrate
diversity through time, and compositional changes between sampling periods
abu
patterns and associated disturbance by floods (Flecker and Feifarek 1994, Jacobsen and
ring our
stu semblages is not
particularly surprising. The fact that high rainfall variability during our study did not obscure
re macroinvertebrates were collected with a Surber sampler with the same mesh size
(Paaby et al. 1998).
Spatial and temporal variation within reaches
Pool and riffle habitats in our study reaches supported macroinvertebrate assemblage
with very different taxonomic composition, consistent with previous work in neotropical
streams (Buss et al. 2004), including one of the few studies of stream macroinvertebra
southeastern Costa Rica (Ramírez et al.1998). Despite these differences, the effects of
deforestation, and the influence of riparian forest buffers, appeared to be consistent across
pool and riffle habitats. We did not observe a significant interaction between reach type and
habitat type for any of our comparisons of macroinvertebrate abundance, diversity, or
taxonomic composition. Results from extensive bioassessment surveys in North America
have shown that anthropogenic impacts are generally consistent across stream habitats (G
and Herlihy 2006). However, even when trends among habitats are similar,
macroinvertebrate assemblages in different habitats may be responding to different stre
gradients (Buss et al. 2004). Whether or not benthic macroinvertebrates in pools and riff
were respondin
deforestation has similar im
pler is likely to be more effective in riffles than in pools because it depends on
invertebrates being washed downstream into the collecting net. This difference in samp
efficiency may have contributed to observed differences in macroinvertebrate abundance,
taxa richness and assemblage composition between habitat types.
Temporal dynamics appeared to have less influence on macroinvertebrate assemblag
than riparian conditions or stream habitat type, despite the fact that we targeted our s
to capture seasonal variation. There were no sign
abundance or
were relatively weak compared with other factors. Seasonal changes in macroinvertebrate
ndance and assemblage structure in neotropical streams are strongly linked to rainfall
Encalada 1998, Ramírez et al. 2006). Rainfall did not show any clear seasonality du
dy, and so the lack of consistent temporal trends in macroinvertebrate as
54
differences in macroinvertebrate assemblages among reach types or habitat types is more
prising and suggests that these assemblages are largely structured by deterministic sur
For management and conservation
stre
macroinvertebrates, generally maintaining macroinvertebrate assemblages with similar
hat
pro of
reg ur
stu
highly variable and had some areas less than 15 m in width. Despite this variability, these
sim
rest buffer reach was a clear exception to this pattern, and illustrates the limitations
dis uring
effl
fro ined roads are both important sources of sediment pollution in streams
tion. It
is d this reach consistently had
nly be
exp
ove nts are reduced or eliminated (Osborne
ending on catchment-scale
forest cover in this study in order to eliminate many potentially confounding factors, and
further research will be needed to determine whether riparian buffers will sustain similar
processes.
est buffers in tropical stream
In our study, riparian forest buffers averaging at least 15 m on both banks of headwater
ams appeared to significantly reduce the effects of deforestation on benthic
diversity and taxonomic composition as sites in continuous forest. These results suggest t
per management of riparian areas could substantially reduce the negative effects
deforestation on tropical headwater streams and provide strong support for Costa Rican
ulations mandating protection of riparian forests in this zone. Forest buffers around o
dy streams were often considerably wider than this minimum requirement, but were also
areas appeared to promote stream biodiversity and maintain stream ecosystem conditions
ilar to those found in forested reference streams.
One fo
of riparian buffers. This reach, despite having a wide forest buffer, had been heavily
turbed by foraging pigs, was paralleled by a road that was subject to severe erosion d
rain events, and had high nutrient concentrations that may have been influenced by domestic
uent from several nearby residences. Stream bank trampling by livestock and erosion
m poorly mainta
(Waters 1995), and benthic habitats in this site had clearly been affected by sedimenta
ifficult to know whether water quality was also a factor, but
the lowest macroinvertebrate densities of any of our sites. Riparian forest buffers can o
ected to effectively mitigate impacts on streams when factors that bypass them or
rwhelm their capacity to filter sediments and nutrie
and Kovacic 1993, Wenger 1999).
Riparian buffer functions can also be expected to vary dep
patterns in land use (Allan 2004). We focused on reach-scale effects in catchments with high

55
functions in landscapes with more extensive deforestation. Although some studies in
perate streams have found that benthic communities are most strongly influentem ced by local
wn that
cat .
hea estrial-aquatic
rea an management has community-wide consequences in small
sig
Spe reaches compared to
abu ersity. These responses may not
effe
forest buffer, in contrast, generally supported assemblages with similar diversity and
con
div sts that our conclusions regarding forest buffer functions
pro
def
sam Monika Springer generously
spe rion,
lan
sup
riparian conditions (Sponseller et al. 2001, Lammert and Allan 1999), others have sho
chment-scale land use is more important and can overwhelm local effects (Roth et al
1996, Harding et al. 1998). Whichever spatial scale is most important, it appears that even in
vily forested catchments, clearing of riparian vegetation can disrupt terr
linkages in headwater streams (England and Rosemond 2004).
Finally, comparisons between fish and macroinvertebrate assemblages in our study
ches suggest that ripari
tropical streams. In stream reaches without a forest buffer, deforestation appeared to have
nificant, and contrasting, effects on fish and benthic macroinvertebrate assemblages.
cifically, we found higher fish abundance and diversity in pasture
forest reaches (Lorion et al. In Prep), while macroinvertebrates showed no change in
ndance in pasture reaches and appeared to decline in div
be independent, as fishes in lowland Costa Rican streams have been shown to exert top-down
cts on benthic communities (Pringle and Hamazaki 1998). Stream reaches with a riparian
taxonomic composition as forested reference sites for both fish and macroinvertebrates. This
cordance between the two assemblages, which represent multiple trophic levels and
erse habitat associations, sugge
are robust. Riparian forest buffers are not a replacement for continuous forest, but can
mote biodiversity and stream ecosystem integrity in tropical catchments affected by
orestation.
Acknowledgements
Pablo Gutiérrez made a tremendous contribution to this work through his efforts in
ple processing and macroinvertebrate identification.
provided laboratory space and draft identification keys, and helped identify many difficult
cimens. Wills Flowers also provided taxonomic expertise. Thanks to Julia Young-Lo
José Maria López, and Teodoro López for invaluable assistance in the field, and to the
downers in the study area who provided access to their farms. This research was
ported by NSF-IGERT grant no. 0114304.
56
References
ard, F., H. D. Eva, H.-J. M. P. Stibig, J. Gallego, T. Richards, and J.-P. Malingreau.
2002. Determination of defore
Ach
station rates of the world's humid tropical forests. Science
n, D.C., USA.
y 26:32-46.
06.
Ben Length-mass relationships
o the
Journal of the North American Benthological Society 18:308-
Benstead, J. P., M. M. Douglas, and C. M. Pringle. 2003. Relationship of stream invertebrate
ss
gascar. Freshwater Biology 49:490-501.
ity
iv für Hydrobiologie
Bra
297:999-1002.
Allan, J. D. 2004. Landscapes and riverscapes: the influence of land use on stream
ecosystems. Annual Review of Ecology and Systematics 35:257-284.
American Public Health Association (APHA). 1995. Standard methods for the examination
of water and wastewater. American Public Health Association, Washingto
Anderson, M. J. 2001. A new method for non-parametric multivariate analysis of variance.
Austral Ecolog
Anderson, M. J. 2005. PERMANOVA: a FORTRAN computer program for permutational
multivariate analysis of variance. Department of Statistics, University of Auckland,
Auckland, New Zealand.
Bain, M. B., J. T. Finn, and H. E. Booke. 1985. Quantifying stream substrate for habitat
analysis studies. North American Journal of Fisheries Management 5:499-5
ke, A. C., A. D. Huryn, L. A. Smock, and J. B. Wallace. 1999.
for freshwater macroinvertebrates in North America with particular reference t
southeastern United States.
343.
communities to deforestation in eastern Madagascar. Ecological Applications 13:1473-
1490.
Benstead, J. P., and C. M. Pringle. 2004. Deforestation alters the resource base and bioma
of endemic stream insects in eastern Mada
Bojsen, B. H., and D. Jacobsen. 2003. Effects of deforestation on macroinvertebrate divers
and assemblage structure in Ecuadorian Amazon streams. Arch
158:317-342.
y, J. R., and J. T. Curtis. 1957. An ordination of the upland forest communities of
southern Wisconsin. Ecological Monographs 27:325-349.
57
Buss, D. F., D. F. Baptista, J. L. Nessimian, and M. Egler. 2004. Substrate specificity,
environmental degradation, and disturbance structuring macroinvertebrate assemblages in
Cu Perry, and W. B. Taliaferro. 1989.
Dal s. Oikos 33:106-
Du
shwater Biology 51:1710-1729.
49:721-734.
tebrate
-142.
Hal ic basis of invertebrate production
Harding, J. S., E. F. Benfield, P. V. Bolstad, G. S. Helfman, and E. B. D. Jones. 1998. Stream
regory, D.
and M. K. Young. 1993. A
neotropical streams. Hydrobiologia 518:179-188.
mmins, K. W., M. A. Wilzbach, D. M. Gates, J. B.
Shredders and riparian vegetation. BioScience 39:24-30.
l, P. C. 1979. A sampling technique for littoral stone dwelling organism
112.
dgeon, D. 2006. The impacts of human disturbance on stream benthic invertebrates and
their drift in North Sulawesi, Indonesia. Fre
England, L. E., and A. D. Rosemond. 2004. Small reductions in forest cover weaken
terrestrial-aquatic linkages in headwater streams. Freshwater Biology
Flecker, A. S., and B. Feifarek. 1994. Disturbance and the temporal variability of inver
assemblages in two Andean streams. Freshwater Biology 31:131
Gerth, W. J., and A. T. Herlihy. 2006. Effect of sampling different habitat types in regional
macroinvertebrate bioassessment surveys. Journal of the North American Benthological
Society 25:501-512.
Gomi, T., R. C. Sidle, S. Noguchi, J. N. Negishi, A. R. Nik, and S. Sasaki. 2006. Sediment
and wood accumulations in humid tropical headwater streams: effects of logging and
riparian buffers. Forest Ecology and Management 224:166-175.
Gregory, S. V., F. J. Swanson, W. A. McKee, and K. W. Cummins. 1991. An ecosystem
perspective of riparian zones. BioScience 41:540-551.
l, R. O., G. E. Likens, and H. M. Malcom. 2001. Troph
in 2 streams at the Hubbard Brook Experimental Forest. Journal of the North American
Benthological Society 20:432-447.
biodiversity: the ghost of land use past. Proceedings of the National Academy of Sciences
of the USA 95:14843-14847.
Hawkins, C. P., J. L. Kershner, P. A. Bisson, M. D. Bryant, L. M. Decker, S. V. G
A. McCullough, C. K. Overton, G. H. Reeves, R. J. Steedman,
hierarchical approach to classifying stream habitat features. Fisheries 18:3-12.

58
Hawkins, C. P., M. L. Murphy, and N. H. Anderson. 1982. Effects of canopy cover, sub
composition, and gradient on the structure on macroinvertebrate communities in Cascad
Range streams of Oregon. Ecology 63:1840-1856.
strate
e
Heartsill-Scalley, T., and T. M. Aide. 2003. Riparian vegetation and stream condition in a
Henry, R., V. S. Uieda, A. A. de O. Afonso, and R. M. Kikuchi. 1994. Input of allochthonous
Holdridge, L. R. 1967. Life zone ecology. Tropical Science Center, San José, Costa Rica.
Jacobsen, D., and A. Encalada. 1998. The macroinvertebrate fauna of Ecuadorian highland
Kar ce. Science
Kerans, B. L., J. R. Karr, and S. A. Ahlstedt. 1992. Aquatic invertebrate assemblages: spatial
Lammert, M., and J. D. Allan. 1999. Assessing biotic integrity of streams: effects of scale in
Magurran. A. E. 1988. Ecological diversity and its measurement. Princeton University Press,
Mc
istance-based redundancy analysis. Ecology 82:290-297.
tropical agriculture-secondary forest mosaic. Ecological Applications 13:225-234.
matter and structure of fauna in a Brazilian headstream. Verhandlungen der Internationale
Vereinigung für Theoretische und Angewandte Limnologie 25:1866-1870.
Hijmans, R. J., S. E. Cameron, J. L. Parra, P. G. Jones, and A. Jarvis. 2005. Very high
resolution interpolated climate surfaces for global land areas. International Journal of
Climatology 25:1965-1978.
Iwata, T., S. Nakano, and M. Inoue. 2003. Impacts of past riparian deforestation on stream
communities in a tropical rainforest in Borneo. Ecological Applications 13:461-473.
streams in the wet and dry season. Archiv für Hydrobiologie 142:53-70.
r, J. R., and I. J. Schlosser. 1978. Water resources and the land-water interfa
201:229-234.
and temporal differences among sampling protocols. Journal of the North American
Benthological Society 11:377-390.
measuring the influence of land use/cover and habitat structure on fish and
macroinvertebrates. Environmental Management 23:257-270.
Laurance, W. F. 1999. Reflections on the tropical deforestation crisis. Biological
Conservation 91:109-117.
Princeton, New Jersey.
Ardle, B. H., and M. J. Anderson. 2001. Fitting multivariate models to community data: a
comment on d

59
McCune, B., and J. B. Grace. 2002. Analysis of ecological communities. MJM Software
Design, Gleneden Beach, Oregon, USA.
McCune, B., and M. J. Mefford. 1999. PC-ORD. Multivariate analysis of ecological data,
Version 5.0. MjM Software, Gleneden Beach, Oregon, USA.
McKergow, L. A., I. A. Prosser, R. B. Grayson, and D. Heiner. 2004. Performance of g
and rainforest riparian buffers in the wet tropics, Far North Queensland. 1. Riparian
hydrology. Aus
rass
tralian Journal of Soil Research 42:473-484
erritt, R. W., and K. W. Cummins. 1996. An introduction to the aquatic insects of North
America, 3rd Edition. Kendall/Hunt Publishing Company, Dubuque, Iowa, USA.
ontgomery, D. R., and J. M. Buffington. 1997. Channel-reach morphology in mountain
drainage basins. Geological Society of America Bulletin 109:596-611.
aiman, R. J., and H. Décamps. 1997. The ecology of interfaces: riparian zones. Annual
Review of Ecology and Systematics 28:621-658.
sborne, L. L., and D. A. Kovacic. 1993. Riparian vegetated buffer strips in water-quality
restoration and stream management. Freshwater Biology 29:243-258.
aaby, P., A. Ramírez, and C. M. Pringle. 1998. The benthic macroinvertebrate community
in Caribbean Costa Rican streams and the effect of two sampling methods. Revista de
Biología Tropical 46 (Suppl. 6):185-199.
eterjohn, W. T., and D. L. Correll. 1984. Nutrient dynamics in an agricultural watershed:
observations on the role of a riparian forest. Ecology 65:1466-1475.
ringle, C. M., and T. Hamazaki. 1998. The role of omnivory in a neotropical stream:
separating diurnal and nocturnal effects. Ecology 79:269-280.
ringle, C. M., and F. N. Scatena. 1999. Aquatic ecosystem deterioration in Latin America
, New York, USA.
Quinn, J. M. 2000. Effects of pastoral developme in K nd M. J.
ors. New l m inverte t y and im
Zealand m Society r h, New Z n
R Pringle, an . 2006. T poral and spatial patterns in stream
and inse s in tropical lowland streams. Jo a
Bentholog l 5:108-12
M
M
N
O
P
P
P
P
and the Caribbean. Pages 104-113 in L. U. Hatch and M. E. Swisher, editors. Managed
ecosystems: the Mesoamerican experience. Oxford University Press
nt. Pages 208-229 . J. Collier a
Winterbourn, edit Zea and strea bra es: ecolog plications for
management. New Li nological , Ch istchurc eala d.
amírez, A., C. M. d M Douglas. em
physicochemistry ct as emblages urn l of the
North American ica Society 2 5.
60
R aaby, C. M. P g . Agüero. 1998. Effect of habitat type on benthic
in two la al stream Revista
ppl. 6):201- .
R uía para e d acroi te tico o
ersidad olomb
R ., and V. H. . wate m nd be
brates. Chap & Yor w
R . Allan, and E 96. L sc ces o
integrity assessed at multiple spatial scales. Landscape Ecology 11:141-15
Roy, A. H., A. D. Rosemond, . J. Paul d ace. 2 H
specific responses of stream insects to land cover disturbance: biological consequences
ader, S. A., and A. T. Joyce. 1988. Deforestation rates and trends in Costa Rica, 1940 to
1983. Biotropica 20:11-19.
ánchez-Azofeifa, G. A., R. C. Harriss, and D. L. Skole. 2001. Deforestation in Costa Rica: a
quantitative analysis using remote sensing imagery. Biotropica 33:378-384.
AS Institute Inc. 2002. SAS Version 9.1. SAS Institute, Cary, North Carolina, USA.
ponseller, R. A., E. F. Benfield, and H. M. Valett. 2001. Relationships between land use,
spatial scale, and stream macroinvertebrate communities. Freshwater Biology 46:1409-
1424.
weeney, B. W. 1993. Effects of streamside vegetation on macroinvertebrate communities of
White Clay Creek in eastern North America. Proceedings of the Academy of Natural
ional feeding groups
of macroinvertebrates in neotropical stream Hydr b logia 5 6 1-26
T othaker, L. E. 1993. Mu son ro ub ica Park,
California, USA.
Vannote, R. L., G. W. Minshall, K. W. Cummins, J. R. Sedell, and C. E. Cushing. 1980. The
m concept. Canadian Journal h ri u e c 0-
amírez, A., P. P rin le, and G
macroinvertebrates low nd tropic s, Costa Rica. de Biología
Tropical 46 (Su 213
oldán, G. 1996. G l estu io de los m nver brados acuá s del Departament
de Antioquia. Univ de Antioquia, C ia.
osenberg, D. M Resh 1993. Fresh r bio onitoring a nthic
macroinverte man Hall, New k, Ne York.
oth, N. E., J. D D. L. rickson. 19 and ape influen n stream biotic
6.
D. S Leigh, M. , an J. B. Wall 003. abitat-
and monitoring implications. Journal of the North American Benthological Society
22:292-307.
S
S
S
S
S
Sciences of Philadelphia 144:291-340.
Tomanova, S., E. Goitia, and J. Helesic. 2006. Trophic levels and funct
s. o io 5 :25 4.
o ltiple compari p cedures. Sage P l tions, Newbury
river continuu of Fis e es and Aq atic Sci n es 37:13
137.
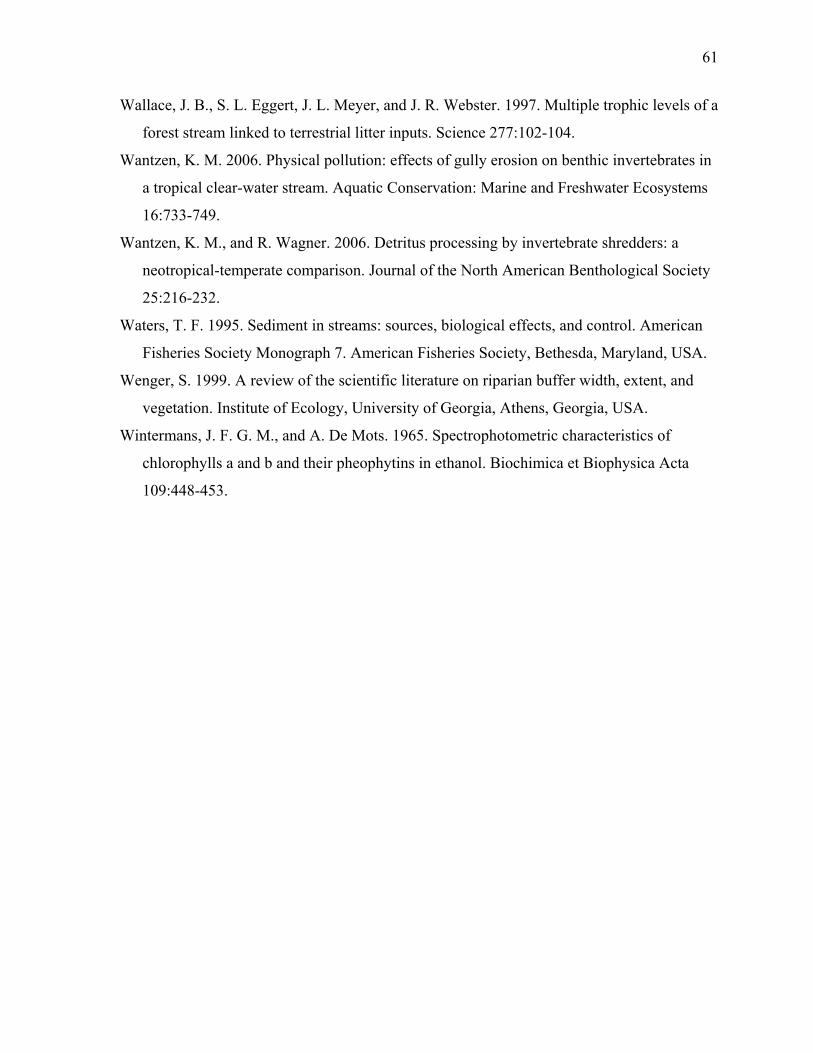
61
Wallace, J. B., S. L. Eggert, J. L. Meyer, and J. R. We t 7 u t p els of a
forest stream linked t terres a Science 277:102-104.
quatic Conservation: Marine and Freshwater Ecosystems
16:733-749.
antzen, K. M., and R. Wagner. 2006. Detritus processing by invertebrate shredders: a
neotropical-temperate comparison. Journal of the North American Benthological Society
25:216-232.
aters, T. F. 1995. Sediment in streams: sources, biological effects, and control. American
Fisheries Society Monograph 7. American Fisheries Society, Bethesda, Maryland, USA.
enger, S. 1999. A review of the scientific literature on riparian buffer width, extent, and
vegetation. Institute of Ecology, University of Georgia, Athens, Georgia, USA.
intermans, J. F. G. M., and A. De Mots. 1965. Spectrophotometric characteristics of
chlorophylls a and b and their pheophytins in ethanol. Biochimica et Biophysica Acta
109:448-453.
bs er. 199 . M ltiple ro hic lev
o tri l litter inputs.
Wantzen, K. M. 2006. Physical pollution: effects of gully erosion on benthic invertebrates in
a tropical clear-water stream. A
W
W
W
W

62
T an values (ran ) f env e tal va s n fo est nd pasture s es in southeas ost n 4 fo a type).
Forest Buffer Pasture
able 1. Me ge o ironm n riable i rest, for buffer, atudy reach tern C a Rica ( = r each re ch
Forest
Catchment Area (ha) 46 (26-79) 53 (15-103) 60 (15-130) Catchment % Forest 97 (93-100) 83 (72-92) 81 (60-91)
h (m) 2.0 (1.7-2.5) 1.7 (1.3-2.2) 1.8 (1.4-2.3) ) 11 (8-16) 12 (8-18) 17 (11-22)
Coarseness 2.8 (2.4-3.4) 2.5 (1.9-3.0) 2.6 (1.8-3.1) mbeddedness (%) 36 (27-45) 46 (39-66) 56 (40-79)
) 28 (19-41) 26 (10-49) 17 (9-23) ) 0.8 (0.6-1.1) 0.7 (0.4-0.8) 0.8 (0.5-0.9)
y Cover (%) 93 (91-95) 94 (93-95) 78 (44-93)
perature (°C) 24.6 (23.0-25.9) 25.2 (24.0-27.2) 26.3 (22.9-30.5) y (µS/cm) 300 (239-403) 352 (160-442) 241 (210-286)
7.9 (7.7-8.2) 8.0 (7.5-8.3) 7.6 (7.5-7.8) (mg/L) 0.06 (0.04-0.09) 0.08 (0.03-0.19) 0.03 (0.0-0.07) (mg/L) 0.05 (0.04-0.05) 0.04 (0.03-0.06) 0.02 (0.0-0.04)
(mg/L) 0.09 (0.05-0.12) 0.11 (0.05-0.18) 0.08 (0.05-0.17)
m2) 35.1 (23.8-40.5) 31.7 (18.4-42.0) 48.2 (19.5-90.4) yll-a (mg/m2) 5.0 (0.7-14.5) 6.4 (0.7-17.8) 62.2 (0.6-165.6)
Channel WidtMean Depth (cmSubstrate ERiffle Area (%Channel Gradient (%Canop TemConductivitpH NO3-N NH4-N PO4-P Leaf Litter (g AFDM/Chloroph
Notes: Leaf litter and chlorophyll-a standing crop means are based on habitat-weighted stimates for the study reaches for three sample periods (leaf litter) or two sample periods hlorophyll-a).
e(c

63
Table 2. Results of repeated-measures ANOVA models for macroinvertebrate density, biom , an with reach t rest buffer, or pasture), sample period and habitat type (pool or riffle) as fixed effects (n = 4 for each reach type). Reach T Sample Period Habitat Type
ass d diversity ype (forest, fo
ype
F2,18 P F1,18 P P F2,36
De y (i 0.39 .36 0.109 6.37 0.021 nsit nd./m2)a 0.680 2Bi ss ( / 0.336 7.47 0.014 Taxa ich e 43 8 0.098 10.57 0.004 Al Div r 3.73 0.08 0.925 3.46 0.079 EP axa 0.505 2.24 0.152
oma g m2)a 0.58 0.569 1.13R n ss 2. 0.116 2.4
pha e sity 0.044 T T Richness 4.20 0.032 0.70
Not es t gnifica .05. Biomass comparisons are based on aquatic insects only. Interaction terms were nt for any of the models. a lo ) t n analysis
es: R ul s in bold are si nt at P < 0 not significa
g10(x ra sformed for

64
Table 3. Results of three-way PERMANOVA test for the effects of reach type, sample period, and habitat type on the taxonomic composition of macroinvertebrate assemblages in study reaches in southeastern Costa Rica. Source df SS MS F P Reach Type (R) 2 14401 7201 6.1371 0.0001 Sample Period (P) 2 4194 2097 1.7874 0.0342 Habitat Type (H) 1 14403 14403 12.2758 0.0001 R x P 4 3035 759 0.6467 0.9587 P x H 2 653 326 0.2782 0.9999 R x H 2 1962 981 0.8363 0.6481 R x P x H 4 1824 456 0.3887 0.9999 Residual 54 63358 1173
Notes: Results in bold are significant at P < 0.05.

65
Table 4. List of taxa making the largest contributions to dissimilarity between forest and asture reaches, and between forest buffer and pasture reaches, based on SIMPER analysis, order of decreasing importance. Taxa in bold were generally more abundant in pasture aches.
Forest Forest Buffer
pinre
Rank vs. Pasture vs. Pasture 1 Farrodes Tricorythodes 2 Anchytarsus Farrodes 3 Thiaridae Thiaridae 4 Thraulodes Thraulodes 5 Tricorythodes Caenis
9 Heteragrion Campsurus 10 Gomphidae Chironomidae 11 Terpides Heteragrion 12 Coenagrionidae Coenagrionidae 13 Hydrobiidae Oligochaeta 14 Palaemnema Hydrobiidae 15 Campsurus Hexatoma 16 Hexacylloepus Hexacylloepus 17 Chironomidae Anchytarsus 18 Perigomphus Terpides 19 Baetidae Gomphidae 20 Hexatoma Palaemnema
6 Caenis Allenhyphes 7 Neoelmis Neoelmis 8 Oligochaeta Baetidae

66
Figure 1. Map of study area in southeastern Costa Rica, with locations of the 12 sampling reaches.
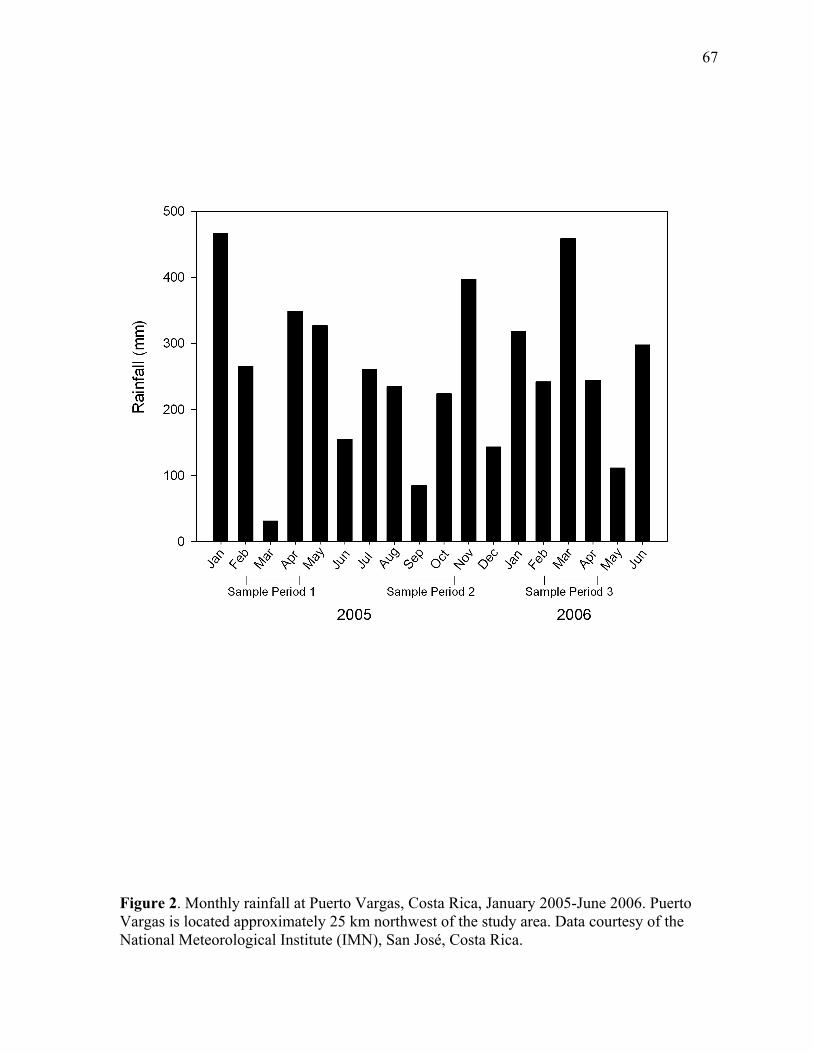
67
igure 2. Monthly rainfall at Puerto Vargas, Costa Rica, January 2005-June 2006. Puerto as is located approximately 25 km northwest of the study area. Data courtesy of the nal Meteorological Institute (IMN), San José, Costa Rica.
FVargNatio
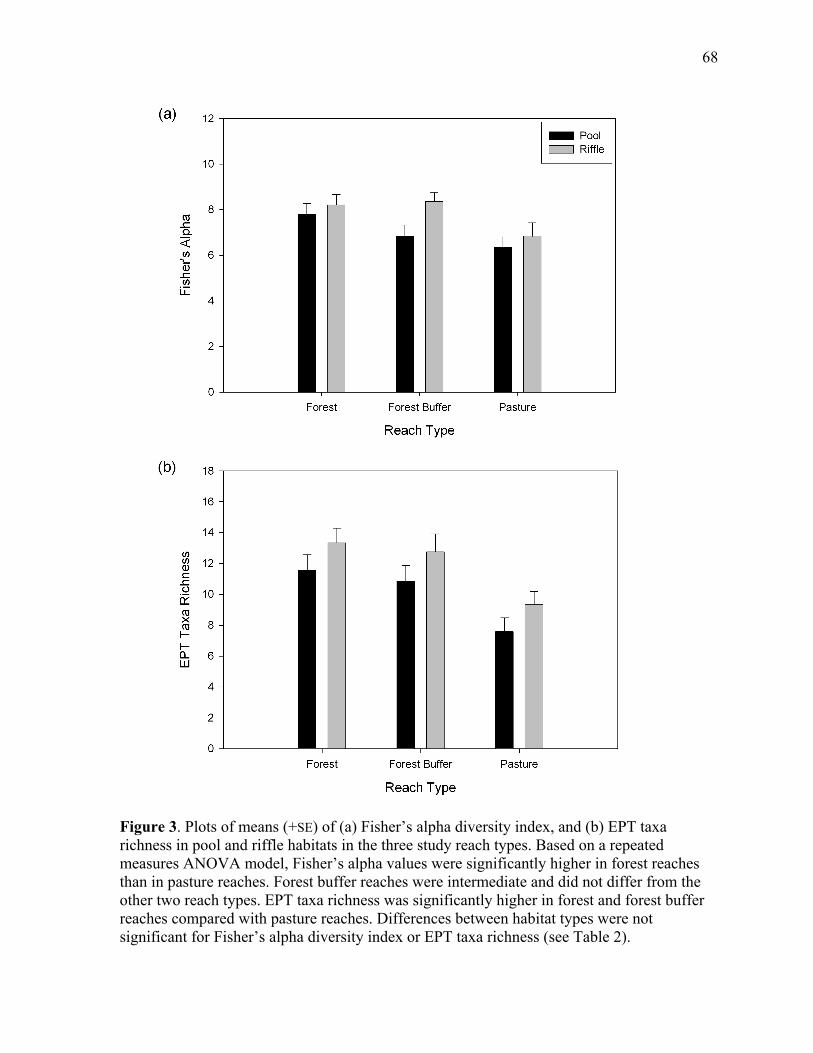
68
Figure 3. Plots of means (+ ) of (a) Fisher’s alpha dive ity x, an ( EPT axarichness in pool an s in tudy r t a n temeasures ANOVA model, Fisher’s alpha values were significantly higher in forest reaches than in pasture reaches. Forest buffer reaches were int di nd oother two reach types. EPT taxa richn ifica hi in st nd st er r aches compared ach ces b n ta s er t s for Fis ersit EPT taxa richness (see Table 2).
SEd riffle habitat
rs inde d b) t the three s each ypes. B sed o a repea d
erme ate agh
did n t differ from the ess was sign ntly er fore a fore buff
e with pasture re es. Differen etwee habi t type w e noignificant her’s alpha div y index or

69
Figure 4. Taxonomic composition o brate asse ge a po nriffles in the three study reach types in southeastern Costa Rica. Proportio ar se allmacroinvertebrates captured in each ss am g p d
f macroinverte mbla s in ( ) ols a d (b) ns e ba d on
reach type acro all s plin erio s.
70
(a)
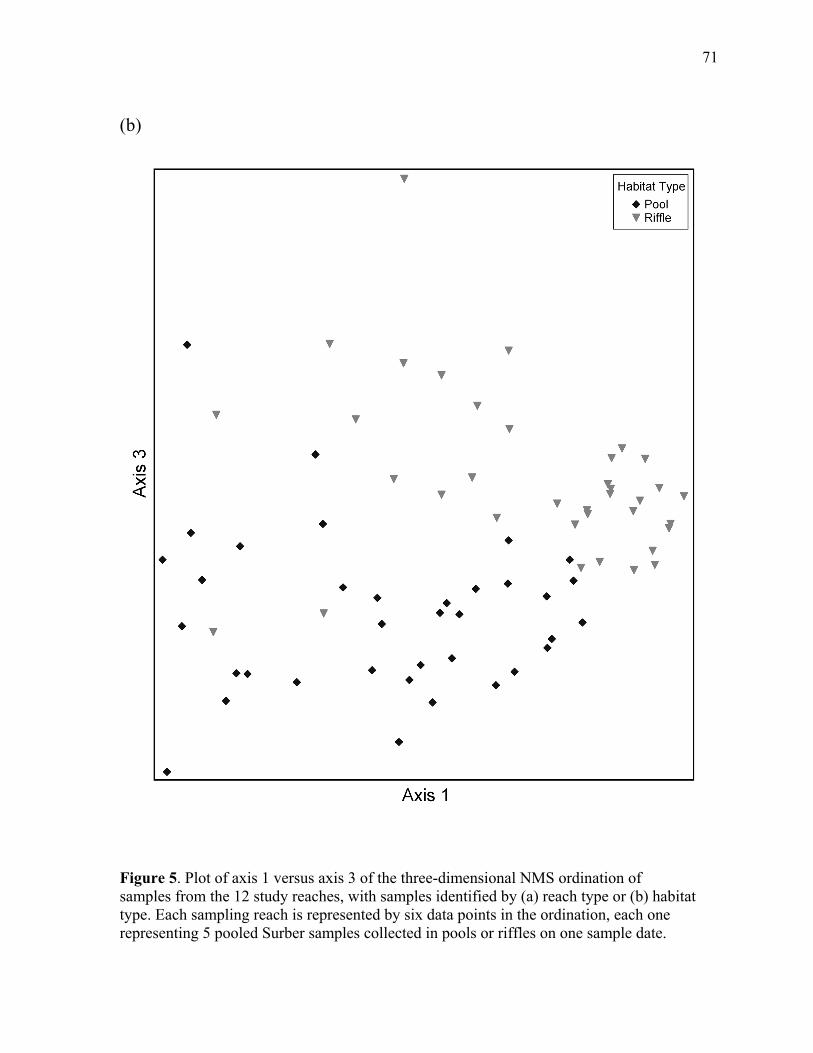
71
(b)
Figure 5. Plot of axis 1 versus axis 3 of the three-dimensional NMS ordination of samples from the 12 study reaches, with samples idtype. Each sampling reach is represented by six data poin
entified by (a) reach type or (b) habitat ts in the ordination, each one
pooled Surber samples collected in pools or riffles on one sample date. representing 5
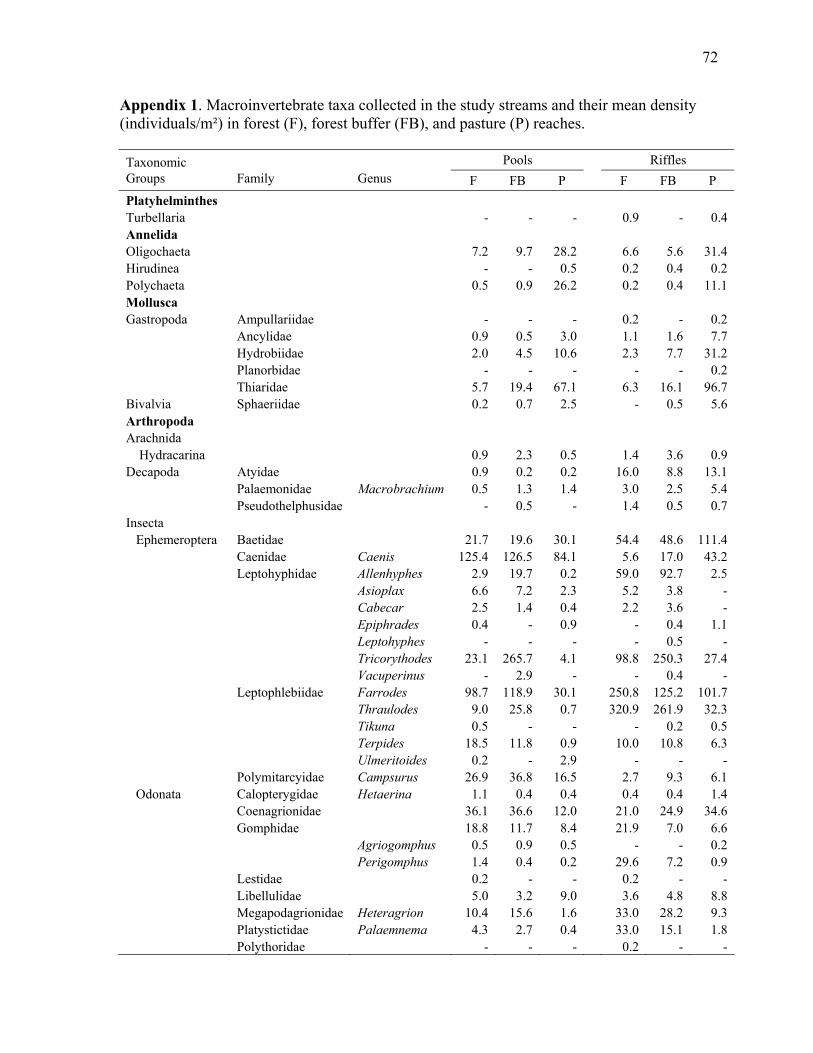
72
Appendix 1. Macroinvertebrate taxa collected in the study streams and their mean density (individuals/m²) in forest (F), forest buffer (FB), and pasture (P) reaches. Taxonomic Pools Riffles Groups Family Genus F FB P F FB P Platyhelminthes Turbellaria - - - 0.9 - Annelida Oligochaeta 7.2 9.7 28.2 6.6 5.6 31Hirudinea
0.4
.4 - - 0.5 0.2 0.4 0.2
Pol 4 11.1 Mo
2 .7
- 0.2
16.1 96.7 6
3.6 0.9 8.8 13.1
5.4 .7
19.6 30.1 54.4 48.6 111.4
4 126.5 84.1 5.6 17.0 43.2 5
- -
0.5 - 250.3 27.4
- 101.7 32.3
0.5 6.3
- 6.1
.4 34.6 6.6
- 0.2 2 0.9 - -
4.8 8.8 28.2 9.3
1.8 Polythoridae - - - 0.2 - -
ychaeta 0.5 0.9 26.2 0.2 0.llusca
Gastropoda Ampullariidae - - - 0.2 - 0. Ancylidae 0.9 0.5 3.0 1.1 1.6 7 Hydrobiidae 2.0 4.5 10.6 2.3 7.7 31.2 Planorbidae - - - - Thiaridae 5.7 19.4 67.1 6.3 Bivalvia Sphaeriidae 0.2 0.7 2.5 - 0.5 5.Arthropoda Arachnida Hydracarina 0.9 2.3 0.5 1.4 Decapoda Atyidae 0.9 0.2 0.2 16.0 Palaemonidae Macrobrachium 0.5 1.3 1.4 3.0 2.5 Pseudothelphusidae - 0.5 - 1.4 0.5 0Insecta Ephemeroptera Baetidae 21.7 Caenidae Caenis 125.
Leptohyphidae Allenhyphes 2.9 19.7 0.2 59.0 92.7 2. Asioplax 6.6 7.2 2.3 5.2 3.8 Cabecar 2.5 1.4 0.4 2.2 3.6 Epiphrades 0.4 - 0.9 - 0.4 1.1 Leptohyphes - - - - Tricorythodes 23.1 265.7 4.1 98.8 Vacuperinus - 2.9 - - 0.4 Leptophlebiidae Farrodes 98.7 118.9 30.1 250.8 125.2 Thraulodes 9.0 25.8 0.7 320.9 261.9 Tikuna 0.5 - - - 0.2 Terpides 18.5 11.8 0.9 10.0 10.8 Ulmeritoides 0.2 - 2.9 - - Polymitarcyidae Campsurus 26.9 36.8 16.5 2.7 9.3 Odonata Calopterygidae Hetaerina 1.1 0.4 0.4 0.4 0.4 1 Coenagrionidae 36.1 36.6 12.0 21.0 24.9 Gomphidae 18.8 11.7 8.4 21.9 7.0 Agriogomphus 0.5 0.9 0.5 -
Perigomphus 1.4 0.4 0.2 29.6 7.Lestidae 0.2 - - 0.2
Libellulidae 5.0 3.2 9.0 3.6 Megapodagrionidae Heteragrion 10.4 15.6 1.6 33.0 Platystictidae Palaemnema 4.3 2.7 0.4 33.0 15.1

73
Appendix 1 cont. Taxonomic Pools Riff
les
Groups Family Genus F FB P F FB P Plecoptera Perlidae Anacroneuria 1.8 3.8 - 19.7 16.9 1.1 Hemiptera Gerridae - 0.2 - 1.3 0.5 Hebridae Hebrus - - - - - Mesoveliidae - - 0.4 0.5 0.5 Naucoridae - 0.5 - 2.7 2. Veliidae Rhagovelia - 0.7 - 2.9 5. Microvelia - - - 0.4 0.2 Megaloptera Corydalidae Chloronia - - - 0.2 - - Corydalus - - - 0.5 - Platyneuromus - - - 0.4 - Trichoptera Calamoceratidae Phylloicus 1.6 0.2 0.9 1.4 0.2 Ecnomidae Austrotinodes 1.8 0.5 - 0.9 1.4 Helicopsychidae - - 0.2 0.2 0. Hydropsychidae Macronema 4.5 2.0 0.2 5.4 0 Smicridea Leptonema
0.9 0.2 0.4
7 0.5 2 1.6
0.2
- 0.2 0.4
- 2 0.4 .2 -
0.7 0.7 0.2 40.0 51.8 9.3 - - - 0.5 1.3 5.2
- .6
0.5 8 4 -
2.0 1.4 0.4
4 2.0 - 26.2
-
- - 8 2.9
1.1 10.9 0.2 9.7
.7 - 2.3 7.4 Neocylloepus - - - - 0.2 -
Neoelmis 14.4 15.4 6.1 87.7 95.4 43.1 Notelmis - - - 0.2 - - Phanocerus - - - - - 0.2
- - 3 .1
- -
Hydroptilidae Alisotrichia - - - 0.7 0.7 Neotrichia 2.9 3.9 1.1 13.3 17.6 15 Ochrotrichia - - - 0.2 - Oxyethira - - 0.2 - - 6. Leptoceridae Nectopsyche 2.2 1.8 - 0.5 2.2 0. Oecetis 0.2 - - - - Philopotamidae Chimarra - 0.4 - 16.9 20.3 Polycentropodidae Polycentropus 1.3 0.9 3.2 1.4 - Polyplectropus 0.7 0.2 1.1 4.1 0.2 Xiphocentronidae 0.4 0.5 0.7 1.1 0. Lepidoptera Pyralidae - 0.2 1.8 - Coleoptera Chrysomelidae - 0.2 - - - Curculionidae - - - - 0.2 - Dryopidae - - - - 0.5 - Dytiscidae 0.7 - 1.1 0.2 1.1 4.8 Elmidae Austrolimnius - 0.4 1.3 - 0.7 6.8 Cylloepus 1.1 - 0.5 0.7 Heterelmis 1.6 1.3 0.7 8.1 1. Hexacylloepus 7.7 12.7 16.7 2.9 1 Hexanchorus - - 0.2 - - Macrelmis 1.3 4.3 1.3 6.1 12.7 Microcylloepus 0.2 0.7 0
Stenhelmoides - - - - 0.2 Gyrinidae 0.2 - - 0.2 - Hydraenidae - - 0.4 - - 1. Hydrophilidae 0.4 - 0.2 0.2 - 1 Hydroscaphidae - 0.5 2.3 -
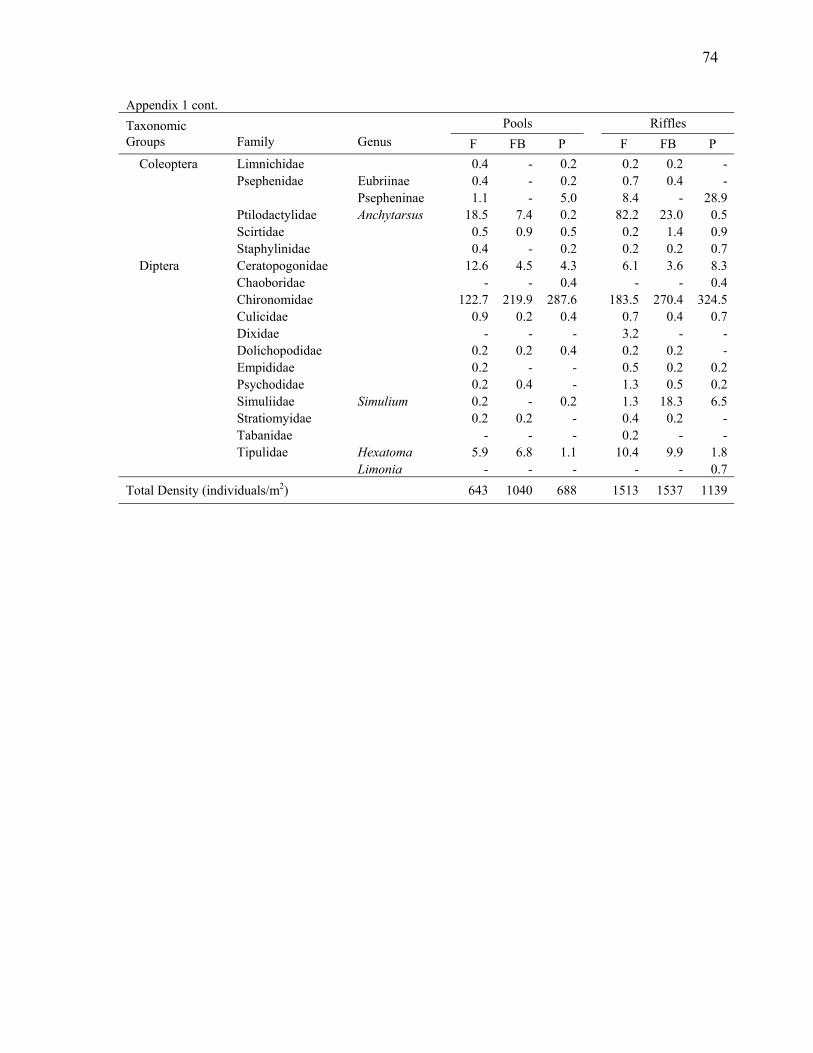
74
Appendix 1 cont. Taxonomic Pools Riffles Groups Family Genus F FB P F FB P Coleoptera Limnichidae 0.4 - 0.2 0.2 0.2 - Psephenidae Eubriinae 0.4 - 0.2 0.7 0.4 Psepheninae 1.1 - 5.0 8.4 - Ptilodactylidae Anchytarsus 18.5 7.4 0.2 82.2 23.0
- 28.9
0.5 .4 0.9 .2 0.7
3 4
324.5 .4 0.7 - -
- 0.2 0.2
.3 6.5
.2 - - -
8 7
1139
Scirtidae 0.5 0.9 0.5 0.2 1Staphylinidae 0.4 - 0.2 0.2 0
Diptera Ceratopogonidae 12.6 4.5 4.3 6.1 3.6 8. Chaoboridae - - 0.4 - - 0. Chironomidae 122.7 219.9 287.6 183.5 270.4 Culicidae 0.9 0.2 0.4 0.7 0 Dixidae - - - 3.2 Dolichopodidae 0.2 0.2 0.4 0.2 0.2 Empididae 0.2 - - 0.5 0.2 Psychodidae 0.2 0.4 - 1.3 0.5 Simuliidae Simulium 0.2 - 0.2 1.3 18 Stratiomyidae 0.2 0.2 - 0.4 0 Tabanidae - - - 0.2 Tipulidae Hexatoma 5.9 6.8 1.1 10.4 9.9 1. Limonia - - - - - 0.Total Density (individuals/m2) 643 1040 688 1513 1537
75
C apter 3: Altitudinal gradients in diversity and diadromy in stream fish assemblages
of the Sixaola River basin, Costa Rica
Abstract
Distributional patterns of stream fishes remain poorly understood in many areas o
Mesoamerica, while anthropogenic impacts continue to alter freshwater ecosystems
throughout the region. Diadromous fishes may be especially vulnerable to habitat
degradation and hydrologic alterations, but few studies have focused on their distribution a
abundance in Mesoamerican streams. In this study, we investigated how fish diversity and
assemblage structure vary along an altitudinal gradient in the Sixaola River basin, one of the
least-impacted river basins on the Caribbean slope of Costa Rica. Stream fishes were
sampled in 20 reference-quality sites located at elevations from near sea level to 500 m. Fish
diversity declined steeply with increasing elevation, with very limited species replace
Ordination of the study sites based on fish relative abundance showed some grouping of
sites, based in part on geographic proximity. The main gradient in fish assemblage str
was correlated with several stream habitat variables, especially the amount of pool habitat,
substrate size, and channel slope. The location of sampling sites within the river network
appeared to have a less important influence on fish diversity than altitudinal gradients in
stream habitat, but may still play an important role in structuring local fish assemblages
Diadromou
h
f
nd
ment.
ucture
.
s fishes were common at most sites, and did not show strong altitudinal gradients
in s
,
tors
stream fishes and
pecies richness or abundance. As a result, their contribution to local diversity and
abundance increased significantly with elevation, and diadromous fishes were dominant at
the highest elevation sites. Our results illustrate how altitudinal gradients in habitat can affect
stream fish assemblages and highlight the importance of riverine connectivity to the
ecological integrity of streams in Mesoamerica.
Introduction
Freshwater fishes respond to a wide range of environmental gradients in lotic ecosystems
producing heterogeneity in assemblage structure at multiple spatial scales (Matthews 1998).
Documenting this diversity and developing an understanding of the biotic and abiotic fac
that interact to maintain it is crucial for developing effective conservation strategies
(Angermeier and Winston 1998). Nevertheless, distributional patterns of
76
fact
ic
cean (Angermeier and
Kar
ons
ariation in biological
com
ors influencing fish assemblage structure remain poorly understood in many areas of the
tropics.
Mesoamerica has a diverse freshwater fish fauna that reflects a complex history of
colonization from South America and subsequent diversification (Miller 1966, Myers 1966,
Bermingham and Martin 1998). Barriers to dispersal have resulted in very limited geograph
ranges for many fish species, and high levels of endemism in the region (Smith and
Bermingham 2005). The freshwater ecosystems that support these fishes, however, are being
heavily altered by hydroelectric development, pollution, and deforestation (Pringle and
Scatena 1999, Anderson et al. 2006). Thus, there is an urgent need to document the
distribution of freshwater species and assemblages in Mesoamerican river systems that are
relatively intact, both as a baseline by which to compare future changes and as a goal for
restoration in systems that have already been degraded.
Studies of freshwater fishes in Mesoamerica have generally emphasized variation in fish
assemblages along gradients in stream size and/or distance from the o
r 1983, Lyons and Schneider 1990, Winemiller and Leslie 1992, Rodiles-Hernández et al.
1999, Esselman et al. 2006), and have documented positive relationships between
assemblage diversity and stream size, as well as longitudinal zonation from headwater to
coastal areas. Work in other regions has shown that freshwater fish assemblages can also
vary greatly among streams that are similar in size, but which vary in watershed position
(Osborne and Wiley 1992, Roper and Scarnecchia 2001, Pouilly et al. 2006). Comparis
among streams of similar size in different parts of a river network could provide insight into
how fishes respond to environmental gradients while controlling for many confounding
factors associated with longitudinal changes in channel size and stream discharge.
A variety of characteristics can be used to describe spatial v
munities, including taxonomic diversity, species composition, and functional
organization. The prevalence of certain life history traits can be especially informative, and
may allow for more mechanistic explanations of species distributions in relation to
environmental factors (Poff 1997). These traits may also provide information on how
vulnerable specific species and assemblages may be to environmental change. For example,
migratory species require a specific array of habitats to complete their life cycle and are
particularly vulnerable to changes in hydrologic connectivity in river systems. Diadromous

77
fishes and shrimps, which make obligatory migrations between freshwater and marine
habitats during their life cycle (McDowall 1987), are widely recognized for their ec
significance and increasing imperilment in Caribbean island streams (e.g. Holmquist et al.
1998, Fiévet et al. 2001, March et al. 2003, Greathouse et al. 2006). Diadromous taxa are
also common in ma
ological
ny mainland Mesoamerican streams and face similar threats, but have
enerally received much less research and conservation attention (but see Cruz 1987,
2006, Esselman et al. 2006).
fish
on in
hile
ntext, our objectives were to
doc
r
es, including the headwaters of all major tributaries. The middle
f the watershed lies mostly within the Bribri and Cabécar Indigenous Territories,
nding hills are almost entirely privately owned.
g
Anderson et al.
In this study, we describe patterns in diversity and species composition of stream
assemblages in relation to environmental conditions along an altitudinal gradient spanning
nearly 500 m in the Sixaola River basin, Costa Rica. We chose to work in the Sixaola River
basin because it is one of the least-impacted watersheds of its size in Costa Rica (Sanchez-
Azofeifa et al. 2002), and has no hydroelectric facilities or other engineered barriers to fish
passage. Furthermore, we are not aware of any published studies documenting patterns of
stream fish diversity or assemblage structure in the Bocas biogeographical province of
southeastern Costa Rica and western Panama (Smith and Bermingham 2005). Altitudinal
gradients in fish diversity and species composition are particularly relevant to conservati
the study area because anthropogenic impacts have been concentrated in lowland areas, w
many montane streams are relatively pristine. In this co
ument the altitudinal distribution of stream fishes, particularly the distribution of
diadromous species, and investigate how the structure of stream fish assemblages relates to
local habitat conditions and spatial position within the river network.
Methods
Study Area
The study was conducted in the Costa Rican portion of the Sixaola River basin (9°35' N,
83°00' W), an international river basin spanning the border between Costa Rica and Panama
on the Caribbean slope of the Talamanca mountains (Figure 1). The Sixaola watershed
encompasses an area of approximately 2,780 km², and spans elevations from sea level to ove
3,800 m. Over half of the Costa Rican portion of the Sixaola basin is protected by national
parks or biological reserv
portion o
while the lower Sixaola Valley and surrou

78
along this
vegetation
also
e
ase
asin
ccess is limited or nonexistent in much of the
stud
e of
n
ctrofishing unit (Model B-12, Smith-
ntative sample
of t , and
s made
In this study, we sampled streams from near sea level to an elevation of 500 m, an
altitudinal gradient spanning a distance of over 50 km. Annual precipitation varies
gradient from approximately 2500 mm in the lowlands to over 3000 mm at the highest
elevation sites (WorldClim, Hijmans et al. 2005). The climate in the region is largely
aseasonal, but rainfall tends to peak in November and December, while drier conditions often
persist in February-April, and again in August-September (Coen 1983). Natural
varies along the altitudinal gradient, from tropical moist forest at lowland sites to
premontane wet forest at the highest elevation sites (Holdridge 1967). Natural forest
vegetation has been replaced with pastures and extensive banana and plantain plantations in
much of the lower Sixaola River basin. Land cover in piedmont areas of the Bribri and
Cabécar indigenous territories is a mix of small farms, remnant natural forest, and extensiv
fallows.
Twenty sites on second- and third-order streams were selected for the study and sampled
on one occasion between February-June 2006. Only reference-quality sites representing the
least-disturbed conditions available were selected, and streams were always at or near b
flow when sampling took place. Accessibility was a major constraint, as the Sixaola b
has relatively little infrastructure and road a
y area. Potential study sites were identified from 1:50,000 scale topographic maps
(Instituto Geografico Nacional, Costa Rica) and then scouted in advance of sampling to
investigate current land use patterns in riparian and upland areas. We purposely avoided sites
above waterfalls that would restrict fish passage. At each site, we selected a study reach
twenty times the mean wetted channel width (range 65-130 m) that was representativ
stream habitat conditions for several hundred meters upstream and downstream of the chose
site.
Fish Sampling
Fishes were sampled at all sites using a backpack ele
Root Inc., Vancouver, Washington, USA). The goal was to capture a represe
he fish assemblage at each site, in terms of species presence and relative abundance
our methods reflect time constraints associated with sampling the most remote sites.
Sampling reaches were divided into 3-4 sub-reaches and one very thorough pass wa
through all habitats in each sub-reach. Our preliminary work in high and low elevation

79
streams showed that fish were concentrated in deeper pool and cascade habitats, and so a
second pass was made through all pools, as well as cascade habitats >30 cm in depth. Fish
from all passes at a site were combined for the analyses. Block nets were used to isolat
reaches when deemed necessary. All fishes >20 mm were identified to species in the f
using keys in Bussing (199
e sub-
ield
8), except for fishes of the genera Eleotris and Sicydium. Larger
Sicy
he
ther
g
n
hrimps that occur in coastal rivers of the study region
(Gi f
l
upied
dium individuals (>100 mm) could be identified to species in the field based on
differences in tooth morphology using a hand loupe, and we found that two species, Sicydium
adelum and Sicydium altum, often co-occurred at our sampling sites. However, most
Sicydium individuals were much smaller than 100 mm, and could not be identified. Given t
difficulty of reliably identifying Eleotris and Sicydium individuals, and recognizing the
similar ecology of the species within each genus that occur in the study region (Bussing
1998, Winemiller and Ponwith 1998), these fish were grouped at the genus level in all
analyses.
Fish species were classified as diadromous based on references from Costa Rica or o
parts of their range (Gilbert and Kelso 1971, Loftus et al. 1984, Cruz 1987, 1989, Bussin
1998). For Awaous banana, Eleotris, and Pomadasys crocro, diadromy is assumed based o
several different lines of evidence, especially their presence in tismiches, or mass upstream
migrations of juvenile fishes and s
lbert and Kelso 1971, Nordlie 1981, Winemiller and Ponwith 1998). Evidence o
diadromy in Gobiomorus dormitor is equivocal (Gilmore 1992), but this species was rare in
our collections and assuming diadromy has little effect on our results. We further classified
diadromous species as catadromous or amphidromous (McDowall 1987), but migration
patterns are poorly understood for all of the species collected in this study and these
designations should be considered provisional pending further studies.
Environmental variables
Stream habitat measurements were made at each site in an effort to quantify key factors
potentially influencing the diversity and composition of stream fish assemblages. All channe
geomorphic units in the sampling reach were categorized as pool, riffles, runs, or cascades
based on criteria in Hawkins et al. (1993), and the proportion of the sampling reach occ
by each channel unit type was estimated visually. Ten transects spaced two channel widths
apart were established in the study reaches, and stream depth and substrate size were

80
measured at each transect following methods adapted from Iwata et al. (2003). Stream depth
was measured at five equally-spaced points across the stream channel, and at each depth
sampling point, the dominant substrate in a 25 x 25 cm area surrounding the point was
classified as sand or silt (particle size <2 mm), gravel (2-16 mm), pebble (17-64 m
(65-256 mm), boulder (>256 mm), or bedrock. These substra
m), cobble
tes were then coded as follows:
4, cobble; 5, boulder; and 6, bedrock. The mean and
stan
ints
t
ortance of spatial position within the watershed on
fish
e
d
ce
owed
1, sand or silt; 2, gravel; 3, pebble;
dard deviation of the substrate values were used as indices of substrate coarseness and
variability, respectively, for the sampling reaches (Bain et al. 1985).
Stream canopy cover was estimated visually to the nearest 10% at 5 equally spaced po
in the center of the wetted channel and then averaged for the reach. Channel slope was
determined using a clinometer and measuring staff. Water temperature was measured with a
thermometer in a well-mixed area of the stream channel between 09:30-10:00 hours. Stream
discharge data were not available for any of the sampling sites, and so we used catchmen
area as a proxy for stream size. Catchment boundaries were delineated using a digital
elevation model of the study area with approximately 90 m resolution from the Shuttle Radar
Topography Mission (SRTM; United States Geological Survey 2002). Elevation at the mid-
point of each sampling reach was also determined using the SRTM elevation data. Physical
characteristics of the study sites are summarized in Table 1.
Finally, in order to investigate the imp
assemblage structure, we calculated link magnitude (Shreve 1966) for all the streams in
the Sixaola basin from the same 1:50,000 scale topographic maps used to select sites. Each
study reach was then assigned a downstream link value based on the link magnitude at th
next major tributary downstream. This is a relatively coarse method for estimating watershe
position, but has been shown to adequately represent downstream processes influencing fish
assemblages in tributary streams (Osborne and Wiley 1992). Streams often had a relatively
small tributary immediately downstream, and so the link magnitude at the nearest confluen
with the mainstem Sixaola or one of its five major tributaries (Figure 1) was used.
Downstream distances to a major tributary varied from 0.2-13.4 km among the study sites
and tended to be slightly lower in higher elevation sites because access routes often foll
major tributaries.

81
Data Analysis
Relationships between elevation, environmental variables, and fish assemblage
characteristics were investigated using linear regression analysis in SAS Version 9.1 (SAS
stitute Inc. 2002). Log transformations were used when necessary to meet regression model
ssumptions. Regressions were considered significant at α = 0.05. Fish diversity in the study
expressed as species richness, based on the total number of species observed,
and
In
ted
s
-
s among sites based on fish relative abundance, and all species were retained
in t
e
stre
t the
In
a
reaches was
using Fisher’s alpha diversity index. Fisher’s alpha was used because it is relatively
insensitive to sample size (Magurran 1988), which varied greatly among the study reaches.
order to evaluate how well our sampling methods characterized species richness in each
sampling site, we used the program EcoSim (Gotelli and Entsminger 2005) to calculate
individual-based rarefaction curves, and then inspected the curves to determine whether
sampling produced an asymptote in species richness.
Relationships between fish assemblages and environmental gradients were investiga
by extracting major gradients in fish assemblage structure using ordination and then relating
these gradients to individual environmental variables. Ordination of the sampling sites wa
done using nonmetric multidimensional scaling (NMS) in the program PC-ORD (McCune
and Mefford 1999). The distance matrix for the NMS ordination was constructed using Bray
Curtis distance
he analysis. The final ordination was based on the best configuration from 250 runs with
random starting points. Appropriate dimensionality for the ordination was determined from a
scree plot and significance tests of stress values based on 250 Monte Carlo randomizations.
Pearson correlation coefficients between environmental variables and ordination scores wer
calculated in PC-ORD.
Results
Altitudinal variation in fish assemblages
A total of 6689 fish representing 26 species and 11 families were captured in the study
ams (Table 2). Thirteen of the 26 species belonged to the families Characidae,
Poeciliidae, and Cichlidae. Characids and poeciliids were numerically dominant at all bu
highest elevation sites and accounted for 38% and 30%, respectively, of all fish captured.
Diadromous fishes, including two Sicydium species, accounted for eight of the 26 species and
approximately 25% of all individuals collected in the study streams (Table 2).

82
Significant changes in fish diversity were observed along the altitudinal sampling
gradient, with fish species richness decreasing steeply with increasing elevation (Figure 2a
Species richness rarefaction curves for the sampling sites showed that our sampling effort
failed to produce an asymptote in species richness in more than half of the sites (data not
shown). Most of these sites were at lower elevations, however, and so actual gradients in
species richness may be even m
).
ore pronounced than shown here. Our sampling methods did
not
o
the highest to lowest elevation sites, although there was considerable variation
wit
never
ere
weak (Table 4). Downstream
link
allow us to make exact estimates of fish density, but fish abundance also appeared to
decline markedly along the altitudinal sampling gradient (Table 3). Sample size appeared t
have little influence on the altitudinal diversity gradient we observed, however, as the
relationship between alpha diversity and elevation was nearly identical to the pattern
observed for species richness (Figure 2b).
Changes in fish diversity with elevation were mostly driven by a pattern of species
addition from
hin this general pattern (Table 3). Of the 26 species captured in the study, 25 were found
in at least one of the five lowest elevation sites, and these sites had 12 species that were
observed at higher elevations. Some species replacement was also evident along the
altitudinal gradient, but most species that were absent from the lowest elevation sites w
quickly added with increasing elevation and had broad altitudinal distributions (Table 3). In
one case, we observed species replacement among congeners, with Rhamdia rogersi
replacing Rhamdia guatemalensis at higher elevations.
Relationships between fish assemblage structure and environmental factors
Variation in elevation among sampling sites represented a set of highly correlated
environmental gradients (Table 4), and, and as noted above, explained a large proportion of
the variation in fish diversity. Elevation and downstream link magnitude were also
significantly correlated, but this relationship was surprisingly
magnitude showed a significant positive correlation with alpha diversity (r2 = 0.34, P =
0.007), but was a much poorer predictor of fish diversity than elevation. Catchment area was
not significantly correlated with alpha diversity (r2 = 0.01, P = 0.73), and also did not
significantly improve model fit when added to the regression model predicting alpha
diversity from elevation.
83
Ordination of sampling sites using NMS based on fish relative abundance produced a
two-dimensional solution (Figure 3). Although the sites were selected to represent a
continuous altitudinal gradient, three fairly distinct groups of sites were evident
ordination, reflecting in part the geographic distribution of sampling sites. One group w
composed of the three lowest elevation sites, all of which were located in the lower S
River basin far from the other sampling sites. One of these three sites, TIG2, also sho
in the
as
ixaola
wed
affi All of
ong
her
f the
e total
itive
opy
e first NMS axis showed very similar relationships
wit and
y
nities with the second group, which included 12 sites located at middle elevations.
the sites in the second group had similar fish assemblages despite being distributed am
several different sub-basins in the study area. The third group was made up of five sites
located in the Coen River sub-basin (Figure 3). All of these sites were located at hig
elevations and included the three highest elevation sites in the study. However, two o
sites in this group were located at similar elevations as sites in the second group, but had
quite different fish assemblages.
The two NMS ordination axes together explained 94% of the variation in fish
assemblages among sampling sites. The first ordination axis alone explained 72% of th
variation in fish assemblage structure, and was highly correlated with a number of habitat
variables that co-varied with elevation (Table 4). In particular, Axis 1 showed strong pos
correlations with channel slope, substrate coarseness, the percentage of cascade habitat, and
distance from the ocean, and a weaker positive association with substrate variability. Axis 1
was negatively correlated with the percentage of pool habitat, water temperature, can
cover, and downstream link magnitude (Table 4, Figure 3). Most environmental variables
that were significantly correlated with th
h elevation, but differences were also apparent, especially for substrate variability
water temperature. Interestingly, downstream link magnitude showed a much stronger
correlation with the first NMS axis than with either elevation or fish diversity. The second
ordination axis explained an additional 22% of the variation in fish assemblages, but onl
showed a significant correlation with one environmental variable, average depth (Table 4).
Axis 2 appeared to separate the middle elevation sites, which tended to have shallower
channels and more riffle habitat, from the lowest and highest elevation sites, which were
dominated by pools or cascades, respectively (Figure 3). Catchment area was not
significantly correlated with either of the ordination axes.

84
Distribution of diadromous fishes
Diadromous fishes showed very different patterns of diversity and abundance along the
altitudinal gradient than fish assemblages overall. Although distance from the ocean
increased with elevation, there was no significant relationship between elevation and the
number of diadromous species captured in the sampling sites (r2 = 0.07, P = 0.26). The
num owed no
es
e,
e
romous
y species in the study.
Dis
xa
ber of diadromous individuals captured, standardized by sampling area, also sh
significant relationship with elevation (r2 = 0.04, P = 0.39). Thus, while overall fish speci
richness and density declined sharply from low to high elevation sites, the diversity and
abundance of diadromous species remained relatively constant. As a result, the importance of
diadromous species in fish assemblages increased dramatically along the altitudinal gradient.
When expressed as a percentage of total species richness at each site, diadromous species
richness had a highly significant positive association with elevation (Figure 4a). Likewis
the percentage of individuals in a site with a diadromous life history also increased
significantly with elevation (Figure 4b).
Although diadromous species richness did not vary significantly with elevation, we did
observe changes in the species composition within the diadromous group along the altitudinal
gradient (Table 3). Most of this turnover occurred at low elevations, and appeared to be
related to proximity to the ocean. Distance to the ocean generally increased throughout th
altitudinal gradient, but the three lowest elevation sites were much closer to the ocean than
the rest of the sampling sites (Figure 1). In these sites, Eleotris was the dominant diad
taxon, while Sicydium and Joturus pichardi were completely absent. Outside of the three
lowest elevation sites, Sicydium was abundant and ubiquitous, while J. pichardi occurred at
many sites, always in low abundance. Agonostomus monticola was present in all but one of
the sampling sites and showed the widest altitudinal range of an
tributional patterns of diadromous fishes were not clearly related to the different types of
diadromy represented among the study species. In fact, catadromous and amphidromous ta
were both widely distributed along our sampling gradient (Table 3). In terms of abundance,
catadromous species were rare at all sites, while amphidromous taxa were common in
streams throughout the altitudinal gradient.
85
Discussion
Longitudinal gradients in fish assemblage diversity are well documented in temperate and
tropical river systems (Matthews 1998, Lowe-McConnell 1987). These gradients are often
driven by a pattern of species addition from headwaters to larger streams (Sheldon 1968
Horwitz 1978, Rahel and Hubert 1991, Rodiles-Hernández et al. 1999, Robinson and Rand
2005), although longitudinal zonation and species replacement can also be important (Balon
and Stewart 1983, Petry and Schulz 2006). Many d
,
ifferent factors have been proposed to
exp
ser
am
l
ver,
geo ent
n
cal
of
lain these patterns, including increasing habitat diversity (Gorman and Karr 1978),
decreasing temporal variability (Horwitz 1978), and greater habitat volume, especially the
development of larger pools (Sheldon 1968), in downstream areas. These factors affect a
variety of biotic and abiotic processes in streams, and interact in important ways to influence
the structure and diversity of stream fish assemblages along the river continuum (Schlos
1982, 1987).
Our results, like those of Pouilly et al. (2006), illustrate that environmental factors that
co-vary with elevation can produce similar gradients in fish diversity, independent of stre
size. Gradients in stream habitat from high to low elevation streams were also consistent in
several ways with changes normally observed along a continuum of stream size, including
increases in water temperature and the proportion of pool habitat, and decreases in channe
slope and substrate coarseness. Pouilly et al. (2006) observed similar patterns in streams
along an altitudinal gradient in Bolivia, and concluded that changes in stream habitat and
productivity may both be important in explaining variation in fish assemblage structure.
The high covariance we observed among environmental variables complicates
interpretation of their influence on fish diversity and taxonomic composition. Howe
morphic changes associated with variation in channel slope along the altitudinal gradi
appeared to be especially important. In particular, we found large differences among sites i
the amount of pool habitat, with the prevalence of pools increasing considerably from the
highest to lowest elevation sites (Table 1). Pool development is hypothesized to be of criti
importance in structuring stream fish assemblages in small temperate streams through its
influence on biotic interactions, temporal variability, and habitat heterogeneity (Schlosser
1987). Although seasonal dynamics are very different in tropical streams, the availability

86
deeper pool habitats has similarly important effects on predation, competition and population
dynamics (e.g. Power 1984).
us
nd
t with decreasing
ee any consistent trends in the mean depth of the study reaches.
Ave
des, both of which had much higher water velocities and coarser
n low elevation pools. Many fishes in the region appear to have affinities for
imp
tch patterns expected
dec remes in our
tho
ana ariation
mo
env tream shading on fish
The vast majority of fish captured in our study sites were associated with pool habitats.
However, several small fish species appeared to select against deep pool habitats. Rivul
isthmensis, in particular, was nearly always found in riffles or in shallow pools isolated from
the main channel. Biotic interactions have been shown to have a significant influence on the
distribution and abundance of another Rivulus species in Trinidad (Gilliam et al. 1993), a
may be an important factor in habitat selection for many of the fish species in our study
streams.
Interestingly, although we observed a significant increase in pool habita
elevation, we did not s
raging over the entire reach may have obscured the influence of deeper pool habitats, but
maximum depths recorded in the study reaches also varied little among high and low
elevation sites. Nevertheless, there were clear differences in habitat conditions in the deepest
channel units along the altitudinal gradient. Low elevation pools were generally long, with
very little current at base flow conditions and substrates dominated by fine organic and
inorganic material. At higher elevations, the deepest habitats occurred either in relatively
short pools or within casca
substrates tha
specific water velocities (Bussing and Lopez 1976), and so flow conditions may be as
ortant as water depth in determining habitat suitability.
The altitudinal gradient in stream canopy cover also failed to ma
along a river continuum. In fact, we found a significant increase in stream canopy cover with
reasing elevation, a pattern heavily influenced by sites at the elevational ext
study (Table 1). Longitudinal variation in canopy cover from headwaters to larger streams is
ught to play a critical role in structuring stream communities through its influence on
basal food resource availability (Vannote et al. 1980). Although we did not observe
logous patterns along our altitudinal sampling gradient, there was considerable v
in stream canopy cover among sites that was influenced by stream size and channel
rphology. High correlations between stream canopy cover and several other
ironmental factors made it difficult to isolate the effects of s

87
assemblages. However, the potential for canopy cover to regulate instream primary
duction and fish assemblage trophic structure deserves further study.
Although local stream habitat conditions strongly affect
pro
the diversity and species
imp sses (Gorman 1986, Osborne and
con dients, making it difficult to determine the relative
site ants
in t able mainstem habitats, but also had very different habitat
ma . However, we also found that
div
stro s, but does not mean that colonization
dow t
in fish assemblage structure (Table 4).
ext
rain
dur re flood
ene
gra bance on stream biota is likely to
about
the tudy area,
wh portance of extinction and immigration
r
stu l scales will be needed to determine how
composition of fish assemblages, spatial position within a watershed can also have an
ortant influence through its effect on colonization proce
Wiley 1992, Roper and Scarnecchia 2001). Unfortunately, spatial factors are often
founded by major habitat gra
importance of colonization dynamics versus local habitat suitability. In our study streams,
s at higher elevations were increasingly distant from potential source pools of immigr
he largest, most temporally st
conditions than lowland streams. Not surprisingly, we found that the downstream link
gnitude of our study sites was correlated with elevation
elevation and several co-varying habitat variables were much stronger predictors of fish
ersity than downstream link magnitude. This suggests that local habitat conditions have a
nger influence on fish diversity in the study stream
processes are unimportant. In fact, despite having a weak correlation with elevation,
nstream linkage magnitude showed a relatively strong correlation with the main gradien
Variation in valley morphology among the study streams supports the idea that
inction-colonization dynamics differ along the altitudinal sampling gradient. Heavy
fall in the study region produces frequent floods with highly stochastic timing. Lowland
streams typically had wide, unconstrained valleys where stream energy could dissipate
ing these floods. In contrast, montane sites typically had very narrow valleys whe
rgy was concentrated in the stream channel. When combined with the high channel
dient in montane streams, the magnitude of flood distur
be much greater in these sites than in lowland streams. However, very little is known
home range size or dispersal abilities of any the freshwater fish species in our s
ich would also influence interpretations on the im
in the study streams. By necessity, we captured a snapshot of fish assemblage structure in ou
dy sites, but long-term studies over larger spatia

88
local disturbance and larger-scale colonization dynamics influence diversity and species
position in these streams. com
dia
Riv e very different patterns of abundance and
their
rela is pattern is very different from
dom dromous species at all elevations (Fièvet et al. 2001, Greathouse et al.
his ers to
fish have
a st f diadromous fishes, and highlight the
fres
hav f
ean
slo ar
inla cies adapted to high gradient montane streams (Bussing and
sity
in t
Fir rse, both physically and biologically, with major
of a ient will thus require protection of a
neo
(M rotected areas in the Sixaola River basin
illustrates the difficulties of building representative reserve networks for stream fishes. While
Understanding the consequences of fish movement is especially important for
dromous species, which make up a substantial portion of the fish fauna in the Sixaola
er basin. Diadromous taxa appear to hav
diversity than non-diadromous fishes in this system, resulting in significant changes in
tive abundance along our altitudinal sampling gradient. Th
Caribbean island streams, which generally have depauperate freshwater fish assemblages
inated by dia
2006). In these systems, the distribution of diadromous species is influenced by their life
tory requirements, biotic interactions with other diadromous taxa, and physical barri
migration (Greathouse et al. 2006), but not by interactions with a relatively rich freshwater
fauna, as in mainland Mesoamerican streams. These biotic interactions are likely to
rong influence on the distribution and abundance o
importance of differential abilities among diadromous taxa to penetrate higher-elevation
hwater environments (McDowall 1998). In streams of the Sixaola basin, these factors
e produced a somewhat counterintuitive altitudinal gradient in the prominence o
diadromous species. However, the pattern we observed is likely common on the Caribb
pe of Mesoamerica, where diadromous mugilid and gobiid fishes are able to penetrate f
nd and are among the few spe
López 1977, Cruz 1987, Bussing 1998, Esselman et al. 2006).
Our findings have several important implications for conservation of stream fish diver
he Sixaola River basin, and more broadly in Caribbean slope streams of Mesoamerica.
st, small streams in the region are dive
altitudinal gradients in stream fish diversity and species composition. Effective conservation
ll stream fish species and assemblages along this grad
representative array of streams and their associated watersheds. Recent studies from other
tropical regions have also found high spatial heterogeneity in fish assemblages among
small streams (Gerhard et al. 2004), and discussed the implications for reserve design
endonça et al. 2005). The current distribution of p

89
over half of the Costa Rican portion of the Sixaola watershed is currently protected by
national parks or reserves, existing protected areas are concentrated in high elevation areas.
wh
presenting further challenges when diadromous taxa are considered (Pringle 2001). Although
hum r more
bor International Park, the largest protected area in the region, but we did
e
to t mous fishes made up
fically
targ
Ken
dia s taxa in the region, it appears that all of these species must migrate to the ocean to
stre grity
ups 97), including streams within protected areas (Pringle 2001).
consequences for the study streams, as the grazing activities of these species likely have a
pling
me ated the abundance of Sicydium gobies because of their strong
and we commonly observed feeding scars associated with their grazing activities. Although
sub
Cas
the
There is virtually no formal protection of lowland streams and their associated watersheds,
ich support the most diverse fish assemblages.
Similar situations are encountered elsewhere in Costa Rica and are common worldwide,
montane streams in the Sixaola basin are protected by national park status and a lack of
an infrastructure, movements by diadromous fishes connect these areas with othe
heavily impacted parts of the landscape. Most of our sites were located well below the
ders of La Amistad
have one site located within a small lower elevation extension of the park, and another clos
he boundary of the main body of the park. In these sites, diadro
approximately 42% and 98%, respectively, of all fishes captured. Although not speci
eted in this study, diadromous shrimps of the families Palaemonidae and Atyidae were
also common in all study streams up to the highest elevation sites (C.M. Lorion and B.P.
nedy, unpublished data). Despite the general lack of knowledge about life histories of
dromou
complete their life cycle. As a result, downstream alterations in hydrologic connectivity,
am habitat, and water quality are likely to have a significant influence on biotic inte
tream (Pringle 19
Declines in the herbivores Sicydium and J. pichardi could have especially important
significant influence on nutrient cycling and other stream ecosystem processes. Our sam
thods likely underestim
benthic orientation. Nevertheless, they were among the most abundant fishes in our samples
J. pichardi was not as common, it has traditionally been the most important species for
sistence fishing by indigenous communities in the Sixaola River basin (Borge and
tillo 1997).
In summary, we observed strong gradients in diversity and considerable heterogeneity in
species composition of stream fish assemblages along an altitudinal gradient in the

90
Sixaola River basin. Altitudinal variation in fish assemblage structure appeared to be strongly
ted to stream habitat gradients, but spatial relationships between streams and sources
onists may also
rela of
col be important. Finally, diadromous species were common in all sites,
reg
num lowing (Anderson et al. 2006).
ided by NSF-IGERT grant no. 0114304. We thank the
y
Jos López provided
ind onduct research on their lands.
per
Re
Anderson, E. P., C. M. Pringle, and M. Rojas. 2006. Transforming tropical rivers: an
An
An s
inia landscapes: prerequisite for conservation. Ecological Applications 9:335-349.
at
Bal blages in a river with unusual gradient
her
Ber 998. Comparative mtDNA phylogeography of
highlighting the critical importance of maintaining hydrologic connectivity and natural flow
imes in Mesoamerican streams (Esselman et al. 2006), especially in the decreasing
ber of river systems that remain free-f
Acknowledgements
Funding for this research was prov
many Bribri and Cabécar guides and field assistants who made this work possible, especiall
elito Sánchez and Juradir Villanueva. Julia Young-Lorion and José Maria
invaluable assistance in the field, as well. We are also grateful to the private landowners and
igenous community leaders who granted us permission to c
The Costa Rican Ministry of Environment and Energy (MINAE) kindly provided research
mits for this work.
ferences
environmental perspective on hydropower development in Costa Rica. Aquatic
Conservation: Marine and Freshwater Ecosystems 16:679-693.
germeier, P. L., and J. R. Karr. 1983. Fish communities along environmental gradients in
a system of tropical streams. Environmental Biology of Fishes 9:117-135.
germeier, P. L., and M. R. Winston. 1999. Characterizing fish community diversity acros
Virg
Bain, M. B., J. T. Finn, and H. E. Booke. 1985. Quantifying stream substrate for habit
analysis studies. North American Journal of Fisheries Management 5:499-506.
on, E. K., and D. J. Stewart. 1983. Fish assem
(Luongo, Africa – Zaire system), reflections on river zonation, and description of anot
new species. Environmental Biology of Fishes 9:225-252.
mingham, E., and A. P. Martin. 1
neotropical freshwater fishes: testing shared history to infer the evolutionary landscape of
lower Central America. Molecular Ecology 7:499-517.

91
Bussing, W Universidad de Costa
Bussing, W
A.
and
dos en
latano, Honduras. Revista de Biología
Esselm
ined regions and across a longitudinal gradient in the Monkey
Fièvet, E., T pacts of
assemblages? Archiv für Hydrobiologie 151:405-425.
der. 2004. Stream fish communities and their
associations to habitat variables in a rain forest reserve in southeastern Brazil.
Environmental Biology of Fishes 71:321-340.
Gilbert, C. R., and D. P. Kelso. 1971. Fishes of the Tortuguero area, Caribbean Costa Rica.
Bulletin of the Florida State Museum 16:1-54.
Gilliam, J. F., D. F. Fraser, and M. Alkins-Koo. 1993. Structure of a tropical fish community:
a role for biotic interactions. Ecology 74:1856-1870.
Borge, C., and R. Castillo. 1997. Cultura y conservación en la Talamanca indígena. Editorial
Universidad Estatal a Distancia, San José, Costa Rica.
. A. 1998. Freshwater fishes of Costa Rica. Editorial de la
Rica, San José, Costa Rica.
. A., and M. I. López. 1977. Distribución y aspectos ecológicos de los peces de
las cuencas hidrográficas de Arenal, Bebedero y Tempisque, Costa Rica. Revista de
Biología Tropical 25:13-37.
Coen, E. 1983. Climate. Pages 35-46 in D. H. Janzen, editor. Costa Rican natural history.
University of Chicago Press, Chicago, Illinois, US
Cruz, G. A. 1987. Reproductive biology and feeding habits of Cuyamel, Joturus pichardi
Tepemechín, Agonostomus monticola (Pisces: Mugilidae) from Rio Platano, Mosquitia,
Honduras. Bulletin of Marine Science 40:63-72.
Cruz, G. A. 1989. Joturus pichardi (Pisces: Mugilidae) sexualmente maduros captura
Laguna de Brus y en la desembocadura del Río P
Tropical 37:107-108.
an, P. C., M. C. Freeman, and C. M. Pringle. 2006. Fish-assemblage variation
between geologically def
River Basin, Belize. Journal of the North American Benthological Society 25:142-156.
ito de Morais, L., Tito de Morais, A., Monti, D., and H. Tachet. 2001. Im
an irrigation and hydroelectric scheme in a stream with a high rate of diadromy
(Guadeloupe, Lesser Antilles): can downstream alterations affect upstream faunal
Gerhard, P., R. Moraes, and S. Molan
92
Gilmore, R. G. 1992. Bigmouth sleeper, Gobiomorus dormitor. Pages 105-111 in C. R.
Gilbert, editor. Rare and endangered biota of Florida, Volume 2: fishes. University Press
of Flor ai
Gorman, O. T. 1986. Assemblage organization of stream fishes: the effect of rivers on
adventitious streams. American Naturalist 128:611-616.
Gorman, O n Ecology
59:507
Gotelli, N. J., and G. L. Entsminger. 2005. Ecosim: Null Models Software for Ecology,
Versio . Acquired Intelligence Inc. and Kesey-Bear, Jericho, Vermont, USA.
Greathouse, E. A., C. M. Pringle, and J. G. Holmquist. 2006. Conservation and management
migratory fauna: dams in tropical streams of Puerto Rico. Aquatic Conservation:
rine reshwater Ecosystems 16:695-712.
Hawkins, C. P., J. L. Kershner, P. A. Bisson, M. gory, D.
McCullough, C. K. Overton, G. H. Reeves, R. J. Steedman, and M. K. Young. 1993. A
rarchi pproach to classifying stream habitat features. Fisheries 18:3-12.
Hi R .
olutio lated climate surfaces for global land areas. International Journal of
matology 25:1965-1978.
Holdridge, L. R. 1967. Life zone ecology. Tropi Rica.
Ho idt-Gengenbach, and B. B. Yoshioka. 1998. High dams and
rine-freshwater linkages: effects on native and introduced fauna in the Caribbean.
nse B
Horwitz, R. J. 1978. Temporal variability patter
es. Ecological Monographs 48:307-321.
Iwata, T., S. Nakano, and M. Inoue. 2003. Impacts of past riparian deforestation on stream
m i 73.
Loftus, W A. Kushlan, and S. A. Voorhees. 1984. Status of the mountain mullet in
lorida. Florida Scientist 47:256-263.
Lo l,
iversity Press, Cambridge, UK.
ida, G nesville, Florida, USA.
. T
-51
., a
5.
d J. R. Karr. 1978. Habitat structure and stream fish communities.
n 7.72
of
Ma
A.
hie
jma
res
Cli
lmquist, J. G., J. M. Schm
ma
Co
fish
com
sou
we-
Un
and F
D. Bryant, L. M. Decker, S. V. Gre
cal a
., S
n interpo
ns, . J E. Cameron, J. L. Parra, P. G. Jones, and A. Jarvis. 2005. Very high
cal Science Center, San José, Costa
rvation iology 12:621-630.
ns and the distributional patterns of stream
uni
. F
ties
., J.
n a tropical rainforest in Borneo. Ecological Applications 13:461-4
thern F
CoMc nnel R. H. 1987. Ecological studies in tropical fish communities. Cambridge

93
M n. A. E. 1988 ical diversity and its me
March, J. G., J. P. Benstead, C. M. Pringle, and F. N. Scatena. 2003. Damming tropical
island streams: pro
Matthews, W. J. 1998 Patterns in freshwater fish ecology. Chapman & Hall, New York,
.
McCune, B., and M. J. M RD. Multivariate analys ata,
Version 5.0. MjM den Beach, Oregon, USA.
McDowall, R. M. 1987. Evolution and importance of diadromy: the occurrence and
distribution of diadromy among fishes. American Fisheries Socie Symposium 1:1-13.
McDowall, R. M. 199 wnstream-upstream
diadromous fish fa New Zealand rivers. Freshwater Biology 40:111-
122.
Mendonça, F. P., W. Magnusson, and J. Zuanon. 2005. Relationsh s between habitat
s of central Amazonia. Copeia
-764.
Miller, R. R. 1966. G graphical distribution of Central American freshwater fishes. Copeia
1966:773-802.
Myers, G. S. 1966. D
1966:766-773.
N G. 1981. F biology of eleotrid fishes in a tropical estuary.
Journal of Fish Biology 18:97-110.
Osborne, L. L., and M. J. W Influence of tributary spatial position on the structure
of warmwater fish nal of Fisheries an Aquatic Sciences
49:671-681.
P , and U. H 6. Longitudinal changes and indicator species of the fish
fauna in the subtro
Lyons, J. and D. W. Schneider. 1990. Factors influencing fish distribution and community
structure in a smal coastal river in southwestern C sta Rica. Hydrobiologia 203:1-14. l o
agurra . Ecolog asurement. Princeton University Press,
Princeton, New Jersey, USA.
blems, solutions, and alternatives. BioScience 53:1069-1078.
.
New York, USA
efford. 1999. PC-O is of ecological d
Software, Glene
ty
8. Fighting the flow: do linkages in the ecology of
unas in West Coast
E. ip
characteristics and fish assemblages in small stream
2005:751
eo
erivation of the freshwater fish fauna of Central America. Copeia
ordlie, F. eeding and reproductive
iley. 1992.
communities. Canadian Jour d
etry, A. C. . Schulz. 200
pical Sinos River, Brazil. Journal of Fish Biology 69:272-290.

94
Pof
Pou
f, N. L. . Landscape filters and species traits: towards mechanistic understanding and
predictions in stream ecology. Journal of the North American Benthological Society
16:391-409.
ill M ture of
fish assem
Journal of Fish Biology 68:137-156.
er, M. E. 1984. Depth distributions of armored catfish: predator-induced resource
avoidance? Ecology 65:523-528.
gle, C. t
flow. Journal of the North American Benthological Society 16:425-438.
gle, . 2001. Hydrologic connectivity and the management of biological reserves: a
spective. Ecological Applications 11:981-998.
nd F. N. Scatena. 1999. Aquatic ecosystem
t a
s erican experience. Oxford University Press, New York e
rk, USA.
J W. A. Hubert. 1991. Fish assemblages and habitat gradients in a R
unta
nge
on, and P. S. Rand. 2005. Discontinuity in fish assemblages across an elevation
dient in a southern Appalachian watershed, USA. Ecology of Freshwater Fish 14
s-He
ersity an position of the fish community of the Lacanja River, Chiapas e
rnal of Freshwater Ecology 14:455-468.
. B and D. L. Scarnecchia. 2001. Patterns of diversity, density, and biom
othermic vertebrates in ten small streams along a North A rican river cont u
rthwest S c 68-175.
z-Azo . T e .
ources
sources
1997
y, ., S. Barrera, and C. Rosales. 2006. Changes in taxonomic and trophic struc
blages along an environmental gradient in the Upper Beni watershed (Bolivia).
Pow
Prin
Prin
glo
Pringl
and
eco
Yo
Rahel
Mo
cha
Robins
gra
23
Rodile
div
Jou
Roper
ect
No
Sanche
res
Re
M. 1997. Exploring how disturbance is transmitted upstream: going agains the
ged
w
:14
xic
f
m.
Wa
ate
C. M
al p
C.
he
yste
b er
e, M., a deterioration in Latin America
Caribbean. Pages 104-113 in L. U. Hatch and M. E. Swisher, editors. Man
ms: the Mesoam , N
, F. ., and ocky
in-Great Plains stream: biotic zonation and additive patterns of community
. Transactions of the American Fisheries Society 120:319-332.
J. L.,
-
o.
ter
r
.
rnández, R. E., E. Díaz-Pardo, and J. Lyons. 1999. Patterns in the species
d com , M
, B ., ass o
me
e C
act
inu
02
s. W
cien
a,
re
eve
e 7
A
on
pm
5:1
., R
al
en
feif
and
D
G.
gi
lo
C.
d c
8:4
Ha
ov
09
rri
er
-4
ss,
ch
24
A
an
.
. L
ge
. S
in
tor
Co
rie
sta
r, a
R
nd
ica
. d
p
am
s a
in
nd
o-B
ec
ck.
om
20
iclan
t 1
: im on
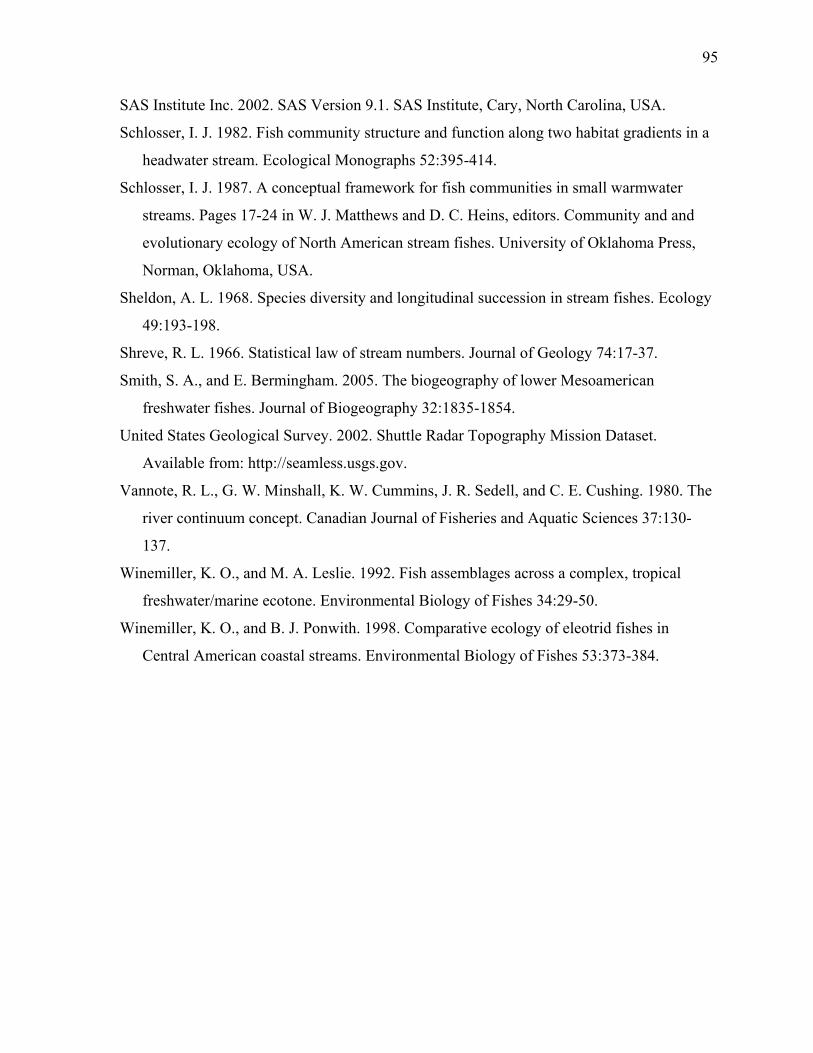
95
SAS Institute Inc. 2002. SAS Version 9.1. SAS Institute, Cary, North Carolina, USA.
in a
headwater stream. Ecological
S hlosser, I. J. 1987. A conceptual for f ies i
D. C. Heins, editors. Community and and
ecology of North Am stream fishes. University of Oklahoma Press,
klahoma, USA.
Sheldon, A. L. 1968. Species diversity and longitudinal succession in stre hes. Ecology
S 6. Statistical law of numbers. Journal of Geology 74:17-37.
S . Bermingham. 20 biogeogr f lower Mes ican
Journal of Biogeography 32:1835-1854.
United States Geological Survey. 2002. Shuttle Radar Topography Missi aset.
://seamless.usgs.gov.
, K. W mins, J. R. Sedell, and C. E. Cushing. 1980. The
inemiller, K. O., and M. A. Leslie. 1992. Fish assemblages across a complex, tropical
freshwater/marine ecotone. Environmental Biology of Fishes 34:29-50.
inemiller, K. O., and B. J. Ponwith. 1998. Comparative ecology of eleotrid fishes in
Central American coastal streams. Environmental Biology of Fishes 53:373-384.
Schlosser, I. J. 1982. Fish community structure and function along two habitat gradients
Monographs 52:395-414.
c framework ish communit n small warmwater
streams. Pages 17-24 in W. J. Matthews and
evolutionary erican
Norman, O
am fis
49:193-198.
hreve, R. L. 196 stream
mith, S. A., and E 05. The aphy o oamer
freshwater fishes.
on Dat
Available from: http
Vannote, R. L., G. W. Minshall . Cum
river continuum concept. Canadian Journal of Fisheries and Aquatic Sciences 37:130-
137.
W
W
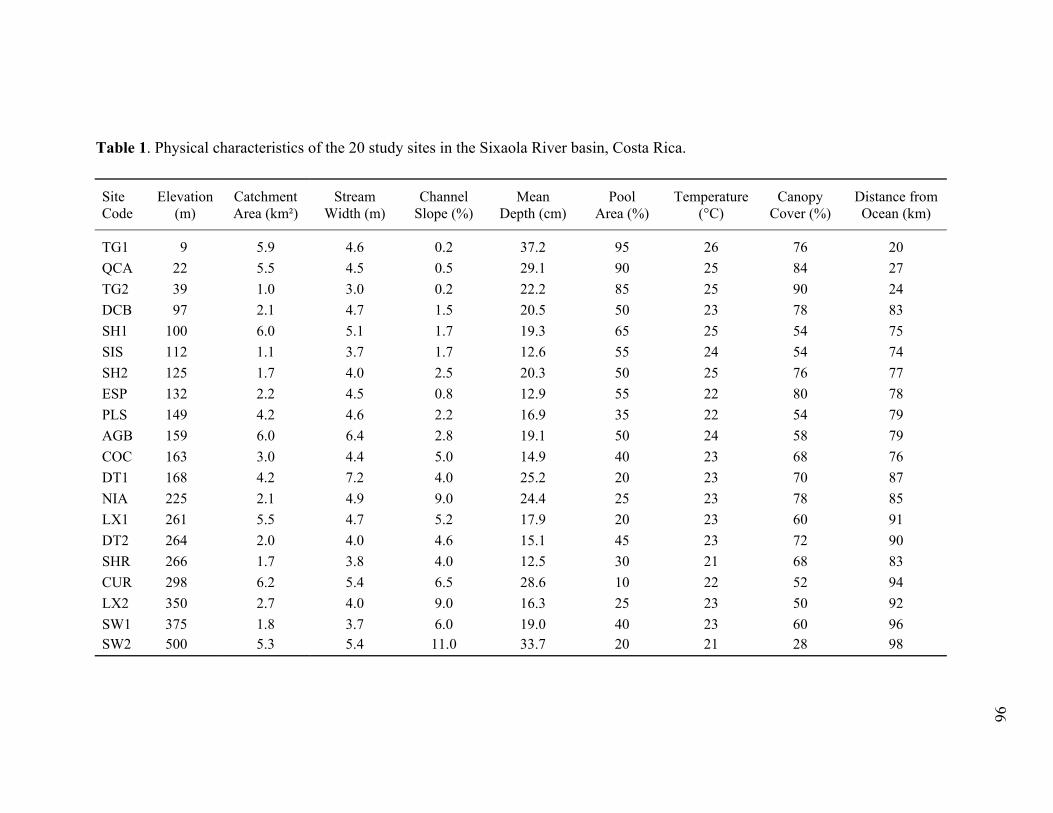
96
. Physical characteristics of the 20 study sites in the Sixaola River basin, Costa Rica.
Elevation Catchment Stream Channel Mean Pool Temperature Canopy Distance from
able 1
Site Code (m) Area (km²) Width (m) Slope (%) Depth (cm) Area (%) (°C) Cover (%) Ocean (km)
TG1 9 5.9 4.6 0.2 37.2 95 26 76 20 QCA 22 5.5 4.5 0.5 29.1 90 25 84 27 TG2 39 1.0 3.0 0.2 22.2 85 25 90 24 DCB 97 2.1 4.7 1.5 20.5 50 23 78 83 SH1 100 6.0 5.1 1.7 19.3 65 25 54 75 SIS 112 1.1 3.7 1.7 12.6 55 24 54 74 SH2 125 1.7 4.0 2.5 20.3 50 25 76 77 ESP 132 2.2 4.5 0.8 12.9 55 22 80 78 PLS 149 4.2 4.6 2.2 16.9 35 22 54 79 AGB 159 6.0 6.4 2.8 19.1 50 24 58 79 COC 163 3.0 4.4 5.0 14.9 40 23 68 76 DT1 168 4.2 7.2 4.0 25.2 20 23 70 87 NIA 225 2.1 4.9 9.0 24.4 25 23 78 85 LX1 261 5.5 4.7 5.2 17.9 20 23 60 91 DT2 264 2.0 4.0 4.6 15.1 45 23 72 90 SHR 266 1.7 3.8 4.0 12.5 30 21 68 83 CUR 298 6.2 5.4 6.5 28.6 10 22 52 94 LX2 350 2.7 4.0 9.0 16.3 25 23 50 92 SW1 375 1.8 3.7 6.0 19.0 40 23 60 96 SW2 500 5.3 5.4 11.0 33.7 20 21 28 98
T

97
Table 2. List of fish species captured in the 20 study sites in the Sixaola River basin, with the total number of individuals of each species captured across all sites. Family Species Number of Individuals
Characidae Astyanax aeneus 266 Astyanax orthodus 294 Bryconamericus scleroparius 1980 Hyphessobrycon panamensis 14 Rhamphichthyidae Hypopomus occidentalis 67 Pimelodidae Rhamdia guatemalensis 56 Rhamdia rogersi 79 Rivulidae Rivulus isthmensis 16 Poeciliidae Alfaro cultratus 368 Brachyraphis parismina 13 Phallichthys amates 220 Poecilia gillii 638 Priapichthys annectens 790 Synbranchidae Synbranchus marmoratus 5
140 Archocentrus myrnae 58 Archocentrus nigrofasciatus 32 Parachromis loisellei 4 Mugilidae Agonostomus monticola* 506 Joturus pichardi* 28 Gobiidae Awaous banana* 13 Sicydium adelum* Sicydium altum* 992a Eleotridae Eleotris sp.* 106 Gobiomorus dormitor* 3
Haemulidae Pomadasys crocro* 1 Cichlidae Astatheros bussingi
* diadromous species a total number of individuals of both Sicydium species captured

98
e fish long an nal sampling gradient in the Sixaola River basin, with sites arranged in i ecie anged b general altitudinal distribution.
Site code and elevation (m)
abl 3. Distribution of streamncreasing elevation and fish sp
es as arr
altitudy their
i order of
TG1 QCA TG2 DC SIS SH2 ESP PLS AGB COC DT1 NIA LX1 DT2 SHR CUR LX2 SW1B SH1 SW2 Species 9 22 Brachyraphis parismina x
39 112 125 132 149 159 163 168 225 261 264 266 298 350 375
97
100
500
Pomadasys crocro c x Hyphessobrycon panamensis x Parachromis loisellei x Eleotris sp.
x x x x x x x x x x x x x x x x x
x x x
x x x
x x
9
x x x x x x x x x x x x x
0.7
x x x x
x x x x x x x
x x x x x x x x x x x x x x x
x x x x x x x x x x x x x x x x x x x x x x x
x x x x x x x x x x x x x x x x x x x x x x x x x x x x x x x x x x
x x x x x x x x x x x x x x x x x x x x
x x x x x x x x x x . 2.2 0. 2.0 1.2 0.6 0.5 0.7 1.4 0.5 0.4 0.2 0.7 0.9 0.3 0.2 0.6
x x x x
0.2
a x xAstyanax aeneus x xAlfaro cultratus x xPhallichthys amates x xArchocentrus nigrofasciatus x xSynbranchus marmoratus xAstyanax orthodus x xGobiomorus dormitor c x Awaous banana a x xRivulus isthmensis x Rhamdia guatemalensis x xHypopomus occidentalis x x Poecilia gillii x x Astatheros bussingi x x Bryconamericus scleroparius x x Agonostomus monticola a x x Priapichthys annectens x Archocentrus myrnae Sicydium sp. a Joturus pichardi c Rhamdia rogersi Total Fish Density (ind./m²) 1 7 1.7
N ecies samp indicated by an ‘x’. Diadromous species are in bold. a amphidr pecie catadromous species
ling site is otes: Presence of each sp in aomous s s; c
T

99
Table 4. Pearson correlation coefficients of linear relationships between environmental variables and elevation, and the two NMS axes (n = 20 for all variables). Elevation NMS Axis 1 NMS Axis 2 r r r Catchment Area 0.01 0.08 -0.44 Channel Slope 0.90 0.81 -0.43 Mean Depth -0.02 -0.22 -0.66 Depth CV -0.18 -0.16 0.41 Substrate Coarseness 0.89* 0.85 0.25 Substrate SD 0.27 0.52 0.39 % Pool Habitat -0.78 -0.88 0.08 % Riffle Habitat -0.15 0.06 0.44
0.82 0.79 -0.34 rature -0.77 -0.61 0.04
Ca
% Cascade Habitat Water Tempe
nopy Cover -0.70 -0.75 0.38 Distance from Ocean 0.94* 0.90 0.05 Downstream Link Magnitude -0.48 -0.79 0.38
Notes: Correlation coefficients in bold are significant at P < 0.05. Asterisks indicate linear relationships based on log10(elevation).

100
Figure 1. Map of the study area in southeastern Costa Rica, with locations of the 20 sampling sites in the Sixaola River basin.

101
Figure 2. Plots of a) fish species richness and b) Fishstudy sites (P < 0.001 for both regression relationship
er’s alpha versus elevation in the 20 s).

102
Figure 3. NMS ordination of the 20 sampling sites based on relative abundance of all fish species (final stress = 8.691). Environmental variables that were significantly correlated withNMS axes are shown, with arrows indicating the direction of increasing values for
the
variables listed (see Table 4 for correlation coefficients).
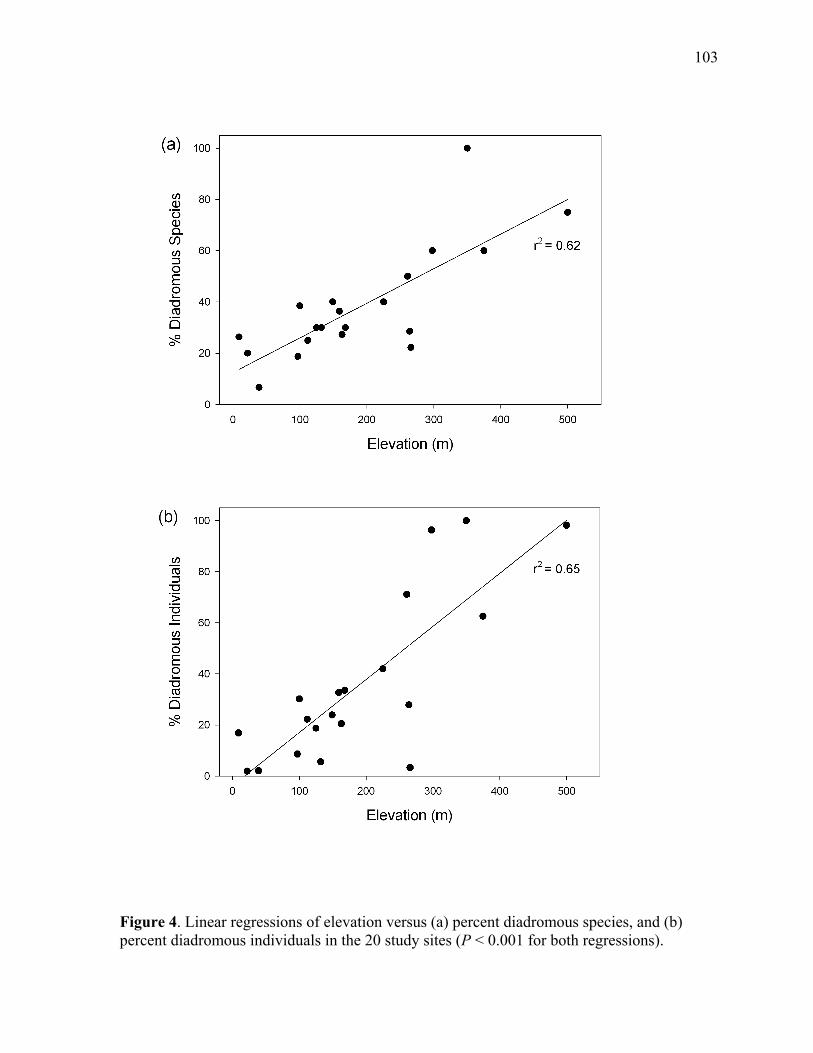
103
Figure 4. Linear regressions of elevation versus (a) percent diadromous species, and (b) percent diadromous individuals in the 20 study sites (P < 0.001 for both regressions).

104
Chapter 4: Comprehensive conservation planning: developing a framework fo
planning across terrestrial, freshwater and marine ecosystems.
Abstract
Systematic conservation planning methods are widely used to identify conservation
priority areas, and for a variety of reasons have traditionally considered terrestrial,
freshwater, and marine ecosystems separately. Many physical and ecological processes link
these ecosystems, however, affecting biodiversity in all three realms. These interactions
suggest that an integrated planning approach could more effectively conserve biodiversi
Comprehensive conservation planning for terrestrial and aquatic ecosystems poses significant
challenges, and a critical evaluation of available methods is currently lacking. Here we
discuss the goals of comprehensive conservation planning in general and in the specif
r
ty.
ic
con
ll
several
eed to develop new comprehensive
plan
text of a planning domain on the Caribbean slope of Costa Rica and Panama, and then
review strategies currently being used to develop conservation plans for multiple realms. A
of the methods we review can be used to improve integration of planning efforts for
terrestrial and aquatic systems, but there is a trade-off between ease of application and the
consideration of ecological linkages among realms in the planning process. Although
of the methods we review would be applicable to comprehensive planning in our study site,
models needed to incorporate biophysical interactions among realms into conservation
planning algorithms remain poorly developed. Given the limited capacity for expanding
protected area networks in most regions, and the way that matrix lands affect existing
protected areas in multiple realms, there is a great n
ning tools that can direct a broader array of conservation interventions.
Introduction
The loss of biodiversity is among the greatest challenges currently facing humanity
(Pimm et al 1995, Dirzo and Raven 2003). Species and even entire ecosystems are going
extinct at a rate far greater than ever before, in what has been referred to as the 6th extinction
crisis (Pimm and Brooks 2000). The biodiversity crisis appears to be particularly severe in
freshwater ecosystems (Abell 2002, Malmqvist and Rundle 2002), where rates of extinction
and endangerment may be even higher than in terrestrial environments (Ricciardi and
Rasmussen 1999, Revenga et al. 2005).

105
In response, there has been increased attention given to gaps in the current global
protected areas network (Rodrigues et al. 2004a), as well as calls for improving conservation
on private lands outside of reserves (O’Connell and Noss 1992, Knight 1999). There is
continued debate about how much of the planet should be protected (Brooks 2004, Tear et al.
2004), and whether efforts should focus on species (Brooks et al. 2004), ecosystems (Higgins
et al. 2004), or ecosystem function (Moss 2000). Nevertheless, the establishment of
representative network of protected areas which covers all biomes and species is a widely
recognized target scientifically (Brooks 2004, Rod
a
rigues et al. 2004a, Rodrigues et al. 2004b)
y 1992).
s
.
f
t
lanning
g for
n of
ties
ds
governmental agencies or non-governmental organizations
are
and politically (Convention on Biological Diversit
Systematic conservation planning methods have been developed during the last 20 year
in response to the need to move beyond ad-hoc reserve selection and to set measurable
targets, strategies and goals for the design of protected areas (Margules and Pressey 2000)
These methods are used to identify potential reserve networks that represent the full range o
species and ecosystems in a given planning area and are spatially efficient, recognizing the
scarcity of resources available for conservation and the need to balance conservation goals
with other societal values (Sarkar et al. 2006). Systematic conservation planning methods are
now widely used to identify conservation priority areas in both terrestrial and marine
systems. Applications in freshwater environments are less common (Sarkar et al. 2006), bu
several recent examples illustrate how these methods can be adapted to freshwater p
(Abellán et al. 2005, Linke et al. 2007).
For a variety of institutional and logistical reasons, systematic conservation plannin
terrestrial, freshwater, and marine realms has usually been conducted separately (Beger et al.
In Press). Conservation planning is an inherently complex process and even in the most
thoroughly studied areas in the world there is high uncertainty concerning the distributio
biodiversity (Margules et al. 2002) and threats to its persistence (Gaston et al. 2002). For
aquatic ecosystems, even the most basic information needed to assess conservation priori
may be scarce (Abell 2002). Planning in different realms requires expertise in different fiel
of research, and entirely different
often involved in management and conservation of the different ecosystems (Beger et al.
In Press). Biogeographical patterns, ecological processes, and the relative importance of
different threats to biodiversity also differ among terrestrial, freshwater, and marine
106
ecosystems. As a result, conservation planning in different realms may involve very differ
considerations (Carr et al. 2003 Dunn 2003, Abell et al. 2007) and methods (Higgins et al.
2005). Together these factors constitute a considerable barrier to development of
comprehensive planning approaches for terrestrial and aquatic ecosystems.
Despite these challenges, there is a growing recognition of the limitations of a fragment
approach to conse
ent
ed
rvation planning (Beger et al. In Press). Freshwater, marine, and terrestrial
eco
ecosystems, comprehensive planning approaches
at consider functional interactions between terrestrial and aquatic environments are likely
vantages of conducting comprehensive conservation
asse s
s
,
n to guide decisions on planning methodology. A critical evaluation of the
met could
.
systems are strongly linked by fluxes of water, sediment, nutrients and organisms (e.g.
Hynes 1975, Polis et al. 1997, Nakano and Murakami 2001, McDowall 1998), which have a
critical influence on biodiversity in all three realms. The relevance of these interactions to
conservation is particularly conspicuous for aquatic ecosystems, where many of the most
important threats to biodiversity are directly linked to activities in terrestrial landscapes
upslope and upstream (Allan 2004, Thrush et al. 2004, Stoms et al. 2005, Burcher et al.
2007). Resource fluxes from aquatic ecosystems can have significant effects on productivity
and community composition in terrestrial environments, as well (Nakano and Murakami
2001, Polis et al. 2004, Crait et al. 2007). These interactions are particularly important in
transition zones like riparian areas, which also support unique communities (Sabo et al.
2005). Given this interdependence among
th
to produce more robust conservation assessments (Stoms et al. 2005, Beger et al., In Press).
Recognition of the potential ad
ssments has led to an increasing number of conservation plans that identify priority area
for terrestrial and aquatic biodiversity in a common planning domain. A variety of method
have been used to develop these plans, representing varying levels of integration in the
planning process. However, it remains unclear how effectively these methods incorporate
interactions among realms, the primary impetus for a comprehensive approach. In addition
different methods may be appropriate in different situations, depending on the availability of
data and expertise, the nature of terrestrial-aquatic interactions in the planning area, and the
specific goals of the conservation assessment. Unfortunately, there is currently very little
informatio
hods currently being used to integrate terrestrial and aquatic conservation goals
help direct efforts by conservation practitioners and suggest directions for future research
107
In this paper, we begin by discussing the goals of comprehensive conservation planning
using a planning domain on the Caribbean slope of Central America as an example. Next,
summarize the strategies that have been used, or proposed, to produce conservation plans that
include terrestrial and aquatic ecosystems. Each strategy is then evaluated based on severa
criteria, including data requirements, methodological difficulty, and the degree to which
functional interactions between ecosystems are represented. Based on this evaluation, we
present a set of methods that would be most useful for comprehensive planning in our
example planning domain, and discuss future developments in conservation plannin
Throughout our discussion, we use the term conservation planning to refer to the proce
identifying potential reserve networks using systematic reserve selection algorithms and
spatial decision support software, although reserve selection is just one part of the
conservation planning process (Knight et al. 2006).
Goals of a comprehensive planning approach
Systematic conservation plann
,
we
l
g.
ss of
ing aims to identify an array of sites that, if managed
ressey 2000). In practice, this usually entails selecting a set of priority
site
n
er
ins
n a
al extension of the systematic planning approach. Ideally, a
com
l
properly, could provide for the persistence of the full complement of biodiversity in a given
region (Margules and P
s based on the distribution of a few relatively well-studied groups, as well as the
occurrence of habitat types that can be identified through remote sensing or unique
combinations of biophysical factors like soil, elevation, and precipitation (Margules et al.
2002, Higgins et al. 2005). The extent to which plants and vertebrates, which are most ofte
used as surrogates for biodiversity patterns, represent broader patterns of biodiversity
remains an important, and unanswered, question. The ability of habitat types (e.g. land cov
types) to represent patterns of biodiversity has been established in some cases, but rema
poorly understood in general (Brooks et al. 2004). Despite these problems, the use of
biodiversity surrogate groups and habitat types in conservation planning is a pragmatic
approach to incorporating the best available information into the planning process (Pressey
2004).
Planning for the persistence of all species and ecosystems, terrestrial and aquatic, i
given area is a logic
prehensive plan would meet several key goals. First, it would identify a network of sites
where known biodiversity features in terrestrial and aquatic ecosystems, including individua

108
species and entire communities, are fully represented. In addition, potential reserves woul
be extensive enough to maintain viable populations of all species and sustain ecological
processes (e.g. disturbance regimes) necessary for the long-term persistence of all
biodiversity features. These goals have typically been addressed in conservation planni
d
ng
ay from sites with heavy human impacts (e.g. Noss et al. 1999, Cowling
et a
priority
ated
een
et
a of this area are extremely diverse due to the wide variety of life
zon
plants
a
through the size of potential reserves, identifying corridors among these sites, and steering
reserve selection aw
l. 2003, Mattson and Angermeier 2007). In a comprehensive approach, these factors
would still be relevant, but two additional considerations would also be important. First,
reserve selection methods should consider spatial relationships between sites in different
realms that sustain key biophysical processes (Figure 1). For example, the spatial
arrangement of coral reefs and mangroves could influence the abundance and persistence of
species that use both ecosystems during their life cycle (Mumby 2006). Second, a
comprehensive planning approach would ideally identify a network of conservation
areas that minimizes threats to biodiversity in all realms, recognizing that threats can move
between realms and follow directional flows in aquatic ecosystems.
An example planning domain
The goals of a comprehensive assessment can be illustrated using an example planning
domain that includes terrestrial, freshwater and marine ecosystems. Our example is loc
on the Caribbean slope of Central America in southeastern Costa Rican and northwestern
Panama. The terrestrial portion of the planning domain covers approximately 3800 km2 and
encompasses the Estrella and Sixoala River basins and the smaller coastal drainages betw
them (Figure 2). This area is located within the Mesoamerican biodiversity hotspot (Myers
al. 2000, Mittermeier et al. 2005), and includes portions of the Talamanca montane
ecoregion, a Global 200 priority ecoregion (Palminteri et al. 1999, Olson and Dinerstein
2002). The flora and faun
es, and to the fact that is it a convergence zone for fauna from North and South America
(Graham 1995). The area is also rich in endemic birds, mammals, herpetofauna and
(Palminteri et al. 1999). The inland backbone of the Talamanca Mountains is drained by
network of rivers that support diverse vertebrate and invertebrate communities, including
several freshwater fish species endemic to the region (Bussing 1998). Nearshore marine
environments are also included in our planning domain and are exceedingly diverse, with
109
some of the largest coral reefs in Costa Rica (Cortes 1998). Transition zones between
ecosystems in this landscape include floodplain lakes and wetlands, riparian forests,
estuaries, mangroves, lagoons, and beaches. These interfaces provide critical habitat and
bre arine
z
al Park,
epresented (Palminteri et al. 1999, Powell
nd marine environments, and nearly all of the coral reefs in the area. Land
tenu nd large
999),
6),
fishing (J. Schipper, unpublished data), and siltation in nearshore marine
env
restrial
l, and so
eding grounds for many of the region's rare and threatened species, such as estu
nurseries for the Atlantic tarpon or beach nesting sites for sea turtles (Wilkinson 2004, Corte
1998).
Several protected areas, including La Amistad International Park, Chirripò Nation
Hitoy-Cerere Biological Reserve, Cahuita National Park, Gandoca-Manzanillo National
Wildlife Refuge, and a number of smaller private reserves have already been established in
the region (Boza 1986). The current system of protected areas is extensive (Figure 2), but
highly skewed toward to high-elevation montane forests and coastal swamps, leaving many
of the most diverse ecosystems in the region underr
et al. 2000). Cahuita National Park and Gandoca-Manzanillo National Wildlife Refuge
protect terrestrial a
re outside of protected areas includes private lands owned by small landholders a
corporations, as well as several indigenous reserves that together occupy nearly 30% of the
planning domain and form a buffer zone around montane protected areas. Common land uses
in indigenous reserves include plantain production, banana and cacao agroforestry systems,
and shifting cultivation of basic grains, while intensive monocultures of banana and plantain,
cattle pasture, and tourism development predominate on private lands outside reserves.
Banana and plantain production is concentrated in the floodplains of the Sixaola and Estrella
River systems, where plantations receive year-round pesticide applications of up to 50 kg of
active ingredient/ha/yr for export-quality fruit (B. Polidoro et al., unpublished data).
Principal threats to biodiversity in this region include logging (Palminteri et al. 1
intensive agriculture and agrochemical use (Borge and Castillo 1997, Castillo et al. 200
illegal hunting and
ironments (Cortes and Risk 1985). Coastal development also poses a potential risk to
biodiversity in multiple ecosystems, but the severity of this risk is largely unknown.
Although most floodplain environments in the area have been severely altered, the ter
portion of the planning domain is one of the most intact landscapes in the region. Freshwater
and marine ecosystems in the planning domain are also significant on a national leve

110
there is an urgent need for strategic conservation planning in the area to ensure the lo
persistence of terrestrial and aquatic biodiversity.
A comprehensive conservation plan for our planning domain would ideally include
several key components. First, the plan would identify a suite of sites that could complem
the existing re
ng-term
ent
serve network and allow for the persistence of species and ecosystems that are
n
at low to mid-elevations that support species and communities that are poorly
rep
for
varying
deg mine
use
eavy
s and
t
able 1). Based on our
e, we identified seven methods for
not adequately protected in existing reserves. In practice, this would mean identifying a
array of sites
resented in current protected areas. Ideally, these sites would be selected based on their
connectivity with existing protected areas, as well as their importance for seasonal migrations
of organisms, dispersal and recruitment processes, and natural disturbance regimes within
terrestrial, freshwater, and marine realms. Second, the plan would target transition zones
between realms, including floodplains and estuaries, which are particularly important
biodiversity conservation. These habitats could be mapped and considered as unique habitat
types to be included in representation goals. Third, an effective comprehensive plan would
identify a set of priority sites that minimizes threats to biodiversity throughout the reserve
network. This is a particularly important aspect, as existing reserves are threatened to
rees by exogenous factors (e.g. sediment deposition on reefs) that threaten to under
conservation objectives. Finally, a comprehensive plan would ideally promote the
maintenance of ecosystem services (Chan et al. 2006) and maximize economic benefits to
local communities (Naidoo and Ricketts 2006).
Methods for integrated conservation planning
A review of the conservation literature yielded a variety of conservation plans that
terrestrial and aquatic biodiversity features to identify a set of conservation priority areas
(Table 1). These plans used diverse approaches to identify priorities, ranging from h
dependence on expert opinion to systematic approaches driven by selection algorithm
spatial decision support systems. Methods for targeting terrestrial and aquatic biodiversity
features also differed greatly among the plans we reviewed. The examples we present are no
an exhaustive list, but were selected to illustrate the range of approaches that have been used.
Most of these examples focus on terrestrial and freshwater ecosystems, but several recent
conservation plans have also included marine conservation goals (T
review of these plans and other relevant literatur
111
dev .
then overlay results.
icularly
de
w
m, and does
op
betw her
n
eloping comprehensive conservation plans for terrestrial and aquatic realms (Table 2)
These approaches vary from post-hoc comparisons of conservation priorities based on
independent assessments of freshwater, terrestrial, and/or marine environments in a particular
geographic area to increasingly integrated approaches. Below, we evaluate each of these
methods based on planning efficiency, ease of application using existing software, data
requirements compared with planning for each realm separately, and the extent to which
interactions between realms are considered when selecting priority areas (see Table 2).
Method 1. Develop separate conservation plans for terrestrial, freshwater, and/or marine
realms and
This is the simplest approach methodologically, and in terms of data requirements. Once
separate conservation plans for terrestrial and aquatic realms have been developed, priority
areas can easily be overlaid in a geographic information system. This method is part
well-suited to integration across freshwater and terrestrial realms because of the way that
freshwater ecosystems are embedded in terrestrial landscapes. Simple overlays in this case
may provide considerable insight into synergies or trade-offs between freshwater and
terrestrial conservation priorities. Marine systems are more spatially distinct, but overlays
may still be informative for coastal areas and islands, where protected areas could inclu
multiple realms.
Maintaining separate planning processes for terrestrial and aquatic ecosystems may allo
for more thorough and relevant assessments of biodiversity priorities in each real
not require that similar data are available for both. However, the effort required to devel
completely separate plans makes this a relatively inefficient approach, especially if similar
data and software are being used in the planning process. In some areas, conservation
assessments for one or more realms already exist, and utilizing this information in an overlay
approach could significantly reduce the cost of producing a comprehensive plan. Linkages
een realms are very poorly represented with this approach, although assigning hig
priority to areas of spatial congruence between realms may capture sites where functional
relationships are intact. Using expert opinion to modify priority areas based on overlays ca
also improve integration across realms.

112
Method 2. Target terrestrial and aquatic habitat types when selecting conservation priori
areas: a coarse-filter approach.
As discussed above, targeting habitat types for protection in conservation planning is a
pragmatic approach to deal with uncertainty concerning the distribution of most speci
ty
es.
Hab
ata
ht to
can be more difficult. Significant
pro
g
Me eas:
d
ery
itat types (also referred to as land types or ecological systems) are often called coarse-
filter targets because they are thought to capture large and poorly known complements of
species (Groves et al. 2002). Planning using terrestrial and aquatic habitat types as coarse-
filter targets is straightforward methodologically, and is an efficient way to incorporate d
from both ecosystems in a single analysis. Furthermore, this approach gives equal weig
terrestrial and aquatic biodiversity through representation of all habitats in the planning
domain.
Data requirements for this method may be higher than for conducting separate
assessments, primarily because of the need for comparable data across realms. Maps of
terrestrial habitats are often readily available or can be produced using remote sensing and
other spatial data. Similar methods typically cannot be applied to aquatic systems, and so
producing accurate maps of marine and freshwater habitats
gress has recently been made in this area for freshwater systems (Higgins et al. 2005,
Thieme et al. 2007), offering new opportunities for integration across realms. Other issues of
scale are also relevant, especially in practice. First, the different shapes and spatial extents of
ecological systems in different realms can make display very difficult, especially when
spatial decision support systems are being used to explore conservation trade-offs.
Boundaries between realms are particularly complicated, as they are often temporally
dynamic (e.g. floodplains, tidal marshes) and difficult to delineate. Explicitly targetin
transition zones for protection could alleviate many of these problems, ensuring that features
in both realms, and the ecological processes they support, are adequately represented (Beger
et al. In Press). Aside from capturing transition areas, this method does not effectively
address linkages among realms.
thod 3. Target terrestrial and aquatic species when selecting conservation priority ar
a fine filter approach.
Although targeting specific habitat types for conservation may capture most species an
assemblages, these areas may not provide adequate protection for species that depend on v
113
specific habitats, have limited ranges, or require extraordinarily large areas to maintain viable
populations. Targeting these species of special conservation concern provides a fine filte
that complements the coarse-filter approach (Groves et al. 2002). The geographic dis
of focal species can be represented spatiall
r
tribution
y as point occurrences or as polygons based on
f occupancy, habitat suitability models or expert opinion. The quality of
spe
rdized
n
is
es
ealms.
es
ting
en conducting a
sys ed
known areas o
cies occurrence data varies widely, and is often heavily biased even in the best-studied
areas (Margules et al. 2002, Pressey 2004). Nevertheless, once data have been standa
to a common format, fine-filter targets from different ecosystems can be treated equally i
the planning process. Using fine-filter targets from terrestrial and aquatic ecosystems in th
way can improve the efficiency of the planning process while using existing data and
planning methods.
Like the coarse-filter approach discussed above, using fine-filter targets from terrestrial
and aquatic ecosystems does little to address linkages among realms and their influence on
biodiversity. Selecting focal species like amphibians, otters, or wading birds that rely on
habitats in more than one realm could help, because their ranges may capture transition zon
between realms. However, even for these species, there is no guarantee that key spatial
relationships between habitats in different realms will be captured with this approach.
Method 4. Use conservation assessment for one realm as a “seed” for identifying priorities
in other r
When a conservation assessment has already been made for one realm, the selected
priority areas can be used to guide reserve selection in other realms. This method has been
used to select potential marine reserves based on their spatial congruence with previously
selected terrestrial priority areas (e.g. Floberg et al. 2004), and to modify an existing
terrestrial conservation assessment so that it better represents freshwater biodiversity featur
(Abell et al. 2004). This approach is relatively efficient where a systematic conservation
assessment for one realm has already been developed, and has minimal extra data
requirements compared with planning for a single realm. Using one assessment as a star
point for others is quite similar to locking in existing protected areas wh
tematic conservation assessment (e.g. Cowling et al. 2003), and can be accomplish
using available software tools. The extent to which ecosystem linkages are represented with
this approach depends on how additional conservation priority areas are selected. For

114
example, if spatial congruence with an existing set of sites is emphasized using a bounda
length function in the selection algorithm, important functional linkages among ecosy
may be preserved incidentally. Nevertheless, because the initial set of priority area
locked in without considering linkages with other realms, sites that are most important for
maintaining these linkages and minimizing threats to biodiversity may be overlooke
Method 5. Automatically select transition areas adjacent to aquatic conservation priority
areas (e.g. floodplains).
As noted above, ecological processes that operate in transition zones where two realms
meet are often vital to maintaining biodiversity in both realms. One alternative for
representing these functional relationships in a comprehensive planning approach
include parts of adjacent ecosystems when selecting priority areas. For example, riparia
areas adjacent to streams targeted for protection could automatically be included as priori
areas for
ry
stems
s are
d.
is to
n
ty
conservation action. Shorelines adjacent to marine protected areas could also be
is relatively straightforward to apply and, similar to the explicit
Deciding exactly how much area to protect in the adjacent ecosystem is not as
rd, and additional spatial data on the occurrence of certain vegetation types or
are to map geomorphic surfaces and provide
r
reg f this method, aquatic ecosystems are
n
200
imp
as p
strongly linked to the surrounding landscape, and so
elli
200 ,
is a ity areas that are relevant to terrestrial and aquatic
targeted. This strategy
mapping of transition zones, may protect unique biological communities and ecological
processes that occur in transition zones.
straightforwa
other indicator species may be needed to determine appropriate dimensions for transition
as. Digital elevation models can be used
information on the spatial extent of floodplains and other transition zones, even in data-poo
ions (Thieme et al. 2007). Despite the advantages o
affected by land use and other impacts in their catchments at multiple spatial scales (Alla
4), and so protecting narrow transition zones alone may not be sufficient to maintain
ortant functional linkages among ecosystems.
Method 6. Use river basin boundaries to define the planning domain and small catchments
lanning units
Freshwater ecosystems are
freshwater protected areas function best when reserves protect entire catchments (Criv
2, Saunders et al. 2002, Abell et al. 2007). Using catchments as planning units, therefore
n efficient approach to identifying prior

115
conservation goals. Applying this approach is relatively simple, as watersheds can b
ultiple spatial scales using digital elevation models to match the target
e mapped
at m size for planning
on
of p o be
use ted
land it from conservation at the
plan n terrestrial and freshwater planning domains. Terrestrial
ly
con iogeographic units (Abell et
rep on how much of a river basin or
is a ts across many of the methods reviewed here, and can only
eco
Me alms in reserve selection
rial
and assessments
and tions of the benefits of specific conservation actions (Stoms
con ish
n
biodiversity (e.g. transport of sediment and pollutants between realms). Beger et al. (In Press)
g a variety
of e
The main limitation of this approach is the difficulty of accurately describing and
predicting ecosystem interactions across realms (Stoms et al. 2005). Many of the most
units. In addition, catchments are naturally nested in a way that facilitates spatial aggregati
lanning units into larger reserves. Upstream-downstream connectivity rules can als
d to ensure that priority sub-catchments are not selected downstream from unprotec
areas (Linke et al. 2007). Nearshore marine environments are similarly affected by
scapes “upstream” (Stoms et al. 2005), and could benef
catchment scale.
The major drawback to using catchments as the basis for comprehensive conservation
ning is the mismatch betwee
ecoregions, the most common planning domain for terrestrial assessments, are rare
gruent with the catchment boundaries that define freshwater b
al. 2002). This creates non-trivial issues of scale for comprehensive assessments, as
resentation and complementarity criteria depend
terrestrial ecoregion is included in the planning domain (e.g. Floberg et al. 2004). This issue
fundamental challenge that cu
be circumvented by developing separate conservation plans for freshwater and terrestrial
systems.
thod 7. Explicitly consider ecological linkages between re
algorithms.
Conservation planning tools that incorporate biophysical interactions between terrest
aquatic ecosystems have the potential to produce more realistic conservation
allow for more robust evalua
et al. 2005, Beger et al. In Press). These interactions could include natural processes that
tribute to the development and maintenance of biodiversity (e.g. diadromous f
migration, allochthonous resource subsidies among realms), as well as processes that threate
provide a thorough review of these topics, as well as specific methods for targetin
cological interactions between realms in systematic conservation assessments.

116
important processes can be described qualitatively, but precise quantitative descriptions are
ch more difficult to develop. In some cases, such detail may not be crucial and relatively
ple heuristic rules can be used
mu
sim . This approach has often been used to steer reserve
Ac ms, water, sediment,
app
com n in these
info change will affect key biophysical processes
e-
offs
sev ing a comprehensive conservation plan. Here we
iscuss the applicability and feasibility of each method for our example planning domain. We
re not aware of any systematic planning efforts in the study region that have been conducted
not among
eco
fres
met
nd 3)
wou
200
the
mo ata,
aerial photos, and satellite imagery. Occurrence data within the planning domain exist for
(ww
fres
selection away from areas with high human impact, using variables like road density.
curate, spatially-explicit models describing movement of organis
nutrients, and contaminants among realms would clearly be superior to qualitative
roaches. However, data needed to parameterize these models is often limited or
pletely absent, particularly in developing regions. Spatial and temporal variatio
processes further complicates modeling and prediction. Finally, even if there was sufficient
rmation to accurately predict how land-use
operating among realms, linking these models to decision support systems to examine trad
among individual sites presents another level of complexity.
Application to the example planning domain
The conservation planning methods reviewed above are not mutually exclusive, and
eral may be appropriate when develop
d
a
at a scale relevant to our planning domain, and so building on an existing plan (Method 4) is
an option in this area. The lack of previous planning efforts and high connectivity
systems suggests that conducting separate conservation assessments for terrestrial,
hwater and marine environments (Method 1) would also be an inefficient and ineffective
hod.
Among the remaining methods, targeting specific habitats and species (Methods 2 a
ld both be feasible in our study area. Maps of terrestrial habitat types (Kappelle et al.
2) and nearshore marine ecosystems are available for the planning domain, and
freshwater habitats could be mapped using available digital elevation data. In addition,
st important transitional ecosystems could be mapped using existing digital elevation d
many terrestrial and aquatic species of conservation concern, including birds and amphibians
w.natureserve.org), mammals (Harvey et al. 2006, J. Schipper, unpublished data),
hwater fishes (Bussing 1998, C. Lorion, unpublished data), and reef-building corals
117
(Co
bec hort-term surveys rather than demographic studies.
com as
new
selection to improve connectivity within the reserve network, which could increase the long-
s.
between ecosystems and their influence on biodiversity, and so other methods would also be
fres
rela argeted directly.
prohibits
clea
Cahuita National Park, where terrestrial and freshwater systems immediately adjacent to the
d
con 98).
mo study
area
size readily available digital
betw he study region. All major river
area
eco
al.1 ority
area s, but cannot be
ce of
key e ecosystems, as
rtes 1998). Available occurrence data may not necessarily represent viable populations
ause most data are from s
Nevertheless, targeting known biodiversity features in all realms would be an essential
ponent of a comprehensive planning approach, and priority areas could be updated
data became available. Boundary length constraints could also be used during reserve
term viability of small, fragmented populations and species with large area requirement
Targeting specific species and ecosystems would not adequately address linkages
needed to produce an effective comprehensive plan. Including transition areas adjacent to
hwater and marine protected areas (Method 5) could help maintain functional
tionships among realms, but may be redundant if transition zones are t
Furthermore, transition areas may already be protected by law (e.g. Costa Rican law
ring streamside forests). The limitations of protecting transition zones are evident in
marine environment are protected, but reef systems continue to be affected by sediment an
taminants from outside the protected area (Cortes and Risk 1985, Cortes 19
Using a catchment-based approach to define conservation priority areas (Method 6) is
st likely to reduce threats to aquatic ecosystems, and explains why we defined our
by watersheds as opposed to political boundaries. Small sub-catchments 10-20 km2 in
could be mapped as planning units for our study area using
elevation data. The major problem with this approach is the lack of spatial congruence
een terrestrial ecoregions and watershed boundaries in t
basins in the region are divided by terrestrial ecoregion boundaries, with higher elevation
s on both slopes of the Talamanca Mountains located within the Talamanca montane
region, and lower elevation areas defined by different terrestrial ecoregions (Palminteri et
999). This arrangement makes it difficult to assess how terrestrial conservation pri
s fit into ecoregional-scale representation of species and ecosystem
avoided if catchments are used as the basis for planning.
Finally, effective conservation in our planning domain will require the maintenan
ecosystem processes operating between terrestrial, freshwater, and marin

118
well as mitigation of threats that move among these realms. Specifically targeting ecological
cesses for protection using reserve selection algorithms (Method 7) could be done in
eral ways. First, as mentioned above
pro
sev , transition areas like riparian zones and shorelines
bou
pathways for diadromous fishes, could also be identified and targeted using available reserve
be u based on their potential to affect aquatic
ating reserve selection algorithms with process models describing the flow of
offs
generally lacking for the study region. Even though sedimentation and contamination are
coa
Cas
var
Con
ed
on al
inte s, has great potential to produce more effective reserve
asse biodiversity in all realms. Such tools could
incl
The ere
conservation opportunities are limited. Even in a relatively intact landscape like our example
y
land able for conservation. Furthermore,
setting aside more protected areas in this landscape may do less to ameliorate threats to
could be mapped as distinct features and linked to protected areas in adjacent realms using
ndary length constraints. Longer connections among reserves, such as migratory
selection algorithms (Beger et al. In Press). Concerning threats, simple heuristic rules could
sed to prioritize potential terrestrial reserves
ecosystems downstream either positively or negatively (Stoms et al. 2005).
Integr
water, nutrients, sediment, and contaminants could provide a much clearer picture of trade-
between different potential reserves. However, data to parameterize these models are
known to threaten numerous aquatic species and ecosystems in Costa Rica and other tropical
stal landscapes (Cortes and Risk 1985, Peters et al. 1997, Wishnie and Socha 2003,
tillo et al. 2006), their rates are difficult to predict and often exhibit high natural
iability (Krishnaswamy et al. 2001).
clusions
A comprehensive approach to conservation planning that identifies priority areas bas
biodiversity patterns in terrestrial and aquatic ecosystems, as well as biophysic
ractions between these realm
networks. However, realizing this potential will require the development of new tools for
ssing exactly how reserve selection will affect
also be used to inform decisions about a broader array of conservation interventions,
uding habitat restoration and application of best management practices on private lands.
se interventions would be particularly important in heavily modified landscapes wh
planning domain, the capacity for setting aside more protected areas is severely limited b
tenure and land use patterns and the resources avail

119
aquatic biodiversity than improving land management practices and simply enforcing
s.
There is good e
current
law
vidence that agricultural land uses in this domain vary greatly in their
t
the osystems remain
-use
pra rehensive planning framework may seem
serve
soc se
values are not included in the planning process, optimal solutions to complex planning
is
rotection
of e
stra fective conservation of freshwater
spe als while providing other economic
hieve
this ical risk
bio
adv hallenge is to link these models with conservation
ptimal
solu
dev comprehensive planning techniques based on a broader perspective of
real
Ack
y, David
The us develop the ideas presented here.
capacity to support native biodiversity (Harvey et al. 2006, Harvey and Gonzalez 2007), bu
effects of different land uses on biodiversity in freshwater and marine ec
very poorly understood. Incorporating trade-offs between reserve designation, land
ctices, and biophysical processes into a comp
hopelessly complex, but it may be the only way to find conservation solutions that best
iety. Private lands will always contribute at some level to conservation, and when the
problems may be missed (Faith and Walker 2002, Polasky et al. 2005).
The need to look beyond strict reserves in comprehensive planning approaches
particularly clear when considering freshwater conservation goals. Although strict p
ntire catchments is the ideal approach for freshwater biodiversity conservation, this
tegy is infeasible for most river systems. Thus, ef
biodiversity will require a broader perspective on protected areas that includes areas
cifically managed to meet conservation go
opportunities (Abell et al. 2007). Expanding terrestrial reserve networks may help to ac
goal, but eliminating destructive land uses is just as important. Ecolog
assessment provides a ready framework for identifying sites that pose the greatest threat to
diversity, and incorporating these methods into the planning process could significantly
ance comprehensive assessments. The c
planning algorithms in decision support systems to explore trade-offs and search for o
tions. Conservation planning has a long way to go to achieve these goals, but
elopment of
conservation action may significantly improve our ability to conserve biodiversity in all
ms.
nowledgements
This work was supported in part by NSF-IGERT grant no. 0114304. Robert Presse
obald, and Michelle Thieme helped

120
References
ll, R. 2002. Conservation biology for the biodiversity crisis: a freshwater follow-up.
Conservation Biology 16:1435
Abe
-1437.
Abe . Olson. 2002. A sourcebook for conducting
.
Abe
Abe
ent area selection methods. Biodiversity
All
Beg
ngham. In Press. Conservation planning for
Bor vación en la Talamanca indígena. Editorial
Boz
Bro h?
Bro
Bur ps
Bus
Abell, R., J. D. Allan, and B. Lehner. 2007. Unlocking the potential of protected areas for
freshwaters. Biological Conservation 134:48-63.
ll, R., M. Thieme, E. Dinerstein, and D
biological assessments and developing biodiversity visions for ecoregion conservation.
Volume II: freshwater ecoregions. World Wildlife Fund, Washington, D.C., USA
ll, R., M. Thieme, B. Lehner, G. Powell, S. Palminteri, J.-C. Riveros, and S. Hamilton.
2004. Southwest Amazon freshwater-terrestrial integration. World Wildlife Fund,
Washington, D.C., USA.
llán, P., D. Sánchez-Fernández, J. Velasco, and A. Millán. 2005. Conservation of
freshwater biodiversity: a comparison of differ
and Conservation 14:3457–3474.
an, J. D. 2004. Landscapes and riverscapes: the influence of land use on stream
ecosystems. Annual Review of Ecology and Systematics 35:257-284.
er, M., H. Grantham, R. Pressey, K. Wilson, E. Peterson, D. Dorfman, P. Mumby, R.
Lourival, D. Brumbaugh, and H. Possi
processes connecting marine, freshwater, and terrestrial realms. Ecology Letters.
ge, C., and R. Castillo. 1997. Cultura y conser
Universidad Estatal a Distancia, San José, Costa Rica.
a, M. 1986. Parques Nacionales: Costa Rica. Incafo, S.A., Madrid, Spain.
oks T. M. 2004. Coverage provided by the global protected-area system: Is it enoug
BioScience. 54:1081–1091
oks T. M., G. A. B. Fonseca, and A. S. L. Rodrigues. 2004. Species, data, and
conservation planning. Conservation Biology 18:1682-1688.
cher, C. L., H. M. Valett, and E. F. Benfield. 2007. The land-cover cascade: relationshi
coupling land and water. Ecology 88:228-242.
sing, W. A. 1998. Freshwater fishes of Costa Rica. Editorial de la Universidad de Costa
Rica, San José, Costa Rica.
121
Carr, M. H., J. E. Neigel, J. A. Estes, S. Andelman, R. R. Warner, and J. L. Largier. 2003.
Comparing marine and terrestrial ecosystems: implications for the design of coastal
marine reserves. Ecological Applications 13:S90-S107.
Castillo, L. E., E. Martinez, C. Ruepert, C. Savage, M. Gilek, M. Pinnock, and E. Solis.
2006. Water quality and macroinvertebrate community response following pestici
applications in a banana plantation, Limon, Costa Rica. Science of the Total
Environment. 367:418-432.
de
.
4:2138-2152.
f
Cor
ce.
Cowling, R. M., R. L. Pressey, M. Rouget, and A. T. Lombard. 2003. A conservation plan
l
Cra
logy 88:1040-1052.
3-
Dir 003. Global state of biodiversity and loss. Annual Review of
Dun l systems by
Faith, D. P., and P. A. Walker. 2002. The role of trade-offs in biodiversity conservation
Chan K. M. A., M. R. Shaw, D. R. Cameron, E. C. Underwood, and G. C. Daily. 2006
Conservation planning for ecosystem services. PLOS Biology
Cortes, J., and M. Risk. 1985. A reef under siltation stress: Cahuita, Costa Rica. Bulletin o
Marine Science 36:339-356.
tes, J. 1998. Cahuita and Laguna Gondoca, Costa Rica. In B. Kjerfve, B., ed.
CARICOMP Carribbean Coral Reef, Seagrass and Mangrove Sites. UNESCO, Fran
for a global biodiversity hotspot – the Cape Floristic Region, South Africa. Biologica
Conservation 112:191-216.
it, J. R., and M. Ben-David. 2007. Effects of river otter activity on terrestrial plants in
trophically altered Yellowstone Lake. Eco
Crivelli, A. J. 2002. The role of protected areas in freshwater fish conservation. Pages 37
388 in M. J. Collares-Pereira, M. M. Coelho, and I. G. Cowx, eds. Conservation of
freshwater fishes: options for the future. Blackwell Science Ltd., Oxford, UK.
zo, R., and P. H. Raven. 2
Environment and Resources 28:137-167.
n, H. 2003. Can conservation assessment criteria developed for terrestria
applied to riverine systems? Aquatic Ecosystem Health & Management 6:81-95.
planning: linking local management, regional planning, and global conservation efforts.
Journal of Biosciences 27:393-407.

122
Floberg, J., M. Goering, G. Wilhere, C. MacDonald, C. Chappell, C. Rumsey, Z. Ferdana,
Holt, P. Skidmore, T. Horsman, E. Alverson, C. Tanner, M. Bryer, P. Iachetti, A.
Harcombe, B. McDona
A.
ld, T. Cook, M. Summers, D. Rolph. 2004. Willamette Valley-
Conservancy of Canada,
e.
Gaston, K. J., R. L. Pressey, and C. R. Margules. 2002. Persistence and vulnerability:
Gra een Mexico/Central America and northern
s. The New York Botanical Gardens, New
Gro . H. Redford, M. L. Shaffer, J. M. Scout, J. V.
:2257-
arvey, C. A., J. Gonzalez, and E. Somarriba. 2006. Dung beetle and terrestrial mammal
diversity in forests, indigenous agroforestry systems and plantain monocultures in
Talamanca, Costa Rica. Biodiversity and Conservation 15:555-585.
iggins, J. V., M. T. Bryer, M. L. Khoury, and T. W. Fitzhugh. 2005. A freshwater
classification approach for biodiversity conservation planning. Conservation Biology
19:432-445.
Higgins J. V., T. H. Ricketts, J. D. Parrish, E. Dinerstein, G. V. N. Powell. 2004. Beyond
Noah: saving species is not enough. Conservation Biology 18:1672-1673.
Puget Trough-Georgia Basin Ecoregional Assessment, Volume One: Report. Prepared by
The Nature Conservancy with support from the Nature
Washington Department of Fish and Wildlife, Washington Department of Natural
Resources (Natural Heritage and Nearshore Habitat programs), Oregon State Natural
Heritage Information Center and the British Columbia Conservation Data Centr
retaining biodiversity in the landscape and in protected areas. Journal of Biosciences
27:361–384.
ham, A. 1995. Development of affinities betw
South American lowlands and lower montane vegetation during the Tertiary. Pages 11-
22. in S. P. Churchill, H. Balslev, E. Forero, and J. L. Luteyn, eds. Biodiversity and
Conservation of Neotropical Montane Forest
York, New York, USA.
ves, C. R., D. B. Jensen, L. L. Valutis, K
Baumgartner, J. V. Higgins, M. W. Beck, and M. G. Anderson. 2002. Planning for
biodiversity conservation: putting conservation science into practice. BioScience 52:499-
512.
Harvey, C. A., and J. Gonzalez. 2007. Agroforestry systems conserve species-rich but
modified assemblages of tropical birds and bats. Biodiversity and Conservation 16
2292.
H
H
Huggins, A. E., S. Keel, P. Kra
Hynes, H. B. N. 1975. The stream
Kappelle, M., M. Castro, H. Acevedo, P. Cordero, L. González, E. Méndez & H. Monge.
Knight R. L. 1999. Private lands: negl
Knight, R. L., R. M. Cowling, and B.
Krishnaswamy, J., P. N. Halpin, and D. D. Rich
Linke, S., R. L. Pressey, R. C. Bailey, and R.
Malm
Margules, C. R., and R. L. Pressey. 2000. Sy
123
mer, F. Núñez, S. Schill, R. Jeo, A. Chatwin, K. Thurlow, M.
McPearson, M. Libby, R. Tingey, M. Palmer and R. Seybert. 2007. Biodiversity
Conservation Assessment of the Insular Caribbean Using the Caribbean Decision Support
System, Technical Report. The Nature Conservancy, USA.
and its valley. Verhandlungen Internationale Vereinigung
fur Theoretische und Angewandte Limnologie 19:1-15.
2002. A rapid method in ecosystem mapping and monitoring as a tool for managing
Costa Rican ecosystem health. In D.J. Rapport, W.L. Lasley, D.E. Rolston, N.O. Nielsen,
C.O. Qualset, and A.B. Damania, eds. Managing for Healthy Ecosystems. Lewis
Publishers, Boca Raton, Florida, USA.
ected geography. Conservation Biology 13:223-224.
M. Campbell. 2006. An operational model for
implementing conservation action. Conservation Biology 20:408-419.
ter. 2001. Dynamics of sediment discharge in
relation to land-use and hydroclimatology in a humid tropical watershed in Costa Rica.
Journal of Hydrology 253:91-109.
H. Norris. 2007. Management options for river
conservation planning: condition and conservation re-visited. Freshwater Biology
52:918-938.
qvist, B., and S. Rundle. 2002. Threats to the running water ecosystems of the world.
Environmental Conservation 29: 134-153.
stematic conservation planning. Nature 405:243-
253.
Margules, C. R., R. L. Pressey, and P. H. Williams. 2002. Representing biodiversity: data
and procedures for identifying priority areas for conservation. Journal of Biosciences
27:309–326.
Marshall, R. M., D. Turner, A. Gondor, D. Gori, C. Enquist, G. Luna, R. Paredes Aguilar, S.
Anderson, S. Schwartz, C. Watts, E. Lopez, and P. Comer. 2004. An ecological analysis
of conservation priorities in the Apache Highlands Ecoregion. Prepared by the Nature

Mattson, K. M., and P. L. Angerm
McDowall, R. M. 1988. Diadrom
Mitterm
Moss, B. 2000. Biodiversity in fresh waters – an
Mum
Myers, N., R. A. Mitterm
124
Conservancy of Arizona and the Instituto del Medio Ambiente y el Desarollo Sustentable
del Estado de Sonora.
eier. 2007. Integrating human impacts and ecological
integrity into a risk-based protocol for conservation planning. Environmental
Management 39:125-138.
y in fishes: migrations between freshwater and marine
environments. Croom Helm, London, UK.
eier, R. A., P. R. Gil, M. Hoffman, J. Pilgrim, T. Brooks, C. G. Mittermeier, J.
Lamoreux, and G. A. B. da Fonseca. 2005. Hotspots revisited: earth's biologically richest
and most endangered terrestrial ecoregions. University of Chicago Press, Chicago,
Illinois, USA
issue of species preservation or system
functioning? Environmental Conservation 27: 1-4.
by, P. J. 2006. Connectivity of reef fishes between mangroves and coral reefs:
algorithms for the design of marine reserves at seascape scales. Biological Conservation
128:215-222.
eier, C. G. Mitterm ier, G. A. B. da Fonseca, and J. Kent. 2000.
Biodiversity hotspots for conservation priorities. Nature 403:853-858.
Naidoo, R., and T. H. Ricketts. 2006. Mappi ic costs and benefits of
conservation. PLOS Biology 4:2153-2164.
Nakano, S., and M. Murakami. 2001. Reciprocal subsidies: dynamic interdependence
between terrestrial and aquatic food webs. Proceedings of the National Academy of
Science of the USA 98: 166-170
Noss, R. F., J. R. Striftholt, K. Vance-Borla
plan for the Klamath-Siskiyou Ecoregion. Natural Areas Journal 19:392-411.
Noss, R.F. C. Carroll, K. Vance-Borland, and G. Wuerthner. 2002. A multicriteria
assessment of the irreplaceability and vulnerability of sites in the Greater Yellowstone
Ecosystem. Conservation Biology 16:895-908.
O’Connell M. A. O., and R. F. Noss. 1992. Private land management for biological diversity.
Environmental Management 16:435-450
e
ng the econom
nd, C. Carroll, and P. Frost. 1999. A conservation

Olsen, D. M., and E. Dinerstein. 2002. The
Palm
Peters, E. C., N. J. Gassm
125
Global 200: priority ecoregions for global
conservation. Annals of the Missouri Botanical Garden 89:199-224.
interi, S., G. Powell, A. Fernandéz, and D. Tovar. 1999. Talamanca Montane-Isthmian
Pacific Ecoregion-Based conservation plan: Preliminary reconnaissance phase. Tropical
Science Center, San José, Costa Rica.
an, J. C. Firman, R. H. Richmond, and E. A. Power. 1997.
Ecotoxicology of tropical marine ecosystems. Environmental Toxicology and Chemistry
16:12-40.
Pimm, S. L. and T. M. Brooks. 2000 The Sixth Extinction: How large, how soon, and where?
Pages 46-62 in P. Raven, ed. Nature and Human Society: the quest for a sustainable
world. National Academy Press, Washington, D.C., USA.
Pimm, S. L., G. J. Russell, J. L. Gittleman, and T. M. Brooks. 1995. The future of
biodiversity. Science 269:347-350.
Polasky, S., E. Nelson, E. Lonsdorf, P. Fackler, and A. Starfield. 2005. Conserving species in
a working landscape: land use with biological and economic objectives. Ecological
Applications 15:1387-1401.
Polis, G. A., W. B. Anderson, and R. D. Holt. 1997. Toward an integration of landscape and
food web ecology: the dynamics of spatially subsidized food webs. Annual Review of
Ecology and Systematics 28:289-316.
Polis, G. A., F. Sánchez-Piñero, P. T. Stapp, W. B. Anderson, and M. D. Rose. 2004. Trophic
flows from water to land: marine input affects food webs of islands and coastal
ecosystems worldwide. Pages 200-216 in G. A. Polis, M. E. Power, and G. R. Huxel, eds.
Food webs at the landscape level. University of Chicago Press, Chicago, Illinois, USA.
Powell, G. V. N., J. Barborak, and M. Rodriguez S. 2000. Assessing representativeness of
protected natural areas in Costa Rica for conserving biodiversity: a preliminary gap
analysis. Biological Conservation 93:35-41.
Pressey, R. L. 2004. Conservation planning and biodiversity: assembling the best data for the
job. Conservation Biology 18:1677-1681.
Revenga, C., I. Campbell, R. Abell, P. de Villiers, and M. Bryer. 2005. Prospects for
monitoring freshwater ecosystems towards the 2010 targets. Philosophical Transactions
of the Royal Society B 360:397-413.

126
Ricciardi, A., and J. B. Rasmussen. 1999. Extinction rates of North American freshwater
fauna. Conservation Biology 13:1220-1222.
Rodrigues, A. S. L., S. J. Andelman, M. I. Bakarr, L. Boitani, T. M. Brooks, R. M. Cowling,
L. D. C. Fishpool, G. A. B. Fonseca, K. J. Gaston, M. Hoffmann, J. S. Long, P. A.
Marquet, J. D. Pilgrim, R. L. Pressey, J. Schipper, W. Sechrest, S. N. Stuart, L.G.
Underhill, R. W. Waller, M. E. J. Watts & X. Yan. 2004a. Effectiveness of the global
protected area network in representing species diversity. Nature 428:640-643.
Rodrigues, A. S. L., H. R. Akçakaya, S. J. Andelman, M. I. Bakarr, L. Boitani, T. M. Brooks,
J. S. Chanson, L. D. C. Fishpool, G. A. B. Fonseca, K. J. Gaston, M. Hoffmann, P. A.
Marquet, J. D. Pilgrim, R. L. Pressey, J. Schipper, W. Sechrest, S. N. Stuart, L. G.
Underhill, R. W. Waller, M. E. J. Watts & X. Yan. 2004b. Global gap analysis: Priority
regions for expanding the global protected-area network. BioScience 54:1092-1100.
Sabo, J. L., R. Sponseller, M. Dixon, K. Gade, T. Harms, J. Heffernan, A. Jani, G. Katz, C.
Soykan, J. Watts, and J. Welter. 2005. Riparian zones increase regional species richness
by harboring different, not more, species. Ecology 86:56-62.
Sarkar, S., R. L. Pressey, D. P. Faith, C. R. Margules, T. Fuller, D. M. Stoms, A. Moffett, K.
A. Wilson, K. J. Williams, P. H. Williams, and S. Andelman. 2006. Biodiversity
conservation planning tools: present status and challenges for the future. Annual Review
of Environment and Resources 31:123-159.
Saunders, D. L., J. J. Meeuwig, and A. C. Vincent. 2002. Freshwater protected areas:
strategies for conservation. Conservation Biology 16:30-41.
Schoen, J., and D. Albert. 2007. Southeastern Alaska conservation strategy: a conceptual
approach. In J. Schoen and E. Dovichin, eds. The coastal forests and mountains
ecoregions of Southeastern Alaska and the Tongass National Forest: a conservation
assessment and resource synthesis. Audubon Alaska and The Nature Conservancy,
Anchorage, Alaska, USA.
Stoms, D. M., F. W. Davis, S. J. Andelman, M. H. Carr, S. D. Gaines, B. S. Halpern, R.
Hoenicke, S. G. Leibowitz, A. Leydecker, E. M. P. Madin, H. Tallis, and R. R.Warner.
2005. Integrated coastal reserve planning: making the land-sea connection. Frontiers in
Ecology and the Environment 3:429-436

127
Tear T. H., P. Kareiva, P. L. Angermeier, P. Comer, B. Czech, R. Kautz, L. Landon, D.
Mehlman, K. Murphy, M. Ruckelshaus, J. M. Scott, and G. Wilhere. 2005. How much is
enough? The recurrent problem of setting measurable objectives in conservation.
BioScience 55:835-849.
The Nature Conservancy. 2000. Middle Rockies-Blue Mountains Ecoregional Conservation
Plan. Prepared by the Middle Rockies-Blue Mountains Planning Team.
The Nature Conservancy. 2001. California North Coast Ecoregional Plan. Prepared by the
The Nature Conservancy of California.
The Nature Conservancy. 2002. Chesapeake Bay Lowlands Ecoregional Plan. Prepared by
the Chesapeake Bay Lowlands Ecoregional Planning Team.
The Nature Conservancy. 2003a. Cook Inlet Basin Ecoregional Assessment. Prepared by The
Nature Conservancy of Alaska.
The Nature Conservancy. 2003b. The West Gulf Coastal Plain Ecoregional Conservation
Plan. West Gulf Coastal Plain Ecoregional Planning Team, The Nature Conservancy, San
Antonio, Texas, USA.
The Nature Conservancy. 2004. A blueprint for conserving the biodiversity of the Federated
States of Micronesia. The Nature Conservancy, USA.
Thieme, M., B. Lehner, R. Abell, S. K. Hamilton, J. Kellndorfer, G. Powell, and J. C.
Riveros. 2007. Freshwater conservation planning in data-poor areas: an example from a
remote Amazonian basin (Madre de Dios River, Peru and Bolivia). Biological
Conservation 135:484-501.
Thrush, S. F., J. E. Hewitt, V. J. Cummings, J. I. Ellis, C. Hatton, A. Lohrer, and A. Norkko.
2004. Muddy waters: elevating sediment input to coastal and estuarine habitats. Frontiers
in Ecology and the Environment 2:299-306.
Weitzell, R. E, M. L. Khoury, P. Gagnon, B. Schreurs, D. Grossman, and J. Higgins. 2003.
Conservation Priorities for Freshwater Biodiversity in the Upper Mississippi River Basin.
Nature Serve and The Nature Conservancy.
Wilkinson, C. 2004. Status of Coral Reefs of the World: 2004 Vol. 2. Australian Institute of
Marine Science, Townsville, Australia.

128
Wishnie, M. H., and G. Socha. 2003. Watershed management in the Pacific Slope Buffer
Zone of the La Amistad Biosphere Reserve, Costa Rica. Journal of Sustainable Forestry
16:65-102.
WWF. 2006. A Vision for Biodiversity Conservation in Central Africa: Biological Priorities
for Conservation in the Guinean-Congolian Forest and Freshwater Region.WWF-
US/Central African Regional Program Office, Washington, D.C., USA.

129
Table 1. Examples of conservation assessments that include targets and/or identify priority areas for terrestrial and aquatic ecosystems, arranged in chronological order.
Reserve Selection Author and date Geographic Area Terrestrial Freshwater Marine Software 1 Noss et al. 1999 Klamath-Siskiyou Ecoregion, USA x x NoneP
aP
2 TNC 2000 Middle Rockies-Blue Mountains Ecoregion, USA x x SITES
3 TNC 2001 North Coast California Ecoregion, USA x x NoneP
aP
4 Noss et al. 2002 Greater Yellowstone Ecosystem, USA x x SITES
5 TNC 2002 Chesapeake Bay Lowlands Ecoregion, USA x x x NoneP
bP
6 Cowling et al. 2003 Cape Floristic Province, South Africa x x C-PLAN
8 TNC 2003a Cook Inlet Basin Ecoregion, USA x x x SITES
7 TNC 2003a West Gulf Coastal Plain Ecoregion, USA x x NoneP
bP
9 Weitzell et al. 2003 Upper Mississippi River Basin, USA x x NoneP
bP
10 Floberg et al. 2004 Willamette Valley-Puget Trough- x x x SITES
Georgia Basin Ecoregion, North America
11 Marshall et al. 2004 Apache Highlands Ecoregion, USA x x SITES
12 TNC 2004 Federated States of Micronesia x x x NoneP
bP
13 WWF 2006 Guinean-Congolian Region, Africa x x NoneP
bP
14 Huggins et al. 2007 Insular Caribbean x x x MARXAN
15 Schoen and Albert 2007 Southeast Alaska, USA x x MARXAN
P
aP priority areas selected based on number of targets and suitability criteria
P
bP conservation portfolio designed based on expert opinion
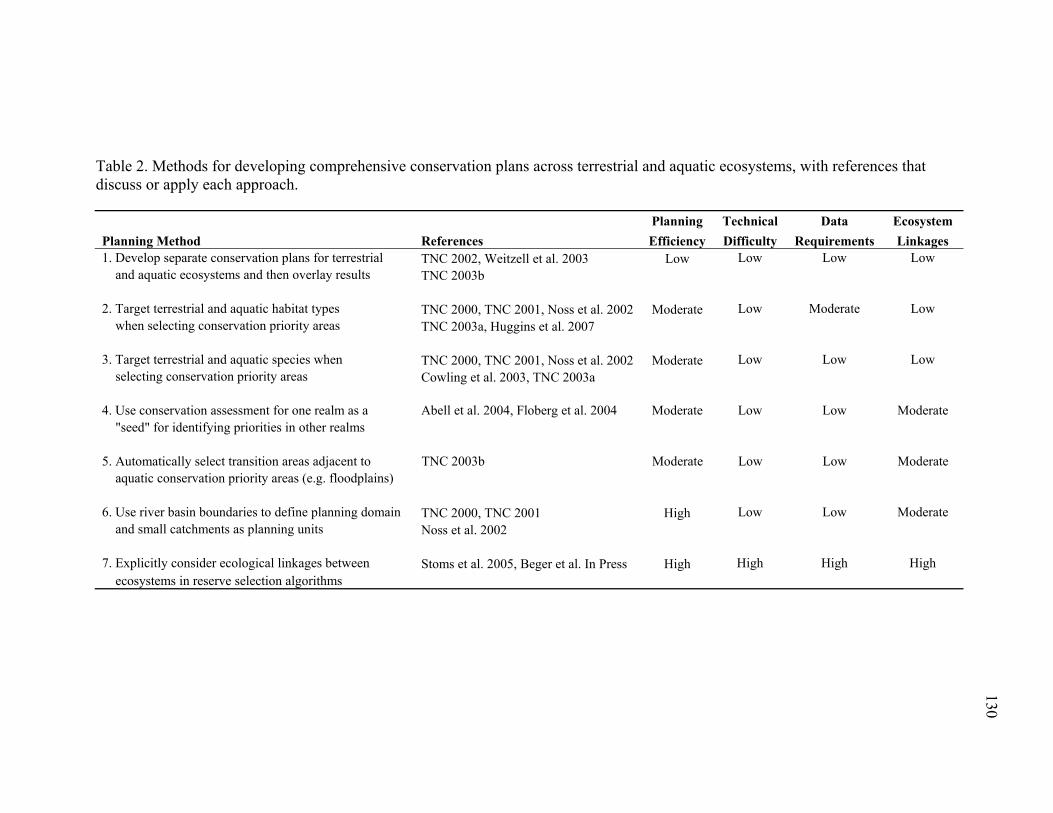
130
Table 2. Methods for developing comprehensive conservation plans across terrestrial and aquatic ecosystems, with references that discuss or apply each approach. Planning Technical Data Ecosystem Planning Method References Efficiency Difficulty Requirements Linkages 1. Develop separate conservation plans for terrestrial TNC 2002, Weitzell et al. 2003 Low Low Low Low and aquatic ecosystems and then overlay results TNC 2003b 2. Target terrestrial and aquatic habitat types TNC 2000, TNC 2001, Noss et al. 2002 Moderate Low Moderate Low when selecting conservation priority areas TNC 2003a, Huggins et al. 2007 3. Target terrestrial and aquatic species when TNC 2000, TNC 2001, Noss et al. 2002 Moderate Low Low Low selecting conservation priority areas Cowling et al. 2003, TNC 2003a 4. Use conservation assessment for one realm as a Abell et al. 2004, Floberg et al. 2004 Moderate Low Low Moderate "seed" for identifying priorities in other realms 5. Automatically select transition areas adjacent to TNC 2003b Moderate Low Low Moderate aquatic conservation priority areas (e.g. floodplains) 6. Use river basin boundaries to define planning domain TNC 2000, TNC 2001 High Low Low Moderate and small catchments as planning units Noss et al. 2002 7. Explicitly consider ecological linkages between Stoms et al. 2005, Beger et al. In Press High High High High ecosystems in reserve selection algorithms

131
Figure 1. Examples of biotic and abiotic linkages among terrestrial, freshwater, and marine ecosystems.
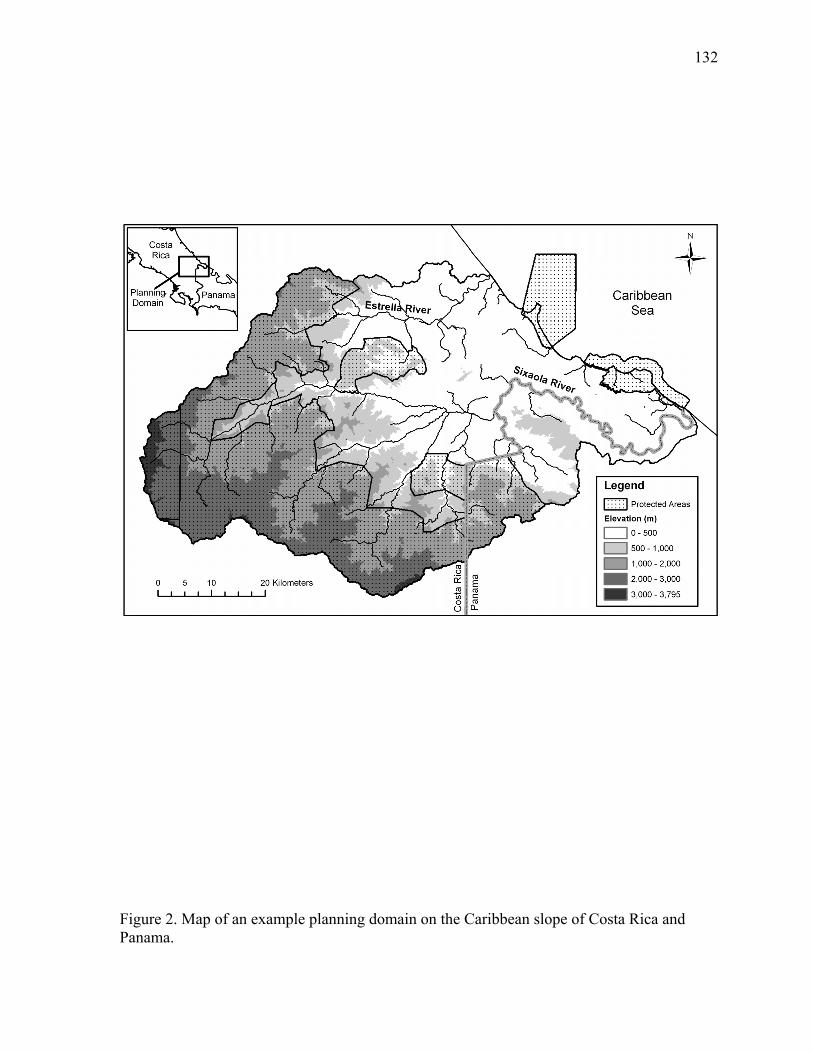
132
Figure 2. Map of an example planning domain on the Caribbean slope of Costa Rica and Panama.
Recommended