1
Effectiveness of treatment approaches for children and adolescents with reading disabilities:
A meta-analysis of randomized controlled trials
Katharina Galuschka1, Elena Ise2, Kathrin Krick1, and Gerd Schulte-Körne1*
1 Department of Child and Adolescent Psychiatry and Psychotherapy, University of Munich,
Munich, Germany
2 Department of Child and Adolescent Psychiatry and Psychotherapy, University of Cologne,
Cologne, Germany
*E-mail: [email protected]
2
Abstract
Children and adolescents with reading disabilities experience a significant impairment
in the acquisition of reading and spelling skills. Given the emotional and academic conse-
quences for children with persistent reading disorders, evidence-based interventions are criti-
cally needed. The present meta-analysis extracts the results of all available randomized
controlled trials. The aims were to determine the effectiveness of different treatment ap-
proaches and the impact of various factors on the efficacy of interventions.
The literature search for published randomized-controlled trials comprised an electronic
search in the databases ERIC, PsycINFO, PubMed, and Cochrane, and an examination of bib-
liographical references. To check for unpublished trials, we searched the websites clinicaltri-
als.com and ProQuest, and contacted experts in the field.
Twenty-two randomized controlled trials with a total of 49 comparisons of experimental
and control groups could be included. The comparisons evaluated five reading fluency train-
ings, three phonemic awareness instructions, three reading comprehension trainings, 29 phon-
ics instructions, three auditory trainings, two medical treatments, and four interventions with
coloured overlays or lenses. One trial evaluated the effectiveness of sunflower therapy and
another investigated the effectiveness of motor exercises.
The results revealed that phonics instruction is not only the most frequently investigated
treatment approach, but also the only approach whose efficacy on reading and spelling per-
formance in children and adolescents with reading disabilities is statistically confirmed. The
mean effect sizes of the remaining treatment approaches did not reach statistical significance.
The present meta-analysis demonstrates that severe reading and spelling difficulties can
be ameliorated with appropriate treatment. In order to be better able to provide evidence-
based interventions to children and adolescent with reading disabilities, research should inten-
sify the application of blinded randomized controlled trials.
Keywords: dyslexia, reading disability, intervention, treatment approach, systematic review,
meta-analysis
3
Introduction
Children, adolescents, and adults with reading disability (dyslexia) experience a signifi-
cant impairment in the acquisition of reading accuracy, reading fluency, reading comprehen-
sion, and spelling skills, which cannot be accounted for by low IQ, visual acuity problems,
neurological damage, or poor educational opportunities [1]. Reading disability has genetic
basis [2] and the underlying neurobiological and cognitive causes are largely debated. Im-
pairments in auditory speech perception and processing, as well as visual attention and per-
ception deficits are considered as the main causes of reading and spelling difficulties in
dyslexia [3-5]. Reading and spelling deficits influence an individual’s performance in most
academic domains [1]. In addition, there is strong evidence of a link between reading disabili-
ties and externalizing disorders, generalized anxiety, and school-related anxiety [6,7].
The evidence-based development and the evaluation of interventions for children and
adolescents with reading disabilities are, therefore, of particularly profound importance. A
large number of interventions and therapies, derived from various treatment approaches, have
been constructed and evaluated. Several systematic reviews have already summarized the
findings of studies that evaluated the effectiveness of reading and spelling interventions. One
of the most influential reviews of the research literature was conducted by the National Read-
ing Panel (NRP) in the year 2000 [8]. The review displays important results about the effec-
tiveness of different types of reading instruction. Its main finding was that systematic
instruction in learning letter sound relations and in blending sounds to form words is most
effective for improving reading and spelling skills in disabled readers [8]. Despite the im-
portance of this finding, 13 years after its publication, the NRP review needs to be updated in
order to integrate recent empirical findings.
However, most current systematic reviews are focused on the effectiveness of one spe-
cific treatment approach [9-11]. Other reviews address preventive methods for children at-risk
for reading disability [12,13]. Since there is no widespread use of randomized-controlled trials
(RCTs) in this research domain, current systematic reviews and meta-analyses often included
not only RCTs, but also low-quality primary research (e.g., non-randomized research designs)
[14-16]. To our best knowledge, no systematic review has been published to date that includes
all available RCTs, without focusing on a specific treatment approach, and that integrates the
results quantitatively with statistical methods.
4
The present meta-analysis has two advantages over previously published work. First,
due to the inclusion of exclusively RCTs, the observed effect sizes can most likely be attribut-
ed to the intervention. Second, because all available RCTs are integrated, it is possible to
compare the effectiveness of different treatment approaches.
The goal of this meta-analysis is twofold. The first aim is to determine the efficacy of
different treatment approaches on reading and spelling performance of reading disabled chil-
dren and adolescents. The second aim is to explore the impact of various factors on the effica-
cy of these treatment approaches.
Method
Literature Search
An extensive literature search was conducted. We searched for intervention studies that
were published until June 2013 in the databases ERIC, PsycINFO, PubMed, and Cochrane
with the following search terms: “dyslexia” or “developmental reading disorder” or “devel-
opmental dyslexia” or ”developmental reading disability” or “reading disorder” or “word
blindness” or “spelling disorder” or “developmental spelling disorder” or “specific spelling
disorder” combined with “intervention” or “treatment” or “therapy” or “therapeutics” or
“training” or “remediation“.
We also examined bibliographical references of systematic reviews and primary studies.
To check for unpublished RCTs, we searched the websites clinicaltrials.com and ProQuest. In
addition, we contacted experts by sending an e-mail to each member of the mailing list of the
Society for the Scientific Studies of Reading (SSSR).
Study selection criteria
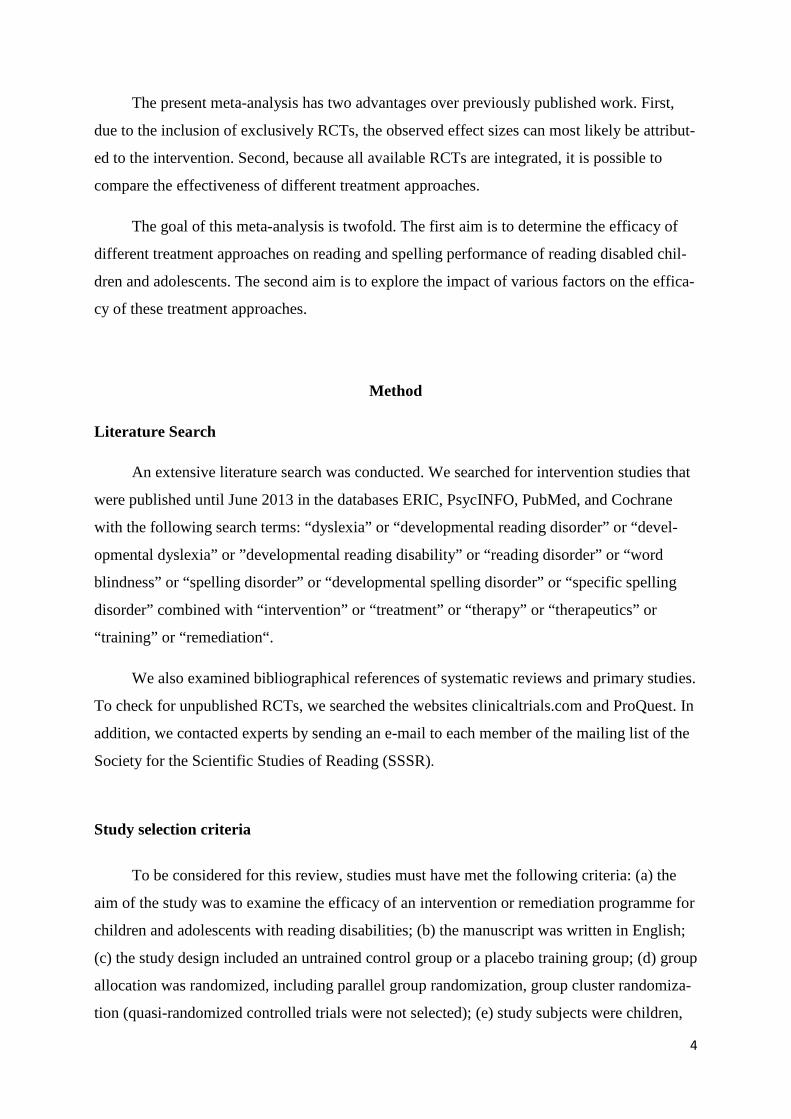
To be considered for this review, studies must have met the following criteria: (a) the
aim of the study was to examine the efficacy of an intervention or remediation programme for
children and adolescents with reading disabilities; (b) the manuscript was written in English;
(c) the study design included an untrained control group or a placebo training group; (d) group
allocation was randomized, including parallel group randomization, group cluster randomiza-
tion (quasi-randomized controlled trials were not selected); (e) study subjects were children,
5
adolescents or adults (no studies with adults could be included) whose reading performance
was below the 25 th percentile or at least one standard deviation (SD), one year, or one grade
below the expected level; (f) the study included subjects with intelligence in the normal range
(IQ ≥ 85, or described as having normal intelligence by the study author); (g) poor reading
occured in mother tongue; (h) one or more reading or spelling tests were administered before
and after treatment; and (i) pre- and post-test results of the reading or spelling tests were re-
ported with sufficient detail to allow the calculation of an effect size or could be requested
from the authors. Figure 1 summarizes the process of selecting studies for the meta-analysis.
Figure 1. Flow chart of study selection process.
6
Coding of the RCTs
Coding was done independently by the first author and an associate using a structured
coding sheet. First, data necessary for effect size calculation (mostly means and standard de-
viations of pre- and post-tests) was extracted. Next, methodological characteristics, interven-
tion characteristics, and sample characteristics were coded.
The methodological characteristics included: (a) the dependent variable (reading speed,
reading comprehension, reading accuracy, pseudoword reading accuracy, pseudoword reading
speed, nonword reading accuracy, nonword reading speed, or spelling); (b) the sample size;
and (c) the administered reading test and spelling test. The intervention characteristics includ-
ed: (a) treatment approach; (b) spelling/writing activities included (yes or no); (c) duration of
the intervention in weeks; (d) total amount of intervention in hours; (e) setting (group, indi-
vidual, or computer); and (f) conductor (professional or nonprofessional).
Treatment approaches were classified into distinct categories based on the description of
the intervention in the report. The categories closely match the topic areas of the NRP review
[8]. The category phonemic awareness instruction includes interventions that foster the ability
to recognize and manipulate phonemes in words. This implies tasks for recognizing phonemes
in words, blending phonemes to words, segmenting a word into its phonemes, eliminating a
phoneme from a word, or adding a phoneme to a word. All tasks are presented and performed
orally. The category phonics instruction includes interventions that systematically teach letter-
sound-correspondences and decoding strategies that involve blending or segmenting individu-
al letters or phonemes or dividing a spoken or written word into syllables or onset and rimes.
These interventions comprise reading and writing activities. The category reading fluency
training includes interventions that contain repeated oral word reading practice or guided re-
peated word reading. These interventions aim to improve word recognition skills. The catego-
ry reading comprehension training includes interventions that comprise tasks in which
participants learn to extract textual information, summarize it, and relate it to existing
knowledge. The category auditory training includes interventions in which subjects are con-
fronted with non-linguistic auditory stimuli and are trained to identify and distinguish these
stimuli. The category medical treatment includes interventions in which participants receive
drugs to enhance their reading and spelling performance. The category coloured overlays in-
cludes interventions in which study subjects read with coloured filters or coloured overlays.
7
Finally, sample characteristics were coded. These included (a) age (mean and range)
and (b) severity of reading impairment. The severity of reading impairment was identified by
the inclusion criteria used in the trials and consists of three categories. The category severe
reading disability includes studies in which participants’ reading performance was at least 2
SD below the expected value, below the 2.5th percentile, at least two years below grade level,
or showed a discrepancy between chronological age and reading age of at least two years. The
category moderate reading disability includes studies in which participants’ reading perfor-
mance was at least 1 SD below the expected value, at least one year below grade level, below
the 16th percentile, or showed a discrepancy between chronological age and reading age of at
least one year. The category mild reading disability includes studies in which participants’
reading performance was below the 25th percentile.
Data extraction and effect size calculation
To evaluate the efficacy of an intervention, the effect size Hedges g was calculated by
dividing the difference between the performance scores of the control group (CG) and the
experimental group (EG) at post-test by their pooled standard deviation, and multiplying the
result by a correction factor [17,18].
Formula 1 - Hedges g
14
31
2
²)1(²)1( −−
−+−+−
= −
df
nn
snsng
CGEG
CGCGEGEG
MM CGEG
M= mean; EG= experimental group; CG = control group; n = number of study subjects; s= standard deviation; df = degrees of freedom
If studies included more than one intervention group, but only one control group, every
comparison of an intervention group with the control group was treated separately as an indi-
vidual study. As a consequence, the control group was used to compute several effect sizes
which are not independent from each other. An overweighting of the effect sizes was counter-
acted by dividing the sample size of the control group by the number of intervention groups.
Similarly, if several control groups, but only one intervention group, were included, each
8
comparison of a control group with the intervention group was treated as an individual study
and the sample size of the intervention group was divided by the number of control groups.
To reduce the risk of under- or overestimating effect sizes, some effect sizes were cor-
rected for pre-test differences. If the difference between the pre-test scores of the experi-
mental and the control group displayed an effect size equal or greater than 0.20 (g ≥ 0.20), the
post-test score of the experimental group was corrected by adding or subtracting the differ-
ence between the pre-test scores. The effect size was then calculated on the basis of the cor-
rected post-test score and the (uncorrected) pooled standard deviation. This was done because
the formula described above does not take into consideration the pre-test differences, which
leads to an over- or underestimation of the true magnitude of the effect if there are significant
differences between the groups before the start of the intervention.
A maximum of two effect sizes were calculated for each comparison of an experimental
group with a control group, one for reading performance and one for spelling performance.
The following measures of reading performance were considered adequate for effect size cal-
culation: reading accuracy, reading speed, reading comprehension, nonword reading speed,
nonword reading accuracy, pseudoword reading speed or pseudoword reading accuracy. To
determine spelling performance, tests measuring spelling accuracy were considered adequate.
Some studies used multiple reading and spelling tests to determine treatment efficacy,
including standardized measures and non-standardized measures of learning transfer, as well
as non-standardized measures whose tasks closely matched the training content. Effect sizes
were calculated based on standardized measures, which are generally considered to be
measures of learning transfer, if these were available. If standardized measures were not
available, non-standardized measures of learning transfer were used for effect size calculation
(n = 3 studies). Self-constructed measures that matched the training content were not used for
effect size calculation, because these measures may not generalize to material not specifically
taught. Thus, all effect sizes are based on measures of learning transfer. If a study reported
results for several comparable tests (e.g., several standardized tests measuring different as-
pects of reading such as reading speed and comprehension), an average effect size was calcu-
lated from the effect sizes for individual tests, separately for reading and spelling
performance.
9
Non-standardized dependent measures are suspected to overestimate the true magnitude
of an effect [14,19]. Although all effect sizes are based on measures of learning transfer, it
cannot be ruled out completely that the inclusion of studies without standardized measures
introduced an artifact. For this reason, the main analyses were run with and without studies
that used non-standardized measures. First, the analyses were conducted with all studies that
met the inclusion criteria outlined above (i.e. studies with standardized or non-standardized
measures; n = 22 studies; see Table 1). Second, the analyses were run with those studies that
included standardized measures (n = 19 studies).
For studies that did not report means and standard deviations, effect sizes were calculat-
ed on the basis of other measures, for example t-test or F-test values. If a study did not report
sufficient data, more information was requested from the corresponding author. If this request
failed, co-authors were contacted.
Quality assessment
The methodological quality of the included studies was assessed independently by the
first author and an associate with the checklist for randomized controlled trials by the Scottish
Intercollegiate Guidelines Network. To assess selection bias, it was determined if an adequate
concealment method was used. Centralised allocation, computerised allocation systems, and
the use of opaque envelopes were regarded as adequate methods of concealment. To assess
performance / detection bias, it was determined if the study was blinded. Blinding of the par-
ticipants and therapists is difficult to ensure in cognitive treatment trials. Therefore, it was
only appraised if the assessment of the outcome measures was conducted by a blinded person.
To assess reporting bias, it was determined if the data was adequately reported.
Statistical analysis
All analyses were performed using Biostat software “Comprehensive Meta Analysis
Version 2.2.064” [20]. Because of substantial differences between the treatment approaches
that were evaluated in the included studies, there is no reason to assume that all studies share
10
an identical true effect size. Consequently, a random effects model was used for the meta-
analysis.
Results
Of the randomized-controlled trials that were identified by the literature search, only 22
met all inclusion criteria and could be included in the meta-analysis. Interrater-agreement for
article inclusion or exclusion exceeded κ = 0.786. All discrepancies were resolved by discus-
sion. Coding reliabilities (percentage of interrater-agreement) for study characteristics and
data extraction averaged 87%. Again, all discrepancies were disputed and solved.
Specifications regarding the methodological quality of the included trials were often in-
complete. A sufficient description of the allocation concealment was missing in each of the 22
trials. Sixteen trials did not specify if the dependent variables were assessed by a blinded per-
son [21-36]. Two trials [37,38] stated explicitly that the outcome measures were assessed by a
person that was aware of the study subjects’ affiliation. Four studies [39-42] performed a
blind assessment of treatment outcomes. It can therefore be concluded that most studies are at
risk of having a bias. Data was considered as adequately reported in all of the included trials.
One trial had to be excluded from the analysis due to lack of information regarding outcome
data. Attempts to contact the authors failed.
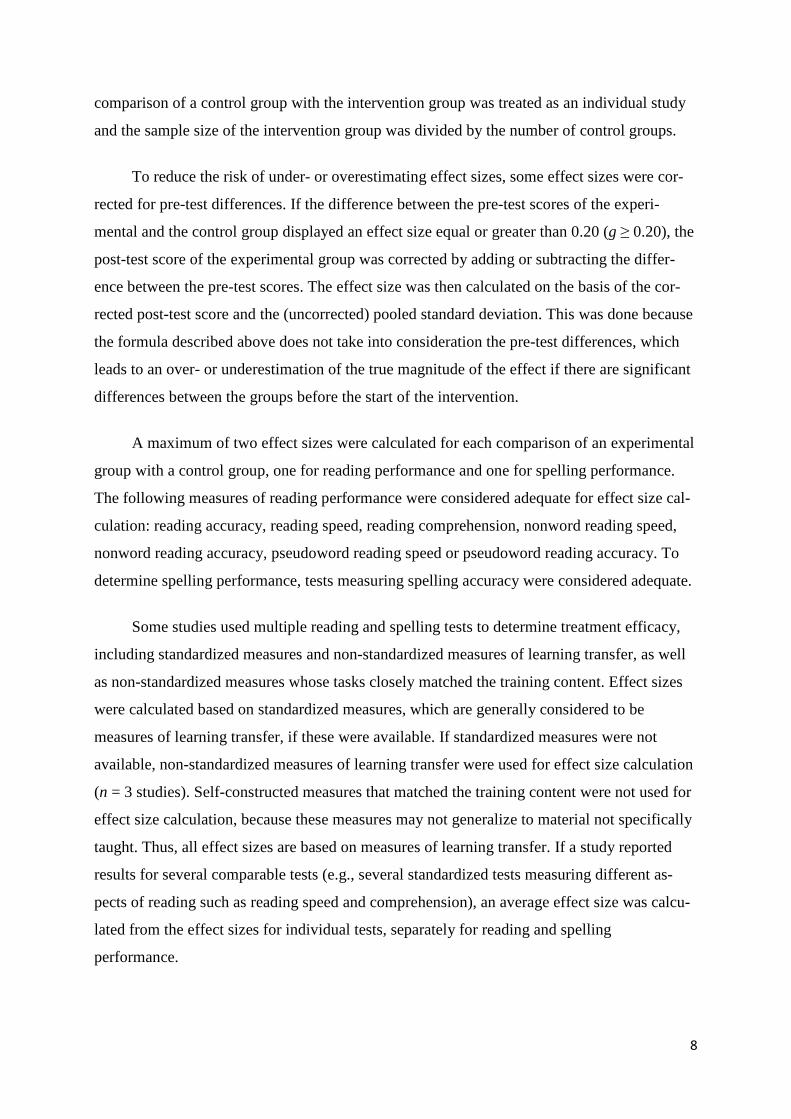
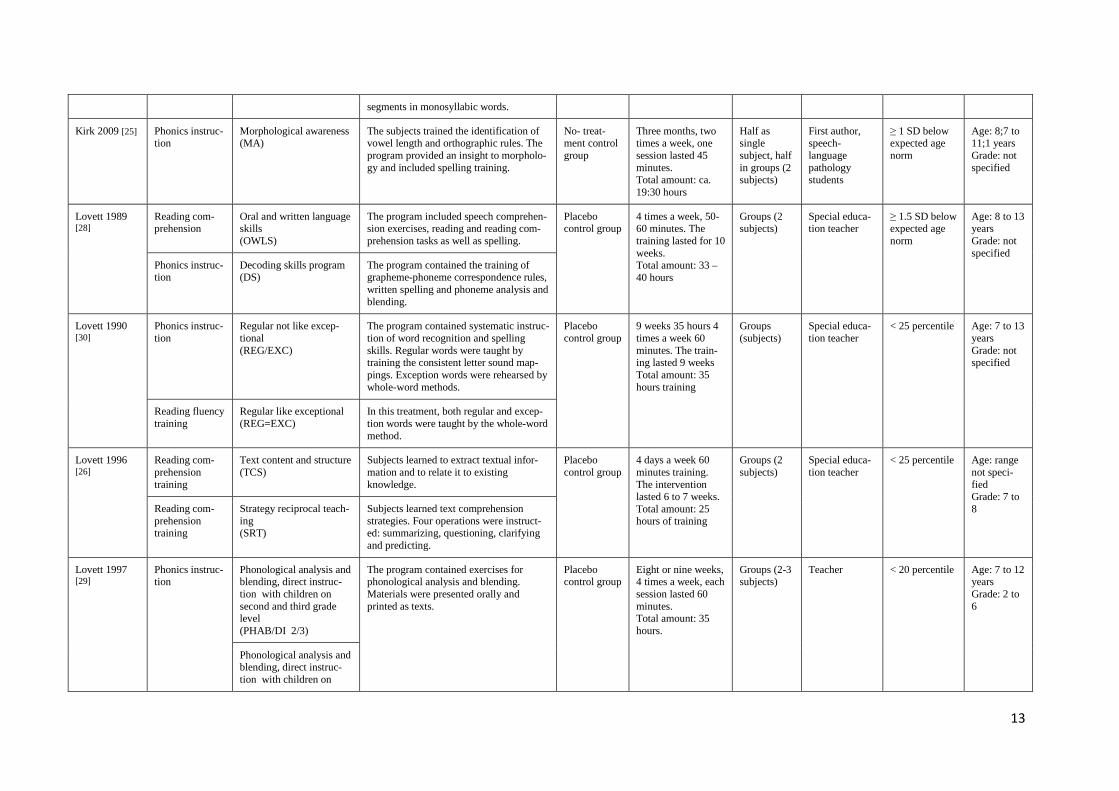
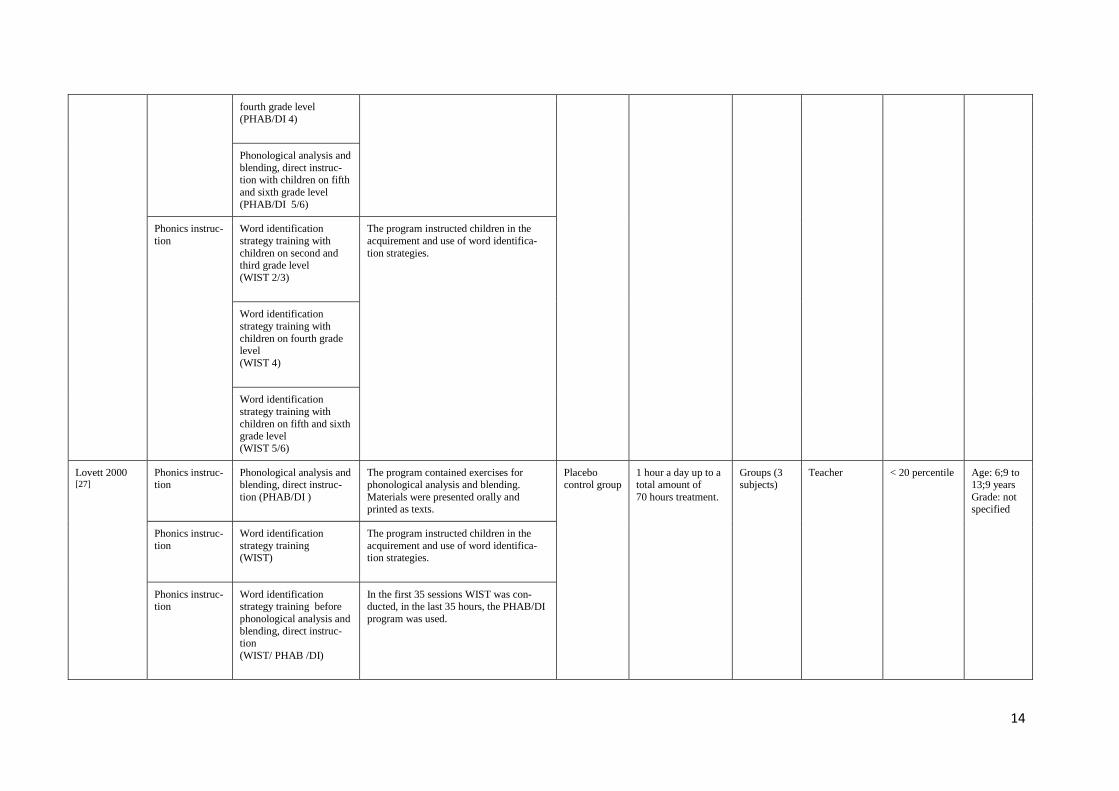
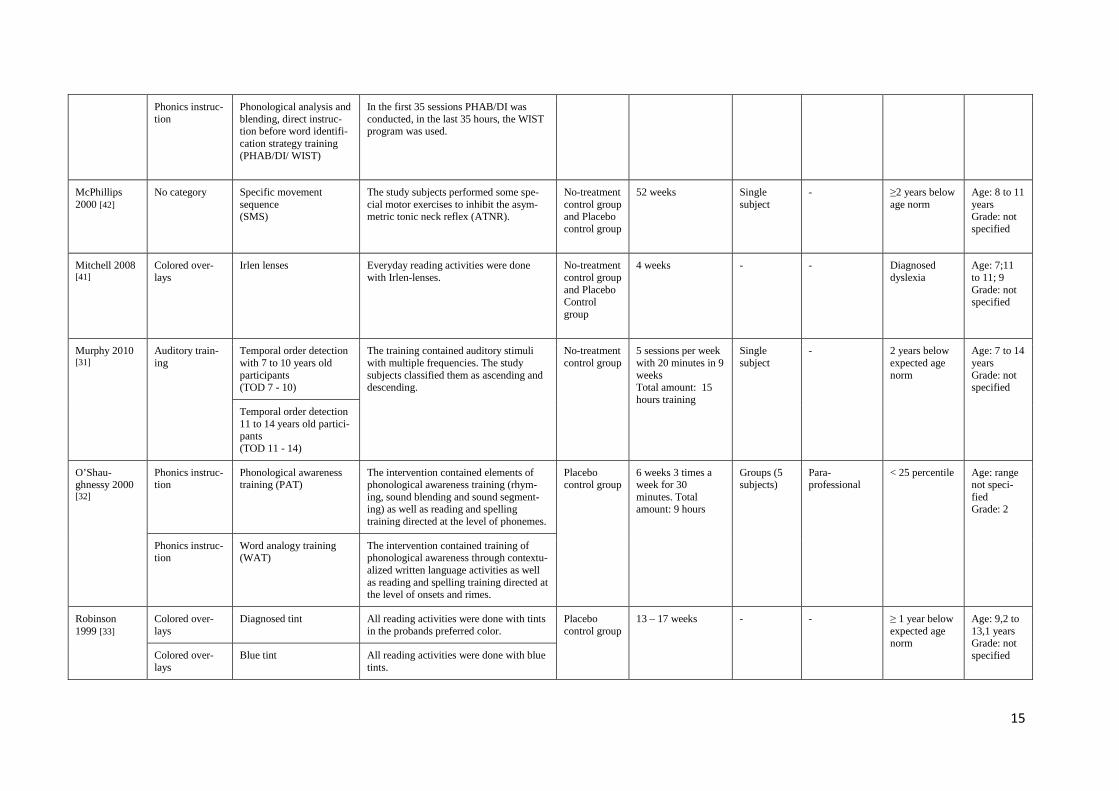
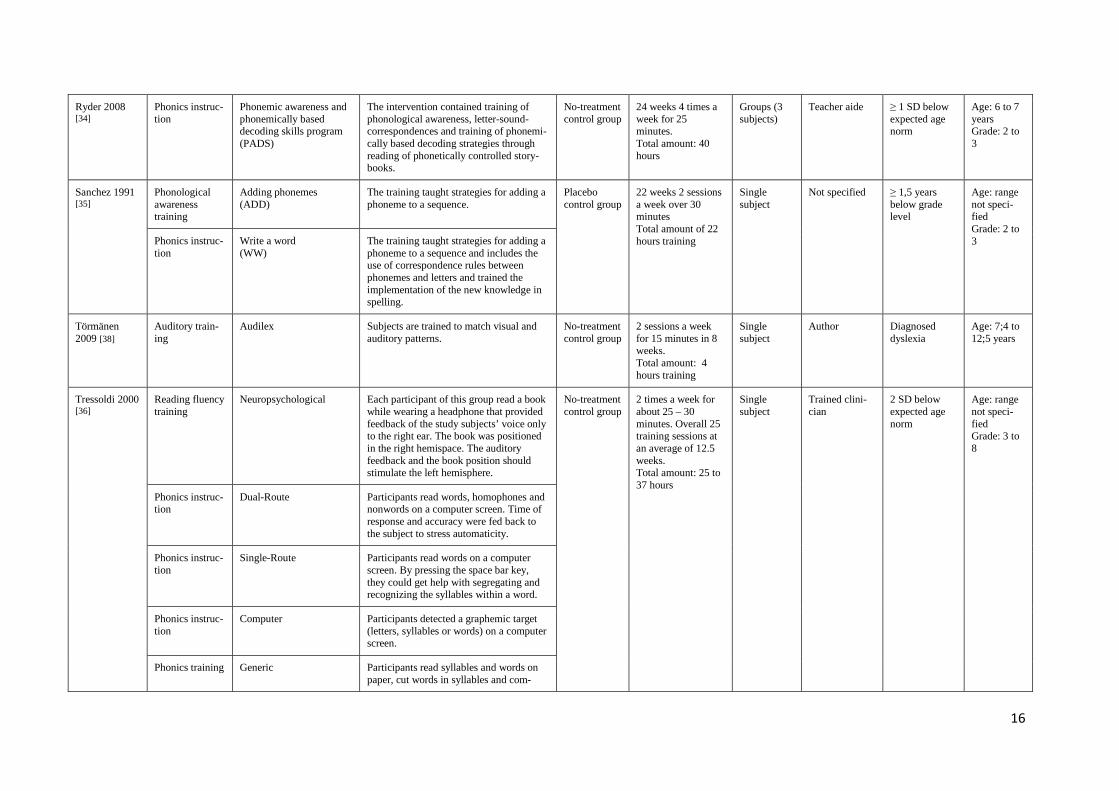
Table S1 presents an overview of the trials that are included in the meta-analysis. Thir-
teen of the 22 trials included more than one intervention group, and two trials included more
than one control group. Therefore, the meta-analysis was computed with a total of 49 compar-
isons of an experimental and a control group. These comparisons comprised 1138 participants
in the experimental groups and 764 participants in the control groups.

11
Table S1. Study characteristics.
First author and year of publication
Approach Experimental group Content Control condition
Amount Setting Conductor Inclusion criteria: reading
Age/Grade
Bhattacharya 2004 [37]
Phonics instruc-tion
Syllable low
Children with a reading score on third grade level practiced reading of a total of 100 words (25 per session). The words were orally divided in syllables with supporting hand signals.
No- treat-ment control group
Four days within a week, one session lasted 30 minutes. Total amount: 2 hours
Single subject
Research team ≥ 1 year below age norm
Age: range not speci-fied Grade: 6 to 10
Phonics instruc-tion
Syllable high
Children with a reading score on fourth or fifth grade level practiced reading of a total of 100 words (25 per session). The words were orally divided in syllables with supporting hand signals.
Reading fluency training
Word low
Children with a reading score on third grade level practiced reading of a total of 100 words (25 per session) by reading them as whole words rather than in parts.
Reading fluency training
Word high
Children with a reading score on fourth or fifth grade level practiced reading of a total of 100 words (25 per session) by reading them as whole words rather than in parts.
Bull 2007 [21] No category Sunflower
The therapy combined homeopathy, acupressure, osteopathy and kinesiology to address the study subjects’ personal, neurological and motivational deficits.
No- treat-ment control group
Eight appointments, one session lasted 40 minutes. Total amount: 5:20 hours
Single subject
Sunflower practitioner
Diagnosed dyslexia by an educational psychologist
Age: 6 to 13 years Grade: not specified
del Rosario Ortiz Gonzáles 2002 [22]
Phonological awareness training
Speech perception, sound-symbol correspondence and phonemic awareness (SP/LPA)
The program contained a systematic instruction in letter-sound correspondence and phonemic awareness as well as speech perception. All tasks were presented and performed orally.
No- treat-ment control group
Four weeks, five times a week, one session lasted 20 minutes. Total amount: 6:30 hours
Groups with 4 subjects
Postgraduate student
≤ 15 percentile Age: 9;0 to 11;0 years Grade: not specified
Phonological awareness training
Sound-symbol corre-spondence and phonemic awareness (LPA)
The program contained a systematic instruction in letter-sound correspondence and phonemic awareness. All tasks were presented and performed orally.
Heikkila 2013 Phonics instruc- 2-letter frequent Study subjects practiced 30 2-letter fre- Placebo Ten sessions in two Single Teacher ≥ 1 SD below Age: 8;3 to
12
[23] tion quent syllables, and repeated each of them 50 times. During training, participants heard an auditory stimulus via headphones and chose the corresponding syllable as quickly as possible from five written options on the computer screen. They received feedback according to the speed of accurate responses.
control group or three weeks, one session lasted five to ten minutes. Total amount: ca. 1:30 hours
subject expected level 11;3 Grade: not specified
Phonics instruc-tion
4-letter frequent Study subjects practiced 30 4-letter fre-quent syllables, and repeated each of them 50 times. During training, participants heard an auditory stimulus via headphones and chose the corresponding syllable as quickly as possible from five written options on the computer screen. They received feedback according to the speed of accurate responses.
Phonics instruc-tion
4-letter infrequent Study subjects practiced 30 4-letter infre-quent syllables, and repeated each of them 50 times. During training, participants heard an auditory stimulus via headphones and chose the corresponding syllable as quickly as possible from five written options on the computer screen. They received feedback according to the speed of accurate responses.
DiIanni 1985 [39]
Medical Treat-ment
Piracetam The subjects received a daily dose of 3.3g Piracetam
Placebo control group
Twelve weeks; 3.3 g per day
- - RQ ≤ .85 Age: 8;0 to 13;11 Grade: not specified
Jimenéz 2007 [24]
Phonics instruc-tion
Phoneme Words were presented on a computer screen. Children read these words pho-neme by phoneme.
No- treat-ment control group
Three weeks, five times a week, one session lasted 30 to 40 minutes. Total amount: 8:45 hours.
Single subject
Psychologist < 25 percentile Age: 7;1 to 10;6 Grade: not specified
Phonics instruc-tion
Syllable Words were presented on a computer screen. Children read these words syllable by syllable.
Reading fluency training
Whole-word Words were presented on a computer screen. Children read these words as a whole.
Phonics instruc-tion
Onset-rime Words were presented on a computer screen. Children read onset and rime
13
segments in monosyllabic words.
Kirk 2009 [25] Phonics instruc-tion
Morphological awareness (MA)
The subjects trained the identification of vowel length and orthographic rules. The program provided an insight to morpholo-gy and included spelling training.
No- treat-ment control group
Three months, two times a week, one session lasted 45 minutes. Total amount: ca. 19:30 hours
Half as single subject, half in groups (2 subjects)
First author, speech-language pathology students
≥ 1 SD below expected age norm
Age: 8;7 to 11;1 years Grade: not specified
Lovett 1989 [28]
Reading com-prehension
Oral and written language skills (OWLS)
The program included speech comprehen-sion exercises, reading and reading com-prehension tasks as well as spelling.
Placebo control group
4 times a week, 50- 60 minutes. The training lasted for 10 weeks. Total amount: 33 – 40 hours
Groups (2 subjects)
Special educa-tion teacher
≥ 1.5 SD below expected age norm
Age: 8 to 13 years Grade: not specified Phonics instruc-
tion Decoding skills program (DS)
The program contained the training of grapheme-phoneme correspondence rules, written spelling and phoneme analysis and blending.
Lovett 1990 [30]
Phonics instruc-tion
Regular not like excep-tional (REG/EXC)
The program contained systematic instruc-tion of word recognition and spelling skills. Regular words were taught by training the consistent letter sound map-pings. Exception words were rehearsed by whole-word methods.
Placebo control group
9 weeks 35 hours 4 times a week 60 minutes. The train-ing lasted 9 weeks Total amount: 35 hours training
Groups (subjects)
Special educa-tion teacher
< 25 percentile Age: 7 to 13 years Grade: not specified
Reading fluency training
Regular like exceptional (REG=EXC)
In this treatment, both regular and excep-tion words were taught by the whole-word method.
Lovett 1996 [26]
Reading com-prehension training
Text content and structure (TCS)
Subjects learned to extract textual infor-mation and to relate it to existing knowledge.
Placebo control group
4 days a week 60 minutes training. The intervention lasted 6 to 7 weeks. Total amount: 25 hours of training
Groups (2 subjects)
Special educa-tion teacher
< 25 percentile Age: range not speci-fied Grade: 7 to 8
Reading com-prehension training
Strategy reciprocal teach-ing (SRT)
Subjects learned text comprehension strategies. Four operations were instruct-ed: summarizing, questioning, clarifying and predicting.
Lovett 1997 [29]
Phonics instruc-tion
Phonological analysis and blending, direct instruc-tion with children on second and third grade level (PHAB/DI 2/3)
The program contained exercises for phonological analysis and blending. Materials were presented orally and printed as texts.
Placebo control group
Eight or nine weeks, 4 times a week, each session lasted 60 minutes. Total amount: 35 hours.
Groups (2-3 subjects)
Teacher < 20 percentile Age: 7 to 12 years Grade: 2 to 6
Phonological analysis and blending, direct instruc-tion with children on
14
fourth grade level (PHAB/DI 4)
Phonological analysis and blending, direct instruc-tion with children on fifth and sixth grade level (PHAB/DI 5/6)
Phonics instruc-tion
Word identification strategy training with children on second and third grade level (WIST 2/3)
The program instructed children in the acquirement and use of word identifica-tion strategies.
Word identification strategy training with children on fourth grade level (WIST 4)
Word identification strategy training with children on fifth and sixth grade level (WIST 5/6)
Lovett 2000 [27]
Phonics instruc-tion
Phonological analysis and blending, direct instruc-tion (PHAB/DI )
The program contained exercises for phonological analysis and blending. Materials were presented orally and printed as texts.
Placebo control group
1 hour a day up to a total amount of 70 hours treatment.
Groups (3 subjects)
Teacher < 20 percentile Age: 6;9 to 13;9 years Grade: not specified
Phonics instruc-tion
Word identification strategy training (WIST)
The program instructed children in the acquirement and use of word identifica-tion strategies.
Phonics instruc-tion
Word identification strategy training before phonological analysis and blending, direct instruc-tion (WIST/ PHAB /DI)
In the first 35 sessions WIST was con-ducted, in the last 35 hours, the PHAB/DI program was used.
15
Phonics instruc-tion
Phonological analysis and blending, direct instruc-tion before word identifi-cation strategy training (PHAB/DI/ WIST)
In the first 35 sessions PHAB/DI was conducted, in the last 35 hours, the WIST program was used.
McPhillips 2000 [42]
No category Specific movement sequence (SMS)
The study subjects performed some spe-cial motor exercises to inhibit the asym-metric tonic neck reflex (ATNR).
No-treatment control group and Placebo control group
52 weeks Single subject
- ≥2 years below age norm
Age: 8 to 11 years Grade: not specified
Mitchell 2008 [41]
Colored over-lays
Irlen lenses
Everyday reading activities were done with Irlen-lenses.
No-treatment control group and Placebo Control group
4 weeks - - Diagnosed dyslexia
Age: 7;11 to 11; 9 Grade: not specified
Murphy 2010 [31]
Auditory train-ing
Temporal order detection with 7 to 10 years old participants (TOD 7 - 10)
The training contained auditory stimuli with multiple frequencies. The study subjects classified them as ascending and descending.
No-treatment control group
5 sessions per week with 20 minutes in 9 weeks Total amount: 15 hours training
Single subject
- 2 years below expected age norm
Age: 7 to 14 years Grade: not specified
Temporal order detection 11 to 14 years old partici-pants (TOD 11 - 14)
O’Shau-ghnessy 2000 [32]
Phonics instruc-tion
Phonological awareness training (PAT)
The intervention contained elements of phonological awareness training (rhym-ing, sound blending and sound segment-ing) as well as reading and spelling training directed at the level of phonemes.
Placebo control group
6 weeks 3 times a week for 30 minutes. Total amount: 9 hours
Groups (5 subjects)
Para-professional
< 25 percentile Age: range not speci-fied Grade: 2
Phonics instruc-tion
Word analogy training (WAT)
The intervention contained training of phonological awareness through contextu-alized written language activities as well as reading and spelling training directed at the level of onsets and rimes.
Robinson 1999 [33]
Colored over-lays
Diagnosed tint All reading activities were done with tints in the probands preferred color.
Placebo control group
13 – 17 weeks - - ≥ 1 year below expected age norm
Age: 9,2 to 13,1 years Grade: not specified
Colored over-lays
Blue tint All reading activities were done with blue tints.
16
Ryder 2008 [34]
Phonics instruc-tion
Phonemic awareness and phonemically based decoding skills program (PADS)
The intervention contained training of phonological awareness, letter-sound-correspondences and training of phonemi-cally based decoding strategies through reading of phonetically controlled story-books.
No-treatment control group
24 weeks 4 times a week for 25 minutes. Total amount: 40 hours
Groups (3 subjects)
Teacher aide ≥ 1 SD below expected age norm
Age: 6 to 7 years Grade: 2 to 3
Sanchez 1991 [35]
Phonological awareness training
Adding phonemes (ADD)
The training taught strategies for adding a phoneme to a sequence.
Placebo control group
22 weeks 2 sessions a week over 30 minutes Total amount of 22 hours training
Single subject
Not specified ≥ 1,5 years below grade level
Age: range not speci-fied Grade: 2 to 3 Phonics instruc-
tion Write a word (WW)
The training taught strategies for adding a phoneme to a sequence and includes the use of correspondence rules between phonemes and letters and trained the implementation of the new knowledge in spelling.
Törmänen 2009 [38]
Auditory train-ing
Audilex Subjects are trained to match visual and auditory patterns.
No-treatment control group
2 sessions a week for 15 minutes in 8 weeks. Total amount: 4 hours training
Single subject
Author Diagnosed dyslexia
Age: 7;4 to 12;5 years
Tressoldi 2000 [36]
Reading fluency training
Neuropsychological
Each participant of this group read a book while wearing a headphone that provided feedback of the study subjects’ voice only to the right ear. The book was positioned in the right hemispace. The auditory feedback and the book position should stimulate the left hemisphere.
No-treatment control group
2 times a week for about 25 – 30 minutes. Overall 25 training sessions at an average of 12.5 weeks. Total amount: 25 to 37 hours
Single subject
Trained clini-cian
2 SD below expected age norm
Age: range not speci-fied Grade: 3 to 8
Phonics instruc-tion
Dual-Route
Participants read words, homophones and nonwords on a computer screen. Time of response and accuracy were fed back to the subject to stress automaticity.
Phonics instruc-tion
Single-Route
Participants read words on a computer screen. By pressing the space bar key, they could get help with segregating and recognizing the syllables within a word.
Phonics instruc-tion
Computer
Participants detected a graphemic target (letters, syllables or words) on a computer screen.
Phonics training Generic Participants read syllables and words on paper, cut words in syllables and com-
17
posed words using isolated syllables etc.
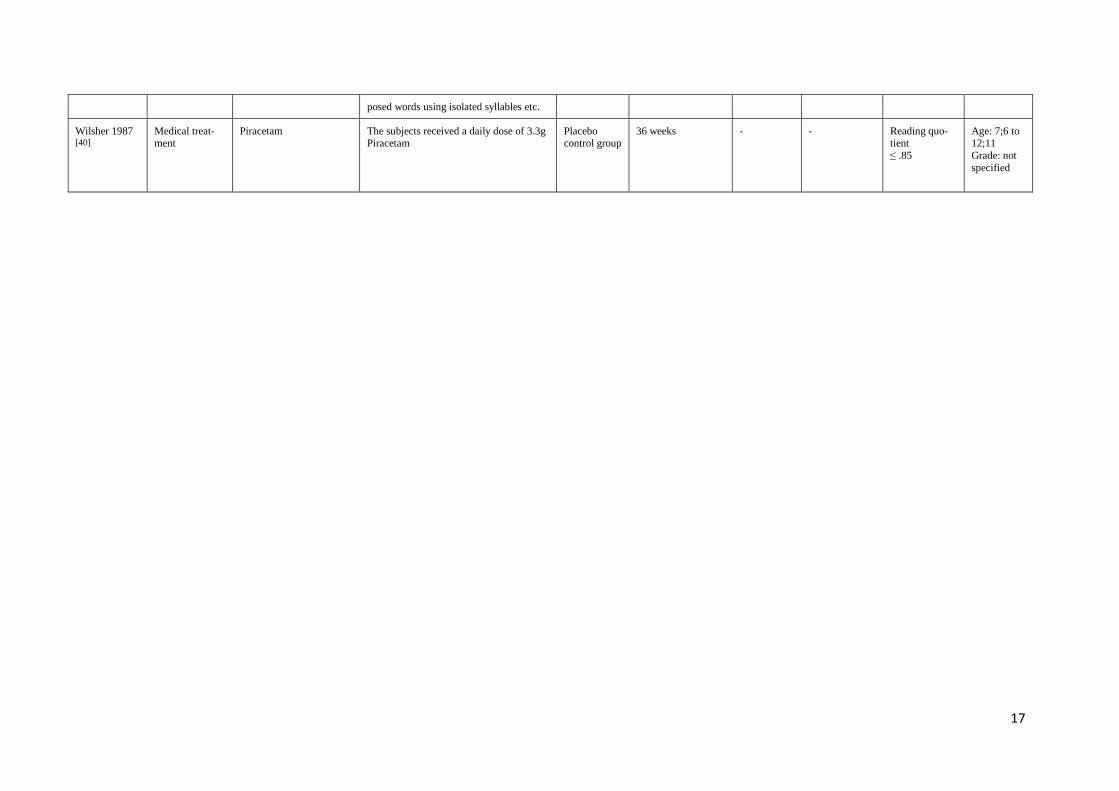
Wilsher 1987 [40]
Medical treat-ment
Piracetam
The subjects received a daily dose of 3.3g Piracetam
Placebo control group
36 weeks
- - Reading quo-tient ≤ .85
Age: 7;6 to 12;11 Grade: not specified
18
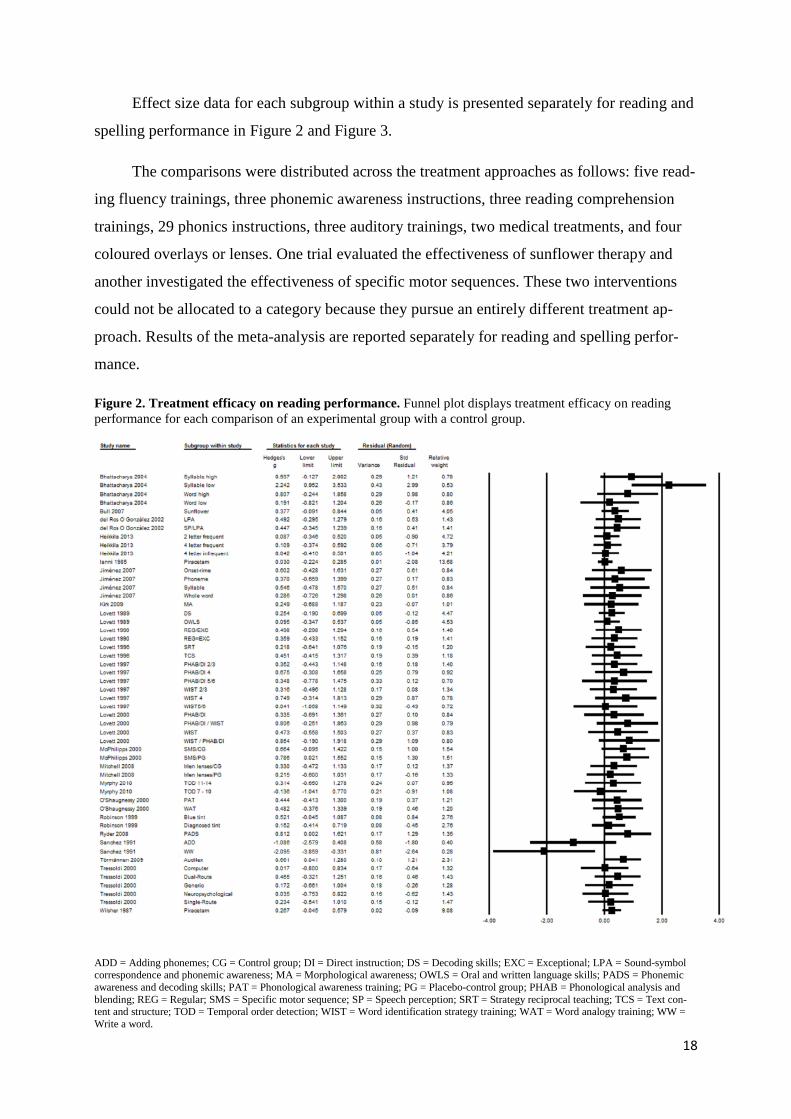
Effect size data for each subgroup within a study is presented separately for reading and
spelling performance in Figure 2 and Figure 3.
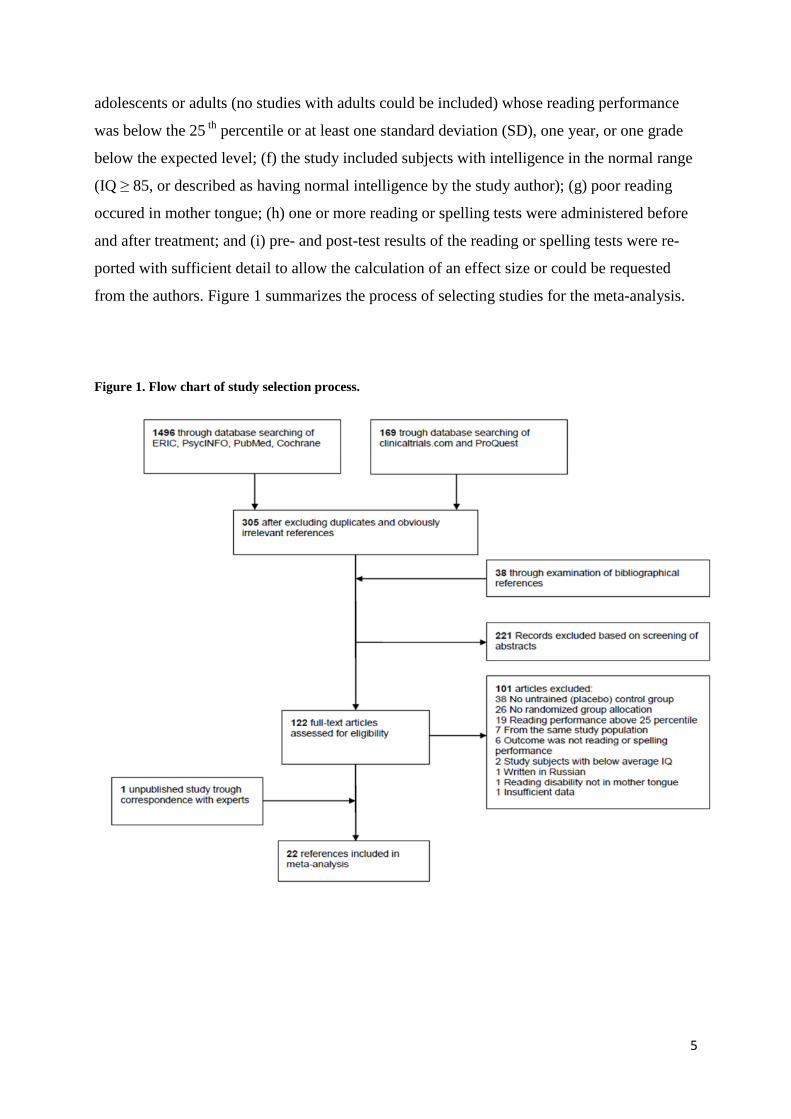
The comparisons were distributed across the treatment approaches as follows: five read-
ing fluency trainings, three phonemic awareness instructions, three reading comprehension
trainings, 29 phonics instructions, three auditory trainings, two medical treatments, and four
coloured overlays or lenses. One trial evaluated the effectiveness of sunflower therapy and
another investigated the effectiveness of specific motor sequences. These two interventions
could not be allocated to a category because they pursue an entirely different treatment ap-
proach. Results of the meta-analysis are reported separately for reading and spelling perfor-
mance.
Figure 2. Treatment efficacy on reading performance. Funnel plot displays treatment efficacy on reading performance for each comparison of an experimental group with a control group.
ADD = Adding phonemes; CG = Control group; DI = Direct instruction; DS = Decoding skills; EXC = Exceptional; LPA = Sound-symbol correspondence and phonemic awareness; MA = Morphological awareness; OWLS = Oral and written language skills; PADS = Phonemic awareness and decoding skills; PAT = Phonological awareness training; PG = Placebo-control group; PHAB = Phonological analysis and blending; REG = Regular; SMS = Specific motor sequence; SP = Speech perception; SRT = Strategy reciprocal teaching; TCS = Text con-tent and structure; TOD = Temporal order detection; WIST = Word identification strategy training; WAT = Word analogy training; WW = Write a word.
19
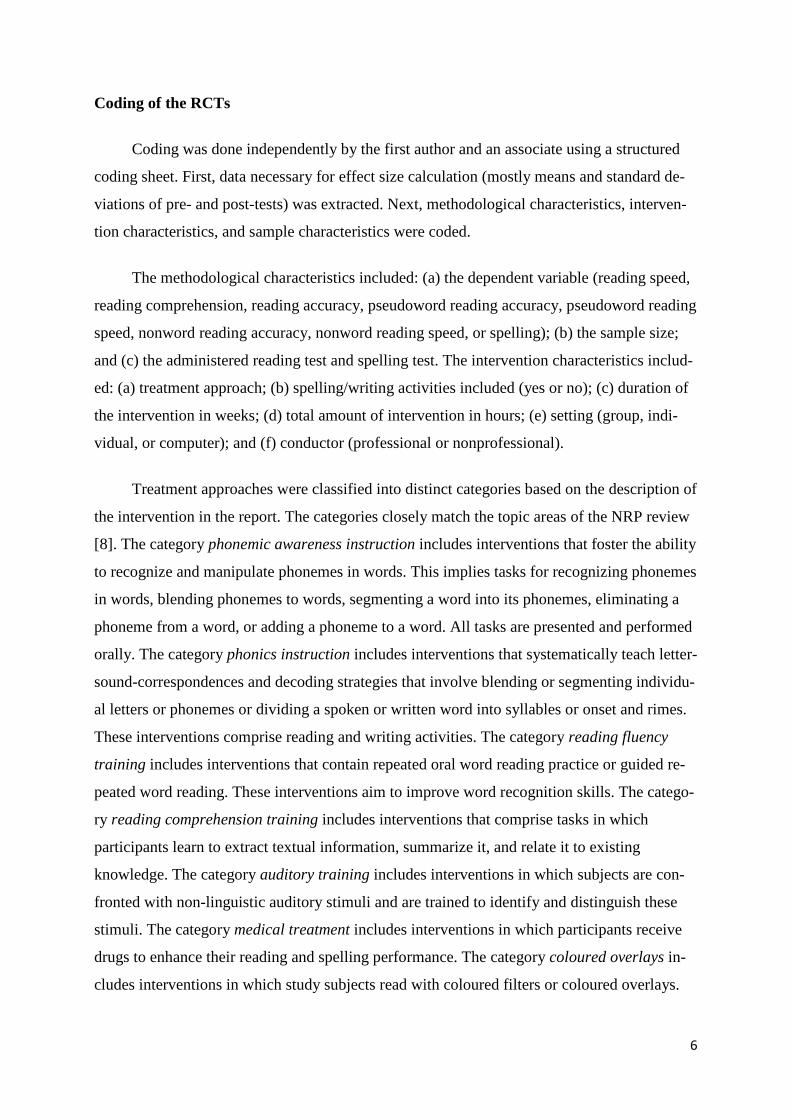
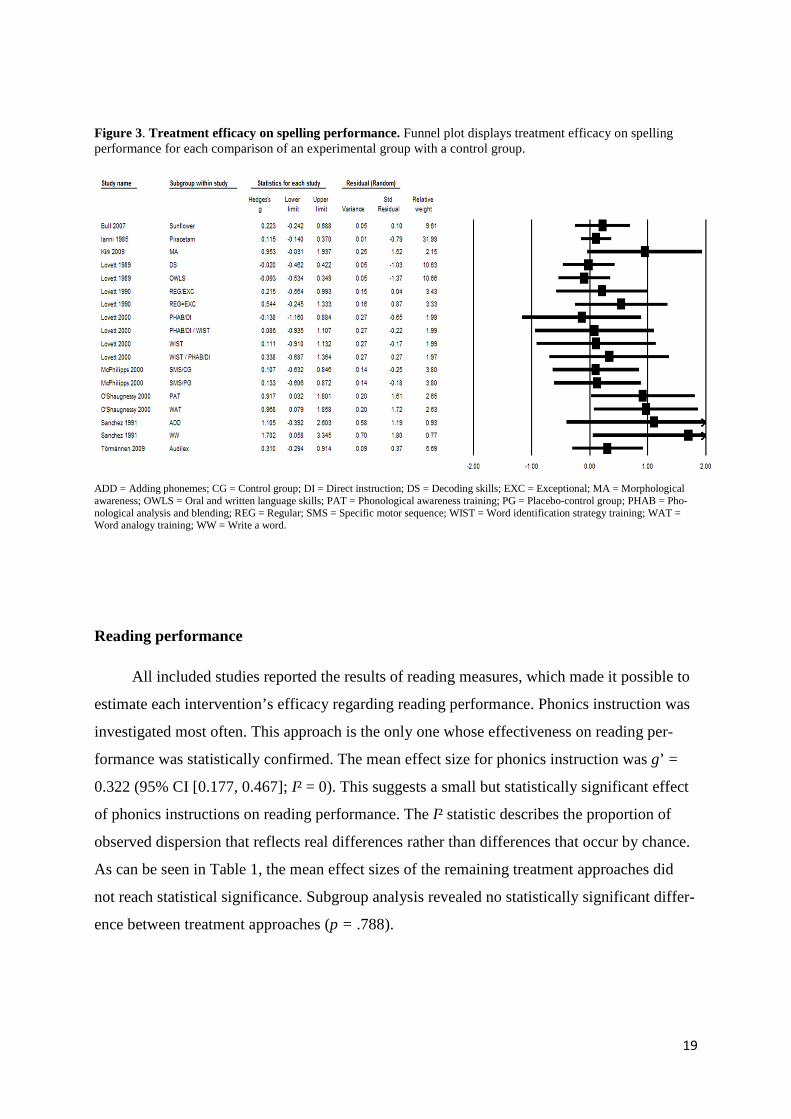
Figure 3. Treatment efficacy on spelling performance. Funnel plot displays treatment efficacy on spelling performance for each comparison of an experimental group with a control group.
ADD = Adding phonemes; CG = Control group; DI = Direct instruction; DS = Decoding skills; EXC = Exceptional; MA = Morphological awareness; OWLS = Oral and written language skills; PAT = Phonological awareness training; PG = Placebo-control group; PHAB = Pho-nological analysis and blending; REG = Regular; SMS = Specific motor sequence; WIST = Word identification strategy training; WAT = Word analogy training; WW = Write a word.
Reading performance
All included studies reported the results of reading measures, which made it possible to
estimate each intervention’s efficacy regarding reading performance. Phonics instruction was
investigated most often. This approach is the only one whose effectiveness on reading per-
formance was statistically confirmed. The mean effect size for phonics instruction was g’ =
0.322 (95% CI [0.177, 0.467]; I² = 0). This suggests a small but statistically significant effect
of phonics instructions on reading performance. The I² statistic describes the proportion of
observed dispersion that reflects real differences rather than differences that occur by chance.
As can be seen in Table 1, the mean effect sizes of the remaining treatment approaches did
not reach statistical significance. Subgroup analysis revealed no statistically significant differ-
ence between treatment approaches (p = .788).
20
In addition, subgroup analyses were conducted to explore the influence of other varia-
bles (intervention and sample characteristics) on reading improvement. Results are displayed
in Table 2. Studies that did not include or did not specify a certain variable were excluded
from the subgroup analysis in question. In addition, it was not possible to define subgroups of
age or grade level because children’s age and grade level showed considerable overlap be-
tween studies. Therefore, it was not possible to perform subgroup analyses with these varia-
bles. The analyses revealed that intervention studies with mild reading disabled children and
adolescents report a slightly higher mean effect size (g’ = 0.449; 95% CI [0.239, 0.659]; I² =
0%) compared with studies that included moderately disabled (g’ = 0.228; 95% CI [0.113,
0.342]; I² = 31%) or severe reading disabled (g’ = 0.305; 95% CI [0.033, 0.576]; I² = 0%)
study subjects. However, this difference did not reach statistical significance (p = .188).
Studies were allocated into three distinct subgroups depending on the amount of inter-
vention that was provided. No significant difference (p = .250) was found between the mean
effect size of interventions that lasted up to 14 hours (g’ = 0.351; 95% CI [0.181, 0.520]; I² =
0%), interventions that lasted between 15 hours and 34 hours (g’ = 0.113; 95% CI [-0.148,
0.374]; I² = 0%), and interventions with more than 35 hours (g’ = 0.371; 95% CI [0.172,
0.570]; I² = 0%).
To compare the effects of interventions with short- and long-term duration, the studies
were divided into two subgroups: (a) up to 12 weeks; and (b) more than 12 weeks. The cut-off
value of 12 weeks was chosen because it results in two subgroups of equal size making a sta-
tistical comparison between the two groups more appropriate. Interventions with a maximum
duration of 12 weeks showed a small mean effect size of g’ = 0.261 (95% CI [0.155, 0.368]; I²
= 0%). Interventions that lasted more than 12 weeks tended to show higher effect sizes (g’ =
0.353; [0.151, 0.554]; I² = 12%). Again, this difference did not reach statistical significance (p
= .432).
To detect the impact of the setting on the success of an intervention three subgroups
could be differentiated: (a) computer with teacher; (b) individual intervention; and (c) group
intervention. The mean effect sizes of these subgroups did not differ significantly from each
other (p = .403). The studies in the computer with teacher subgroup reached a mean effect
size of g’ = 0.364 (95% CI [0.085, 0.643]; I² = 0%), which was comparable to the mean effect
size of group interventions (g’ = 0.379; 95% CI [0.211, 0.549]; I² = 0%). Single subject inter-
ventions showed a small but significant mean effect size of g’ = 0.205 (95% CI [0.003,
0.407]; I² = 57%).
21
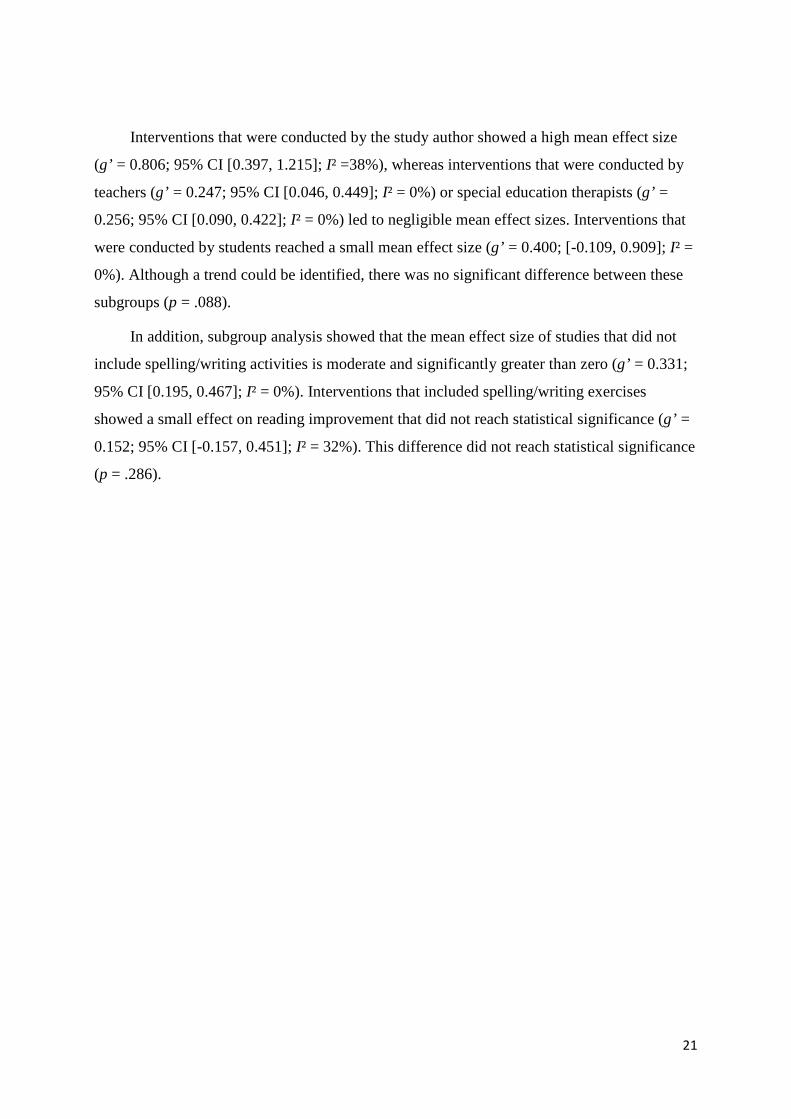
Interventions that were conducted by the study author showed a high mean effect size
(g’ = 0.806; 95% CI [0.397, 1.215]; I² =38%), whereas interventions that were conducted by
teachers (g’ = 0.247; 95% CI [0.046, 0.449]; I² = 0%) or special education therapists (g’ =
0.256; 95% CI [0.090, 0.422]; I² = 0%) led to negligible mean effect sizes. Interventions that
were conducted by students reached a small mean effect size (g’ = 0.400; [-0.109, 0.909]; I² =
0%). Although a trend could be identified, there was no significant difference between these
subgroups (p = .088).
In addition, subgroup analysis showed that the mean effect size of studies that did not
include spelling/writing activities is moderate and significantly greater than zero (g’ = 0.331;
95% CI [0.195, 0.467]; I² = 0%). Interventions that included spelling/writing exercises
showed a small effect on reading improvement that did not reach statistical significance (g’ =
0.152; 95% CI [-0.157, 0.451]; I² = 32%). This difference did not reach statistical significance
(p = .286).
22
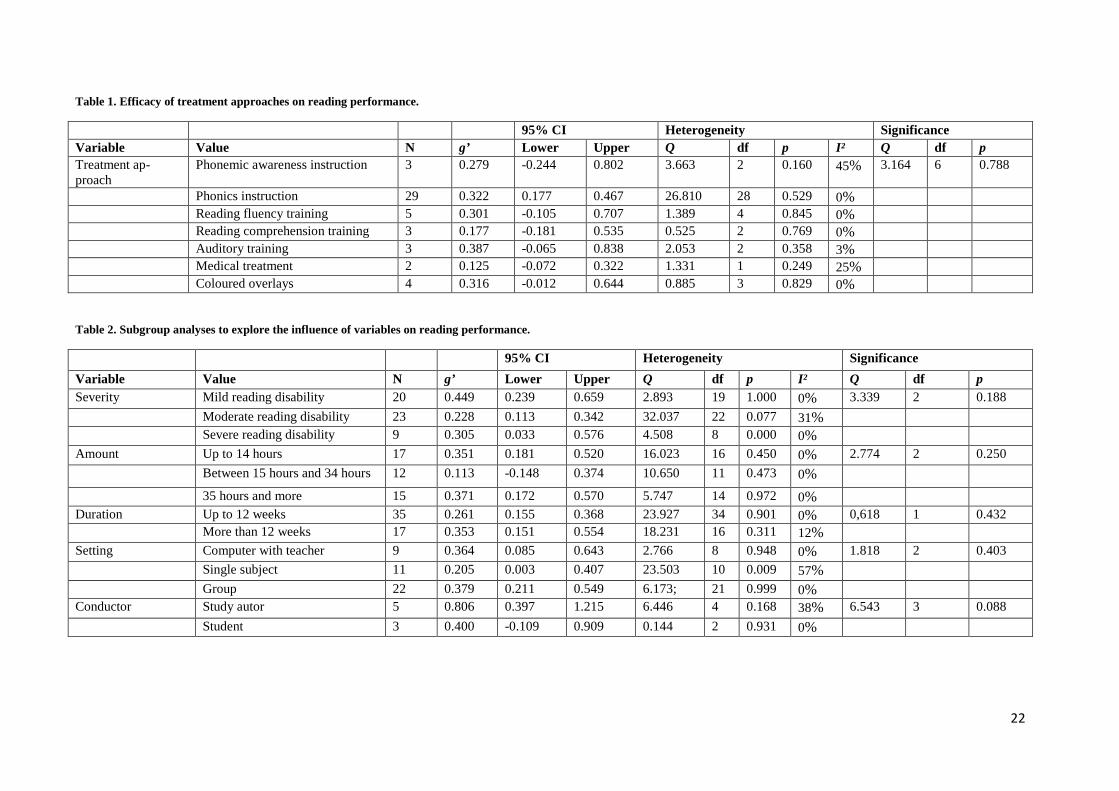
Table 1. Efficacy of treatment approaches on reading performance.
95% CI Heterogeneity Significance Variable Value N g’ Lower Upper Q df p I² Q df p Treatment ap-proach
Phonemic awareness instruction 3 0.279 -0.244 0.802 3.663 2 0.160 45% 3.164 6 0.788
Phonics instruction 29 0.322 0.177 0.467 26.810 28 0.529 0% Reading fluency training 5 0.301 -0.105 0.707 1.389 4 0.845 0% Reading comprehension training 3 0.177 -0.181 0.535 0.525 2 0.769 0% Auditory training 3 0.387 -0.065 0.838 2.053 2 0.358 3% Medical treatment 2 0.125 -0.072 0.322 1.331 1 0.249 25% Coloured overlays 4 0.316 -0.012 0.644 0.885 3 0.829 0%
Table 2. Subgroup analyses to explore the influence of variables on reading performance.
95% CI Heterogeneity Significance
Variable Value N g’ Lower Upper Q df p I² Q df p Severity Mild reading disability 20 0.449 0.239 0.659 2.893 19 1.000 0% 3.339 2 0.188
Moderate reading disability 23 0.228 0.113 0.342 32.037 22 0.077 31% Severe reading disability 9 0.305 0.033 0.576 4.508 8 0.000 0%
Amount Up to 14 hours 17 0.351 0.181 0.520 16.023 16 0.450 0% 2.774 2 0.250
Between 15 hours and 34 hours 12 0.113 -0.148 0.374 10.650 11 0.473 0%
35 hours and more 15 0.371 0.172 0.570 5.747 14 0.972 0% Duration Up to 12 weeks 35 0.261 0.155 0.368 23.927 34 0.901 0% 0,618 1 0.432 More than 12 weeks 17 0.353 0.151 0.554 18.231 16 0.311 12%
Setting Computer with teacher 9 0.364 0.085 0.643 2.766 8 0.948 0% 1.818 2 0.403
Single subject 11 0.205 0.003 0.407 23.503 10 0.009 57%
Group 22 0.379 0.211 0.549 6.173; 21 0.999 0% Conductor Study autor 5 0.806 0.397 1.215 6.446 4 0.168 38% 6.543 3 0.088
Student 3 0.400 -0.109 0.909 0.144 2 0.931 0%
23
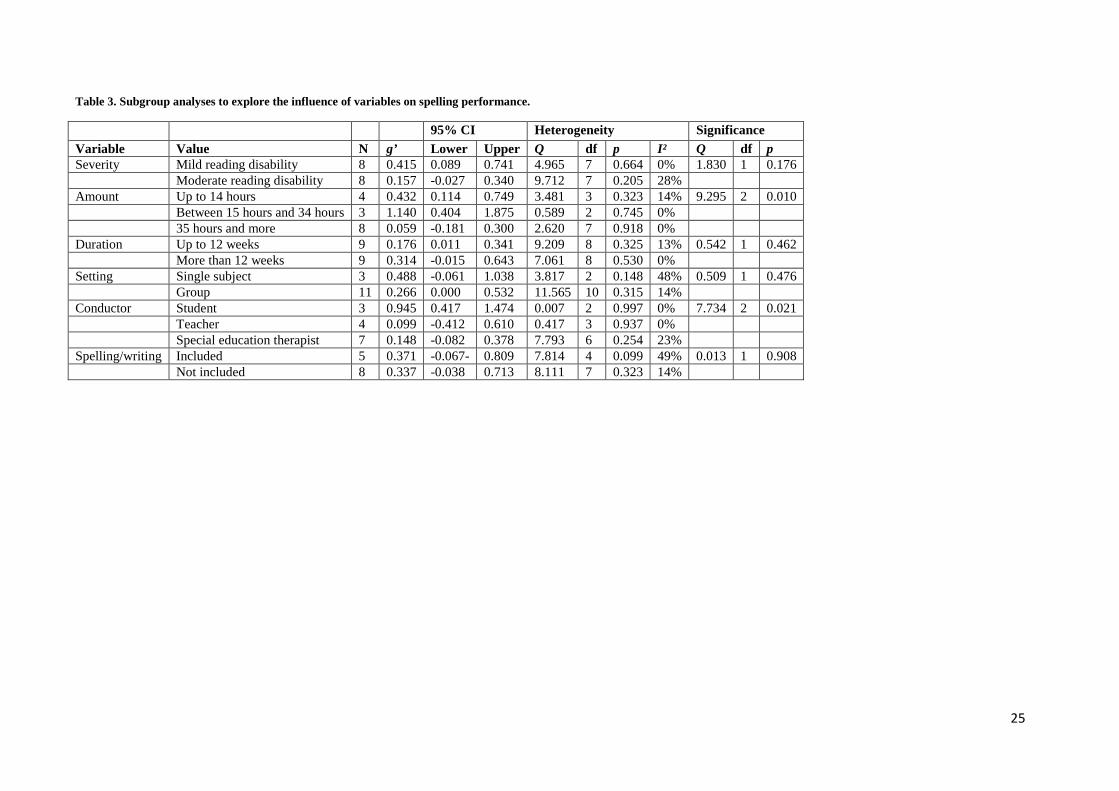
Spelling Performance
Ten trials (containing 18 comparisons) conducted spelling tests before and after treat-
ment. It was, therefore, possible to calculate 18 effect sizes for spelling. Only in case of phon-
ics instruction was it possible to compute a mean effect size. The other treatment approach
categories included only one study that assessed spelling performance. Ten studies evaluated
the effect of phonics instruction on spelling performance. These revealed a small but statisti-
cally significant mean effect size (g’ = 0.336; 95% CI [0.062, 0.610]; I² = 22%).
Again, subgroup analyses were conducted to explore the involvement of other variables
(intervention and sample characteristics) on the improvement of spelling performance. Be-
cause only few studies were available, some subgroups comprised less categories as in the
case of reading performance (see Table 3).
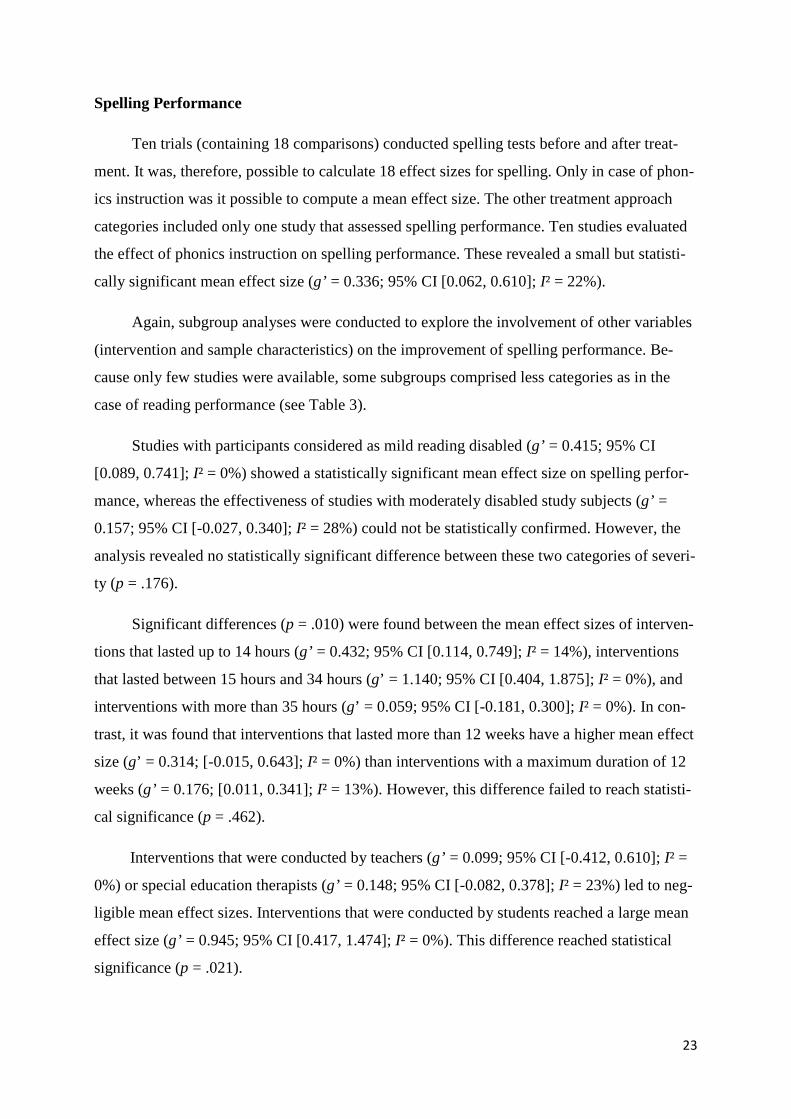
Studies with participants considered as mild reading disabled (g’ = 0.415; 95% CI
[0.089, 0.741]; I² = 0%) showed a statistically significant mean effect size on spelling perfor-
mance, whereas the effectiveness of studies with moderately disabled study subjects (g’ =
0.157; 95% CI [-0.027, 0.340]; I² = 28%) could not be statistically confirmed. However, the
analysis revealed no statistically significant difference between these two categories of severi-
ty (p = .176).
Significant differences (p = .010) were found between the mean effect sizes of interven-
tions that lasted up to 14 hours (g’ = 0.432; 95% CI [0.114, 0.749]; I² = 14%), interventions
that lasted between 15 hours and 34 hours (g’ = 1.140; 95% CI [0.404, 1.875]; I² = 0%), and
interventions with more than 35 hours (g’ = 0.059; 95% CI [-0.181, 0.300]; I² = 0%). In con-
trast, it was found that interventions that lasted more than 12 weeks have a higher mean effect
size (g’ = 0.314; [-0.015, 0.643]; I² = 0%) than interventions with a maximum duration of 12
weeks (g’ = 0.176; [0.011, 0.341]; I² = 13%). However, this difference failed to reach statisti-
cal significance (p = .462).
Interventions that were conducted by teachers (g’ = 0.099; 95% CI [-0.412, 0.610]; I² =
0%) or special education therapists (g’ = 0.148; 95% CI [-0.082, 0.378]; I² = 23%) led to neg-
ligible mean effect sizes. Interventions that were conducted by students reached a large mean
effect size (g’ = 0.945; 95% CI [0.417, 1.474]; I² = 0%). This difference reached statistical
significance (p = .021).
24
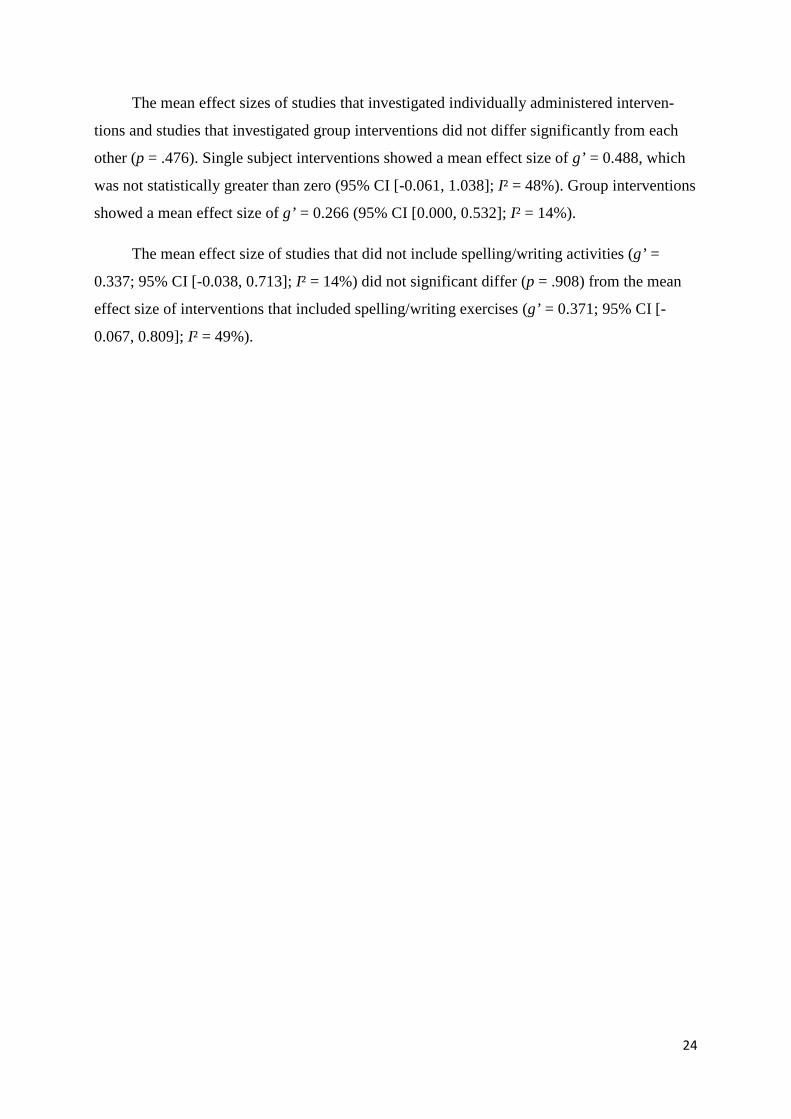
The mean effect sizes of studies that investigated individually administered interven-
tions and studies that investigated group interventions did not differ significantly from each
other (p = .476). Single subject interventions showed a mean effect size of g’ = 0.488, which
was not statistically greater than zero (95% CI [-0.061, 1.038]; I² = 48%). Group interventions
showed a mean effect size of g’ = 0.266 (95% CI [0.000, 0.532]; I² = 14%).
The mean effect size of studies that did not include spelling/writing activities (g’ =
0.337; 95% CI [-0.038, 0.713]; I² = 14%) did not significant differ (p = .908) from the mean
effect size of interventions that included spelling/writing exercises (g’ = 0.371; 95% CI [-
0.067, 0.809]; I² = 49%).
25
Table 3. Subgroup analyses to explore the influence of variables on spelling performance.
95% CI Heterogeneity Significance Variable Value N g’ Lower Upper Q df p I² Q df p Severity Mild reading disability 8 0.415 0.089 0.741 4.965 7 0.664 0% 1.830 1 0.176 Moderate reading disability 8 0.157 -0.027 0.340 9.712 7 0.205 28% Amount Up to 14 hours 4 0.432 0.114 0.749 3.481 3 0.323 14% 9.295 2 0.010 Between 15 hours and 34 hours 3 1.140 0.404 1.875 0.589 2 0.745 0% 35 hours and more 8 0.059 -0.181 0.300 2.620 7 0.918 0% Duration Up to 12 weeks 9 0.176 0.011 0.341 9.209 8 0.325 13% 0.542 1 0.462 More than 12 weeks 9 0.314 -0.015 0.643 7.061 8 0.530 0% Setting Single subject 3 0.488 -0.061 1.038 3.817 2 0.148 48% 0.509 1 0.476 Group 11 0.266 0.000 0.532 11.565 10 0.315 14% Conductor Student 3 0.945 0.417 1.474 0.007 2 0.997 0% 7.734 2 0.021 Teacher 4 0.099 -0.412 0.610 0.417 3 0.937 0% Special education therapist 7 0.148 -0.082 0.378 7.793 6 0.254 23% Spelling/writing Included 5 0.371 -0.067- 0.809 7.814 4 0.099 49% 0.013 1 0.908 Not included 8 0.337 -0.038 0.713 8.111 7 0.323 14%
26
Additional analyses
In the vast majority of studies (19 out of 22), the effect size calculation was based on
standardized measures. Only three trials [23,26,30] used non-standardized measures of learn-
ing transfer. These studies had evaluated phonics instructions, reading comprehension train-
ings, and a reading fluency training. Because the inclusion of studies with non-standardized
measures might introduce an artifact (outlined above), the main analyses were rerun after
these three studies were excluded.
Since only one study remained in the category ‘reading comprehension training’, it was
not possible to calculate a mean effect size for this treatment approach. In the category ‘read-
ing fluency training’ the exclusion of studies with non-standardized measures led to a minor
change in the magnitude of the effect (Reading: g’ = 0.280; 95% CI [-0.072, 0.322]); n = 4).
Interestingly, the mean effect sizes for phonics instruction are higher if trials using non-
standardized measures are excluded from the analysis (Reading: g’ = 0.424; 95% CI [0.246,
0.601]; n = 25; Spelling: g’ = 0.376; 95% CI [0.065, 0.686]); n = 9). These findings demon-
strate that the inclusion of studies with non-standardized measures in the present meta-
analysis did not lead to an overestimation of the effect sizes and, therefore, does not confound
the results.
Publication bias
A common problem of all disciplines in meta-analytic reviews is the phenomenon of
publication bias [43]. Publication bias occurs because statistically significant results are more
likely to be published than non-significant results.
Only a small number of included studies assessed spelling performance. In addition,
phonics instruction is the only treatment approach whose positive effect on reading perfor-
mance is statistically confirmed. Therefore, publication bias was explored exemplarily only
for those studies that evaluated phonics instruction and used reading performance as depend-
ent variable. A funnel plot was used to explore the presence of publication bias. The shape of
the funnel plot displayed asymmetry with a gap on the left of the graph. Using Duval and
Tweedie’s trim and fill [44] the extent of publication bias was assessed and an unbiased effect
size was estimated.
27
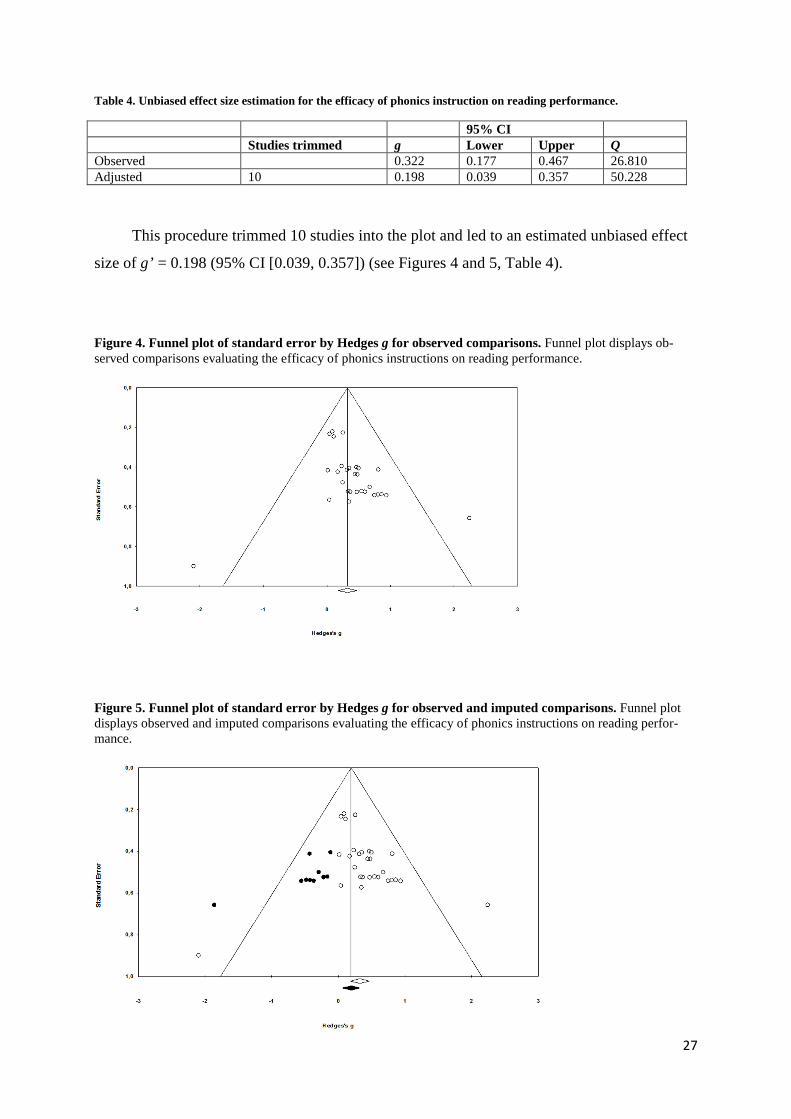
Table 4. Unbiased effect size estimation for the efficacy of phonics instruction on reading performance.
95% CI Studies trimmed g Lower Upper Q Observed 0.322 0.177 0.467 26.810 Adjusted 10 0.198 0.039 0.357 50.228
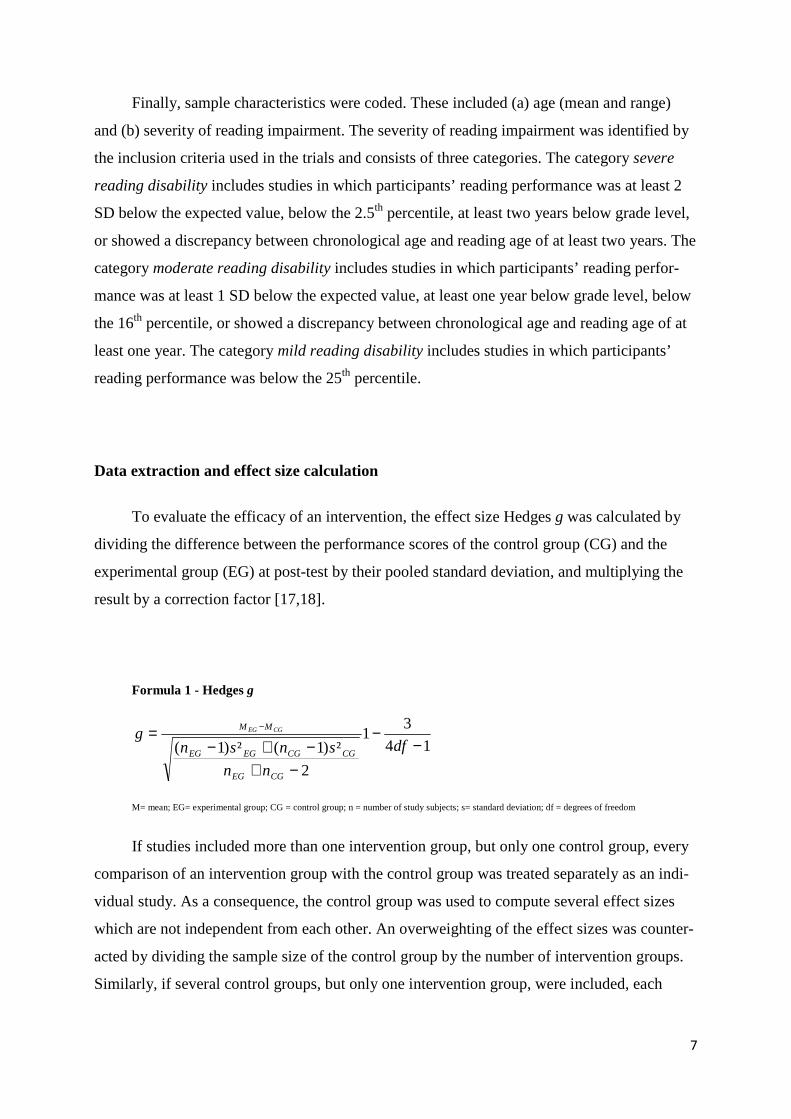
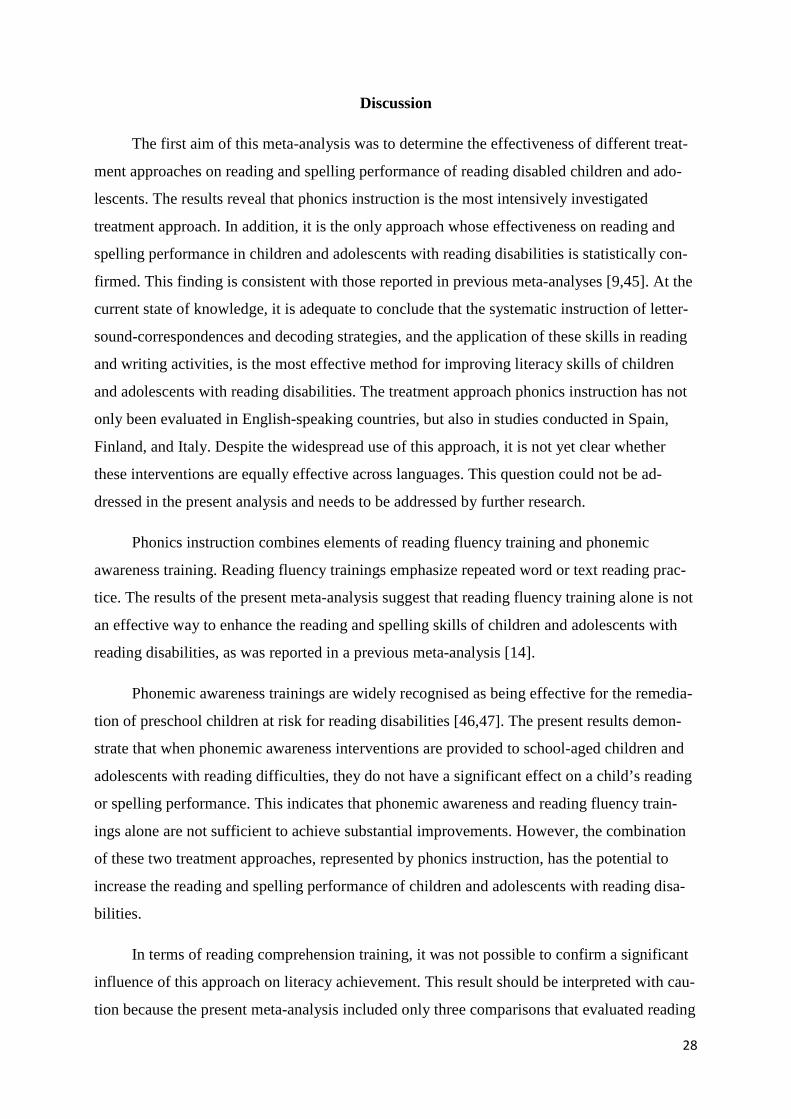
This procedure trimmed 10 studies into the plot and led to an estimated unbiased effect
size of g’ = 0.198 (95% CI [0.039, 0.357]) (see Figures 4 and 5, Table 4).
Figure 4. Funnel plot of standard error by Hedges g for observed comparisons. Funnel plot displays ob-served comparisons evaluating the efficacy of phonics instructions on reading performance.
Figure 5. Funnel plot of standard error by Hedges g for observed and imputed comparisons. Funnel plot displays observed and imputed comparisons evaluating the efficacy of phonics instructions on reading perfor-mance.
28
Discussion
The first aim of this meta-analysis was to determine the effectiveness of different treat-
ment approaches on reading and spelling performance of reading disabled children and ado-
lescents. The results reveal that phonics instruction is the most intensively investigated
treatment approach. In addition, it is the only approach whose effectiveness on reading and
spelling performance in children and adolescents with reading disabilities is statistically con-
firmed. This finding is consistent with those reported in previous meta-analyses [9,45]. At the
current state of knowledge, it is adequate to conclude that the systematic instruction of letter-
sound-correspondences and decoding strategies, and the application of these skills in reading
and writing activities, is the most effective method for improving literacy skills of children
and adolescents with reading disabilities. The treatment approach phonics instruction has not
only been evaluated in English-speaking countries, but also in studies conducted in Spain,
Finland, and Italy. Despite the widespread use of this approach, it is not yet clear whether
these interventions are equally effective across languages. This question could not be ad-
dressed in the present analysis and needs to be addressed by further research.
Phonics instruction combines elements of reading fluency training and phonemic
awareness training. Reading fluency trainings emphasize repeated word or text reading prac-
tice. The results of the present meta-analysis suggest that reading fluency training alone is not
an effective way to enhance the reading and spelling skills of children and adolescents with
reading disabilities, as was reported in a previous meta-analysis [14].
Phonemic awareness trainings are widely recognised as being effective for the remedia-
tion of preschool children at risk for reading disabilities [46,47]. The present results demon-
strate that when phonemic awareness interventions are provided to school-aged children and
adolescents with reading difficulties, they do not have a significant effect on a child’s reading
or spelling performance. This indicates that phonemic awareness and reading fluency train-
ings alone are not sufficient to achieve substantial improvements. However, the combination
of these two treatment approaches, represented by phonics instruction, has the potential to
increase the reading and spelling performance of children and adolescents with reading disa-
bilities.
In terms of reading comprehension training, it was not possible to confirm a significant
influence of this approach on literacy achievement. This result should be interpreted with cau-
tion because the present meta-analysis included only three comparisons that evaluated reading
29
comprehension training. All three comparisons were conducted by the same author and they
demonstrated negligible [28] to small [26] effect sizes. There is a clear need to complement
these studies with further research.
The mean effect size of coloured lenses (Irlen lenses) did not reach statistical signifi-
cance. Some studies compared the effect of coloured lenses to a placebo control group; other
studies used an untrained control group instead. An interesting observation is that Irlen lenses
showed small effect sizes if the experimental group was compared to an untreated control
group [41]. If the experimental group was compared to a placebo control group, effect sizes
were negligible [33,41]. This finding confirms earlier systematic reviews that could not prove
any positive effect of coloured lenses on literacy achievement, and suggests that results are
mainly due to placebo effects [48,49].
Studies that tried to enhance reading and spelling skills of children and adolescents with
reading disabilities by medication with the nootropic piracetam showed only minor effects,
and the mean effect size for reading performance did not reach statistical significance. With
the possibility of side effects in mind [50] the risks of medication seem to outweigh its bene-
fits.
Auditory trainings intend to foster reading and spelling by focussing on the underlying
causes of the poor performance. At first glance, this approach seems convenient, but the re-
sults of the present meta-analysis demonstrate that auditory trainings do not significantly im-
prove children’s reading and spelling skills. Based on the results of the present meta-analysis
and those reported by other systematic reviews and non-randomized trials [10,51,52], it can
be concluded that focussing directly on literacy skills is effective but the efficacy of interven-
tions focussing on the underlying causes could not be confirmed to date.
The second aim of this meta-analysis was to explore the impact of various factors on the
efficacy of interventions. The results of subgroup analyses do not allow clear conclusions
about what makes an intervention successful. This may be caused by mutual confounding in
the subgroup analyses, which means that each moderator could be confounded by any of the
other moderators. This influences the observed association between moderator and outcomes
and distorts the true magnitude of effects. As a consequence, the results of the performed sub-
group analyses should be interpreted with caution. However, some findings are worth noting.
First, subgroup analyses demonstrated that children and adolescents with mild reading disabil-
ities show more improvement in literacy skills than more severely impaired participants. Sec-
30
ond, interventions with higher amounts of treatment or longer durations of treatment seem to
be more effective in improving literacy skills than therapies with small amounts of treatment
or short-time interventions. Third, consistent with previous meta-analyses [8,14], it was found
that interventions that were conducted by the study author tend to show higher effect sizes
than interventions that were implemented by other conductors. This suggests that solid and
professional knowledge about reading disability in children and adolescents might enhance
treatment efficacy. Meta-regression or hierarchical linear methods can be helpful to identify
specific variables that influence the efficacy of an intervention. Due to the small number of
included studies that distinguished or evaluated each variable, these statistical methods could
not be applied in the present meta-analysis.
Unfortunately, it could not be assessed which intervention is particularly effective for a
specific age or grade level. This was due to the occurrence that many of the included trials
comprised study subjects of a wide age span. Ever since the meta-analyses of the NRP in the
year 2000 [8], it has been apparent that interventions are not equally effective for different age
groups or grade levels. Providing children of a wide age span with the same interventions is
therefore not a recommended option for research settings and clinical practice.
The influence of publication bias was determined with funnel plots. Publication bias re-
fers to the appearance that many studies remain unpublished because of negligible effect sizes
or non-significant findings [53]. This is presumably the case in this research domain. We con-
trolled publication bias exemplarily for the treatment approach of phonics instructions, but it
can be assumed that this phenomenon is present in the other treatment approaches as well.
Duval and Tweedies trim and fill analysis estimated and valued the true, unbiased effect size
as being small, but still statistically significant.
Consistent with prior research [9,11,12,14,45], this analysis demonstrated that severe
reading and spelling difficulties can be ameliorated with appropriate treatment. The need for
evidence-based interventions is obvious given the emotional and academic consequences for
children with persistent reading disorders [6]. To increase the informative value of studies,
research in this domain should improve its methodological quality. Studies were often exclud-
ed from this analysis because of the absence of randomized allocation concealment. Random-
ization tries to secure that known and unknown determining factors are spread equally across
groups. Research has shown that when meta-analyses include studies whose allocation con-
cealment is inadequate, effects of interventions can be misjudged [54]. Each study that was
included in our analysis was randomized, but due to missing methodological specifications
31
the quality of randomization procedures could not be determined. An equally important aspect
is the assessment of the dependent variables by a blinded person. It has been demonstrated
[55,56] that effects of interventions are exaggerated if the relevant outcome measures are not
assessed in a blinded test situation. Therefore, effects can only be attributed to the conducted
intervention if they are observed in a blinded randomized controlled trial with an adequate
concealment technique. Unfortunately, most of the studies included in the present meta-
analysis did not specify whether the dependent variable was assessed by a blinded person.
This meta-analysis comprises studies from various English-speaking and non-English-
speaking countries like Finland, Italy, Spain, and Brazil. To conduct a meaningful meta-
analysis with an adequate number of comparisons, these studies could not be analyzed sepa-
rately for different languages or groups of languages. The transferability of research findings
from English-speaking countries to languages with more consistent orthographies and less
syllabic complexity and vice versa is largely debated [57-59]. It has been demonstrated that
differences between languages affect children’s literacy acquisition [59,60] and, therefore, it
cannot be generally assumed that symptom based treatment approaches are equally effective
in each language.
The Anglo-American region far outweighs other countries in quantity and quality of the
published work in this research domain. In order to be able to support children and adolescent
with reading disabilities in different languages with evidence-based interventions, research in
every country has to realign on high-quality standards. This refers in particular to the intensi-
fied application of blinded randomized controlled trials. Moreover, in order to solve the ques-
tions of the transferability of research findings across languages, cross-linguistic studies are
required.
Acknowledgments
We are grateful for the financial support provided by the „Bundesverband für Legasthe-
nie und Dyskalkulie e.V.“ (BVL) and „Deutsche Gesellschaft für Kinder- und Jugendpsychi-
atrie, Psychosomatik und Psychotherapie“ (DGKJP).
We would also like to thank the authors of the studies included in this review for responding
so willingly to repeated requests for information.
32
References 1. Lyon GR, Shaywitz SE, Shaywitz BA (2003) A definition of dyslexia. Ann Dyslexia 53: 1-14. 2. Scerri TS, Schulte-Körne G (2010) Genetics of developmental dyslexia. Eur Child Adolesc
Psychiatry 19: 179-197. 3. Schulte-Korne G, Bruder J (2010) Clinical neurophysiology of visual and auditory processing in
dyslexia: a review. Clin Neurophysiol 121: 1794-1809. 4. Goswami U, Fosker T, Huss M, Mead N, Szucs D (2011) Rise time and formant transition duration
in the discrimination of speech sounds: the Ba-Wa distinction in developmental dyslexia. Dev Sci 14: 34-43.
5. Ziegler JC, Pech-Georgel C, Dufau S, Grainger J (2010) Rapid processing of letters, digits and symbols: what purely visual-attentional deficit in developmental dyslexia? Dev Sci 13: F8-F14.
6. Carroll JM, Maughan B, Goodman R, Meltzer H (2005) Literacy difficulties and psychiatric disorders: Evidence for comorbidity. J Child Psychol Psychiatry 46: 524-532.
7. Willcutt EG, Pennington BF (2000) Psychiatric comorbidity in children and adolescents with reading disability. J Child Psychol Psychiatry 41: 1039-1048.
8. National Institute of Child Health and Human Development (2000) Report of the National Reading Panel. Teaching children to read: An evidence-based assessment of the scientific research literature on reading and its implications for reading instruction (NIH Publication No. 00-4769). Washington, DC: US Government Printing Office.
9. McArthur G, Eve PM, Jones K, Banales E, Kohnen S, et al. (2012) Phonics training for English-speaking poor readers. Cochrane Database Syst Rev 12: CD009115.
10. Loo JHY, Bamiou DE, Campbell N, Luxon LM (2010) Computer-based auditory training (CBAT): benefits for children with language- and reading-related learning difficulties. Dev Med Child Neurol 52: 708-717.
11. Goodwin AP, Ahn S (2010) A meta-analysis of morphological interventions: Effects on literacy achievement of children with literacy difficulties. Ann Dyslexia 60: 183-208.
12. Suggate SP (2010) Why what we teach depends on when: grade and reading intervention modality moderate effect size. Dev Psychol 46: 1556-1579.
13. Elbaum B, Vaughn S, Hughes MT, Moody SW (2000) How Effective Are One-to-One Tutoring Programs in Reading for Elementary Students at Risk for Reading Failure? A Meta-Analysis of the Intervention Research. J Educ Psychol 92: 605-619.
14. Scammacca N, Roberts G, Vaughn S, Edmonds M, Wexler J, et al. (2007) Interventions for Adolescent Struggling Readers: A Meta-Analysis with Implications for Practice. Center on Instruction.
15. Swanson HL, Swanson HL (2001) Research on Interventions for Adolescents with Learning Disabilities: A Meta-Analysis of outcomes related to higher order processing. Elem School J 101: 331.
16. Wanzek J, Vaughn S, Scammacca NK, Metz K, Murray CS, et al. (2013) Extensive Reading Interventions for Students With Reading Difficulties After Grade 3. Rev Educ Res 83: 163-195.
17. Hedges LV (1981) Distribution theory for Glass's estimator of effect size and related estimators. J Educ Behav Stat 6: 107-128.
18. Hedges LV (1982) Estimation of effect size from a series of independent experiments. Psychol Bull 92: 490-499.
19. Swanson HL (1999) Reading research for students with LD: a meta-analysis of intervention outcomes. J Learn Disabil 32: 504-532.
20. Borenstein M, Hedges LV, Higgins JPT, Rothstein HR (2005) Comprehensive Meta-Analysis Version 2. Englewood, NJ: Biostat.
21. Bull L (2007) Sunflower therapy for children with specific learning difficulties (dyslexia): a randomised, controlled trial. Complement Ther Clin Pract 13: 15-24.
33
22. del Rosario Ortiz González M, Espinel AI, Rosquete RG (2002) Remedial interventions for children with reading disabilities: speech perception-an effective component in phonological training? J Learn Disabil 35: 334-342.
23. Heikkilä R, Aro M, Närhi V, Westerholm J, Ahonen T (2013) Does training in syllable recognition improve reading speed? A computer-based trial with poor readers from second and third grade. Sci Stud Read 17: 398-414.
24. Jiménez JE, Hernández-Valle I, Ramírez G, Ortiz Mdel R, Rodrigo M, et al. (2007) Computer speech-based remediation for reading disabilities: the size of spelling-to-sound unit in a transparent orthography. Span J Psychol 10: 52-67.
25. Kirk C, Gillon GT (2009) Integrated morphological awareness intervention as a tool for improving literacy. Lang Speech Hear Serv Sch 40: 341-351.
26. Lovett MW, Borden SL, Warren-Chaplin PM, Lacerenza L, DeLuca T, et al. (1996) Text comprehension training for disabled readers: An evaluation of reciprocal teaching and text analysis training programs. Brain Lang 54: 447-480.
27. Lovett MW, Lacerenza L, Borden SL, Frijters JC, Steinbach KA, et al. (2000) Components of effective remediation for developmental reading disabilities: Combining phonological and strategy-based instruction to improve outcomes. J Educ Psychol 92: 263-283.
28. Lovett MW, Ransby MJ, Hardwick N, Johns MS, Donaldson SA (1989) Can dyslexia be treated? Treatment-specific and generalized treatment effects in dyslexic children's response to remediation. Brain Lang 37: 90-121.
29. Lovett MW, Steinbach KA (1997) The effectiveness of remedial programs for reading disabled children of different ages: Does the benefit decrease for older children? Learn Disabil Q 20: 189-210.
30. Lovett MW, Warren-Chaplin PM, Ransby MJ, Borden SL (1990) Training the word recognition skills of reading disabled children: Treatment and transfer effects. J Educ Psychol 82: 769-780.
31. Murphy CF, Schochat E (2011) Effect of nonlinguistic auditory training on phonological and reading skills. Folia Phoniatr Logop 63: 147-153.
32. O'Shaughnessy TE, Swanson HL (2000) A comparison of two reading interventions for children with reading disabilities. J Learn Disabil 33: 257-277.
33. Robinson GL, Foreman PJ (1999) Scotopic sensitivity/Irlen syndrome and the use of coloured filters: a long-term placebo-controlled study of reading strategies using analysis of miscue. Percept mot skills 88: 35-52.
34. Ryder JF, Tunmer WE, Greaney KT (2008) Explicit instruction in phonemic awareness and phonemically based decoding skills as an intervention strategy for struggling readers in whole language classrooms. Read Writ 21: 349-369.
35. Sanchez E, Rueda MI (1991) Segmental awareness and dyslexia: Is it possible to learn to segment well and yet continue to read and write poorly? Read Writ 3: 11-18.
36. Tressoldi PE, Lonciari I, Vio C (2000) Treatment of specific developmental reading disorders, derived from single- and dual-route models. J Learn Disabil 33: 278-285.
37. Bhattacharya A, Ehri L (2004) Graphosyllabic analysis helps adolescent struggling readers read and spell words. J Learn Disabil 37: 331-348.
38. Törmänen MRK, Takala M (2009) Auditory processing in developmental dyslexia: An exploratory study of an auditory and visual matching training program with Swedish children with developmental dyslexia. Scand J Psychol 50: 277-285.
39. DiIanni M, Wilsher CR, Blank MS, Conners CK, Chase CH, et al. (1985) The effects of piracetam in children with dyslexia. J Clin Psychopharmacol 5: 272-278.
40. Wilsher CR, Bennett D, Chase CH, Conners CK, DiIanni M, et al. (1987) Piracetam and dyslexia: effects on reading tests. J Clin Psychopharmacol 7: 230-237.
41. Mitchell C, Mansfield D, Rautenbach S (2008) Coloured filters and reading accuracy, comprehension and rate: a placebo-controlled study. Percept mot skills 106: 517-532.
42. McPhillips M, Hepper PG, Mulhern G (2000) Effects of replicating primary-reflex movements on specific reading difficulties in children: a randomised, double-blind, controlled trial. Lancet 12: 537-541.
43. Dickersin K, Min YI (1993) Publication bias: the problem that won't go away. Ann N Y Acad Sci 703: 135-146.
34
44. Duval S, Tweedie R (2000) Trim and fill: A simple funnel-plot-based method of testing and adjusting for publication bias in meta-analysis. Biometrics 56: 455-463.
45. Ehri LC, Nunes SR, Stahl SA, Willows DM (2001) Systematic phonics instruction helps students learn to read: Evidence from the National Reading Panel's meta-analysis. Rev Educ Res 71: 393-447.
46. Ehri LC, Nunes SR, Willows DM, Schuster BV, Yaghoub-Zadeh Z, et al. (2001) Phonemic awareness instruction helps children learn to read: Evidence from the National Reading Panel's meta-analysis. Read Res Q 36: 250-287.
47. Bus AG, van Ijzendoorn MH (1999) Phonological awareness and early reading: A meta-analysis of experimental training studies. J Educ Psychol 91: 403-414.
48. Döhnert M, Englert ED (2003) The Irlen syndrome-are there pathophysiologic correlates and scientific evidence for "reading with colors"? Z Kinder Jugendpsychiatr Psychother 31: 305-309.
49. Evans BJ, Drasdo N (1991) Tinted lenses and related therapies for learning disabilities: A review. Ophthalmic Physiol Opt 11: 206-217.
50. Wilsher CR, Taylor EA (1994) Piracetam in developmental reading disorders: A review. Eur Child Adolesc Psychiatry 3: 59-71.
51. Ise E, Engel RR, Schulte-Körne G (2012) Effective treatment of dyslexia: a meta-analysis of inter-vention studies. Kindh Entwickl 21: 122-136.
52. Berwanger D, von Suchodoletz W (2004) Trial of time processing training in children with reading and spelling disorders. Z Kinder Jugendpsychiatr Psychother 32: 77-84.
53. Thornton A, Lee P (2000) Publication bias in meta-analysis: its causes and consequences. J Clin Epidemiol 53: 207-216.
54. Pildal J, Hrobjartsson A, Jorgensen KJ, Hilden J, Altman DG, et al. (2007) Impact of allocation concealment on conclusions drawn from meta-analyses of randomized trials. Int J Epidemiol 36: 847-857.
55. Schulz KF, Chalmers I, Hayes RJ, Altman DG (1995) Empirical evidence of bias. Dimensions of methodological quality associated with estimates of treatment effects in controlled trials. JAMA 273: 408-412.
56. Balk EM, Bonis PA, Moskowitz H, Schmid CH, Ioannidis JP, et al. (2002) Correlation of quality measures with estimates of treatment effect in meta-analyses of randomized controlled trials. JAMA 287: 2973-2982.
57. Seymour PH, Aro M, Erskine JM (2003) Foundation literacy acquisition in European orthographies. Br J Psychol 94: 143-174.
58. Erickson K, Sachse S (2010) Reading acquisition, AAC and the transferability of English research to languages with more consistent or transparent orthographies. Augm Altern Commun 26: 177-190.
59. Ziegler JC, Bertrand D, Toth D, Csepe V, Reis A, et al. (2010) Orthographic depth and its impact on universal predictors of reading: a cross-language investigation. Psychol Sci 21: 551-559.
60. Landerl K, Ramus F, Moll K, Lyytinen H, Leppanen PH, et al. (2013) Predictors of developmental dyslexia in European orthographies with varying complexity. J Child Psychol Psychiatry 54: 686-694.
Recommended