Science of Sintering 41 (2009) 11-17 ________________________________________________________________________
_____________________________
) Corresponding author pengconghuayahoocomcn
doi 102298SOS0901011P UDK 6618466618831662785 Effect of Zircon on Sintering Composition and Microstructure of Magnesia Powders C Peng) N Li B Han The Hubei Province Key Laboratory of Refractory and Ceramics 181 Wuhan University of Science and Technology 947 Heping Dadao Wuhan Hubei 430081 PR China Abstract
The effects of zircon on sintering composition and microstructure of fused magnesia powders were studied by XRD SEM and EDAX With the increase of zircon content up to 6 wt the strength of sintered samples increased but the apparent porosity decreased 6 wt is an appropriate content of zircon to possess better properties of samples and in this case the samples have a dense microstructure and lower content of glass phase The presence of a liquid phase resulting from zircon addition is the main reason to improve sintering of magnesia powders Keywords Fused magnesia Zircon Sintering Densification
1 Introduction
Magnesia-based refractories have been widely used in cement rotary kilns and steel ladles for their high melting point and good resistance to basic slags and clinkers However they have some shortcomings such as high thermal conductivity poor thermal shock resistance and penetration resistance [1] In order to avoid the shortcomings mentioned above oxides such as SiO2 Al2O3 Cr2O3 TiO2 ZrO2 and WO3 were added into refractories [2 3] These oxides may react with MgO to form a second phase to improve sintering of MgO Chaudhuri et al [4] studied the effects of titania ilmenite and zirconia on properties of magnesia refractories and found that calcium titanate formed in samples with added titania but ZrO2 was soluble into MgO crystals Han et al [1] studied sintering of MgO-based refractories with added WO3 and demonstrated that the low melting phases MgWO4 and CaWO4 formed in MgO boundaries resulting in an increase of the liquid volume The formation of CaWO4 lead to change of the CaOSiO2 (CS) ratio and decreased the amount of 3CaOmiddotSiO2 (C3S) and 2CaOmiddotSiO2 (C2S) and increased amount of liquid so that the densification was improved by phase liquid sintering Guo et al [5] discussed the effect of ZrSiO4 on sintering of sintered- magnesia and the properties of magnesia brick made of pre-synthesized magnesia-zirconia They indicated that ZrSiO4 could accelerate the sintering of magnesia remarkably and properties of this magnesia brick were superior to those of common magnesia products
Fine powder mixtures of fused magnesia and zircon were used to prepare the MgO-
CPeng et al Science of Sintering 41 (2009) 11-17 ___________________________________________________________________________
12
based refractories to form the matrixes which are very important for properties of refractories Reaction sintering occurred during firing ZrO2 forsterite and glass phase were in-situ formed in the matrix which gave an important effect on the composition and properties of the samples This paper describes some of the results
2 Experimental procedures
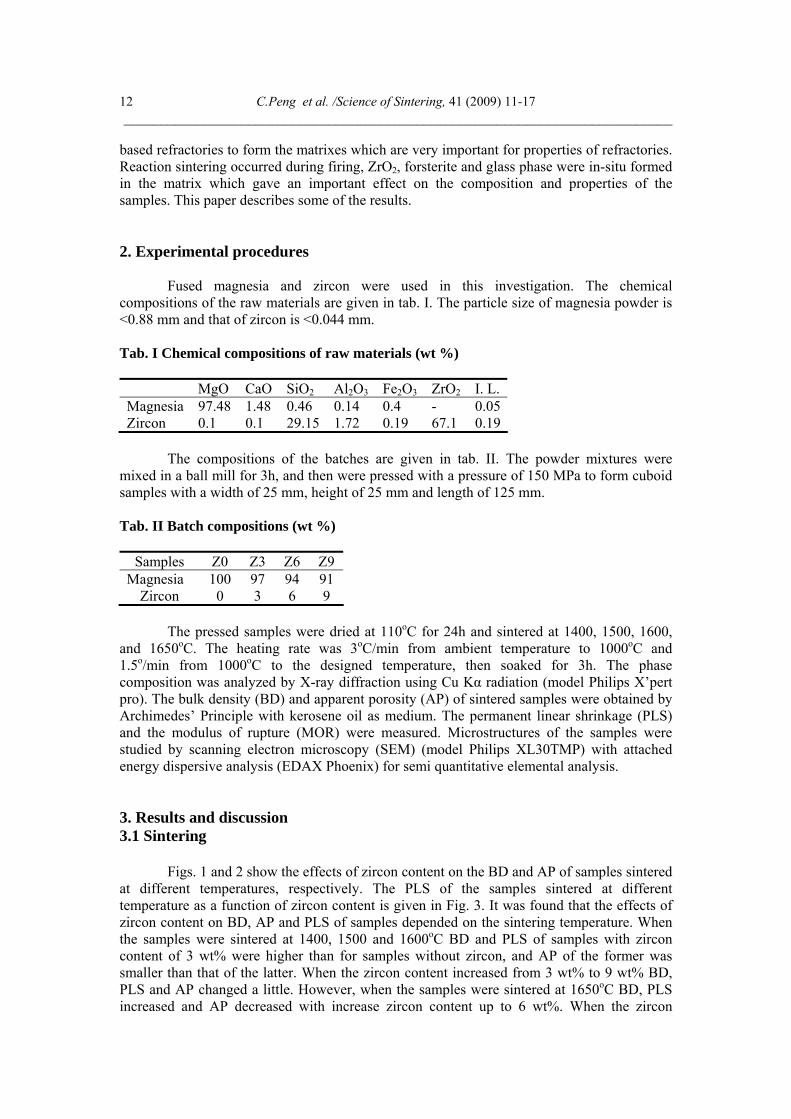
Fused magnesia and zircon were used in this investigation The chemical compositions of the raw materials are given in tab I The particle size of magnesia powder is lt088 mm and that of zircon is lt0044 mm
Tab I Chemical compositions of raw materials (wt ) MgO CaO SiO2 Al2O3 Fe2O3 ZrO2 I L Magnesia 9748 148 046 014 04 - 005Zircon 01 01 2915 172 019 671 019 The compositions of the batches are given in tab II The powder mixtures were
mixed in a ball mill for 3h and then were pressed with a pressure of 150 MPa to form cuboid samples with a width of 25 mm height of 25 mm and length of 125 mm
Tab II Batch compositions (wt )
Samples Z0 Z3 Z6 Z9 Magnesia 100 97 94 91
Zircon 0 3 6 9 The pressed samples were dried at 110oC for 24h and sintered at 1400 1500 1600 and 1650oC The heating rate was 3oCmin from ambient temperature to 1000oC and 15omin from 1000oC to the designed temperature then soaked for 3h The phase composition was analyzed by X-ray diffraction using Cu Kα radiation (model Philips Xrsquopert pro) The bulk density (BD) and apparent porosity (AP) of sintered samples were obtained by Archimedesrsquo Principle with kerosene oil as medium The permanent linear shrinkage (PLS) and the modulus of rupture (MOR) were measured Microstructures of the samples were studied by scanning electron microscopy (SEM) (model Philips XL30TMP) with attached energy dispersive analysis (EDAX Phoenix) for semi quantitative elemental analysis
3 Results and discussion 31 Sintering
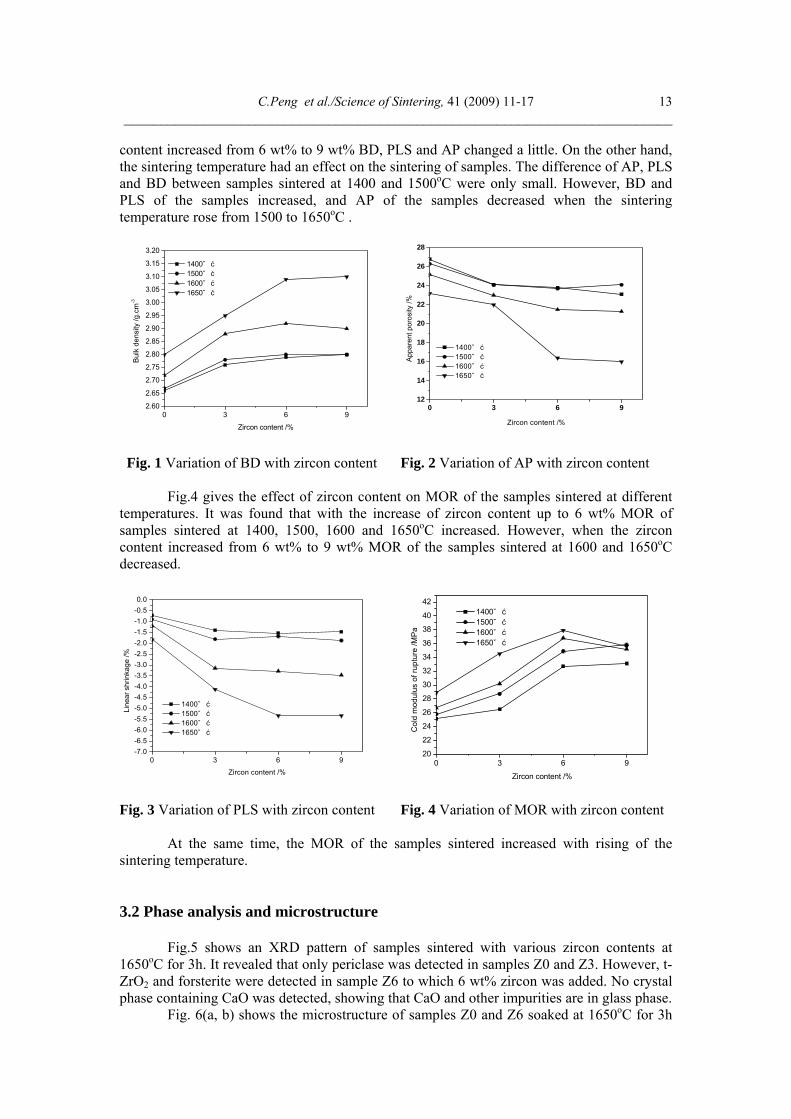
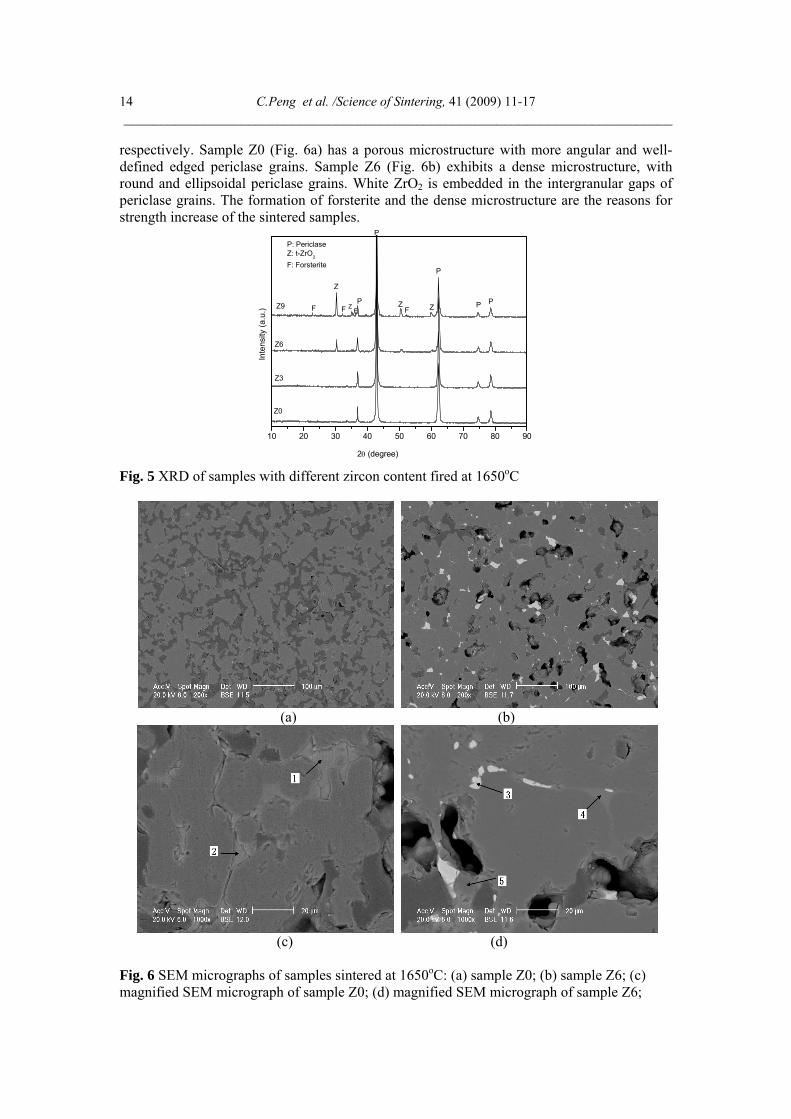
Figs 1 and 2 show the effects of zircon content on the BD and AP of samples sintered at different temperatures respectively The PLS of the samples sintered at different temperature as a function of zircon content is given in Fig 3 It was found that the effects of zircon content on BD AP and PLS of samples depended on the sintering temperature When the samples were sintered at 1400 1500 and 1600oC BD and PLS of samples with zircon content of 3 wt were higher than for samples without zircon and AP of the former was smaller than that of the latter When the zircon content increased from 3 wt to 9 wt BD PLS and AP changed a little However when the samples were sintered at 1650oC BD PLS increased and AP decreased with increase zircon content up to 6 wt When the zircon
CPeng et alScience of Sintering 41 (2009) 11-17 ___________________________________________________________________________
13
content increased from 6 wt to 9 wt BD PLS and AP changed a little On the other hand the sintering temperature had an effect on the sintering of samples The difference of AP PLS and BD between samples sintered at 1400 and 1500oC were only small However BD and PLS of the samples increased and AP of the samples decreased when the sintering temperature rose from 1500 to 1650oC
0 3 6 9260
265
270
275
280
285
290
295
300
305
310
315
320
Bulk
den
sity
gc
m-3
Zircon content
1400ˇ ć 1500ˇ ć 1600ˇ ć 1650ˇ ć
0 3 6 912
14
16
18
20
22
24
26
28
App
aren
t por
osity
Zircon content
1400ˇ ć 1500ˇ ć 1600ˇ ć 1650ˇ ć
Fig 1 Variation of BD with zircon content
Fig 2 Variation of AP with zircon content
Fig4 gives the effect of zircon content on MOR of the samples sintered at different
temperatures It was found that with the increase of zircon content up to 6 wt MOR of samples sintered at 1400 1500 1600 and 1650oC increased However when the zircon content increased from 6 wt to 9 wt MOR of the samples sintered at 1600 and 1650oC decreased
0 3 6 9-70-65-60-55-50-45-40-35-30-25-20-15-10-0500
1400ˇ ć 1500ˇ ć 1600ˇ ć 1650ˇ ć
Line
ar s
hrin
kage
Zircon content 0 3 6 9
20
22
24
26
28
30
32
34
36
38
40
42
Col
d m
odul
us o
f rup
ture
MP
a
Zircon content
1400ˇ ć 1500ˇ ć 1600ˇ ć 1650ˇ ć
Fig 3 Variation of PLS with zircon content
Fig 4 Variation of MOR with zircon content
At the same time the MOR of the samples sintered increased with rising of the
sintering temperature
32 Phase analysis and microstructure
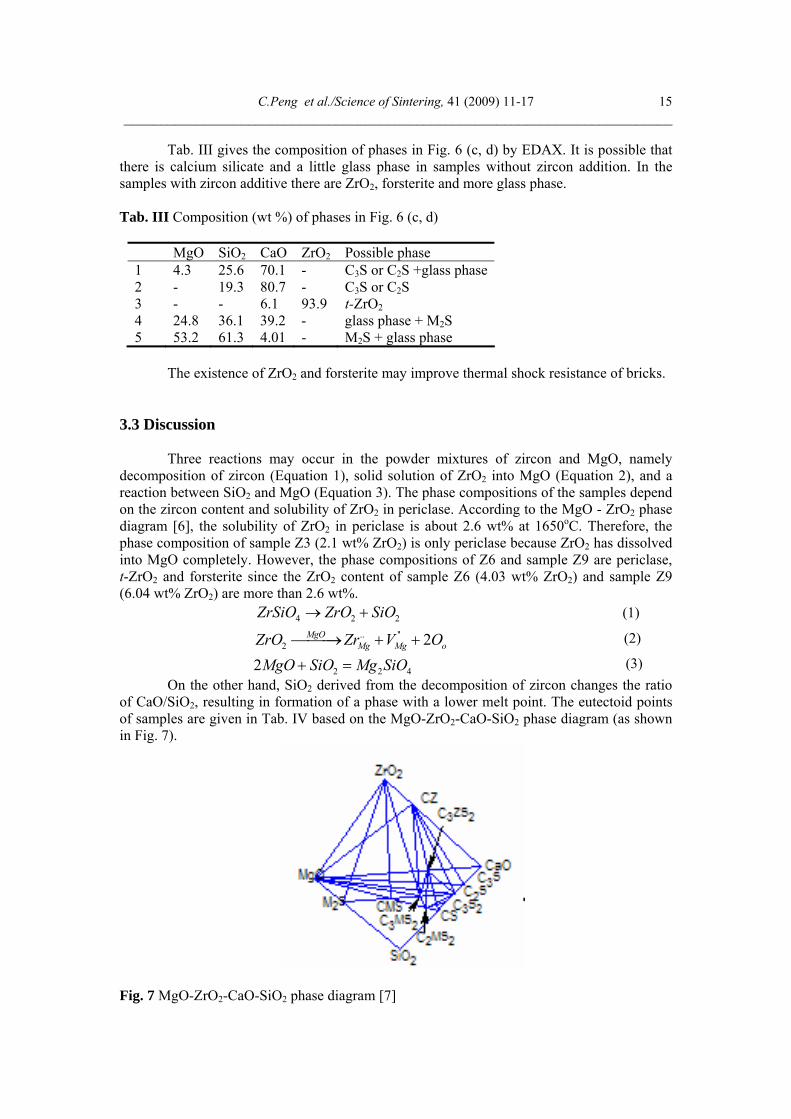
Fig5 shows an XRD pattern of samples sintered with various zircon contents at 1650oC for 3h It revealed that only periclase was detected in samples Z0 and Z3 However t-ZrO2 and forsterite were detected in sample Z6 to which 6 wt zircon was added No crystal phase containing CaO was detected showing that CaO and other impurities are in glass phase
Fig 6(a b) shows the microstructure of samples Z0 and Z6 soaked at 1650oC for 3h
CPeng et al Science of Sintering 41 (2009) 11-17 ___________________________________________________________________________
14
respectively Sample Z0 (Fig 6a) has a porous microstructure with more angular and well-defined edged periclase grains Sample Z6 (Fig 6b) exhibits a dense microstructure with round and ellipsoidal periclase grains White ZrO2 is embedded in the intergranular gaps of periclase grains The formation of forsterite and the dense microstructure are the reasons for strength increase of the sintered samples
10 20 30 40 50 60 70 80 90
ZZ
Z
P
P
P
PFF F
Inte
nsity
(au
)
2θ (degree)
Z0
Z3
Z6
Z9
P PericlaseZ t-ZrO2
F Forsterite
FZ
P
Fig 5 XRD of samples with different zircon content fired at 1650oC
(a) (b)
(c) (d) Fig 6 SEM micrographs of samples sintered at 1650oC (a) sample Z0 (b) sample Z6 (c) magnified SEM micrograph of sample Z0 (d) magnified SEM micrograph of sample Z6
CPeng et alScience of Sintering 41 (2009) 11-17 ___________________________________________________________________________
15
Tab III gives the composition of phases in Fig 6 (c d) by EDAX It is possible that there is calcium silicate and a little glass phase in samples without zircon addition In the samples with zircon additive there are ZrO2 forsterite and more glass phase Tab III Composition (wt ) of phases in Fig 6 (c d)
MgO SiO2 CaO ZrO2 Possible phase 1 43 256 701 - C3S or C2S +glass phase2 - 193 807 - C3S or C2S 3 - - 61 939 t-ZrO24 248 361 392 - glass phase + M2S 5 532 613 401 - M2S + glass phase
The existence of ZrO2 and forsterite may improve thermal shock resistance of bricks
33 Discussion
Three reactions may occur in the powder mixtures of zircon and MgO namely decomposition of zircon (Equation 1) solid solution of ZrO2 into MgO (Equation 2) and a reaction between SiO2 and MgO (Equation 3) The phase compositions of the samples depend on the zircon content and solubility of ZrO2 in periclase According to the MgO - ZrO2 phase diagram [6] the solubility of ZrO2 in periclase is about 26 wt at 1650oC Therefore the phase composition of sample Z3 (21 wt ZrO2) is only periclase because ZrO2 has dissolved into MgO completely However the phase compositions of Z6 and sample Z9 are periclase t-ZrO2 and forsterite since the ZrO2 content of sample Z6 (403 wt ZrO2) and sample Z9 (604 wt ZrO2) are more than 26 wt
4 2 2ZrSiO ZrO SiOrarr + (1)
2 2MgOMg Mg oZrO Zr V O⎯⎯⎯rarr + + (2)
2 22 4MgO SiO Mg SiO+ = (3) On the other hand SiO2 derived from the decomposition of zircon changes the ratio
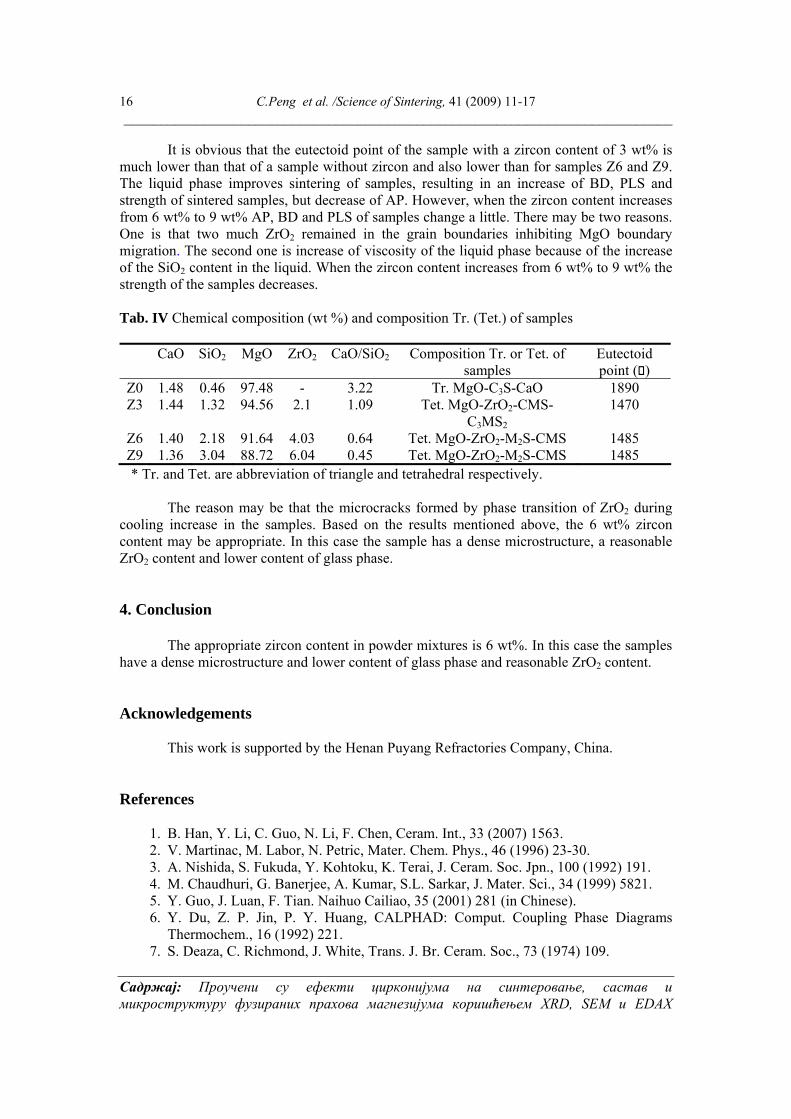
of CaOSiO2 resulting in formation of a phase with a lower melt point The eutectoid points of samples are given in Tab IV based on the MgO-ZrO2-CaO-SiO2 phase diagram (as shown in Fig 7)
Fig 7 MgO-ZrO2-CaO-SiO2 phase diagram [7]
CPeng et al Science of Sintering 41 (2009) 11-17 ___________________________________________________________________________
16
It is obvious that the eutectoid point of the sample with a zircon content of 3 wt is much lower than that of a sample without zircon and also lower than for samples Z6 and Z9 The liquid phase improves sintering of samples resulting in an increase of BD PLS and strength of sintered samples but decrease of AP However when the zircon content increases from 6 wt to 9 wt AP BD and PLS of samples change a little There may be two reasons One is that two much ZrO2 remained in the grain boundaries inhibiting MgO boundary migration The second one is increase of viscosity of the liquid phase because of the increase of the SiO2 content in the liquid When the zircon content increases from 6 wt to 9 wt the strength of the samples decreases
Tab IV Chemical composition (wt ) and composition Tr (Tet) of samples
CaO SiO2 MgO ZrO2 CaOSiO2 Composition Tr or Tet of samples
Eutectoid point ( )
Z0 148 046 9748 - 322 Tr MgO-C3S-CaO 1890 Z3 144 132 9456 21 109 Tet MgO-ZrO2-CMS-
C3MS2 1470
Z6 140 218 9164 403 064 Tet MgO-ZrO2-M2S-CMS 1485 Z9 136 304 8872 604 045 Tet MgO-ZrO2-M2S-CMS 1485 Tr and Tet are abbreviation of triangle and tetrahedral respectively The reason may be that the microcracks formed by phase transition of ZrO2 during
cooling increase in the samples Based on the results mentioned above the 6 wt zircon content may be appropriate In this case the sample has a dense microstructure a reasonable ZrO2 content and lower content of glass phase
4 Conclusion
The appropriate zircon content in powder mixtures is 6 wt In this case the samples have a dense microstructure and lower content of glass phase and reasonable ZrO2 content
Acknowledgements This work is supported by the Henan Puyang Refractories Company China References
1 B Han Y Li C Guo N Li F Chen Ceram Int 33 (2007) 1563 2 V Martinac M Labor N Petric Mater Chem Phys 46 (1996) 23-30 3 A Nishida S Fukuda Y Kohtoku K Terai J Ceram Soc Jpn 100 (1992) 191 4 M Chaudhuri G Banerjee A Kumar SL Sarkar J Mater Sci 34 (1999) 5821 5 Y Guo J Luan F Tian Naihuo Cailiao 35 (2001) 281 (in Chinese) 6 Y Du Z P Jin P Y Huang CALPHAD Comput Coupling Phase Diagrams
Thermochem 16 (1992) 221 7 S Deaza C Richmond J White Trans J Br Ceram Soc 73 (1974) 109
Садржај Проучени су ефекти цирконијума на синтеровање састав и микроструктуру фузираних прахова магнезијума коришћењем XRD SEM и EDAX
CPeng et alScience of Sintering 41 (2009) 11-17 ___________________________________________________________________________
17
метода Повећање садржаја цирконијума до 6 масених процената увећава чврстину синтерованих узорака али се видљива порозност смањује Шест масених процената је оптималан садржај цирконијума јер узорци имају побољшана својства и у овом случају гушћу микроструктуру и мањи садржак стаклене фазе Присуство течне фазе која потиче од додатка цирконијума је главни разлог побољшања праха магнезијума Кључне речи Фузиран магнезијум цирконијум згушњавање
CPeng et al Science of Sintering 41 (2009) 11-17 ___________________________________________________________________________
12
based refractories to form the matrixes which are very important for properties of refractories Reaction sintering occurred during firing ZrO2 forsterite and glass phase were in-situ formed in the matrix which gave an important effect on the composition and properties of the samples This paper describes some of the results
2 Experimental procedures
Fused magnesia and zircon were used in this investigation The chemical compositions of the raw materials are given in tab I The particle size of magnesia powder is lt088 mm and that of zircon is lt0044 mm
Tab I Chemical compositions of raw materials (wt ) MgO CaO SiO2 Al2O3 Fe2O3 ZrO2 I L Magnesia 9748 148 046 014 04 - 005Zircon 01 01 2915 172 019 671 019 The compositions of the batches are given in tab II The powder mixtures were
mixed in a ball mill for 3h and then were pressed with a pressure of 150 MPa to form cuboid samples with a width of 25 mm height of 25 mm and length of 125 mm
Tab II Batch compositions (wt )
Samples Z0 Z3 Z6 Z9 Magnesia 100 97 94 91
Zircon 0 3 6 9 The pressed samples were dried at 110oC for 24h and sintered at 1400 1500 1600 and 1650oC The heating rate was 3oCmin from ambient temperature to 1000oC and 15omin from 1000oC to the designed temperature then soaked for 3h The phase composition was analyzed by X-ray diffraction using Cu Kα radiation (model Philips Xrsquopert pro) The bulk density (BD) and apparent porosity (AP) of sintered samples were obtained by Archimedesrsquo Principle with kerosene oil as medium The permanent linear shrinkage (PLS) and the modulus of rupture (MOR) were measured Microstructures of the samples were studied by scanning electron microscopy (SEM) (model Philips XL30TMP) with attached energy dispersive analysis (EDAX Phoenix) for semi quantitative elemental analysis
3 Results and discussion 31 Sintering
Figs 1 and 2 show the effects of zircon content on the BD and AP of samples sintered at different temperatures respectively The PLS of the samples sintered at different temperature as a function of zircon content is given in Fig 3 It was found that the effects of zircon content on BD AP and PLS of samples depended on the sintering temperature When the samples were sintered at 1400 1500 and 1600oC BD and PLS of samples with zircon content of 3 wt were higher than for samples without zircon and AP of the former was smaller than that of the latter When the zircon content increased from 3 wt to 9 wt BD PLS and AP changed a little However when the samples were sintered at 1650oC BD PLS increased and AP decreased with increase zircon content up to 6 wt When the zircon
CPeng et alScience of Sintering 41 (2009) 11-17 ___________________________________________________________________________
13
content increased from 6 wt to 9 wt BD PLS and AP changed a little On the other hand the sintering temperature had an effect on the sintering of samples The difference of AP PLS and BD between samples sintered at 1400 and 1500oC were only small However BD and PLS of the samples increased and AP of the samples decreased when the sintering temperature rose from 1500 to 1650oC
0 3 6 9260
265
270
275
280
285
290
295
300
305
310
315
320
Bulk
den
sity
gc
m-3
Zircon content
1400ˇ ć 1500ˇ ć 1600ˇ ć 1650ˇ ć
0 3 6 912
14
16
18
20
22
24
26
28
App
aren
t por
osity
Zircon content
1400ˇ ć 1500ˇ ć 1600ˇ ć 1650ˇ ć
Fig 1 Variation of BD with zircon content
Fig 2 Variation of AP with zircon content
Fig4 gives the effect of zircon content on MOR of the samples sintered at different
temperatures It was found that with the increase of zircon content up to 6 wt MOR of samples sintered at 1400 1500 1600 and 1650oC increased However when the zircon content increased from 6 wt to 9 wt MOR of the samples sintered at 1600 and 1650oC decreased
0 3 6 9-70-65-60-55-50-45-40-35-30-25-20-15-10-0500
1400ˇ ć 1500ˇ ć 1600ˇ ć 1650ˇ ć
Line
ar s
hrin
kage
Zircon content 0 3 6 9
20
22
24
26
28
30
32
34
36
38
40
42
Col
d m
odul
us o
f rup
ture
MP
a
Zircon content
1400ˇ ć 1500ˇ ć 1600ˇ ć 1650ˇ ć
Fig 3 Variation of PLS with zircon content
Fig 4 Variation of MOR with zircon content
At the same time the MOR of the samples sintered increased with rising of the
sintering temperature
32 Phase analysis and microstructure
Fig5 shows an XRD pattern of samples sintered with various zircon contents at 1650oC for 3h It revealed that only periclase was detected in samples Z0 and Z3 However t-ZrO2 and forsterite were detected in sample Z6 to which 6 wt zircon was added No crystal phase containing CaO was detected showing that CaO and other impurities are in glass phase
Fig 6(a b) shows the microstructure of samples Z0 and Z6 soaked at 1650oC for 3h
CPeng et al Science of Sintering 41 (2009) 11-17 ___________________________________________________________________________
14
respectively Sample Z0 (Fig 6a) has a porous microstructure with more angular and well-defined edged periclase grains Sample Z6 (Fig 6b) exhibits a dense microstructure with round and ellipsoidal periclase grains White ZrO2 is embedded in the intergranular gaps of periclase grains The formation of forsterite and the dense microstructure are the reasons for strength increase of the sintered samples
10 20 30 40 50 60 70 80 90
ZZ
Z
P
P
P
PFF F
Inte
nsity
(au
)
2θ (degree)
Z0
Z3
Z6
Z9
P PericlaseZ t-ZrO2
F Forsterite
FZ
P
Fig 5 XRD of samples with different zircon content fired at 1650oC
(a) (b)
(c) (d) Fig 6 SEM micrographs of samples sintered at 1650oC (a) sample Z0 (b) sample Z6 (c) magnified SEM micrograph of sample Z0 (d) magnified SEM micrograph of sample Z6
CPeng et alScience of Sintering 41 (2009) 11-17 ___________________________________________________________________________
15
Tab III gives the composition of phases in Fig 6 (c d) by EDAX It is possible that there is calcium silicate and a little glass phase in samples without zircon addition In the samples with zircon additive there are ZrO2 forsterite and more glass phase Tab III Composition (wt ) of phases in Fig 6 (c d)
MgO SiO2 CaO ZrO2 Possible phase 1 43 256 701 - C3S or C2S +glass phase2 - 193 807 - C3S or C2S 3 - - 61 939 t-ZrO24 248 361 392 - glass phase + M2S 5 532 613 401 - M2S + glass phase
The existence of ZrO2 and forsterite may improve thermal shock resistance of bricks
33 Discussion
Three reactions may occur in the powder mixtures of zircon and MgO namely decomposition of zircon (Equation 1) solid solution of ZrO2 into MgO (Equation 2) and a reaction between SiO2 and MgO (Equation 3) The phase compositions of the samples depend on the zircon content and solubility of ZrO2 in periclase According to the MgO - ZrO2 phase diagram [6] the solubility of ZrO2 in periclase is about 26 wt at 1650oC Therefore the phase composition of sample Z3 (21 wt ZrO2) is only periclase because ZrO2 has dissolved into MgO completely However the phase compositions of Z6 and sample Z9 are periclase t-ZrO2 and forsterite since the ZrO2 content of sample Z6 (403 wt ZrO2) and sample Z9 (604 wt ZrO2) are more than 26 wt
4 2 2ZrSiO ZrO SiOrarr + (1)
2 2MgOMg Mg oZrO Zr V O⎯⎯⎯rarr + + (2)
2 22 4MgO SiO Mg SiO+ = (3) On the other hand SiO2 derived from the decomposition of zircon changes the ratio
of CaOSiO2 resulting in formation of a phase with a lower melt point The eutectoid points of samples are given in Tab IV based on the MgO-ZrO2-CaO-SiO2 phase diagram (as shown in Fig 7)
Fig 7 MgO-ZrO2-CaO-SiO2 phase diagram [7]
CPeng et al Science of Sintering 41 (2009) 11-17 ___________________________________________________________________________
16
It is obvious that the eutectoid point of the sample with a zircon content of 3 wt is much lower than that of a sample without zircon and also lower than for samples Z6 and Z9 The liquid phase improves sintering of samples resulting in an increase of BD PLS and strength of sintered samples but decrease of AP However when the zircon content increases from 6 wt to 9 wt AP BD and PLS of samples change a little There may be two reasons One is that two much ZrO2 remained in the grain boundaries inhibiting MgO boundary migration The second one is increase of viscosity of the liquid phase because of the increase of the SiO2 content in the liquid When the zircon content increases from 6 wt to 9 wt the strength of the samples decreases
Tab IV Chemical composition (wt ) and composition Tr (Tet) of samples
CaO SiO2 MgO ZrO2 CaOSiO2 Composition Tr or Tet of samples
Eutectoid point ( )
Z0 148 046 9748 - 322 Tr MgO-C3S-CaO 1890 Z3 144 132 9456 21 109 Tet MgO-ZrO2-CMS-
C3MS2 1470
Z6 140 218 9164 403 064 Tet MgO-ZrO2-M2S-CMS 1485 Z9 136 304 8872 604 045 Tet MgO-ZrO2-M2S-CMS 1485 Tr and Tet are abbreviation of triangle and tetrahedral respectively The reason may be that the microcracks formed by phase transition of ZrO2 during
cooling increase in the samples Based on the results mentioned above the 6 wt zircon content may be appropriate In this case the sample has a dense microstructure a reasonable ZrO2 content and lower content of glass phase
4 Conclusion
The appropriate zircon content in powder mixtures is 6 wt In this case the samples have a dense microstructure and lower content of glass phase and reasonable ZrO2 content
Acknowledgements This work is supported by the Henan Puyang Refractories Company China References
1 B Han Y Li C Guo N Li F Chen Ceram Int 33 (2007) 1563 2 V Martinac M Labor N Petric Mater Chem Phys 46 (1996) 23-30 3 A Nishida S Fukuda Y Kohtoku K Terai J Ceram Soc Jpn 100 (1992) 191 4 M Chaudhuri G Banerjee A Kumar SL Sarkar J Mater Sci 34 (1999) 5821 5 Y Guo J Luan F Tian Naihuo Cailiao 35 (2001) 281 (in Chinese) 6 Y Du Z P Jin P Y Huang CALPHAD Comput Coupling Phase Diagrams
Thermochem 16 (1992) 221 7 S Deaza C Richmond J White Trans J Br Ceram Soc 73 (1974) 109
Садржај Проучени су ефекти цирконијума на синтеровање састав и микроструктуру фузираних прахова магнезијума коришћењем XRD SEM и EDAX
CPeng et alScience of Sintering 41 (2009) 11-17 ___________________________________________________________________________
17
метода Повећање садржаја цирконијума до 6 масених процената увећава чврстину синтерованих узорака али се видљива порозност смањује Шест масених процената је оптималан садржај цирконијума јер узорци имају побољшана својства и у овом случају гушћу микроструктуру и мањи садржак стаклене фазе Присуство течне фазе која потиче од додатка цирконијума је главни разлог побољшања праха магнезијума Кључне речи Фузиран магнезијум цирконијум згушњавање
CPeng et alScience of Sintering 41 (2009) 11-17 ___________________________________________________________________________
13
content increased from 6 wt to 9 wt BD PLS and AP changed a little On the other hand the sintering temperature had an effect on the sintering of samples The difference of AP PLS and BD between samples sintered at 1400 and 1500oC were only small However BD and PLS of the samples increased and AP of the samples decreased when the sintering temperature rose from 1500 to 1650oC
0 3 6 9260
265
270
275
280
285
290
295
300
305
310
315
320
Bulk
den
sity
gc
m-3
Zircon content
1400ˇ ć 1500ˇ ć 1600ˇ ć 1650ˇ ć
0 3 6 912
14
16
18
20
22
24
26
28
App
aren
t por
osity
Zircon content
1400ˇ ć 1500ˇ ć 1600ˇ ć 1650ˇ ć
Fig 1 Variation of BD with zircon content
Fig 2 Variation of AP with zircon content
Fig4 gives the effect of zircon content on MOR of the samples sintered at different
temperatures It was found that with the increase of zircon content up to 6 wt MOR of samples sintered at 1400 1500 1600 and 1650oC increased However when the zircon content increased from 6 wt to 9 wt MOR of the samples sintered at 1600 and 1650oC decreased
0 3 6 9-70-65-60-55-50-45-40-35-30-25-20-15-10-0500
1400ˇ ć 1500ˇ ć 1600ˇ ć 1650ˇ ć
Line
ar s
hrin
kage
Zircon content 0 3 6 9
20
22
24
26
28
30
32
34
36
38
40
42
Col
d m
odul
us o
f rup
ture
MP
a
Zircon content
1400ˇ ć 1500ˇ ć 1600ˇ ć 1650ˇ ć
Fig 3 Variation of PLS with zircon content
Fig 4 Variation of MOR with zircon content
At the same time the MOR of the samples sintered increased with rising of the
sintering temperature
32 Phase analysis and microstructure
Fig5 shows an XRD pattern of samples sintered with various zircon contents at 1650oC for 3h It revealed that only periclase was detected in samples Z0 and Z3 However t-ZrO2 and forsterite were detected in sample Z6 to which 6 wt zircon was added No crystal phase containing CaO was detected showing that CaO and other impurities are in glass phase
Fig 6(a b) shows the microstructure of samples Z0 and Z6 soaked at 1650oC for 3h
CPeng et al Science of Sintering 41 (2009) 11-17 ___________________________________________________________________________
14
respectively Sample Z0 (Fig 6a) has a porous microstructure with more angular and well-defined edged periclase grains Sample Z6 (Fig 6b) exhibits a dense microstructure with round and ellipsoidal periclase grains White ZrO2 is embedded in the intergranular gaps of periclase grains The formation of forsterite and the dense microstructure are the reasons for strength increase of the sintered samples
10 20 30 40 50 60 70 80 90
ZZ
Z
P
P
P
PFF F
Inte
nsity
(au
)
2θ (degree)
Z0
Z3
Z6
Z9
P PericlaseZ t-ZrO2
F Forsterite
FZ
P
Fig 5 XRD of samples with different zircon content fired at 1650oC
(a) (b)
(c) (d) Fig 6 SEM micrographs of samples sintered at 1650oC (a) sample Z0 (b) sample Z6 (c) magnified SEM micrograph of sample Z0 (d) magnified SEM micrograph of sample Z6
CPeng et alScience of Sintering 41 (2009) 11-17 ___________________________________________________________________________
15
Tab III gives the composition of phases in Fig 6 (c d) by EDAX It is possible that there is calcium silicate and a little glass phase in samples without zircon addition In the samples with zircon additive there are ZrO2 forsterite and more glass phase Tab III Composition (wt ) of phases in Fig 6 (c d)
MgO SiO2 CaO ZrO2 Possible phase 1 43 256 701 - C3S or C2S +glass phase2 - 193 807 - C3S or C2S 3 - - 61 939 t-ZrO24 248 361 392 - glass phase + M2S 5 532 613 401 - M2S + glass phase
The existence of ZrO2 and forsterite may improve thermal shock resistance of bricks
33 Discussion
Three reactions may occur in the powder mixtures of zircon and MgO namely decomposition of zircon (Equation 1) solid solution of ZrO2 into MgO (Equation 2) and a reaction between SiO2 and MgO (Equation 3) The phase compositions of the samples depend on the zircon content and solubility of ZrO2 in periclase According to the MgO - ZrO2 phase diagram [6] the solubility of ZrO2 in periclase is about 26 wt at 1650oC Therefore the phase composition of sample Z3 (21 wt ZrO2) is only periclase because ZrO2 has dissolved into MgO completely However the phase compositions of Z6 and sample Z9 are periclase t-ZrO2 and forsterite since the ZrO2 content of sample Z6 (403 wt ZrO2) and sample Z9 (604 wt ZrO2) are more than 26 wt
4 2 2ZrSiO ZrO SiOrarr + (1)
2 2MgOMg Mg oZrO Zr V O⎯⎯⎯rarr + + (2)
2 22 4MgO SiO Mg SiO+ = (3) On the other hand SiO2 derived from the decomposition of zircon changes the ratio
of CaOSiO2 resulting in formation of a phase with a lower melt point The eutectoid points of samples are given in Tab IV based on the MgO-ZrO2-CaO-SiO2 phase diagram (as shown in Fig 7)
Fig 7 MgO-ZrO2-CaO-SiO2 phase diagram [7]
CPeng et al Science of Sintering 41 (2009) 11-17 ___________________________________________________________________________
16
It is obvious that the eutectoid point of the sample with a zircon content of 3 wt is much lower than that of a sample without zircon and also lower than for samples Z6 and Z9 The liquid phase improves sintering of samples resulting in an increase of BD PLS and strength of sintered samples but decrease of AP However when the zircon content increases from 6 wt to 9 wt AP BD and PLS of samples change a little There may be two reasons One is that two much ZrO2 remained in the grain boundaries inhibiting MgO boundary migration The second one is increase of viscosity of the liquid phase because of the increase of the SiO2 content in the liquid When the zircon content increases from 6 wt to 9 wt the strength of the samples decreases
Tab IV Chemical composition (wt ) and composition Tr (Tet) of samples
CaO SiO2 MgO ZrO2 CaOSiO2 Composition Tr or Tet of samples
Eutectoid point ( )
Z0 148 046 9748 - 322 Tr MgO-C3S-CaO 1890 Z3 144 132 9456 21 109 Tet MgO-ZrO2-CMS-
C3MS2 1470
Z6 140 218 9164 403 064 Tet MgO-ZrO2-M2S-CMS 1485 Z9 136 304 8872 604 045 Tet MgO-ZrO2-M2S-CMS 1485 Tr and Tet are abbreviation of triangle and tetrahedral respectively The reason may be that the microcracks formed by phase transition of ZrO2 during
cooling increase in the samples Based on the results mentioned above the 6 wt zircon content may be appropriate In this case the sample has a dense microstructure a reasonable ZrO2 content and lower content of glass phase
4 Conclusion
The appropriate zircon content in powder mixtures is 6 wt In this case the samples have a dense microstructure and lower content of glass phase and reasonable ZrO2 content
Acknowledgements This work is supported by the Henan Puyang Refractories Company China References
1 B Han Y Li C Guo N Li F Chen Ceram Int 33 (2007) 1563 2 V Martinac M Labor N Petric Mater Chem Phys 46 (1996) 23-30 3 A Nishida S Fukuda Y Kohtoku K Terai J Ceram Soc Jpn 100 (1992) 191 4 M Chaudhuri G Banerjee A Kumar SL Sarkar J Mater Sci 34 (1999) 5821 5 Y Guo J Luan F Tian Naihuo Cailiao 35 (2001) 281 (in Chinese) 6 Y Du Z P Jin P Y Huang CALPHAD Comput Coupling Phase Diagrams
Thermochem 16 (1992) 221 7 S Deaza C Richmond J White Trans J Br Ceram Soc 73 (1974) 109
Садржај Проучени су ефекти цирконијума на синтеровање састав и микроструктуру фузираних прахова магнезијума коришћењем XRD SEM и EDAX
CPeng et alScience of Sintering 41 (2009) 11-17 ___________________________________________________________________________
17
метода Повећање садржаја цирконијума до 6 масених процената увећава чврстину синтерованих узорака али се видљива порозност смањује Шест масених процената је оптималан садржај цирконијума јер узорци имају побољшана својства и у овом случају гушћу микроструктуру и мањи садржак стаклене фазе Присуство течне фазе која потиче од додатка цирконијума је главни разлог побољшања праха магнезијума Кључне речи Фузиран магнезијум цирконијум згушњавање
CPeng et al Science of Sintering 41 (2009) 11-17 ___________________________________________________________________________
14
respectively Sample Z0 (Fig 6a) has a porous microstructure with more angular and well-defined edged periclase grains Sample Z6 (Fig 6b) exhibits a dense microstructure with round and ellipsoidal periclase grains White ZrO2 is embedded in the intergranular gaps of periclase grains The formation of forsterite and the dense microstructure are the reasons for strength increase of the sintered samples
10 20 30 40 50 60 70 80 90
ZZ
Z
P
P
P
PFF F
Inte
nsity
(au
)
2θ (degree)
Z0
Z3
Z6
Z9
P PericlaseZ t-ZrO2
F Forsterite
FZ
P
Fig 5 XRD of samples with different zircon content fired at 1650oC
(a) (b)
(c) (d) Fig 6 SEM micrographs of samples sintered at 1650oC (a) sample Z0 (b) sample Z6 (c) magnified SEM micrograph of sample Z0 (d) magnified SEM micrograph of sample Z6
CPeng et alScience of Sintering 41 (2009) 11-17 ___________________________________________________________________________
15
Tab III gives the composition of phases in Fig 6 (c d) by EDAX It is possible that there is calcium silicate and a little glass phase in samples without zircon addition In the samples with zircon additive there are ZrO2 forsterite and more glass phase Tab III Composition (wt ) of phases in Fig 6 (c d)
MgO SiO2 CaO ZrO2 Possible phase 1 43 256 701 - C3S or C2S +glass phase2 - 193 807 - C3S or C2S 3 - - 61 939 t-ZrO24 248 361 392 - glass phase + M2S 5 532 613 401 - M2S + glass phase
The existence of ZrO2 and forsterite may improve thermal shock resistance of bricks
33 Discussion
Three reactions may occur in the powder mixtures of zircon and MgO namely decomposition of zircon (Equation 1) solid solution of ZrO2 into MgO (Equation 2) and a reaction between SiO2 and MgO (Equation 3) The phase compositions of the samples depend on the zircon content and solubility of ZrO2 in periclase According to the MgO - ZrO2 phase diagram [6] the solubility of ZrO2 in periclase is about 26 wt at 1650oC Therefore the phase composition of sample Z3 (21 wt ZrO2) is only periclase because ZrO2 has dissolved into MgO completely However the phase compositions of Z6 and sample Z9 are periclase t-ZrO2 and forsterite since the ZrO2 content of sample Z6 (403 wt ZrO2) and sample Z9 (604 wt ZrO2) are more than 26 wt
4 2 2ZrSiO ZrO SiOrarr + (1)
2 2MgOMg Mg oZrO Zr V O⎯⎯⎯rarr + + (2)
2 22 4MgO SiO Mg SiO+ = (3) On the other hand SiO2 derived from the decomposition of zircon changes the ratio
of CaOSiO2 resulting in formation of a phase with a lower melt point The eutectoid points of samples are given in Tab IV based on the MgO-ZrO2-CaO-SiO2 phase diagram (as shown in Fig 7)
Fig 7 MgO-ZrO2-CaO-SiO2 phase diagram [7]
CPeng et al Science of Sintering 41 (2009) 11-17 ___________________________________________________________________________
16
It is obvious that the eutectoid point of the sample with a zircon content of 3 wt is much lower than that of a sample without zircon and also lower than for samples Z6 and Z9 The liquid phase improves sintering of samples resulting in an increase of BD PLS and strength of sintered samples but decrease of AP However when the zircon content increases from 6 wt to 9 wt AP BD and PLS of samples change a little There may be two reasons One is that two much ZrO2 remained in the grain boundaries inhibiting MgO boundary migration The second one is increase of viscosity of the liquid phase because of the increase of the SiO2 content in the liquid When the zircon content increases from 6 wt to 9 wt the strength of the samples decreases
Tab IV Chemical composition (wt ) and composition Tr (Tet) of samples
CaO SiO2 MgO ZrO2 CaOSiO2 Composition Tr or Tet of samples
Eutectoid point ( )
Z0 148 046 9748 - 322 Tr MgO-C3S-CaO 1890 Z3 144 132 9456 21 109 Tet MgO-ZrO2-CMS-
C3MS2 1470
Z6 140 218 9164 403 064 Tet MgO-ZrO2-M2S-CMS 1485 Z9 136 304 8872 604 045 Tet MgO-ZrO2-M2S-CMS 1485 Tr and Tet are abbreviation of triangle and tetrahedral respectively The reason may be that the microcracks formed by phase transition of ZrO2 during
cooling increase in the samples Based on the results mentioned above the 6 wt zircon content may be appropriate In this case the sample has a dense microstructure a reasonable ZrO2 content and lower content of glass phase
4 Conclusion
The appropriate zircon content in powder mixtures is 6 wt In this case the samples have a dense microstructure and lower content of glass phase and reasonable ZrO2 content
Acknowledgements This work is supported by the Henan Puyang Refractories Company China References
1 B Han Y Li C Guo N Li F Chen Ceram Int 33 (2007) 1563 2 V Martinac M Labor N Petric Mater Chem Phys 46 (1996) 23-30 3 A Nishida S Fukuda Y Kohtoku K Terai J Ceram Soc Jpn 100 (1992) 191 4 M Chaudhuri G Banerjee A Kumar SL Sarkar J Mater Sci 34 (1999) 5821 5 Y Guo J Luan F Tian Naihuo Cailiao 35 (2001) 281 (in Chinese) 6 Y Du Z P Jin P Y Huang CALPHAD Comput Coupling Phase Diagrams
Thermochem 16 (1992) 221 7 S Deaza C Richmond J White Trans J Br Ceram Soc 73 (1974) 109
Садржај Проучени су ефекти цирконијума на синтеровање састав и микроструктуру фузираних прахова магнезијума коришћењем XRD SEM и EDAX
CPeng et alScience of Sintering 41 (2009) 11-17 ___________________________________________________________________________
17
метода Повећање садржаја цирконијума до 6 масених процената увећава чврстину синтерованих узорака али се видљива порозност смањује Шест масених процената је оптималан садржај цирконијума јер узорци имају побољшана својства и у овом случају гушћу микроструктуру и мањи садржак стаклене фазе Присуство течне фазе која потиче од додатка цирконијума је главни разлог побољшања праха магнезијума Кључне речи Фузиран магнезијум цирконијум згушњавање
CPeng et alScience of Sintering 41 (2009) 11-17 ___________________________________________________________________________
15
Tab III gives the composition of phases in Fig 6 (c d) by EDAX It is possible that there is calcium silicate and a little glass phase in samples without zircon addition In the samples with zircon additive there are ZrO2 forsterite and more glass phase Tab III Composition (wt ) of phases in Fig 6 (c d)
MgO SiO2 CaO ZrO2 Possible phase 1 43 256 701 - C3S or C2S +glass phase2 - 193 807 - C3S or C2S 3 - - 61 939 t-ZrO24 248 361 392 - glass phase + M2S 5 532 613 401 - M2S + glass phase
The existence of ZrO2 and forsterite may improve thermal shock resistance of bricks
33 Discussion
Three reactions may occur in the powder mixtures of zircon and MgO namely decomposition of zircon (Equation 1) solid solution of ZrO2 into MgO (Equation 2) and a reaction between SiO2 and MgO (Equation 3) The phase compositions of the samples depend on the zircon content and solubility of ZrO2 in periclase According to the MgO - ZrO2 phase diagram [6] the solubility of ZrO2 in periclase is about 26 wt at 1650oC Therefore the phase composition of sample Z3 (21 wt ZrO2) is only periclase because ZrO2 has dissolved into MgO completely However the phase compositions of Z6 and sample Z9 are periclase t-ZrO2 and forsterite since the ZrO2 content of sample Z6 (403 wt ZrO2) and sample Z9 (604 wt ZrO2) are more than 26 wt
4 2 2ZrSiO ZrO SiOrarr + (1)
2 2MgOMg Mg oZrO Zr V O⎯⎯⎯rarr + + (2)
2 22 4MgO SiO Mg SiO+ = (3) On the other hand SiO2 derived from the decomposition of zircon changes the ratio
of CaOSiO2 resulting in formation of a phase with a lower melt point The eutectoid points of samples are given in Tab IV based on the MgO-ZrO2-CaO-SiO2 phase diagram (as shown in Fig 7)
Fig 7 MgO-ZrO2-CaO-SiO2 phase diagram [7]
CPeng et al Science of Sintering 41 (2009) 11-17 ___________________________________________________________________________
16
It is obvious that the eutectoid point of the sample with a zircon content of 3 wt is much lower than that of a sample without zircon and also lower than for samples Z6 and Z9 The liquid phase improves sintering of samples resulting in an increase of BD PLS and strength of sintered samples but decrease of AP However when the zircon content increases from 6 wt to 9 wt AP BD and PLS of samples change a little There may be two reasons One is that two much ZrO2 remained in the grain boundaries inhibiting MgO boundary migration The second one is increase of viscosity of the liquid phase because of the increase of the SiO2 content in the liquid When the zircon content increases from 6 wt to 9 wt the strength of the samples decreases
Tab IV Chemical composition (wt ) and composition Tr (Tet) of samples
CaO SiO2 MgO ZrO2 CaOSiO2 Composition Tr or Tet of samples
Eutectoid point ( )
Z0 148 046 9748 - 322 Tr MgO-C3S-CaO 1890 Z3 144 132 9456 21 109 Tet MgO-ZrO2-CMS-
C3MS2 1470
Z6 140 218 9164 403 064 Tet MgO-ZrO2-M2S-CMS 1485 Z9 136 304 8872 604 045 Tet MgO-ZrO2-M2S-CMS 1485 Tr and Tet are abbreviation of triangle and tetrahedral respectively The reason may be that the microcracks formed by phase transition of ZrO2 during
cooling increase in the samples Based on the results mentioned above the 6 wt zircon content may be appropriate In this case the sample has a dense microstructure a reasonable ZrO2 content and lower content of glass phase
4 Conclusion
The appropriate zircon content in powder mixtures is 6 wt In this case the samples have a dense microstructure and lower content of glass phase and reasonable ZrO2 content
Acknowledgements This work is supported by the Henan Puyang Refractories Company China References
1 B Han Y Li C Guo N Li F Chen Ceram Int 33 (2007) 1563 2 V Martinac M Labor N Petric Mater Chem Phys 46 (1996) 23-30 3 A Nishida S Fukuda Y Kohtoku K Terai J Ceram Soc Jpn 100 (1992) 191 4 M Chaudhuri G Banerjee A Kumar SL Sarkar J Mater Sci 34 (1999) 5821 5 Y Guo J Luan F Tian Naihuo Cailiao 35 (2001) 281 (in Chinese) 6 Y Du Z P Jin P Y Huang CALPHAD Comput Coupling Phase Diagrams
Thermochem 16 (1992) 221 7 S Deaza C Richmond J White Trans J Br Ceram Soc 73 (1974) 109
Садржај Проучени су ефекти цирконијума на синтеровање састав и микроструктуру фузираних прахова магнезијума коришћењем XRD SEM и EDAX
CPeng et alScience of Sintering 41 (2009) 11-17 ___________________________________________________________________________
17
метода Повећање садржаја цирконијума до 6 масених процената увећава чврстину синтерованих узорака али се видљива порозност смањује Шест масених процената је оптималан садржај цирконијума јер узорци имају побољшана својства и у овом случају гушћу микроструктуру и мањи садржак стаклене фазе Присуство течне фазе која потиче од додатка цирконијума је главни разлог побољшања праха магнезијума Кључне речи Фузиран магнезијум цирконијум згушњавање
Recommended


![monazite/zircon and futile]zircon (multiple passes - downloads](https://img.pdfslide.us/doc/110x75/6231ccd013e4e240230def43/monazitezircon-and-futilezircon-multiple-passes-downloads.jpg)