JTTEE5 2:339-344 �9 International
Effect of Plasma Spray Operating Conditions on Plasma Jet Characteristics
and Coating Properties S. Malmberg and J. Heberlein
Using statistical design of experiments, the arc current, total gas flow rate, percent secondary gas (He), and powder feed rate have been varied to assess the torch behavior and establish its correlation to coating properties. The torch response includes arc voltage drop, torch efficiency, and plasma jet geometry. High-speed images of the luminous plasma jet for each operating condition have been acquired with a LaserStrobe TM videoeamera, and image analysis has been used to quantify the jet length and jet fluctua- tions as additional torch responses. Porosity and unmelted particles, which are determined using image analysis of a micrograph of a NiAI coating cross section, were selected as principal coating charac- teristics. These findings are expected to be useful for optimization of new spray processes and for evalu- ation of new torch designs.
1. Introduction
THE properties and quality of a plasma-sprayed coating depend on the operating conditions of the plasma spray system, the size of the plasma jet hot zone, and the heat and momentum transfer from the plasma jet to the particles. The complex nature of a thermal plasma makes theoretical understanding of particle mo- tion and heat and mass transfer difficult.D] Plasma jet structure and turbulence affect the quantity of air entrainment and, there- fore, the heat transfer rates to particles traveling through the plasma jet. [2] Techniques to measure particle size, velocity, and temperature during spraying have been introduced by Fincke et al. [3] and by Vardelle et al. [4] The complexity of these techniques requires long experimental operating times, expensive labora- tory equipment, and well-controlled conditions, thereby making extensive experimentation difficult and prohibiting its use in a manufacturing environment. A new technique used here [51 uses the LaserStrobC M Vision system and image analysis to measure the luminous plasma jet geometry and particle velocity during plasma spraying.
Traditional manufacturing systems control the plasma torch operating conditions based on previous experience in estab- lishing a quality coating, without a fundamental understanding of what occurs in the plasma jet. Previous research [6] has indi- cated that slight changes in operating conditions greatly affect coating properties. A number o f papers, for example Ref 7 to 9, have been dedicated to the use of design of experiments for re- lating coating properties to the operating parameters used during plasma spraying. Design of experiment techniques have been used to study the effects of operating conditions on the plasma jet and particle velocities as well as the coating properties during plasma spraying.
~K ey Words: image analysis, microstructure, plasma jet characteristics, spray distribution, visualization
S. Malmberg and J. Heberlein, Department of Mechanical Engineering and ERC for Plasma-Aided Manufacturing, University of Minnesota, Min- neapolis, Minnesota.
2. Experimental Method
2.1 Plasma Spray System
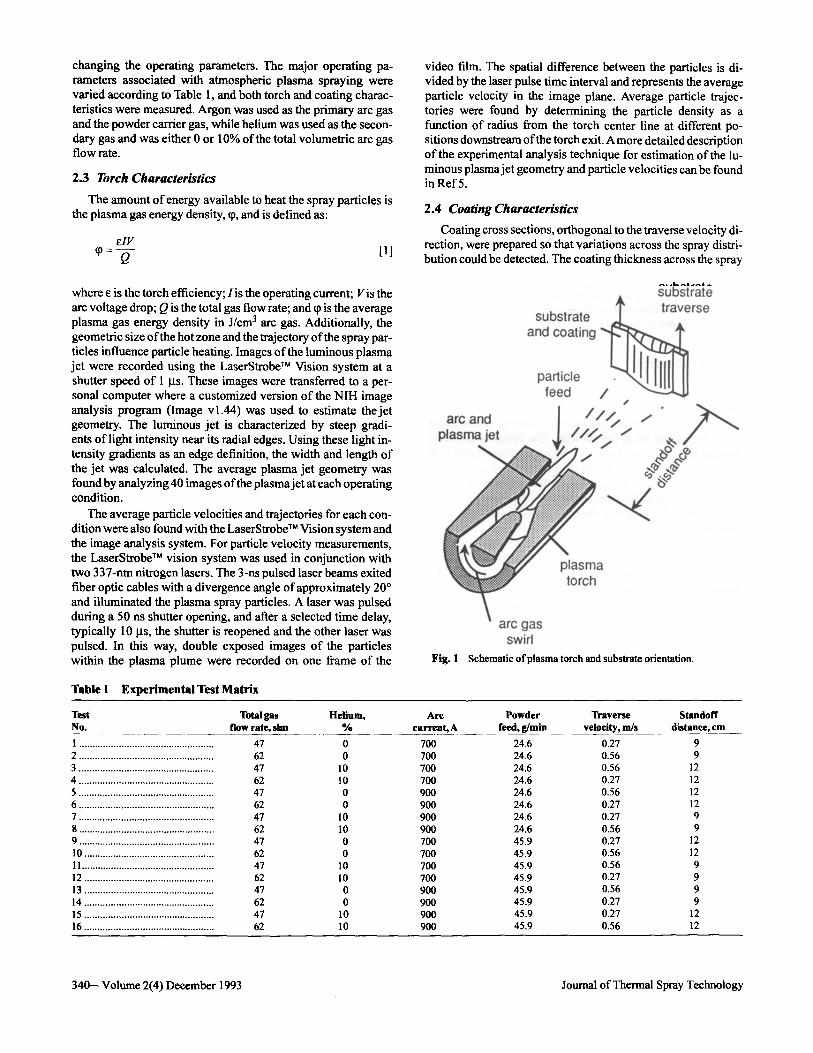
The orientation of the substrate and coating with respect to the plasma torch is depicted in Fig. 1. The substrate, attached to a rotating 30.5-cm diameter disk, is orthogonal to the torch cen- ter line and repeatedly travels past the torch, at a desired traverse velocity. In this way, a coating has been built up layer by layer such that the spray distribution could be analyzed. The Miller SG-100 plasma torch in the subsonic configuration (anode 2083-145, cathode 1083A- 129, gas injector 2083-130) was used for all of the experiments, with operating parameters set accord- ing to Table 1. Powder was injected at the top of the torch normal to the torch center line with a slight forward angle. The 95/5% NiAl alloy powder (Alloys International 1037) used in these ex- periments was spherical with a size distribution of 50 to 100 ktm, a mean size of 85 ~tm, and a standard deviation of 12 ~tm. The particles, suspended in an argon carder gas flowing at 4.5 slm, enter the 8-mm diameter anode nozzle with a velocity of about 7 m/s. Coatings were formed on a grit-blasted mild steel substrate over a 2-min spraying time without the aid o f substrate cooling or preheating.
Arc gas was injected at the base of the cathode such that the gas swirls around the cathode and into the anode nozzle. The swirl motion is used to both stabilize the cathode arc attachment while continuously moving the anode arc attachment reducing the arc spot heat load on the anode.
2.2 Design of Experiments
Design of experiment methods allow the determination of ef- fects o f operating parameter variation on responses such as spe- cific coating properties. [1~ The typical methodology is to select high and low levels o f the operating parameters and through a series of experiments determine the effect o f these parameters on the response. The response is any measurable characteristic of the system, i.e., porosity, number of unmelted particles in a coating, arc voltage drop, etc.
A 2 (6-2) fractional factorial experiment [1 l] was used to esti- mate the variation in torch performance and coating quality by
Journal of Thermal Spray Technology Volume 2(4) December 1993--339
changing the operating parameters. The major operating pa- rameters associated with atmospheric plasma spraying were varied according to Table 1, and both torch and coating charac- teristics were measured. Argon was used as the primary arc gas and the powder carrier gas, while helium was used as the secon- dary gas and was either 0 or 10% of the total volumetric arc gas flow rate.
2.3 Torch Characteristics
The amount o f energy available to heat the spray particles is the plasma gas energy density, (p, and is defined as:
~IV ~ : - 0 - [l]
where e is the torch eff iciency;/ is the operating current; Vis the arc voltage drop; Q is the total gas flow rate; and q) is the average plasma gas energy density in J/cm 3 arc gas. Additionally, the geometric size of the hot zone and the trajectory o f the spray par- ticles influence particle heating. Images of the luminous plasma jet were recorded using the LaserStrobe TM Vision system at a shutter speed of 1 p-s. These images were transferred to a per- sonal computer where a customized version of the NIH image analysis program (Image vl .44) was used to estimate the jet geometry. The luminous jet is characterized by steep gradi- ents of light intensity near its radial edges. Using these light in- tensity gradients as an edge definition, the width and length of the jet was calculated. The average plasma jet geometry was found by analyzing 40 images of the plasma jet at each operating condition.
The average particle velocities and trajectories for each con- dition were also found with the LaserStrobe TM Vision system and the image analysis system. For particle velocity measurements, the LaserStrobe TM vision system was used in conjunction with two 337-nm nitrogen lasers. The 3-ns pulsed laser beams exited fiber optic cables with a divergence angle of approximately 20 ~ and illuminated the plasma spray particles. A laser was pulsed during a 50 ns shutter opening, and after a selected time delay, typically 10 p.s, the shutter is reopened and the other laser was pulsed. In this way, double exposed images of the particles within the plasma plume were recorded on one frame of the
video film. The spatial difference between the particles is di- vided by the laser pulse time interval and represents the average particle velocity in the image plane. Average particle trajec- tories were found by determining the particle density as a function of radius from the torch center line at different po- sitions downstream of the torch exit. A more detailed description of the experimental analysis technique for estimation of the lu- minous plasma jet geometry and particle velocities can be found in Ref 5.
2.4 Coating Characteristics
Coating cross sections, orthogonal to the traverse velocity di- rection, were prepared so that variations across the spray distri- bution could be detected. The coating thickness across the spray
substrate
substrate ~ r s e . ~,nm~ nn and coating
particle feed /
J
arc and I ///.,,. / plasma jet | / / / I " /
~ ' ~ plasma torch
arc gas swirl
Fig. 1 Schematic of plasma torch and substrate orientation.
Table 1 E x p e r i m e n t a l T e s t Matrix
Test Total gas Helium, Arc Powder Traverse Standoff No. flow rate, sire % current, A feed, g/min velocity, m/s distance, cm
I . . . . . . . . . . . . . . . . . . . . . . . . . . . . . . . . . . . . . . . . . . . . . . . . . . . 4 7
2 . . . . . . . . . . . . . . . . . . . . . . . . . . . . . . . . . . . . . . . . . . . . . . . . . . . 6 2
3 . . . . . . . . . . . . . . . . . . . . . . . . . . . . . . . . . . . . . . . . . . . . . . . . . . . 4 7
4 . . . . . . . . . . . . . . . . . . . . . . . . . . . . . . . . . . . . . . . . . . . . . . . . . . . 6 2
5 . . . . . . . . . . . . . . . . . . . . . . . . . . . . . . . . . . . . . . . . . . . . . . . . . . . 4 7
6 ................................................... 62 7 ................................................... 47 8 ................................................... 62 9 ................................................... 47 10 ................................................. 62 11 .................................................. 47 12 ................................................. 62 13 ................................................. 47 14 ................................................. 62 15 ................................................. 47 16 ................................................. 62
0 700 24.6 0.27 9 0 700 24.6 0.56 9
10 700 24.6 0.56 12 10 700 24.6 0.27 12 0 900 24.6 0.56 12 0 900 24.6 0.27 12
10 900 24.6 0.27 9 10 900 24.6 0.56 9 0 700 45.9 0.27 12 0 700 45.9 0.56 12
10 700 45.9 0.56 9 10 700 45.9 0.27 9 0 900 45.9 0.56 9 0 900 45.9 0.27 9
10 900 45.9 0.27 12 10 900 45.9 0.56 12
340--Volume 2(4) December 1993 Journal of Thermal Spray Technology
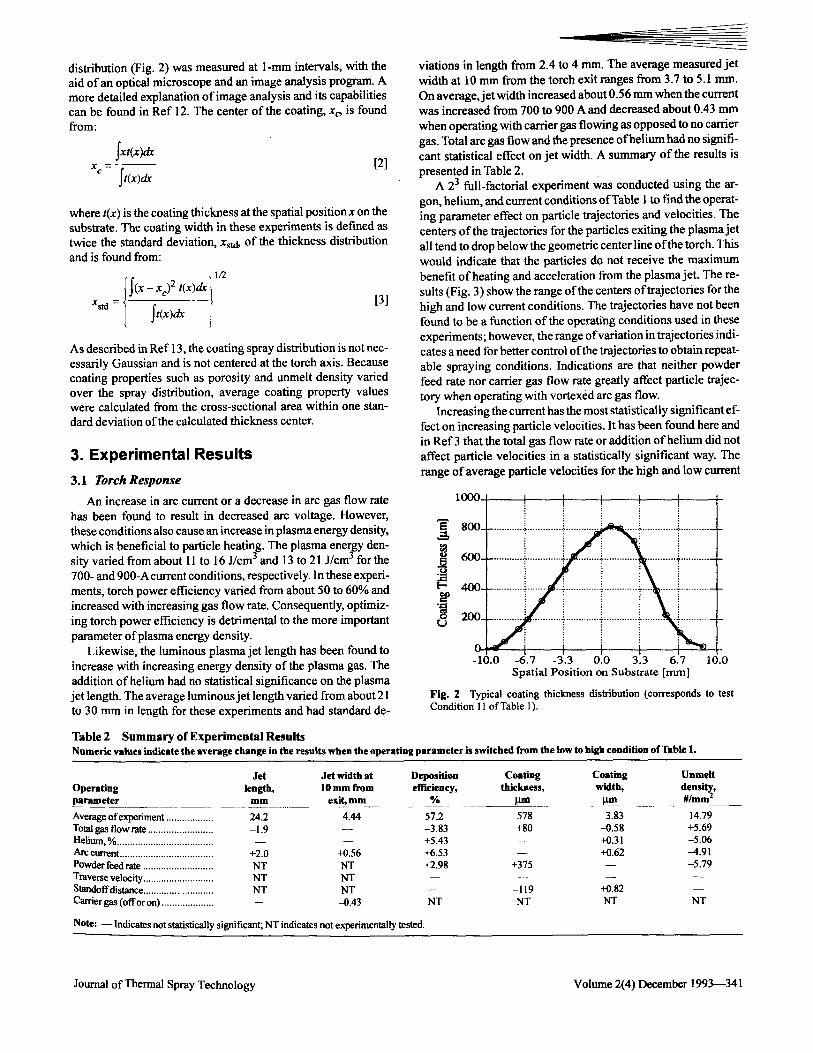
distribution (Fig. 2) was measured at l-ram intervals, with the aid of an optical microscope and an image analysis program. A more detailed explanation o f image analysis and its capabilities can be found in Ref 12. The center o f the coating, Xc, is found from:
Sxt(x)ak [2]
x c - ~t(x)a~
where t(x) is the coating thickness at the spatial position x on the substrate. The coating width in these experiments is defined as twice the standard deviation, Xs~ of the thickness distribution and is found from:
1/2
Xsid = [ ft(x)dac J [3]
As described in Ref 13, the coating spray distribution is not nec- essarily Gaussian and is not centered at the torch axis. Because coating properties such as porosity and unmelt density varied over the spray distribution, average coating property values were calculated from the cross-sectional area within one stan- dard deviation of the calculated thickness center.
3. Experimental Results 3.1 Torch Response
An increase in arc current or a decrease in arc gas flow rate has been found to result in decreased arc voltage. However, these conditions also cause an increase in plasma energy density, which is beneficial to particle heating. The plasma energy den- sity varied from about 11 to 16 J/cm 3 and 13 to 21 J/cm 3 for the 700- and 900-A current conditions, respectively. In these experi- ments, torch power efficiency varied from about 50 to 60% and increased with increasing gas flow rate. Consequently, optimiz- ing torch power efficiency is detrimental to the more important parameter of plasma energy density.
Likewise, the luminous plasma jet length has been found to increase with increasing energy density of the plasma gas. The addition of helium had no statistical significance on the plasma jet length. The average luminous jet length varied from about 21 to 30 mm in length for these experiments and had standard de-
Table 2 S u m m a r y o f E x p e r i m e n t a l R e s u l t s
viations in length from 2.4 to 4 ram. The average measured jet width at 10 mm from the torch exit ranges from 3.7 to 5.1 mm. On average, jet width increased about 0.56 mm when the current was increased from 700 to 900 A and decreased about 0.43 mm when operating with carrier gas flowing as opposed to no carrier gas. Total arc gas flow and the presence o f helium had no signifi- cant statistical effect on jet width. A summary o f the results is presented in Table 2.
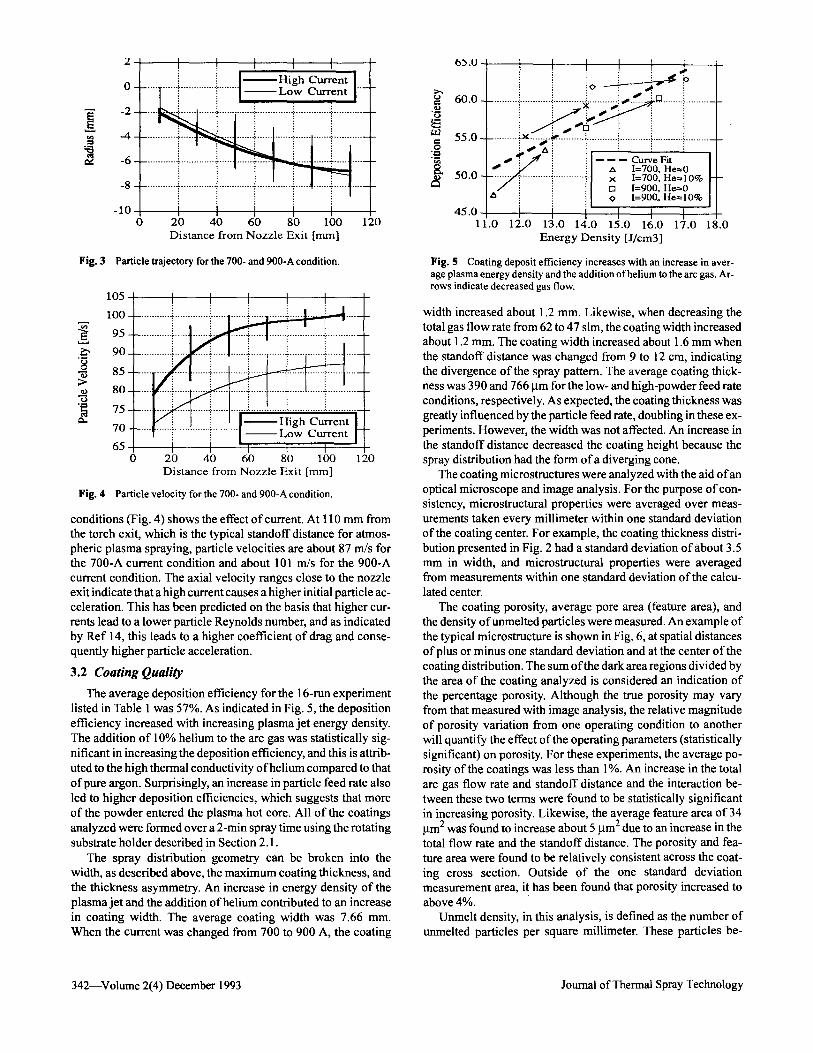
A 23 full-factorial experiment was conducted using the ar- gon, helium, and current conditions of Table I to find the operat- ing parameter effect on particle trajectories and velocities. The centers of the trajectories for the particles exiting the plasma jet all tend to drop below the geometric center line o f the torch. This would indicate that the particles do not receive the maximum benefit o f heating and acceleration from the plasma jet. The re- sults (Fig. 3) show the range of the centers of trajectories for the high and low current conditions. The trajectories have not been found to be a function of the operating conditions used in these experiments; however, the range of variation in trajectories indi- cates a need for better control of the trajectories to obtain repeat- able spraying conditions. Indications are that neither powder feed rate nor carrier gas flow rate greatly affect particle trajec- tory when operating with vortexed arc gas flow.
Increasing the current has the most statistically significant ef- fect on increasing particle velocities. It has been found here and in Ref3 that the total gas flow rate or addition o f helium did not affect particle velocities in a statistically significant way. The range of average particle velocities for the high and low current
1000 ! !
8o0_
o 6 0 0 -
F- 400-
"~ 200_ L)
O -10.0 -6.7 -3.3 0.0 3.3 6.7 10.0
Spatial Position on Substrate [ram]
Fig. 2 Typical coating thickness distribution (corresponds to test Condition 11 of Table 1 ).
Numeric values indicate the average change in the results when the operating parameter is switched from the low to high condition o f Tab le 1.
Jet Jet width at Deposition Coating Coating Operating length, 10 mm from efficiency, thickness, width, parameter mm exit, mm % pm um
Average of experiment .................. 24.2 Total gas flow rate ......................... -1.9 Helium, % ..................................... - - Arc current .................................... +2.0 Powder feed rate ........................... NT Traverse velocity ........................... NT Standoffdistance ........................... NT Cartier gas (offor on) .................... - -
Uumelt density, #/ram 2
4.44 57.2 578 3.83 14.79 - - -3.83 +80 -0.58 +5.69 - - +5.43 - - +0.31 -5.06
+0.56 +6.53 - - +0.62 -4.91 NT +2.98 +375 - - -5.79 NT . . . . NT - - -119 +0.82 - - -0.43 NT NT NT NT
Note: - - Indicates not statistically significant; NT indicates not experimentally tested.
Journal of Thermal Spray Technology Volume 2(4) December 1993--341
F i g . 3
2
0
-2
- 4 -
- 6 -
-8
-10 0
I I I
..... I r .............. r ........ I .
20 40 60 80 100 120 Distance from Nozzle Exit [ram]
Particle trajectory for the 700- and 900-A condition.
105
100
~ 95
.~ 90
8 85 >
80
"~ 75
70
65 0 20 40 60 80 100 120
Distance from Nozzle Exit [mm]
Fig. 4 Particle velocity for the 700- and 900-A condition.
conditions (Fig. 4) shows the effect o f current. At 110 mm from the torch exit, which is the typical standoff distance for atmos- pheric plasma spraying, particle velocities are about 87 m/s for the 700-A current condition and about 101 m/s for the 900-A current condition. The axial velocity ranges close to the nozzle exit indicate that a high current causes a higher initial particle ac- celeration. This has been predicted on the basis that higher cur- rents lead to a lower particle Reynolds number, and as indicated by Ref 14, this leads to a higher coefficient of drag and conse- quently higher particle acceleration.
3 . 2 Coating Quality The average deposition efficiency for the 16-run experiment
listed in Table 1 was 57%. As indicated in Fig. 5, the deposition efficiency increased with increasing plasma jet energy density. The addition of 10% helium to the arc gas was statistically sig- nificant in increasing the deposition efficiency, and this is attrib- uted to the high thermal conductivity of helium compared to that of pure argon. Surprisingly, an increase in particle feed rate also led to higher deposition efficiencies, which suggests that more of the powder entered the plasma hot core. All of the coatings analyzed were formed over a 2-rain spray time using the rotating substrate holder described in Section 2.1.
The spray distribution geometry can be broken into the width, as described above, the maximum coating thickness, and the thickness asymmetry. An increase in energy density of the plasma jet and the addition of helium contributed to an increase in coating width. The average coating width was 7.66 mm. When the current was changed from 700 to 900 A, the coating
65 .O l I [ t ~.
60.0 ........... i ............ ~ ........... ~ ........ ~i'~22>~ ........ ~ ..........
= 5 5 . 0 . . . . . . . . . . = . x . . . . . . . . ~ . . . . . . . . . . : . . . . . . . . . . . . . . . . . ~ _
"~ m m ~ Curve Fit " ~ 5 0 . 0 ................ ~'• 1=700,1=700, He---tHe-'-00% ~:~ rn 1=900, He.=0 A : <> 1=900, He=lO%
45.0 j [ I [ 1.0 12.0 13.0 14.0 15.0 16.0 17.0 18.0
Energy Density [J/cm3]
Fig. 5 Coating deposit efficiency increases with an increase in aver- age plasma energy density and the addition of helium to the arc gas. Ar- rows indicate decreased gas flow.
width increased about 1.2 mm. Likewise, when decreasing the total gas flow rate from 62 to 47 slm, the coating width increased about 1.2 mm. The coating width increased about 1.6 mm when the standoff distance was changed from 9 to 12 cm, indicating the divergence of the spray pattern. The average coating thick- ness was 390 and 766 Ixm for the low- and high-powder feed rate conditions, respectively. As expected, the coating thickness was greatly influenced by the particle feed rate, doubling in these ex- periments. However, the width was not affected. An increase in the standoff distance decreased the coating height because the spray distribution had the form of a diverging cone.
The coating microstructures were analyzed with the aid of an optical microscope and image analysis. For the purpose of con- sistency, microstructural properties were averaged over meas- urements taken every millimeter within one standard deviation of the coating center. For example, the coating thickness distri- bution presented in Fig. 2 had a standard deviation of about 3.5 mm in width, and microstructural properties were averaged from measurements within one standard deviation of the calcu- lated center.
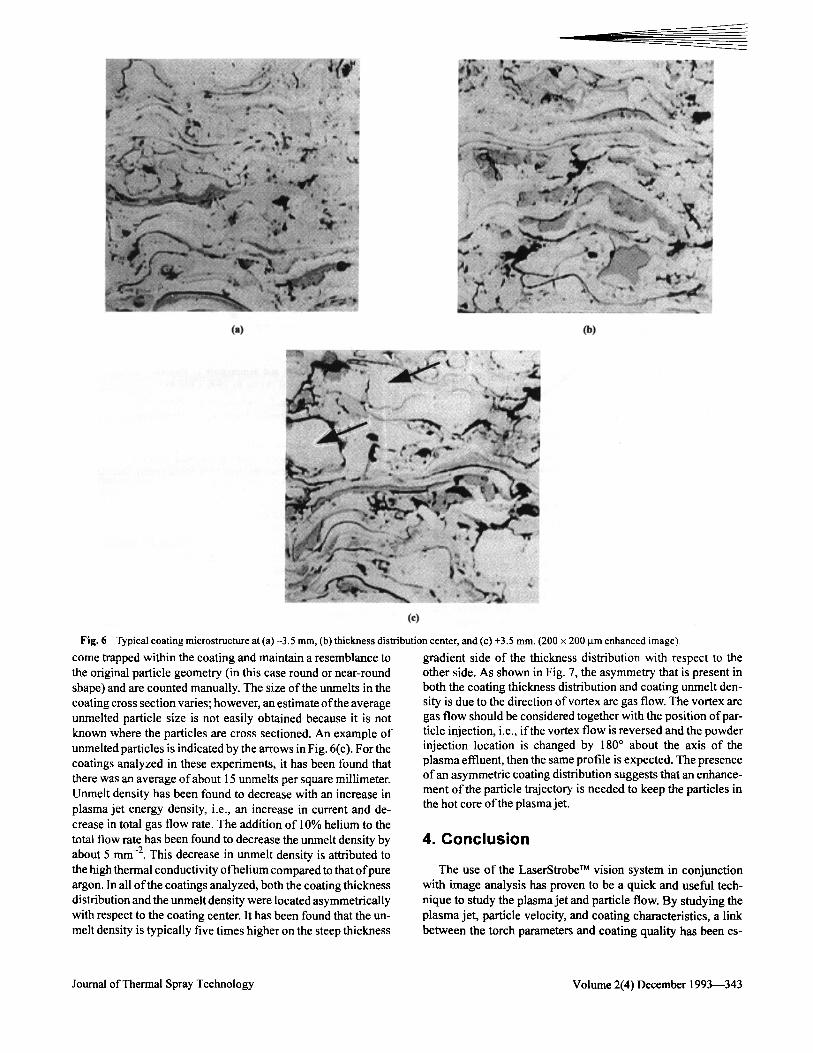
The coating porosity, average pore area (feature area), and the density o f unmelted particles were measured. An example of the typical microstructure is shown in Fig. 6, at spatial distances of plus or minus one standard deviation and at the center of the coating distribution. The sum of the dark area regions divided by the area of the coating analyzed is considered an indication of the percentage porosity. Although the true porosity may vary from that measured with image analysis, the relative magnitude of porosity variation from one operating condition to another will quantify the effect of the operating parameters (statistically significant) on porosity. For these experiments, the average po- rosity of the coatings was less than 1%. An increase in the total arc gas flow rate and standoff distance and the interaction be- tween these two terms were found to be statistically significant in increasing porosity. Likewise, the average feature area of 34 ~tm 2 was found to increase about 5 ~tm 2 due to an increase in the total flow rate and the standoff distance. The porosity and fea- ture area were found to be relatively consistent across the coat- ing cross section. Outside of the one standard deviation measurement area, it has been found that porosity increased to above 4%.
Unmelt density, in this analysis, is defined as the number of unmelted particles per square millimeter. These particles be-
342--Volume 2(4) December 1993 Journal of Thermal Spray Technology
(a) (b)
(c)
Fig. 6
come trapped within the coating and maintain a resemblance to the original particle geometry (in this case round or near-round shape) and are counted manually. The size of the unmelts in the coating cross section varies; however, an estimate of the average unmelted particle size is not easily obtained because it is not known where the particles are cross sectioned. An example of unmelted particles is indicated by the arrows in Fig. 6(c). For the coatings analyzed in these experiments, it has been found that there was an average of about 15 unmelts per square millimeter. Unmelt density has been found to decrease with an increase in plasma jet energy density, i.e., an increase in current and de- crease in total gas flow rate. The addition of 10% helium to the total flow rate has been found to decrease the unmelt density by about 5 mm -2. This decrease in unmelt density is attributed to the high thermal conductivity o fbelium compared to that of pure argon. In all of the coatings analyzed, both the coating thickness distribution and the unmelt density were located asymmetrically with respect to the coating center. It has been found that the un- melt density is typically five times higher on the steep thickness
Typical coating microstructure at (a) -3.5 mm, (b) thickness distribution center, and (c) +3.5 mm. (200 • 200 ~tm enhanced image).
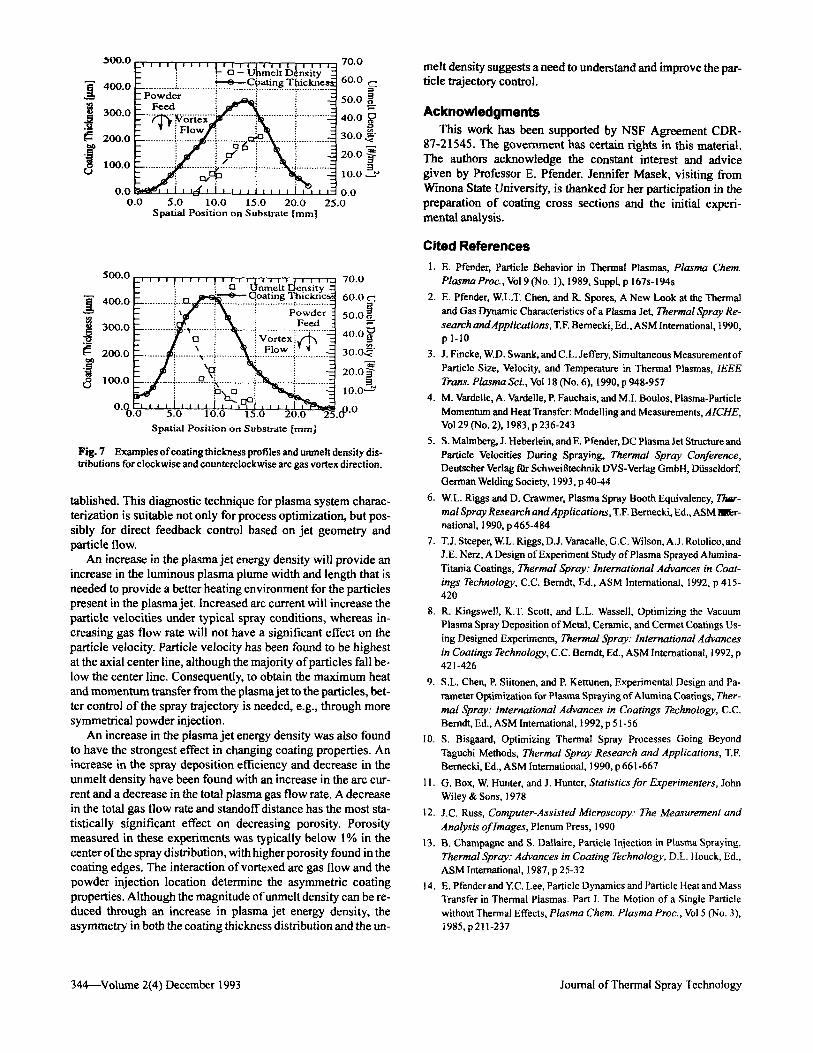
gradient side of the thickness distribution with respect to the other side. As shown in Fig. 7, the asymmetry that is present in both the coating thickness distribution and coating unmelt den- sity is due to the direction of vortex arc gas flow. The vortex arc gas flow should be considered together with the position of par- ticle injection, i.e., if the vortex flow is reversed and the powder injection location is changed by 180 ~ about the axis of the plasma effluent, then the same profile is expected. The presence o f an asymmetric coating distribution suggests that an enhance- ment o f the particle trajectory is needed to keep the particles in the hot core of the plasma jet.
4. Conclusion
The use of the LaserStrobe TM vision system in conjunction with image analysis has proven to be a quick and useful tech- nique to study the plasma jet and particle flow. By studying the plasma jet, particle velocity, and coating characteristics, a link between the torch parameters and coating quality has been es-
Journal of Thermal Spray Technology Volume 2(4) December 1993---343
500.0
: ~ C o a t i n g Thicknes~ ,~ 400.0 --l~ow.~ier ............. :.-...~.: .............. ] ............. _
300.0 ~-.. ~...Xd.~i:i~ ~. -a~ ........... )~ ........... : ............
i - ~ 2 ~ . o
~ 100.0 ....
0.0 I ler 1 1 t [ J I i I | 1 |
0.0
70.0
60.0
50.0
40.0
3 0 . 0 .~"
20.0
10.O
0.0 5.0 10.0 15.0 20.0 25.0
Spatial Position on Substrate [mml
8
500.0 I I I I I I 1 1 l I I I I 1 1 " 1 ' I [ I I - I I ~a . L . - .J
- : : unmett IJensity - : ~ _ - - - 0 - - Ooating T~hickrie,
4 0 0 . 0 - - ........... ~.-.[211~...., ~ ............ , .............. ~ ............ .~
-- i ",~/ i '~m i Powder : i i Feed
3oo.o ............ ]~ ........ i...X ....................................
2ooo :_ .... : cb ::
..............
o.or-: , , , I . . . . t ,-7",t:~, I , , L, I ~ 0 .0 5.0 10.O 15.0 20.0 25
Spatial Position on Substrate [rnm]
70.0
60.0
5 0 0 ~ �9 =.
40.0
30.03
2o.o~-
i0.0 B,~ ~
,00.0
Fig. 7 Examples ofcoating thickness profiles and unmelt density dis- tributions for clockwise and counterclockwise arc gas vortex direction.
tablished. This diagnostic technique for plasma system charac- terization is suitable not only for process optimization, but pos- sibly for direct feedback control based on jet geometry and particle flow.
An increase in the plasma je t energy density will provide an increase in the luminous plasma plume width and length that is needed to provide a better heating environment for the particles present in the plasma jet. Increased arc current will increase the particle velocities under typical spray conditions, whereas in- creasing gas flow rate will not have a significant effect on the particle velocity. Particle velocity has been found to be highest at the axial center line, although the majority of particles fall be- low the center line. Consequently, to obtain the maximum heat and momentum transfer from the plasma jet to the particles, bet- ter control o f the spray trajectory is needed, e.g., through more symmetrical powder injection.
An increase in the plasma jet energy density was also found to have the strongest effect in changing coating properties. An increase in the spray deposition efficiency and decrease in the unmel t density have been found with an increase in the arc cur- rent and a decrease in the total plasma gas flow rate. A decrease in the total gas flow rate and standoffdistance has the most sta- tistically significant effect on decreasing porosity. Porosity measured in these experiments was typically below 1% in the center o f the spray distribution, with higher porosity found in the coating edges. The interaction ofvortexed arc gas flow and the powder injection location determine the asymmetric coating properties. Although the magnitude ofunmel t density can be re- duced through an increase in plasma jet energy density, the asymmetry in both the coating thickness distribution and the un-
melt density suggests a need to understand and improve the par- ticle trajectory control.
Acknowledgments This work h a s been supported by NSF Agreement CDR-
87-21545. The government has certain rights in this material. The authors acknowledge the constant interest and advice given by Professor E. Pfender. Jennifer Masek, visiting from Winona State University, is thanked for her participation in the preparation o f coating cross sections and the initial experi- mental analysis.
Cited References 1. E. Pfender, Particle Behavior in Thermal Plasmas, Plasma Chem
Plasma Proc., Vol 9 (No. 1), 1989, Suppl, p 167s-I 94s 2. E. Pfender, W.L.T. Chert, and R. Spores, A New Look at the Thermal
and Gas Dynamic Characteristics of a Plasma Jet, Thermal Spray Re- search andApplications, T.F. Bernecki, Ed., ASM International, t 990, pl-10
3. J. Fincke, W.D. Swank, and C.L. Jeffery, Simultaneous Measurement of Partic}e Size, Velocity, and Temperature in Thermal Plasmas, IEEE Trans. Plasma Sci., Vol 18 (No. 6), 1990, p 948-957
4. M. Vardelle, A. Vardelle, P. Fauchais, and M.I. Boulos, Plasma-Particle Momentum and Heat Transfer: Modelling and Measurements, AICHE, Vo129 (No. 2), 1983, p 236-243
5. S. Malmberg, J. Heberlein, and E. Pfender, DC Plasma Jet Structureand Particle Velocities During Spraying, Thermal Spray Conference, Deutscher Vedag t~ Schweit~tecbxtik OVS-Verlag GmbH, Diisseldorf, German Welding Society, 1993, p 40-44
6. W.L. Riggs and D. Crawmer, Plasma Spray Booth Equivalency, Ther- mal Spray Research and Applications, T.F. Bernecki, Ed., ASM lql~r- national, 1990, p 465-484
7. T.J. Steeper, W.L. Riggs, D.J. Varacalle, G.C. Wilson, A.J. Rotolico, and J.E. Nerz, A Design of Experiment Study of Plasma Sprayed A|umina- Titania Coatings, Thermal Spray: International Advances in Coat- ings Technology, C.C. Berndt, Ed., ASM International, 1992, p 415- 420
8. R. Kingswell, K.T. Scott, and L.L. Wassell, Optimizing the Vacuum Plasma Spray Deposition of Metal, Ceramic, and Cermet Coatings Us- ing Designed Experiments, Thermal Spray: International Advances in Coatings Technology, C.C. Berndt, Ed., ASM International, 1992, p 421-426
9. S.L. Chen, P. Siitonen, and P. Kettunen, Experimental Design and Pa- rameter Optimization for Plasma Spraying of Alumina Coatings, Ther- mal Spray: International Advances in Coatings Technology, C.C. Berndt, Ed., ASM International, 1992, p 51-56
I0. S. Bisgaard, Optimizing Thermal Spray Processes Going Beyond Taguchi Methods, Thermal Spray Research and Applications, T.F. Bernecki, Ed., ASM International, 1990, p 661-667
11. G. Box, W. Hunter, and J. Hunter, Statistics for Experimenters, John Wiley & Sons, 1978
12. J.C. Russ, Computer-Assisted Microscopy: The Measurement and Analysis of Images, Plenum Press, 1990
13. B. Champagne and S. Dallaire, Particle Injection in Ptasma Spraying, Thermal Spray: Advances in Coating Technology, D.L. Houck, Ed., ASM International, 1987, p 25-32
14. E. Pfender and Y.C. Lee, Particle Dynamics and Panicle Heat and Mass Transfer in Thermal Plasmas. Part I. The Motion of a Single Particle without Thermal Effects, Plasma Chem. Plasma Proc., Vol 5 (No. 3), 1985, p 211-237
344--Volume 2(4) December 1993 Journal of Thermal Spray Technology
Recommended