72
CHAPTER - V
5. Effect of Calcination Temperature on Surface Morphology and Size of
Ionic liquid Capped ZnO Nanoparticles by Sol-gel Method
5.1. Introduction
A versatile smart, multifunctional and semiconductor ZnO material has attracted
considerable attention due to its widespread applications [1, 2]. The sol-gel method for the
preparation of zinc oxide nanoparticles has its unique advantages such as simple, fast, better
homogeneity, controlled stoichiometry and easy industrial production [3]. Most of the
organic solvents employed for the synthesis are highly toxic, flammable and even explosive.
Ionic liquids (ILs) which has no negative environmental and safety problems like that of
volatile organic solvents are explored and received much attention in inorganic synthetic
protocols [4].
Among the various types of ionic liquids, imidazolium based ILs is the most
commonly used [5]. Thermal annealing is widely employed to improve the crystal quality and
to study the structural defects of nanomaterials. Detailed investigations are required to
explain the grain size effect on the temperature dependent behavior, which is very much
essential from the technological perspective. Because the particle size and annealing
temperature have a close relation, with increases of annealing temperature, particle size
increases [6-8]. Annealing process may be responsible for the occurrence of dislocation and
adsorption/decomposition on the surface, thus the structure and stoichiometric ratio of the
material would change [9]. There are many reports on the effect of calcination temperature on
zinc oxide synthesis [10], but the same effect was not yet reported in IL capped synthesis.
Hence in the current study an effort was taken to study the change in size, morphology and

73
structure of ZnO under various calcination temperatures in [BMIM] BF4 ionic liquid capped
pathway. A comparative study is taken into account between ionic liquid and conventional
solvent water in ZnO nanoparticles synthesis. The Zn(OH)2 were subsequently annealed at
different temperatures (100, 300 & 500°C) for studying the effect of thermal treatment on the
surface morphology and the size of the ZnO nanoparticles. Stabilization of ZnO nanoparticles
is attained by capping their surface with the organic ligand of ionic liquid. Structural, thermal
behaviour and morphological properties of the synthesized nanoparticles were characterised
by XRD, TGA and SEM with EDX analysis. The schematic representation of ionic liquid
capped ZnO nanoparticle synthesis under different calcinations is given below (Fig. 5.1).
Figure 5.1: Schematic representation of calcination effect on ZnO nanoparticles

74
5.2. Results and Discussion
5.2.1. Phase structure of ZnO nanoparticles by XRD
The phase structure and crystallinity of ZnO nanoparticles synthesised using ionic
liquid and conventional solvent at different calcination temperatures are characterised from
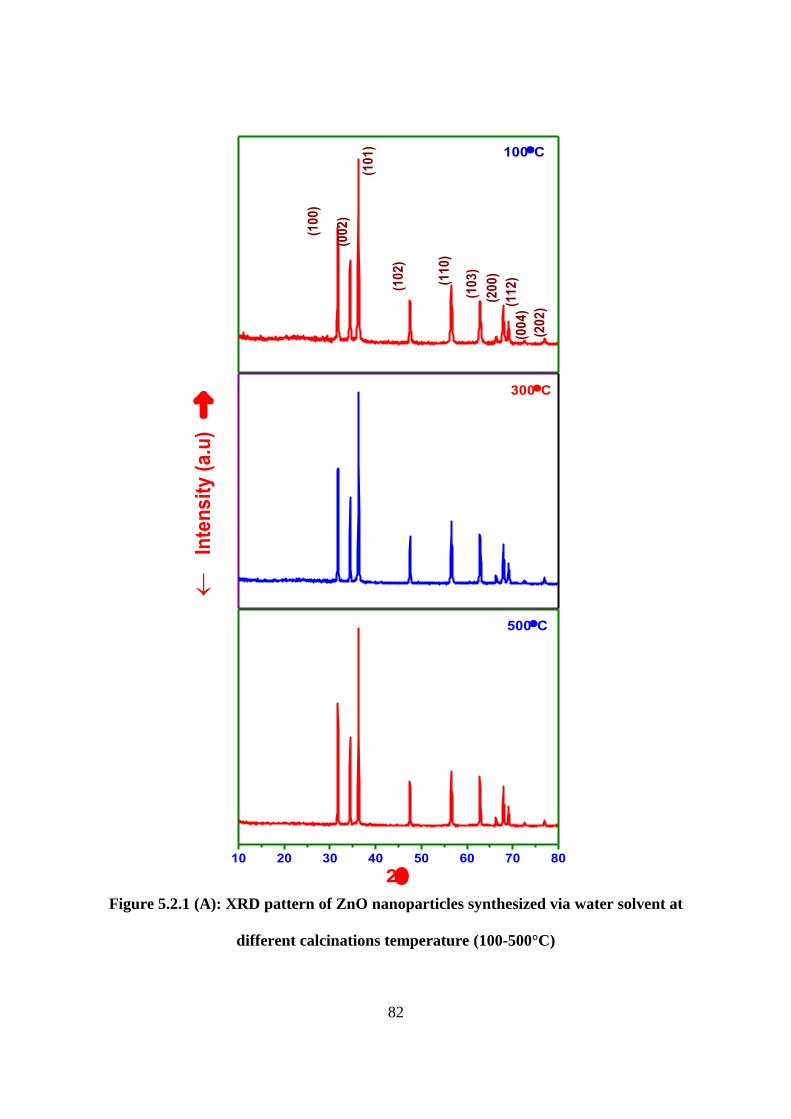
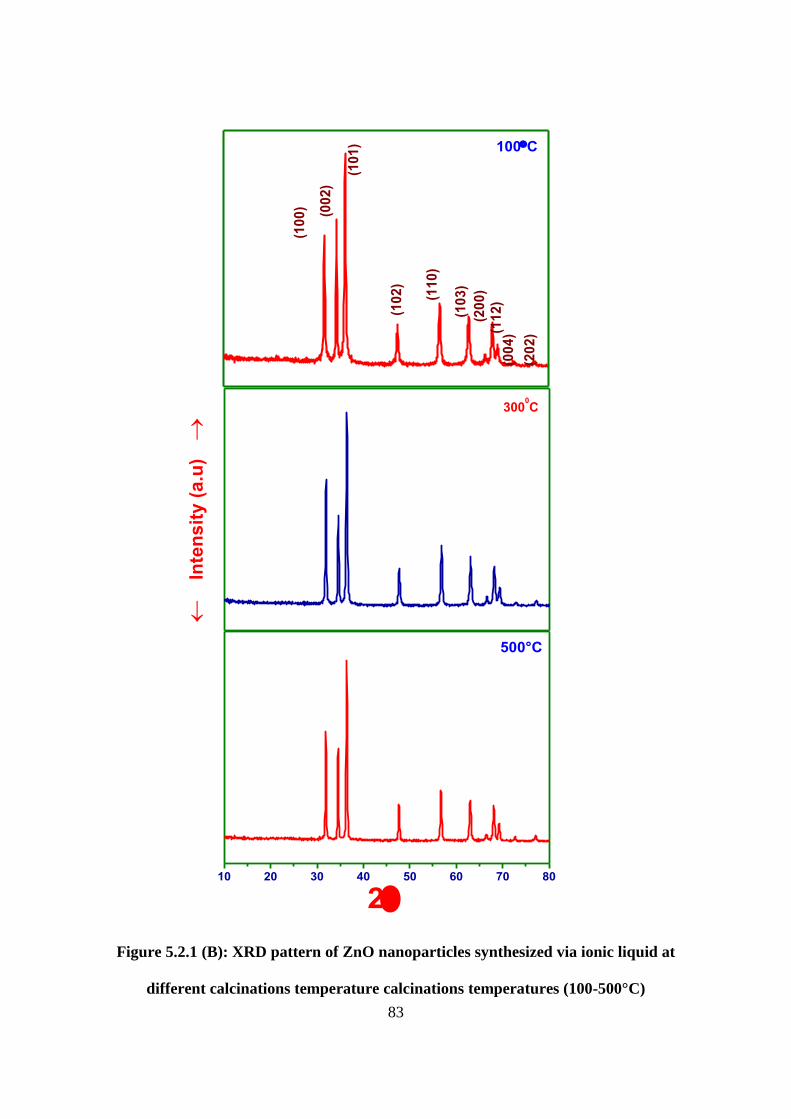
XRD analysis are shown in Figure 5.2.1(A) & 5.2.1(B). XRD pattern of synthesized ZnO
nanoparticles with two different solvents depicts a set of diffraction peaks corresponding to
(100), (002), (101), (102), (110), (103), (200), (112), (201), (004) and (202) planes in close
correlation with lattice planes of hexagonal wurtzite structure of ZnO. In both cases, sharp
peaks with prominent intensity reflect the high crystallinity in ZnO nanoparticles and the
detectable peaks matches well with the JCPDS card (36-1451). All of the characteristic peaks
of ZnO lie in the range of 20°<2θ<80° it further confirms the form of metal oxide (ZnO). The
crystallite size of ZnO nanoparticles calculated using Scherrer’s equation are 28, 34 and 41
nm with ionic liquid and 43, 52 and 59 nm with water solvent under the calcination
temperature 100, 300 and 500°C respectively and tabulated in Table 5.2.1.
Generally elevation of increasing calcination temperature produces increase in
particle size due to aggregation and also unevenly sized particles. Crystallite size of ZnO
nanoparticles increases gradually by the elevation of calcination temperature in ionic liquid
compared to conventional solvent as medium. When ionic liquids (ILs) are used as template,
the nucleation rate is increased due to their low interface tension and it has control over the
shape of each particle. Hence calcination of ZnO prepared in ionic liquid (IL) template
produced controlled size nanoparticles of definite crystallinity with identical shape and size.
The XRD pattern of both solvents emphasizes the purity of ZnO nanoparticles by the absence
of unidentified peaks. Increase of crystallinity with increasing calcination temperature was

75
observed by the increase of intensity of the diffraction peaks thereby confirms the statement
of previous reports [6].
5.2.2. Morphology of ZnO nanoparticles by SEM
The particle size and morphology change between the low and high calcination range
of ZnO nanoparticles prepared in two different solvents are investigated by scanning electron
microscopic analysis. SEM images of ZnO nanoparticles prepared with conventional solvent
at different temperature were recorded under two different magnifications are displayed in
Figure 5.2.2(A). The structure of spherical shaped granular particles without much
agglomeration is received for the ZnO at 100°C. When temperature increases to 300°C and
500°C, the spherical shaped morphology changed to irregular and uneven granular particles
without any boundary due to the lack of aptitude to control agglomeration of particles by the
conventional solvent (water). SEM images of ZnO nanoparticles prepared in [BMIM] BF4 is
depicted in Figure 5.2.2(B) [a = 100°C, b = 300°C and c = 500°C]. At 100°C, the morphology
of ZnO nanoparticles exhibit tiny aggregative granule shaped nanoparticles, whereas the
temperature increased to 300°C and 500°C, the morphology changes to ball like uniform
shaped particles and capsules shape nanoparticles with very fine agglomeration respectively.
The average particle sizes of individual ZnO nanoparticles from the SEM images based on
the scale bar provided are around 50, 100, and 150 nm for 100, 300 and 500°C, respectively.
5.2.3. Thermal stability of ZnO nanoparticles by TGA
The relative weight loss of the zinc hydroxide precursor synthesized without and with
ionic liquid during the heat treatment was studied by thermogravimetric analysis. The TG
analysis was carried out from room temperature to 800°C and depicted in Figure 5.2.3. From
the TGA curve of zinc hydroxide in water solvent (a), the intact weight loss of about 16%
associated with the heating process occurred in three phases is understood. A significant

76
weight loss of about 8% happened upto 366°C is envisaged for the removal of water which is
adsorbed on the surface of the material. The second stage weight loss of about 7% occurred
between 366°C to 400°C can be attributed to the complete crystallisation of zinc oxide from
the amorphous nature. Oxidation of residue compounds is occurred above 400°C with the
accompanying weight loss of 1%.
The TGA curve of the zinc hydroxide precursor with ionic liquid (b) presents three
stages upto 800°C is given in Figure 5.2.3. The first stage weight loss (5%) between room
temperature to 250°C associated with the elimination of water molecules and surface
hydroxyl groups on the synthesized particles. A sharp down fall weight loss of about 25%
observed in the second stage from 250°C to 350°C may be due to the crystallisation and
formation of zinc oxide nanoparticles. Further weight loss of about 10% may be happened
due to the decomposition of ionic liquid, [BMIM] BF4 between 350°C to 623°C. There is no
reasonable weight loss above 600°C.
5.2.4. Energy dispersive x-ray spectroscopy
The EDX spectrum of ZnO nanoparticles synthesized at different calcination
temperatures by employing the conventional and ionic liquid solvent were recorded along
with the SEM measurement are shown in Figure 5.2.4(A) & 5.2.4(B). The formation of ZnO
nanoparticles were confirmed by the presence of Zn and O peaks in both solvents at all
investigated temperatures. The significant difference in the EDX spectrum of ZnO
nanoparticles in ionic liquid capped medium is the peak corresponding to carbon along with
Zn and O, which could be from the carbon skeleton of imidazolium cation. The presence of
carbon atom peak elucidates the capping of ionic liquids on the synthesized ZnO at all
calcination temperatures even at higher temperature of 500°C.

77
5.2.5. Formation of ZnO nanostructures
The reason behind the controlled size particles with well defined morphology at all
calcination temperature ranges are based on the spectral features of the ionic liquid as
template. Nucleation and growth of crystal was controlled by the ionic liquid. IL itself is
existing as cations and anions as follows [(BMIM)x (X)x-n]n+
cations and [(BMIM)x-n (X)x]n-
anions where X= BF4-. The anion surrounds the [Zn(OH)4]
2- by coulombic force of attraction
which polarises the precursor and facilities dehydration to form ZnO nanoparticles.
Meanwhile the negatively charged hydroxyl ion of [Zn(OH)4]2-
repulse the anionic part of
ionic liquid, in order to counter act the repulsion cationic part forms the second layer over the
anionic part of ionic liquid followed which ZnO nanoparticles formed by the dehydration of
the precursors. In the presence of ionic liquid the anisotropic growth of ZnO is totally
controlled by capping the newly formed ZnO particle with cation of IL which could not
provide sites for other ZnO particles to occupy interstitial sites, therefore further growth is
totally restricted it helped to get a controlled size discrete nanoparticle of well-defined
geometry. Generally size of nanoparticles increases with increase of temperature due to the
aggregation of individual particles. The same case occurs in our study also but due to the
capping of ionic liquid on the surface of ZnO nanoparticles, increase of size occurs in a
controlled rate due to the thermally robust property of ionic liquid.
ZnO nanoparticles are having size and shape dependent characteristics [11]. For example,
50-150 nm was used as a sunscreen additive to absorb UV light and enhances the sun
protection and with capsule shape was used in biomedical applications and sensing devices
[12, 13]. Therefore the preparation of ZnO nanoparticles of varied size in discrete state with
specified geometry such as granules, balls and capsule shapes would fulfil the need in
different areas of application.

78
5.3. Conclusion
In this study the effect of temperature on the size and morphology of ZnO
nanoparticles synthesized by conventional and ionic liquid solvent were reported. The
morphology of zinc oxide nanoparticles synthesized with conventional solvent changes to
irregular and uneven surface from the spherical shaped granules with increasing calcination
temperature. Use of ionic liquid as solvent in this investigation provides environmentally
benign and greener route and also tune the size and shape of nanocrystals. The use of
additives as shape directing/templating agents can be eliminated by employing ionic liquids
due to its multifunction such as template, solvent, templating agent and reactant during the
particle formation process. Specifically interesting particles including granules, balls and
capsule shapes of ZnO can be synthesized by this route. The special quality of ionic liquid
induces to act as entropic driver for spontaneous, well defined and extended ordering of
nanoscale materials. An ionic liquid control the crystal growth and collects the nanoparticles
just by condensed manner. Ionic liquids replace the use of harmful solvent and stabilizing
agent in inorganic synthesis of nanoparticles. This study concludes that this method opens up
a new way for preparing nanoparticles of metals, metal oxides, metal alloys, semiconductive
metals and their alloys.

79
References
[1]. S. Selvam, R. Rajiv gandhi, J. Suresh, S. Gowri and M. Sundrarajan, International
Journal of Pharmaceutics, 434, 374 (2012).
[2]. Z. Jijun and C. Zhongfang, Journal of Computational and Theoretical Nanoscience, 8,
2397 (2011).
[3]. S. Maensiri, P. Lackul and V. Promarak, J Cryst Growth, 289, 106 (2006).
[4]. M. Ramalakshmi and M. Sundrarajan, Asian journal of chemistry, 25, 3081 (2012).
[5]. M. Ramalakshmi and M. Sundrarajan, Materials research bulletin, 48, 618 (2012).
[6]. M. Hamadanian and V. Jabbari 5th SASTech 2011, Khavaran Higher-education
Institute, Mashhad, Iran. May 12-14.
[7]. Kuan Y. Cheong, Hartini Hussin and Khairul Ismail, ECS Trans, 3, 115 (2006).
[8]. C. C. Vidyasagar, Y. Arthoba Naik_, T. G. Venkatesha and R. Viswanatha, Nano-Micro
Lett. 4, 73 (2012).
[9]. L.C. Nehru1 M. Umadevi1 and C. Sanjeeviraja, International Journal of Materials
Engineering, 2, 17 (2012).
[10]. Z. Qidong and X. Tengfeng, J Phys Chem C, 111,17145 (2007).
[11]. D. Wei1 and H.E. Unalan, Nanotechnology, 19, 424006 (2008).
[12]. L. Wang and M. Mohammed, J Mater Chem, 9, 2871 (1999).
[13]. M. Movahedi, E. Kowsari, and I. Yavari, Material Lettrs, 31, 3856 (2008).

80
Legends
Table
Table 5.2.1: Size of ZnO nanoparticles at different calcination temperatures from XRD
Figures
Figure 5.1: Schematic representation of calcination effect on ZnO nanoparticles
Figure 5.2.1 (A): XRD pattern of ZnO nanoparticles synthesized via water solvent at different
calcinations temperature (100-500°C)
Figure 5.2.1 (B): XRD pattern of ZnO nanoparticles synthesized via ionic liquid at different
calcinations temperature (100-500°C)
Figure 5.2.2 (A): SEM images of ZnO samples prepared via water solvent at different
calcinations temperature (100-500°C)
Figure 5.2.2 (B): SEM images of ZnO samples prepared via ILs at different calcinations
temperature (100-500°C)
Figure 5.2.3: TG analysis of ZnO nanoparticles a) without IL and b) with IL
Figure 5.2.4 (A): EDX spectra of water mediated ZnO samples prepared at different
calcinations temperature (100-500°C)
Figure 5.2.4 (B): EDX spectra of ionic liquid mediated ZnO samples prepared at different
calcinations temperature (100-500°C)

81
Table 5.2.1: Size of ZnO nanoparticles at different calcination temperatures from XRD
Solvent
Calcination temperature (°C)
FWHM
Peak (deg)
Mean particle size (nm)
Water
100
300
500
0.1900
0.1580
0.1400
43
52
59
[BMIM]BF4
100
300
500
0.3800
0.2789
0.2331
22
28
34
82
Figure 5.2.1 (A): XRD pattern of ZnO nanoparticles synthesized via water solvent at
different calcinations temperature (100-500°C)
100C
(10
0)
(00
2)
(10
1)
(10
2)
(11
0)
(10
3)
(20
0)
(11
2)
(00
4)
(20
2)
Inte
ns
ity
(a
.u)
300C
10 20 30 40 50 60 70 80
500C
2
83
Figure 5.2.1 (B): XRD pattern of ZnO nanoparticles synthesized via ionic liquid at
different calcinations temperature calcinations temperatures (100-500°C)
10 20 30 40 50 60 70 80
500°C
2
(20
2)
(10
3)
(00
4)(1
12
)
(20
0)(11
0)
(10
2)
(10
1)
(00
2)
(10
0)
100C
3000C
In
ten
sit
y (
a.u
)

84
Figure 5.2.2(A): SEM images of ZnO samples prepared via water solvent at different
calcinations temperatures (100-500°C)

85
Figure 5.2.2 (B): SEM images of ZnO samples prepared via ILs at different calcination
temperatures (100-500°C)

86
100 200 300 400 500 600 700
84
88
92
96
100
366.30C
233.07CW
eig
ht
(%)
Temperature (°C)
95.00C
a) Zn(OH)2 precursor without ionic liquid
100 200 300 400 500 600 700
60
70
80
90
100 b) Zn(OH)2 precursor with ionic liquid
622.59C
347.17C
95.00C
Weig
ht
(%)
Temperature (°C)
Figure 5.2.3: TG analysis of ZnO nanoparticles a) without IL and b) with IL

87
Figure 5.2.4 (A): EDX spectra of water mediated ZnO samples prepared at different
calcination temperatures (100-500°C

88
Figure 5.2.4 (B): EDX spectra of ionic liquid mediated ZnO samples prepared at
different calcination temperatures (100-500°C)
Recommended