Dr. Alkafaji et al. Int. Journal of Engineering Research and Applications www.ijera.com
Vol. 3, Issue 5, Sep-Oct 2013, pp.135-148
www.ijera.com 135 | P a g e
Effect of Burning By Fire Flame on Load Carrying Capacity of
Self-Compacting Concrete Columns
Dr. Mohammed Mansour Kadhum Alkafaji*, Saif Salah Alkaizwini** *Department of Civil Engineering, College of Engineering, University of Babylon
**Department of Civil Engineering, College of Engineering, University of Babylon
ABSTRACT This research presents experimentally investigated the effect of burning by fire flame on the behavior and load
carrying capacity of reduced scale SCC column models. Residual ultimate load carrying capacity, load versus
deflection curves, maximum crack width, axial deformation and crack pattern for column specimens with and
without burning were recorded and discussed.
The reinforced SCC columns were exposed to direct fire fame temperature levels of 752 and 1472oF (400 and 800oC) for 1.5 hour period of exposure at 60 days age.
It was found that the predicted load carrying capacity of SCC columns by three codes (ACI-318/08, BS-
8110/97 and Canadian/84), was unconservative after burning except the BS Code equation which was found
able to predict load capacity after exposure to high fire temperature levels. Load-deflection curves indicate
deleterious response to the fire exposure.
Keywords: Burning; Fire Flame; Load Carrying Capacity; SCC Columns
I. INTRODUCTION Many investigations on self-consolidating
concrete (SCC) have been carried out in the last
several years and the mechanical behavior of this
type of concrete is well understood by now. The fire behavior of this specialized concrete, however, is not
fully understood.
Concrete columns are considered to be an
important structural element in reinforced concrete
structures because they support the structure and
transfer the loads to the supports or foundation, so
any failure or damage occurs in the column may
cause a partial or complete failure of the structure by
perhaps chain action.1 Thus, the aim of this
experimental study was to evaluate the effect of fire
flame exposure on the behavior of SCC columns. SCC is defined so that no additional inner or
outer vibration is necessary for compaction. It is
compacting itself due to its own weight and is de-
aerated almost completely while flowing in the
formwork. In structural members with high
percentage of reinforcement it also fills completely
all voids and gaps.
SCC consists of the same components as
conventionally normal concrete, which are hydraulic
cement, fine and coarse aggregates plus appreciable
amount of additives and/or admixtures (fillers and superplasticizers). The high amount of
superplasticizer is for reducing the water demand and
highly enhancing flowability and overall workability.
The high powder content, as well as the use of
viscosity modifying agents are to increase plasticity
and viscosity of the SCC mix.2,3
The effect of sand grading, particle shape and surface
texture on the rheology of SCC was studied.4 They
found that increasing the fineness of sand particles
and the (fine aggregate / total aggregate) ratio lead to
increase the yield stress and plastic viscosity.
The effect of sand-aggregate ratio (S/A = fine aggregate volume to total aggregate volume) on
the elastic modulus of SCC was studied.5 They found
that the flow ability of SCC increases with the
increase in S/A ratio, meanwhile the modulus of
elasticity of SCC is not significantly affected by this
ratio when the total aggregate volume was kept
constant.
Several test methods are used to evaluate
filling ability (flowability), passing ability
(passibility), and segregation resistance (stability) of
fresh SCC. Among these test methods are the followings:
- Slump flow and T50cm test to evaluate flowability
and stability.
- L-box test to assess flowability and passing ability.
- U-box test to measure the filling ability.
- V-funnel test to determine the filling ability.
The residual strength of concrete members
after fire exposure investigated,6 from a batch of
traditional (TC = NSC) and self-compacting (SCC)
concrete, two cubes were heated for each of the
examined temperature levels till 1472oF (800°C). The
heating rate was 38.3oF/min (3.5°C/min) and the target temperature was kept constant for 750 minutes.
The cubes were cooled in ambient air after removal
from the oven. Fig. 1 shows the mean residual
compressive strength immediately after cooling was
RESEARCH ARTICLE OPEN ACCESS

Dr. Alkafaji et al. Int. Journal of Engineering Research and Applications www.ijera.com
Vol. 3, Issue 5, Sep-Oct 2013, pp.135-148
www.ijera.com 136 | P a g e
68oF (20°C) for TC and 221oF (105°C) for SCC.
Both curves were situated around the Euro code
curves for normal siliceous concrete.
Studied the behavior of composite beams
composed of rolled steel profile concreted between
flanges during a fire by conducting a fire resistance test with different cross sections and load ratios, by
numerical analysis. The results they obtained are as
follows:
1) In steel-concrete composite beams which were
simply supported and to which positive bending
moment was applied, deformations were
downward in the early period of fire, and then
the deformation rate decreased once but
increased again as heating was continued, leading to the limit of fire resistance.
2) The fire resistance of steel-concrete composite
beams increased when the applied bending
moment ratio decreased. The fire resistance time
was affected by the size of the cross-section,
whether steel-concrete composite beams were
connected to the reinforced concrete floor or not,
as well as by the applied bending moment ratio.7
II. RESEARCH SIGNIFICANCE Numerous investigations studied the effect
of fire on concrete, reinforced concrete members is
concentrated on exposing such members to high
temperatures in special furnaces. Such conditions do
not represent the effects due to real fires. In order to
simulate this problem to practical site conditions
reduced scale column models were cast and they
were as close as possible to practical circumstances. The present work proposes a reinforced SCC
column models which resemble the simulation of the
state of stress which the reinforced concrete columns
are subjected to during fire under loading of different
degrees in laboratory. Simulation of real fires in
laboratory using a set of methane burners which
subjecting the column specimens to real fire flame.
III. EXPERIMENTAL INVESTIGATION 3.1 Materials and Mixes
The properties of materials used in any
structure are of considerable importance.8,9 The
properties of materials used in the current study are
presented in this chapter. Standard tests according to
the American Society for Testing and Materials
(ASTM) and Iraqi specifications IQS were conducted
to determine the properties of materials.
3.2 Materials
Tasluga-Bazian Ordinary Portland cement
(O.P.C) (ASTM Type I). This cement conforms to the Iraqi specification and ASTM C150-05.10,11 Fine
river sand and gravel were used in this study, and
Table 1 contains information about the particle size
distribution, specific gravities, and absorption of the
aggregates. Both materials were obtained from local
sources in Iraq. The sand and gravel were then
washed and cleaned with water several times, then it
were spread out and left to dry in air, after which it
were ready for use. These materials are conformed to
the requirements of the Iraqi specification and ASTM
C33-03.12,13 Deformed steel bars of diameters 1/3 and
3/8 in. (Ø8 mm and Ø10 mm) were used as reinforcement and met the ASTM A615
requirements. 14
A liquid superplasticizer commercially
known as [Ura-plast SP] was added to the concrete
mix to obtain high workability and fluidity. This
superplasticizer can be classified as class F and G
according to ASTM C494-9915 as it has the capability
of obtaining more than 12% reduction in mixing
water for a given consistency, besides it has a
retarding effect to setting. According to trials it was
found that the most suitable dose of Ura-plast SP is
(4 liters per 100kg of cement). The typical properties of this superplasticizer are listed in Table 2.
Limestone powder named locally as "Ghobra" was
used filler to increase the amount of powder content
(cement + filler) to produce SCC mixes in the present
work. The fineness of limestone powder was
measured by Blaine method and found to be 1500
cm2/g. The particle size which is less than 0.125mm
acts to increase workability and density of the SCC.
This filler conforms to BS 8500-2, 4.4 specifications.
The chemical composition of the used limestone
powder is given in Table 3.
3.3 Mix design and proportions
The Japanese mix design procedure cited by
EFNARC16 was followed to design the mix
proportions of SCC. Many trials were made to fix the
proportions so as to obtain SCC mix maintaining the
ranges and limits of fresh SCC. Table 4 shows the
mix proportions of the SCC mix used in the present
study.
3.4 The fresh properties of SCC
The fresh properties of SCC were tested by the procedure of European Guidelines16 for testing
fresh SCC. Four characteristics were achieving by
conducting three test which were flowability, was
achieved by slump flow test, passibility which was
achieved by L box tests, viscosity which was
achieved by T50 and V funnel tests, and segregation
resistance which was achieved by no halo shape in
slump flow test, no visible segregation during
handling or testing, and by controlled the average
separated diameter of slump to not exceeded the
segregation border in slump flow test, Fig. 2 shows the apparatus of the test.
3.5 Column specimen preparation The dependent dimensions of the specimens
of SCC columns were selected to be 5.95.939.4 in.
(1501501000 mm). The mold included: base, sides and sectors for ends. They were made of plywood

Dr. Alkafaji et al. Int. Journal of Engineering Research and Applications www.ijera.com
Vol. 3, Issue 5, Sep-Oct 2013, pp.135-148
www.ijera.com 137 | P a g e
with a thickness of 0.7 in. (18 mm) to reduce the
water effect during the casting process.
The longitudinal and lateral ties
reinforcement used is deformed steel bars of
diameters 1/3 and 3/8 in. (Ø8 and Ø10 mm)
respectively. Fig. 3 shows the details of the reinforcement of column specimens and Table 5
shows the description and the notation of column
specimens.
9 SCC column specimens were cast and
cured under laboratory conditions. The casting and
curing of the columns were carried out during the
period from first of July to the first of November
2012 (4 months period). All specimens were cured in
the same method. The specimens in their moulds
were covered with a plastic sheet and kept in the
casting room at 25(±1) °C for 24 h. These were then
demoulded and transferred to the moist curing room at 24(±1) °C and 95(±1) % RH and cured in water
where they remained until required for testing.
After the complete 60 days age which is the
age of fire processing and testing. Fire processing
was achieved by subjecting the SCC column
specimens to direct fire flame from a network of
methane burner. Although the maximum
temperatures reached during fires of buildings are in
the order of 1832 to 2192oF (1000 to 1200oC)17,18
such high temperatures occur only at the surface of
the exposed members. Considering the relatively small size modeling of the specimens to be tested, it
was decided to limit temperature of the specimens to
three temperature levels of 752 and 1472oF (400 and
800oC). The dimensions of this burner network are
39.4×3.94 in. (1000×100 mm) (length × width
respectively) as shown in Fig. 4.
When the target temperature was reached, the
temperature of concrete and steel reinforcement was
measured at different depths by continuously
applying Infrared ray thermometer from about
approximately 118.2 in. (3 meters) from the concrete
exposed to fire. The measurement device was shown in Fig. 5.
3.6 Testing procedure All the SCC column specimens were white
painted to facilitate detection of cracks. The column
specimens were tested using a load cell of maximum
capacity of (150 Tons) at the age of (60 days). At
each test, the first cracking load, midheight lateral
deflection, axial deformation, maximum crack width
and ultimate load were recorded. The load was
applied through a bearing plate for the axially loaded columns, and through a cylindrical roller to simulate
line load, attached to the top of bearing plates. The
load was applied gradually, the readings were
recorded manually. After the first crack appeared on
the column surface, the load was applied in small
increments up to failure. The specimens were
concentrically and eccentrically loaded by
eccentricity of 1.77 and 3.55 in. (45mm and 90 mm).
Two dial gauges were fixed at distance 1 in.
(25.4 mm) from the nearest edges of these columns to
measure the deformation at these edges due to
burning. Also, another one was fixed at the centerline
of column specimens to measure the axial
deformation due to concentric load. The dial gauge was used to measured axial deformation of the
specimen having a minimum graduation of 0.001 mm
and a maximum needle length of 1.97 in. (50 mm)
mounted at the bottom face of the specimens. Fig. 6
shows the setup of axial deformation measurements
mentioned above.
The positions of the visual cracks in the
concrete and the loads, at which these cracks were
formed, were recorded. The reading of the lateral
deflections versus loads was recorded simultaneously
for each load increment.
For the SCC column specimens which were subjected to fire flame under loading as shown in
Fig. 7. The specified (target) fire temperature was
reached by mounting the fire subjecting burners by a
sliding arm to control the fire distance to the surface
of the column specimens, and also by monitoring the
fire intensity through controlling the methane gas
pressure in the burners. The temperature was
measured by infrared rays thermometer continuously
till reaching the specified (target) fire temperature.
Then, the sliding arm and gas pressure were kept at
this position along the period of burning (1.5 hour). The lateral deflection of the column specimens
exposed to fire are resulting from loading to 20% of
ultimate load before burning, loading 20% and
applied fire flame, and loading after burning until
failure. While, for specimens without burning the
lateral deflection is resulting from applied load only.
IV. EXPERIMENTAL RESULTS AND
DISCUSSION 4.1 Fresh concrete test results
Table 6 gives the experimental results
obtained from Slump flow, T50cm, L-box, and V-
funnel tests that were conducted throughout the
present work. It can be seen that the test results are
within the limits of Self-compacting concrete results
established in EFNARC 200516 which means that the
designed concrete mix in the present work conforms
to the specifications of SCC.
4.2 Compressive strength results
Table 7 presents cube compressive strength
test results for the SCC mix before and after exposure
to fire flame at the ages 28, 60 and 90 days.
Compressive strength test was conducted by using a
standard cubes of dimensions 5.95.95.9 in.
(150150150 mm). Each test result represents the mean value of the compressive strength of three
cubes. Fig. 8 reveals the relation between
compressive strength and fire temperature. It is
obvious from the results that compressive strength
decreases significantly with exposure to fire flame.

Dr. Alkafaji et al. Int. Journal of Engineering Research and Applications www.ijera.com
Vol. 3, Issue 5, Sep-Oct 2013, pp.135-148
www.ijera.com 138 | P a g e
The percentage of residual compressive
strength after burning at 752ºF (400ºC) fire
temperature was (84%), while the percentage of the
remaining compressive strength was (42%) at 1472ºF
(800ºC) fire temperature. In addition, it can be noted
that the test results of the residual compressive strength after burning show that, the reduction at 28
days age was more than the reduction at 60 and 90
days. This may be attributed to the fact that hydration
of cement paste is more complete at later ages.
4.3 First crack load and ultimate load for columns
exposed to fire flame
The ultimate load values were recorded for
all columns which were tested with or without
exposure to fire flame. Table 8 shows the results of
the first crack load and ultimate load values for all
columns specimens. From this Table, it can be seen that the values of ultimate load decreases when the
column specimen is exposed to fire flame.
At burning temperature 752 and 1472ºF (400 and
800°C), the residual ultimate loads were (86 and 26
%) for concentric loads respectively, while (87,
113.8%) and (28, 39%) for reinforced concrete SCC
column specimens loaded at eccentricity of 1.77, 3.55
in. (45, 90mm) respectively.
First crack load which was recorded in this
study was represented, the load which caused the
visible first crack in the face of column which parallel with the direction of the fire flame and
caused by loading operation with respect to the
columns which were not exposed to the fire and,
which were exposed to fire. Where, the last columns
(fired columns) were precracked before the loading
operation. From these results, it can be concluded that
the first crack load of the reference SCC column
specimens decreased with increased amount of
eccentricity.
Fig. 9 reveals the effect of fire flame on load
carrying capacity with different amount of
eccentricities 1.77 and 3.55 in. (45 and 90 mm). From this Figure, it can be noted that the ultimate load
capacity had increased in the eccentric columns with
3.55 in. (e=90 mm). This can be explained by the low
reduction percentages in tensile and compressive
strength of the concrete member at this low fire
temperature exposure, on the other hand the
expansion happening due to this fire exposure can
cause an increase in the axial compressive stress
affecting on the eccentric 3.55 in. (e=90 mm) loaded
column specimens which raise the moment capacity
of the column and consequently the load capacity. The fire flame temperature applied to
concrete column causes evaporation of the free
moisture in concrete with continual exposure to fire.
The temperature inside the specimen increases and
the strength of concrete decreases. This can be
attributed to hydration of free lime and deformation
of Ca(OH)2 due to absorption of moisture by the
effect of fire flame, so expansion takes place, which
causes cracking and reduces the ultimate load
capacity.
The data of axial deformation was recorded
up to 95% of the ultimate load, because the final axial
deformation at ultimate load cannot be measured due
to the immediate type of failure of concrete column specimens.
Fig. 10 and 11 present the effect of fire
flame temperature on the characteristics of axial
deformation of the column specimens. From these
Figures, it can be seen that the concentric SCC
column specimens exhibited a small contraction
when loaded to 20% of the ultimate load during
25minutes then remain constant for the later period of
this applied load, and then the columns exhibit a
sudden increase in contraction which was identified
as failure after applied residual load. While,
forcolumn specimens exposed to fire flame temperature 752 and 1472ºF (400 and 800°C) also
exhibited a small contraction when loaded to 20% of
the ultimate load during 25 minutes then remain
constant for the later period of this load, thereon
noticed a large elongation at the left and right edge of
column specimens when exposed to burning, then a
sudden contraction was observed when applying the
residual load until 95% of ultimate load.
Finally, these Figures present the time versus the
vertical displacements in y-direction (expansion or
contraction) for column specimens at different stages during burning and loading.
4.4 Effect of fire flame on load-deflection
relationship
The midheight lateral deflection of the
column specimens which were loaded and exposed to
fire flame at the same time was measured during this
process. Each column specimen was loaded to 20%
of the ultimate load before burning for a period of 25
minute; then exposed to fire flame temperatures of
752 and 1472ºF (400 and 800°C) thereon; the
residual ultimate load was applied until failure. Fig. 12 to 14 showed the load-midheight
lateral deflection relationships for columns before
and after the exposure to the fire flame, where,
columns which exposed to higher fire temperature,
gives approximately, the lesser curvature compared
with those of the control column specimens and
lower burning temperature. This can be attributed to
the reduction in modulus of elasticity of concrete and
increase in the amount of cracks formation.
These Figures reveal that the load-deflection
relation of the column specimens is almost linearly proportional for the two eccentricities 1.77 and 3.55
in. (45 and 90mm) and for temperature exposure
1472ºF (800°C). In addition, it can be noted that the
increase in the fire temperature decreases the load
carrying capacity and increases lateral deflection in
column specimens.
When the fire flame temperature increases to
1472ºF (800°C), the load carrying capacity decreases,

Dr. Alkafaji et al. Int. Journal of Engineering Research and Applications www.ijera.com
Vol. 3, Issue 5, Sep-Oct 2013, pp.135-148
www.ijera.com 139 | P a g e
and also the deflection values increase rapidly for the
same load and eccentricity as shown in these Figures.
This can be attributed to the weaker bond strength
between the concrete and steel reinforcement. This
de-bonding is resulted due to the cracks that formed
at surface. They were at locations close to the steel reinforcement. As these cracks propagated and
widened, the fire penetrated into the inner part of the
column specimens and the steel reinforcement
through the "crack opening".
4.5 Test observations and mode of failure During testing of SCC column specimens up
to failure, it was observed the cracks appeared on the
concentric columns nearly vertical, hairline cracks
appeared at the middle portion of columns. More
cracks (mostly vertical) continued to appear on the
column faces. Also approximately the first twenty five minutes of burning at temperature 1472ºF
(800°C), concrete spalling was observed. Scabbing
occurred prior to the column failure due to the
crushing of the concrete and subsequent buckling of
the main reinforcement at later stage. For columns
loaded at eccentricity 45 and 90mm on the surface
from the tension zone towards the compression zone.
Further, flexural cracks were formed progressively
and widened as the loading increased. However some
of short nearly vertical, hairline cracks were detected
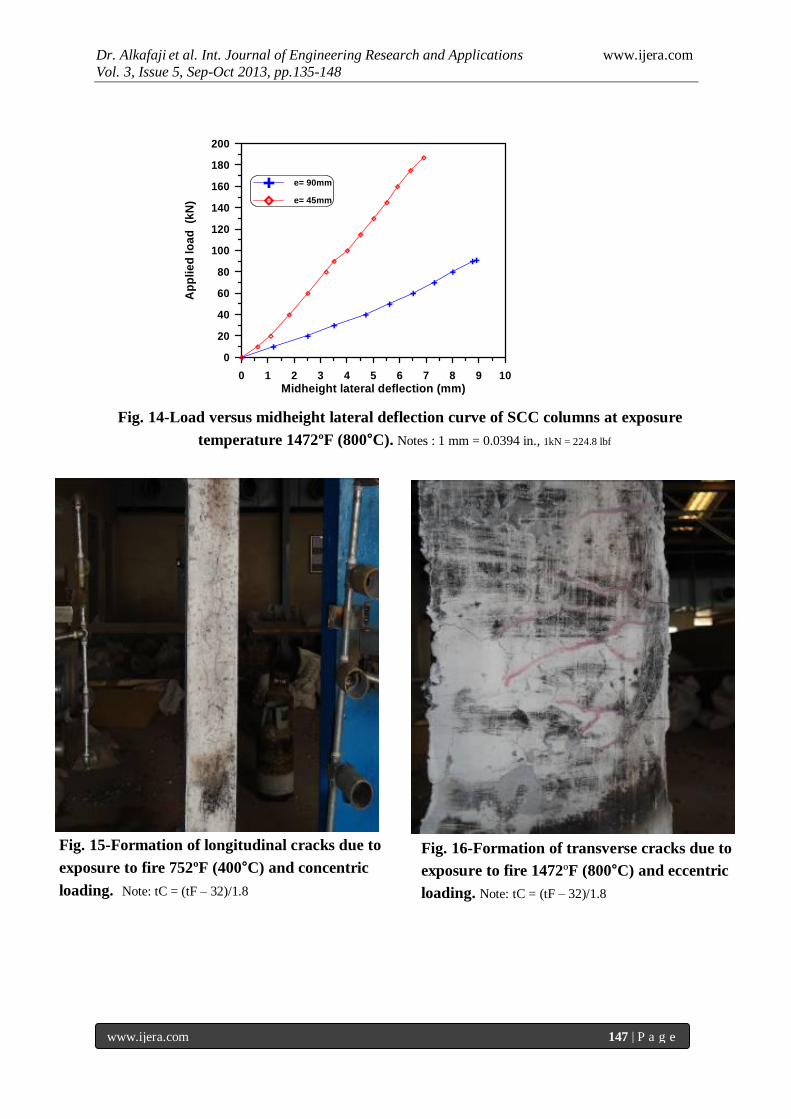
on the middle third of the columns. As exposure to fire flames continued,
longitudinal cracks appeared and propagated on all
faces of the columns tested. Also transverse cracks
during burning, which appeared at locations of ties
can be distinguished. Fig. 15 and 16 show these
cracks.
As loading increased, the cracks widened
and extended to join and form triangular-shaped
cracks of 5.3-5.7 in. (135-145 mm) length and 1.57-
1.97 in. (40-50 mm) width as shown in Fig. 17.
Generally, runoff water from all surfaces of column
specimens in the first few minutes was noticed. This phenomenon was observed at about 12-16 minutes
and continued for approximately 11 minutes for all
burning temperatures 752 and 1472ºF (400 and
800oC), Fig. 18 show this behavior. This can be
attributed to the increase in vapor pressure inside the
saturated voids which causes water to escape out
from the cracks on the surface generated by fire
exposure.
Different modes of failure were observed:
Compression failure for concentric loaded column
specimens.
Combined flexural and compression failure for
eccentric loaded column specimens.
The columns burned at 752ºF (400oC), the
type of failure for concentric and eccentric loaded
specimens stayed without changes. For columns
burned at 1472ºF (800oC), the type of failure also
remained constant but scabbing in the concrete cover
occurred. This can be attributed to the vapor pressure
of the runoff water which exerts internal pressure
stresses on the surface layers of concrete which are
unconfined by the tie reinforcement resulting in
scabbing of these layers.
4.6 General behavior and verification of building
code provisions of axially loaded column
specimens
The test results were used to verify the
recommendations and design simplifications of the
various Building Codes Pertaining to axial load
capacity (Pn) design, specifically, comments are
made on accuracy of strength Predictions. These
equations are selected and used in this study for
comparison with the results of the experimental
work. These equations are outlined in the Table 9.
Table 10 presents the comparison between the
experimental results with (ACI19, B.S20 and Canadian21) Codes. To utilize these equations after
exposure to fire flame temperatures the relative axial
load capacity values (Pu test/Pn calculated) were
calculated for the SCC column specimens. The
relationship between fire temperature with residual
axial load capacity and ultimate load carrying
capacity are illustrated in Fig. 19.
At burning temperature 752ºF (400°C), the ACI
Building Code gave reasonable results to predict
axial load capacity, while the (B.S20 and Canadian21)
codes gave very conservative values of column capacity. The ratios between the measured and
(ACI19, B.S20 and Canadian21) predicted values were
(1.14, 1.91 and 1.74%) respectively.
At burning temperature 1472ºF (800°C), the ACI
Code became unable to predict axial load capacity,
while the B.S Building codes gave close results,
whereas, the Canadian code gave overestimated
results to predict column load capacity to predict
column capacity. The ratios between the measured
and (ACI19, B.S20 and Canadian21) predicted values
were (0.61, 0.98 and 0.83%) respectively.
V. CONCLUSIONS Based on the results obtained from this
work, the following conclusions can be withdrawn:
1. The residual compressive strength ranged
between (84-88%) at 752ºF (400ºC), and (42-
51%) at 1472ºF (800ºC) burning temperature.
2. In this study, it is observed that the value of
longitudinal crack width is less than flexure
transverse crack width for columns with or without burning.
3. It is found that the residual ultimate load
capacity of SC column specimens decreases
significantly when subjected to burning by fire
flame.
After exposure to fire temperature 752ºF
(400oC), the percentage residual ultimate
load is 86% for concentric loaded, while
87% and 113.8% for eccentric at 1.77 and

Dr. Alkafaji et al. Int. Journal of Engineering Research and Applications www.ijera.com
Vol. 3, Issue 5, Sep-Oct 2013, pp.135-148
www.ijera.com 140 | P a g e
3.55 in. (45 and 90 mm) loaded column
specimens respectively.
After exposure to fire temperature 1472ºF
(800oC), the percentage residual ultimate
load is 26% for concentric loaded, while
28% and 39% for eccentric at 1.77 and 3.55 in. (45 and 90 mm) loaded column
specimens respectively.
4. The experimental results clearly indicate that the
crack width in reinforced concrete columns that
are subjected to fire flame are higher than the
columns that are not burned at identical loads.
5. In this study, it is noticed that the load-deflection
relation of rigid beam specimens exposed to fire
flame temperature around 1472ºF (800oC) are
more leveled indicating softer load-deflection
behavior than that of the control beams. This can
be attributed to the early cracks and lower modulus of elasticity.
6. The Canadian/84 and ACI Codes predict
ultimate load carrying capacity after exposure to
752ºF (400oC) fire flame temperature
conservatively.
7. B.S-8110/97 Code give close results to predict
ultimate load carrying capacity after exposure to
752ºF (400oC) fire flame temperature.
NOTATION ACI = American concrete institute
ASTM = American society for testing and materials
An = net concrete area
Ast = total area of longitudinal steel
reinforcement
fc' = cylinder compressive strength of concrete
fcu = cube compressive strength of concrete
fcua = cube compressive strength after burning
fcub = cube compressive strength before burning Fy = yield stress of steel reinforcing bar
NSC = normal strength concrete
LSP = limestone powder
IQS = Iraqi specification limits
Sec. = second
Pu = measured ultimate load
Pn = designed ultimate load
S/A = fine aggregate volume to total aggregate
volume ratio
SP = superplasticizer
TC = Traditional concrete
References [1] Sakai, K., and Sheikh, S. A., "What Do We
Know about Confinement in Reinforced
Concrete Columns," ACI Structural Journal,
V. 86, No. 2, Mach-April, 1989, pp. 192-
207.
[2] Campion, M., and Jost, P., "SCC:
Expanding the Possibilities of Concrete
Design and Placement," Concrete International, No. 4, April, 2000, pp. 31-34.
[3] Frank J. and Fritz H., "Ecological
Performance of SCC," The Swiss Society of
Engineering and Architects, 2001, pp. 1-8.
[4] Dirch, H.; Mehta, R; and Rune, M.,
"Rheology of Self-compacting Mortars,
Influence of Particle Grading," Research and Development Centre, Aalborg, Denmark,
2000, pp. 1-15.
[5] Su, K.; Cho, W.; Yang, C.; and Huang, R.,
"Effect of Sand Ratio on the Elastic
Modulus of SCC," Journal of Marine
Science and Technology, V. 10, No. 1,
2002, pp. 8-13.
[6] Annerel, E., "Residual strength of concrete
members after fire Exposure," Department
of Structural Engineering, Ghent University,
2007, 2 pp.
[7] Kodaira, A.; Fujinaka, H.; Ohashi, H.; and Nishimura, T., "Fire Resistance of
Composite Beams Composed of Rolled
Steel Profile Concreted between Flanges,"
Fire Science and Technology 23(3), 2004,
pp. 192-208.
[8] Neville, A. M., "Properties of Concrete,"
Longman Group, Ltd., 4th and Final Edition,
1995, pp. 388.
[9] ACI Committee 211, "Standard Practice for
Selecting Proportions for Normal,
Heavyweight, and Mass Concrete (ACI211.1-91)," American Concrete
Institute, Michigan, U.S.A. 1997.
[10] Iraqi Organization of Standards, IOS 5:
1984; for Portland cement.
[11] ASTM C150, "Standard Specification for
Portland Cement," Annual Book of ASTM,
Standards American Society for Testing and
Materials, 2005.
[12] ASTM C33, "Standard Specification for
Concrete Aggregates," American National
Standard, 2003.
[13] Iraqi Organization of Standards No.45, "Aggregate from Natural Sources for
concrete and Construction," Baghdad, 1984.
[14] ASTM A615/615M-5a, "Standard
Specification for Deformed and Plain
Carbon Structural Steel Bars for Concrete
requirement," Annual Book of ASTM
Standards, V.01.02, 2005.
[15] ASTM C 494/C 494M-99, "Standard
Specification for Chemical Admixture for
Concrete," Annual Book of ASTM
Standards, American Society for Testing and Materials, V.04.02, 1999.
[16] European Research Project, "Measurements
of Properties of Fresh Self Compacting
Concrete," Guidelines for Testing Fresh Self
Compacting Concrete, Principle Author;
G.DE SCHUTTER, September, 2005.
[17] Mohamadbhai, G., T., "Effect of Exposure
Time and Rates of Heating and Cooling on

Dr. Alkafaji et al. Int. Journal of Engineering Research and Applications www.ijera.com
Vol. 3, Issue 5, Sep-Oct 2013, pp.135-148
www.ijera.com 141 | P a g e
Residual Strength of Heated Concrete,"
Magazine of Concrete Research, V. 136,
September, 1986, pp. 151-158.
[18] Castillo, C., and Durrani, A., J., "Effect of
Transient High Temperature on High
Strength Concrete," ACI Materials Journal, V. 87, No. 1, January-February, 1990, pp.
47-53.
[19] ACI 318-08, "Building Code Requirements
for Reinforced Concrete," American
Concrete Institute, Detroit, 2008.
[20] British Standards Institution, 8110 part 2,
"Code of Practice for Design and
Construction," London, 1997.
[21] Canadian Standards Association, "Design of
Concrete Structures for Buildings CAN.3-
A23.3-M84," National Standard of Canada,
Rexdale, Canada, 1984.
TABLES AND FIGURES List of Tables:
Table 1 - Aggregate properties.
Table 2 - Properties of Ura-plast superplasticizer.
Table 3- Chemical composition of limestone powder.
Table 4- Mix proportions of the SCC mix.
Table 5- Description of column test specimens.
Table 6- Results of fresh properties for SCC. Table 7- Test values of cube compressive strength
before and after burning.
Table 8- Test results of the first crack load, ultimate load,
axial deformation and maximum deflection for reference
columns and columns exposed to fire flame.
Table 9- Summary of formulas for predicting axial
load column capacity.
Table 10- Comparison of the load carrying capacity
test results with that obtained from (ACI19, B.S20 and
Canadian21) codes of SCC column specimens at age
of 60 days.
List of Figures:
Fig. 1 - The residual compressive strength
(Annerel6).
Fig. 2 - Apparatus test.
Fig. 3 - Reinforcement details of reinforced SCC
column specimens.
Fig. 4 - The network methane burners. Fig. 5 - Temperature measurement device.
Fig. 6 - The testing measurement of axial
deformation.
Fig. 7- Testing of SCC column specimens under 15%
of ultimate load with exposure burning.
Fig. 8 - Effect of fire temperature on the compressive
strength.
Fig. 9 - Effect of fire temperature on the ultimate
load of column specimens.
Fig. 10 - Axial deformation versus time curve at
centerline of column specimen before burning.
Fig. 11 - Axial deformation versus time curve at 2.0 in. (50.8 mm) from the centerline of column
specimen before, during and after burning.
Fig. 12 - Load versus midheight lateral deflection
curve of SCC columns before burning.
Fig. 13 - Load versus midheight lateral deflection
curve of SCC columns at exposure temperature 752ºF
(400°C).
Fig. 14 - Load versus midheight lateral deflection
curve of SCC columns at exposure temperature
1472ºF (800°C).
Fig. 15 - Formation of longitudinal cracks due to exposure to fire 752ºF (400°C) and concentric
loading
Fig. 16 - Formation of transverse cracks due to
exposure to fire 1472ºF (800°C) and eccentric
loading.
Fig. 17 - Formation of triangular-shaped cracks due
to exposure to fire 1472ºF (800°C) and eccentric
loading prior to failure.
Fig. 18 - Runoff water from SCC column specimen.
Fig. 19 - Effect of fire temperature on the axial load
capacity of SC column specimens.
Table 1 - Aggregate properties.
Sieve diameter, mm (in.)
Percent passing
Coarse Fine
12.5 (1/2) 100 100
9.5 (3/8) 100 100
4.75 (3/16) 13.4 99.8
2.36 (0.0937) 3 89.6
1.18 (0.0469) 2 71.3
0.60 (0.0234) — 50.3
0.30 (0.0124) — 18.4
0.15 (0.0059) — 4.1
0.075 (0.00295) — 1.1
0 0 0
Specific gravity,
kg/m3(lb/ft3) 2650 (159) 2660 (160)
Absorption, % 2.41 1.78
Note: 1 kg/m3 = 0.06 lb/ft3.

Dr. Alkafaji et al. Int. Journal of Engineering Research and Applications www.ijera.com
Vol. 3, Issue 5, Sep-Oct 2013, pp.135-148
www.ijera.com 142 | P a g e
Table 2 - Properties of Ura-plast superplasticizer.
Form Color Relative density Viscosity pH
value
Transport Labeling
Viscous
liquid
Dark
brown
1.1 at 68°F
(20°C)
128 + 3 cps
at 68°F
(20°C)
6.6 Not classified
as dangerous
No hazard
label required
Table 3-Chemical composition of limestone powder.
Oxide CaO SiO2 Al2O3 Fe2O3 MgO SO3 L.O.I
% 52.76 1.40 0.70 0.17 0.10 2.91 40.60
Table 4-Mix proportions of the SCC mix.
Mix proportions of specimen materials, lb/ft3 (kg/m3)
W/P ratio Water Cement Sand Gravel LSP
SP
% by wt. of
cement
0.33 12.40 (200) 29.76 (480) 47.12 (760) 52.33 (844) 7.44 (120) 6
Table 5-Description of column test specimens.
Column Notation C1 C2 C3 C4 C5 C6 C7 C8 C9
Temperature Stage ºF (ºC) 77 (25)( 752 (400) 1472 (800)
Eccentricity of Applied
Load
in. (mm)
0 1.77 (45) 3.55 (90) 0 1.77 (45) 3.55 (90) 0 1.77 (45) 3.55 (90)
.6 Table 6-Results of fresh properties for SCC.
Type of Test Flow, in.
(mm)
T50cm, (sec.) V-time, sec. L-box (H2/H1)%
Values 30.34 (770) 3.1 6.8 0.93
Limits of
EFNARC,2005
25.6–31.5
(650–800)
2–5 6–12 0.8–1
Table 7-Test values of cube compressive strength before and after burning.
Age at
exposure
(days)
Cube compressive strength psi (MPa) (fcua/fcub) Ratio
Temperature ºF (ºC)
b/a c/a
77 (25)(
(a)
752 (400)
(b)
1472 (800)
(c)
28 6090 (42) 5119 (35.3) 2552 (17.6) 0.84 0.42
60 6670 (46) 5800 (40.0) 2871 (19.8) 0.87 0.48
90 6960 (48) 6119 (42.2) 3553 (24.5) 0.88 0.51

Dr. Alkafaji et al. Int. Journal of Engineering Research and Applications www.ijera.com
Vol. 3, Issue 5, Sep-Oct 2013, pp.135-148
www.ijera.com 143 | P a g e
Table 8-Test results of the first crack load, ultimate load, axial deformation and maximum deflection for
reference columns and columns exposed to fire flame.
Column
Notation
Temperature
Level
ºF (ºC)
First Crack
Load
lbf (kN)
Ultimate
Load
lbf (kN)
Percentage
Residual
Ultimate Load
(%)
Axial
Deformation
in. (mm) at
Centerline
Maximum
Deflection
at
Midheight
in. (mm)
C1
77 (25)(
41026 (182.5) 219854 (978) 100 0.126 (3.2) ----
C2 32371 (144.0) 147918 (658) 100 ---- 0.23 (5.83)
C3 10678 (47.5) 52154 (232) 100 ---- 0.346 (8.72)
C4
752 (400)
Precracking 189282 (842) 86 0.173 (4.4) ----
C5 Precracking 129035 (574) 87 ---- 0.248 (6.3)
C6 Precracking 59347 (264) 113.8 ---- 0.362 (9.20)
C7
1472 (800)
Precracking 57549 (256) 26 0.243 (6.18) ----
C8 Precracking 42038 (187) 28 ---- 0.272 (6.9)
C9 Precracking 20457 (91) 39 ---- 0.350 (8.9)
--- No measured value
Table 9-Summary of formulas for predicting axial load column capacity.
Method Equation EQ. NO.
ACI-318M-08 Code 𝐏𝐧 = 𝟎.𝟖𝟓𝐟𝐜 ′ 𝐀𝐧 + 𝐟𝐲𝐀𝐬𝐭 1
B.S 8110-97 Code 𝐏𝐧 = 𝟎.𝟒𝐟𝐜𝐮𝐀𝐧 + 𝟎.𝟕𝟓𝐟𝐲𝐀𝐬𝐭 2
Canadian Code-1984 𝐏𝐧 = 𝟎.𝟓𝟏𝐟𝐜 ′ 𝐀𝐧 + 𝐟𝐲𝐀𝐬𝐭 3
Table 10-Comparison of the load carrying capacity test results with that obtained from (ACI19
, B.S20
and
Canadian21
) codes of SCC column specimens at age of 60 days.
Column
Notation
Compressive
strength (MPa)
Fy
(GPa)
Ultimate load (kN) 𝐏𝐮 𝐭𝐞𝐬𝐭
𝐏𝐧 𝐀𝐂𝐈
𝐏𝐮 𝐭𝐞𝐬𝐭
𝐏𝐧 𝐁.𝐒
𝐏𝐮 𝐭𝐞𝐬𝐭
𝐏𝐧 𝐂𝐚𝐧𝐝.
Fcu F'c Test B.S ACI Cand.
C1 42.0 35.7 540 978 500.3 843.3 547.5 1.16 1.96 1.78
C4 35.3 30.0 540 842 440.8 735.8 484.0 1.14 1.91 1.74
C7 17.6 14.96 453 256 260.8 421.6 308.8 0.61 0.98 0.83
Notes: 1 MPa = 145 psi; 1 GPa = 145.04 ksi, 1kN = 224.8 lbf
Fig. 1-The residual compressive strength.6
Note: tC = (tF – 32)/1.8

Dr. Alkafaji et al. Int. Journal of Engineering Research and Applications www.ijera.com
Vol. 3, Issue 5, Sep-Oct 2013, pp.135-148
www.ijera.com 144 | P a g e
Section A-A
A A
Tie spacing
410mm (main longitudinal
reinforcement) 1000mm
Concrete cover
=30mm
410mm (main longitudinal
reinforcement)
Fig. 3-Reinforcement details of reinforced SCC column specimens. (Note: 1 mm = 0.0394 in.)
V-funnel test
T50 test
L-box test
Fig. 2-Apparatus test. (Note: 1 mm = 0.0394 in.)

Dr. Alkafaji et al. Int. Journal of Engineering Research and Applications www.ijera.com
Vol. 3, Issue 5, Sep-Oct 2013, pp.135-148
www.ijera.com 145 | P a g e
Fig. 4-The network methane burners.
Fig. 5-Temperature measurement device.
Fig. 7-Testing of SCC column specimens under 15%
of ultimate load with exposure burning.
Fig. 6-The testing measurement of axial
deformation.
Notes: tC = (tF – 32)/1.8, 1 MPa = 145 psi
Notes: tC = (tF – 32)/1.8
Fig. 8-Effect of fire temperature on the
compressive strength.
Fig. 9-Effect of fire temperature on the
ultimate load of column specimens.
0 100 200 300 400 500 600 700 800
Fire temperature ( C)
10
20
30
40
50
Co
mp
res
siv
e s
tre
ng
th (
MP
a)
The age (days)
28
60
90
o 0 100 200 300 400 500 600 700 800
Fire temperature ( C)
20
40
60
80
100
120
Re
sid
ua
l u
ltim
ate
lo
ad
%
e= 0.0mm
e= 45mm
e= 90mm
o

Dr. Alkafaji et al. Int. Journal of Engineering Research and Applications www.ijera.com
Vol. 3, Issue 5, Sep-Oct 2013, pp.135-148
www.ijera.com 146 | P a g e
Note : 1 mm = 0.0394 in.
Fig. 10-Axial deformation versus time curve at
centerline of column specimen before burning.
0 5 10 15 20 25 30 35
Time (minutes)
-3.0
-2.5
-2.0
-1.5
-1.0
-0.5
0.0
Ax
ial
de
form
ati
on
(m
m)
Applied load to 20% Pu Constant
load 75% Pu
0 10 20 30 40 50 60 70 80 90 100 110 120 130
Time (minutes)
-3.0
-2.5
-2.0
-1.5
-1.0
-0.5
0.0
0.5
1.0
1.5
2.0
Ax
ial
de
form
ati
on
(m
m)
400 C
800 C
o
o
Note : 1 mm = 0.0394 in.
Fig. 11-Axial deformation versus time curve at 2.0 in.
(50.8 mm) from the centerline of column specimen
before, during and after burning.
Applied load to 20% Pu
Constant load
During fire
1
2
3
4 75% Pu
1
2
3 4
Notes : 1 mm = 0.0394 in., 1kN = 224.8 lbf
Fig. 12-Load versus midheight lateral deflection
curve of SCC columns before burning.
0 1 2 3 4 5 6 7 8 9
Midheight lateral deflection (mm)
0
50
100
150
200
250
300
350
400
450
500
550
600
650
700
Ap
pli
ed
lo
ad
(k
N)
e= 90mm
e= 45mm
Notes : 1 mm = 0.0394 in., 1kN = 224.8 lbf
Fig. 13-Load versus midheight lateral deflection
curve of SCC columns at exposure temperature
752°F (400°C).
0 1 2 3 4 5 6 7 8 9 10
Midheight lateral deflection (mm)
0
50
100
150
200
250
300
350
400
450
500
550
600
Ap
pli
ed
lo
ad
(k
N)
e= 90mm
e= 45mm
Dr. Alkafaji et al. Int. Journal of Engineering Research and Applications www.ijera.com
Vol. 3, Issue 5, Sep-Oct 2013, pp.135-148
www.ijera.com 147 | P a g e
Fig. 14-Load versus midheight lateral deflection curve of SCC columns at exposure
temperature 1472ºF (800°C). Notes : 1 mm = 0.0394 in., 1kN = 224.8 lbf
Fig. 15-Formation of longitudinal cracks due to
exposure to fire 752ºF (400°C) and concentric
loading. Note: tC = (tF – 32)/1.8
Fig. 16-Formation of transverse cracks due to
exposure to fire 1472ºF (800°C) and eccentric
loading. Note: tC = (tF – 32)/1.8
0 1 2 3 4 5 6 7 8 9 10
Midheight lateral deflection (mm)
0
20
40
60
80
100
120
140
160
180
200
Ap
pli
ed
lo
ad
(k
N)
e= 90mm
e= 45mm

Dr. Alkafaji et al. Int. Journal of Engineering Research and Applications www.ijera.com
Vol. 3, Issue 5, Sep-Oct 2013, pp.135-148
www.ijera.com 148 | P a g e
Fig. 18-Runoff water from SCC column
specimen.
Fig. 17-Formation of triangular-shaped cracks due
to exposure to fire 1472ºF (800°C) and eccentric
loading prior to failure. Note: tC = (tF – 32)/1.8
Notes : tC = (tF – 32)/1.8, 1kN = 224.8 lbf
0 100 200 300 400 500 600 700 800
Fire temperature ( C)
200
300
400
500
600
700
800
900
1000
Co
lum
n l
oa
d c
ap
ac
ity
(K
n)
Pn test
Pn B.S
Pn ACI
Pn Canad
o
Fig. 19-Effect of fire temperature on the axial load capacity of SC column specimens.
Recommended

![Load carrying capacity of a heterogeneous surface bearing · Pascovici [18] analysed the load carrying capacity of a heterogeneous, slip/non-slip pin sliding aganst a flat disc. He](https://img.pdfslide.us/doc/110x75/5e346c9f7e940f2e0e12c596/load-carrying-capacity-of-a-heterogeneous-surface-bearing-pascovici-18-analysed.jpg)