EERI Seminar on Next Generation Attenuation Models
New “Risk-Targeted” Seismic Maps Introduced into USA Building Codes
Nicolas Luco, Research Structural Engineer
U.S. Geological Survey
Golden, Colorado
Indian Institute of Science (IISc) Department of Civil Engineering Seminar
EERI Seminar on Next Generation Attenuation Models
E
E
EE E
E
E
E
E
EE
E
E
EE
E
EE
EE
E
E
E
E
E
E
E
E
4.9
7
33.825.4
30.5
15.5
7.9
14.3
12.7
38.8
12.5
34.7
27
6.813.9
26
37.5
30.6
34.125.5
28.2
27.1
31.6
28.4
6.6
31.1
17.2
3.7
30
90
80
150
100
35
150
70
70
20
15
40
70
200
150
150
70
70
70
20
150
150
40
100
200
10
90
15
35
125
15
20
20
125
200
125
30
35
150
10
25
200
70
25
35
125
100
70
30
15
80
125
150
30
100
60
30
35
40
70
125
125
150
10
10
90
70
70
125
60
25
80
150
50
50
30
25
100
150
60
200
15
150150
90
5
50
100
20
100
30
20
200
90
35
15
15
60
40
35
90
70
20
35
30
25
10
25
10
10
80
35
70
20
35
30
2530
50
15
60
70
60
50
90
100
80
125
40
150
150
125
150
150
80
150
150
200
5
150
100
12590
125
90
100
50 60
70
80
5
5
50
150
100
80
60
150
150200
125
125
150150
60
120° 110° 100°
45°
40°
35°
30°
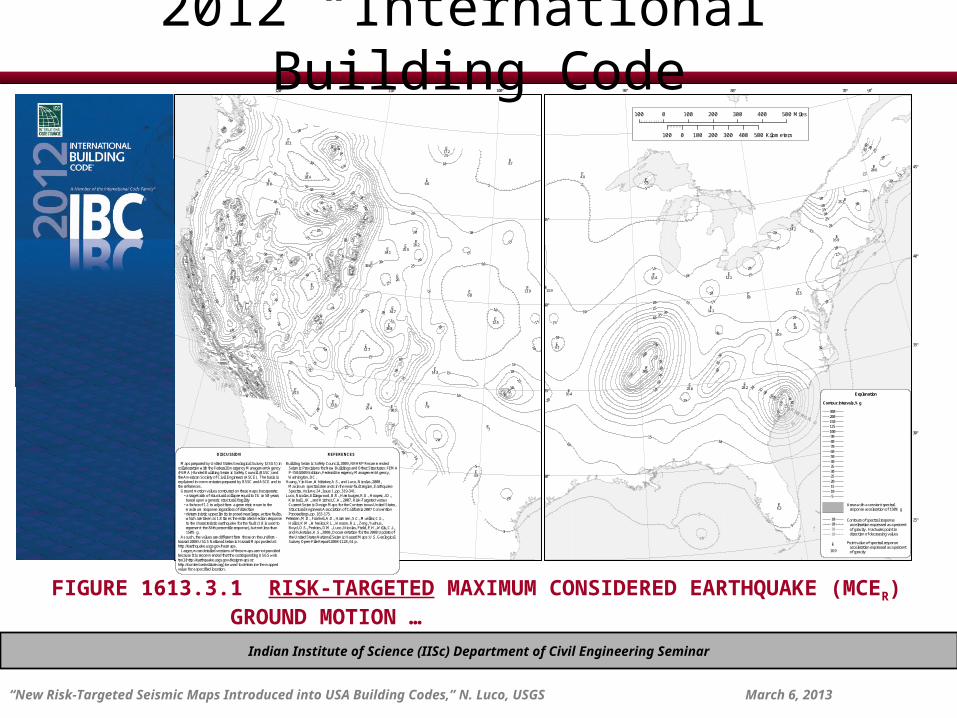
REFERENCES
Building Seismic Safety Council, 2009, NEHRP Recommended Seismic Provisions for New Buildings and Other Structures: FEMA P-750/2009 Edition, Federal Emergency Management Agency, Washington, DC.Huang, Yin-Nan, Whittaker, A.S., and Luco, Nicolas, 2008, Maximum spectral demands in the near-fault region, Earthquake Spectra, Volume 24, Issue 1, pp. 319-341.Luco, Nicolas, Ellingwood, B.R., Hamburger, R.O., Hooper, J.D., Kimball, J.K., and Kircher, C.A., 2007, Risk-Targeted versus Current Seismic Design Maps for the Conterminous United States, Structural Engineers Association of California 2007 Convention Proceedings, pp. 163-175.Petersen, M.D., Frankel, A.D., Harmsen, S.C., Mueller, C.S., Haller, K.M., Wheeler, R.L., Wesson, R.L., Zeng, Yuehua, Boyd, O.S., Perkins, D.M., Luco, Nicolas, Field, E.H., Wills, C.J., and Rukstales, K.S., 2008, Documentation for the 2008 Update of the United States National Seismic Hazard Maps: U.S. Geological Survey Open-File Report 2008-1128, 61 p.
DISCUSSION
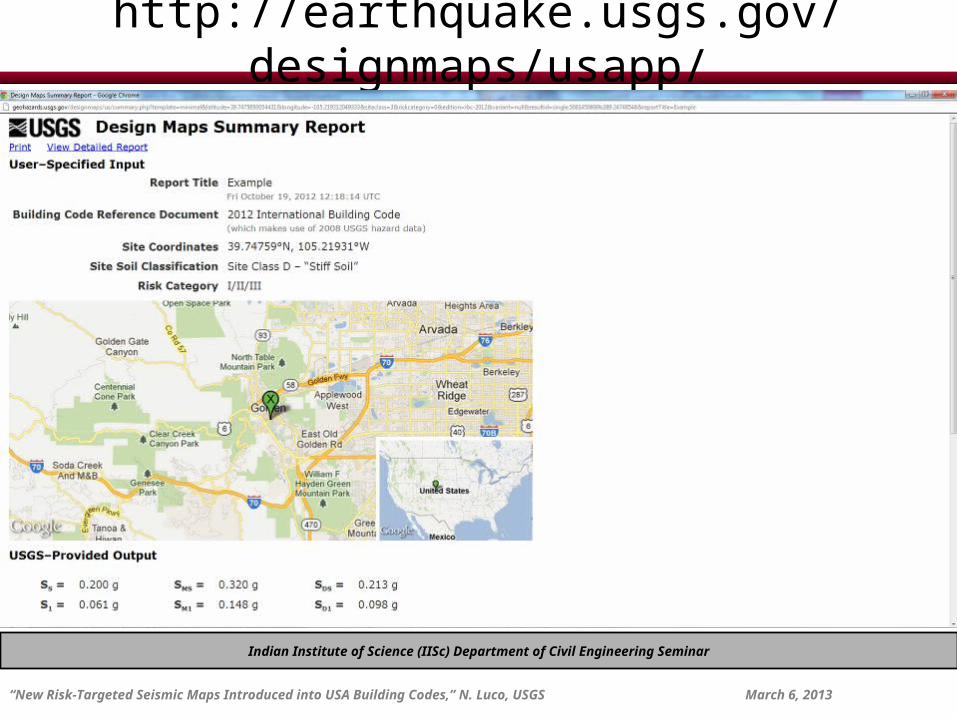
Maps prepared by United States Geological Survey (USGS) incollaboration with the Federal Emergency Management Agency(FEMA)-funded Building Seismic Safety Council (BSSC) andthe American Society of Civil Engineers (ASCE). The basis isexplained in commentaries prepared by BSSC and ASCE and inthe references. Ground motion values contoured on these maps incorporate: • a target risk of structural collapse equal to 1% in 50 years based upon a generic structural fragility • a factor of 1.1 to adjust from a geometric mean to the maximum response regardless of direction • deterministic upper limits imposed near large, active faults, which are taken as 1.8 times the estimated median response to the characteristic earthquake for the fault (1.8 is used to represent the 84th percentile response), but not less than 150% g. As such, the values are different from those on the uniform-hazard 2008 USGS National Seismic Hazard Maps posted at:http://earthquake.usgs.gov/hazmaps. Larger, more detailed versions of these maps are not providedbecause it is recommended that the corresponding USGS webtool (http://earthquake.usgs.gov/designmaps orhttp://content.seinstitute.org) be used to determine the mappedvalue for a specified location.
E
E
EE
E
E
E
E
EE
E
E
E
E
E
E
EE
E
E
6.3
28.2
16.425.6
306
16.9
9.7
14.1
12.510
13.9
12.1
16.9
14.2
25.3
20.6
5.5
4.4
16.4
25
35
10
10
25
5
30
30
20
50
20
20
20
20
20
20
25
150
25
25
5
5
40
15
125
10
35
15
9080
100
25
20
10
60
15
30
50
15
15
40
40
20
20
25
35
15
200
150
35
30
10
125
10
100
90
40
30
8070
5
10
60
50
40
15
3530
1520
25
15
2015
10
10
5
5
5
20
70
25
5
10
50 40
35
30
50° 90° 80° 70°
45°
40°
35°
30°
25°
100 0 100 200 300 400 500 Miles
100 0 100 200 300 400 500 Kilometers
Explanation
Contour intervals, %g
3002001501251009080706050403530252015105
Areas with a constant spectral response acceleration of 150% g
10101010
E16.9
Point value of spectral response acceleration expressed as a percent of gravity
Contours of spectral response acceleration expressed as a percent of gravity. Hachures point in direction of decreasing values
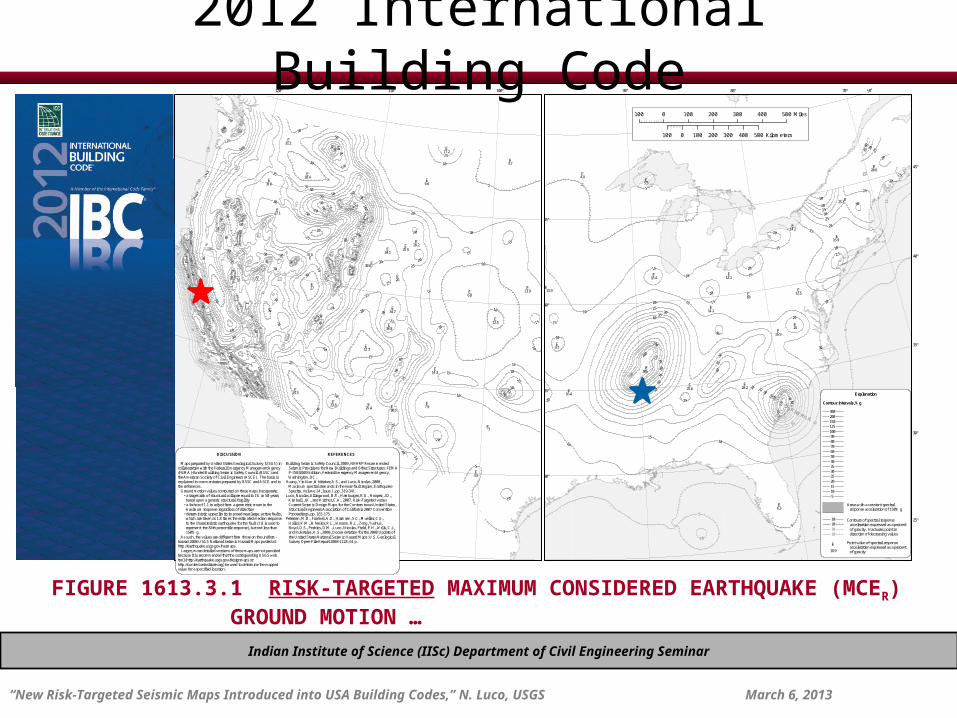
2012 “International” Building Code
FIGURE 1613.3.1 RISK-TARGETED MAXIMUM CONSIDERED EARTHQUAKE (MCER) GROUND MOTION …
Indian Institute of Science (IISc) Department of Civil Engineering Seminar
“New Risk-Targeted Seismic Maps Introduced into USA Building Codes,” N. Luco, USGS March 6, 2013
EERI Seminar on Next Generation Attenuation Models
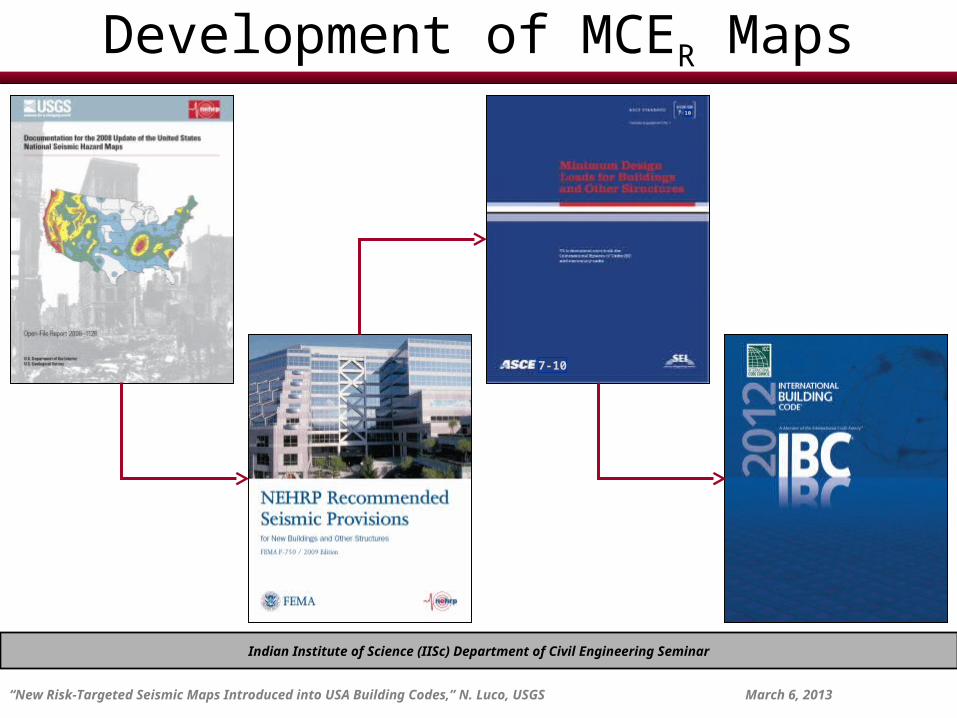
Development of MCER Maps
Indian Institute of Science (IISc) Department of Civil Engineering Seminar
“New Risk-Targeted Seismic Maps Introduced into USA Building Codes,” N. Luco, USGS March 6, 2013
10
7-10
EERI Seminar on Next Generation Attenuation Models
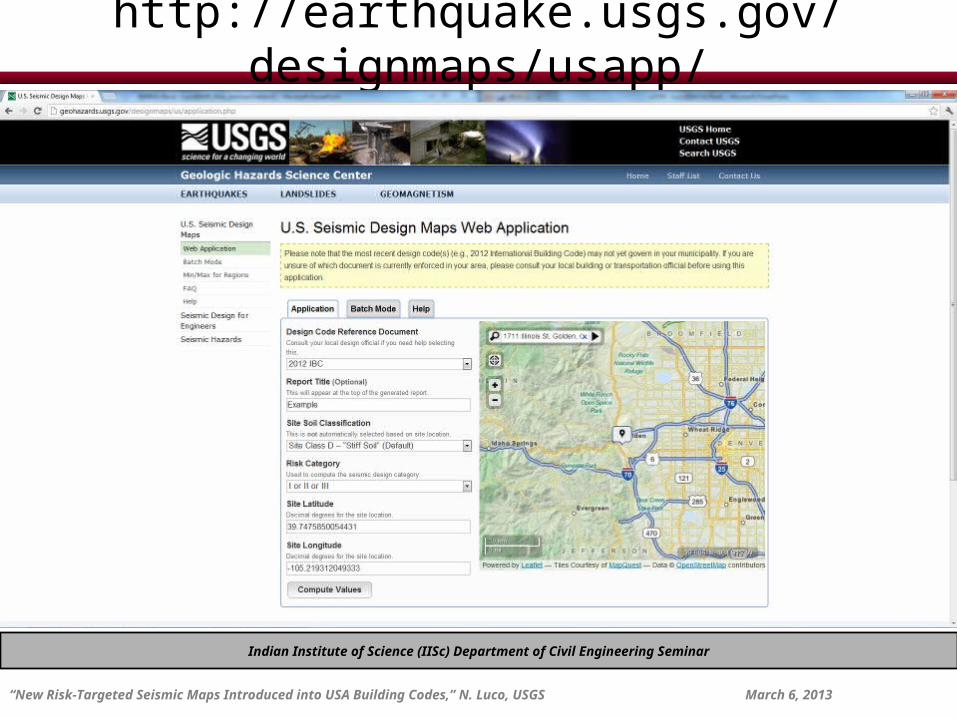
http://earthquake.usgs.gov/designmaps/usapp/
Indian Institute of Science (IISc) Department of Civil Engineering Seminar
“New Risk-Targeted Seismic Maps Introduced into USA Building Codes,” N. Luco, USGS March 6, 2013
EERI Seminar on Next Generation Attenuation Models
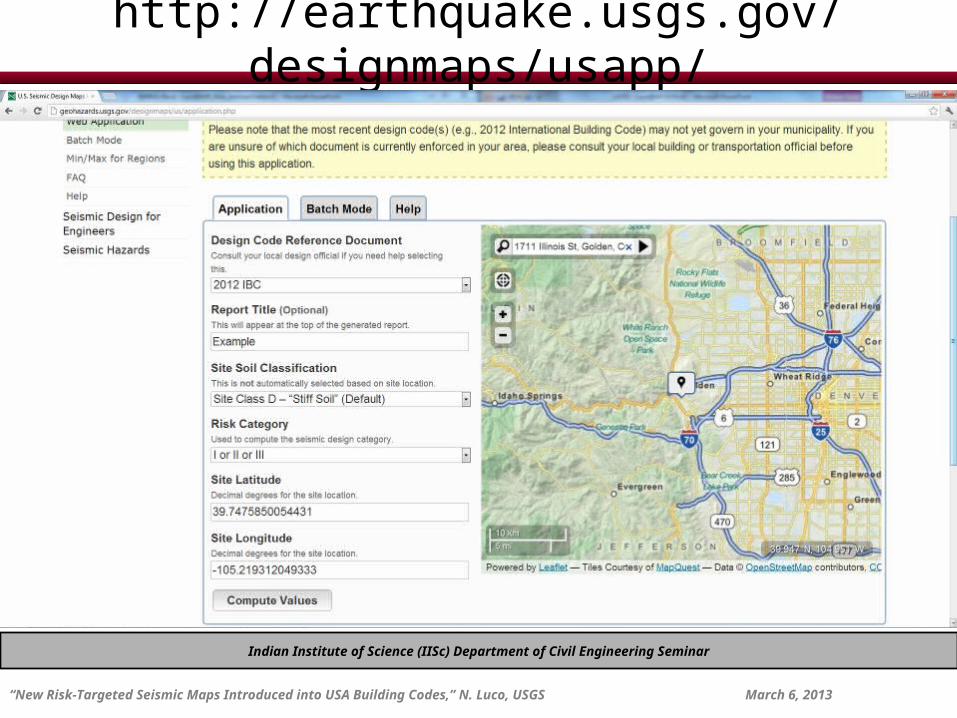
http://earthquake.usgs.gov/designmaps/usapp/
Indian Institute of Science (IISc) Department of Civil Engineering Seminar
“New Risk-Targeted Seismic Maps Introduced into USA Building Codes,” N. Luco, USGS March 6, 2013
EERI Seminar on Next Generation Attenuation Models
http://earthquake.usgs.gov/designmaps/usapp/
Indian Institute of Science (IISc) Department of Civil Engineering Seminar
“New Risk-Targeted Seismic Maps Introduced into USA Building Codes,” N. Luco, USGS March 6, 2013

EERI Seminar on Next Generation Attenuation Models
Outline of Presentation
• Past/present design approaches for seismic safety
• Quantification of seismic risk/performance
• Recent/future risk-based seismic design approaches
• Implications for designing against hazards, in general
• Outstanding issues
Indian Institute of Science (IISc) Department of Civil Engineering Seminar
“New Risk-Targeted Seismic Maps Introduced into USA Building Codes,” N. Luco, USGS March 6, 2013

EERI Seminar on Next Generation Attenuation Models
Past Seismic Design Approaches
• Past and most present design approaches for seismic safety are prescriptive, based on following rules rather than explicitly quantifying performance/risk.
e.g., “If at least seven ground motions [(time series)] are analyzed, the design member forces … are permitted to be taken … as the average of the … values determined from the [building response] analyses …” – ASCE 7 Standard
• For earthquake loads/demands, past (and most present) approaches typically design against …
Indian Institute of Science (IISc) Department of Civil Engineering Seminar
“New Risk-Targeted Seismic Maps Introduced into USA Building Codes,” N. Luco, USGS March 6, 2013

EERI Seminar on Next Generation Attenuation Models
Deterministic Earthquake Scenarios
Indian Institute of Science (IISc) Department of Civil Engineering Seminar
“New Risk-Targeted Seismic Maps Introduced into USA Building Codes,” N. Luco, USGS March 6, 2013
e.g., USGS “ShakeMaps”

EERI Seminar on Next Generation Attenuation Models
Probabilistic Seismic Hazard Maps
Indian Institute of Science (IISc) Department of Civil Engineering Seminar
“New Risk-Targeted Seismic Maps Introduced into USA Building Codes,” N. Luco, USGS March 6, 2013
e.g., ground motion intensity with a uniform 1/2500 annual probability of being exceeded
EERI Seminar on Next Generation Attenuation ModelsIndian Institute of Science (IISc) Department of Civil Engineering Seminar
“New Risk-Targeted Seismic Maps Introduced into USA Building Codes,” N. Luco, USGS March 6, 2013
Past Seismic Design Approaches
Although seismic safety was implied by these past design approaches, …
… the seismic risk for the resulting structures …
(e.g., annual probability of seismically-induced failure)
… was not explicitly quantified in the design process, or in the development of the design process by regulators.

EERI Seminar on Next Generation Attenuation Models
Meanwhile, for decades now (e.g., ATC 3-06, 1978) …
Seismic Risk Quantification
Indian Institute of Science (IISc) Department of Civil Engineering Seminar
“New Risk-Targeted Seismic Maps Introduced into USA Building Codes,” N. Luco, USGS March 6, 2013
EarthquakeScientists
EarthquakeEngineers
SeismicRisk
Probabilistic SeismicFragility Curves
Probabilistic SeismicHazard Curves
EERI Seminar on Next Generation Attenuation Models
Probabilistic Seismic Hazard Curves
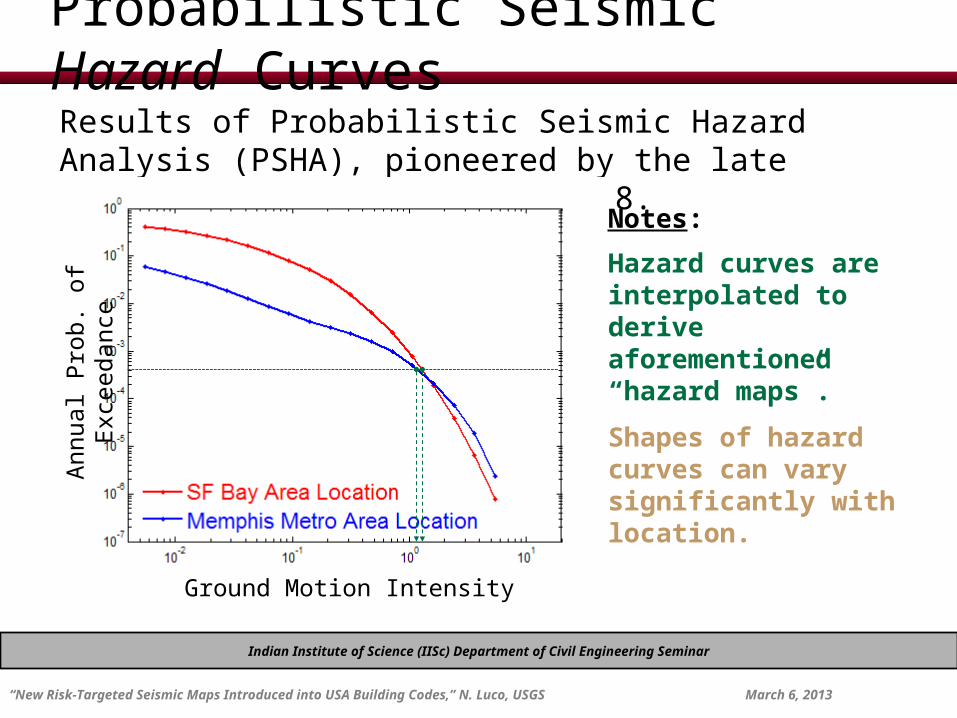
Results of Probabilistic Seismic Hazard Analysis (PSHA), pioneered by the late Prof. C. Allin Cornell in 1968.
Notes:
Hazard curves are interpolated to derive aforementioned “hazard maps”.
Shapes of hazard curves can vary significantly with location.
Indian Institute of Science (IISc) Department of Civil Engineering Seminar
“New Risk-Targeted Seismic Maps Introduced into USA Building Codes,” N. Luco, USGS March 6, 2013
Ground Motion Intensity
Ann
ual P
rob.
of
Exc
eeda
nce
EERI Seminar on Next Generation Attenuation Models
10-2
10-1
100
101
0
0.1
0.2
0.3
0.4
0.5
0.6
0.7
0.8
0.9
1
Ground Motion Intensity, IM = z
Pro
b [
Col
laps
e |
IM =
z ]
Design IM = 1.38gDesign IM = 0.96g
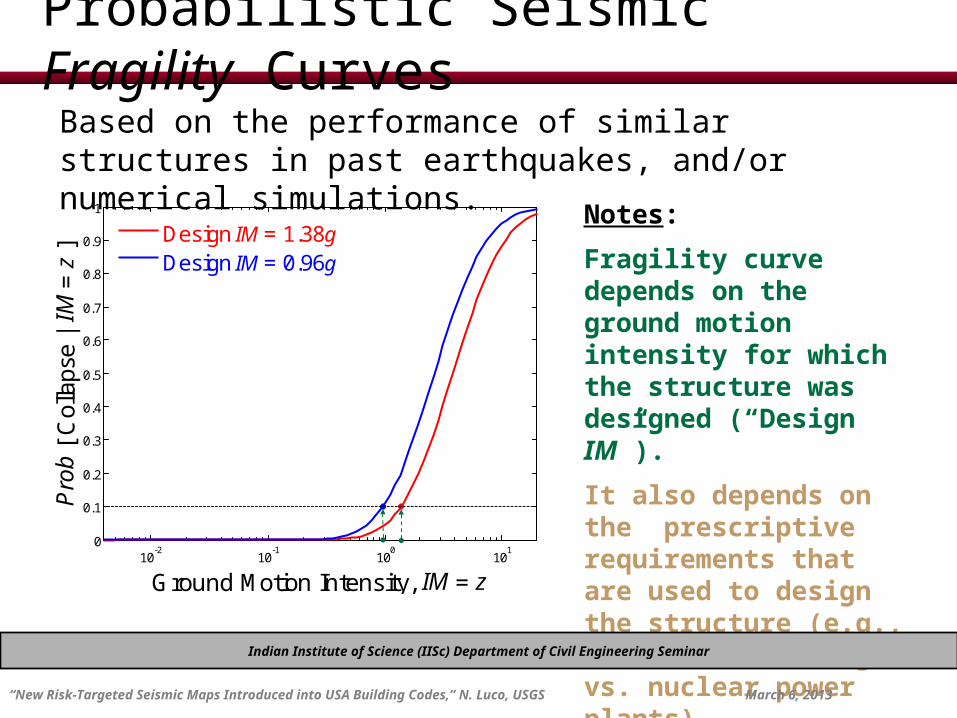
Based on the performance of similar structures in past earthquakes, and/or numerical simulations.
Probabilistic Seismic Fragility Curves
Notes:
Fragility curve depends on the ground motion intensity for which the structure was designed (“Design IM”).
It also depends on the prescriptive requirements that are used to design the structure (e.g., those for buildings vs. nuclear power plants).
Indian Institute of Science (IISc) Department of Civil Engineering Seminar
“New Risk-Targeted Seismic Maps Introduced into USA Building Codes,” N. Luco, USGS March 6, 2013
EERI Seminar on Next Generation Attenuation Models
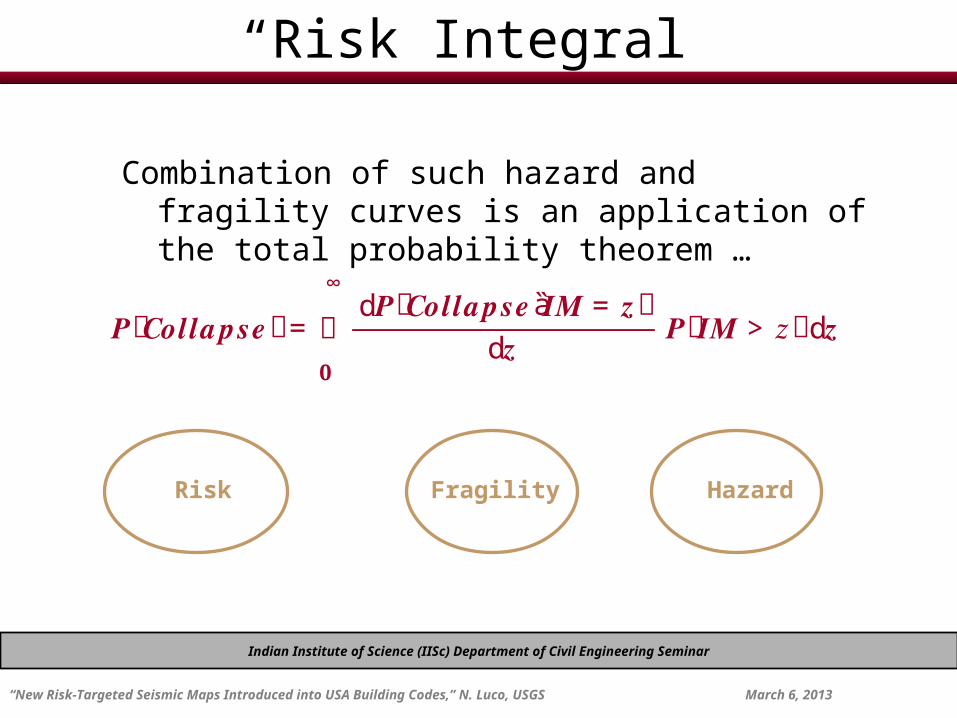
“Risk Integral”
Combination of such hazard and fragility curves is an application of the total probability theorem …
Indian Institute of Science (IISc) Department of Civil Engineering Seminar
“New Risk-Targeted Seismic Maps Introduced into USA Building Codes,” N. Luco, USGS March 6, 2013
𝑷ሾ𝑪𝒐𝒍𝒍𝒂𝒑𝒔𝒆ሿ= න d𝑷ሾ𝑪𝒐𝒍𝒍𝒂𝒑𝒔𝒆ȁ 𝑰𝑴= 𝒛ሿ d𝒛 𝑷ሾ𝑰𝑴> 𝑧ሿ d𝒛∞
𝟎
HazardRisk Fragility

EERI Seminar on Next Generation Attenuation Models
“Risk Integral” (Example)
Indian Institute of Science (IISc) Department of Civil Engineering Seminar
“New Risk-Targeted Seismic Maps Introduced into USA Building Codes,” N. Luco, USGS March 6, 2013
Haz
ard
Ris
kF
rag
ilit
y
Ground Motion Intensity, IM=z
P [
Col
laps
e | I
M=
z ]
P [
IM >
z ]
Inte
gran
d
Design IM = 1.29gDesign IM = 1.18g
EERI Seminar on Next Generation Attenuation Models
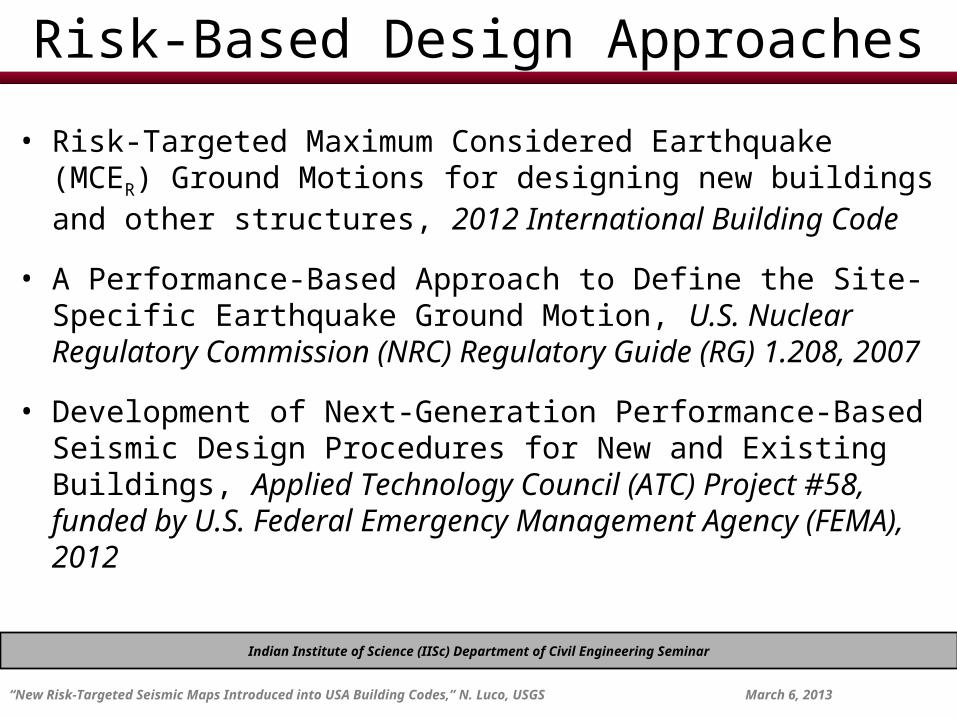
Risk-Based Design Approaches
• Risk-Targeted Maximum Considered Earthquake (MCER) Ground Motions for designing new buildings and other structures, 2012 International Building Code
• A Performance-Based Approach to Define the Site-Specific Earthquake Ground Motion, U.S. Nuclear Regulatory Commission (NRC) Regulatory Guide (RG) 1.208, 2007
• Development of Next-Generation Performance-Based Seismic Design Procedures for New and Existing Buildings, Applied Technology Council (ATC) Project #58, funded by U.S. Federal Emergency Management Agency (FEMA), 2012
Indian Institute of Science (IISc) Department of Civil Engineering Seminar
“New Risk-Targeted Seismic Maps Introduced into USA Building Codes,” N. Luco, USGS March 6, 2013
EERI Seminar on Next Generation Attenuation Models
E
E
EE E
E
E
E
E
EE
E
E
EE
E
EE
EE
E
E
E
E
E
E
E
E
4.9
7
33.825.4
30.5
15.5
7.9
14.3
12.7
38.8
12.5
34.7
27
6.813.9
26
37.5
30.6
34.125.5
28.2
27.1
31.6
28.4
6.6
31.1
17.2
3.7
30
90
80
150
100
35
150
70
70
20
15
40
70
200
150
150
70
70
70
20
150
150
40
100
200
10
90
15
35
125
15
20
20
125
200
125
30
35
150
10
25
200
70
25
35
125
100
70
30
15
80
125
150
30
100
60
30
35
40
70
125
125
150
10
10
90
70
70
125
60
25
80
150
50
50
30
25
100
150
60
200
15
150150
90
5
50
100
20
100
30
20
200
90
35
15
15
60
40
35
90
70
20
35
30
25
10
25
10
10
80
35
70
20
35
30
2530
50
15
60
70
60
50
90
100
80
125
40
150
150
125
150
150
80
150
150
200
5
150
100
12590
125
90
100
50 60
70
80
5
5
50
150
100
80
60
150
150200
125
125
150150
60
120° 110° 100°
45°
40°
35°
30°
REFERENCES
Building Seismic Safety Council, 2009, NEHRP Recommended Seismic Provisions for New Buildings and Other Structures: FEMA P-750/2009 Edition, Federal Emergency Management Agency, Washington, DC.Huang, Yin-Nan, Whittaker, A.S., and Luco, Nicolas, 2008, Maximum spectral demands in the near-fault region, Earthquake Spectra, Volume 24, Issue 1, pp. 319-341.Luco, Nicolas, Ellingwood, B.R., Hamburger, R.O., Hooper, J.D., Kimball, J.K., and Kircher, C.A., 2007, Risk-Targeted versus Current Seismic Design Maps for the Conterminous United States, Structural Engineers Association of California 2007 Convention Proceedings, pp. 163-175.Petersen, M.D., Frankel, A.D., Harmsen, S.C., Mueller, C.S., Haller, K.M., Wheeler, R.L., Wesson, R.L., Zeng, Yuehua, Boyd, O.S., Perkins, D.M., Luco, Nicolas, Field, E.H., Wills, C.J., and Rukstales, K.S., 2008, Documentation for the 2008 Update of the United States National Seismic Hazard Maps: U.S. Geological Survey Open-File Report 2008-1128, 61 p.
DISCUSSION
Maps prepared by United States Geological Survey (USGS) incollaboration with the Federal Emergency Management Agency(FEMA)-funded Building Seismic Safety Council (BSSC) andthe American Society of Civil Engineers (ASCE). The basis isexplained in commentaries prepared by BSSC and ASCE and inthe references. Ground motion values contoured on these maps incorporate: • a target risk of structural collapse equal to 1% in 50 years based upon a generic structural fragility • a factor of 1.1 to adjust from a geometric mean to the maximum response regardless of direction • deterministic upper limits imposed near large, active faults, which are taken as 1.8 times the estimated median response to the characteristic earthquake for the fault (1.8 is used to represent the 84th percentile response), but not less than 150% g. As such, the values are different from those on the uniform-hazard 2008 USGS National Seismic Hazard Maps posted at:http://earthquake.usgs.gov/hazmaps. Larger, more detailed versions of these maps are not providedbecause it is recommended that the corresponding USGS webtool (http://earthquake.usgs.gov/designmaps orhttp://content.seinstitute.org) be used to determine the mappedvalue for a specified location.
E
E
EE
E
E
E
E
EE
E
E
E
E
E
E
EE
E
E
6.3
28.2
16.425.6
306
16.9
9.7
14.1
12.510
13.9
12.1
16.9
14.2
25.3
20.6
5.5
4.4
16.4
25
35
10
10
25
5
30
30
20
50
20
20
20
20
20
20
25
150
25
25
5
5
40
15
125
10
35
15
9080
100
25
20
10
60
15
30
50
15
15
40
40
20
20
25
35
15
200
150
35
30
10
125
10
100
90
40
30
8070
5
10
60
50
40
15
3530
1520
25
15
2015
10
10
5
5
5
20
70
25
5
10
50 40
35
30
50° 90° 80° 70°
45°
40°
35°
30°
25°
100 0 100 200 300 400 500 Miles
100 0 100 200 300 400 500 Kilometers
Explanation
Contour intervals, %g
3002001501251009080706050403530252015105
Areas with a constant spectral response acceleration of 150% g
10101010
E16.9
Point value of spectral response acceleration expressed as a percent of gravity
Contours of spectral response acceleration expressed as a percent of gravity. Hachures point in direction of decreasing values
2012 International Building Code
FIGURE 1613.3.1 RISK-TARGETED MAXIMUM CONSIDERED EARTHQUAKE (MCER) GROUND MOTION …
Indian Institute of Science (IISc) Department of Civil Engineering Seminar
“New Risk-Targeted Seismic Maps Introduced into USA Building Codes,” N. Luco, USGS March 6, 2013

EERI Seminar on Next Generation Attenuation Models
“Risk Integral” (Example)
Indian Institute of Science (IISc) Department of Civil Engineering Seminar
“New Risk-Targeted Seismic Maps Introduced into USA Building Codes,” N. Luco, USGS March 6, 2013
Haz
ard
Ris
kF
rag
ilit
y
Ground Motion Intensity, IM=z
P [
Col
laps
e | I
M=
z ]
P [
IM >
z ]
Inte
gran
d
Design IM = 1.29gDesign IM = 1.18g

EERI Seminar on Next Generation Attenuation Models
2
2
Risk-Targeted Ground Motions
H
azar
dR
isk
Fra
gil
ity
Indian Institute of Science (IISc) Department of Civil Engineering Seminar
“New Risk-Targeted Seismic Maps Introduced into USA Building Codes,” N. Luco, USGS March 6, 2013
DD
Ground Motion Intensity, IM=z
P [
Col
laps
e | I
M=
z ]
P [
IM >
z ]
Inte
gran
d
Design IM = 1.50gDesign IM = 0.90g

EERI Seminar on Next Generation Attenuation Models
Risk-Targeted Ground Motions
H
azar
dR
isk
Fra
gil
ity
Indian Institute of Science (IISc) Department of Civil Engineering Seminar
“New Risk-Targeted Seismic Maps Introduced into USA Building Codes,” N. Luco, USGS March 6, 2013
DD
Ground Motion Intensity, IM=z
P [
Col
laps
e | I
M=
z ]
P [
IM >
z ]
Inte
gran
d
Design IM = 1.38gDesign IM = 0.96g

EERI Seminar on Next Generation Attenuation Models
Risk-Targeted Ground Motions
“Guess” RTGMi
P[Collapse] in 50yrs= 1%?
Generate fragility curve as a function of RTGMi
Integrate fragility & hazard curves to calculate risk
RTGM CalculatedFor
a g
iven
loca
tion
…
Yes
No
Indian Institute of Science (IISc) Department of Civil Engineering Seminar
“New Risk-Targeted Seismic Maps Introduced into USA Building Codes,” N. Luco, USGS March 6, 2013
EERI Seminar on Next Generation Attenuation Models
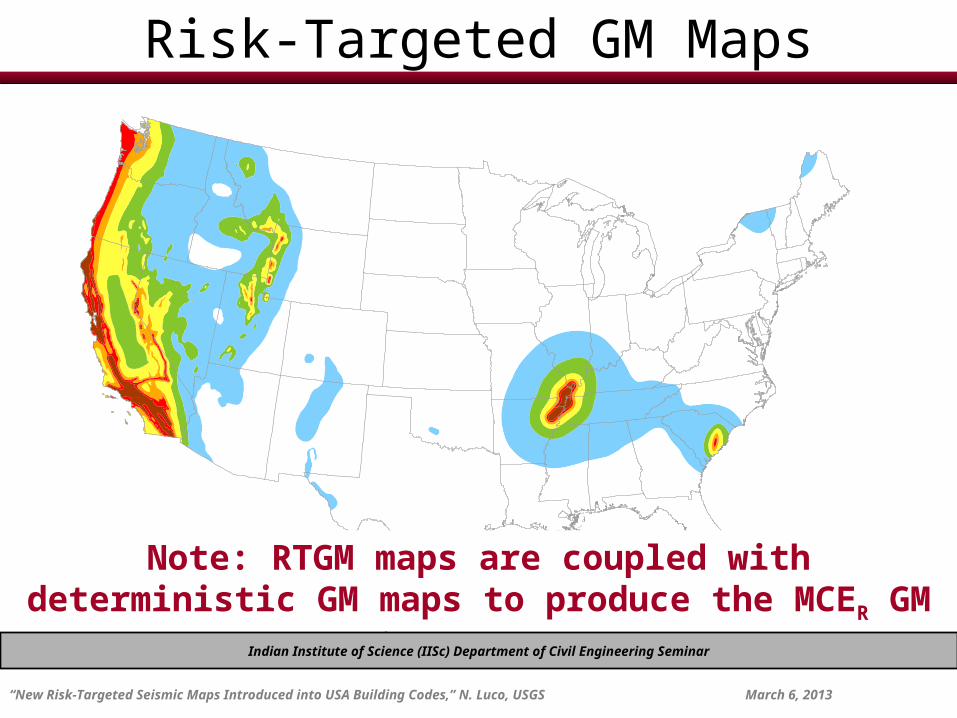
Risk-Targeted GM Maps
Note: RTGM maps are coupled with deterministic GM maps to produce the MCER GM maps in the 2012 IBC
Indian Institute of Science (IISc) Department of Civil Engineering Seminar
“New Risk-Targeted Seismic Maps Introduced into USA Building Codes,” N. Luco, USGS March 6, 2013

EERI Seminar on Next Generation Attenuation Models
Risk Coefficients (CR’s)
• Conventional uniform-hazard (2500-yr) GMs interpolated from hazard curves
• CR’s =
• e.g., SFBA Location MMA Location
Risk-Targeted GM 1.38g 0.96g
Uniform-Hazard GM 1.29g 1.18g
Risk Coefficient (CR) 1.07 0.82
Risk-Targeted GMs
Uniform-Hazard GMs
Indian Institute of Science (IISc) Department of Civil Engineering Seminar
“New Risk-Targeted Seismic Maps Introduced into USA Building Codes,” N. Luco, USGS March 6, 2013
EERI Seminar on Next Generation Attenuation Models
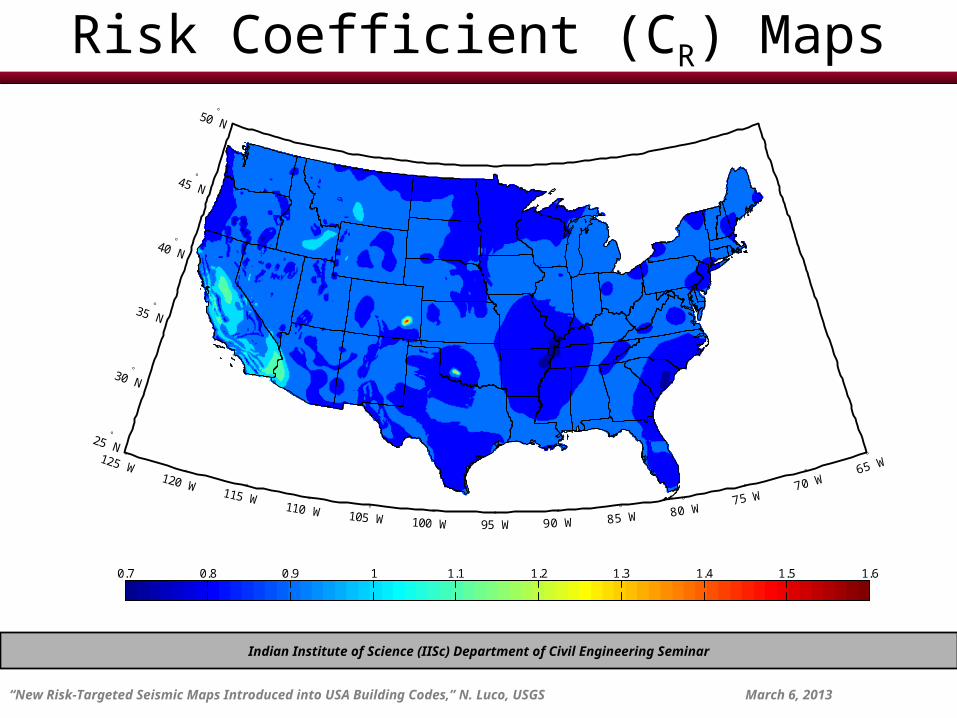
Risk Coefficient (CR) Maps
125 W 120
W 115 W 110
W 105 W 100
W 95
W 90
W 85
W 80 W 75
W 70
W 65 W
25 N
30 N
35 N
40 N
45 N
50 N
Risk-Targeted (1% in 50yrs, = 0.8) Uniform-Hazard (2% in 50yrs) ; 0.2sec SA
0.7 0.8 0.9 1 1.1 1.2 1.3 1.4 1.5 1.6
Indian Institute of Science (IISc) Department of Civil Engineering Seminar
“New Risk-Targeted Seismic Maps Introduced into USA Building Codes,” N. Luco, USGS March 6, 2013

EERI Seminar on Next Generation Attenuation Models
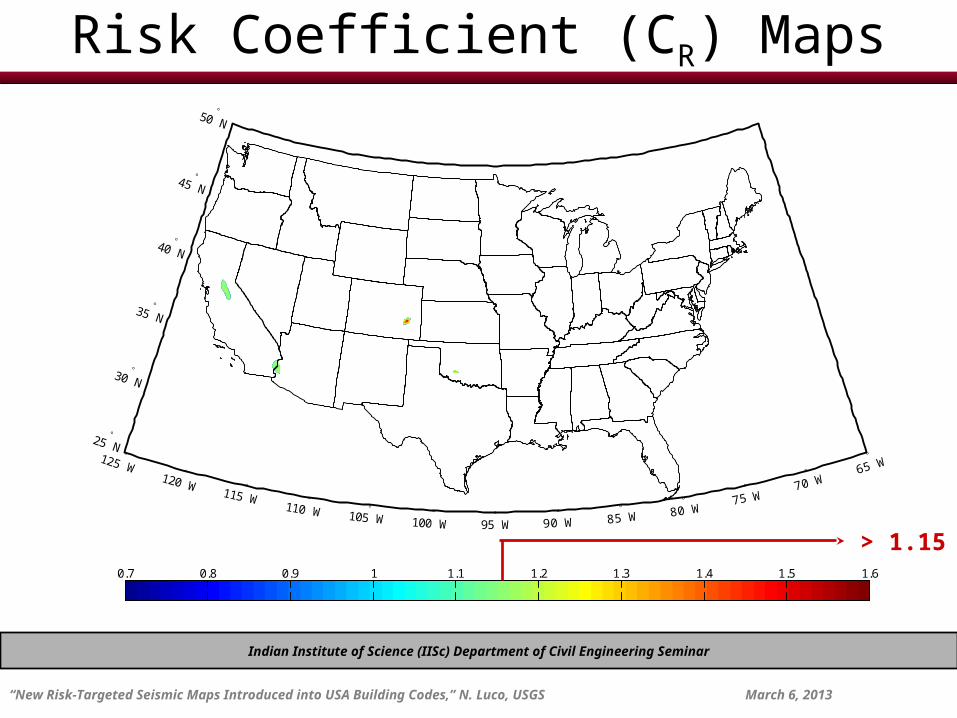
Risk Coefficient (CR) Maps
125 W 120
W 115 W 110
W 105 W 100
W 95
W 90
W 85
W 80 W 75
W 70
W 65 W
25 N
30 N
35 N
40 N
45 N
50 N
Risk-Targeted (1% in 50yrs, = 0.8) Uniform-Hazard (2% in 50yrs) ; 0.2sec SA
0.7 0.8 0.9 1 1.1 1.2 1.3 1.4 1.5 1.6
< 0.85
Indian Institute of Science (IISc) Department of Civil Engineering Seminar
“New Risk-Targeted Seismic Maps Introduced into USA Building Codes,” N. Luco, USGS March 6, 2013
EERI Seminar on Next Generation Attenuation Models
Risk Coefficient (CR) Maps
125 W 120
W 115 W 110
W 105 W 100
W 95
W 90
W 85
W 80 W 75
W 70
W 65 W
25 N
30 N
35 N
40 N
45 N
50 N
Risk-Targeted (1% in 50yrs, = 0.8) Uniform-Hazard (2% in 50yrs) ; 0.2sec SA
0.7 0.8 0.9 1 1.1 1.2 1.3 1.4 1.5 1.6
> 1.15
Indian Institute of Science (IISc) Department of Civil Engineering Seminar
“New Risk-Targeted Seismic Maps Introduced into USA Building Codes,” N. Luco, USGS March 6, 2013

EERI Seminar on Next Generation Attenuation Models
New MCER GMs
Preparation of New Design Maps
Deterministic GMsProbabilistic GMs(Risk-Targeted)
─ In ASCE 7-10─ In 2009 NEHRP
Risk CoefficientsUniform-Hazard GMs
X
To relate back to conventional uniform-hazard (2500-yr) GMs …
Indian Institute of Science (IISc) Department of Civil Engineering Seminar
“New Risk-Targeted Seismic Maps Introduced into USA Building Codes,” N. Luco, USGS March 6, 2013

Google “EERI NGA Seminar Presentations” for Videoor email [email protected] for just PowerPoint
EERI Seminar on Next Generation Attenuation Models
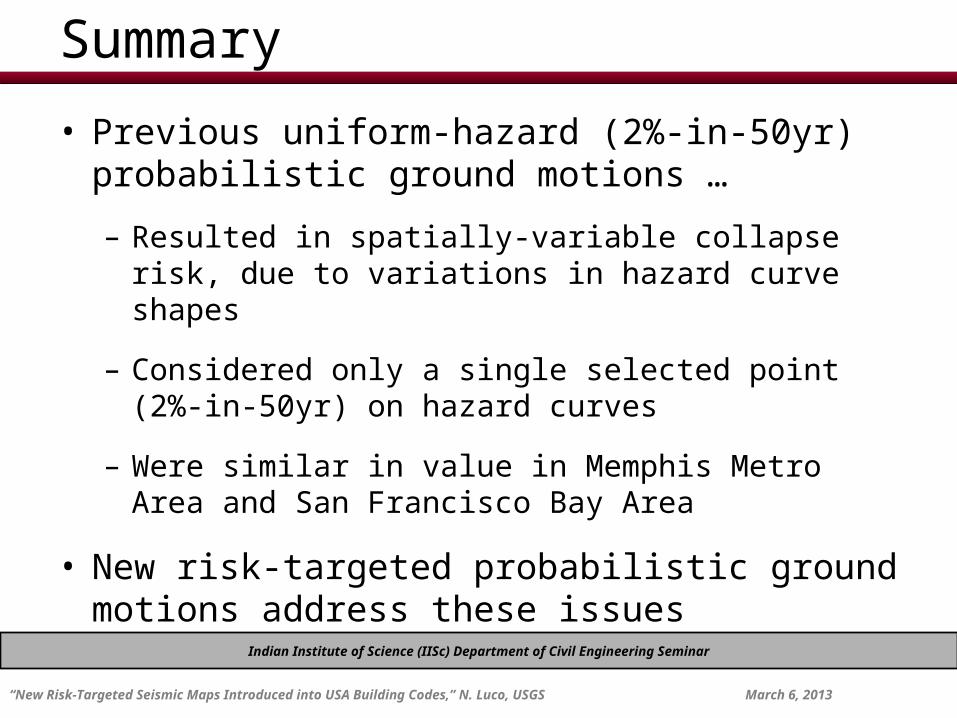
Summary
• Previous uniform-hazard (2%-in-50yr) probabilistic ground motions …
– Resulted in spatially-variable collapse risk, due to variations in hazard curve shapes
– Considered only a single selected point (2%-in-50yr) on hazard curves
– Were similar in value in Memphis Metro Area and San Francisco Bay Area
• New risk-targeted probabilistic ground motions address these issues
Indian Institute of Science (IISc) Department of Civil Engineering Seminar
“New Risk-Targeted Seismic Maps Introduced into USA Building Codes,” N. Luco, USGS March 6, 2013

EERI Seminar on Next Generation Attenuation Models
Summary (continued)• New risk-targeted probabilistic ground motions
(RTGMs) …
– Explicitly & uniformly target 1% probability of collapse in a building’s lifetime, ~50 years
– Consider all points on & spatial variations in shapes of hazard curves
– Require a generic fragility that depends on RTGM & effectively considers shapes of hazard curves
– Changes uniform-hazard (2%-in-50yr) ground motions by factor of 0.85-1.15 generally, but as low as 0.70 near New Madrid and Charleston
Indian Institute of Science (IISc) Department of Civil Engineering Seminar
“New Risk-Targeted Seismic Maps Introduced into USA Building Codes,” N. Luco, USGS March 6, 2013
EERI Seminar on Next Generation Attenuation Models
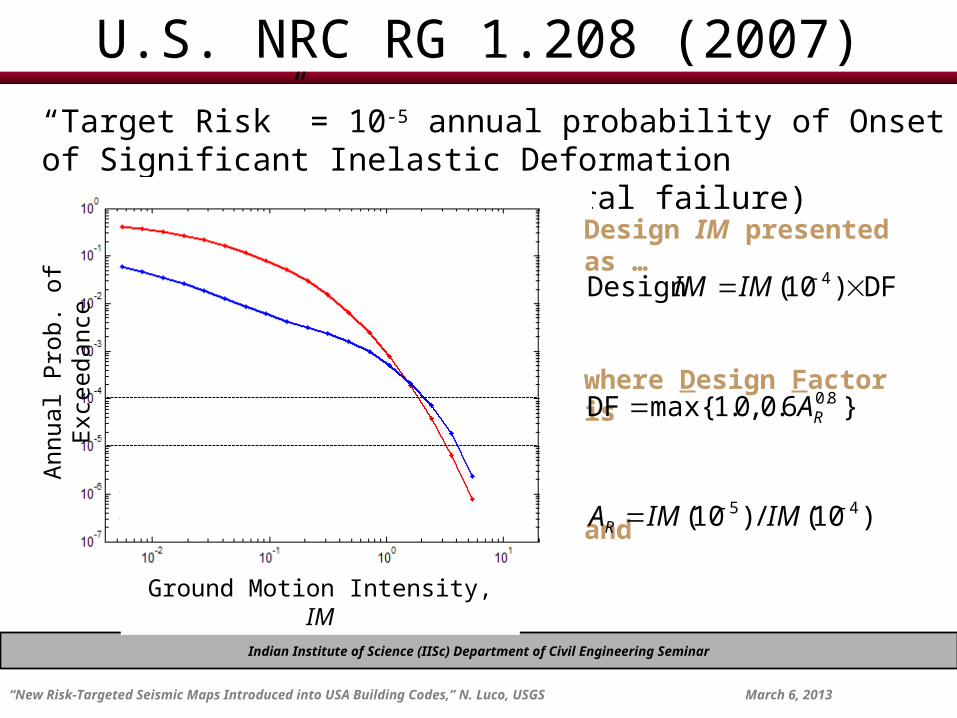
U.S. NRC RG 1.208 (2007)
“Target Risk” = 10-5 annual probability of Onset of Significant Inelastic Deformation (conservative w.r.t. structural failure)
Indian Institute of Science (IISc) Department of Civil Engineering Seminar
“New Risk-Targeted Seismic Maps Introduced into USA Building Codes,” N. Luco, USGS March 6, 2013
Ground Motion Intensity, IM
Ann
ual P
rob.
of
Exc
eeda
nce Design IM presented as
…
where Design Factor is
and
}6.0,0.1max{DF 8.0RA
)10(/)10( 45 IMIMAR
DF)10(Design 4 IMIM

EERI Seminar on Next Generation Attenuation Models
ATC-58 Project (funded by FEMA)
• In addition to building collapse, these new design procedures target annual probabilities of earthquake-induced …
– casualties (Deaths), – repair costs (Dollars), and – loss of use (Downtime)
… via generalizations of the risk integral.
• Furthermore, risk quantification is “high-resolution,” i.e., …
… fragility curve depends on details of individual elements of the building, not just the design ground motion intensity
Indian Institute of Science (IISc) Department of Civil Engineering Seminar
“New Risk-Targeted Seismic Maps Introduced into USA Building Codes,” N. Luco, USGS March 6, 2013
EERI Seminar on Next Generation Attenuation Models
Risk-Based Design Approaches
Indian Institute of Science (IISc) Department of Civil Engineering Seminar
“New Risk-Targeted Seismic Maps Introduced into USA Building Codes,” N. Luco, USGS March 6, 2013
Seismic Risk Quantificationfor Existing Structures
Seismic Designof New Structures
Risk-Based Design

EERI Seminar on Next Generation Attenuation Models
Implications
• Tolerable seismic risk has now been specified quantitatively (vs. qualitative “safe”), which in turn impacts, e.g., …
– evaluation and retrofit of existing structures,
– design for other hazards (e.g., wind, rock falls), and
– prescriptive design procedures (e.g., selection and modification of ground motion time series for structural response simulations).
• Risk-based approaches might eventually allay the need for prescriptive design procedures altogether.
Indian Institute of Science (IISc) Department of Civil Engineering Seminar
“New Risk-Targeted Seismic Maps Introduced into USA Building Codes,” N. Luco, USGS March 6, 2013

EERI Seminar on Next Generation Attenuation Models
Outstanding Issues
• Acceptable/tolerable risk level?
– once in terms of deaths/dollars/downtime, might be borrowed from other hazards?
– for individual structures and aggregation/region?
– must it be geographically uniform?
• Validation of risk modeling/quantification (vs. reality)
– hazard and fragility components/curves
– data very scarce at large ground motion intensities
Indian Institute of Science (IISc) Department of Civil Engineering Seminar
“New Risk-Targeted Seismic Maps Introduced into USA Building Codes,” N. Luco, USGS March 6, 2013
Recommended